


Abstract
This study examines the rapid growth of energy demand in Paraguay, primarily driven by intensive air conditioning use and reduced hydroelectric output due to adverse Paraná River conditions. Employing a Vector Autoregressive (VAR) model, we quantify how temperature shocks significantly elevate peak electricity demand within the National Interconnected System. Our findings reveal that air conditioning accounts for 34–36% of the peak demand, pushing the hydroelectric system towards its operational limits. To address this challenge, we propose a technological transition strategy focused on energy efficiency improvements and labeling programs aimed at reducing peak demand, delaying system saturation, and achieving substantial power savings. These measures offer a practical approach to climate adaptation while supporting Paraguay’s international commitments and Sustainable Development Goals (SGDs) 7 (affordable and clean energy) and 13 (climate action). This work represents the first pioneering effort in Paraguay to quantify the influence of the SIN’s AC at the national level. This research provides policymakers with an evidence-based framework for energy planning, marking a pioneering effort in Paraguay to quantify cooling loads and set actionable efficiency targets.
1. Introduction
Electricity has become one of the most indispensable resources for maintaining daily quality of life and the economic development of countries. Its availability and accessibility are critical factors directly impacting the quality of life of society [1] and socioeconomic growth [2]. However, various studies indicate that high temperatures and other climatic phenomena can significantly alter energy demand, influencing consumption patterns for cooling, heating, and other services [3,4].
In Paraguay, the hydroelectric supply faces growing uncertainty due to unfavorable climatic and hydrological conditions, while demand rises sharply due to the intensive use of air conditioning (AC). Research by [5] suggests that climate change could worsen water resource availability, potentially jeopardizing energy generation. This underscores the need to reduce household AC consumption [6]. Therefore, implementing energy efficiency (EE) standards is crucial [7], considering that certain efficiency improvements can lead to unintended increases in overall consumption [8,9].
Additionally, building features (insulation, windows, walls, infiltration, etc.) have been shown to play a significant role in the thermal load of buildings, affecting AC use [10,11]. The quality of insulation can considerably reduce heat gains or losses, impacting the overall efficiency of cooling equipment and energy demand during temperature peaks.
Another important aspect is the relationship between temperature, humidity, and thermal comfort, represented by comfort curves. These curves describe the conditions under which users find a space comfortable, directly influencing the use of cooling equipment [12]. In hot and humid climates like Paraguay’s, these factors drive greater dependence on AC, intensifying energy demand during heat and humidity peaks [13,14,15].
In this context, the research and development of more efficient technologies [6] and the establishment of standards and labels for AC [16] emerge as central strategies to reduce peak demand and ensure energy supply sustainability. Quantifying the total number of installed AC units and their contribution to peak load is essential [17,18]. In Paraguay, record temperatures have been registered in recent years—reaching 44 °C in 2019—exacerbated by deforestation and climate change [19]. This poses significant challenges to the resilience of the national electrical system and long-term planning.
The primary objective of this study is to comprehensively analyze the influence of temperature on the maximum demand of Paraguay’s National Interconnected System (SIN) and propose energy efficiency measures to mitigate its impact. Specifically, it seeks to empirically confirm the relationship between temperature and maximum demand, quantify the contribution of AC to peak load, and evaluate the impact of technological transition, energy labeling, and envelope characteristics as mitigation solutions.
This study aims to contribute to achieving Sustainable Development Goals 7 and 13 by promoting EE and climate change adaptation. The findings could provide valuable information to policymakers and energy sector professionals for prioritizing actions, improving building envelopes, expanding the grid, and incorporating clean technologies, fostering sustainable energy development for Paraguay and the region.
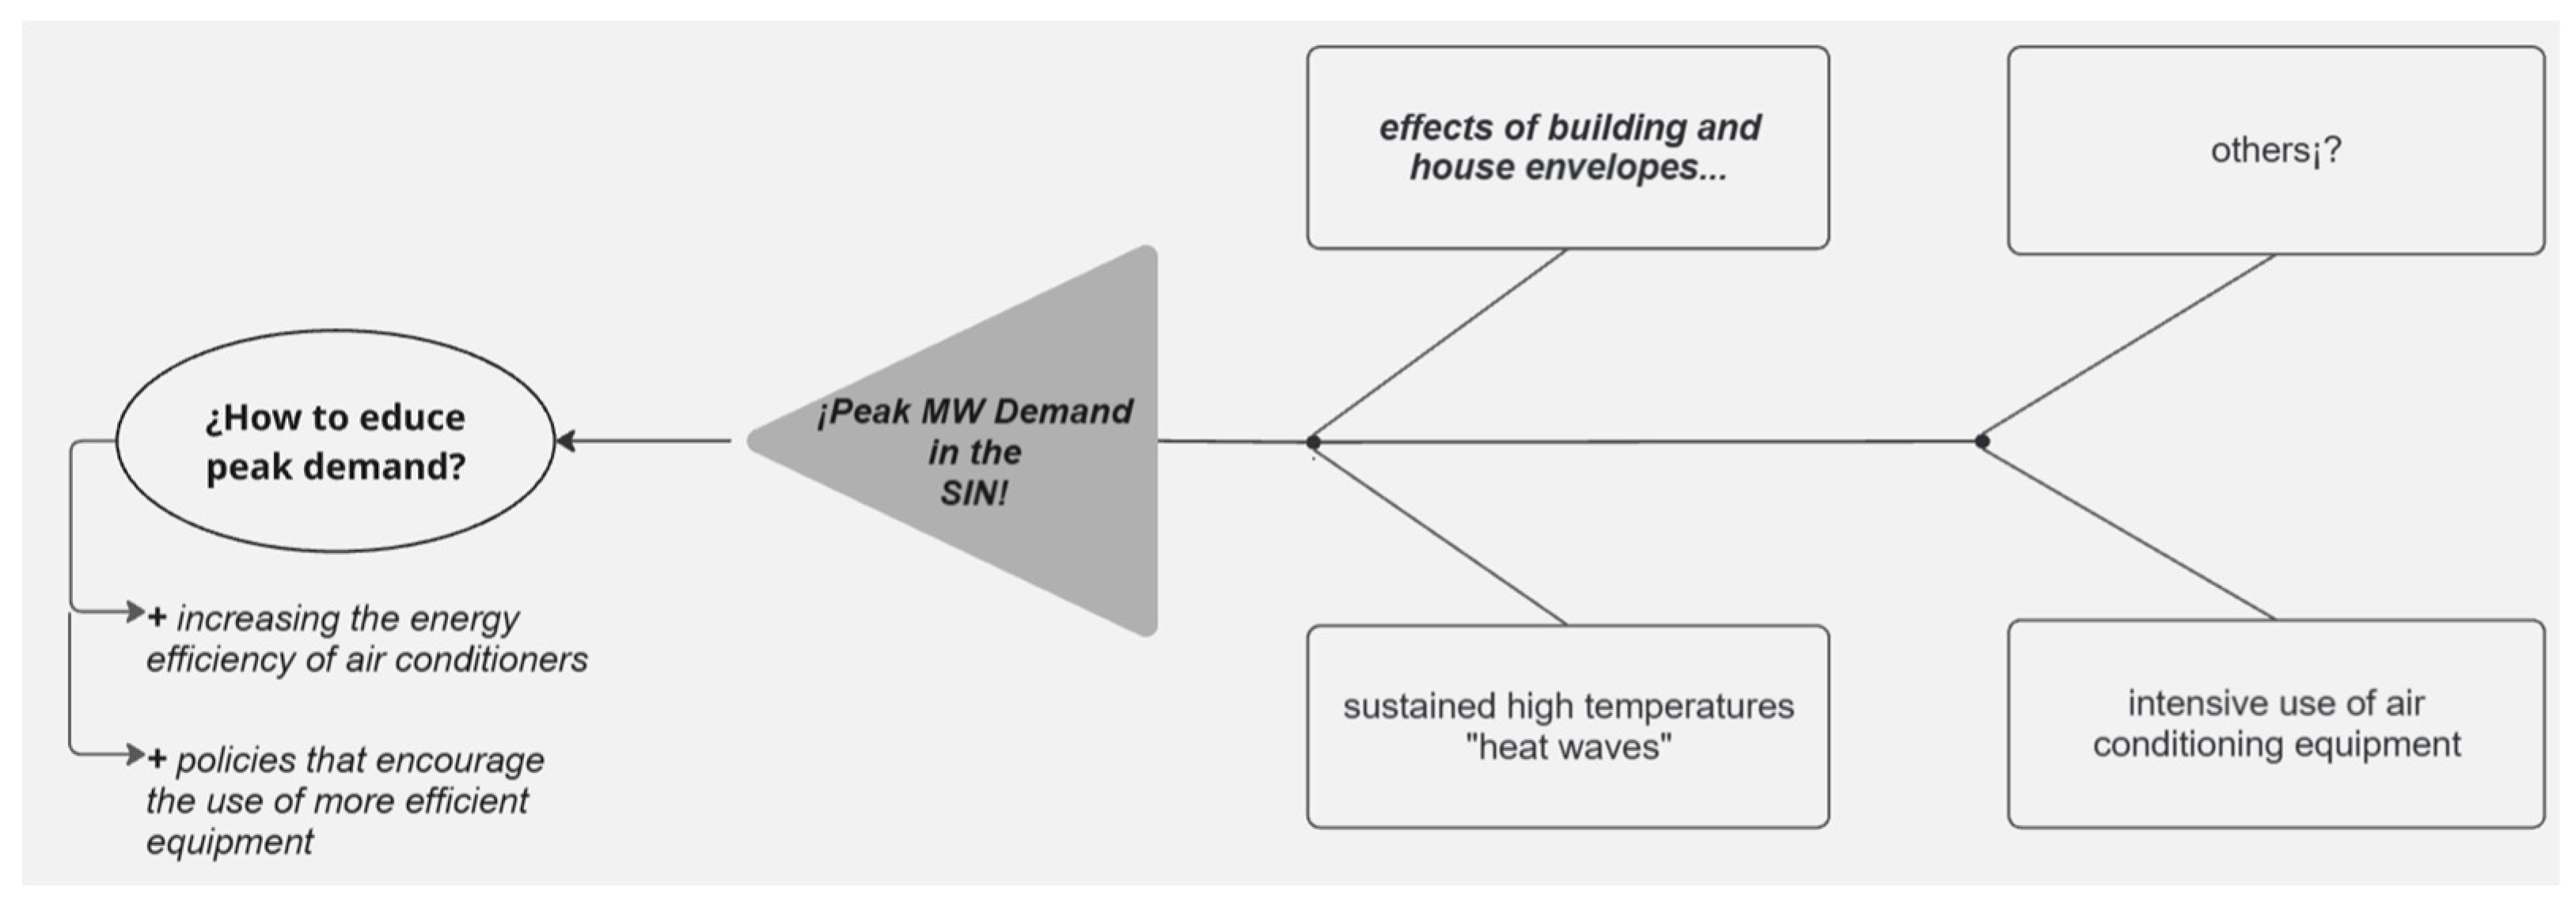
This study does not explicitly model the impact of the building envelope on cooling loads (Figure 1). While envelope features have a substantial impact on thermal loads and AC usage, this investigation lacked systematic data or national benchmarks for local envelope thermal performance. As a result, metrics including U-values, absorptance, and infiltration were excluded. A separate, future study will rigorously quantify the impact of building envelopes on cooling demand, providing a more comprehensive assessment.
Figure 1.
Factors and policies to reduce peak demand in the SIN: climate, envelope and A.C. efficiency.
Because data are scarce, this study first quantifies the direct impact of temperature on demand, deliberately isolating this bivariate relationship from other influences. We acknowledge other major determinants of long-term demand—such as electricity prices, GDP, and income—and note that integrating these with the core climate-demand relationship is a crucial next step for future research.
2. Literature Review
Environmental degradation and the scarcity of adequate energy supply constitute two of the greatest global challenges requiring immediate attention [20]. In the residential sector, the relationship between temperature and electricity demand has been the subject of numerous studies [21,22,23,24,25]. While most of these studies demonstrate that temperature significantly influences consumption or demand, few delve into the specific association of consumption with cooling (especially air conditioning) or propose specific mitigation solutions rooted in energy efficiency policies.
At the international level, Holtedahl and Joutz (2004) [24] analyzed residential electricity demand in Taiwan using an error correction model incorporating degree-days and separating short- and long-term effects. Similarly, Gam and Rejeb (2012) [22] employed econometric methods in Tunisia to relate demand growth to factors such as income, electricity prices, and climate. Auffhammer and Mansur (2014) [21] reviewed how climatic impacts on energy consumption are measured, emphasizing that AC in warm climates significantly increases peak demand.
In regions with hot summers, studies such as [23] (in Delhi and India) and [25] (in Shanghai) used VAR models and impulse-response analyses to confirm the sensitivity of electricity demand to temperature increases. However, while they robustly quantify the statistical effects, they do not isolate the fraction of demand attributable to AC or propose public policy scenarios to mitigate these peaks.
Works such as those by [6,9], focus on the role of AC efficiency in residential demand in China. While they confirm that efficiency improvements in AC units may not reduce total consumption (due to potential rebound effects or increased usage frequency), they do not accurately explain the portion of maximum demand attributable to cooling.
In Latin America, Casarin and Delfino (2011) [26] studied how AC adoption increases residential demand in Buenos Aires, Argentina, focusing their analysis on price dynamics and tariff freezes without offering a comprehensive energy efficiency policy solution.
Regarding EE in air conditioning, various authors have examined minimum efficiency standards and their potential to reduce demand and emissions [6,27,28]. However, most focus on estimating global benefits (emission reductions, economic savings) or discussing the rebound effect, without designing a detailed technological transition model to calculate peak demand savings.
Additionally, building envelopes are considered a key factor in reducing the cooling load associated with AC. Better insulation, high-performance windows, and controlled infiltration can significantly decrease heat gains inside buildings, reducing the need for intensive AC use [10,11]. These envelope improvements can complement energy labeling policies and efficiency standards by reducing the total cooling load faced by equipment.
Comfort curves, which relate temperature, humidity, and human perception, are also crucial tools for understanding the conditions under which AC usage increases. De Dear and Brager (2002) [12] highlighted that, in hot and humid climates, any deviation from these curves leads to a significant increase in dependence on cooling equipment. Refs. [29,30] suggested that controlling relative humidity could optimize energy use by reducing cooling loads in such regions.
In Paraguay, previous studies have highlighted the increase in AC usage and the need to implement EE [31,32,33]. However, these works focus more on describing efficiency potential or proposing energy labeling [34,35] without integrating into a single analytical framework:
The demonstration, through inferential analysis (econometrics), of the relationship between temperature and maximum demand.
The quantification of the fraction is attributable to AC.
The evaluation of an energy efficiency (or technological change) scenario with the resulting savings on peak load, as well as consideration of envelope characteristics to further reduce cooling-related demand.
Thus, the reviewed literature confirms a lack of in-depth studies that address in a comprehensive and disaggregated manner the sequence: temperature → demand → AC → EE measures → impact on peak load. The effect of the use of refrigeration or heat pump equipment on peak demand and load is discussed in several papers [36,37,38].
Within the literature on the rebound effect, refs. [39,40] explored how efficiency improvements in household energy use can lead to varying magnitudes of the rebound effect depending on household income levels in Paraguay. Their conclusions emphasize the need to implement targeted efficiency policies, recognizing that not all population sectors behave similarly after adopting more efficient technologies. While this study primarily focuses on direct rebound in Paraguay, it aligns with the idea that controls, labeling, and efficiency regulations may be insufficient if socioeconomic and behavioral factors are not simultaneously considered [6,41].
Additionally, building envelopes is crucial to enhance the effectiveness of these policies and prevent potential savings from being offset by increased AC use.
This study takes a step further by not only demonstrating the influence of temperature on demand or limiting itself to discussing the potential rebound effect but also by quantifying the contribution of cooling to maximum demand and proposing a technological transition to mitigate peak loads and the imbalance between supply and demand.
While this work mentions the importance of building envelopes and thermal comfort conditions as relevant factors, it does not include them in the calculations performed. However, it highlights their potential as key components to be considered in future studies aiming to comprehensively address the impact of these elements on cooling loads and energy efficiency. International evidence confirms that temperature affects electricity demand and, with warmer summers, increases peak cooling. Recent studies integrate climate with supply and demand and show that warming and water scarcity simultaneously stress both sides of the electricity system, reinforcing the urgency of efficiency and adaptation measures [42].
In addition to VAR, previous studies have used error correction models (ECM) to capture long-term relationships between temperature and energy demand [43,44], and panel data regressions to control for spatial and temporal heterogeneity [45,46,47]. VAR was selected for its ability to model dynamic feedback between temperature and demand without imposing strict exogeneity restrictions, allowing endogenous interactions and persistent feedbacks between variables to be captured [43,48].
3. Methodology
This study adopts a quantitative, exploratory, and descriptive approach to evaluate the influence of temperature on the demand of the National Interconnected System (SIN) and propose energy efficiency measures. The employed methods are described below.
The VAR model was selected for its ability to capture dynamic interdependencies among multiple time series without imposing strict exogeneity assumptions, enabling analysis of the mutual influence between temperature and electricity demand [22,49]. It should be noted that the model used monthly data due to limited access to hourly SIN data during the study period. While hourly data would be ideal for peak load studies, the monthly approach provides a valid baseline for medium-term energy planning. Furthermore, the model intentionally focused on the direct physical relationship between temperature and demand, isolating the climatic effect from other socioeconomic factors to specifically quantify the system’s thermal sensitivity.
3.1. VAR Econometric Model
To determine the influence of temperature on demand, a Vector Autoregressive (VAR) econometric model was applied [22,50], enabling both correlational and explanatory analyses. Its general specification is:
where
- represents the monthly average demand of the SIN at time .
- is the monthly average temperature at time .
- and correspond to the lags of demand and temperature, respectively.
- and are the error terms of each equation.
The VAR model was validated using residual normality tests [51], homoscedasticity tests [52], and no-autocorrelation tests [53]. Subsequently, an Impulse-Response Function was employed to examine the reaction of each variable to shocks or disturbances in the other. This allowed for evaluating the present and future effects of unexpected changes in temperature [54] on SIN demand.
3.2. Air Conditioning Classification
The classification of AC units installed nationwide was conducted by combining data from the National Statistics Institute (INE) and import records (Customs, CLERK consultancy). This process involved (The spreadsheets can be viewed at the following link: Memory of Developed Calculation Analisis Project (accessed on: https://github.com/dsalomon1996/my-first-project, accessed on 25 November 2025)):
Two key steps:
- Obtaining the gross total of installed AC units (2019, 2020, 2021), without disaggregating efficiency or cooling capacity.
- Categorizing AC imports in 2019 based on:
- Energy Efficiency Index (EEI): Used to classify units into efficiency classes (A, B, or C).
- Cooling capacity (BTU/h): Indicates the unit’s cooling performance.
The power consumption of each AC unit was estimated using the formula:
where
- : Cooling capacity in BTU/h.
- : Conversion factor from BTU/h to kW.
- EEI: Energy Efficiency Index.
The percentage distribution from 2019 (based on EEI and BTU/h) was extrapolated to the total installed AC units for 2020 and 2021, allowing the estimation of aggregate energy consumption (or cooling load).
This methodology provides a robust engineering approach for estimating the potential connected load. While it does not capture operational factors such as duty cycle or use diversity—which would require direct field measurements currently unavailable at the national scale—the results represent the most reliable estimate possible with existing official data.
3.3. Projections of Maximum Demand and Installed AC Units
To project SIN maximum demand and the number of AC units over a 12–13-year horizon, two methods were applied:
- Logistic Model
- Models the logistic growth of maximum demand and population (residents and AC units), assuming growth rates decrease as a maximum value approached [55].
- Includes a correlation analysis between total population and the number of installed AC units to estimate their upper limit.
- Assumes the growth rate declines as it approaches the population cap.
The model is expressed as:
where maximum demand value; growth rate, and Inflection point.
- 2.
- Monte Carlo Method
- A Geometric Brownian Motion model with drift was applied, considering demand as a stochastic process with random fluctuations (“shock” scenarios) [56].
- Historical data on maximum demand and installed AC units were used to simulate evolution over 12–13 years.
- After 1000 simulations, the probable demand distribution was obtained, identifying average or extreme scenarios.
3.4. Structuring Energy Efficiency Scenarios
Based on the classification of AC units and the projections obtained, various EE scenarios were structured to evaluate their impact on demand. A baseline distribution (without improvements) was defined, and several measures were proposed based on a Technological Transition Rate (TTR):
- Measure 1 (TTR = 20%): Transition 20% of the least efficient units to higher efficiency classes.
- Measure 2 (TTR = 100%): Transition 100% of one lower efficiency class to a higher one.
- Measure 3 (Complete Transition to Class A): Convert all units to the highest efficiency class.
TTR represents the proportion of AC units transitioning from lower to higher efficiency classes. These measures were compared against a BAU (Business-As-Usual) scenario to estimate power savings (MW) and determine the potential reduction in SIN peak demand.
The choice of the three TTR scenarios is not arbitrary but grounded in a combination of (i) observed growth of the AC fleet in Paraguay, (ii) sensitivity analysis of the transition paths, and (iii) alignment with the progressive implementation of national EE regulations. Historically, INE data show annual increases of 9–14% in the stock of AC units during 2019–2021, which, combined with typical replacement rates reported in the international literature for efficiency programs, makes a 20% TTR a realistic “moderate acceleration” relative to recent trends rather than an extreme policy shock [6,18,27]. Higher TTRs were explored through a 2–100% sensitivity matrix (Section 4.6), and the 100% scenario for one lower class was defined as a stylized upper bound consistent with accelerated phase-out of the worst-performing equipment under stringent minimum energy performance standards (MEPS) [16,20,28]. Finally, the “full transition to Class A” scenario was constructed as a technical potential benchmark, representing the maximum savings compatible with the current label structure and serving as a long-term policy target like scenario design in other energy system studies [42]. In all cases, the scenarios are technology-based and do not explicitly simulate specific instruments (e.g., subsidies vs. mandatory standards); instead, they represent plausible envelopes of outcomes under different combinations of the recently established National Energy Efficiency Labelling Program and the phased MEPS framework introduced by Presidential Decree 2853 for AC and other end-uses [33,35]. A more detailed modelling of policy instruments, costs, and behavioral responses is left for future work, but the present approach ensures that the selected TTR values lie within ranges that are both technically feasible and consistent with Paraguayan regulatory trajectories and international experience.
For this case study, the rebound effect was not considered in the analysis of the econometric model, because the aim was to quantify energy savings, not to study the rebound effect. It is worth mentioning that the rebound effect of energy efficiency should be considered [40].
4. Results and Discussion
This study conducted a comprehensive diagnosis of SIN electricity demand, focusing on demand growth, recorded maximum temperatures, and the evolution of installed AC units. Below, the main findings are described, and the results are discussed in terms of energy efficiency (EE) and future planning.
4.1. Status of SIN Maximum Demands
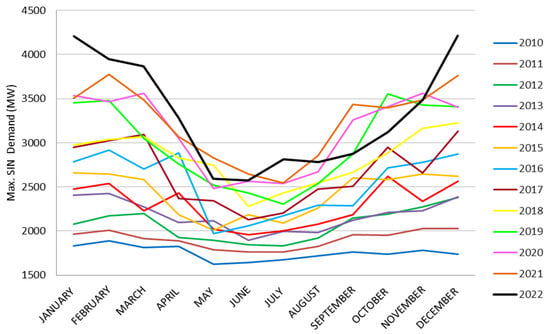
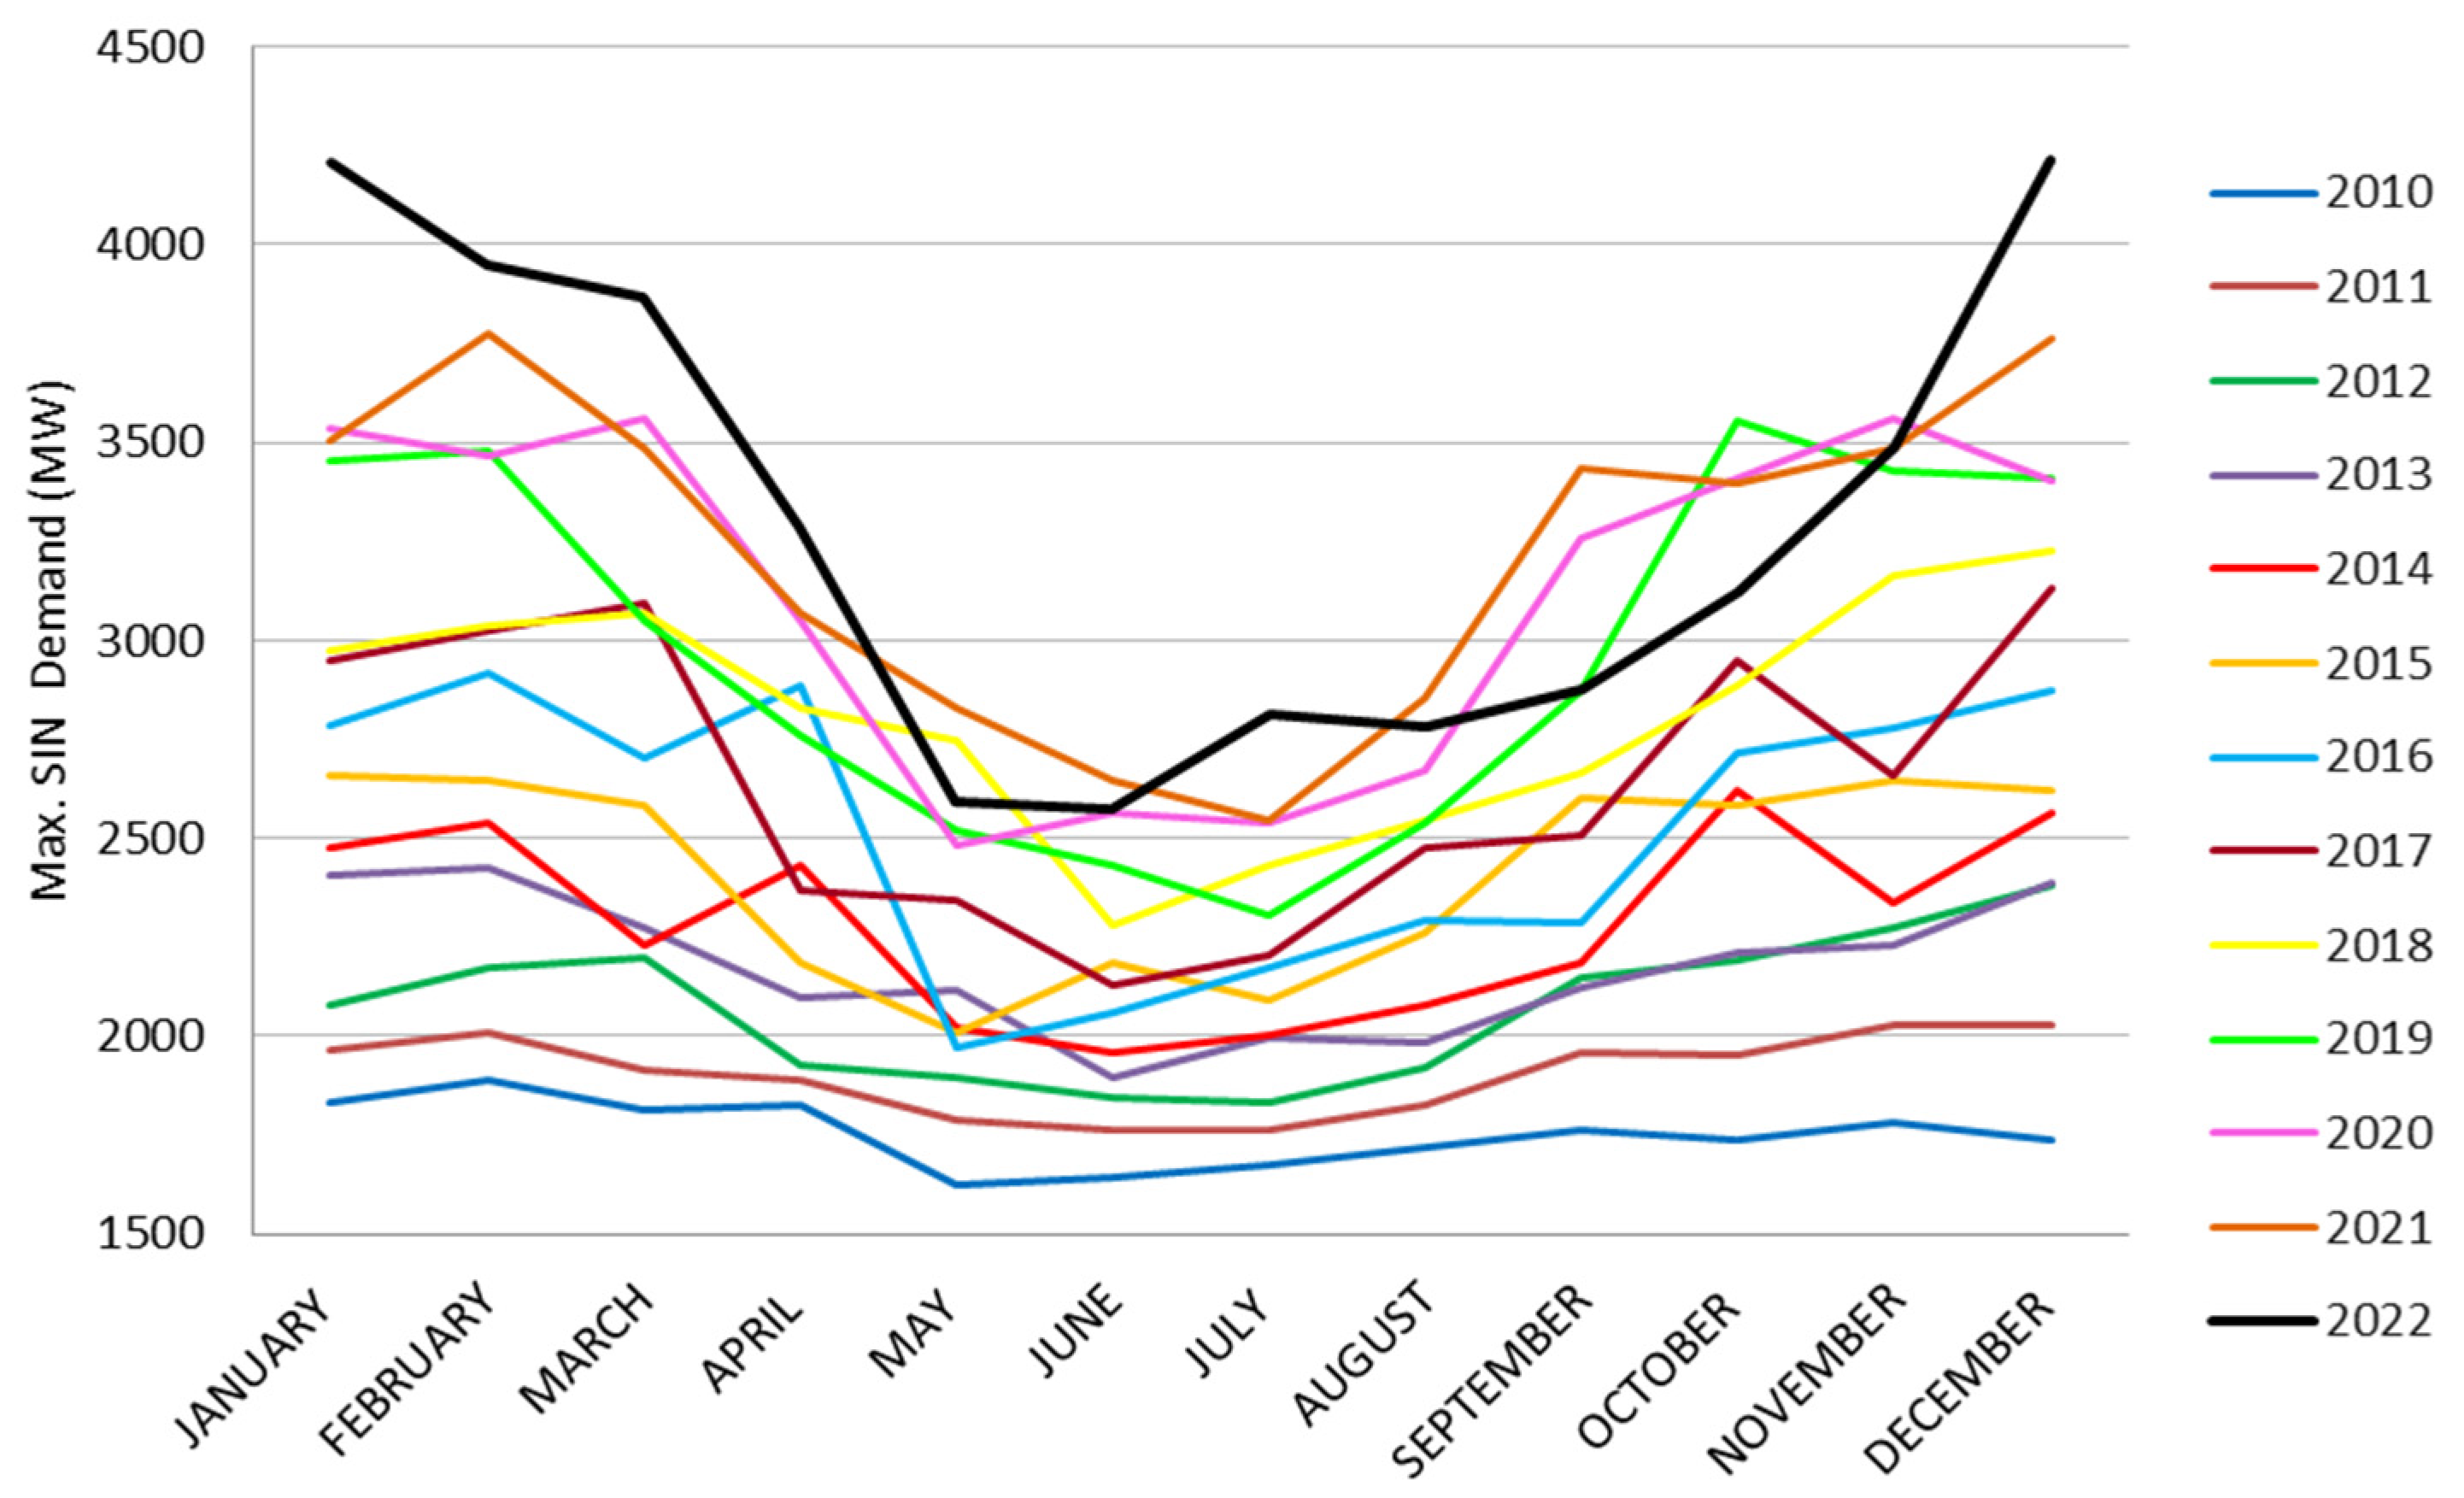
SIN’s maximum demand has experienced significant growth in recent years (Figure 2). Between 2019 and 2020, a 0.3% increase was observed. From 2020 to 2021, the increase was 6%, aligning with the estimates in the Transmission Master Plan 2021–2030, National Electricity Administration (ANDE). Subsequently, between 2021 and 2022, demand grew by 11.4%, reaching a record peak of 4206 MW—429 MW more than the previous year.
Figure 2.
Monthly Maximum Demand Curves of SIN (2010–2022).
When comparing this peak demand with SIN’s maximum dispatchable capacity, the availability could be reduced to 54%, raising concerns about future supply capacity. This risk is heightened by high temperatures (officially recorded on 4 February 2022), which drive intensive AC use.
Figure 2 also highlights how the overlap of demand curves from 2010 to 2015 contrast sharply with the strong growth observed from 2019 to 2022. Key contributing factors include industrial and commercial expansion, changes in energy use habits, and increasing reliance on household electric devices, especially AC. Extreme climatic conditions, such as heat waves or adverse weather events, further accelerate peak demand.
4.2. Status of Installed AC Units Nationwide
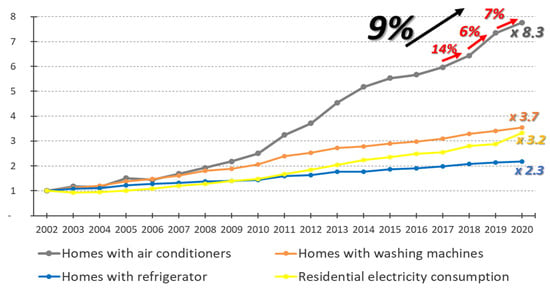
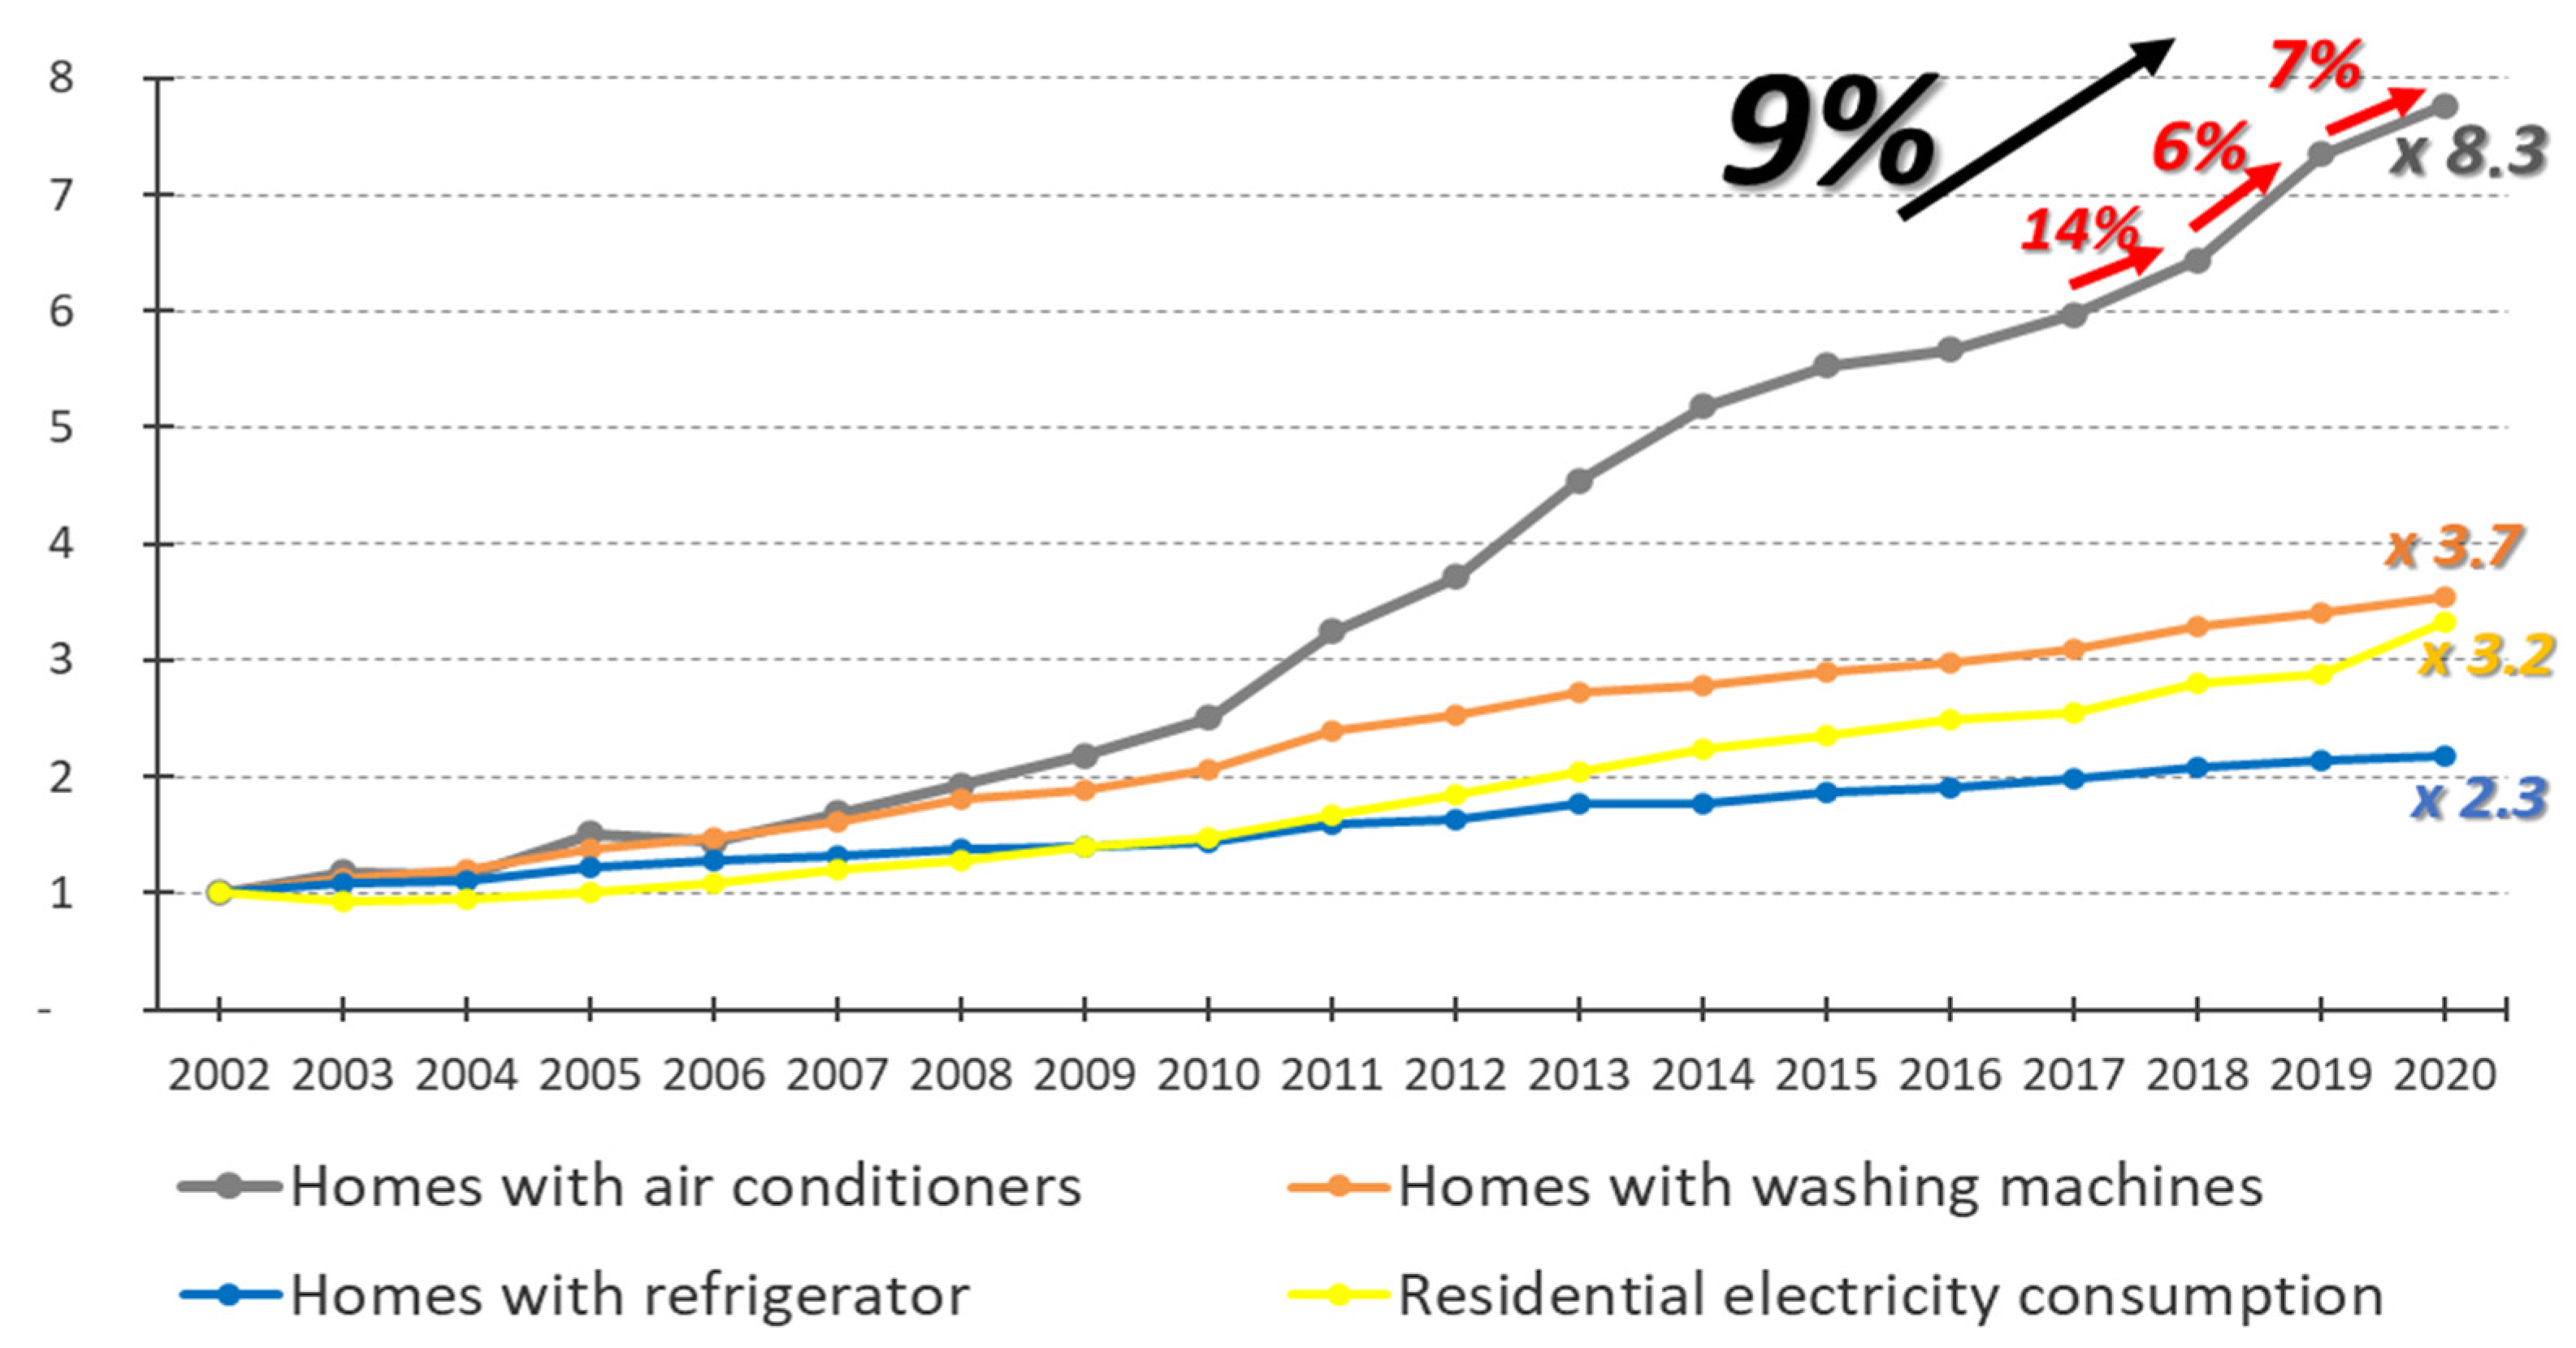
The number of installed AC units in Paraguay shows a clear upward trend, as seen in Figure 3. Between 2002 and 2021, the number of units increased 8.3-fold, leading to a 3.2-fold growth in electricity consumption over the same period. The annual growth rate of AC units (based on INE data) ranged from 9% to 14% during the 2019–2021 period.
Figure 3.
Household Appliance Ownership and Residential Energy Consumption (Percent; 2002 = 100).
This progressive increase largely explains SIN’s peak demand during periods of high temperatures. As the number of installed AC units grows, maximum demand becomes more strained, underscoring the importance of implementing EE measures.
4.3. Influence of Temperature on SIN Demand
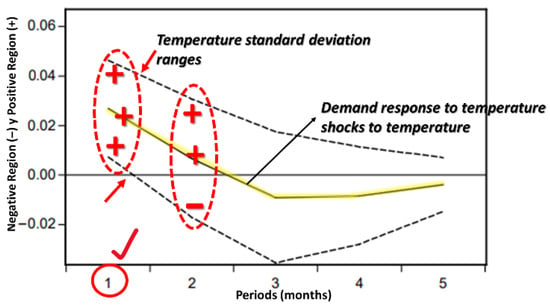
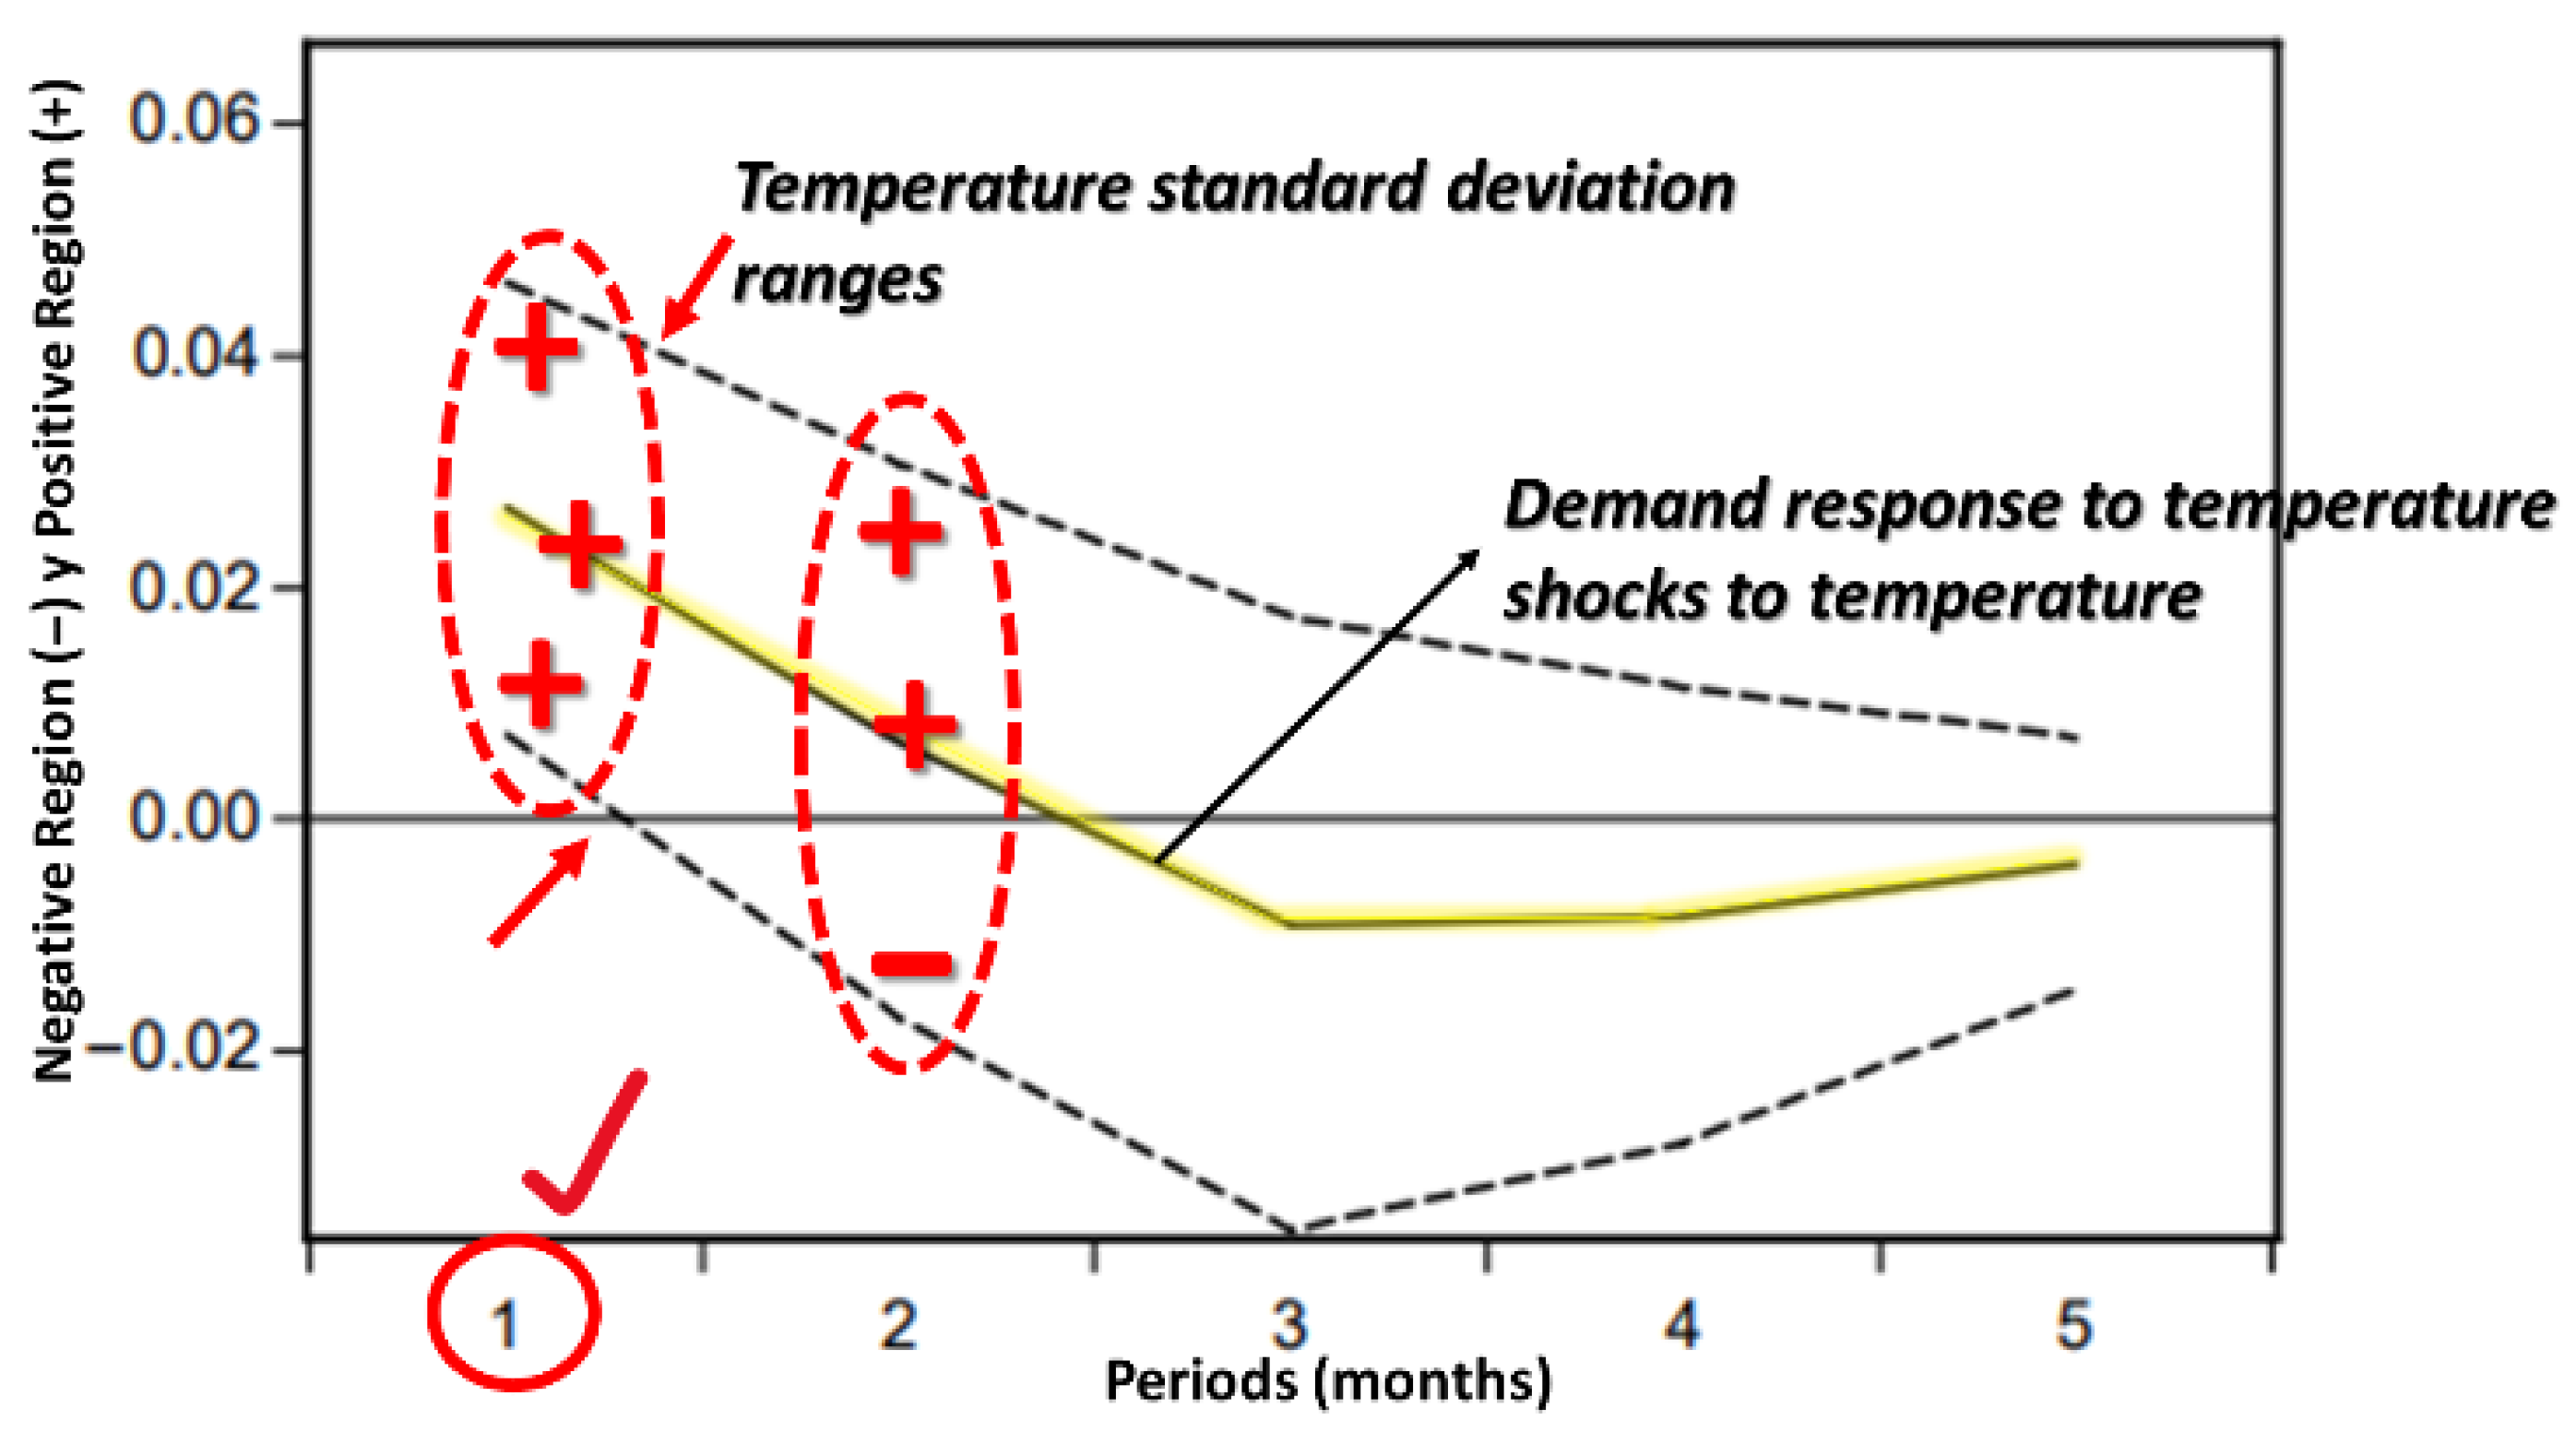
To quantitatively assess the influence of temperature, the monthly average of the SIN demand during 2019–2021, a VAR model was applied, and the Impulse-Response Function was analyzed (Figure 4). Demand and temperature data—sourced from ANDE and NASA’s Power Data Access Viewer—were structured into 36 observations. After validating the model, it was concluded that approximately 20% of the variance in monthly demand can be explained by temperature “shocks” [54].
Figure 4.
Impulse-Response Function of Monthly Average Demand to Monthly Average Temperature Shocks. The reaction is only significant in the first period (1).
These reactions are significant in the short term; however, the effect tends to dissipate after the second analyzed period, suggesting that sudden temperature changes elicit contemporaneous demand responses without long-term persistence. This finding aligns with ANDE’s official statement on the direct relationship between temperature increases and energy consumption [57].
4.4. Contribution of AC Demand to SIN’s Maximum Demand (2019–2021)
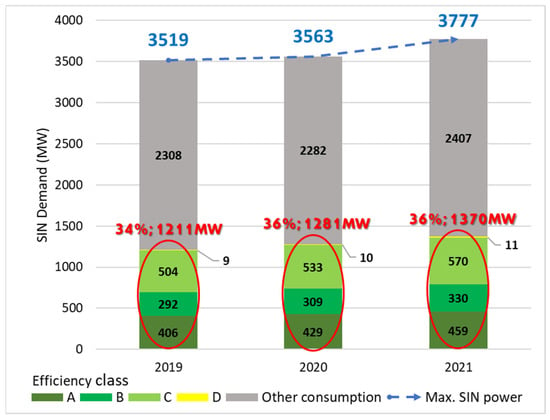
Using the power consumption data of AC units (classified by efficiency and load types), their contribution to SIN’s maximum demand was determined (Figure 5). In 2019, AC demand accounted for 34% of maximum demand, equivalent to 923 MW. In 2020, this proportion rose to 36% (976 MW), and in 2021 it remained at 36% (1044 MW).
Figure 5.
Contribution by Efficiency Class in MW of Installed AC Units to SIN Maximum Power Demand, 2019–2021.
These estimates are based on verified official statistics and differ from values reported by other sources such as [35]. However, the presented approach leverages data validated by Customs and INE, providing a solid approximation of the cooling load impacting SIN.
It is essential to note that the estimate of a 34–36% contribution of AA to peak demand should be interpreted as a robust approximation, given the limitations of existing data. While more detailed methodologies incorporating hourly data, direct field measurements, or more advanced climate metrics could refine this estimate, the results presented constitute the first comprehensive nationwide quantification and establish a fundamental baseline for future research and public policy.
4.5. Effects of EE Measures on Installed AC Demand Nationwide
4.5.1. Projections of SIN Maximum Demand and Installed AC Units
To estimate the evolution of the maximum demand of the National Interconnected System (SIN) and AC penetration in the medium and long term, two methodologies were applied: the Logistic Model and the Monte Carlo Method. Both approaches were compared with historical data from the ANDE and the scenarios presented in its Transmission Master Plan to determine which best aligns with actual behavior and which serves as a “stress scenario” for planning.
Projections Using Logistic Model—Initial Assumption: Population and AC Growth
It is hypothesized that the growth of AC units is correlated with population increase [55]. To verify this, the correlation index between the number of AC units and the population (INE/STP-DGEEC) was calculated. The result obtained was 96%, indicating a direct relationship between AC ownership and the number of inhabitants in the country.
Table 1 (Comparison of Population Projection Values by STP vs. Logistic Model) shows how the model reasonably reproduces official population projection data.
Table 1.
Comparison of Population Projection Values by STP vs. Logistic Model Results.
AC Participation Rate in the Population
For 2019, 2020, and 2021, the average AC participation rate in the population was determined, as shown in Table 2 (Calculation of the Average Participation Rate of Installed AC Units Nationwide in the Total Population). The results indicate rates of 12.90%, 13.45%, and 14.19%, averaging 13.52%.
Table 2.
Growth of AC units, population, and SIN maximum demand: comparison of official data (INE, ANDE) and logistic model results (2019–2021).
Using this average value, it was multiplied by the maximum expected population value, yielding 1.844.849 AC units as the upper limit (e.g., period 2030–2033). Table 2 shows that the model reasonably reproduces the INE’s data on the number of AC units installed nationwide.
Formation of the Logistic Model for AC Units and SIN
Using the above information, the Logistic Model for the number of AC units (Table 2) and the projection of maximum demand (considering the maximum dispatchable capacity: 7831 MW) were structured.
In Table 2, the correlation between ANDE’s official values (2019–2021) and the model results is evident. While the model tends to be conservative (converging to an asymptote), it reasonably reproduces the real trend:
- 2019: 3519 MW (ANDE) vs. 3266 MW (Logistic).
- 2020: 3563 MW (ANDE) vs. 3709 MW (Logistic).
- 2021: 3777 MW (ANDE) vs. 3934 MW (Logistic).
The Logistic Model moderately describes the increase in maximum demand, considering the strong correlation with population growth and AC ownership. It is suitable for controlled growth scenarios but may underestimate situations of rapid dynamics (e.g., peaks of massive AC adoption).
Projection Using Monte Carlo Method
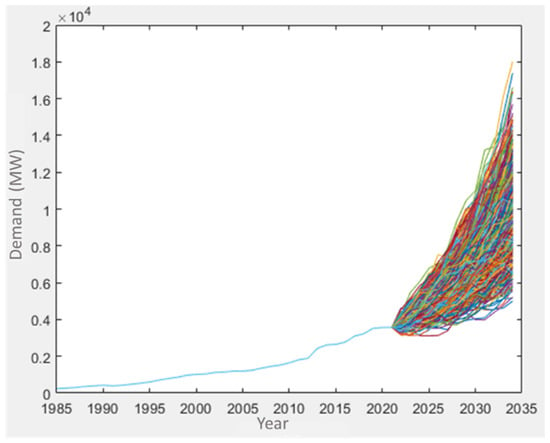
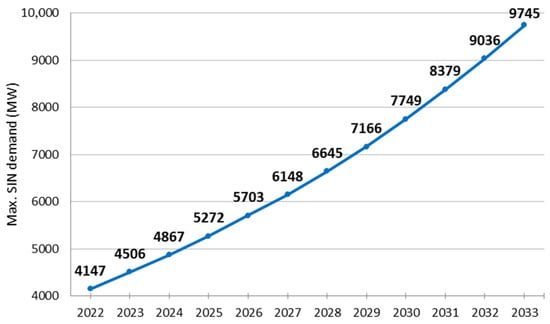
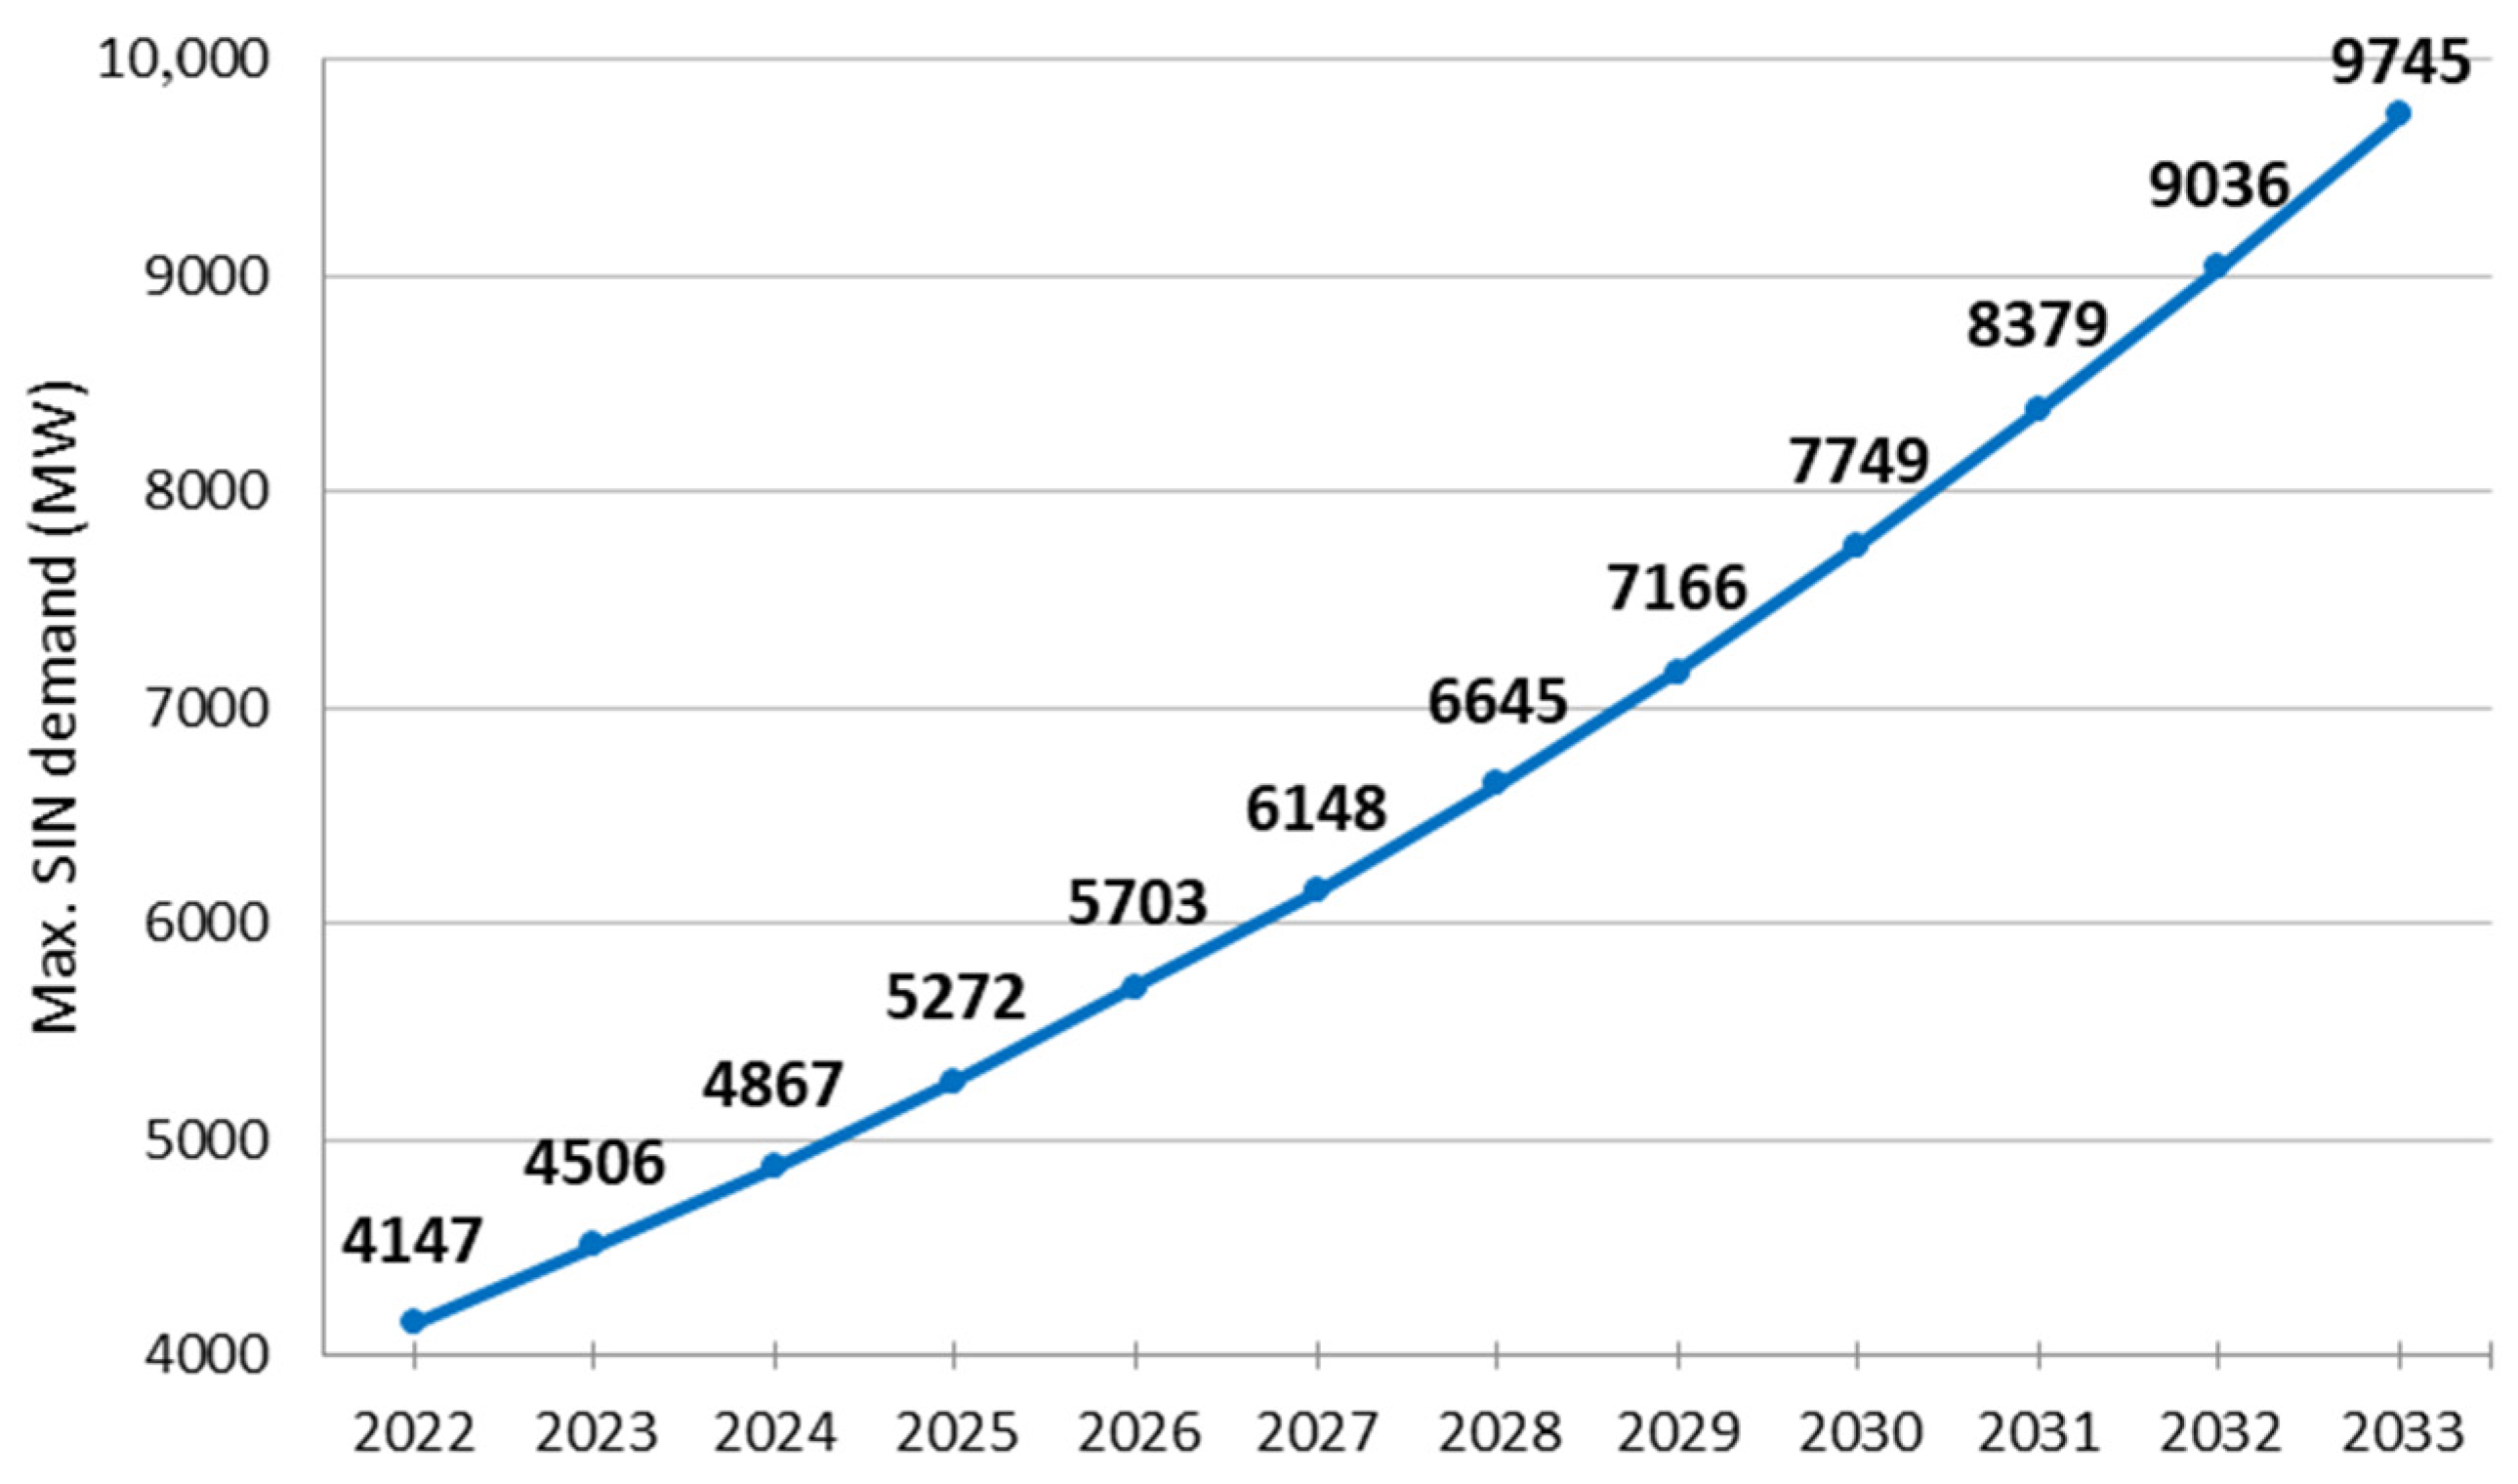
To contrast with the Logistic Model, a Geometric Brownian Motion model with drift was applied [56], generating 1000 simulations of maximum demand (based on historical ANDE data) using normal random distributions (Gaussian). As shown in Figure 6, the disparity in trajectories reflects different “shock” scenarios, and Figure 7 illustrates that maximum demand could reach 9745 MW by 2033, exceeding the capacity of 7831 MW.
Figure 6.
Projections of SIN Maximum Demand (2022–2023).
Figure 7.
Mean of Projected Values for SIN Maximum Demand (2022–2035)—Monte Carlo Method.
It is essential to note that the projections presented in Figure 6 and Figure 7 do not explicitly incorporate a progressive increase in ambient temperature due to global warming. The models assume steady-state climatic conditions based on historical data. However, the Monte Carlo method indirectly captures part of this uncertainty through stochastic perturbations, which can be interpreted as including extreme heat events. A scenario of progressive global warming would represent a crucial area for future research, which would likely show even higher peak demands than those projected here, reinforcing the urgency of the proposed energy efficiency measures.
This outlook is more “optimistic” than the Logistic Model, highlighting the possibility of accelerated demand growth, linked—among other factors—to increased AC usage.
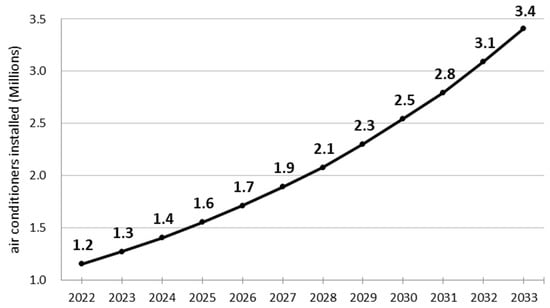
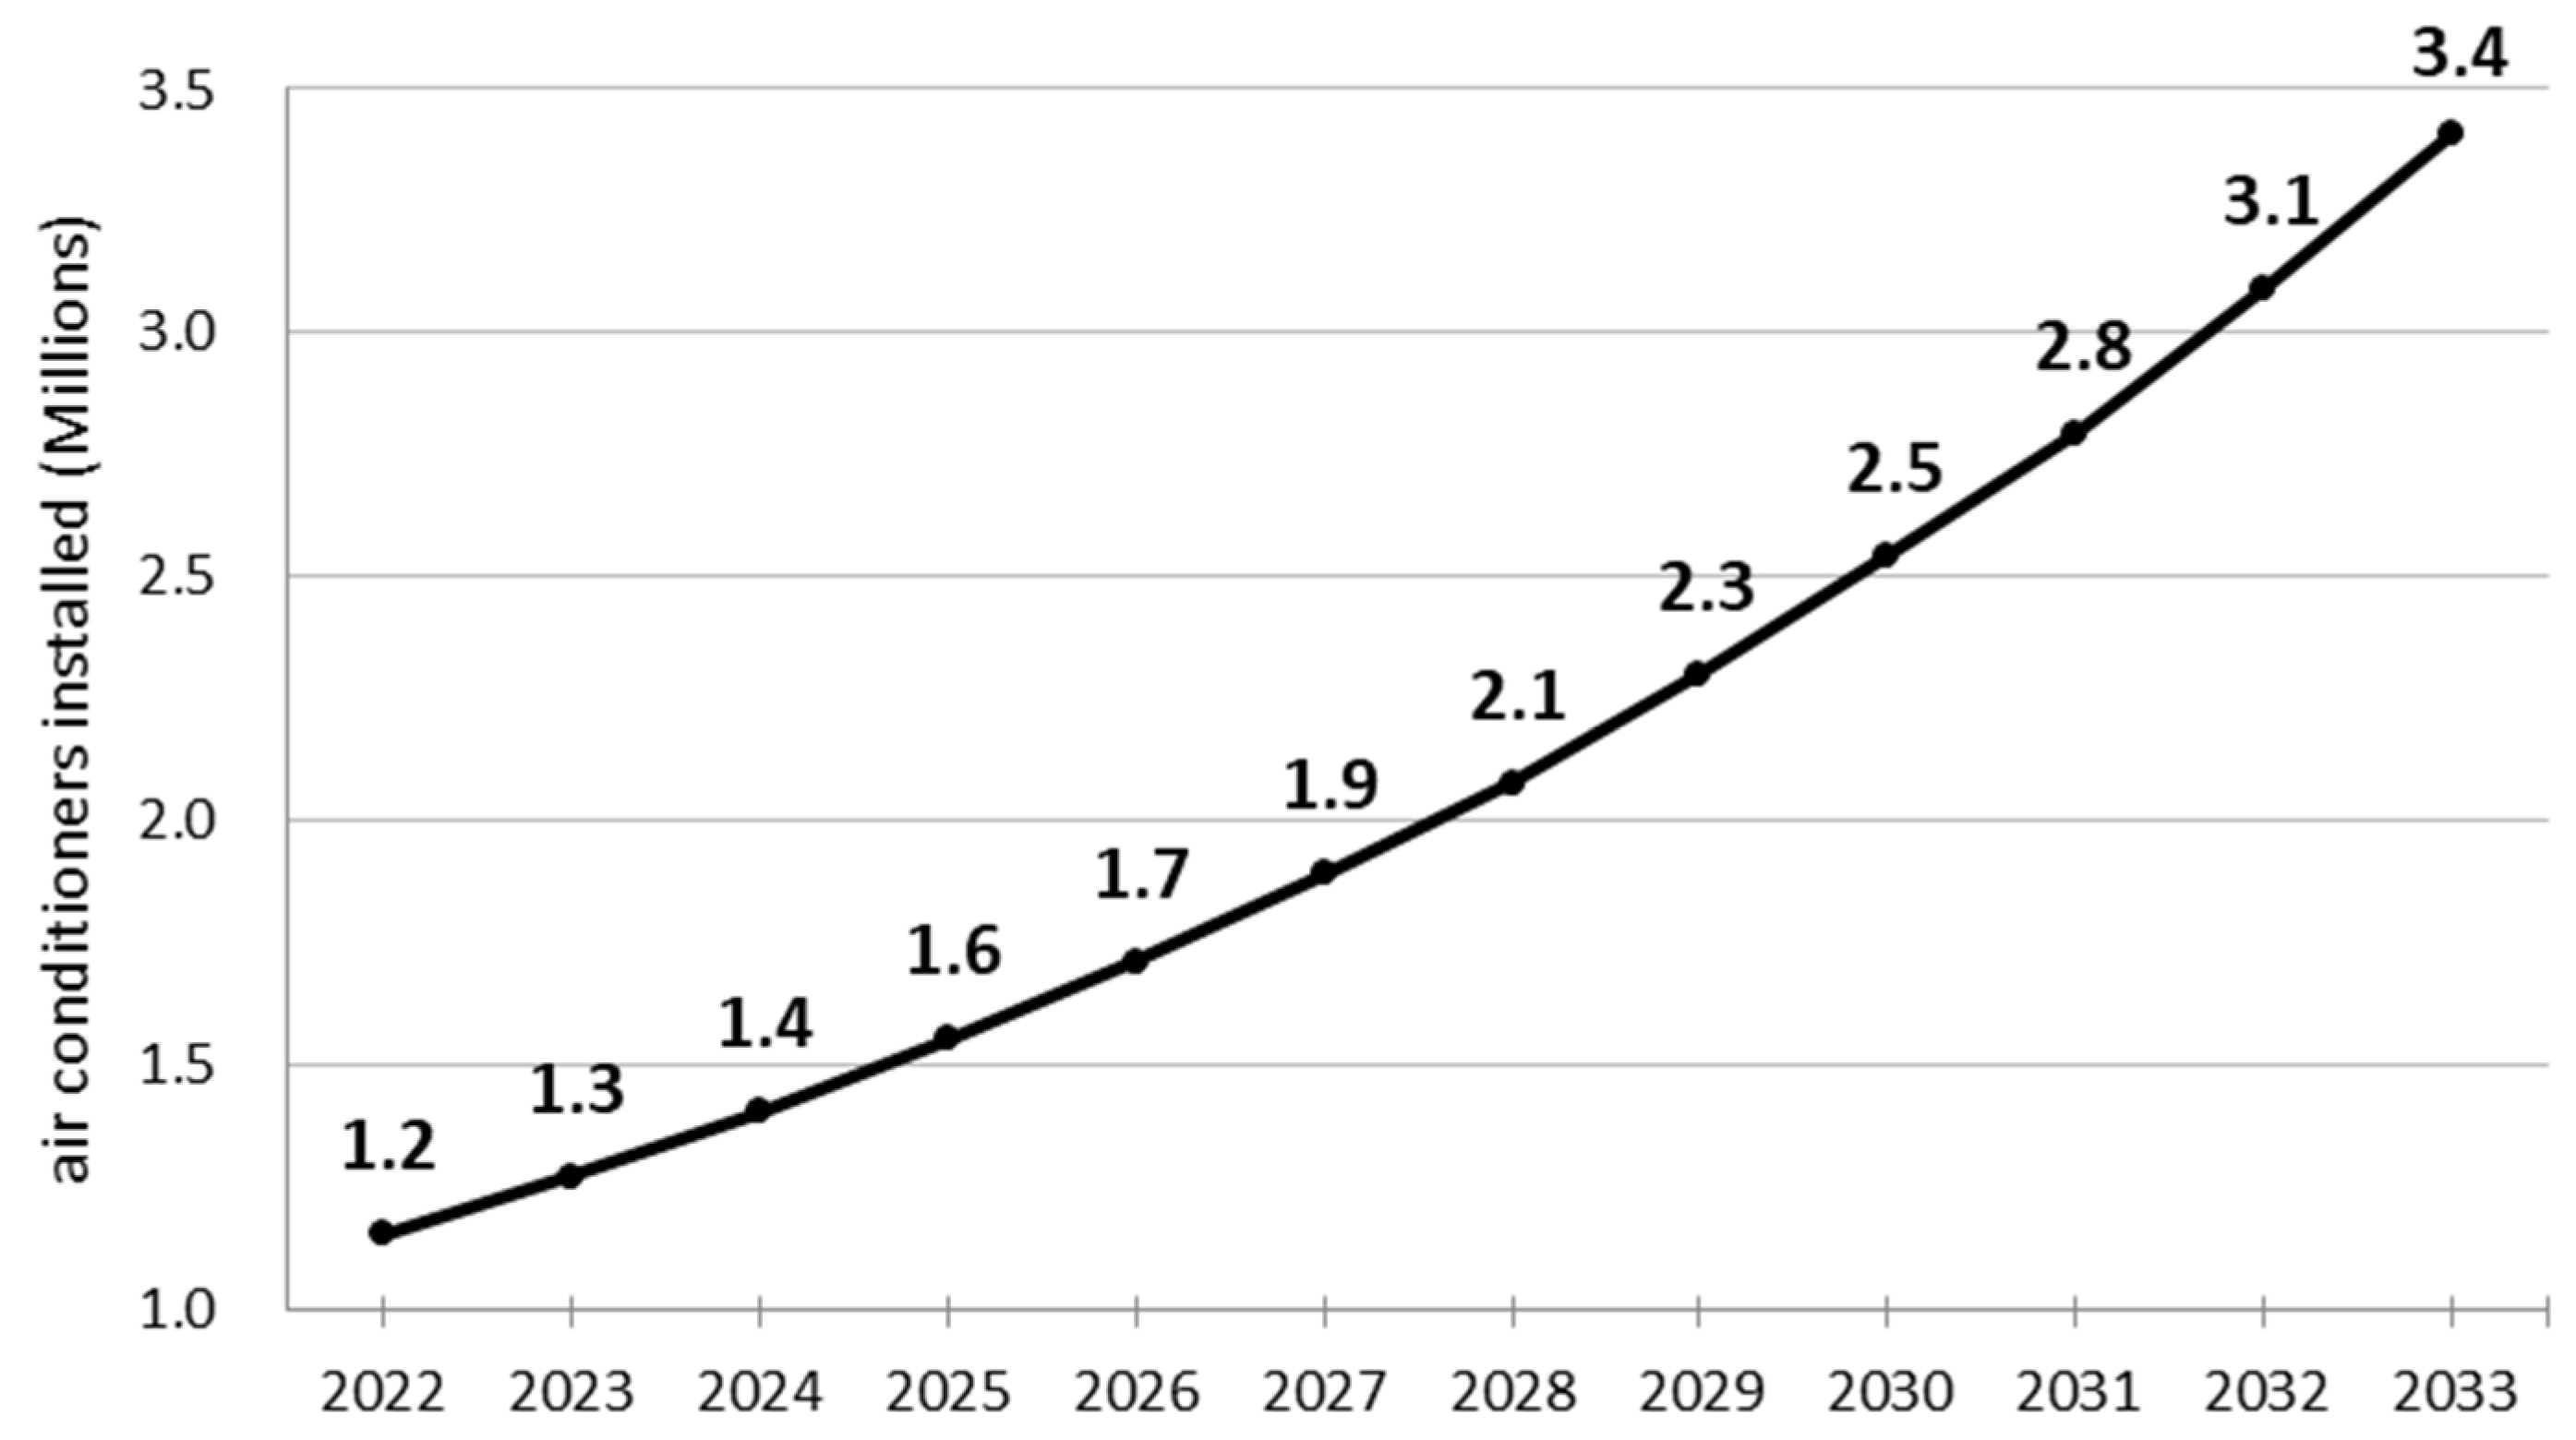
Simultaneously, the projection of the number of AC units (Figure 8) suggests that it could reach approximately 3.4 million by 2033, if the 9% growth rate observed by INE during 2019–2021 is maintained.
Figure 8.
Mean of Projected Values for SIN Maximum Demand (2022–2033).
Comparison with Recorded Values and ANDE Scenarios
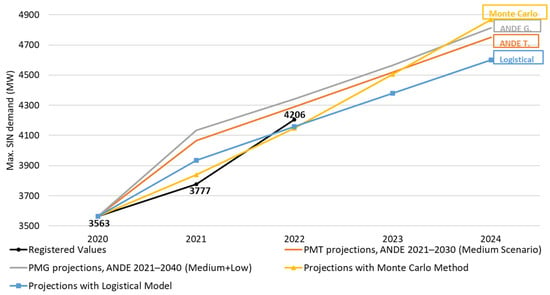
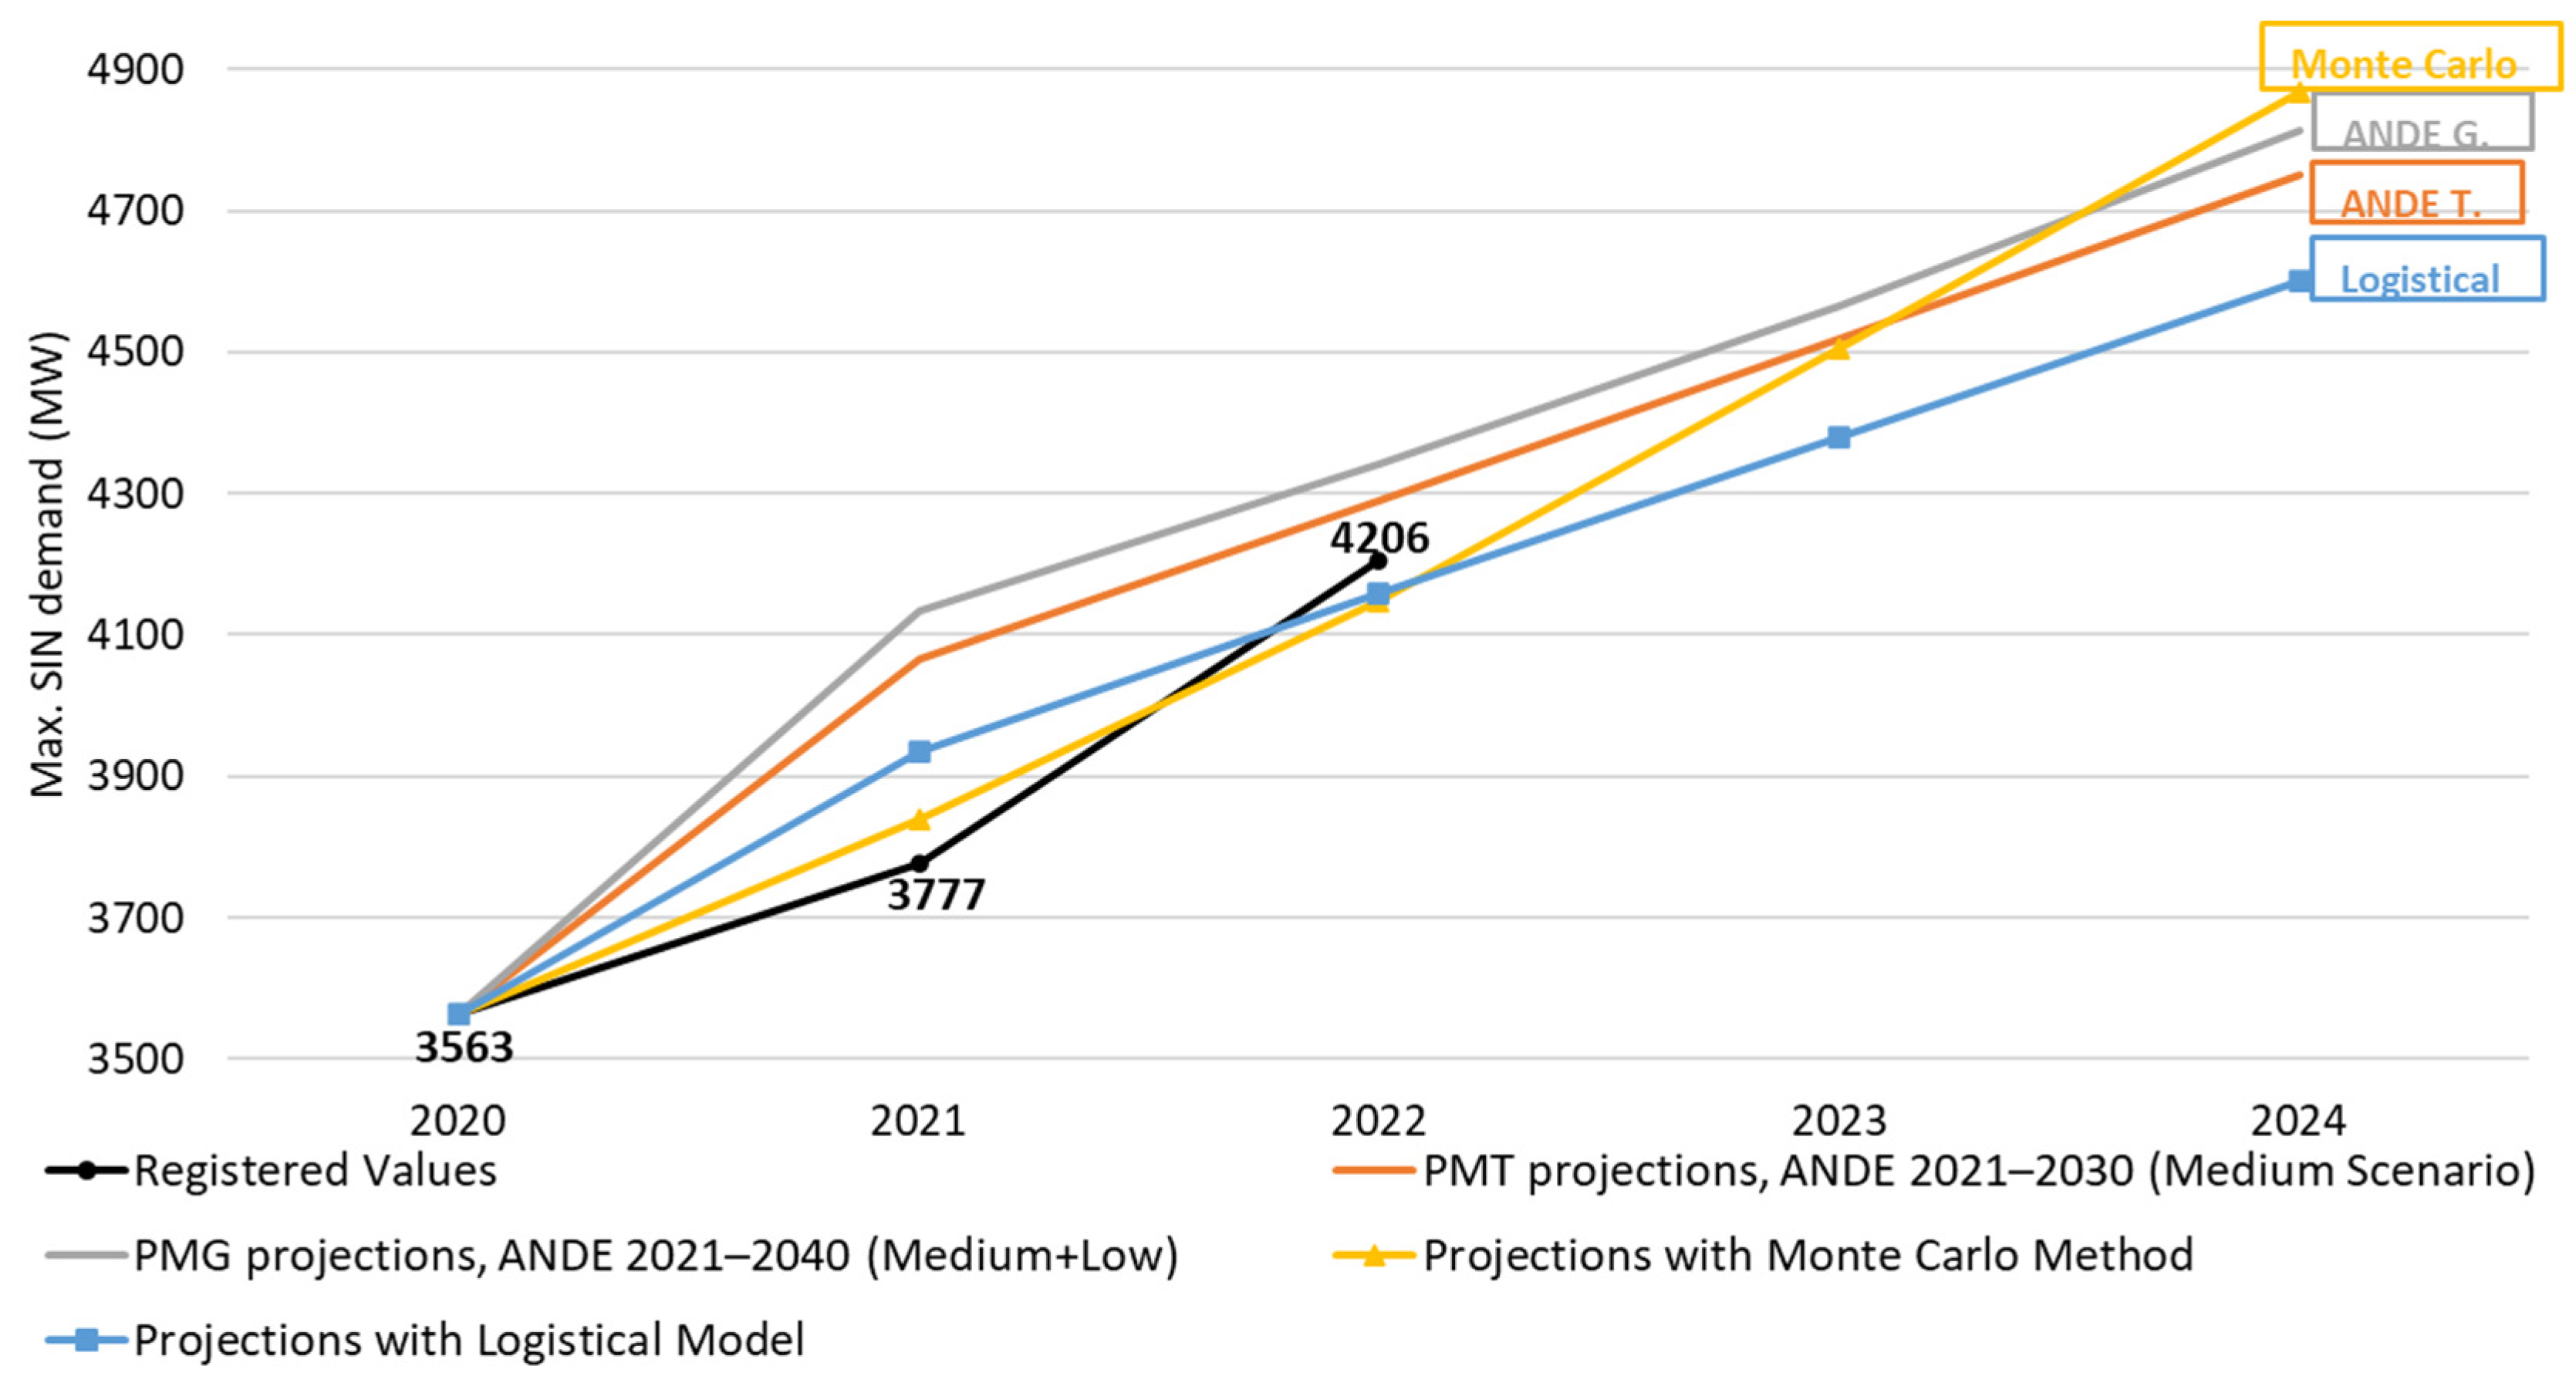
In Figure 9, Monte Carlo and Logistic Model projections are compared with actual values and ANDE scenarios (Medium Scenario, Low Scenario). For 2022, the Monte Carlo projection (4147 MW) and Logistic Model (4158 MW) align more closely with the recorded value (4206 MW) than ANDE’s estimates (Medium–High Scenarios), lending credibility to these methods for planning purposes.
Figure 9.
Projected vs. Recorded Maximum Demand Curves (2020–2024).
While the Logistic Model moderate’s growth (converging to an asymptote), the Monte Carlo Method tends to follow the potential upward trajectory that demand could take in subsequent years, reflecting stress scenarios for the electric system (e.g., heat waves, accelerated increases in the AC fleet).
In planning, it is often recommended to use methods that “stress” the system so that expansion strategies and efficiency policies are designed with a safety margin.
4.5.2. Potential Savings from the Application of EE Measures to AC Units Installed Nationwide
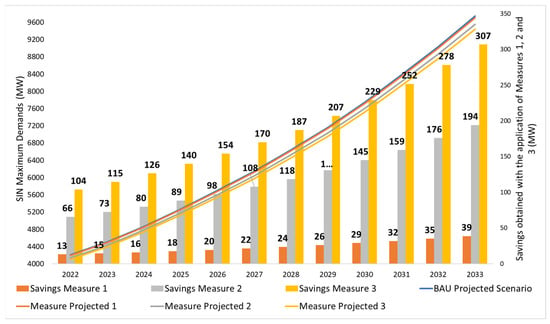
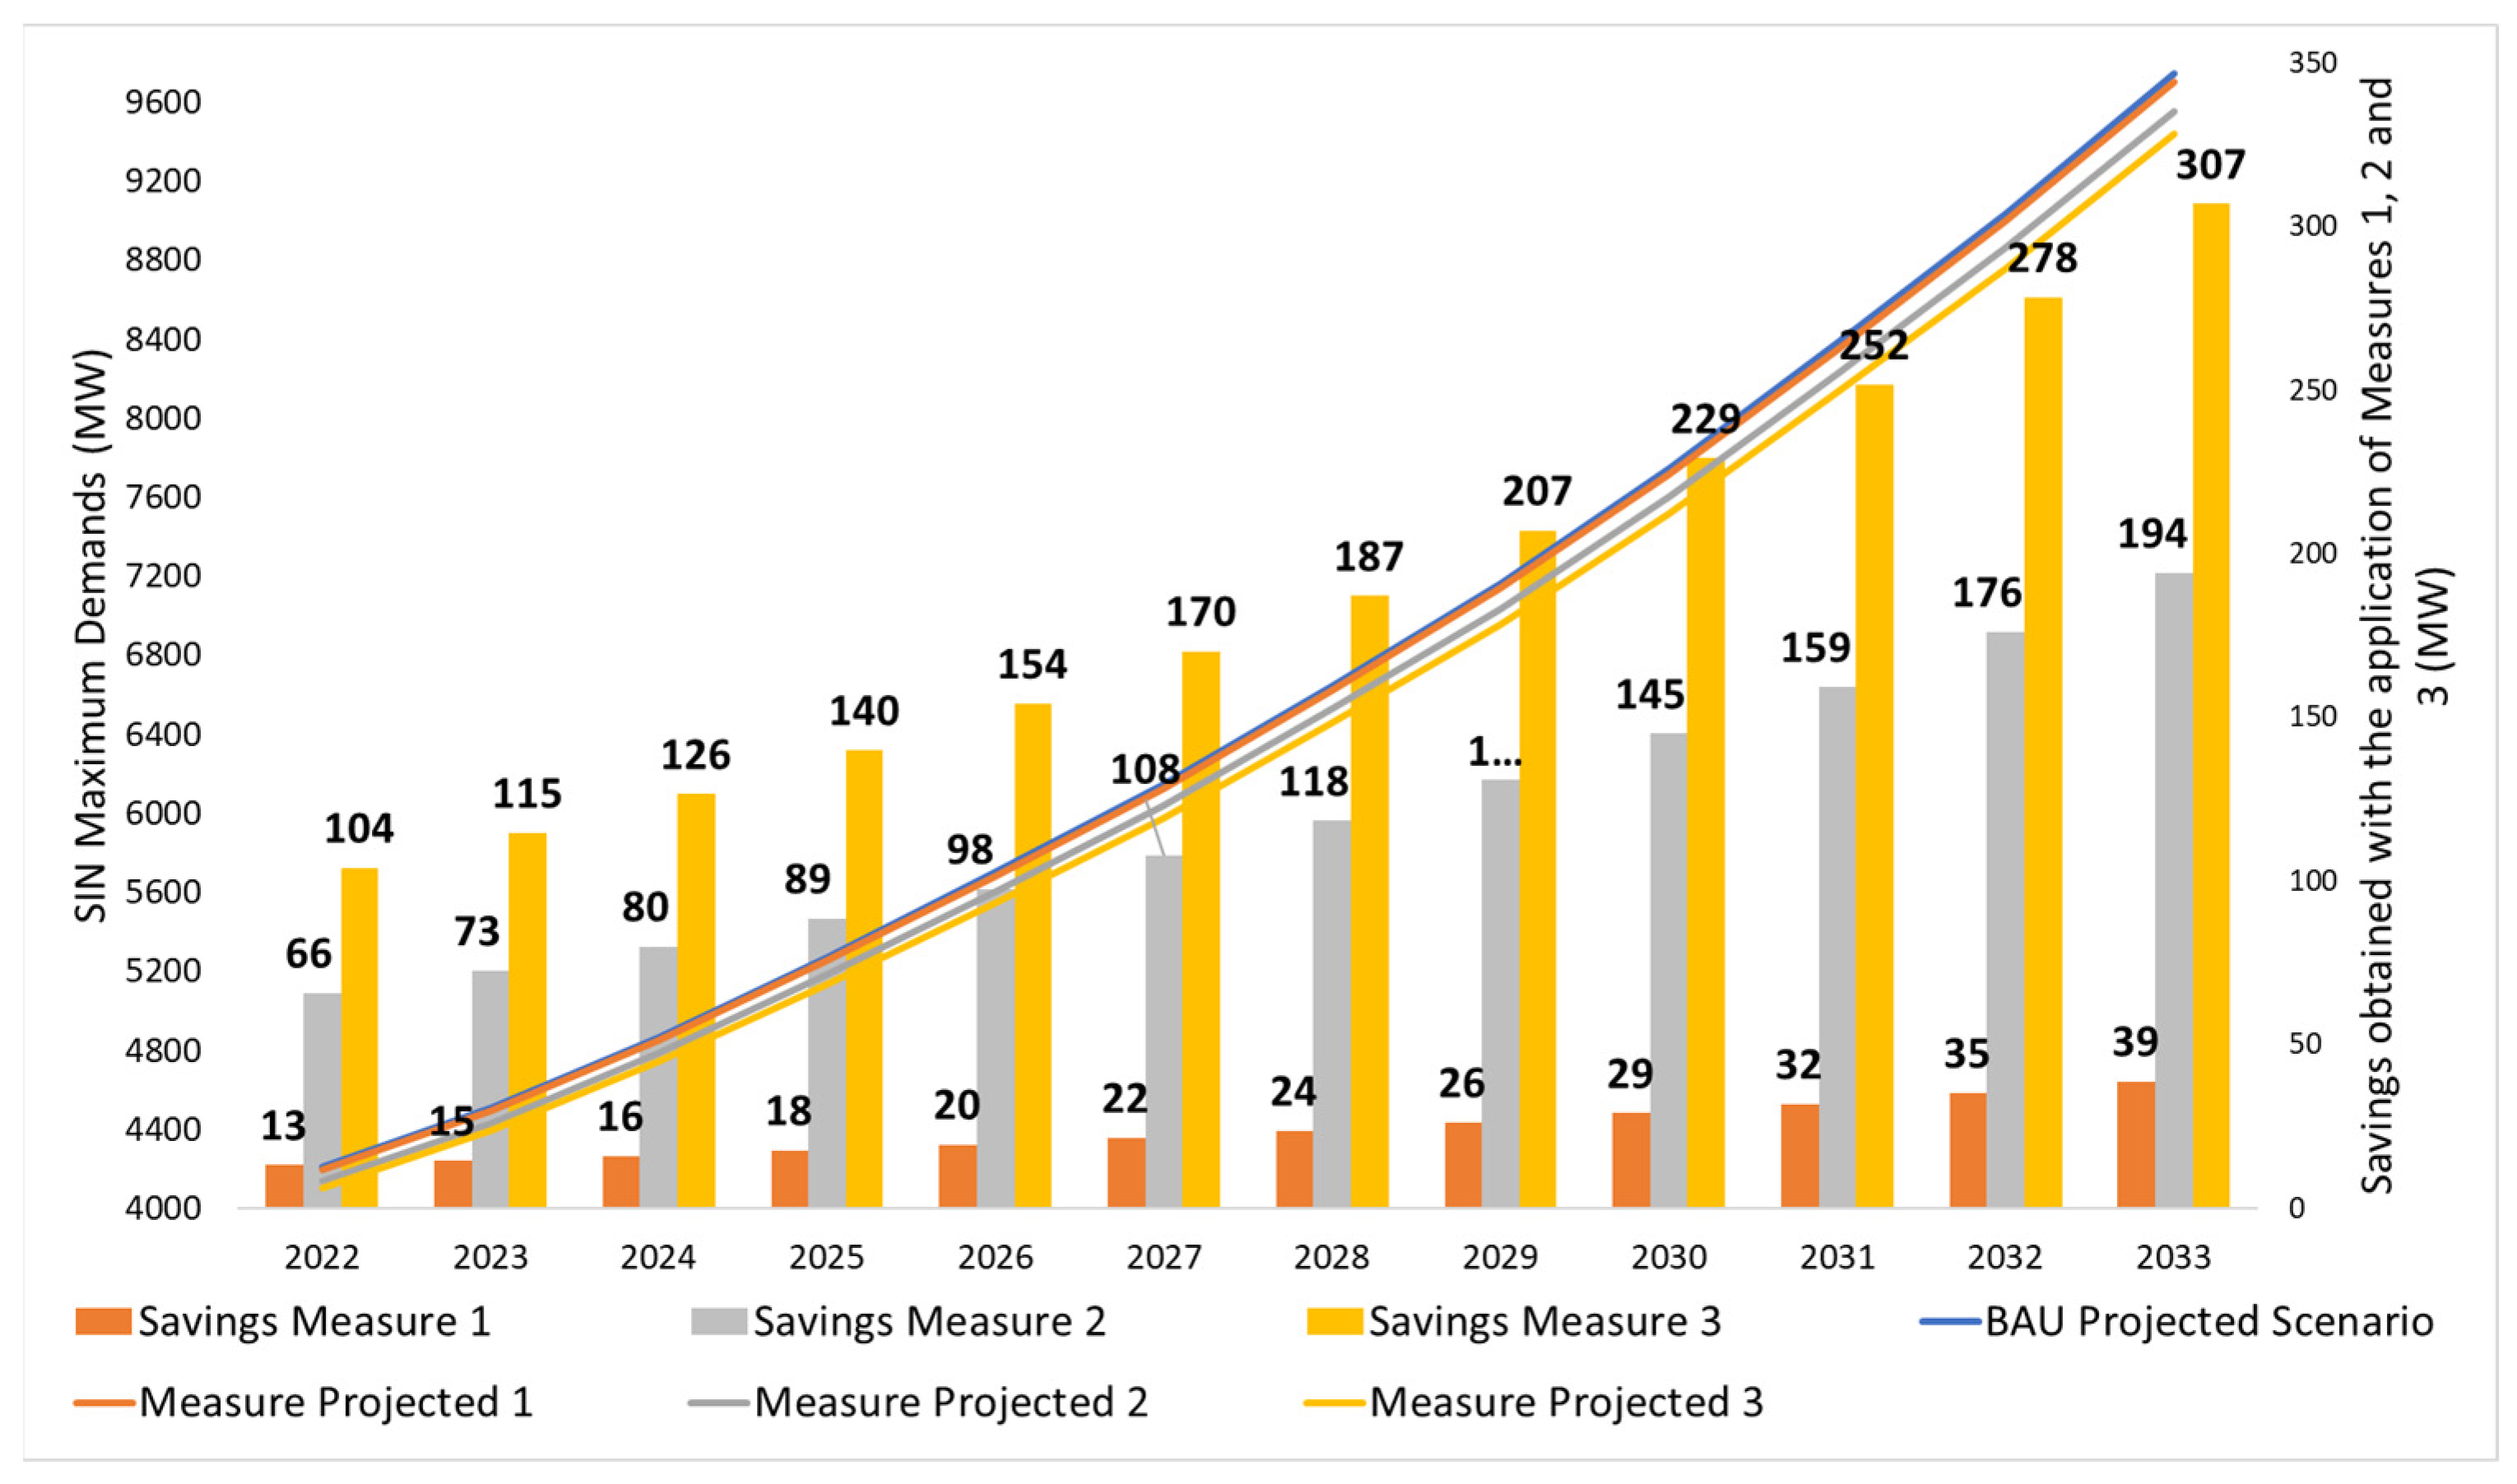
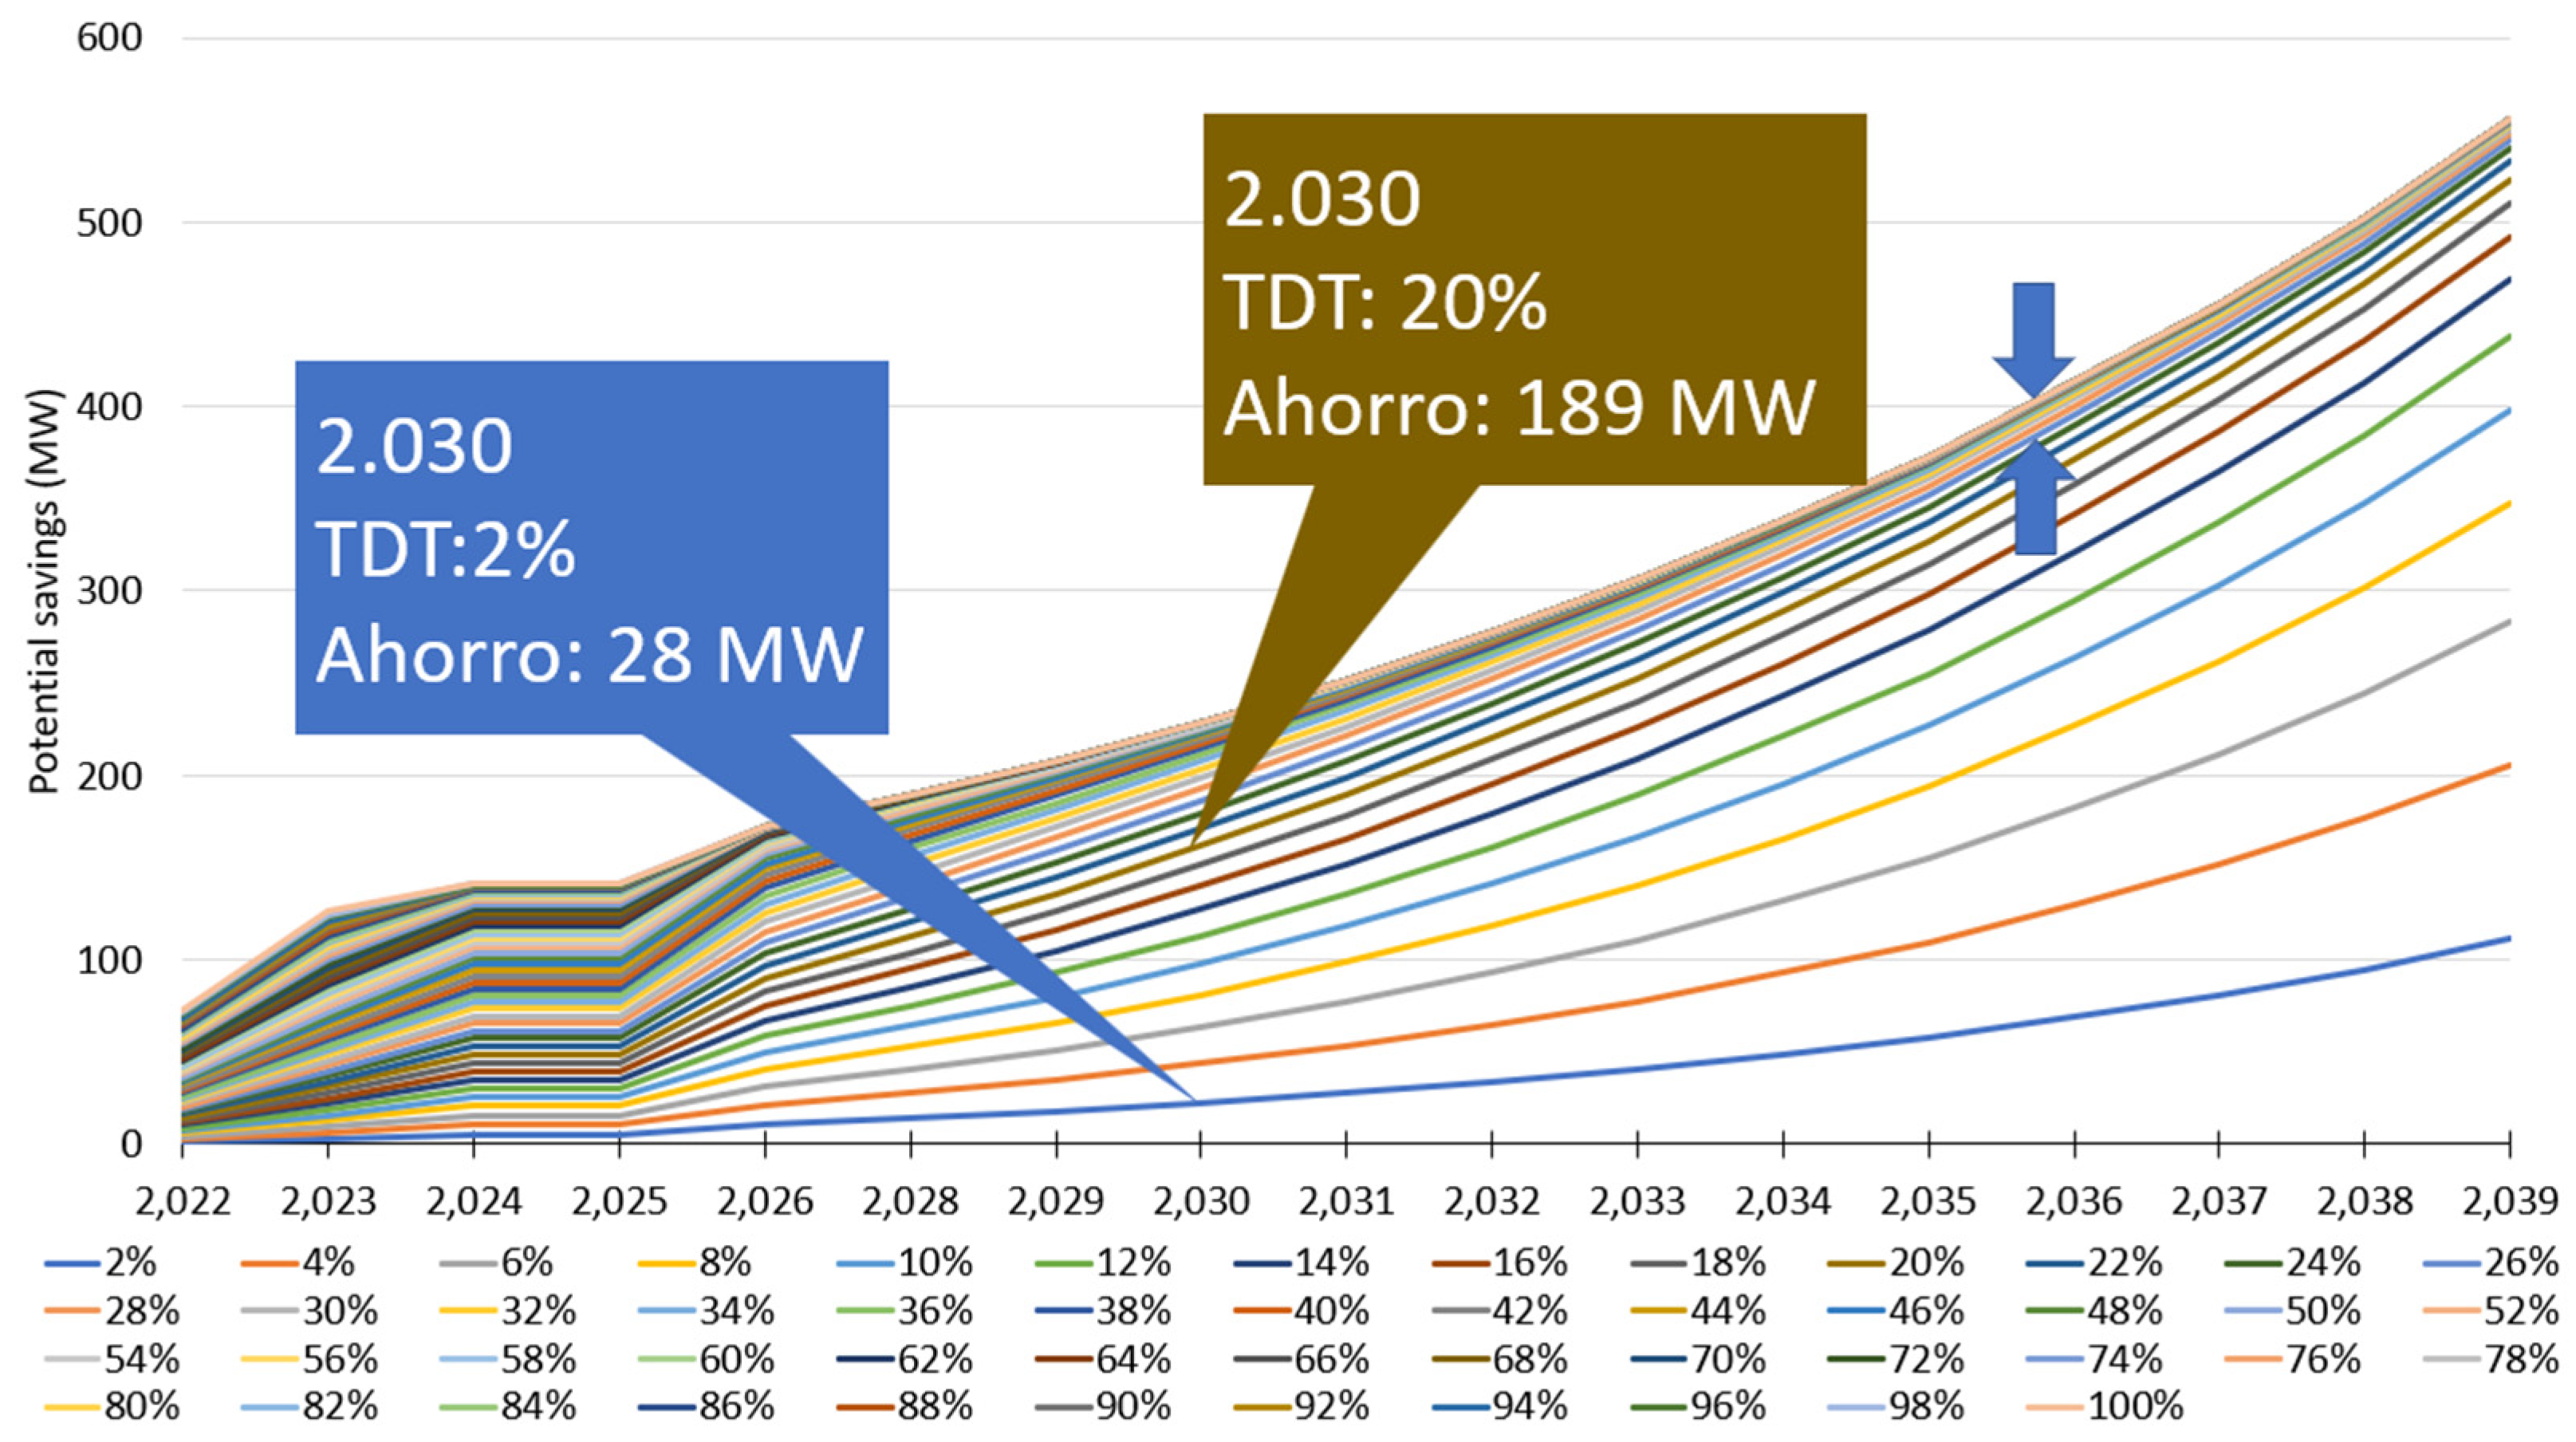
Based on the results from Section 4.5.1 and Section 4.5.2, the impact of three EE measures was evaluated, grounded on TTR—percentages of units migrating from less efficient classes to higher efficiency classes—and compared with a BAU scenario (without EE improvements). As illustrated in Figure 10 and Figure 11, these measures result in different power savings (MW) throughout the 2022–2033 period:
Figure 10.
Results of Applied Measures and Comparison with the BAU Scenario (Savings), 2022–2033 Period.
Figure 11.
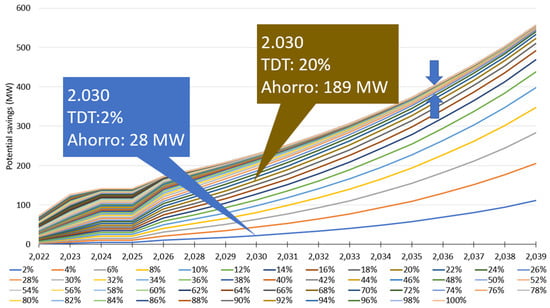
Potential Savings Resulting from the Application of Different Technological Transition Rates (2022–2039).
- Measure 1 (TTR = 20%): Up to ~39 MW savings by 2030.
- Measure 2 (TTR = 100%): ~194 MW savings, equivalent to the capacity of the Acaray Hydroelectric Plant (CH Acaray).
- Measure 3 (Full Transition to Class A): ~307 MW maximum savings by 2030, equivalent to the installed capacity of two generating units of the Yacyreta Hydroelectric Plant (CH Yacyreta).
In contrast, the BAU scenario projects that AC units would account for 46% of maximum demand (4476 MW) by 2033, nearly half of the total peak demand, which is unsustainable without EE policies. Some estimates from consultancies like CLERK differ in the short term (e.g., 13 MW savings in 2022 for TTR = 20%), but the methodology presented here is based on official INE/customs data from 2019 to 2021, offering a more “realistic” approach for the medium to long term.
4.6. Technical Proposal for Viable Improvement
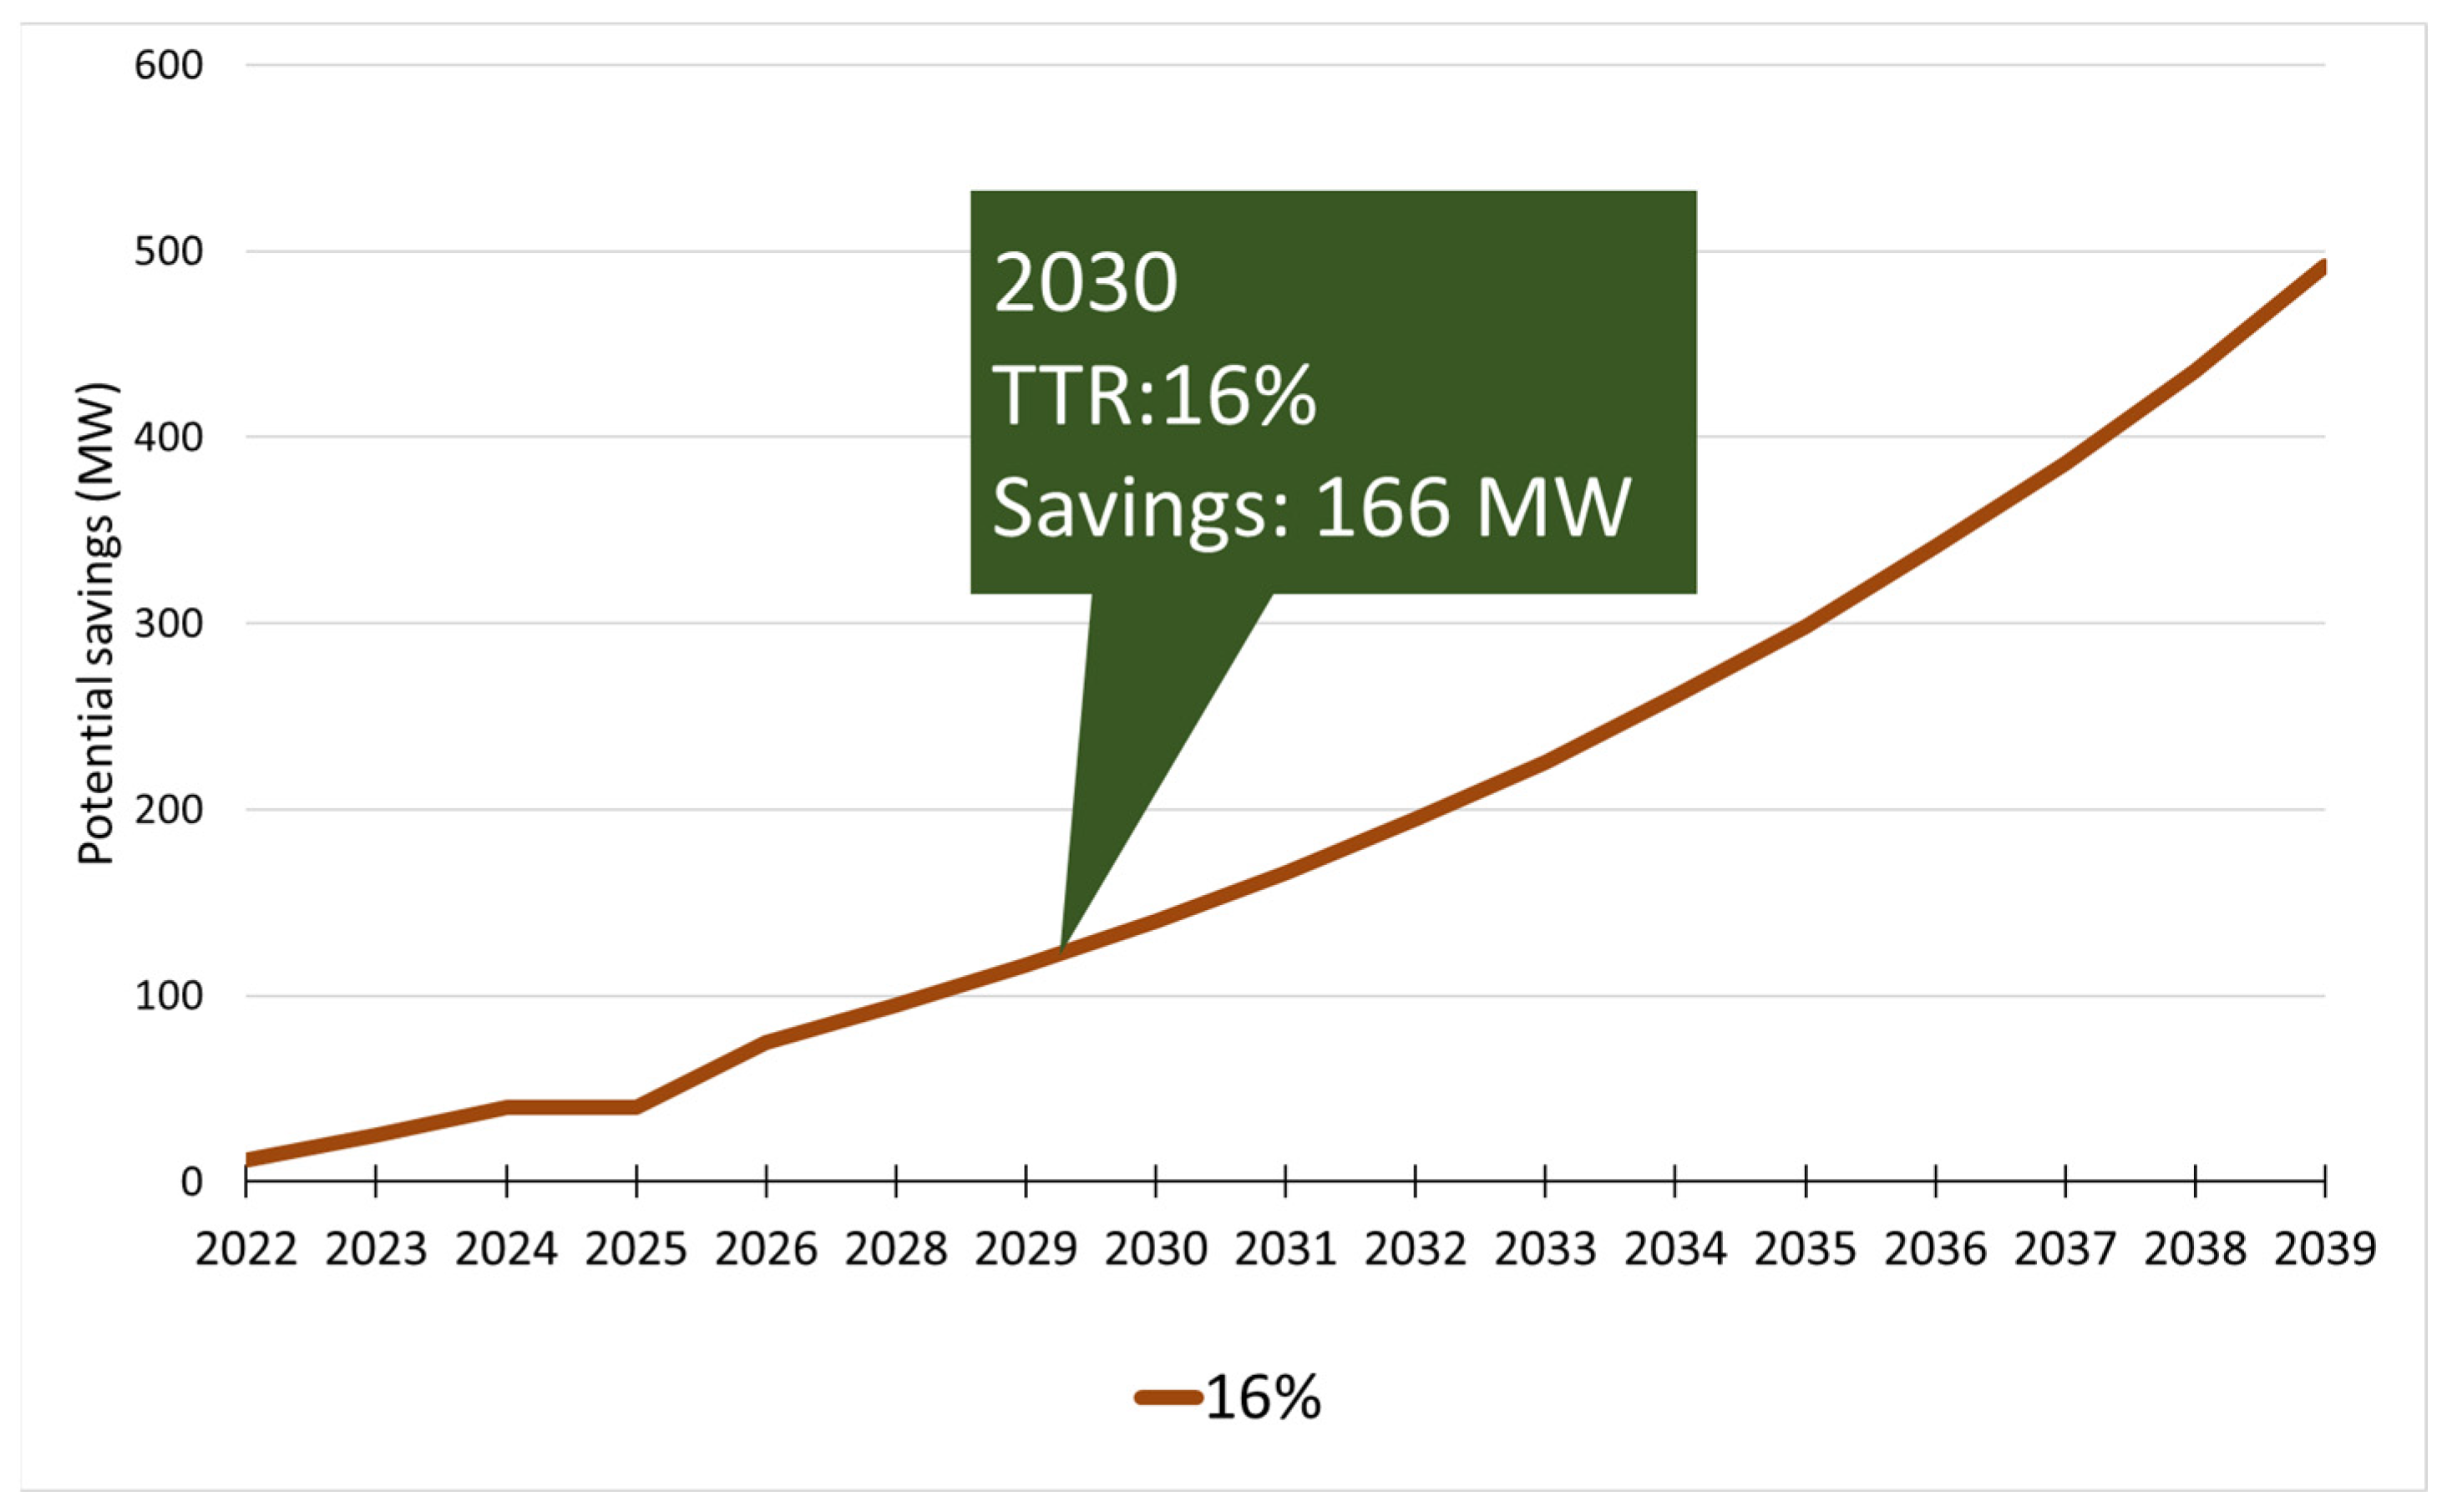
Based on the above, it is recommended to aim for a TTR of 16% from 2022 to 2030, which would involve the progressive replacement of less efficient AC units with Class A units (Figure 12). This strategy could achieve a potential savings of 166 MW by 2030, contributing to the fulfillment of Sustainable Development Goals (SDGs) 7 (Affordable and Clean Energy) and 13 (Climate Action). Furthermore, this approach would allow:
Figure 12.
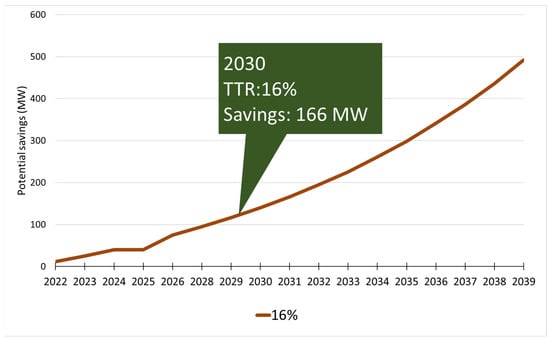
Potential Savings Curve for Each Year with a TTR of 16%.
- Mitigating SIN saturation in extreme heat and drought scenarios.
- Reducing emissions associated with energy generation during peak demand periods.
- Strengthening system resilience against climatic variations and adverse hydrological events.
In summary, the combination of projection models and EE scenarios suggests that without the implementation of labeling policies, equipment replacement, and regulation of inefficient AC supply, Paraguay could face a rapid depletion of its dispatchable capacity and higher costs for expanding electrical infrastructure.
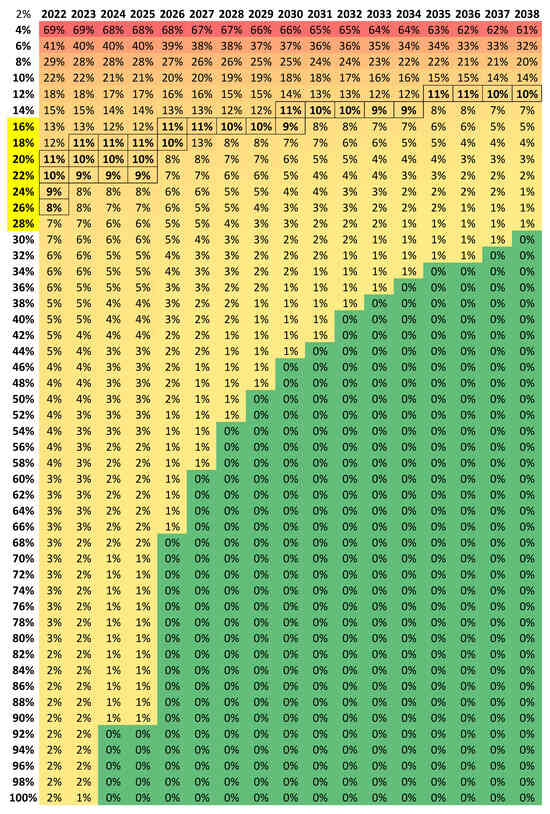
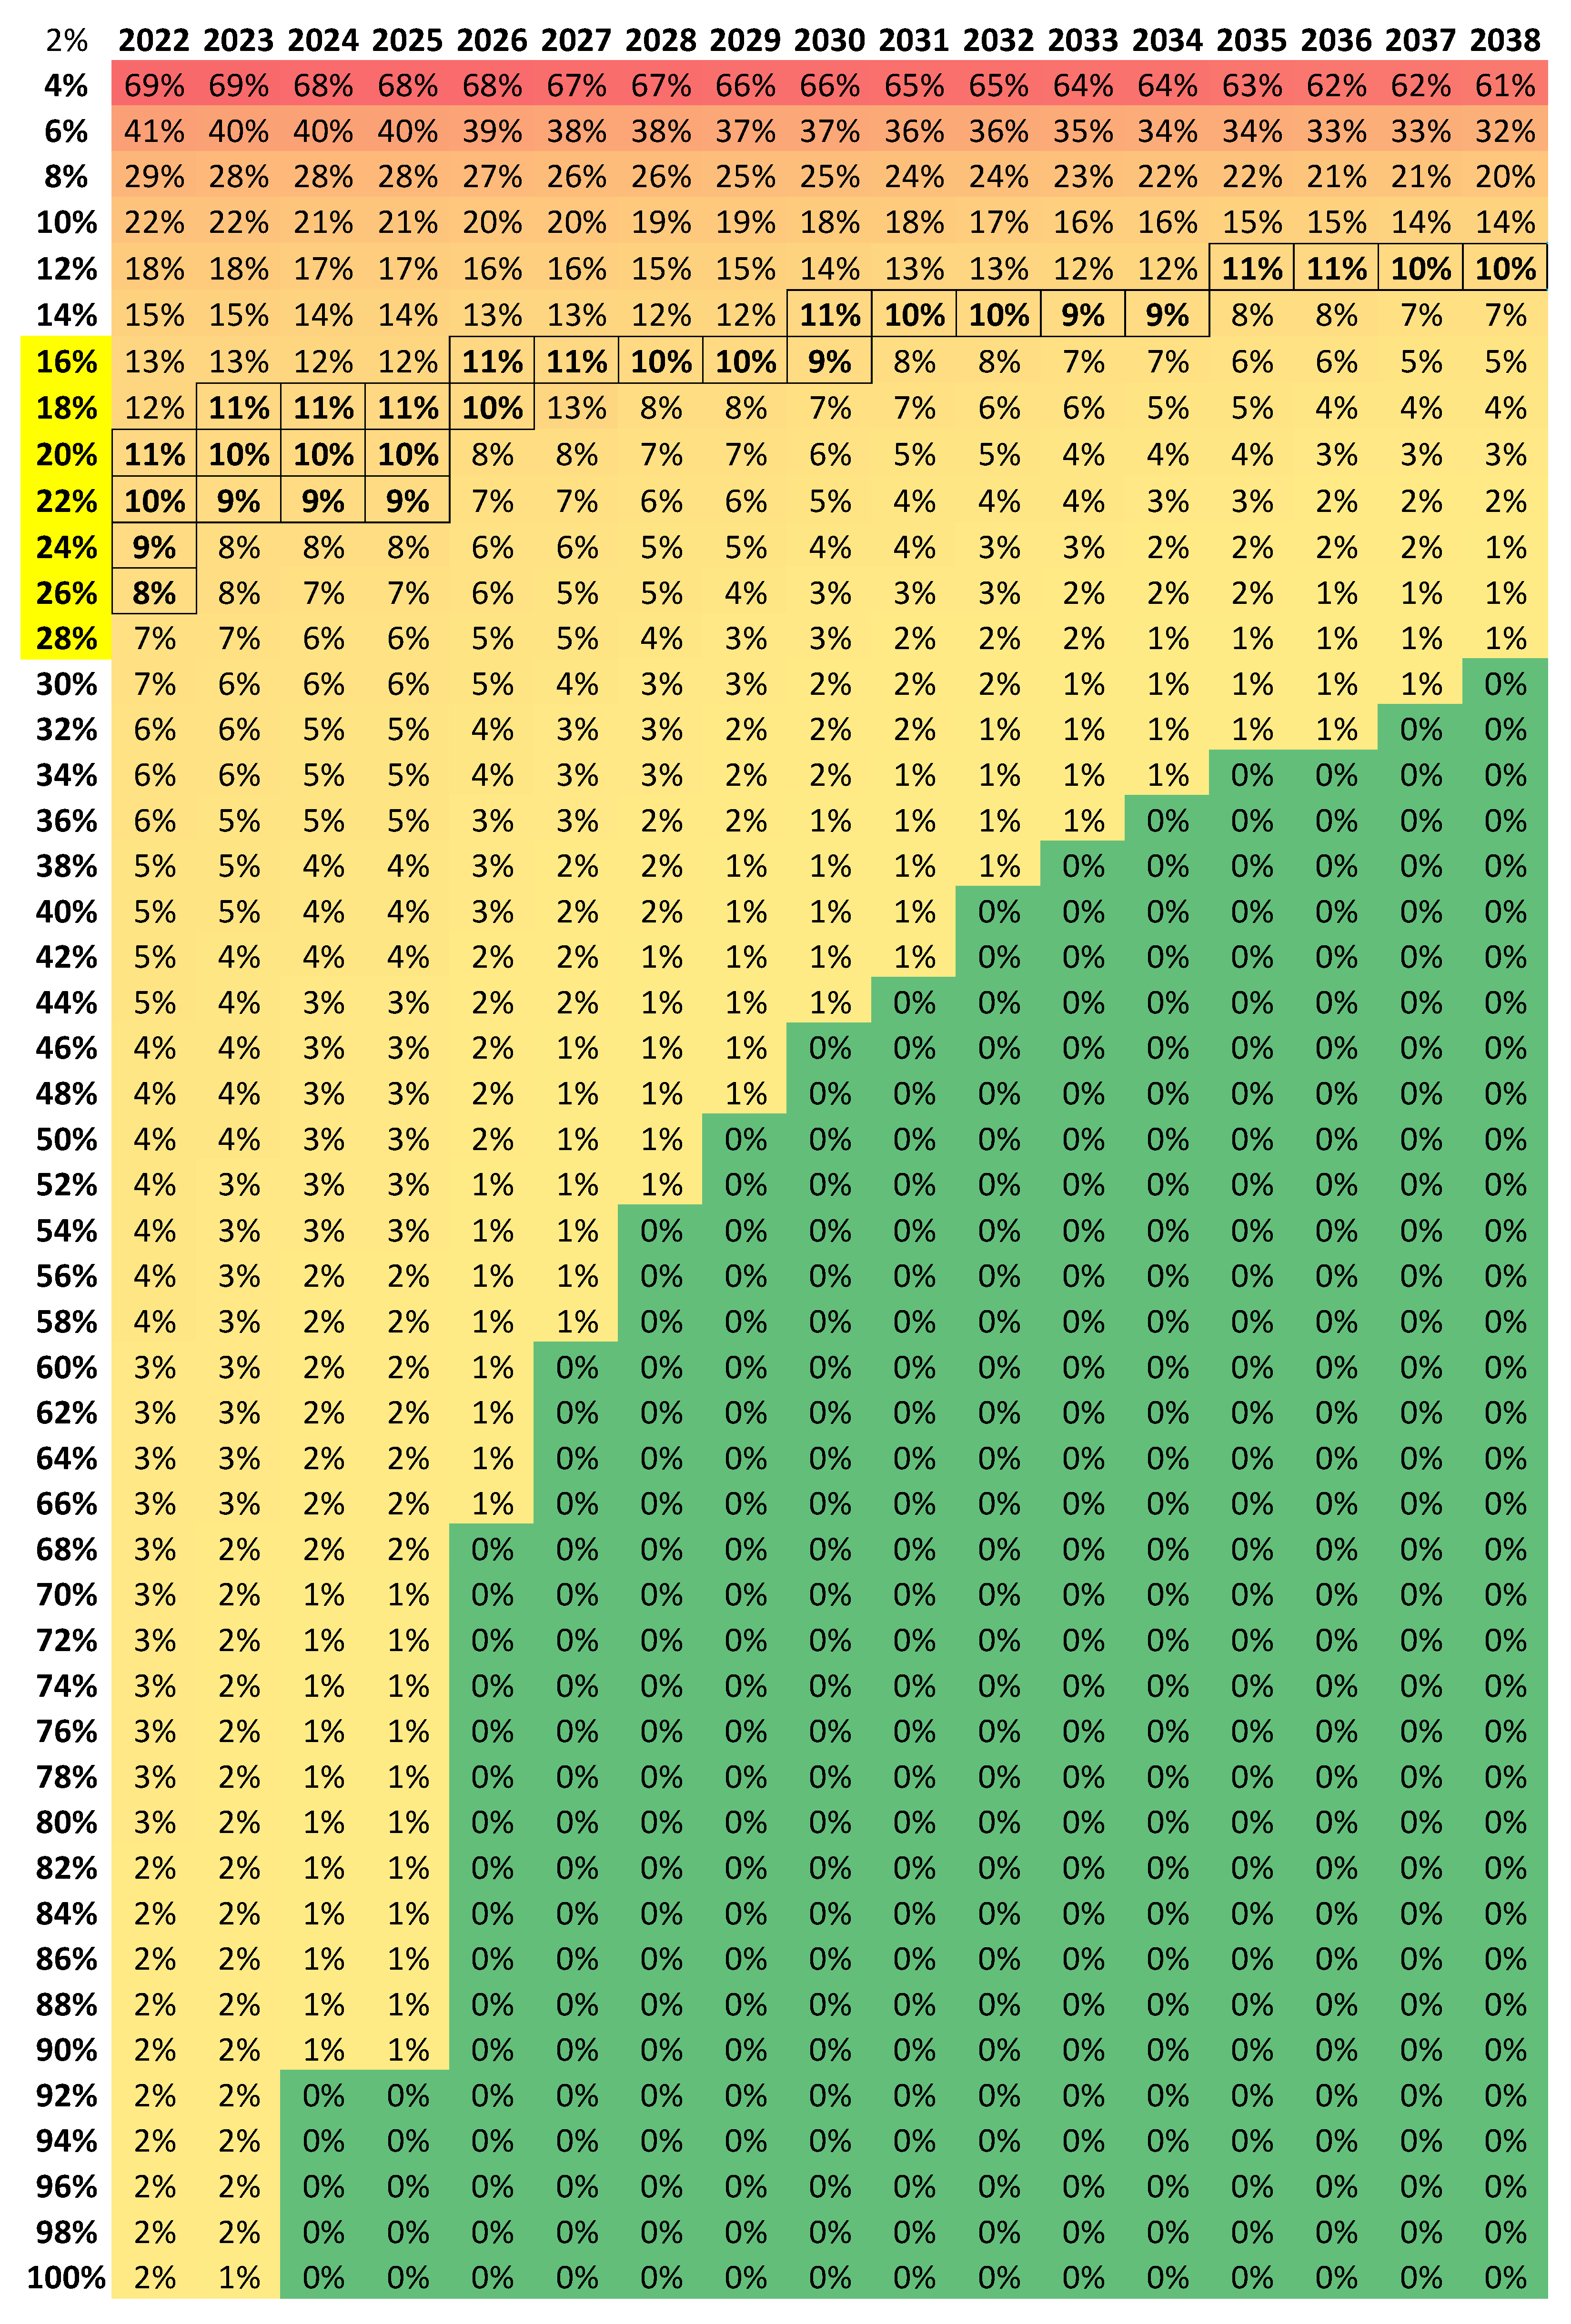
This is a sensitivity analysis that crosses annual TTR/TDT (rows, 2–100%) with year (columns, 2022–2038). Each cell indicates the percentage of inefficient stock that remains to be migrated (or, equivalently, the savings gap that remains to be captured relative to the “all Class A” scenario). Red = high gap; green = 0% (there is no more stock to be migrated; the maximum savings have been captured). The 2022 base is based on the observed label distribution (CLERK/INE) and the model’s stock/demand projections (Logistics/Monte Carlo).
How to read it and the “16–18% range”
- With low TTRs (e.g., 2–8%), the gap decreases very little: in 2038, >20% remains to be migrated.
- With high TTRs (≥40–50%), the gap reaches 0% a few years later (green).
- The 16–18% range is the “practical optimum”: by 2030, it leaves a remainder of ≈10–12%, i.e., ≈88–90% of the potential savings captured without incurring the costs/doubtful viability of much higher TTR. This is consistent with the TTR = 16% recommendation and the estimated savings of ~166 MW by 2030.
The TTR is the annual proportion of the fleet that migrates from less efficient to more efficient classes; the savings in MW are calculated by comparing each transition trajectory with the BAU scenario, using consumption per class (EEI/BTU) and the AA demand and fleet projections. Figure 13 of the manuscript is precisely defined as “Sensitivity Analysis of TTR Variation—Optimized Range”.
Figure 13.
TTR Variance Sensitivity Analysis—Optimized Variance Range.
5. Conclusions
Despite the methodological limitations inherent in the Paraguayan data context, this study represents the first scientific evidence demonstrating the direct and contemporary relationship between temperature and the demand of Paraguay’s National Interconnected System (SIN), corroborating the hypothesis proposed by the ANDE. It was shown that approximately 20% of the variability in electricity demand can be explained by temperature “shocks,” highlighting the need to consider climatic factors in energy planning. Additionally, the analysis indicated that the “cooling load” associated with air conditioning accounts for 34–36% of maximum demand, illustrating how uncontrolled AC expansion and the lack of effective regulations can significantly increase demand peaks during periods of high temperatures.
From a mitigation perspective, the adoption of EE measures—such as the implementation of AC labeling and the TTR—proved critical in postponing early investments in additional generation, transmission, and distribution capacity while strengthening the system’s resilience to extreme climatic events. In this context, the recent enactment of Presidential Decree 2853, which includes the National Energy Efficiency Labeling Program and establishes the gradual application of minimum energy performance standards for selected products, represents a crucial advancement. This study provides robust technical evidence supporting the implementation of this policy and underscores that such initiatives are essential for promoting efficient energy consumption in Paraguay.
Surpassing the contributions of previous studies—limited to verifying the climate-demand relationship without accurately estimating the cooling load or offering concrete mitigation strategies, this work reinforces the importance of establishing technical and regulatory tools to move toward more sustainable energy consumption. Furthermore, the findings offer a valuable technical basis for evaluating future regulations, such as a potential Energy Efficiency Law, highlighting their relevance in energy planning, climate change adaptation, and achieving Sustainable Development Goals (SDGs) 7 and 13.
Author Contributions
Conceptualization, D.S., V.O. and R.R.; methodology, D.S.; validation, V.O., R.R. and E.O.; formal analysis, D.S.; investigation, D.S.; resources, R.R. and V.O.; data curation, D.S.; writing—original draft preparation, D.S.; writing—review and editing, R.R., V.O. and E.O.; visualization, R.R., V.O. and E.O.; supervision, R.R., V.O. and E.O. All authors have read and agreed to the published version of the manuscript.
Funding
This research received partial funding from National Council of Science and Technology (CONACYT) of Paraguay, and the APC was funded by Polytechnic Faculty, National University of Asuncion (FP-UNA).
Data Availability Statement
You can find research data here at the following link https://github.com/dsalomon1996/my-first-project, accessed on 25 November 2025.
Acknowledgments
The authors are very grateful to the National Council of Science and Technology (CONACYT) of Paraguay for the support through the project PINV 18-1040, PROCIENCIA Program and the PRONII Program and specially to the Polytechnic Faculty, National University of Asuncion (FP-UNA). Finally, gratitude is also extended to one anonymous reviewer for their comments and suggestions, which were very helpful in improving this article.
Conflicts of Interest
The authors declare no conflicts of interest.
Abbreviations
The following abbreviations are used in this manuscript:
| AC | Air Conditioning |
| EE | Energy Efficiency |
| ANDE | National Electricity Administration |
| SIN | National Interconnected System |
| VAR | Vector Autoregressive |
| INE | National Statistics Institute |
| BTU/h | Cooling capacity |
| EEI | Energy Efficiency Index |
| TTR | Technological Transition Rate |
| BAU | Business-As-Usual |
| SDGs | Sustainable Development Goals |
References
- Molu, R.J.J.; Mbasso, W.F.; Naoussi, S.R.D.; Kenfack, S.T.; Wira, P. Investigating the Dependency between Electricity and the Human Development Based on Metaheuristic Optimization. Int. J. Energy Econ. Policy 2022, 12, 55–60. [Google Scholar] [CrossRef] [Scilit]
- Mexhuani, A.; Bylykbashi, K.; Jupaj, B.; Shala, A.; Rubini, L. The state of the electrical sector in Western Balkan countries. Case study: Republic of Kosovo. J. Phys. Conf. Ser. 2022, 2385, 012101. [Google Scholar] [CrossRef] [Scilit]
- De Cian, E.; Wing, I.S. Global energy demand in a warming climate. Environ. Resour. Econ. 2019, 72, 365–410. [Google Scholar] [CrossRef] [Scilit]
- Filahi, H.; Omrani, H.; Drobinski, P.; Claudel, S. Impacts of Climate Change on Temporal Fragmentation of Energy Demand in Europe. Available online: https://meetingorganizer.copernicus.org/EGU23/EGU23-5225.html (accessed on 10 July 2025).
- de Cian, E.; Wing, I.S. Centro Euro-Mediterraneo per i Cambiamenti Climatici, Climate Change Impacts on Energy Demand. 2014. Available online: https://www.cmcc.it/publications/rp0240-climate-change-impacts-on-energy-demand (accessed on 25 November 2025).
- Wu, J.; Liu, C.; Li, H.; Ouyang, D.; Cheng, J.; Wang, Y.; You, S. Residential air-conditioner usage in China and efficiency standardization. Energy 2017, 119, 1036–1046. [Google Scholar] [CrossRef] [Scilit]
- Sagawa, D.; Tanaka, K. Machine Learning-Based Estimation of COP and Multi-Objective Optimization of Operation Strategy for Heat Source Considering Electricity Cost and On-Site Consumption of Renewable Energy. Energies 2023, 16, 4893. [Google Scholar] [CrossRef] [Scilit]
- Luo, G.; Sun, T.; Wang, H.; Li, H.; Wang, J.; Miao, Z.; Si, H.; Che, F.; Liu, G. An Energy-Saving Regulation Framework of Central Air Conditioning Based on Cloud–Edge–Device Architecture. Sustainability 2023, 15, 2554. [Google Scholar] [CrossRef] [Scilit]
- Zhang, F.; Huang, Y.; Nan, X. Advanced research methods and their applications on the nexus of energy efficiency and environment: Evidence from five RCEP economies. Econ. Res.-Ekon. Istraživanja 2022, 35, 5676–5698. [Google Scholar] [CrossRef] [Scilit]
- Pérez-Lombard, L.; Ortiz, J.; Pout, C. A review on buildings energy consumption information. Energy Build. 2008, 40, 394–398. [Google Scholar] [CrossRef] [Scilit]
- Sadineni, S.B.; Madala, S.; Boehm, R.F. Passive building energy savings: A review of building envelope components. Renew. Sustain. Energy Rev. 2011, 15, 3617–3631. [Google Scholar] [CrossRef] [Scilit]
- De Dear, R.J.; Brager, G.S. Thermal comfort in naturally ventilated buildings: Revisions to ASHRAE Standard 55. Energy Build. 2002, 34, 549–561. [Google Scholar] [CrossRef] [Scilit]
- Buonocore, C.; De Vecchi, R.; Scalco, V.; Lamberts, R. Thermal preference and comfort assessment in air-conditioned and naturally-ventilated university classrooms under hot and humid conditions in Brazil. Energy Build. 2020, 211, 109783. [Google Scholar] [CrossRef] [Scilit]
- Zhang, X.-B.; Sun, J.; Fei, Y.; Wei, C. Cooler rooms on a hotter planet? Household coping strategies, climate change, and air conditioning usage in rural China. Energy Res. Soc. Sci. 2020, 68, 101605. [Google Scholar] [CrossRef] [Scilit]
- Zhang, Z.; Zhang, Y.; Khan, A. Thermal comfort of people in a super high-rise building with central air-conditioning system in the hot-humid area of China. Energy Build. 2020, 209, 109727. [Google Scholar] [CrossRef] [Scilit]
- Mahlia, T.M.I.; Masjuki, H.H.; Choudhury, I.A. Theory of energy efficiency standards and labels. Energy Convers. Manag. 2002, 43, 743–761. [Google Scholar] [CrossRef] [Scilit]
- Andrews, C.J. Anticipating Air Conditioning’s Impact on the World’s Electricity Producers. Energy J. 1989, 10, 107–120. [Google Scholar] [CrossRef] [Scilit]
- McNeil, M.A.; Letschert, V.E. Future Air Conditioning Energy Consumption in Developing Countries and What Can Be Done About It: The Potential of Efficiency in the Residential Sector. 2008. Available online: https://escholarship.org/uc/item/64f9r6wr#main (accessed on 25 November 2025).
- Oxford Analytica. Climate Disruptions Bring Long-Term Impact in Paraguay; Emerald Publishing: Cambridge, MA, USA, 2023. [Google Scholar] [CrossRef] [Scilit]
- Shaik, S.; Roy, A.; Arıcı, M.; Kontoleon, K.J.; Afzal, A.; Li, D. Air-conditioning cost savings, CO2 emission benefits and return on investment by using waste in porotherm bricks in hot-arid and warm-temperate climates. Energy Build. 2023, 286, 112955. [Google Scholar] [CrossRef] [Scilit]
- Auffhammer, M.; Mansur, E.T. Measuring climatic impacts on energy consumption: A review of the empirical literature. Energy Econ. 2014, 46, 522–530. [Google Scholar] [CrossRef] [Scilit]
- Gam, I.; Rejeb, J.B. Electricity demand in Tunisia. Energy Policy 2012, 45, 714–720. [Google Scholar] [CrossRef] [Scilit]
- Harish, S.; Singh, N.; Tongia, R. Impact of temperature on electricity demand: Evidence from Delhi and Indian states. Energy Policy 2020, 140, 111445. [Google Scholar] [CrossRef] [Scilit]
- Holtedahl, P.; Joutz, F.L. Residential electricity demand in Taiwan. Energy Econ. 2004, 26, 201–224. [Google Scholar] [CrossRef] [Scilit]
- Zhou, K.; Li, Y. Influencing factors and fluctuation characteristics of China’s carbon emission trading price. Phys. Stat. Mech. Its Appl. 2019, 524, 459–474. [Google Scholar] [CrossRef] [Scilit]
- Casarin, A.A.; Delfino, M.E. Price freezes, durables, and residential electricity demand. Evidence from Greater Buenos Aires. Energy Econ. 2011, 33, 859–869. [Google Scholar] [CrossRef] [Scilit]
- Mahlia, T.M.I.; Masjuki, H.H.; Saidur, R.; Amalina, M.A. Viewpoint: Mitigation of emissions through energy efficiency standards for room air conditioners in Malaysia. Energy Policy 2004, 32, 1783–1787. [Google Scholar] [CrossRef] [Scilit]
- Phadke, A. Avoiding 100 New Power Plants by Increasing Efficiency of Room Air Conditioners in India: Opportunities and Challenges. 2014. Available online: https://escholarship.org/uc/item/5h9593bc (accessed on 10 July 2025).
- Kim, C.-H.; Lee, S.-E.; Kim, K.-S. Analysis of Energy Saving Potential in High-Performance Building Technologies under Korean Climatic Conditions. Energies 2018, 11, 884. [Google Scholar] [CrossRef] [Scilit]
- Li, S.; Jeong, J.-W. Energy Performance of Liquid Desiccant and Evaporative Cooling-Assisted 100% Outdoor Air Systems under Various Climatic Conditions. Energies 2018, 11, 1377. [Google Scholar] [CrossRef] [Scilit]
- Amarilla, R.; Buzarquis, E.; Riveros, E.; Fernández, F.; Blanco, G.; Barán, B. Análisis del sector energético del Paraguay. Balance energético en energía útil 2011. Rev. Soc. Científica Parag. 2018, 23, 147–164. [Google Scholar] [CrossRef] [Scilit]
- Olmedo, M.; Ortigoza, E.; Valdez, D.; Rios, R.; Oxilia, V. Evaluation of long-term energy efficiency measures in transport: Case study Paraguay. In Proceedings of the 2020 IEEE Congreso Bienal de Argentina (ARGENCON), Resistencia, Argentina, 30 October–1 November 2020; IEEE: New York, NY, USA; pp. 1–7. [Google Scholar]
- Silvero, F.; Rodrigues, F.; Montelpare, S. Energy Efficiency Policies to Face Buildings’ Climate Change Effects in Paraguay. Appl. Sci. 2020, 10, 3979. [Google Scholar] [CrossRef] [Scilit]
- Clërk. Guía para la Implementación del Etiquetado de Eficiencia Energética en Acondicionadores de aire en Paraguay y Estudio Comparativo del Sistema de Etiquetado de Eficiencia Energética de Paraguay y Uruguay. 2020. Available online: https://minasyenergia.mopc.gov.py/pdf/eficiencia/proyecto3/Guia%20Etiquetado%20Eficiencia%20Energetica.pdf (accessed on 25 November 2025).
- Toledano, P.; Brauch, M.D.; Sherrill, B.M.; Modi, V.; Hu, Y.; Wu, Y.; Ríos Festner, D.; Oxilia, V.; Llamosas, C.; Oviedo Pascottini, M. Decarbonization Pathways for Paraguay’s Energy Sector. 2021. Available online: https://qsel.columbia.edu/assets/uploads/blog/2021/publications/decarbonization-pathways-for-paraguays-energy-sector.pdf (accessed on 25 November 2025).
- Akerma, M.; Hoang, H.-M.; Leducq, D.; Delahaye, A. Experimental characterization of demand response in a refrigerated cold room. Int. J. Refrig. 2020, 113, 256–265. [Google Scholar] [CrossRef] [Scilit]
- Hirschey, J.; Li, Z.; Gluesenkamp, K.R.; LaClair, T.J.; Graham, S. Demand reduction and energy saving potential of thermal energy storage integrated heat pumps. Int. J. Refrig. 2023, 148, 179–192. [Google Scholar] [CrossRef] [Scilit]
- Hoang, H.M.; Akerma, M.; Mellouli, N.; Montagner, A.L.; Leducq, D.; Delahaye, A. Development of deep learning artificial neural networks models to predict temperature and power demand variation for demand response application in cold storage. Int. J. Refrig. 2021, 131, 857–873. [Google Scholar] [CrossRef] [Scilit]
- Alvi, S.; Mahmood, Z.; Nawaz, S.M.N. Dilemma of direct rebound effect and climate change on residential electricity consumption in Pakistan. Energy Rep. 2018, 4, 323–327. [Google Scholar] [CrossRef] [Scilit]
- Bordon Lesme, M.; Freire-González, J.; Padilla, E. The direct rebound effect for two income groups: The case of Paraguay. Energy Sustain. Dev. 2022, 70, 430–441. [Google Scholar] [CrossRef] [Scilit]
- Davis, L.; Gertler, P.; Jarvis, S.; Wolfram, C. Air conditioning and global inequality. Glob. Environ. Change 2021, 69, 102299. [Google Scholar] [CrossRef] [Scilit]
- Zamanipour, B.; Ghadaksaz, H.; Keppo, I.; Saboohi, Y. Electricity supply and demand dynamics in Iran considering climate change-induced stresses. Energy 2023, 263, 126118. [Google Scholar] [CrossRef] [Scilit]
- Apostu, S.A.; Panait, M.; Balsalobre-Lorente, D.; Ferraz, D.; Rădulescu, I.G. Energy Transition in Non-Euro Countries from Central and Eastern Europe: Evidence from Panel Vector Error Correction Model. Energies 2022, 15, 9118. [Google Scholar] [CrossRef] [Scilit]
- Santos, A.G. Forecasting Residential electricity demand in the Philippines using an Error Correction Model. Philipp. Rev. Econ. 2021, 57, 121–151. [Google Scholar] [CrossRef] [Scilit]
- Temperature Effects on Electricity and Gas Consumption: Empirical Evidence from Mexico and Projections under Future Climate Conditions. Available online: https://www.mdpi.com/2071-1050/13/1/305 (accessed on 28 November 2025).
- Fan, J.-L.; Hu, J.-W.; Zhang, X. Impacts of climate change on electricity demand in China: An empirical estimation based on panel data. Energy 2019, 170, 880–888. [Google Scholar] [CrossRef] [Scilit]
- Lehr, J.; Rehdanz, K. The effect of temperature on energy related CO2 emissions and economic performance in German industry. Energy Econ. 2024, 138, 107818. [Google Scholar] [CrossRef] [Scilit]
- Habib, H. Climate change, macroeconomic sensitivity and the response of remittances to the North African countries: A panel VAR analyse. Int. J. Sustain. Dev. World Ecol. 2022, 29, 401–414. [Google Scholar] [CrossRef] [Scilit]
- Lütkepohl, H. New Introduction to Multiple Time Series Analysis; Springer: Berlin/Heidelberg, Germany, 2005. [Google Scholar] [CrossRef]
- Mayer, L.S. The use of exploratory methods in economic analysis: Analyzing residential energy demand. In Evaluation of Econometric Models; Elsevier: Amsterdam, The Netherlands, 1980; pp. 15–45. [Google Scholar]
- Salsabila, F.; Azhar, Z. Dampak Pertumbuhan Ekonomi terhadap Ketimpangan Pendapatan dan Kemiskinan di Indonesia. ARZUSIN 2023, 3, 465–480. [Google Scholar] [CrossRef] [Scilit]
- Wang, Z.; Safikhani, A.; Zhu, Z.; Matteson, D.S. Regularized estimation in high-dimensional vector auto-regressive models using spatio-temporal information. Stat. Sin. 2023, 33, 1271–1294. [Google Scholar] [CrossRef] [Scilit]
- Ng, V.K. A Conditional Testing Approach for Value-at-Risk Model Performance Evaluation. In Validation of Risk Management Models for Financial Institutions: Theory and Practice; Lynch, D., Hasan, I., Siddique, A., Eds.; Cambridge University Press: Cambridge, UK, 2023; pp. 49–56. [Google Scholar] [CrossRef] [Scilit]
- Guisán, M.C. Econometría; McGraw-Hill Interamericana de España S.L.: Madrid, Spain, 1997; Available online: https://books.google.co.kr/books/about/Econometr%C3%ADa.html?id=-v3LAQAACAAJ&redir_esc=y (accessed on 25 November 2025).
- Ulloa Ibarra, J.T.; Rodriguez Carrillo, J.A. El modelo logístico: Una alternativa para el estudio del crecimiento poblacional de organismos. CONACYT 2010. Available online: https://www.redalyc.org/pdf/636/63613123024.pdf (accessed on 25 November 2025).
- Marathe, R.R.; Ryan, S.M. On the validity of the geometric Brownian motion assumption. Eng. Econ. 2005, 50, 159–192. [Google Scholar] [CrossRef] [Scilit]
- ANDE. Altas Temperaturas Dispararon la Demanda de Potencia y Consumo de Energía Eléctrica en el Sistema Interconectado Nacional; Administración Nacional de Electricidad: Asunción, Paraguay, Comunicado institucional, 2022. Available online: https://www.ande.gov.py/interna.php?id=9488 (accessed on 10 November 2025).

Disclaimer/Publisher’s Note: The statements, opinions and data contained in all publications are solely those of the individual author(s) and contributor(s) and not of MDPI and/or the editor(s). MDPI and/or the editor(s) disclaim responsibility for any injury to people or property resulting from any ideas, methods, instructions or products referred to in the content. |
© 2026 by the authors. Licensee MDPI, Basel, Switzerland. This article is an open access article distributed under the terms and conditions of the Creative Commons Attribution (CC BY) license.