Abstract
The growing depletion of fossil fuel resources and rising energy costs underscore the need for efficient renewable energy technologies, such as unglazed transpired solar collectors (UTSCs). UTSCs harness solar energy to preheat outdoor air, thereby improving building energy efficiency and reducing reliance on conventional heating systems. This study presents a computational fluid dynamics (CFD) analysis of UTSC performance under Lithuanian winter conditions (ambient air temperature −2.64 °C, solar irradiance 733.45 W/m2, wind speed 1.93 m/s) using two- and three-dimensional models developed in ANSYS FLUENT. The 3D model simulates a realistic wall fragment with multiple repeating sheet metal profiles and an air gap, while the 2D model represents a longitudinal section applicable to generic UTSC configurations. Both models were validated against experimental data and used to evaluate airflow velocity, pressure distribution, and air temperature rise. The results indicate overall thermal efficiencies of 54.32% for the 3D model and 54.07% for the 2D model, demonstrating that simplified 2D models can achieve comparable accuracy while significantly reducing computational cost. These findings highlight the potential of high-resolution CFD modelling for optimizing UTSC design and enabling faster, more reliable assessments for integration in industrial and commercial building applications.
1. Introduction
Mitigating carbon emissions in the building sector is essential for addressing climate change and reducing greenhouse gas emissions [1]. Traditional building solutions face sustainability challenges that encompass not only energy efficiency but also economic and social dimensions [2]. Today, this sector is undergoing a profound transformation driven by the integration of renewable energy sources—such as solar, wind, hydro, and biofuels—into building systems [3]. In recent years, the capacity of these technologies has grown rapidly, supported by favourable policies and declining costs of renewables [4].
Solar thermal technologies play a key role in improving building energy performance [5]. Among solar energy solutions, collectors offer significant potential for heating and cooling due to their high availability and ease of use. They are generally classified into five types: unglazed, glazed flat-plate, evacuated tube, large-scale thermal, and concentrating collectors [6]. Each type offers specific advantages and opportunities for efficiency improvements [7]. The unglazed transpired solar collector (UTSC) is a building-integrated solar thermal system featuring a perforated absorber plate exposed to solar radiation [8]. Its core component is a dark-coloured, perforated metal sheet that absorbs solar energy and is typically mounted on the exterior façade of a building [9]. Ambient air is drawn through the perforations by a fan, and as it passes through the heated plate, it absorbs thermal energy, resulting in preheated air [10]. Behind the perforated plate lies a plenum chamber where the warmed air is collected before distribution. The design of this chamber strongly influences overall system efficiency [11].
A key characteristic of UTSCs is their ability to simultaneously provide heat and fresh air, thereby enhancing energy efficiency by minimizing the temperature gradient between the building envelope and the surrounding environment [12]. These collectors are adaptable with multitude of façade designs and enable varied forms [6,13]. In cold regions, the performance of UTSCs is lower than in temperate regions due to increased convective and radiative heat losses from the absorber to the environment [14]. However, this does not prevent the technology from being used in building ventilation [15] or integrated with heat pumps [16], and photovoltaic system [17]. Such a combination of a UTSC and an air-to-air heat pump reduced electricity demand and CO2 emissions by up to 10% [18]. In addition, integrated systems are also possible for the district heating of buildings [19]. The integration of UTSC with phase change materials is also being investigated; however, this approach requires additional long-term studies under realistic operating conditions [20]. Further research is required on UTSCs themselves (including cladding design and heat transfer processes) [21], as well as on their integration with other systems and overall optimization.
Initial research on UTSCs began in the mid-1980s, with early CFD simulations introduced in the late 1990s. Foundational analyses relied on two-dimensional (2D) models with homogeneous suction and laminar flow, often simplifying by restricting the domain to a representative element or omitting crosswind [22,23]. Later studies incorporated wind effects and recommended minimum suction velocities to counteract wind-induced outflow [24]. However, real-world, large-scale UTSCs operate under non-uniform suction with turbulent surroundings [25], which can lead to discrepancies: correlations derived under uniform suction may mispredict wind-related heat loss, thermal efficiency, and effectiveness [26]. Bunea et al. (2015) proposed a mathematical model for unglazed collectors under specific conditions, but noted that improvements are needed for long-term weather modelling [27]. In response, modern studies increasingly adopt three-dimensional (3D) CFD to replicate realistic configurations and dynamic scenarios and to resolve airflow distribution, local recirculation, and plenum-scale non-uniformities more accurately than 2D [28,29].
Recent experimental CFD-based studies investigate how variables such as airflow rate, solar radiation, and absorber plate geometry influence heat recapture and thermal performance. Key findings indicate that optimized airflow significantly reduces wall heat loss, while perforation size and shape directly affect the airflow coefficient and overall efficiency [30]. Elguezabal et al. (2020) developed a CFD model for a 6 m2 active façade system, estimating its efficiency between 0.34 and 0.47, and emphasized the need for deeper understanding of such systems [31]. More recently, Fawaier et al. (2024) analyzed UTSCs under varying environmental conditions, revealing complex thermal responses of the backplate and providing optimization insights [32]. Studies focusing on geometry optimization have shown clear flow gradients from bottom to top, often caused by fan placement at the outlet or blocked inlets [25]. Additional design strategies, such as incorporating guide plates to suppress vortex-induced “dead zones,” have been shown to increase outlet temperatures by 3–5 °C and reduce pressure losses [30]. Furthermore, glazing applied to V-groove corrugated collectors can improve heat collection efficiency by up to 20% compared to standard glazed transpired collectors by balancing convective heat loss with optical gain [33]. Li et al. (2024) demonstrated that wider plenums combined with low suction velocity, low resistance, and low fan power result in inhomogeneous suction flow distribution, which in turn increases buoyancy-driven non-uniformity in the plenum airflow [26,34]. Recent works emphasize perforated absorber plate optimization and airflow uniformity, highlighting the need for advanced CFD approaches to capture multi-scale phenomena [35].
Despite these advancements, most studies have focused on simplified geometries or specific operating conditions, resulting in a lack of high-resolution comparisons between two-dimensional and three-dimensional CFD models under realistic climatic scenarios. Moreover, heat transfer processes in UTSCs are strongly influenced by convective mechanisms, which depend on collector geometry (flat or corrugated). Accurate simulation therefore requires detailed modelling of these convective processes. Predicting thermal efficiency involves understanding the heat exchange between air and the collector plate, where factors such as plate temperature, exit temperature, and perforation effects must be accurately represented [36]. The difference in scale between small perforations on the absorber plate and the overall collector size necessitates high-resolution meshes, increasing computational demands and requiring a balance between accuracy and cost [37]. Although perforated surfaces are not a new technology, there is still a lack of research on thermal and aerodynamic processes in the interaction of UTSCs with buildings using CFD [38]. Considering that these systems combine both small and large elements, it is essential to analyze the potential of two- and three-dimensional models for efficiently assessing and improving system performance and airflow regimes [39]. To address these gaps, this study develops high-resolution two- and three-dimensional models to describe heat transfer in UTSCs and compares their performance to enable faster and more detailed analysis for building heating applications.
2. Methodology
2.1. Main Characteristics of UTSC
The UTSC examined in this study is located at Vilnius Gediminas Technical University (VILNIUS TECH), at coordinates 54.722° N, 25.337° E (see Figure 1). It is installed on the building’s south façade, measuring 6.0 m in width and 16.6 m in height, with a total effective area—excluding sheet piling—of approximately 100 m2.
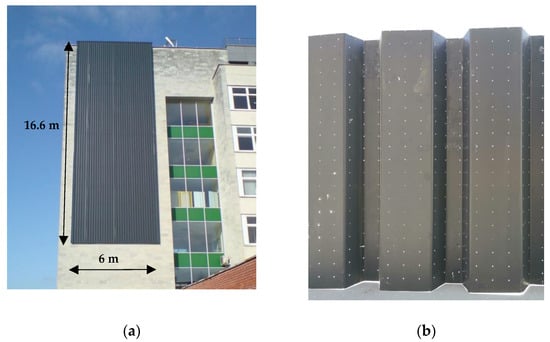
Figure 1.
General view with dimensions (a) and close-up of the UTSC fragment (b).
The collector comprises three separate vertical sections of varying widths (1 m, 2 m, and 3 m), separated by metal partitions. The upper part of the UTSC features a warm-air collection hood with three inlets of different diameters, each corresponding to one section. Heated air is discharged through three ducts of respective diameters: 125 mm from the first section (1 m wide), 160 mm from the second section (2 m wide), and 200 mm from the third section (3 m wide).
The UTSC consists of a trapezoidal, perforated, profiled aluminum sheet approximately 0.6 mm thick, with a thermal conductivity of about 202.4 W·m−1·K−1 and an isobaric specific heat capacity of approximately 880 J·kg−1·K−1. The perforations are circular, about 1.5 mm in diameter, and arranged in a regular rectangular pattern. The horizontal spacing between perforations is approximately 30 mm, while the vertical spacing is about 25 mm.
The sheet is externally coated with a tri-glycidyl isocyanurate powder coating in Basalt Grey (RAL 7012), exhibiting a blackness value of approximately 0.87, a solar absorption coefficient of about 0.862, and a solar reflectance of roughly 0.138. The UTSC is mounted at a distance of approximately 10–15 cm from the building’s brick wall, which is constructed of solid silicate bricks bonded with cement mortar. At the lower part of the collector, this air gap is sealed using elongated metal blinds matching the sheet profile and additionally sealed with polyurethane foam.
2.2. Numerical Model Development and Key Assumptions
Numerical modelling was performed using ANSYS FLUENT 2022 R1 to evaluate the performance of the UTSC. To analyze even the smallest section (1 m wide), geometric simplifications were required; therefore, both 2D and 3D models were developed and their capabilities compared.
To develop the numerical model, the UTSC construction was thoroughly analyzed. The system incorporates numerous small geometric features, such as perforation holes with a diameter of 1.5 mm spaced at intervals of 25–30 mm, drilled into a 0.6 mm thick sheet metal bent in a zigzag pattern with rounded corners of 5 mm bending radius. Considering the overall dimensions of the UTSC, explicitly modelling these fine details would significantly increase the computational cost of the simulation. Therefore, for the 3D UTSC model, only a smaller portion of the collector was analyzed. Specifically, a segment corresponding to two horizontally repeating fragments (167 mm each) and ten vertically repeating fragments (25 mm each) was selected, while maintaining a realistic air gap thickness of approximately 10 cm. The model also included the building wall on which the UTSC was mounted, represented as a 1 cm thick plate to account for its interaction with the collector. Consequently, a fragment of the UTSC measuring 334 × 250 × 122 mm was chosen for the three-dimensional analysis, resulting in a projected absorber area of 0.085 m2.
In the three-dimensional numerical model, the generated mesh consists of elements in a mixed configuration. For complex geometries, such as the absorber sheet and airspace, pyramidal and tetrahedral elements were used, each with four nodes located at the vertices of the tetrahedron. In contrast, simpler geometries, such as the building’s exterior wall, were meshed with prismatic hexahedral elements, each having eight nodes at the vertices. The maximum edge length of the mesh elements was 0.01 m, while the minimum was 0.00023 m. Overall, the finite-volume mesh generated for the 3D model contained 2,431,422 elements (Figure 2).
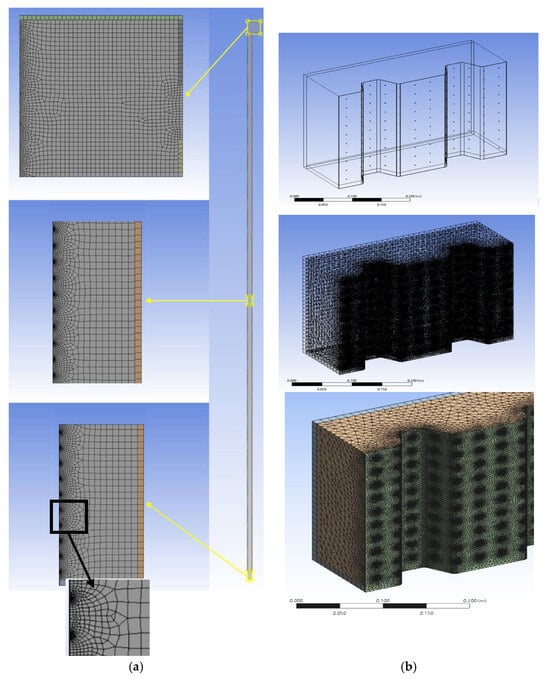
Figure 2.
Numerical models of the UTSC with enlarged details: (a) two- and (b) three-dimensional.
The two-dimensional geometry of the UTSC is defined by a longitudinal section taken along its full height through the air gap. This section passes through the centres of the apertures in one vertical row of perforations and through the centre of an opening in the warm air plenum, as viewed from the left-hand profile of the UTSC. The modelled two-dimensional UTSC geometry measures 375 × 16,600 mm, offering versatility and adaptability to any longitudinal section. To facilitate analysis of the simulation results, the 2D results are presented for three distinct sections of the UTSC air gap:
- (1)
- a 25 cm high section at the inlet,
- (2)
- a section at the mid-height of the air gap, and
- (3)
- a section encompassing the entire enclosure at the top of the collector, near the heated air intake.
The two-dimensional geometry of the full-scale computational model of the UTSC, including the three analyzed sections, is shown in Figure 2. The generated 2D grid consists predominantly of quadrilateral elements with four nodes at each corner. Element edge lengths range from a minimum of 0.0003 m to a maximum of 0.01 m. The finite volume mesh of the entire 2D geometry comprises 164,352 elements. The numerical model assumes steady-state operating conditions to represent the UTSC efficiency over a given period. Realistic boundary conditions are adopted from [36]. Turbulence is modelled using the RNG k-ε approach, which provides improved prediction of separated flows and vortex structures compared to the standard k-ε model [40]. Table 1 summarizes the primary input parameters and boundary conditions applied in the numerical model; their application within the sol–air and external exchange formulations is given by Equations (1)–(5).

Table 1.
Boundary conditions used in CFD simulations [41].
January and February in Lithuania represent the coldest period of the year, with average outdoor air temperatures ranging from −2 °C to −6 °C, and nighttime lows often dropping below −8 °C. Daytime temperatures typically fluctuate between −3 °C and 1 °C, while extreme cold spells can reach −20 °C or lower. Wind speeds during these months generally average around 3 m/s, occasionally increasing under cyclonic conditions [42], which intensifies convective heat losses from exposed surfaces.
2.3. Determination of Other Parameters Used in the Numerical Model
The combined heat transfer coefficient for radiation and convection from the UTSC surface to the building wall, denoted as hi, is determined according to the Lithuanian construction regulation STR 2.01.02:2016 [43]. In this study, the value is taken as hi = 7.69 W/(m2K). To determine he under known wind conditions, the standard LST EN ISO 6946:2017 is applied. In this case, the heat transfer on the external UTSC surface is described by the following equation [44]:
where he is the combined heat transfer coefficient of the external surface due to radiation and convection, W/(m2∙K), hr,e is the coefficient of external surface heat transfer due to radiation, W/(m2∙K), hc,e is the coefficient of heat transfer due to convection, W/(m2∙K).
The radiation heat transfer coefficient is determined by the following equation [44]:
where ε is the emissivity of the outer surface/absorber (ε = 0.87), σ = 5.670 × 10⁻⁸ W/(m2∙K4) is the Stefan–Boltzmann constant, Tave is to the outdoor air temperature, K. For simplicity, the radiation heat transfer was calculated assuming an average view factor for the vertical façade, and angular coefficients were not explicitly considered due to negligible variation in sky exposure.
The convective heat transfer coefficient for the external surface is evaluated according to the following expression:
where vw is the average wind speed, m/s.
Based on the provided equations, the calculated values are: hr,e = 3.91 W/(m2·K), hc,e = 11.72 W/(m2·K), and the overall heat transfer coefficient equals 15.65 W/(m2·K).
To simplify the model, it is assumed that air enters through the absorber’s perforation holes, with the fluid inflow boundary condition applied at these locations based on the known inlet velocity. Using the volumetric airflow rate in a 125 mm duct exiting a 1 m wide UTSC section and the UTSC geometry, the airflow velocity in a perforation hole is calculated as follows:
where —the specific air volume flow rate in the 125 mm duct exiting the 1 m wide UTSC section, in this case 64.08 m3/(h m2) according to [41], Aabs is the absorber area of the UTSC section, 16.6 m2, Aak is the absorber perforation hole cross-sectional area, (m2), nak is the number of perforation meshes in the absorber of the 1 m wide UTSC section considered, ).
A sol-air temperature boundary condition is applied to the surface of the UTSC absorber, which jointly evaluates the boundary conditions of outdoor air temperature, solar radiation and convection. Sol-air temperature is utilized within dynamic thermal modelling frameworks to capture the transient thermal behaviour of building elements under variable environmental conditions. This methodological approach facilitates accurate prediction of heat flux and temperature distribution across diverse building components [45].
The temperature is determined according to the following equation [46]:
where ts−a is the sol-air temperature, °C; te is the outdoor air temperature, °C; f is the absorptivity of the UTSC surface, ; qsj is the total solar radiation incident on surface, W/m2; he is the combined heat transfer coefficient due to radiation and convection, W/(m2∙K) [47]; d is the solar transmittance of the outer surface of the cladding, where, in this case, the absorber is completely opaque and therefore d = 0; r is the coefficient of reflectivity of solar radiation from the outer surface of the cladding, r = 0.138 [48]; ε is the thermal emittance of the outer surface coating, ε = 0.87 [48]; and Δq is the difference in flux densities between the direct longwave radiation to the surface from the sky and surrounding objects and the radiation emitted by an absolute black body at the outdoor air temperature, W/m.
In the sol–air temperature formulation (Equation (5), the longwave term can be expressed with view factors to the sky, ground and surrounding surfaces. In this study, a vertical façade with unobstructed exposure was assumed, and constant sky exposure was used; therefore, angular radiation coefficients (view factors) were not explicitly included and their effect was absorbed into the simplified term and the combined external coefficient .
parameter is determined by the following equation:
where qs is the flux density of direct longwave radiation to the surface from the sky and surrounding objects, W/m2, and q0 is the flux density of radiation emitted by an ideal black body at the outside air temperature, W/m2.
The overall heat transfer efficiency is determined based on the simulated UTSC performance:
where is the volumetric air flow rate, m3/h, is the isobaric air specific heat capacity, kJ/(kgK), is the temperature of the inlet and outlet air, °C, is the air density, kg/m3, is the total solar radiation incident on surface, W/m2, is the absorber area, m2.
The schematic representation of the research methodology is presented in Figure 3.
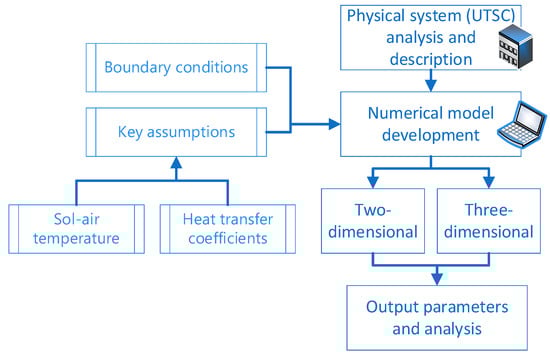
Figure 3.
Workflow of the numerical investigation.
Two- and three-dimensional UTSC models were developed under realistic boundary conditions, including air temperature, solar radiation, and wind speed. To reduce computational complexity, the perforation geometry was simplified. Both models enable comprehensive analysis of airflow patterns, temperature distribution, and pressure variations within the collector’s air gap and plenum region, providing insights into heat transfer mechanisms and overall system efficiency.
3. Results and Discussion
3.1. Two-Dimensional Model Results
The two-dimensional UTSC model represents its longitudinal section along the full height of the air gap. For visualization, three typical cases are considered: the bottom, middle, and top regions of the collector. Figure 3 illustrates the distribution of air temperature and velocity within the gap.
As shown in Figure 4, the air temperature within the UTSC gap increases relatively uniformly from the bottom to the top. Cooler zones are observed near the absorber, caused by streams of cold outdoor air drawn through perforation holes distributed evenly along the entire height of the collector. As a result, each successive stream of outdoor air slightly cools the already warmed air from the lower openings. Nevertheless, these localized heat losses are largely compensated as the air continues to flow upward through the gap. The lowest air temperature was simulated at the inlet openings (−2.64 °C), while a comparatively low temperature of 0.33 °C was observed in the lower part of the gap near the absorber. Even in the warm air collection plenum—at its lower section—a temperature of 6.30 °C was recorded. In contrast, the highest air temperature was observed in the middle part of the UTSC, adjacent to the inner surface of the absorber, reaching 31.65 °C. A comparatively high temperature of 22.15 °C was also obtained in the plenum near the absorber surface.
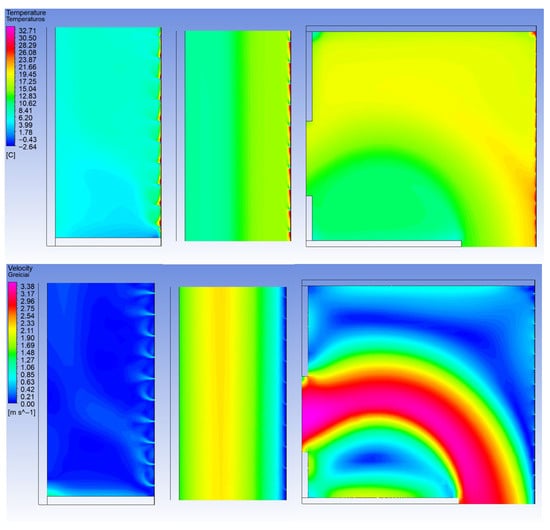
Figure 4.
Air temperature (above), velocity (below) distributions in the two-dimensional UTSC model.
The airflow velocity within the solar wall increases progressively and relatively uniformly from the bottom to the top. In the analyzed air gap, the volumetric airflow rate at each successive vertical row of perforation holes is augmented by additional portions of outdoor air drawn through these openings, resulting in a steady increase in overall flow. Since the cross-sectional area of the air gap remains constant along the entire height of the collector, the airflow velocity follows the same trend as the volumetric flow rate, increasing uniformly upward. Due to the high-pressure zone caused by a strong vortex near the inner surface of the absorber in the upper part of the UTSC, a slight leakage of heated air back to the outdoors was observed from the last 16 rows of upper horizontal perforation holes, indicating the need to optimize the plenum design. The airflow velocity at the inlet openings was 0.327 m/s, while the maximum velocity was recorded at the warm air outlet in the upper part of the UTSC, reaching approximately 3.47 m/s. In contrast, the lowest airflow velocity was found in the lower part of the UTSC, adjacent to the inner surface of the absorber, approaching 0 m/s.
Figure 5 presents the pressure variation within the UTSC as a whole and across different sections.
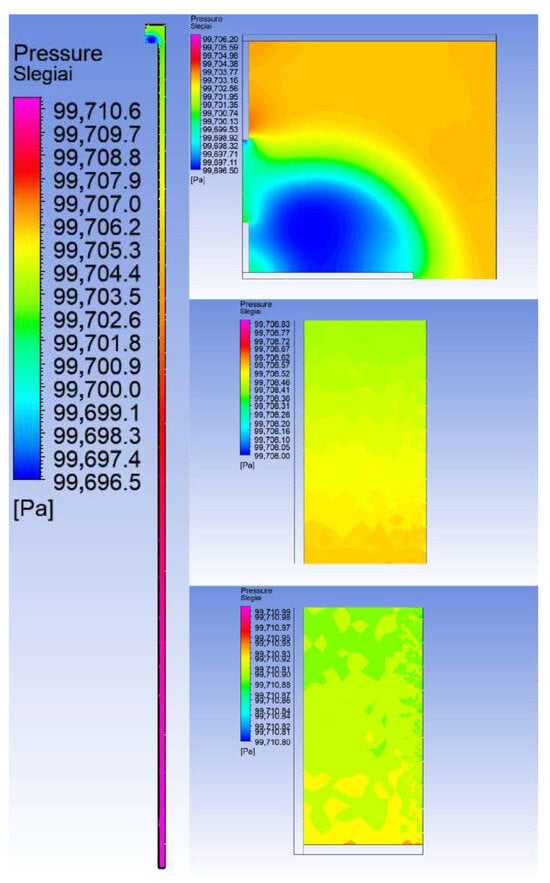
Figure 5.
Pressure distributions in the two-dimensional UTSC model.
The pressure in the analyzed fragment changes only slightly, ranging from 99,696.5 Pa to 99,711.0 Pa, corresponding to a total difference of approximately 14.5 Pa. Overall, the air pressure decreases relatively uniformly from the bottom to the top. The highest pressure was recorded in the lower part of the UTSC, near the bottom cover, while a comparatively high pressure was also observed in the upper section of the plenum, immediately above the outlet opening, within the zone of an intense vortex—99,703.8 Pa. This vortex is responsible for the previously noted leakage of heated air through the last rows of upper perforation holes back to the outdoors. Conversely, the lowest pressure was found in the upper part of the UTSC, in the lower section of the plenum, below the outlet opening, within another vortex zone—99,696.5 Pa. A similarly low pressure was recorded at the outlet opening itself, in its upper section—99,697.2 Pa—due to the rarefaction of air caused by the vacuum suction effect generated by the system fan, which drives airflow through the UTSC gap.
To evaluate specific temperatures at different sections of the UTSC, measurement points were selected at equal intervals of 75 cm, arranged horizontally at various heights. These points were positioned so that each horizontal row coincided with the centre of the perforation holes. In total, 23 rows were defined, as illustrated in Figure 6. Part (b) of this figure presents the airflow velocity, the average temperature for each row, and the corresponding temperature increment (t–tambient).

Figure 6.
Two-dimensional model points (a) and their temperature, temperature increment, and air velocity (b).
Meanwhile, the temperature of the inflowing air—and thus its difference from the outdoor air—steadily increases. The average air temperature in the first row of points is 3.42 °C, which is already 6.06 °C higher than the outdoor air temperature. By the last row of points (the outlet), the air has warmed to 15.35 °C, representing an additional increase of 11.93 °C relative to the temperature at the lowest point of the air gap.
Figure 6 shows that the last row of selected points exhibits a slightly lower air temperature compared to the penultimate row, as the air in the UTSC plenum undergoes minor cooling due to heat loss. The total temperature increase from the outdoor air to the outlet is 17.99 °C. Previous experimental studies of this UTSC, reported in [41], showed a temperature increase of 18.01 °C, indicating that the numerical model is close to the experimental data. At the same time, the air velocity within the gap initially fluctuates but begins to increase steadily from the third row of points onward, once a certain airflow rate is reached and a consistent upward flow is established. The average air velocity in the first row is 0.571 m/s. In the second row, the average velocity decreases to 0.303 m/s, which is lower than in the first row. At the outlet (final row of points), the average air velocity reaches its maximum value of 2.960 m/s.
3.2. Three-Dimensional Model Results
For the 3D model, numerical results are illustrated on three reference planes—one vertical and two horizontals—as follows:
- A vertical plane (YZ) intersecting the centres of a selected row of vertical perforation holes;
- A horizontal plane (XY) passing through the centres of the holes in the first row of horizontal perforations;
- A horizontal plane (XY) passing through the centres of the holes in the last row of horizontal perforations.
These planes were selected to capture the most representative flow and thermal characteristics within the UTSC fragment. The vertical plane allows observation of airflow and temperature gradients along the height of the absorber, while the two horizontal planes provide insight into local variations, where heat transfer and pressure changes are most significant.
The distribution of air temperature, velocity, and pressure obtained from the 3D model for a selected fragment of the UTSC is presented in Figure 7, clearly illustrating the suction of cold outdoor air through the perforation holes.
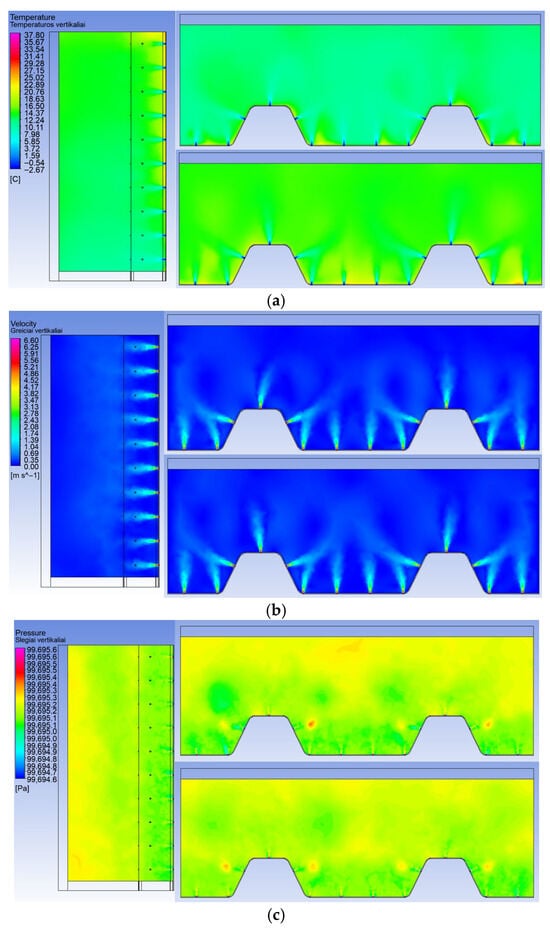
Figure 7.
Three-dimensional UTSC model results: temperature (a), velocity (b) and pressure (c) distributions.
A progressive increase in air temperature due to convective heat transfer is observed as the airflow moves upward. Similar to the 2D case, the temperature distribution is not entirely uniform because outdoor air is drawn through all perforation holes rather than exclusively from the bottom, which cools the already preheated air entering from lower openings. The lowest temperature of the incoming air was recorded at the inlet openings (−2.64 °C), while a comparatively low temperature of 10.35 °C was observed in the lower part of the analyzed solar wall fragment. In contrast, the highest temperature, 21.40 °C, was obtained near the inner surface of the absorber.
From Figure 7b, the numerical analysis reveals how air velocity varies within the model, which fundamentally influences the previously discussed temperature distribution. The airflow velocity within the UTSC fragment increases progressively from the bottom toward the top, following the same trend observed in the 2D model. The highest air velocity was recorded at the inlet openings, reaching 6.00 m/s, while the lowest velocity occurred in the lower part of the analyzed fragment near the inner surface of the absorber, approaching 0 m/s. Additionally, a relatively low velocity of approximately 0.05 m/s was observed between the inlet openings, at the midpoint between them, close to the inner surface of the absorber.
The air pressure throughout the 3D UTSC fragment varies only slightly, ranging from 99,692.2 to 99,705.5 Pa, corresponding to an overall difference of approximately 13.3 Pa. As shown in Figure 7c, the pressure initially increases when moving horizontally from the inlet openings in the absorber toward the building’s exterior wall, then decreases slightly, and rises again near the wall. This behaviour occurs because the air entering through the small inlet openings—significantly smaller compared to the entire absorber area—experiences compression, resulting in a local pressure increase. After passing through the perforation holes, the air expands due to the throttling effect, causing a slight pressure drop. Furthermore, some high-velocity air streams from the inlet openings reach the building’s exterior wall and rebound, creating localized overpressure zones. Similar small overpressure regions are also observed near the absorber, at collision points of outdoor air streams entering through perforation holes arranged on different planes due to the corrugated profile. The highest pressure was recorded near the edges of the inlet openings (99,705.5 Pa), while relatively high values were also observed adjacent to the building’s exterior wall (99,695.3 Pa) and at collision points of air streams from perforation holes on different planes (99,695.4 Pa). In contrast, the lowest pressure occurred around the inlet openings and near the inner surface of the absorber (99,692.2 Pa).
Near the outlet, the confluence of higher bulk momentum and the abrupt change in geometry at the plenum cover produces a pressure overshoot and a recirculation bubble. The 3D pressure maps show a closed streamline region whose core sits just beneath the upper plenum cover; this vortex explains the observed reverse leakage through the top perforation rows and the small efficiency penalty at the outlet. The 2D model reproduces the net pressure drop and outlet acceleration, but only the 3D resolution reveals the topology of the vortex and its preferential leakage path.
Based on the parameters numerically determined through CFD, the overall heat transfer efficiency of the UTSC was calculated. The efficiency of any energy-converting system is defined as the ratio between the usefully utilized energy and the total energy supplied to the system. In the present case, the useful energy is the heat flow extracted by the heated air from the absorber and carried away through the outlet, beyond the boundaries of the analyzed 1 m wide section of the UTSC. Meanwhile, the total energy supplied to the system is the overall heat flux received by the collector, delivered by solar radiation onto the absorber surface. Therefore, the overall heat transfer efficiency of the collector is the ratio of these two heat fluxes and is calculated according to Equation (7).
In the three-dimensional model, the predicted outlet air temperature across the entire UTSC was 15.93 °C, compared to an outdoor air temperature of −2.64 °C. For an airflow rate of 5.34 m3/h through a 3D fragment with an absorber area of 0.085 m2, the calculated thermal efficiency was 54.3%. In the two-dimensional model, with a volumetric airflow of 1065.75 m3/h through the analyzed 1 m-wide UTSC section, an outlet temperature of 15.35 °C and an inlet temperature of −2.64 °C yielded an overall efficiency of 54.07%. Under identical conditions, the experimentally measured efficiency was 53.43%, corresponding to a discrepancy of 1.2% between the numerical and experimental results [41]. The 2D model reproduced the integrated temperature rise (ΔT) with a difference of only 0.02 °C (0.11%) and the overall thermal efficiency within 0.64 percentage points of the experiment. The 3D fragment predicted slightly higher ΔT and η values, which are consistent with localized recirculation and vortex structures near perforations and the upper plenum. These results confirm the reliability of both CFD approaches: the 2D model is suitable for system-level performance estimation at low computational cost, while the 3D model provides essential insight into local aerodynamic and thermal phenomena that cannot be captured by a simplified 2D approach.
The three-dimensional analysis revealed turbulence patterns near perforations, pressure vortices, and collision points of air streams induced by the corrugated absorber profile. These effects lead to non-uniform temperature fields and localized heat losses, highlighting the need for plenum design improvements to minimize energy losses and optimize airflow distribution. Therefore, while the 2D model is adequate for large-scale performance prediction, the 3D model remains indispensable for detailed design optimization and accurate representation of local flow behaviour in real UTSC systems.
4. Conclusions
A high-resolution two- and three-dimensional numerical models of an unglazed transpired solar collector (UTSC) were developed to investigate heat transfer and aerodynamic behaviour under steady-state conditions. The two-dimensional model, representing the full height of the air gap, enabled analysis of temperature, velocity, and pressure distributions, revealing a consistent temperature rise from bottom to top with a total increase of 17.99 °C, closely matching experimental data (18.01 °C). The three-dimensional model provided detailed insight into local flow phenomena, particularly near perforation holes and the absorber surface, where the highest air velocity (6.00 m/s) was observed.
The overall thermal efficiency was estimated at 54.07% for the 2D model and 54.3% for the 3D model, in close agreement with experimental measurements (53.43%). Numerical results also identified a high-pressure vortex at the top of the collector, causing reverse airflow and heat loss through upper perforation rows. These findings indicate the need for plenum design optimization to minimize energy losses and enhance system performance.
Both modelling approaches proved effective for UTSC analysis: the 2D model offers computational efficiency for large-scale studies, while the 3D model captures localized effects critical for design refinement. The 3D model is indispensable for detailed design refinement, as it reveals localized aerodynamic and thermal effects that simplified 2D models cannot resolve. Future research should focus on parametric optimization, transient simulations, and integration with hybrid heating systems to further improve energy efficiency and support the development of advanced building-integrated solar technologies.
Author Contributions
Conceptualization, G.S.; methodology, M.P. and G.S.; software, M.P.; validation, M.P.; formal analysis, M.P.; investigation, G.S.; resources, G.S.; data curation, G.S.; writing—original draft preparation, M.P.; writing—review and editing, G.S.; visualization, M.P.; supervision, G.S.; project administration, G.S.; funding acquisition, G.S. All authors have read and agreed to the published version of the manuscript.
Funding
This Research was co-funded by the European Union within the framework of the Programme for the Environment and Climate Action, LIFE Clean Energy Transition sub-programme. Project: Supporting Energy Transition and Decarbonisation in District Heating Sector, acronym LIFE22-CET-SET_HEAT, project number 101119793. Project website: https://setheat.polsl.pl.
Data Availability Statement
The original contributions presented in this study are included in the article. Further inquiries can be directed to the corresponding author.
Conflicts of Interest
The authors declare no conflicts of interest.
References
- Reddy, V.J.; Hariram, N.P.; Ghazali, M.F.; Kumarasamy, S. Pathway to Sustainability: An Overview of Renewable Energy Integration in Building Systems. Sustainability 2024, 16, 638. [Google Scholar] [CrossRef]
- Lapinskiene, V.; Motuziene, V. Integrated Building Design Technology Based on Quality Function Deployment and Axiomatic Design Methods: A Case Study. Sustain. Cities Soc. 2021, 65, 102631. [Google Scholar] [CrossRef]
- Michaelides, E.E. Energy Efficiency and the Transition to Renewables—Building Communities of the Future. Energies 2025, 18, 1778. [Google Scholar] [CrossRef]
- International Energy Agency Renewables 2024. Analysis and Forecast to 2030. Available online: https://iea.blob.core.windows.net/assets/17033b62-07a5-4144-8dd0-651cdb6caa24/Renewables2024.pdf (accessed on 5 April 2025).
- Vahidinasab, V.; Ardalan, C.; Mohammadi-Ivatloo, B.; Giaouris, D.; Walker, S.L. Active Building as an Energy System: Concept, Challenges, and Outlook. IEEE Access 2021, 9, 58009–58024. [Google Scholar] [CrossRef]
- O’Hegarty, R.; Kinnane, O.; McCormack, S.J. Review and Analysis of Solar Thermal Facades. Sol. Energy 2016, 135, 408–422. [Google Scholar] [CrossRef]
- Sood, T.; Lee, D.; Kumar, R.; Ümit, A. A Detailed Review of Evacuated Tube Solar Collectors for Sustainable Energy, Current Trends and Future Prospects. Sol. Energy 2026, 303, 114054. [Google Scholar] [CrossRef]
- Parimita Panigrahi, S.; Kumar Maharana, S.; Rajashekaraiah, T.; Gopalashetty, R.; Sharifpur, M.; Ahmadi, M.H.; Saleel, C.A.; Abbas, M. Flat Unglazed Transpired Solar Collector: Performance Probability Prediction Approach Using Monte Carlo Simulation Technique. Energies 2022, 15, 8843. [Google Scholar] [CrossRef]
- Collins, M.R.; Abulkhair, H. An Evaluation of Heat Transfer and Effectiveness for Unglazed Transpired Solar Air Heaters. Sol. Energy 2014, 99, 231–245. [Google Scholar] [CrossRef]
- Croitoru, C.V.; Nastase, I.; Bode, F.I.; Meslem, A. Thermodynamic Investigation on an Innovative Unglazed Transpired Solar Collector. Sol. Energy 2016, 131, 21–29. [Google Scholar] [CrossRef]
- Rad, H.M.; Ameri, M. Energy and Exergy Study of Unglazed Transpired Collector-2stage. Sol. Energy 2016, 132, 570–586. [Google Scholar] [CrossRef]
- Eryener, D.; Akhan, H. The Performance of First Transpired Solar Collector Installation in Turkey. Energy Procedia 2016, 91, 442–449. [Google Scholar] [CrossRef]
- Hollick, J.C. Unglazed Solar Wall Air Heaters. Renew. Energy 1994, 5, 415–421. [Google Scholar] [CrossRef]
- Zheng, W.; Li, B.; Zhang, H.; You, S.; Li, Y.; Ye, T. Thermal Characteristics of a Glazed Transpired Solar Collector with Perforating Corrugated Plate in Cold Regions. Energy 2016, 109, 781–790. [Google Scholar] [CrossRef]
- Misevičiūtė, V.; Rudzinskas, L. Simulation of Ventilation System with Unglazed Solar Collector and Air Heat Pump. In Proceedings of the 9th International Conference “Environmental Engineering”, Vilnius, Lithuania, 22–23 May 2014; p. 9. [Google Scholar]
- Januševičius, K.; Streckiene, G.; Bielskus, J.; Martinaitis, V. Validation of Unglazed Transpired Solar Collector Assisted Air Source Heat Pump Simulation Model. Energy Procedia 2016, 95, 167–174. [Google Scholar] [CrossRef]
- Athienitis, A.K.; Bambara, J.; O’Neill, B.; Faille, J. A Prototype Photovoltaic/Thermal System Integrated with Transpired Collector. Sol. Energy 2011, 85, 139–153. [Google Scholar] [CrossRef]
- Safijahanshahi, E.; Salmanzadeh, M. Performance Simulation of Combined Heat Pump with Unglazed Transpired Solar Collector. Sol. Energy 2019, 180, 575–593. [Google Scholar] [CrossRef]
- Saini, P.; Paolo, B.; Fiedler, F.; Widén, J.; Zhang, X. Techno-Economic Analysis of an Exhaust Air Heat Pump System Assisted by Unglazed Transpired Solar Collectors in a Swedish Residential Cluster. Sol. Energy 2021, 224, 966–983. [Google Scholar] [CrossRef]
- Bejan, A.S.; Teodosiu, C.; Croitoru, C.V.; Catalina, T.; Nastase, I. Experimental Investigation of Transpired Solar Collectors with/without Phase Change Materials. Sol. Energy 2021, 214, 478–490. [Google Scholar] [CrossRef]
- Croitoru, C.; Nastase, I.; Voicu, I.; Meslem, A.; Sandu, M. Thermal Evaluation of an Innovative Type of Unglazed Solar Collector for Air Preheating. Energy Procedia 2016, 85, 149–155. [Google Scholar] [CrossRef]
- Kutscher, C.F.; Christensen, C.B.; Barker, G.M. Unglazed Transpired Solar Collectors: Heat Loss Theory. J. Sol. Energy Eng. 1993, 115, 182–1888. [Google Scholar] [CrossRef]
- Arulanandam, S.J.; Hollands, K.G.T.; Brundrett, E. A CFD Heat Transfer Analysis of the Transpired Solar Collector under No-Wind Conditions. Sol. Energy 1999, 67, 93–100. [Google Scholar] [CrossRef]
- Gunnewiek, L.H.; Hollands, K.G.T.; Brundrett, E. Effect of Wind on Flow Distribution in Unglazed Transpired-Plate Collectors. Sol. Energy 2002, 72, 317–325. [Google Scholar] [CrossRef]
- Tajdaran, S.; Kendrick, C.; Hopkins, E.; Bonatesta, F. Geometrical Optimisation of Transpired Solar Collectors Using Design of Experiments and Computational Fluid Dynamics. Sol. Energy 2020, 197, 527–537. [Google Scholar] [CrossRef]
- Li, S.; Gong, X.; Lin, W.; Sun, Y.; Ma, Z. Review of Transpired Solar Collectors: Heat and Mass Transfer Mechanisms and Enhancement, System Integration, and Performance Assessment and Optimisation. J. Clean. Prod. 2024, 450, 141967. [Google Scholar] [CrossRef]
- Bunea, M.; Perers, B.; Eicher, S.; Hildbrand, C.; Bony, J.; Citherlet, S. Mathematical Modelling of Unglazed Solar Collectors under Extreme Operating Conditions. Sol. Energy 2015, 118, 547–561. [Google Scholar] [CrossRef]
- Fawaier, M.; Shaban, N.A.; Bokor, B. Heat Transfer Investigation for Wall Heat Loss Recapture in Transpired Solar Collectors. Energy Convers. Manag. X 2024, 22, 100540. [Google Scholar] [CrossRef]
- Baghdadi, F.; Hrairi, M.; Asraar, W. A Numerical Comparison of 2D and 3D CFD Modelling for Contraction and Expansion Geometries with an Emphasis on Solid Particles Erosion. CFD Lett. 2024, 6, 157–168. [Google Scholar] [CrossRef]
- Jia, B.; Song, Z.; Li, X.; Hu, Z.; Li, Q. Case Studies in Thermal Engineering Enhancing Thermal Performance: The Evolution and Future of Solar Air Heaters with Baffles. Case Stud. Therm. Eng. 2025, 75, 107163. [Google Scholar] [CrossRef]
- Elguezabal, P.; Lopez, A.; Blanco, J.M.; Chica, J.A. CFD Model-Based Analysis and Experimental Assessment of Key Design Parameters for an Integrated Unglazed Metallic Thermal Collector Façade. Renew. Energy 2020, 146, 1766–1780. [Google Scholar] [CrossRef]
- Fawaier, M.; Róbert, G.; Bokor, B. Simulation Study of Dynamic Building Insulation with Transpired Solar Collectors. Energy Rep. 2024, 12, 1325–1343. [Google Scholar] [CrossRef]
- Li, S.; Lin, W.; Gong, X.; Sun, Y.; Ma, Z. Corrugated Transpired Solar Collectors: Mathematical Modeling, Experimental Investigation, and Performance Analysis. Sol. Energy 2023, 262, 111839. [Google Scholar] [CrossRef]
- Tajdaran, S.; Bonatesta, F.; Ogden, R.; Kendrick, C. CFD Modeling of Transpired Solar Collectors and Characterisation of Multi-Scale Airflow and Heat Transfer Mechanisms. Sol. Energy 2016, 131, 149–164. [Google Scholar] [CrossRef]
- Boussouar, G.; Rostane, B.; Aliane, K.; Ravi, D.; Gola, A. Study of the Thermal Performance of Solar Air Collectors with and without Perforated Baffles. Energies 2024, 17, 3812. [Google Scholar] [CrossRef]
- Li, S.; Karava, P.; Savory, E.; Lin, W.E. Airflow and Thermal Analysis of Flat and Corrugated Unglazed Transpired Solar Collectors. Sol. Energy 2013, 91, 297–315. [Google Scholar] [CrossRef]
- Berville, C.; Tetang Fokone, A.; Sima, C.I.; Croitoru, C.V. Mesh Independency Study for an Unglazed Transpired Solar Collector. IOP Conf. Ser. Earth Environ. Sci. 2021, 664, 012059. [Google Scholar] [CrossRef]
- Fawaier, M.; Bokor, B.; Horváth, M. Wall Heat Loss Recapture Evaluation of Transpired Solar Collectors for Different Climates: A European Case Study. Case Stud. Therm. Eng. 2021, 24, 100836. [Google Scholar] [CrossRef]
- Streckienė, G.; Piskulov, M. Performance Simulation of an Unglazed Transpired Solar Collector: Two-Dimensional and Three-Dimensional Analysis. In Proceedings of the 18th Conference on Sustainable Development of Energy, Water and Environment Systems (SDEWES), 1–5 October 2025; p. 97. [Google Scholar]
- ANSYS RNG K-ε Model. Available online: https://ansyshelp.ansys.com/public/account/secured?returnurl=////////Views/Secured/corp/v242/en/flu_th/flu_th_sec_turb_rng.html (accessed on 29 December 2025).
- Rimdžius, D. Neįstiklinto Orinio Saulės Kolektoriaus Charakteristikų Tyrimas Realiomis Sąlygomis/Performance Investigation of Unglazed Solar Air Collector Under Real Conditions; Vilnius Gediminas Technical University: Vilnius, Lithuania, 2016. [Google Scholar]
- World Weather & Climate Information Weather in January in Lithuania. Available online: https://weather-and-climate.com/averages-Lithuania-January (accessed on 8 January 2026).
- STR 2.01.02:2016; Design and Certification of Energy Performance of Buildings (in Lithuanian). Minister for the Environment of the Republic of Lithuania: Vilnius, Lithuania, 2016; p. 279.
- LST EN ISO 6946:2017; Building Components and Building Elements—Thermal Resistance and Thermal Transmittance—Calculation Methods. Lithuanian Standards Board: Vilnius, Lithuania, 2017.
- Georgiou, L.; Kylili, A.; Fokaides, P.A. Numerical Data on Heat Flux of a Novel Controlled-Temperature Double Skin Façade. Data Brief 2021, 36, 107034. [Google Scholar] [CrossRef]
- ASHRAE. ASHRAE Handbook—Fundamentals; ASHRAE: Peachtree Corners, GA, USA, 2021. [Google Scholar]
- CIBSE. CIBSE Guide A: Environmental Design; CIBSE: London, UK, 2015. [Google Scholar]
- Kalzip Solar Reflectance, Thermal Emittance and Solar Reflectance Index (SRI). Available online: https://www.kalzip.com/wp-content/uploads/2020/01/Kalzip-Solar-Reflectance-Index.pdf (accessed on 10 September 2025).
Disclaimer/Publisher’s Note: The statements, opinions and data contained in all publications are solely those of the individual author(s) and contributor(s) and not of MDPI and/or the editor(s). MDPI and/or the editor(s) disclaim responsibility for any injury to people or property resulting from any ideas, methods, instructions or products referred to in the content. |
© 2026 by the authors. Licensee MDPI, Basel, Switzerland. This article is an open access article distributed under the terms and conditions of the Creative Commons Attribution (CC BY) license.