


Abstract
Accurate calculation of the soiling loss ratio (SLR) is essential for photovoltaic power prediction and cleaning optimization. While theoretical power-based methods perform reliably under stable, clear-sky conditions, their accuracy in fluctuating, cloudy weather remains uncertain. This study evaluates the impact of cloudy conditions on SLR calculation through a 20-day comparative experiment using a 10 kW PV system. The power difference between cleaned and soiled arrays defined the benchmark soiling loss ratio (SLRbm), against which theoretical power-derived soiling loss ratio (SLRtpd) was compared. Results show strong agreement between SLRtpd and SLRbm under sunny days but significant fluctuations (mean daily dispersion ratio: 17.8) and frequent anomalous negative values under cloudy conditions. These findings indicate that rapid irradiance changes and MPPT lag in cloudy weather amplify inherent model errors, highlighting the need for revised models adapted to complex meteorological conditions.
1. Introduction
Dust accumulation on photovoltaic (PV) panel surfaces impedes the reception of solar radiation, thereby reducing the output power of PV modules [1,2,3]. In areas with severe soiling, dust shading can lead to localized overheating, accelerating cell aging and even causing damage, which compromises the safe operation of power stations [4,5,6,7]. Studies have shown that power generation losses due to soiling can exceed 50% [8], posing a significant challenge to the accuracy of PV output prediction. Therefore, accurately estimating the degree of PV soiling is essential for ensuring the economic viability and safety of PV plants [9,10].
Numerous researchers have investigated PV soiling assessment. The image recognition method utilizes computer vision to analyze dust distribution, employing visible or infrared images to identify PV modules with different soiling levels. For instance, Zhang et al. proposed a SolarQRNN model that estimates dust density based on image grayscale changes, achieving an accuracy of ±1.67 g/m2 [11]. Tommaso et al. proposed a multi-stage model based on YOLOv3, using UAV-captured infrared and visible images for PV panel defect detection, featuring multi-defect recognition, maintenance suggestion generation, and cross-scenario applicability [12]. Hossain et al. proposed a machine learning-based (specifically, Artificial Neural Networks) dust detection method combined with an automatic water-sprinkling cleaning system, which effectively restored PV panel efficiency to 14.87% [13]. While image-based methods can intuitively and clearly visualize the soiling degree with high accuracy and precision, they possess a key limitation: their effectiveness is heavily dependent on ambient light conditions. Image quality is directly determined by solar irradiance intensity, spectral distribution, and angle of incidence, making clear, cloudless weather a prerequisite for obtaining valid inspection data.
Data-driven methods calculate the soiling loss ratio (SLR) by comparing the output power or current–voltage data of PV modules against data from their clean state. For example, Ankit Pal et al. proposed a data-driven approach for estimating the soiling ratio (SR) and optimizing cleaning strategies for a 504 kW rooftop PV system in India [14]. The study utilized power, temperature, and irradiance data, simplifying the process by estimating PV panel temperature through a model, thus eliminating the need for direct temperature measurement. Deceglie et al. proposed and validated a method named Stochastic Rate and Recovery (SRR), which quantifies soiling loss directly from PV yield data without relying on precipitation data or additional dedicated soiling sensors [15].
Data-driven methods, primarily using performance ratio (PR) and power output analysis, are among the common approaches for calculating surface soiling. PR is used to derive the SLR from the ratio of actual generated power to theoretical generated power. Some studies indicate that this method achieves relatively high accuracy under clear skies but suffers from reduced accuracy under cloudy conditions. For instance, Pramod Nepal’s model proposed a precise method for determining the SR of photovoltaic modules based on the incident angle modifier (IAM). This model performs well on sunny days with high and moderate irradiance, but the deviation increases in cloudy weather with low irradiance due to the dominance of diffuse light [16]. J. Agbogla et al. also indicates that PR calculation heavily relies on accurate and stable irradiance data. The intense fluctuations and difficulty in precise measurement of irradiance under cloudy weather can directly lead to distorted PR calculation results, rendering them ineffective for accurately isolating the soiling loss [17].
Based on this, this study considers weather conditions—specifically distinguishing between clear days with stable irradiance and cloudy days characterized by rapid irradiance fluctuations—as a key variable. By analyzing the fluctuation characteristics (including stability and dispersion) of SLR under these varying conditions, this work aims to evaluate the actual impact of cloudy weather on existing theoretical power-derived calculation methods and to analyze the underlying mechanisms of the observed errors.
2. Experimental Equipment
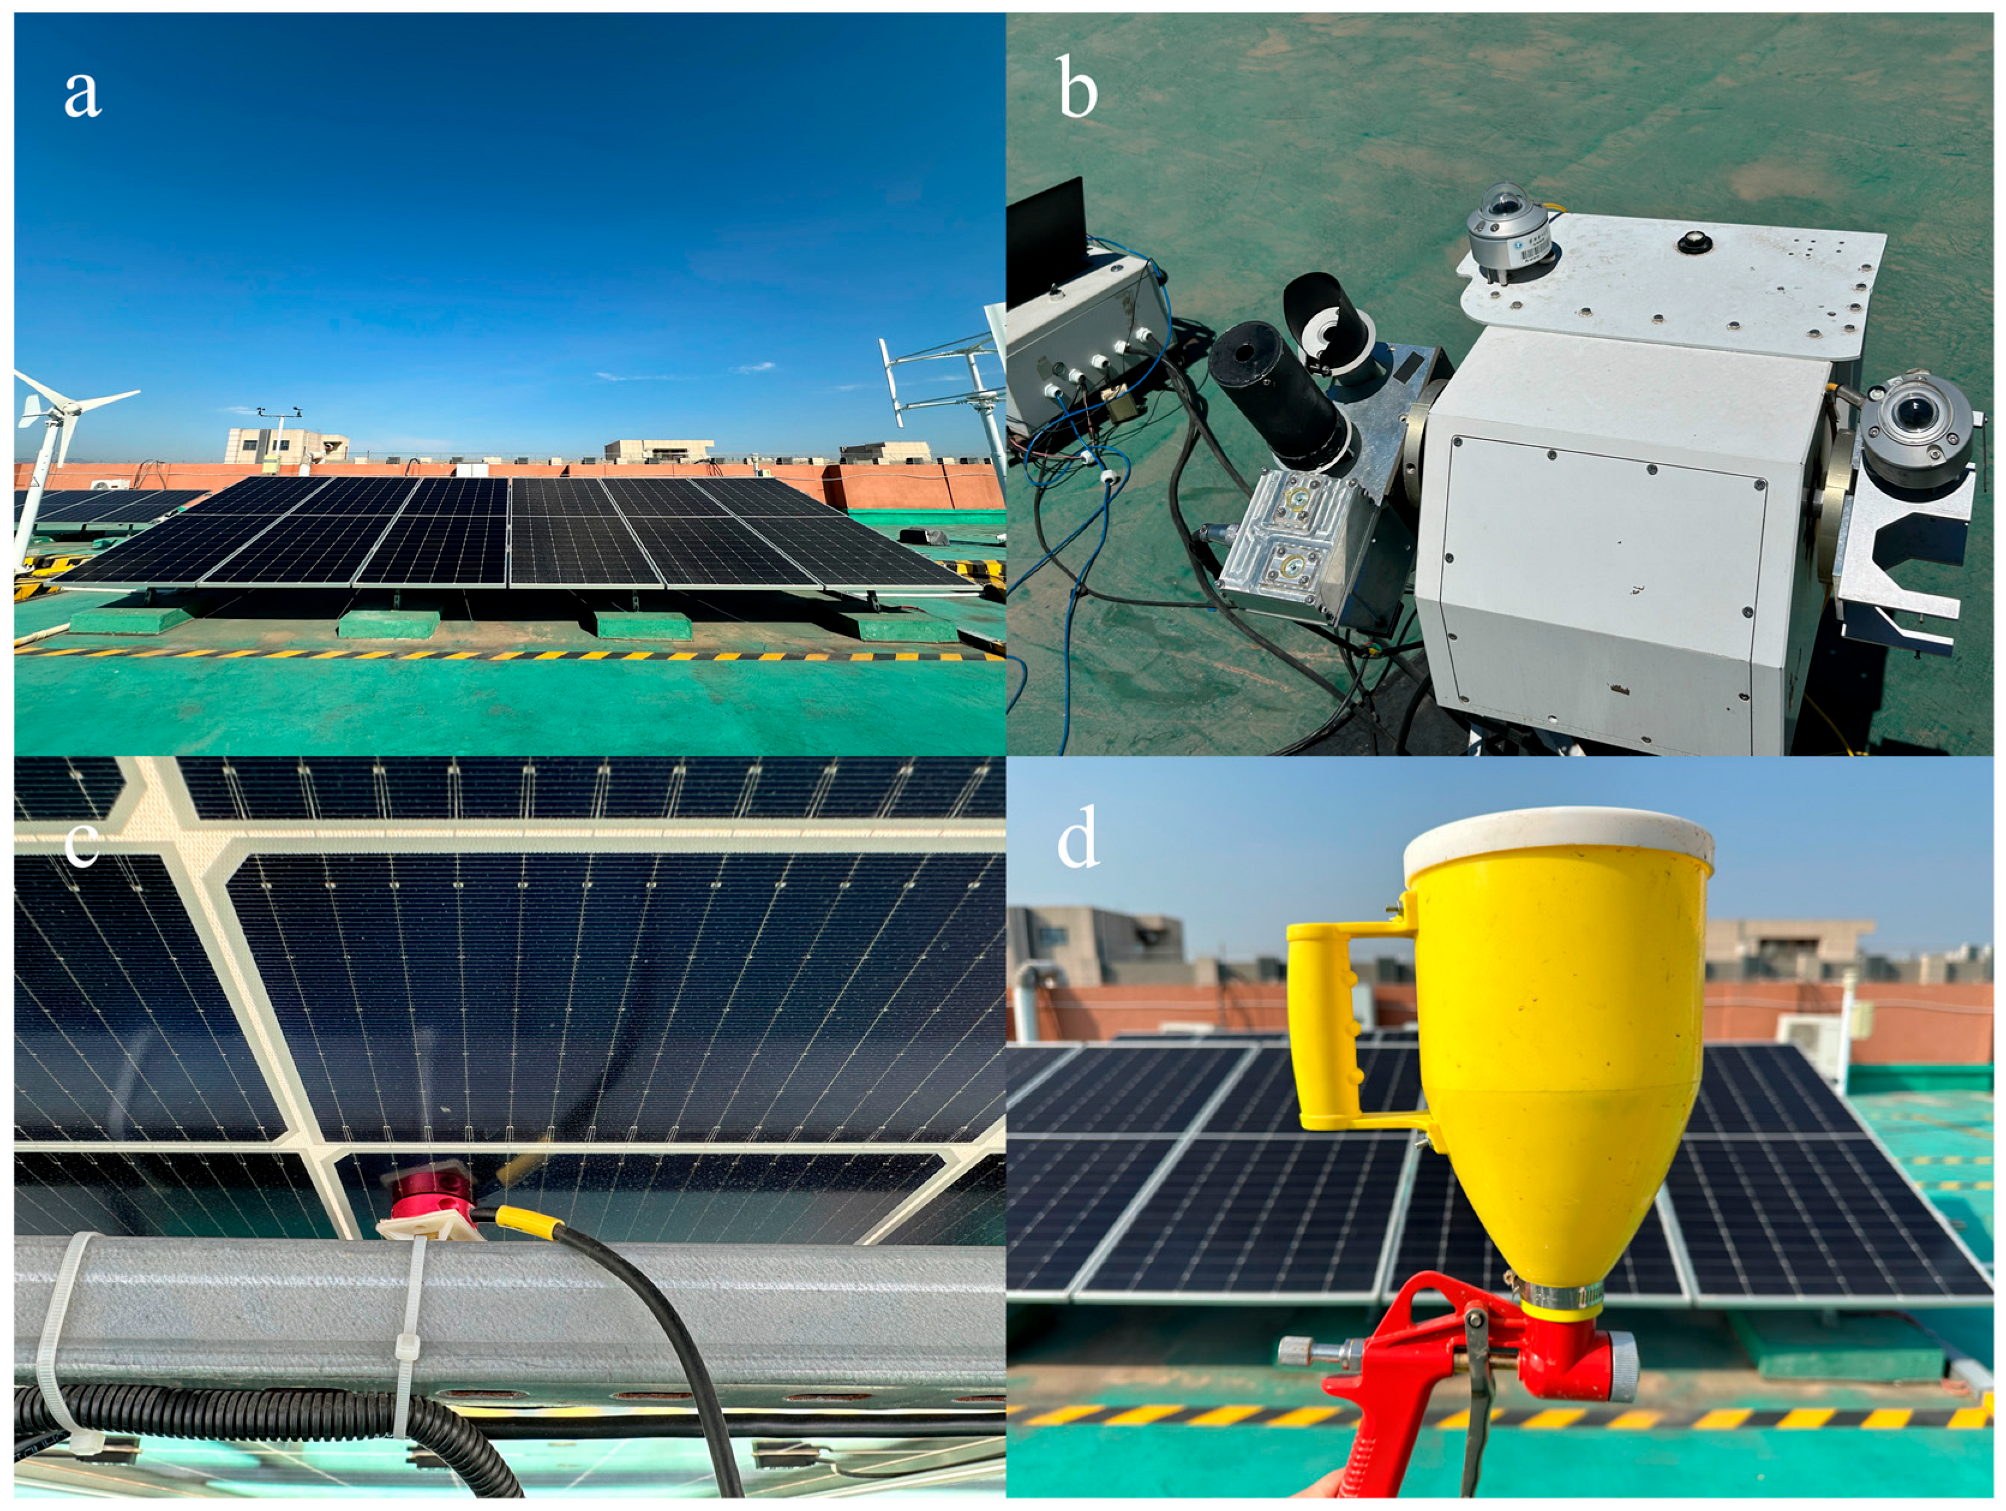
This study utilized a 10 kW photovoltaic system built in the laboratory, as shown in Figure 1a. This photovoltaic system consists of two series of photovoltaic string arrays, totaling 18 photovoltaic panels. Each photovoltaic panel has a rated power of 585 W and is of the JA Solar Deep Blue 4.0 model (JA Solar Technology Co., Ltd., Hebei, China). It was installed on the roof of Building B of North China University of Electric Power. The azimuth angle of the photovoltaic system components is 196°, and the inclination angle is 20°. The installation angle of each photovoltaic component is consistent. The photovoltaic system is equipped with a data acquisition system, which uses the Message Queuing Telemetry Transport (MQTT) protocol to collect current (A), voltage (V), and power (kW). The irradiance (W/m2) data is collected using the Kipp&Zonen total irradiance meter, and the azimuth angle and elevation angle of the irradiance meter are also consistent with the orientation of the photovoltaic panels, as shown in Figure 1b. Thermocouples are used to collect the temperature (°C) data of the photovoltaic panels, as shown in Figure 1c.
Figure 1.
(a) 10 kW photovoltaic system, (b) Kipp & Zonen pyranometer, (c) Thermocouple, (d) Dust spray bottle.
3. Methodology
To systematically investigate the impact of cloudy weather on the calculation of dust accumulation loss rate, this study designed a set of control experiment schemes and defined corresponding calculation and evaluation methods. This section will elaborate on the experimental setup and the calculation method of SLR.
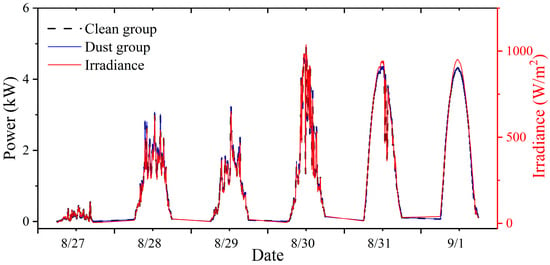
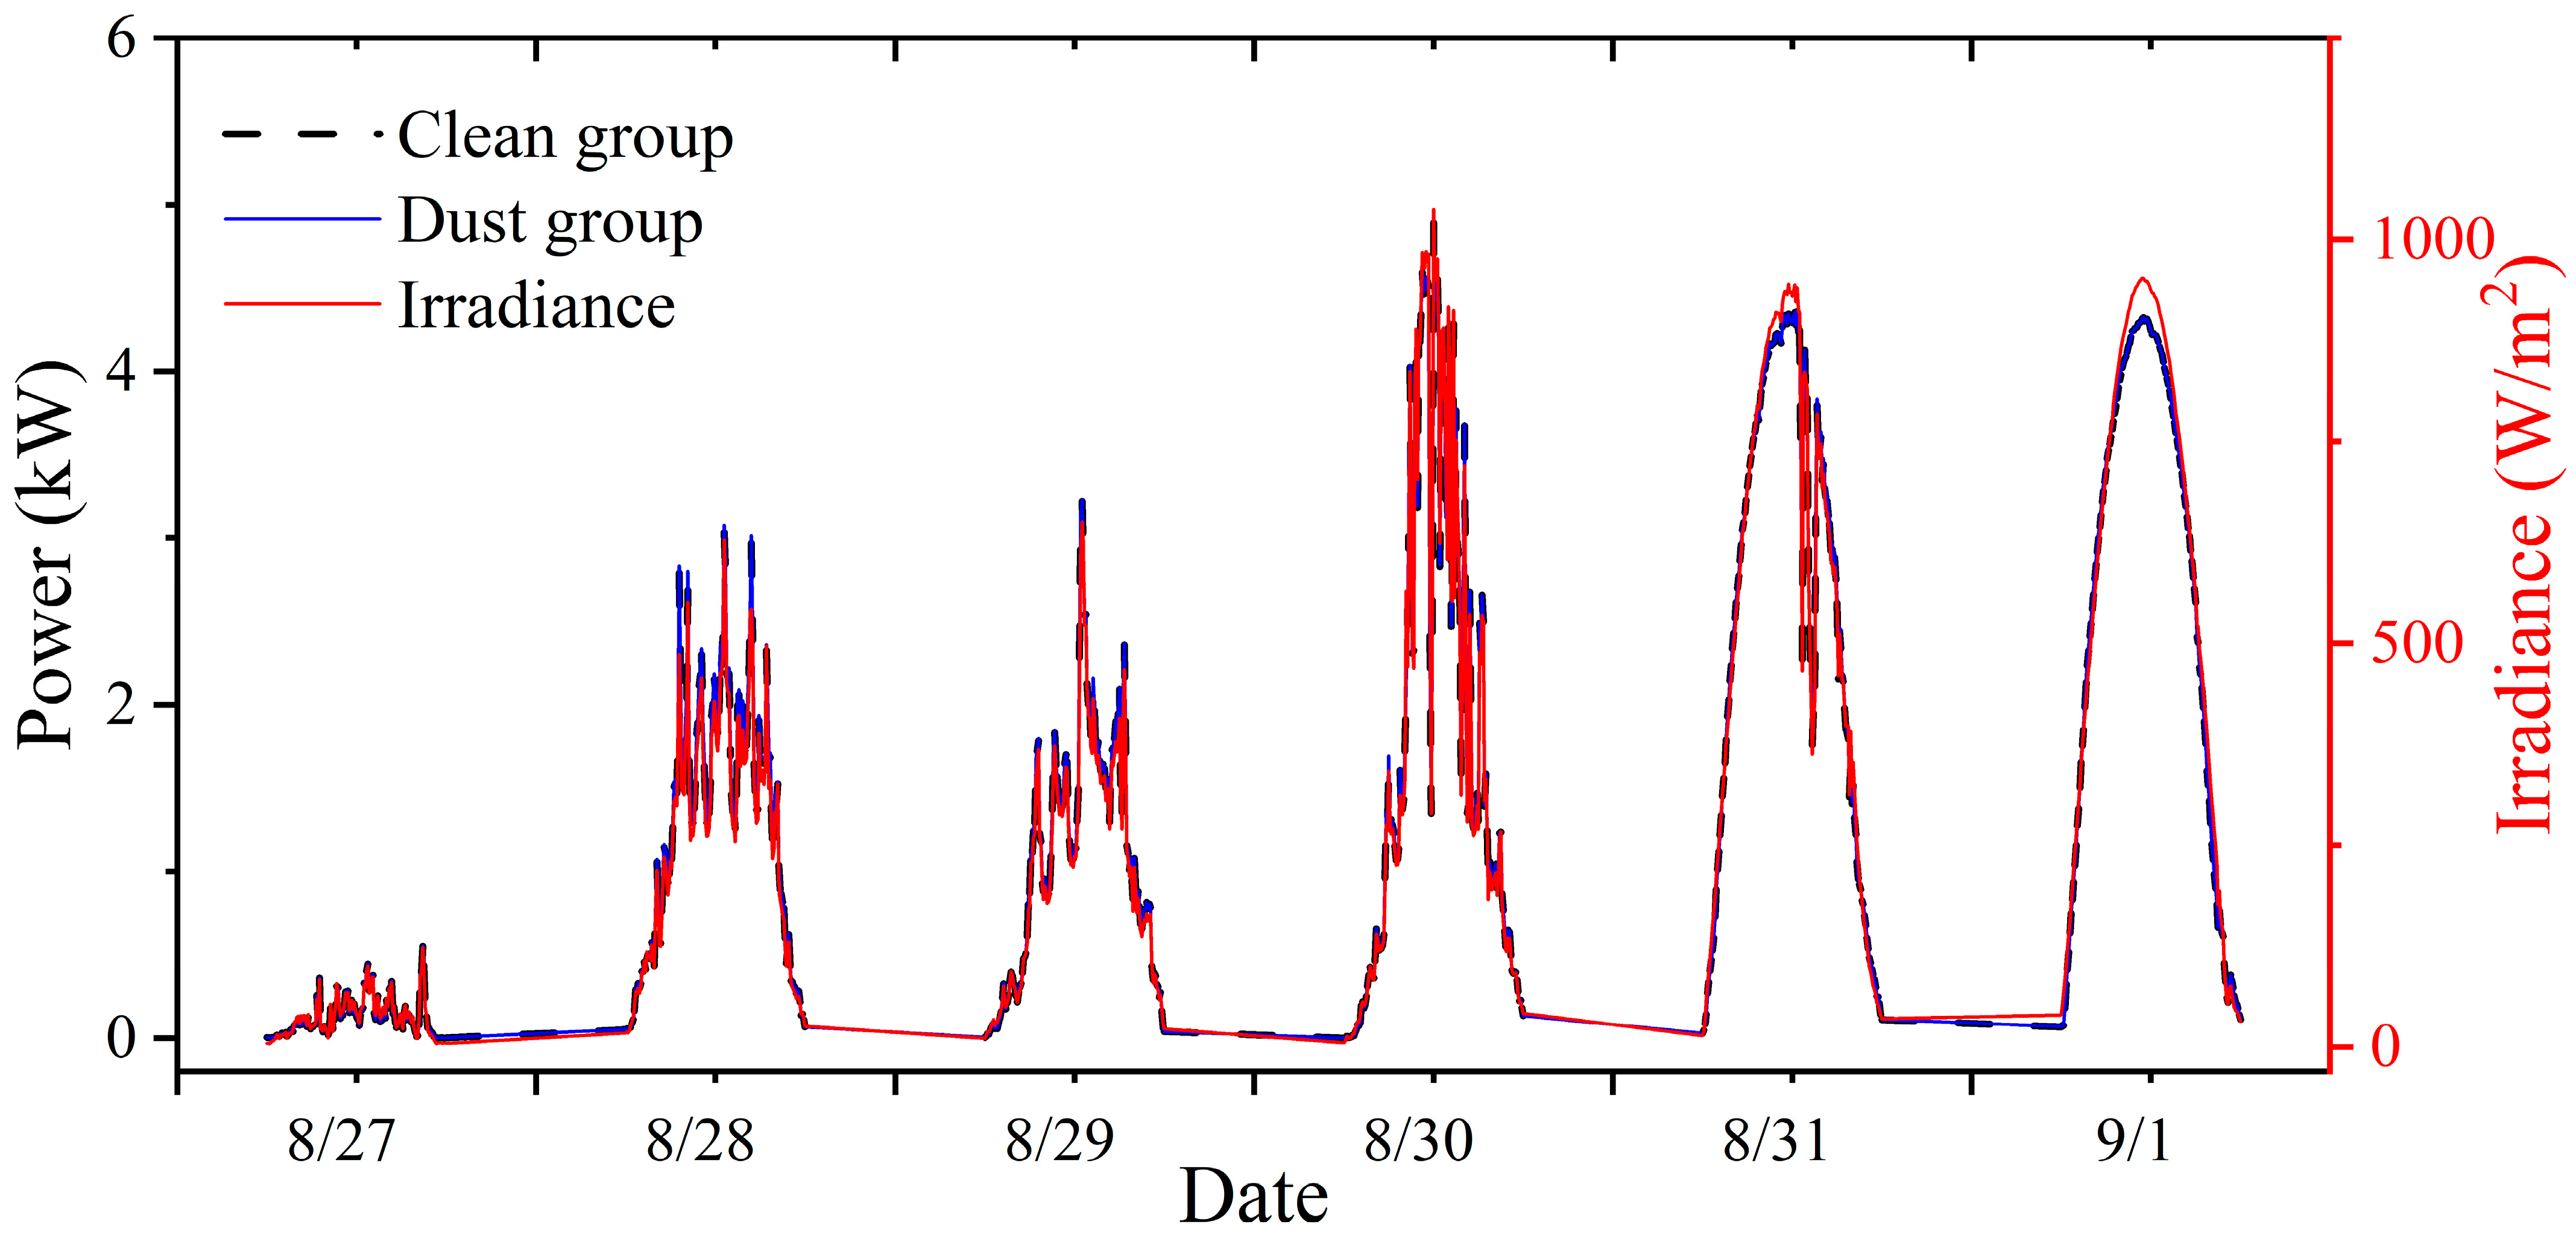
The experimental steps for obtaining photovoltaic dust accumulation and cleaning data are as follows: Two strings of photovoltaic strings are processed separately. One string is treated by sprinkling dust to simulate the dust accumulation phenomenon, serving as the soiling group. The dust samples for this experiment originated from the local soil in Beijing. To prepare standardized experimental dust, we first fully dried the original soil at 105 °C and then sieved it using a 200-mesh sieve to collect the uniform fine powder for subsequent experiments. The specific operation method for sprinkling dust is as follows: First, mix the dust with water to form an evenly suspended liquid. Then, using a spray bottle connected to a pressure stabilizing air pump, spray the suspension into the air, and evenly distribute it to fall onto the surface of the photovoltaic panels in the dust accumulation group. To ensure the uniformity and comparability of dust deposition, the entire spraying process is carried out under strictly controlled parameters: the air pump pressure is maintained at 0.6 MPa, and a systematic moving path and speed is adopted to ensure full and uniform coverage. The watering can device is shown in Figure 1d. The other string group is set as the cleaning group and is cleaned daily to ensure that its surface is always free of dust accumulation. To ensure that the performance differences between the two string groups can be fully attributed to dust accumulation, we confirmed the following prerequisites: all photovoltaic modules were commissioned at the same time, had been in service for less than 2 years, and were initially in good health. Additionally, the two string groups were installed in the same orientation, with the same inclination angle, and in the same surrounding environment. To ensure the comparability of the clean and dust group in the experiment and to guarantee that the subsequent recorded power differences can be attributed entirely to the dust accumulation effect, we conducted an initial calibration experiment on the two groups of photovoltaic panels before the formal start of the experiment. Under the clean state, the power output of the two groups was continuously and synchronously monitored for several days. As shown in Figure 2, the results indicated that the power curves of the two groups were highly consistent, with an average deviation of less than 0.5%. This result fully demonstrated that the two groups of photovoltaic panels had a high degree of consistency in their initial performance. Based on this, we reasonably determined that dust accumulation is the only variable causing systematic differences in the output power of the two groups. To establish a reliable benchmark, this study defined the instantaneous power difference between the clean group and the dust group at the same time as the benchmark soiling loss ratio (SLRbm), and its calculation formula is as follows:
Figure 2.
Power curves of the dust group and the clean group in clean state.
In the above equation, Pclean and Pdust represent the measured instantaneous output power (kW) of the clean group and the soiling group, respectively. As mentioned previously, under the condition that all other factors except the dust accumulation state are kept consistent between the two groups, this power difference can be directly attributed to the optical loss caused by the dust accumulation.
For comparison, we use the theoretical power method, which is widely used in the performance evaluation of photovoltaic systems, to calculate the SLR. This model takes into account the effects of incident irradiance and backsheet temperature on the output power. First, the theoretical output power (Ptheo) of the PV system is calculated using the following formula:
In the above equation:
- C is the installed capacity of the PV string (kW).
- G is the measured irradiance on the plane of the array (W/m2).
- η is the comprehensive efficiency coefficient of the PV system, accounting for constant losses such as inverter efficiency, line losses, and initial module degradation; in this study, this coefficient was determined to be 97.8% based on manufacturer-provided annual degradation rate data.
- α is the power temperature coefficient.
The temperature coefficient α is used to correct for power changes due to the deviation of the backplane temperature from the Standard Test Condition (25 °C). It is calculated as
In the above equation:
- γ is the power temperature coefficient, which has a value of −0.300%/°C for the PV panels used in this experiment.
- T is the backsheet temperature (°C).
Substituting the expression for α into the theoretical power formula yields the complete theoretical power model:
Finally, the SLRtpd obtained based on the theoretical power method is derived by the following formula:
4. Results and Discussion
4.1. Results
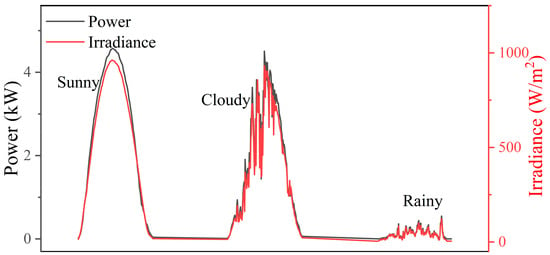
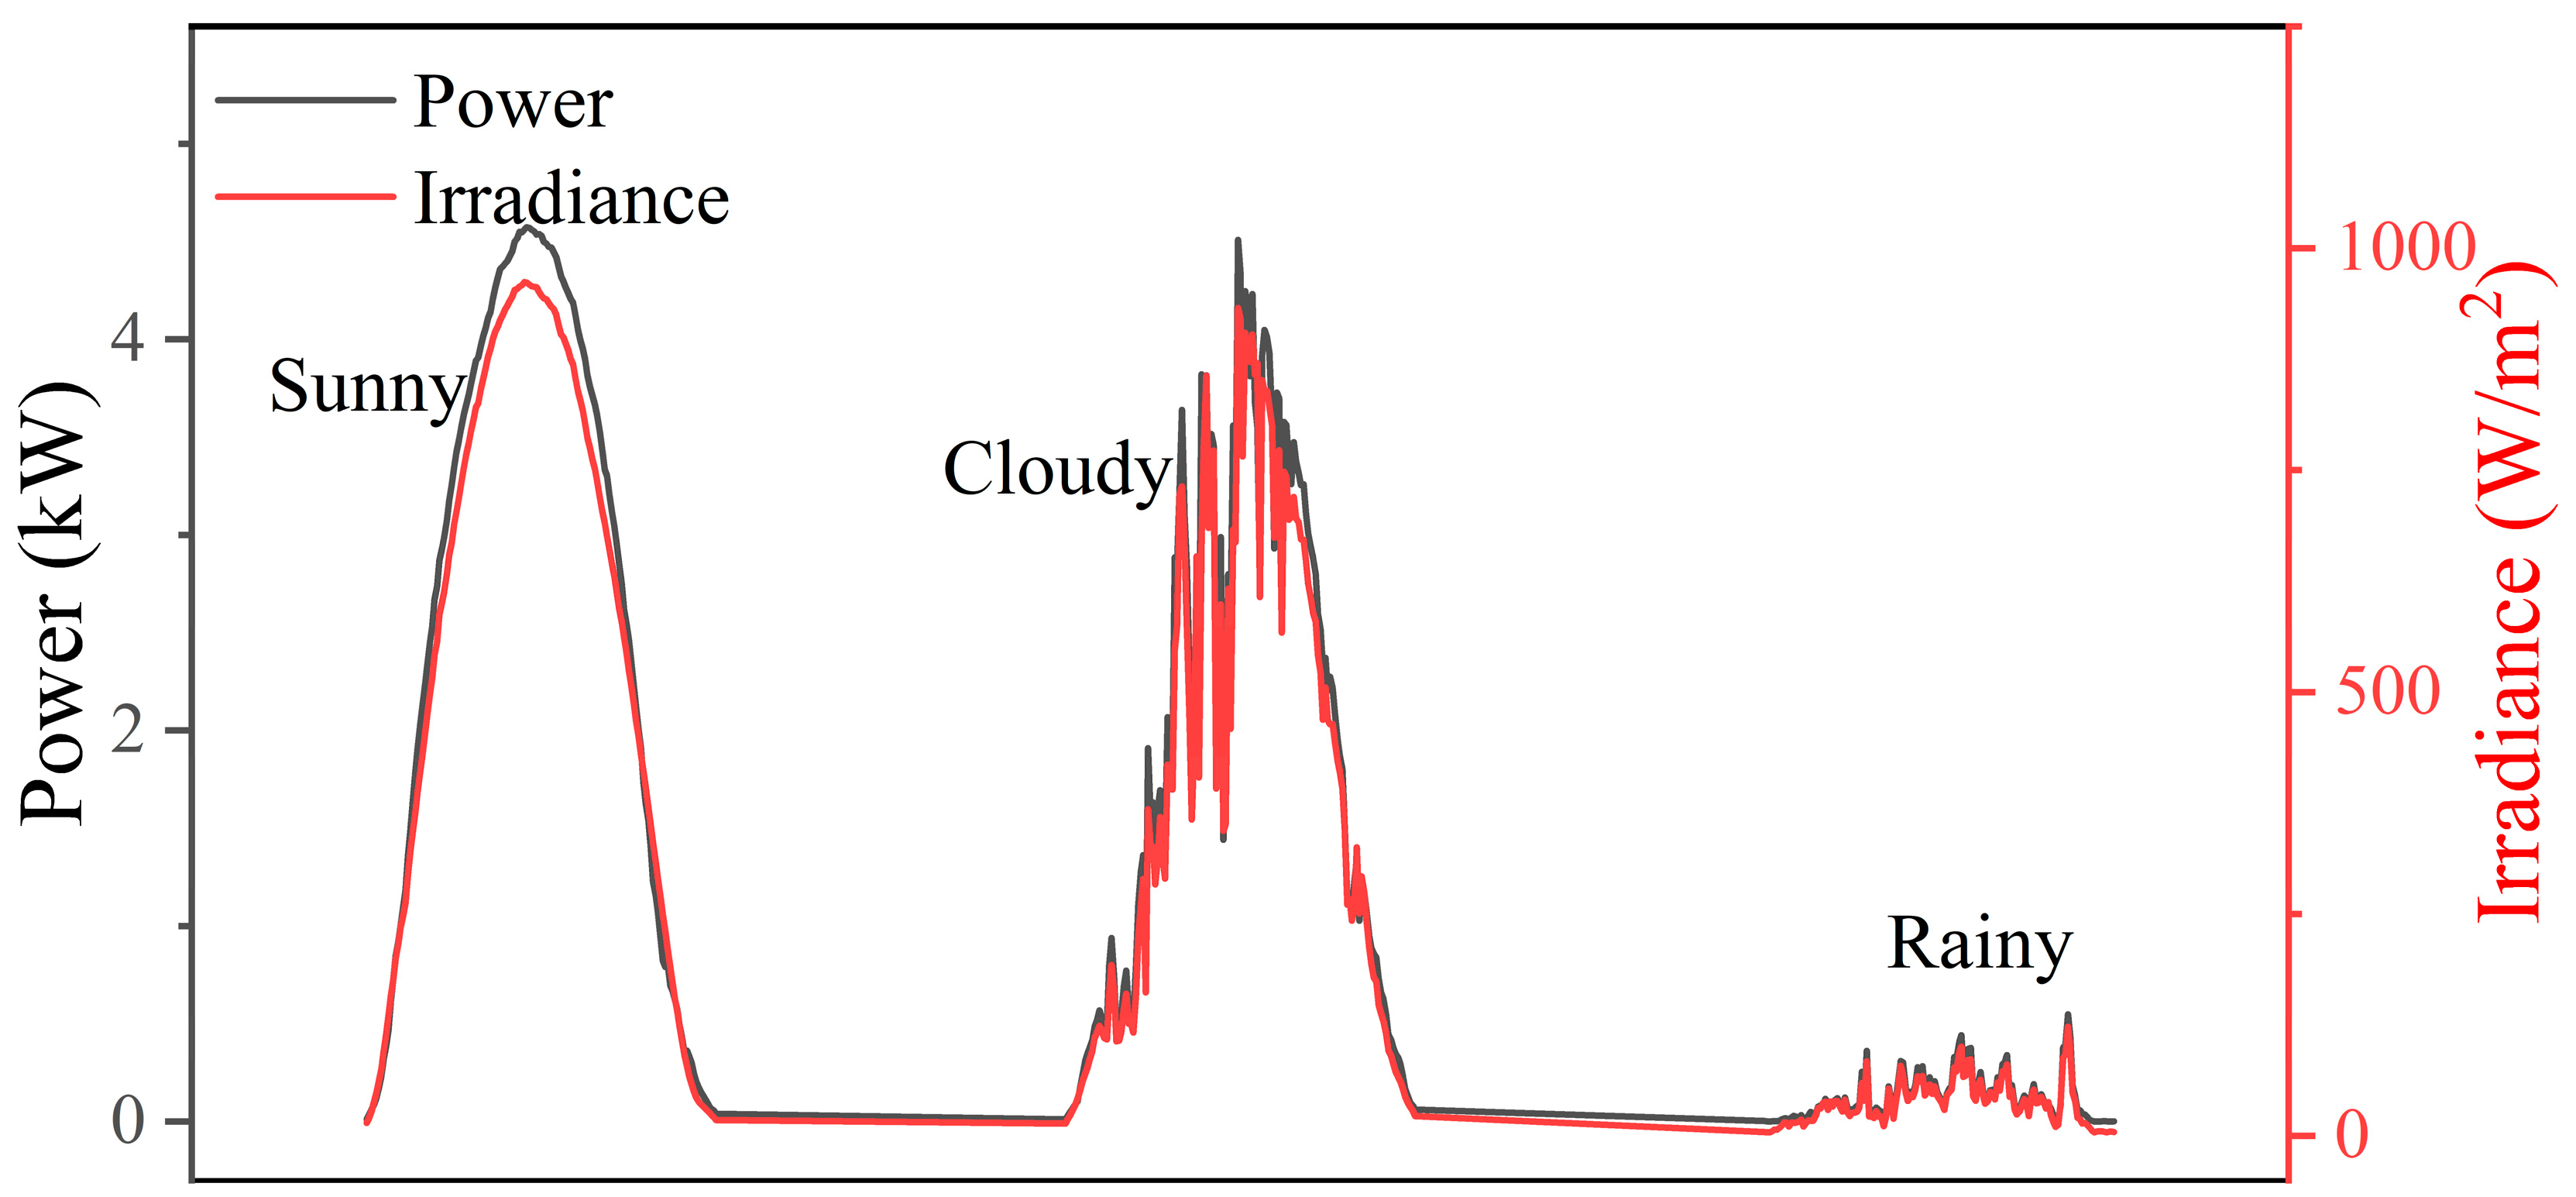
The dust accumulation experiment lasted for 20 days from 27 August to 15 September 2025. Among them, there were 6 days of sunny weather, 10 days of cloudy weather, and 4 days of rainy weather. As shown in Figure 2, we, respectively, present the irradiance and power curve graphs under sunny, cloudy, and rainy weather conditions.
By comparing the irradiance and power curves under different weather conditions (Figure 3), it can be observed that on sunny days, both curves are smooth and approximately follow a normal distribution. The power and irradiance show a significant synchronous change trend, that is, in the morning, as the irradiance increases, the power increases monotonically; after noon, it decreases monotonically as it declines. In contrast, under cloudy weather, irradiance displayed intense fluctuations due to cloud shading. For example, during the period of cloud cover, it drops sharply and rapidly recovers when the clouds pass by correspondingly. Although the photovoltaic output power generally changes with the irradiance, it exhibits obvious lagging behavior, and even in some periods, it shows a phenomenon inconsistent with the irradiance change trend. The curve characteristics under rainy conditions are similar to those under cloudy weather conditions. The overall level of irradiance and power is low, accompanied by frequent fluctuations.
Figure 3.
Irradiance and power curves under sunny (left), cloudy (middle), and rainy (right) conditions.
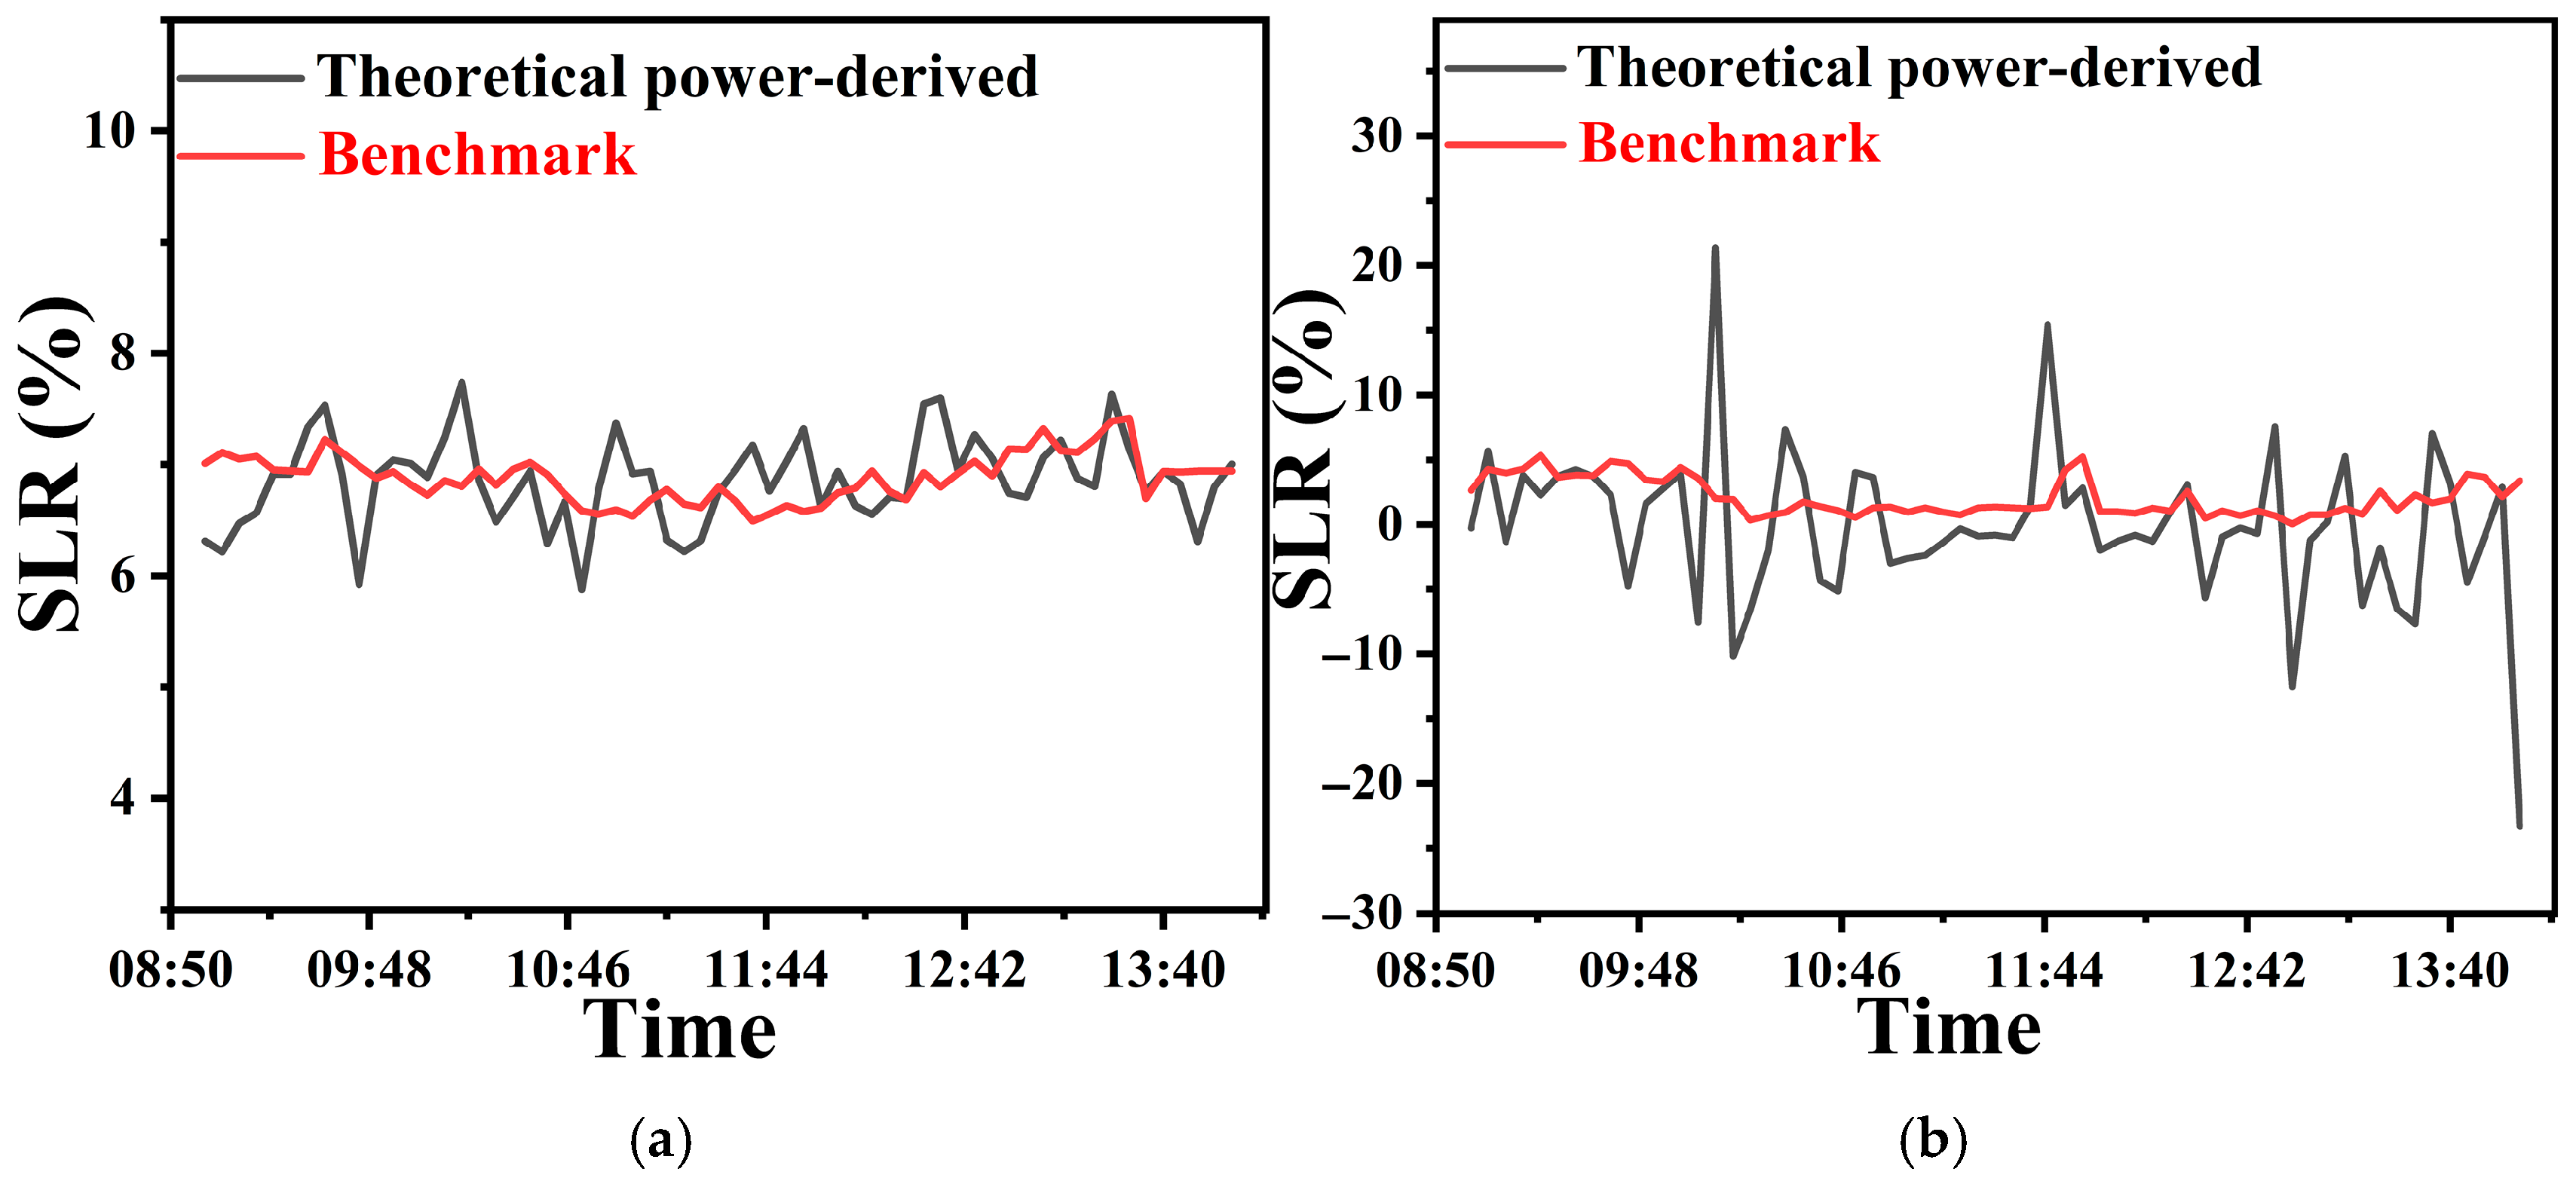
In order to investigate the differences in the calculation results of SLR under cloudy and sunny conditions, we compared and analyzed the calculation result curves of the two weather conditions (Figure 4). Under sunny conditions (Figure 4a), SLRtpd and SLRbm were highly consistent, with a small fluctuation range, demonstrating good stability. In contrast, the calculation results under cloudy weather (Figure 4b) showed severe fluctuations, with frequent negative values and extreme value differences even exceeding 45%. It is worth noting that SLRbm remained relatively stable under different weather conditions, with little change in the fluctuation range.
Figure 4.
Diurnal variation curves of the SLR under typical (a) clear-sky and (b) cloudy conditions.
This phenomenon was not an isolated case. Expanding the analysis to the entire dataset of 6 clear days and 10 cloudy days reveals that the fluctuation of SLRtpd under cloudy weather was significantly higher than under sunny days. To quantify this difference, we introduced the dispersion ratio (DR) as an evaluation indicator. The definition of the discrete rate is as follows:
In the above equation:
- σ represents the standard deviation of all the SLRtpd and SLRbm sampling values within a single day.
- μ represents the average value of all the SLRtpd and SLRbm sampling values within a single day.
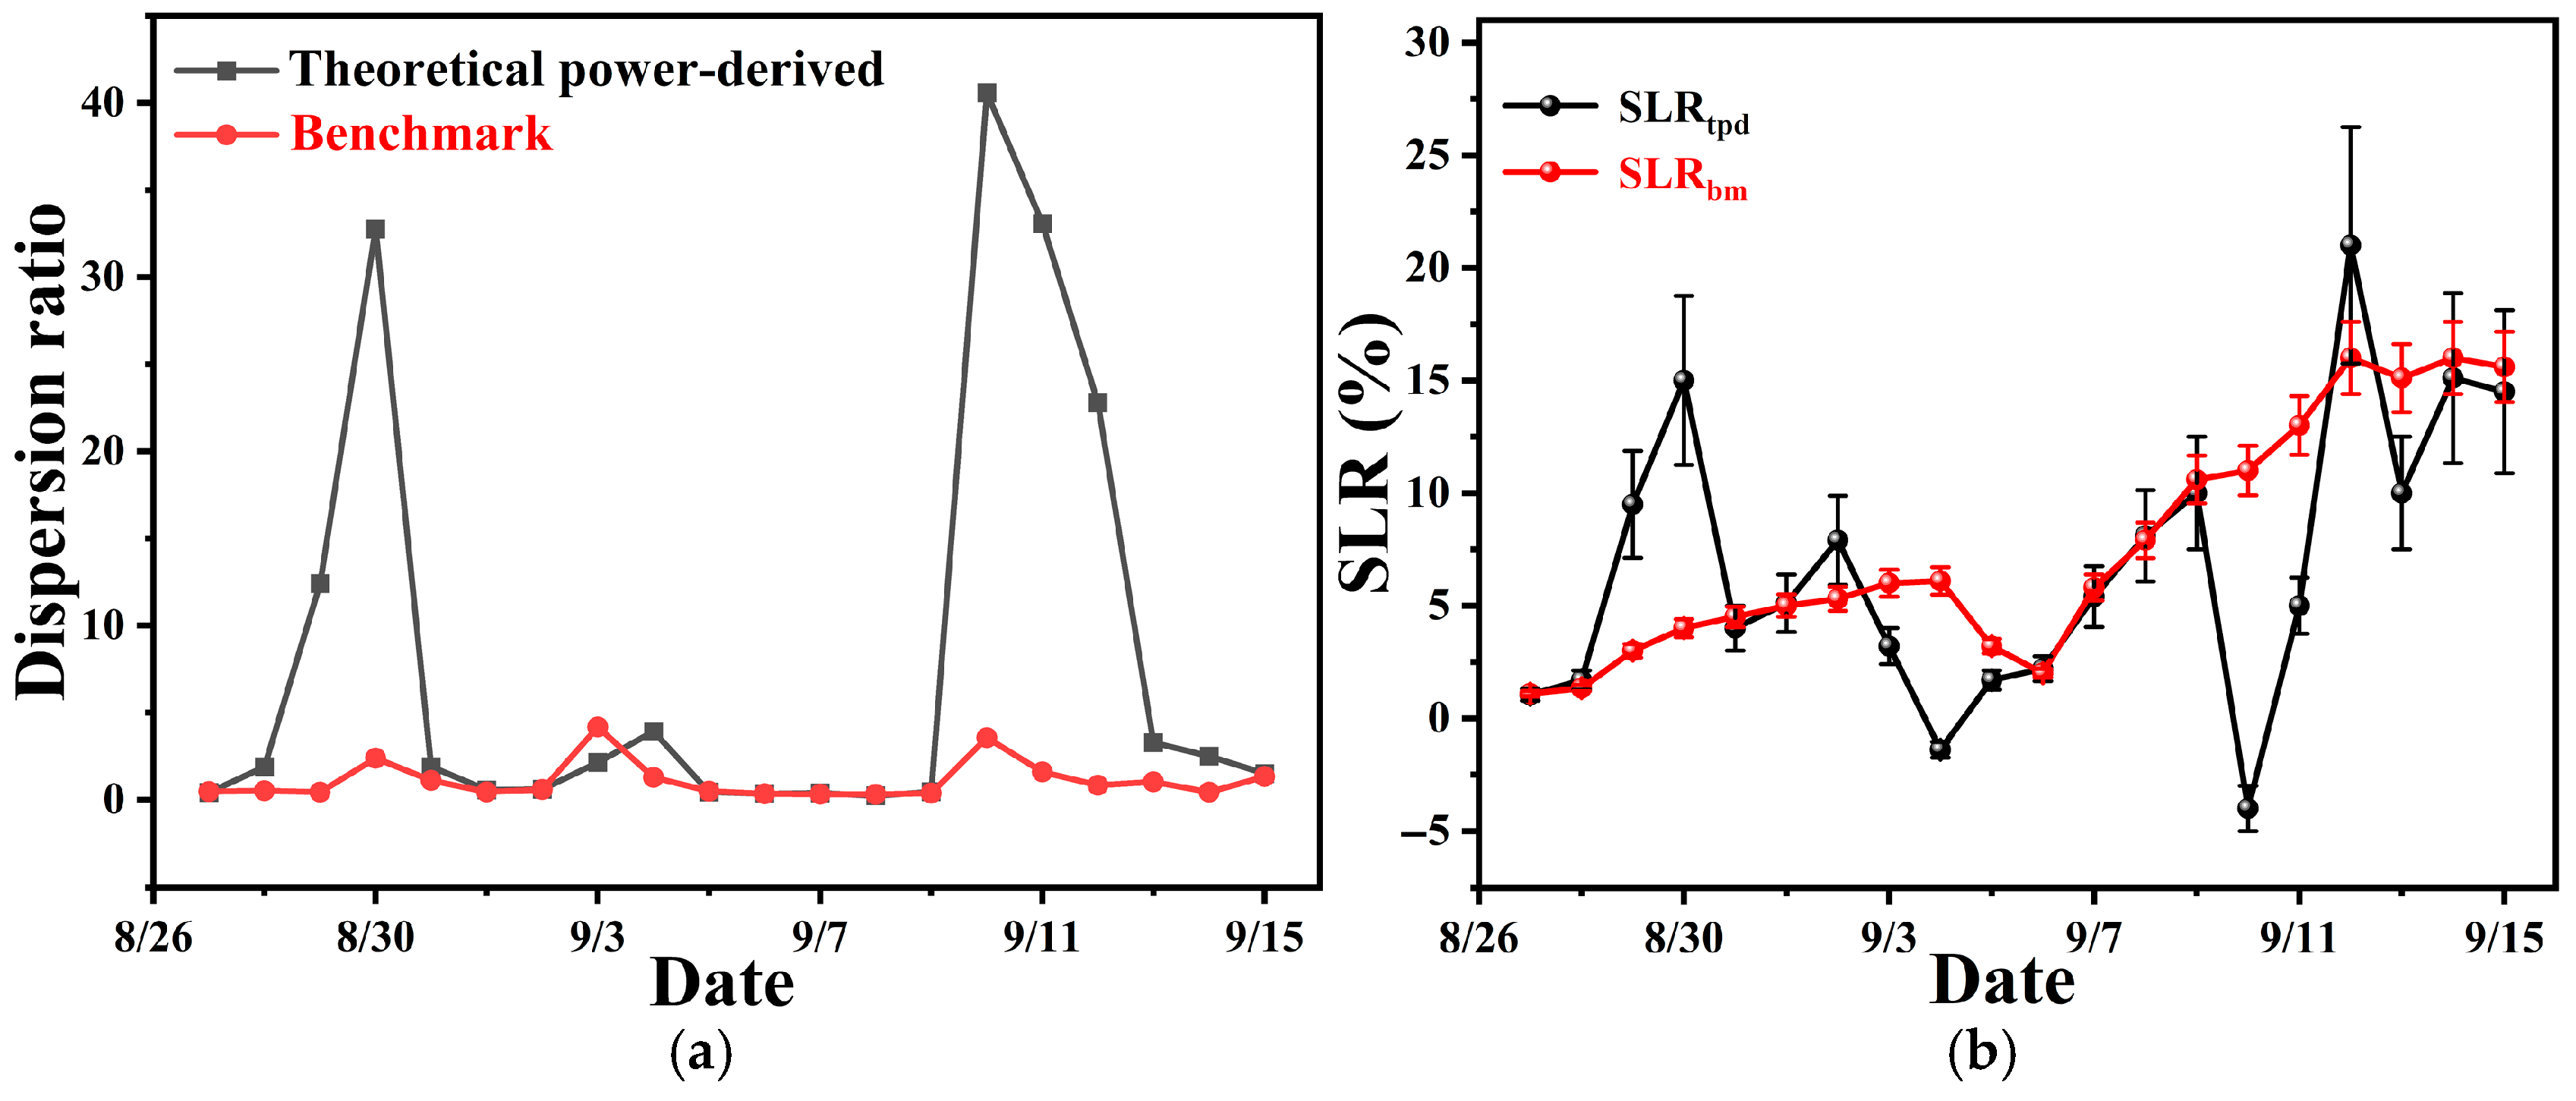
As shown in Figure 5a. The results show that the fluctuation amplitude of SLRtpd was substantially larger than that of SLRbm. On some cloudy days, the dispersion ratio of SLRtpd could even reach 30–40. Calculations show that the dispersion ratio of SLRtpd under clear days was only 0.969, while under cloudy conditions it sharply increased to 17.796, representing an increase of over 18 times. In stark contrast, the average dispersion ratio of SLRbm across all weather conditions was only 1.10, with a fluctuation amplitude far lower than the calculated values.
Figure 5.
(a) Dispersion ratio curves of the SLR on different dates. (b) Variation curves of the SLR over the experimental period.
To investigate the dynamic changes in the SLR throughout the experimental period, we plotted the time series of the daily benchmark and theoretical power-derived values (Figure 5b). The results show that the SLRbm exhibited an overall upward trend, clearly recording the dynamic process of continuous dust accumulation on the module surfaces. Notably, this trend was interrupted on 5–6 September, which were rainy days; we observed a significant cleaning effect from rainwater on the soiled group, leading to a decrease in SLRbm, a phenomenon consistent with physical expectations.
Comparing the trajectories of SLRtpd and SLRbm reveals that the accuracy of the theoretical power-derived value exhibits strong weather dependence: on clear days, SLRtpd matched SLRbm well and effectively reflected the soiling loss; however, under cloudy weather, SLRtpd not only showed significantly greater deviation from SLRbm but also frequently produced physically meaningless negative values, which is consistent with the previously described dispersion ratio. The observations during this period strongly corroborate the previous conclusion that the theoretical power-based SLR calculation method suffers a sharp decline in reliability under cloudy weather and cannot accurately assess the soiling level.
These findings collectively demonstrate that the theoretical power-based SLR calculation method achieves high reliability under clear-sky conditions with stable irradiance but produces significantly distorted results under cloudy weather with highly fluctuating irradiance. This is primarily because the frequent irradiance variations in cloudy weather amplify the errors inherent in the theoretical power model, whereas SLRbm remains relatively unaffected by weather changes, demonstrating better robustness.
4.2. Discussion
This study suggests that the computational errors can mainly be attributed to two interrelated physical and system response characteristics under cloudy weather conditions: the inherent sensitivity of the theoretical power model at low irradiance levels and the dynamic lag effect of MPPT.
Firstly, the accuracy of the theoretical power model is closely related to the irradiance level. Under sunny weather conditions, the irradiance remains stable at a relatively high level (typically above 800 W/m2), and the photovoltaic module operates within the efficient and linear region of the performance curve. The uncertainty range of the model calculation is compressed, resulting in smaller errors. However, in cloudy weather, the irradiance undergoes sudden changes due to cloud cover, dropping from above 800 W/m2 to 400 W/m2 or lower within a short time. At such low irradiance levels, the component operating point is close to its startup threshold, and the nonlinearity of the current-voltage characteristic curve increases [18], which significantly amplifies the inherent approximate error of the linear or quasi-linear theoretical model based on a single efficiency coefficient.
Secondly, the dynamic response lag of the MPPT system is another key factor. The theoretical power model usually assumes that the system can instantaneously track the maximum power point, but the actual MPPT algorithm has inherent response time. Under stable irradiance on a clear day, this lag can be negligible. However, in the case of rapid and frequent jumps in irradiance during cloudy weather, the tracking speed of MPPT cannot keep up with the rhythm of external conditions, causing the actual operating point to continuously deviate from the true maximum power point [19,20,21]. This dynamic mismatch leads to systematic deviations between the measured power and the theoretical power calculated based on instantaneous irradiance. When this deviation is substituted into the SLR calculation formula, it will cause significant fluctuations in the calculation results, and even in the dusty group, due to some transient condition (such as a brief cloud cover for the clean group), the instantaneous power exceeds the theoretical value, resulting in a physically unreasonable negative loss rate.
5. Conclusions
This study, through empirical analysis, demonstrates that the frequent fluctuations in irradiance and the hysteresis effect of Maximum Power Point Tracking (MPPT) under cloudy conditions lead to a significant increase in calculation errors for the SLR. The main conclusions are as follows:
Weather conditions have a decisive impact on calculation accuracy. The theoretical power method accurately reflects soiling loss under clear skies. In contrast, under cloudy weather, the calculated values exhibit severe fluctuations, with a dispersion ratio more than 18 times higher than on clear days. This confirms the limited applicability of this method under non-steady-state irradiance conditions.
The root cause of error likely lies in insufficient model response capability. The theoretical power model fails to capture the response speed and capability of the PV system during abrupt irradiance changes, leading to deviations in power estimation.
Stability of the SLRbm. The benchmark SLRbm, based on the comparison between the cleaned and soiled arrays, showed minor fluctuations (with an average dispersion ratio of only 1.1) under different weather conditions. It can therefore serve as a reliable benchmark for evaluating calculation methods.
Author Contributions
Conceptualization, X.C. and Z.T.; methodology, X.C., X.X. and B.K.; software, X.S. and H.Z.; validation, B.K.; formal analysis, X.C., Z.T. and X.X.; investigation, B.K., W.Z. and H.Z.; resources, X.C., Z.T. and H.Z.; data curation, X.X. and W.Z.; writing—original draft preparation, X.C. and X.X.; writing—review and editing, J.S.; and X.C.; supervision, J.S.; project administration, Z.T. All authors have read and agreed to the published version of the manuscript.
Funding
This work is supported by the project titled “Vice President of Science and Technology” of Changping District, Beijing (202502007023), and partly supported by the Fundamental Research Funds for the Central Universities (2024JC007).
Data Availability Statement
All data that support the findings of this study are available upon reasonable request.
Conflicts of Interest
Authors Xihua Cao, Zipeng Tang, Bo Kuang, Wenzhen Zou, Xuanshuo Shangguan were employed by Huadian Electric Power Research Institute Co., Ltd. The remaining authors declare that the research was conducted in the absence of any commercial or financial relationships that could be construed as a potential conflict of interest.
Abbreviations
The following abbreviations are used in this manuscript:
| PV | Photovoltaic |
| SLR | Soiling loss ratio |
| SLRbm | Benchmark soiling loss ratio |
| SLRtpd | Theoretical power-derived soiling loss ratio |
| MPPT | Maximum Power Point Tracking |
| SR | Soiling ratio |
| PR | Performance ratio |
| MQTT | Message Queuing Telemetry Transport |
References
- Qaisieh, A.; Abu-Nabah, B.A.; Hamdan, M.O.; Alami, A.H.; Khanfar, L.; Zaki, L. Optical characterization of accumulated dust particles and the sustainability of transmitted solar irradiance to photovoltaic cells. Renew. Energy 2023, 219, 119439. [Google Scholar] [CrossRef] [Scilit]
- He, B.; Lu, H.; Zheng, C.; Wang, Y. Characteristics and cleaning methods of dust deposition on solar photovoltaic modules—A review. Energy 2023, 263, 126083. [Google Scholar] [CrossRef] [Scilit]
- Dida, M.; Boughali, S.; Bechki, D.; Bouguettaia, H. Output power loss of crystalline silicon photovoltaic modules due to dust accumulation in Saharan environment. Renew. Sustain. Energy Rev. 2020, 124, 109787. [Google Scholar] [CrossRef] [Scilit]
- Hijjawi, U.; Lakshminarayana, S.; Xu, T.; Piero Malfense Fierro, G.; Rahman, M. A review of automated solar photovoltaic defect detection systems: Approaches, challenges, and future orientations. Sol. Energy 2023, 266, 112186. [Google Scholar] [CrossRef] [Scilit]
- Jeffrey Kuo, C.-F.; Chen, S.-H.; Huang, C.-Y. Automatic detection, classification and localization of defects in large photovoltaic plants using unmanned aerial vehicles (UAV) based infrared (IR) and RGB imaging. Energy Convers. Manag. 2023, 276, 116495. [Google Scholar] [CrossRef] [Scilit]
- Manno, D.; Cipriani, G.; Ciulla, G.; Di Dio, V.; Guarino, S.; Lo Brano, V. Deep learning strategies for automatic fault diagnosis in photovoltaic systems by thermographic images. Energy Convers. Manag. 2021, 241, 1–17. [Google Scholar] [CrossRef] [Scilit]
- Kirsten Vidal de Oliveira, A.; Aghaei, M.; Rüther, R. Aerial infrared thermography for low-cost and fast fault detection in utility-scale PV power plants. Sol. Energy 2020, 211, 712–724. [Google Scholar] [CrossRef] [Scilit]
- Yang, C.; Sun, F.; Zou, Y.; Lv, Z.; Xue, L.; Jiang, C.; Liu, S.; Zhao, B.; Cui, H. A Survey of Photovoltaic Panel Overlay and Fault Detection Methods. Energies 2024, 17, 837. [Google Scholar] [CrossRef] [Scilit]
- Conceição, R.; Silva, H.; Mirão, J.; Collares-Pereira, M. Organic Soiling: The Role of Pollen in PV Module Performance Degradation. Energies 2018, 11, 294. [Google Scholar] [CrossRef] [Scilit]
- Cipriani, G.; D’Amico, A.; Guarino, S.; Manno, D.; Traverso, M.; Di Dio, V. Convolutional Neural Network for Dust and Hotspot Classification in PV Modules. Energies 2020, 13, 6357. [Google Scholar] [CrossRef] [Scilit]
- Zhang, W.; Liu, S.; Gandhi, O.; Rodriguez-Gallegos, C.D.; Quan, H.; Srinivasan, D. Deep-Learning-Based Probabilistic Estimation of Solar PV Soiling Loss. IEEE Trans. Sustain. Energy 2021, 12, 2436–2444. [Google Scholar] [CrossRef] [Scilit]
- Di Tommaso, A.; Betti, A.; Fontanelli, G.; Michelozzi, B. A multi-stage model based on YOLOv3 for defect detection in PV panels based on IR and visible imaging by unmanned aerial vehicle. Renew. Energy 2022, 193, 941–962. [Google Scholar] [CrossRef] [Scilit]
- Hossain, S.; Arika, A.M.; Fahim, I.N.; Uddin, J.; Ahmed, A.; Apon, H.J.; Hoque, M.A. Enhancing solar panel performance: A machine learning approach to dust detection and automated water sprinkle-based cleaning strategy. Sol. Energy 2025, 287, 113240. [Google Scholar] [CrossRef] [Scilit]
- Pal, A.; Ganesan, S.I.; Reddy, M.J.B. Data-Driven Soiling Estimation and Optimized Cleaning Strategies for Industrial Rooftop PV Systems. IEEE J. Photovolt. 2025, 15, 353–361. [Google Scholar] [CrossRef] [Scilit]
- Deceglie, M.G.; Micheli, L.; Muller, M. Quantifying Soiling Loss Directly From PV Yield. IEEE J. Photovolt. 2018, 8, 547–551. [Google Scholar] [CrossRef] [Scilit]
- Nepal, P.; Korevaar, M.; Ziar, H.; Isabella, O.; Zeman, M. Accurate Soiling Ratio Determination With Incident Angle Modifier for PV Modules. IEEE J. Photovolt. 2019, 9, 295–301. [Google Scholar] [CrossRef] [Scilit]
- Agbogla, J.; Sekyere, C.K.K.; Forson, F.K.; Opoku, R.; Baah, B. Soiling estimation methods in solar photovoltaic systems: Review, challenges and future directions. Results Eng. 2025, 26, 104810. [Google Scholar] [CrossRef] [Scilit]
- Gao, X.; Li, S.; Gong, R. Maximum power point tracking control strategies with variable weather parameters for photovoltaic generation systems. Sol. Energy 2013, 93, 357–367. [Google Scholar] [CrossRef] [Scilit]
- Li, S. A variable-weather-parameter MPPT control strategy based on MPPT constraint conditions of PV system with inverter. Energy Convers. Manag. 2019, 197, 111873. [Google Scholar] [CrossRef] [Scilit]
- Li, S.; Attou, A.; Yang, Y.; Geng, D. A maximum power point tracking control strategy with variable weather parameters for photovoltaic systems with DC bus. Renew. Energy 2015, 74, 478–488. [Google Scholar] [CrossRef] [Scilit]
- Adar, M.; Babay, M.-A.; Boussif, M.; Khaouch, Z.; Abbassi, Z.; Najih, Y.; Mabrouki, M. Optimization of Photovoltaic System Modelling: A Comparative Study and Experimental Validation Using Bond Graph Methodology and a Genetic Algorithm. In Applied Mathematics, Modeling and Computer Simulation; IOS Press: Amsterdam, The Netherlands, 2024. [Google Scholar]


Disclaimer/Publisher’s Note: The statements, opinions and data contained in all publications are solely those of the individual author(s) and contributor(s) and not of MDPI and/or the editor(s). MDPI and/or the editor(s) disclaim responsibility for any injury to people or property resulting from any ideas, methods, instructions or products referred to in the content. |
© 2026 by the authors. Licensee MDPI, Basel, Switzerland. This article is an open access article distributed under the terms and conditions of the Creative Commons Attribution (CC BY) license.