


Abstract
Reversible Solid Oxide Cells (rSOCs) are highly efficient energy conversion systems for power generation in fuel cell mode (SOFC) and energy storage in electrolysis mode (SOEC). These devices are typically manufactured through multi-step processing routes based on conventional functional ceramic fabrication techniques, such as tape-casting, extrusion, screen-printing and spraying. In this work, an alternative mold-casting approach is proposed for the fabrication of planar electrolyte-supported rSOCs. Electrolytes made of 8 mol% yttria-stabilized zirconia (YSZ) were prepared via an aqueous gel-casting process using agarose as the gelling agent. The casting molds were fabricated by 3D printing with polylactic acid (PLA) filament. Dense electrolytes with well-controlled geometries were successfully obtained. Complete cells were produced using porous Ni–YSZ as a fuel electrode and porous lanthanum strontium manganite–YSZ. The cells were microstructurally characterized, and their electrochemical performance was evaluated under both SOFC and SOEC operating conditions at 800–900 °C. At 900 °C, the cell achieved a peak power density of 220 mW cm−2 in fuel cell mode and an injected current density of 340 mA cm−2 at 1.3 V in electrolysis mode. Mid-term galvanostatic testing in SOFC mode at 850 °C for 400 h demonstrated good durability and structural stability of the fabricated cells. After the initial stabilization period, the cell exhibited a low degradation rate of 3 mV kh−1.
1. Introduction
Reversible Solid Oxide Cells (rSOCs) are electrochemical devices that can operate both as fuel cells (SOFCs), converting hydrogen into electricity, and as electrolysis cells (SOECs), producing hydrogen from steam using electricity. This reversible operation enables efficient energy conversion and storage, allowing surplus renewable electricity to be stored as hydrogen and later reconverted into clean electricity in a low-carbon cycle. In addition, rSOCs provide high efficiency through heat integration, support grid balancing, and combine hydrogen production and power generation in a single system with low emissions [1]. Compared with low-temperature technologies such as Proton Exchange Membrane (PEM) and alkaline electrolysis cells, rSOCs operate at higher temperatures, which enables faster electrochemical kinetics, higher electrical efficiency, and the possibility of integrating external heat sources. However, PEM and alkaline cells generally offer advantages in terms of lower operating temperatures, faster start-up, and greater technological maturity, making them more suitable for applications requiring dynamic operation [2].
Current state-of-the-art SOCs are fabricated using ceramic materials that ensure thermomechanical stability under high- and intermediate-temperature operating conditions (700–1000 °C) [1,2]. For high-temperature operation (≥800 °C), the most widely used materials include 8 mol% yttria-stabilized zirconia (8YSZ) as the electrolyte, a Ni–YSZ cermet as the fuel electrode, and strontium-doped lanthanum manganite (LSM) as the air electrode. Depending on the component that provides the mechanical support, the cells are typically classified as electrolyte- or fuel electrode-supported. They are fabricated using multistep conventional ceramic processing techniques, including tape-casting, extrusion, punching, and screen-printing. More recently, the rapid emergence and diversification of advanced manufacturing technologies has significantly broadened the fabrication landscape for SOCs. Beyond enabling greater geometric complexity, these technologies allow new ways to tailor electrode and electrolyte morphology, surface features, and microstructural characteristics to an extent not achievable with conventional methods [3]. Consequently, a wide variety of fabrication strategies have been explored to modify electrolyte geometry and surface properties, primarily to reduce electrolyte thickness (thereby lowering ohmic losses) and to increase the electrode–electrolyte interfacial area (thereby reducing polarization resistance). These developments have led to significant performance improvements through innovative techniques, including stereolithography for honeycomb and corrugated electrolytes [4,5], laser micro-patterning [6,7,8,9,10], inkjet-printed micro-pillars [11,12], lithography-based micro-molded structures [13,14], imprinted micro-patterns [15,16], screen-printed YSZ particles [17], plasma-sprayed surface roughening [15,18], thermally or spray-deposited YSZ particles [18,19], and mesh-pressed patterns on tape-cast YSZ electrolytes [20,21]. Among these advanced manufacturing technologies, 3D printing has emerged as a particularly promising approach for producing multi-material functional ceramics, including SOCs and monolithic catalysts [22,23,24,25,26]. In SOCs, this technology enables hierarchically designed architectures, while also simplifying manufacturing, reducing the number of processing steps, lowering initial investment, and improving overall production efficiency [25]. For instance, the fabrication and operation of 45 cm2 electrolyte-supported SOC stacks produced by 3D printing and coupled with thin metallic interconnects have recently been demonstrated in both SOFC and SOEC modes [26].
On the other hand, polymer and metal 3D printing has rapidly advanced over the past decade, moving from laboratory-scale use to industrial applications [27]. In particular, filament- and resin-based printing offers fast and low-cost prototyping with high production rates [28]. These techniques are also useful for producing complex polymer molds for ceramic processing routes such as tape-casting, slip-casting, or gel-casting, enabling highly customized component designs [29]. Mold-casting approaches can reduce manufacturing costs by minimizing the need for expensive machining operations, especially for components with complex geometries or internal features. Once optimized, mold designs can be easily scaled up for batch production, providing high reproducibility and improved efficiency. Moreover, the rapid fabrication and replacement of molds enhances design flexibility, shortens development cycles, and supports cost-effective industrial production of customized ceramic components. Aqueous gel-casting is particularly suitable for shaping ceramics and can overcome several limitations associated with conventional methods for complex geometries. One of its main advantages is its environmental friendliness, since many non-toxic and natural gel-forming agents can be processed in water-based systems. Different materials, such as agar and agarose [30], bovine serum albumin [31], albumen (e.g., egg white) [32], carrageenan [33], curdlan [34], gelatin [35], sodium alginate [36], starch [37], and hydratable alumina [38], have been successfully used as gel-formers. Previous studies have demonstrated the versatility of this process for producing both dense and porous ceramics with controlled microstructures, including functionally graded materials that combine dense and porous regions [39,40]. Gel-casting also offers short processing times, high production yields, and relatively inexpensive equipment [41], making it attractive for laboratory and industrial applications, including SOFC manufacturing [42]. This method has already been applied to the fabrication of anode supports for microtubular SOFCs [43,44,45] and planar SOFCs [46,47,48,49]. Therefore, combining gel-casting with 3D-printed complex molds represents a promising route for manufacturing dense YSZ electrolytes required in monolithic SOC systems.
In this work, electrolyte-supported solid oxide cells (SOCs) were fabricated, characterized, and electrochemically evaluated under both fuel cell (SOFC) and electrolysis (SOEC) operating modes. Planar 8YSZ electrolytes were manufactured by an aqueous gel-casting process using agarose as the gelling agent and 3D-printed molds. The electrolyte-supported cells were subsequently functionalized with Ni-YSZ fuel electrodes and LSM-YSZ air electrodes, resulting in Ni-YSZ/8YSZ/LSM-YSZ cells. While our previous study [49] demonstrated the feasibility of the aqueous gel-casting route for the fabrication of electrolyte-supported SOFCs, the present work extends that investigation by evaluating the electrochemical performance of newly fabricated cells featuring a thinner electrolyte (350 μm) under reversible operation. In particular, the cells were tested in both SOFC and SOEC modes, including reversible SOFC/SOEC cycling and durability experiments. These results provide a comprehensive assessment of the suitability of the proposed fabrication route for reversible SOC applications. All cell specimens, microstructural images, and electrochemical data presented in this work were newly and independently obtained specifically for the present study.
2. Materials and Methods
2.1. Cell Fabrication
Planar electrolyte-supported SOFCs were fabricated by aqueous gel-casting using commercial 8 mol% yttria-stabilized zirconia (TZ-8Y, Tosoh, Tokyo, Japan) as electrolyte material. Agarose (Sigma Aldrich, St. Louis, MO, USA) was used as the gelling agent, Dolapix PC75 as dispersant, and polyethylene glycol (PEG-400, Sigma Aldrich, St. Louis, MO, USA) as anti-foaming additive. According to a previous study [49], the ink employed for planar cell fabrication consisted of a suspension containing 48 vol% solid loading of TZ-8Y powder (specific surface area of 16 ± 3 m2 g−1 and d50 particle size of 0.40 µm), 0.6 wt% Dolapix PC75, 0.8 wt% agarose, and 0.2 wt% PEG-400. This formulation provided viscosities below 1 Pa·s at high shear rates and exhibited pseudoplastic behavior suitable for mold filling and defect-free gel casting. The suspensions also showed stable flow characteristics and homogeneous particle distribution, enabling the fabrication of crack-free green bodies with good dimensional stability. The agarose solution was previously dissolved in distilled water at 90 °C for 1 h and added to the slurry at temperatures above 60 °C to avoid premature gelation. The suspensions were ball-milled for 5 h to ensure homogeneous dispersion and suitable rheological behavior for casting.
The PLA molds used for gel-casting were designed with Autodesk Inventor Professional 2024, exported as STL files, and processed using Ultimaker Cura 4.4 slicing software. The molds were printed with a layer height of 0.2 mm and a printing speed of 50 mm s−1, using an Ender-3 S1 3D printer (Creality, Shenzhen, China). The green supports were demolded and dried at 25 °C under controlled humidity (80% relative humidity) for 24 h to prevent cracking, followed by sintering at 1550 °C for 2 h with heating and cooling rates of 2 °C min−1. Planar electrolytes with a thickness of approximately 350 μm were obtained. Complete cells were fabricated using optimized procedures. NiO–YSZ (1:1 vol%) and (La0.8Sr0.2)0.95MnO3−δ (LSM)–YSZ (1:1 vol%) inks were prepared from commercial powders (Sigma Aldrich, St. Louis, MO, USA), using ethanol as a solvent and 1 wt% polyvinylpyrrolidone (PVP) as a dispersant. LSM powder exhibited a specific surface area of 6 ± 2 m2 g−1 and d50 of 0.9 µm, whereas NiO powder presented a specific surface area of 5 ± 1 m2 g−1 and a d50 of 1.0 µm. The electrode inks were deposited onto the zirconia electrolytes by spray coating. The anode layer was sintered at 1400 °C for 2 h, while the cathode was sintered at 1200 °C for 2 h in air, both using heating and cooling rates of 3 °C min−1. The final button cells exhibited a diameter of approximately 19 mm, an electrolyte thickness of ~350 μm, electrode thicknesses of about 30 μm, and a 1.13 cm2 cathode active area.
2.2. Characterization of the Cells
All cell specimens characterized in this section were newly fabricated for this study. Microstructural images and electrochemical measurements reported herein were newly acquired to provide an original assessment of the thinner electrolyte cells under reversible operation. Microstructural characterization of the cells was carried out using a Field Emission Scanning Electron Microscopy (FESEM, Carl Zeiss, Oberkochen, Germany) equipped with backscattered electron (BSE), secondary electron (SE) and in-lens secondary electron (IL-SE) detectors. The relative density was evaluated by both the Archimedes method and the geometrical method based on sample mass and dimensions, with both approaches providing consistent values. The calculations were performed using the theoretical density of YSZ (5.96 g cm−3) as reference. Surface characterization of the YSZ supports was performed using a Confocal Laser Optical Profilometer (Olympus Lext OLS30, Tokyo, Japan) equipped with several lens objectives from ×10 to ×100. Electrochemical characterization was performed using an Open FlangesTM test set-up (Fiaxell, Lausanne, Switzerland). Gas tightness was ensured with phlogopite mica sealing, and a four-probe configuration was used with nickel wires at the anode and gold wires at the cathode. Nickel foam and gold mesh served as current collectors. To ensure reproducibility, at least three cells were independently fabricated and tested under the same conditions. The electrochemical performance was evaluated using three independently fabricated cells. The obtained results showed highly reproducible behavior, with comparable electrochemical performance among the three cells; therefore, representative data from one cell are presented. The cells were heated to 750 °C under synthetic air, followed by reduction in 5% H2–Ar and pure H2, and subsequently tested at 800, 850 and 900 °C under 100 mL min−1 cm−2 fuel with 25 N2/25 H2/50 H2O in SOEC mode and 67 H2/33 N2 in SOFC mode at the fuel electrode, and 150 mL min−1 cm−2 synthetic air at the oxygen electrode. Steam was generated using a temperature-controlled evaporator and mixed with the reactant gases. Gas flow rates were regulated by mass flow controllers to obtain the desired gas composition. Before each measurement, the system was stabilized at the target temperature and gas composition. To prevent steam condensation, all gas lines between the evaporator and the test cell were maintained above the steam dew point. I–V curves were recorded using a DC power supply (Keithley 2231A-30-3, Keithley Instruments, Solon, OH, USA) and a digital multimeter (Keysight U1253B, Keysight Technologies, Santa Rosa, CA, USA), scanning from OCV to 0.4 V. Electrochemical impedance spectroscopy (EIS) was carried out with a Metrohm Autolab PGSTAT204 (Metrohm Autolab B.V., Utrecht, The Netherlands) in the 100 kHz–0.1 Hz range with a 10 mV amplitude at 1.3 V in SOEC mode and 0.7 V in SOFC mode. Nyquist plots were fitted using equivalent circuits in ZView software v4. Mid-term aging tests (>400 h) were performed under SOFC mode. Moreover, reversibility cycling (from SOFC to SOEC and vice versa) was carried out using the same test station to completely characterize the produced cells and their reversible behavior.
3. Results and Discussion
3.1. Microstructural Characterization of Cell
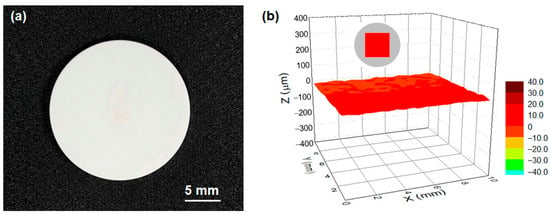
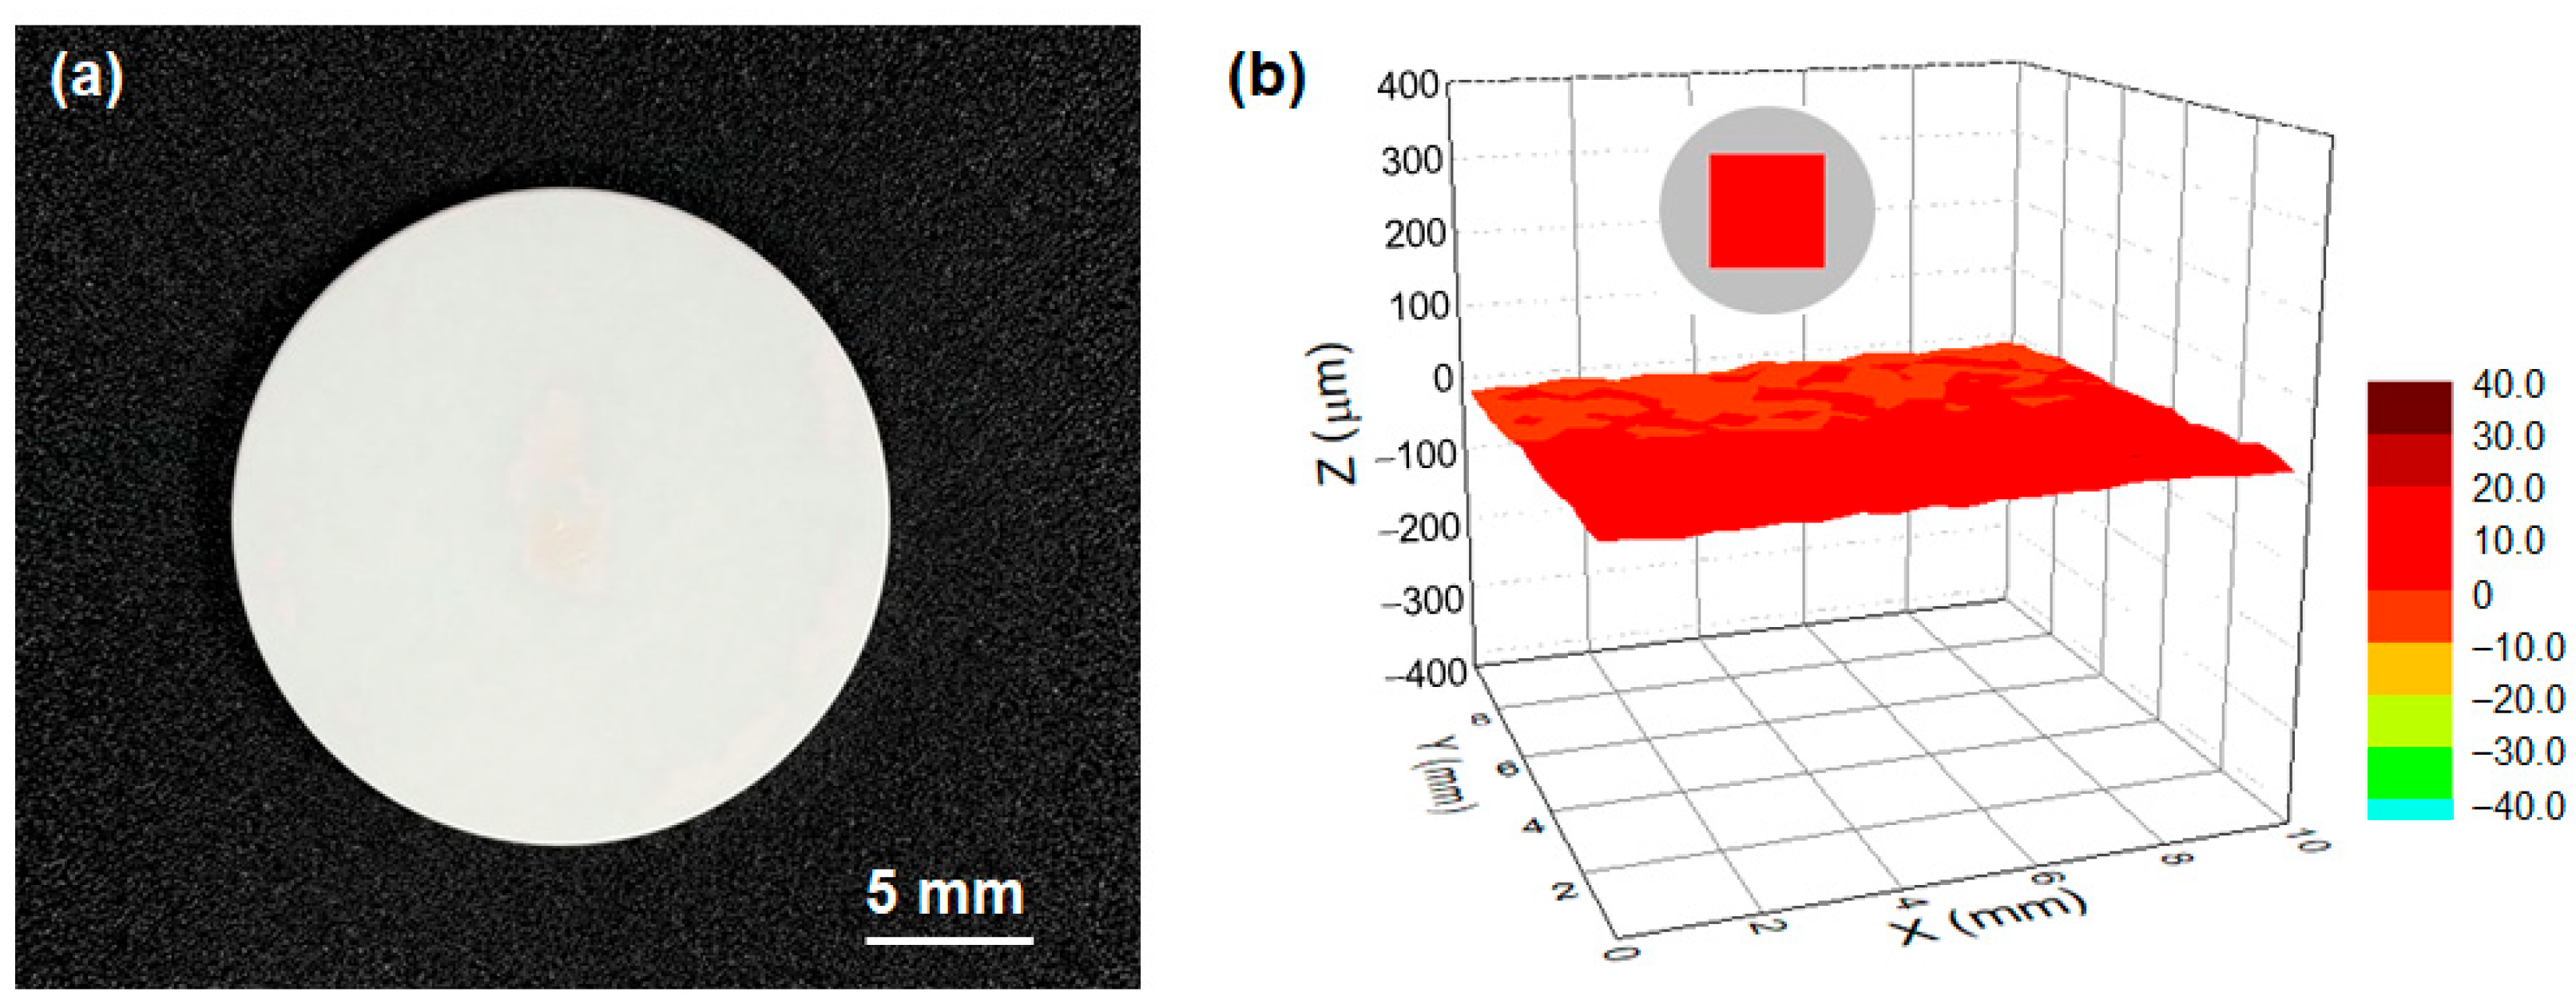
After the fabrication process, the YSZ electrolyte support was evaluated to verify its densification and surface quality, which are critical parameters for ensuring gas-tightness and stable electrochemical performance in SOCs. Figure 1 displays the macroscopic appearance and surface topography of the fabricated YSZ electrolyte. Figure 1a shows the dense YSZ electrolyte support, which exhibits a uniform and defect-free surface with good structural integrity after sintering. The circular geometry and homogeneous appearance indicate a successful fabrication process without visible cracks or warping. Figure 1b presents the surface topography obtained by confocal microscopy. The YSZ electrolyte surface appears relatively smooth and homogeneous, with only minor height variations distributed across the scanned area. The low surface roughness suggests effective densification during thermal treatment and provides favorable conditions for the subsequent deposition and adhesion of the electrode layers.
Figure 1.
(a) Image of a dense YSZ electrolyte support and (b) surface topography of the YSZ electrolyte performed by confocal microscopy.
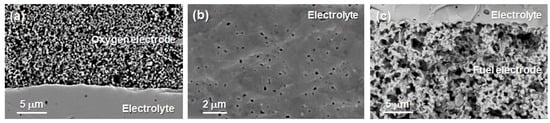
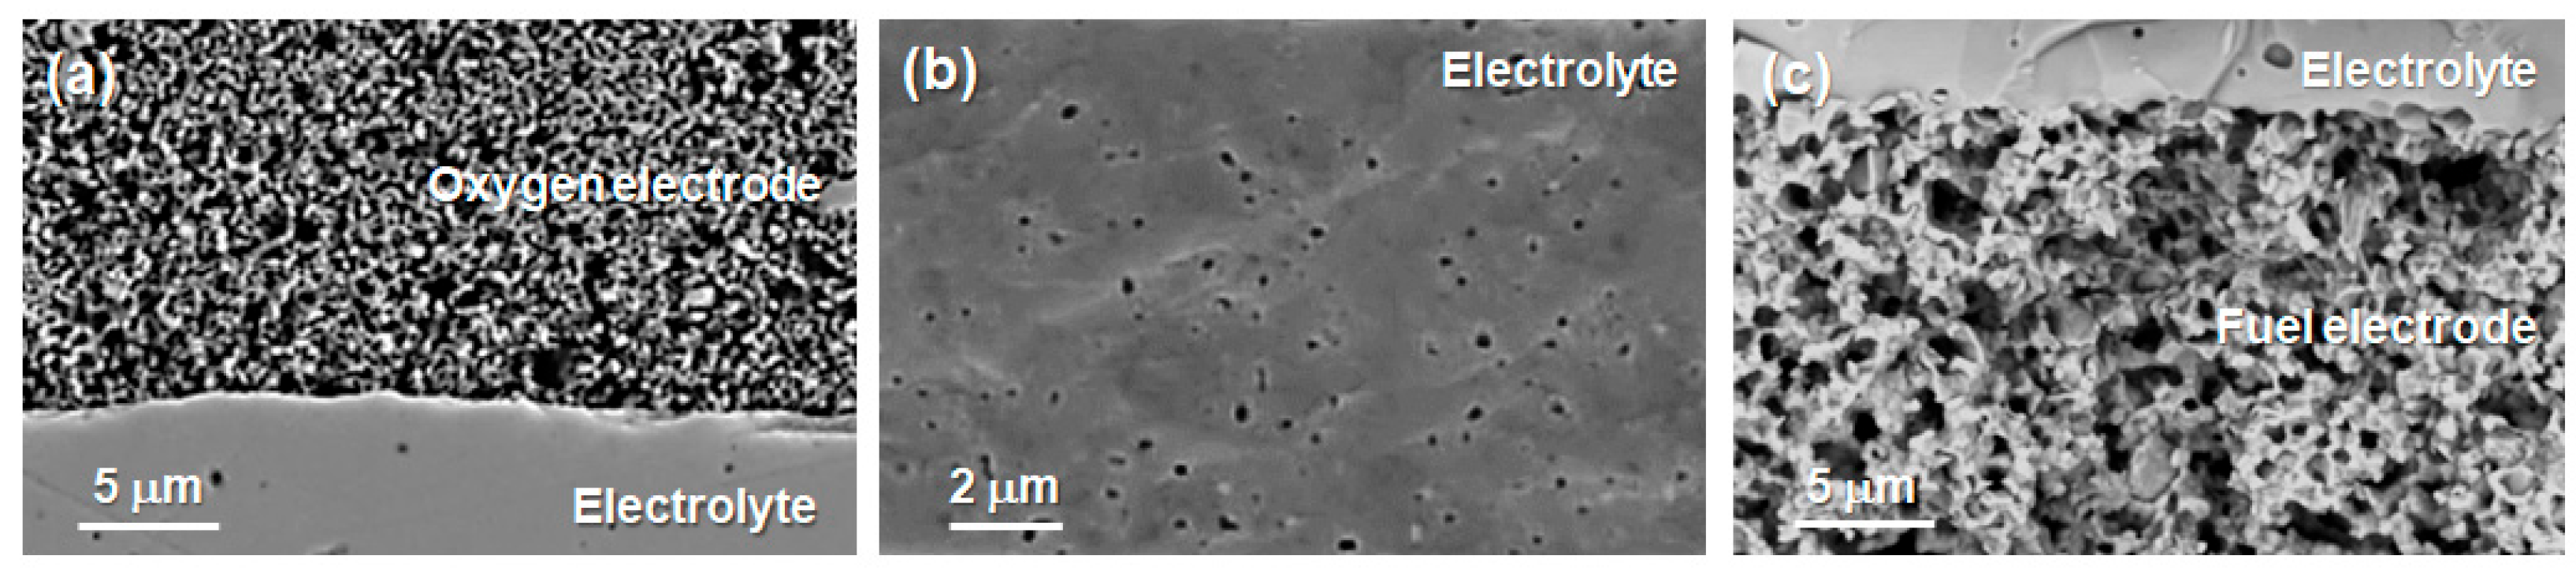
After fabrication of the dense YSZ electrolyte, the fuel and oxygen electrodes, composed of NiO–YSZ and LSM–YSZ, respectively, were sequentially deposited and thermally treated to ensure proper adhesion and microstructural integration within the complete SOC architecture. Figure 2 shows cross-sectional FESEM images of the complete SOC structure. As shown in Figure 2a, the LSM–YSZ oxygen electrode exhibits a porous and interconnected microstructure, favorable for oxygen diffusion and triple-phase boundary (TPB) formation. Good adhesion between the electrode and the dense YSZ electrolyte was observed, without visible cracks or delamination. Figure 2b reveals a dense and homogeneous YSZ electrolyte with minimal residual porosity, indicating successful densification to a relative density exceeding 96% (theoretical density = 5.96 g cm−3). This high degree of densification ensures adequate gas-tightness, which is essential for efficient oxygen-ion conduction. Additionally, the 3D surface profilometry analysis revealed a smooth and homogeneous electrolyte surface, with low micrometer-scale roughness (Ra = 1.7 ± 0.6 μm and Sa = 2.3 ± 0.8 μm), indicating limited surface irregularity and favorable conditions for electrode/electrolyte interfacial contact. As shown in Figure 2c, the Ni–YSZ fuel electrode presents a porous sponge-like morphology that promotes fuel diffusion and electrochemical activity. The interface with the electrolyte is continuous and well bonded, suggesting good structural compatibility.
Figure 2.
Cross-section FESEM images of a complete SOC showing: (a) the LSM–YSZ oxygen electrode interface with the electrolyte, (b) the dense YSZ electrolyte, and (c) the Ni–YSZ fuel electrode interface with the electrolyte.
3.2. Electrochemical Performance Under SOFC and SOEC Modes
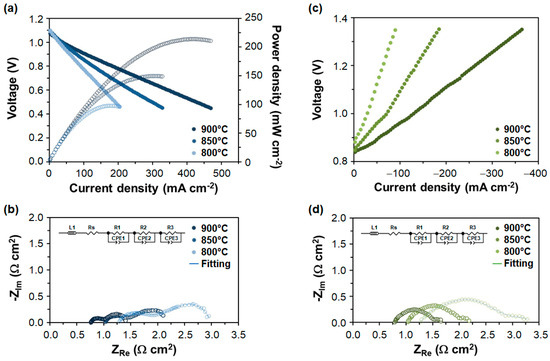
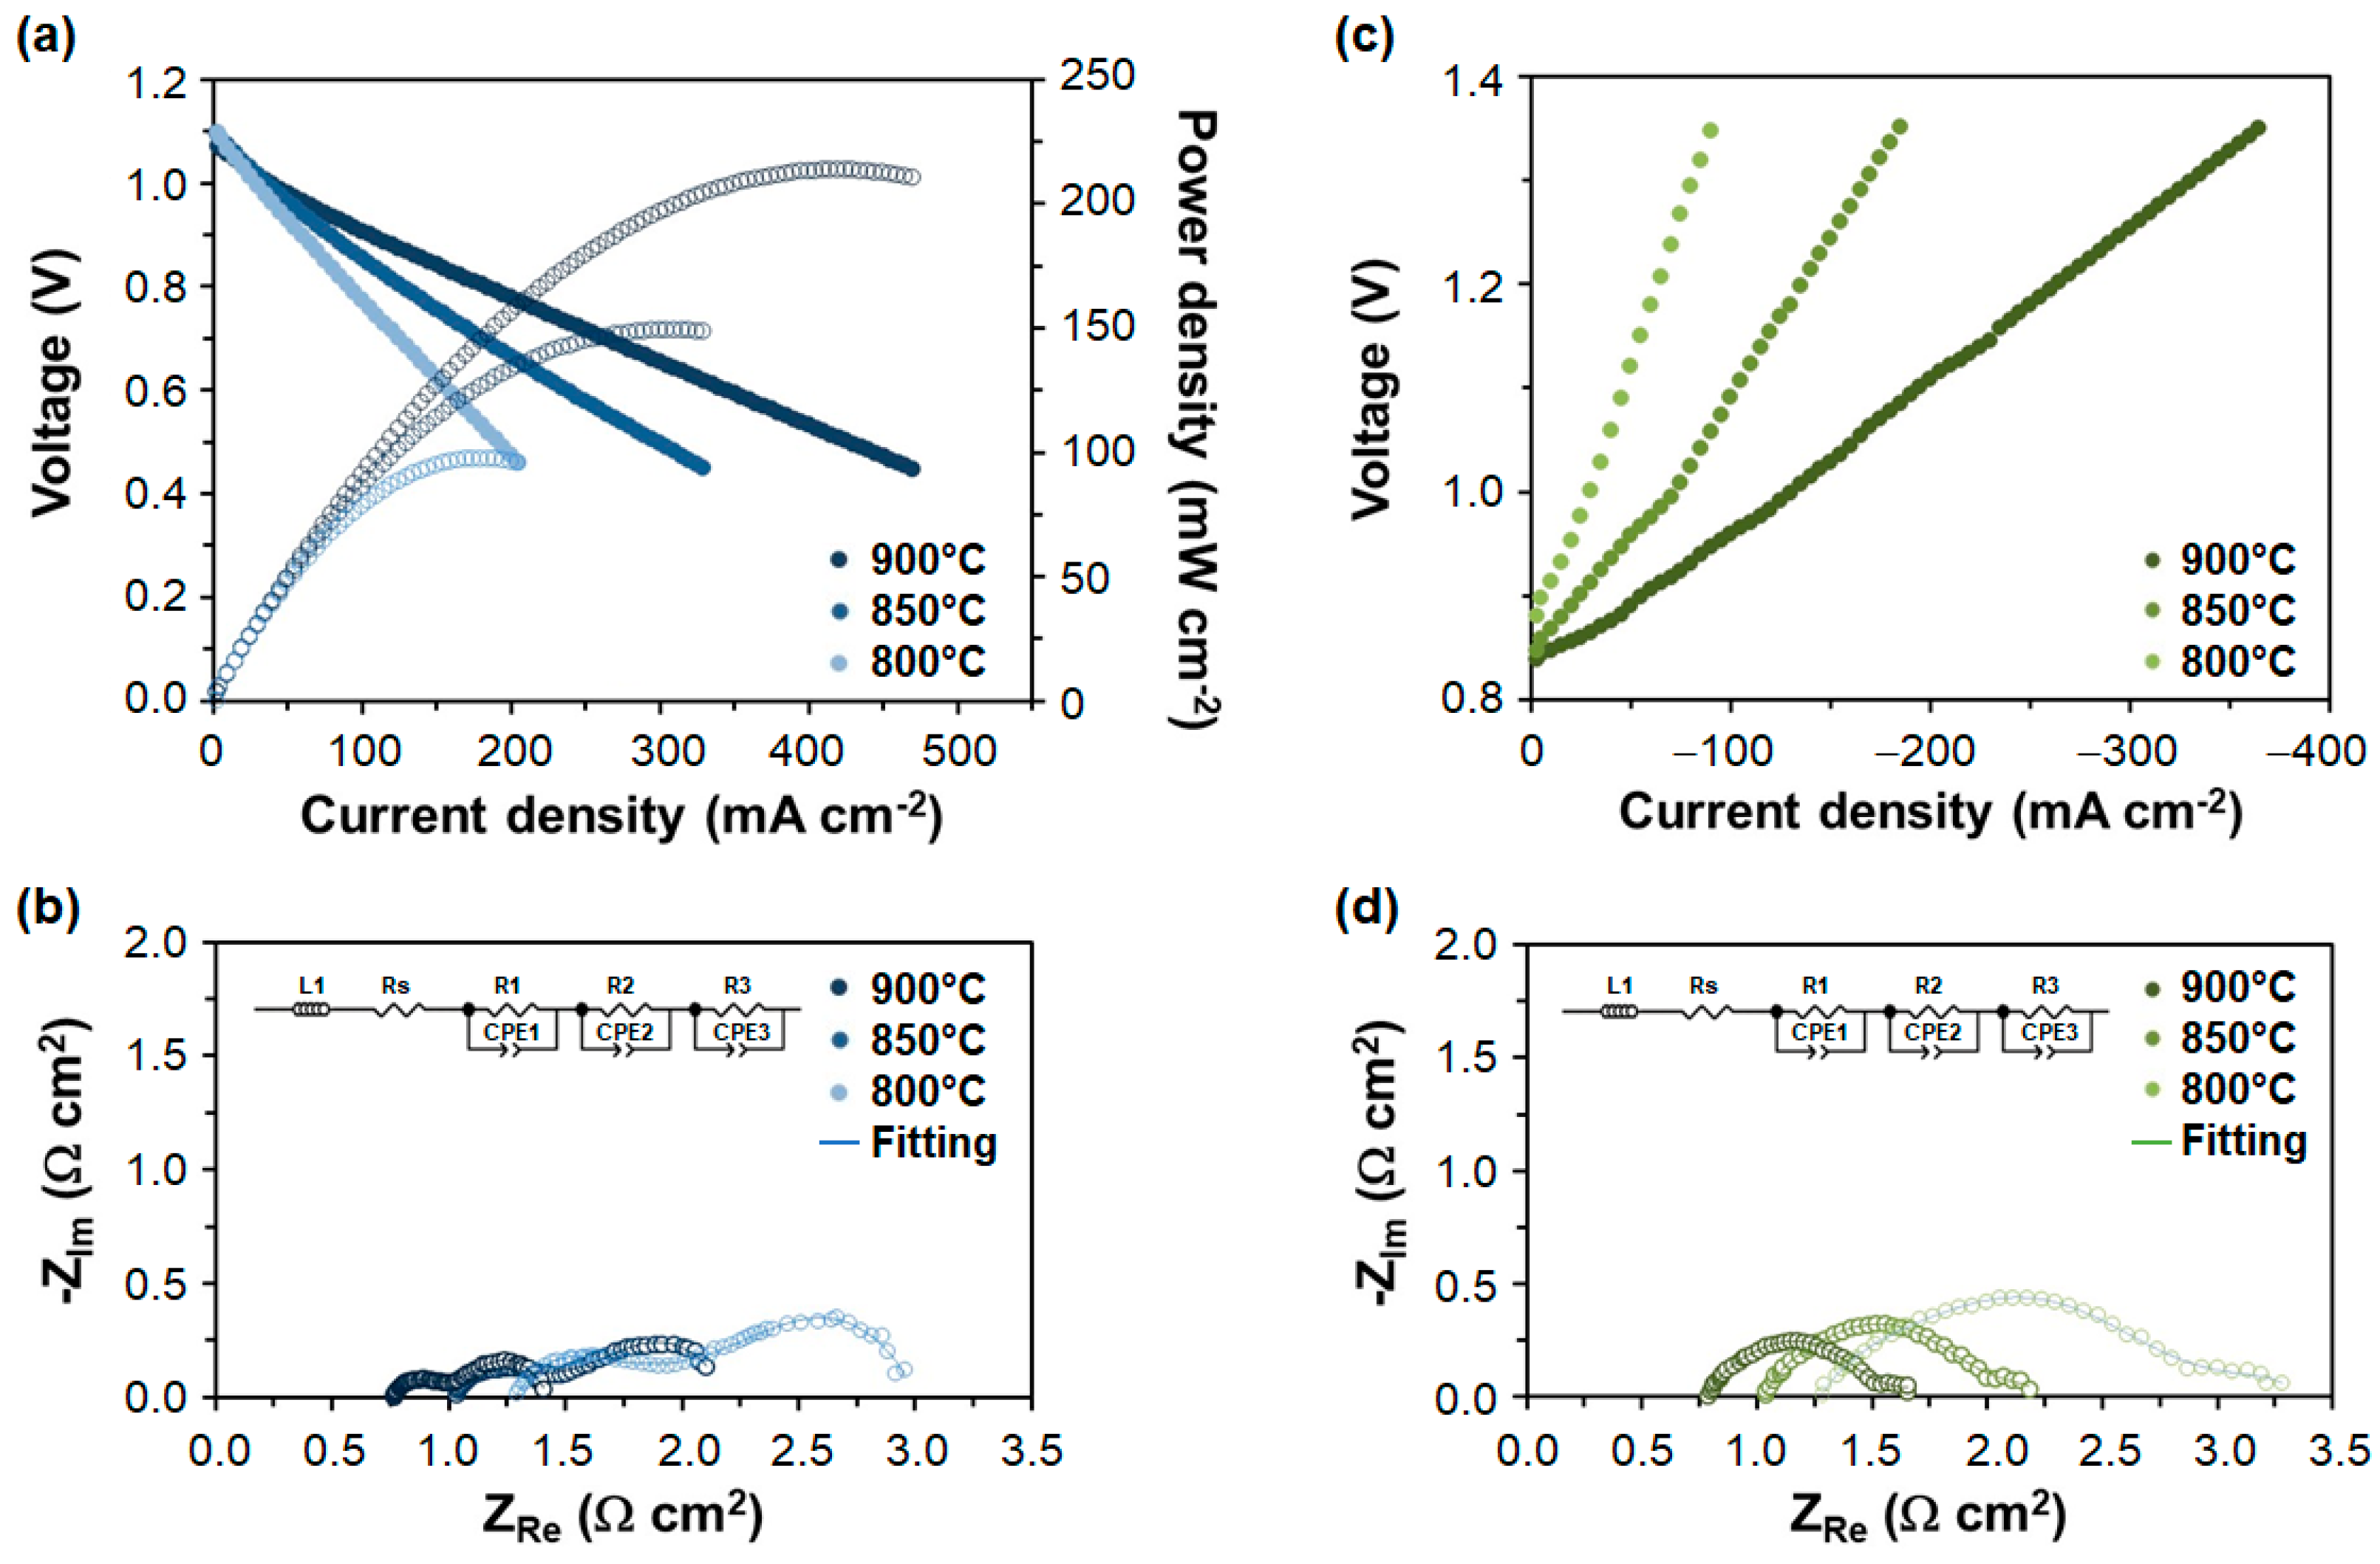
The electrochemical performance of the fabricated SOCs was evaluated in both fuel cell (SOFC) and electrolysis (SOEC) modes at different operating temperatures in order to analyze the effect of temperature on cell performance and polarization resistance. Figure 3 presents the V–I curves together with the corresponding electrochemical impedance spectroscopy (EIS) Nyquist plots obtained under SOFC and SOEC operating conditions.
Figure 3.
V–I curves and the corresponding Nyquist plots from EIS measurements represented for the SOFC mode at 0.7 V and SOEC mode at 1.3 V for the cells measured in: (a,b) SOFC mode and (c,d) SOEC mode at 900 °C, 850 °C and 800 °C under 100 mL min−1 cm−2 fuel with 50 H2O/25 H2/25 N2 in SOEC mode and 67 H2/33 N2 in SOFC mode at the fuel electrode, and 150 mL min−1 cm−2 synthetic air at the oxygen electrode.
In SOFC mode (Figure 3a), the open-circuit voltage (OCV) was approximately 1.08–1.10 V over the investigated temperature range, in close agreement with the values predicted by the Nernst equation. This result confirms the gas-tightness of the electrolyte and the effectiveness of the sealing arrangement employed during testing. As expected, cell performance improved with increasing temperature owing to enhanced ionic conductivity and faster electrode kinetics. The highest performance was obtained at 900 °C, reaching a maximum power density of approximately 220 mW cm−2 at a current density close to 450 mA cm−2. At 850 °C, the maximum power density decreased to around 150 mW cm−2, while a further reduction was observed at 800 °C, where values close to 100 mW cm−2 were obtained. The nearly linear behavior of the V–I curves suggests that the cell performance is largely governed by resistive losses. From the slope of the linear region of the polarization curves, an area-specific resistance (ASR) of approximately 1.4 Ω cm2 can be estimated at 900 °C. This value is close to the resistance expected for an 8YSZ electrolyte of comparable thickness (Rs = 1.2 Ω·cm2 [50]), further supporting the conclusion that the electrolyte provides the dominant contribution to the overall cell resistance. Consequently, the relatively large electrolyte thickness employed in this work is expected to impose a substantial ionic transport limitation, which ultimately constrains the attainable current densities and power output. The impedance spectra measured in SOFC mode (Figure 3b) support this interpretation. The obtained Nyquist arc plots were fitted using an equivalent electrical circuit (incorporated as the inset in Figure 3b), which represented a combination of an inductance (L), a serial resistance (Rs) and a series of three ZARC elements. Both the ohmic resistance, determined from the high-frequency intercept, and the polarization resistance increase progressively as the temperature decreases from 900 to 800 °C. Extracting the values by fitting the impedance spectra using an equivalent circuit model, the ohmic resistance rises from 0.72 Ω·cm2 at 900 °C to about 1.02 Ω·cm2 and 1.25 Ω·cm2 at 850 and 800 °C, respectively. Similarly, the polarization resistance increases from 0.66 Ω·cm2 at 900 °C to 1.17 Ω·cm2 at 850 °C and 1.63 Ω·cm2 at 800 °C. The relatively small impedance arc observed at 900 °C indicates fast electrode kinetics and efficient charge-transfer processes, whereas the larger arcs measured at lower temperatures reveal an increasing contribution from activation polarization and mass-transport limitations. The sum of the ohmic and polarization contributions at 900 °C (~1.38 Ω·cm2) agrees reasonably with the ASR estimated from the polarization curve (~1.4 Ω·cm2), confirming that resistive losses dominate the overall cell response.
Under SOEC operation (Figure 3c), OCV values close to 0.84 V were measured using the 50/25/25 H2O/N2/H2 gas mixture, again matching well the thermodynamic values predicted by the Nernst equation and confirming adequate cell sealing. Current density increased significantly with temperature, highlighting the beneficial effect of elevated temperatures on steam electrolysis. At an applied voltage of 1.3 V, current densities of approximately 340 mA cm−2, 180 mA cm−2 and 90 mA cm−2 were achieved at 900, 850 and 800 °C, respectively. These values are consistent with the expected behavior of electrolyte-supported cells, where the electrolysis performance is strongly influenced by the overall ohmic resistance. The corresponding impedance spectra obtained in SOEC mode (Figure 3d) exhibit trends similar to those observed in fuel-cell operation. A gradual increase in both ohmic and polarization resistances is observed as temperature decreases, resulting in lower electrolysis currents at a given applied voltage. Extracting the values by fitting the impedance spectra using an equivalent circuit model, the ohmic resistance rises from 0.77 Ω·cm2 at 900 °C to about 1.04 Ω·cm2 and 1.28 Ω·cm2 at 850 and 800 °C, respectively. Similarly, the polarization resistance increases from 0.83 Ω·cm2 at 900 °C to 1.23 Ω·cm2 at 850 °C and 1.91 Ω·cm2 at 800 °C. In addition, the impedance arcs recorded under SOEC conditions are slightly larger than those measured in SOFC mode, suggesting a greater kinetic contribution associated with the steam electrolysis reaction. Thus, the results demonstrate that temperature is the key parameter controlling cell performance, with operation at 900 °C providing the lowest total resistance and the highest power generation and hydrogen production rates.
The electrochemical performance reached at 900 °C is consistent with that typically reported for electrolyte-supported reversible solid oxide cells employing relatively thick YSZ electrolytes. For example, previous studies have reported maximum power densities of ~260 mW cm−2 for a planar button cell with a 250 µm thick YSZ electrolyte [5], ~200 mW cm−2 for a cell with a 350 µm thick electrolyte [25], and 320 mW cm−2 for a cell with an approximately 200 µm thick electrolyte [20,21], all measured at 900 °C. Under SOEC operation, a current density of ~420 mA cm−2 at 1.3 V has been reported for a cell with a 250 µm thick YSZ electrolyte [5]. In the present work, operating at 900 °C, the electrolyte-supported cell reached a maximum power density of 220 mW cm−2 in SOFC mode and an electrolysis current density of 340 mA cm−2 at 1.3 V. Although these values are lower than those reported in the literature, the performance remains within the expected range for electrolyte-supported cells with a 350 µm thick electrolyte. The lower performance can be primarily attributed to the higher ohmic resistance associated with the electrolyte, whereas thinner electrolytes significantly reduce this contribution. Indeed, the measured ASR of ~1.4 Ω cm2 confirms that electrolyte resistance is the dominant factor limiting the electrochemical performance under both SOFC and SOEC operating conditions.
3.3. Reversibility Performance and Cycling Under SOFC/SOEC Modes
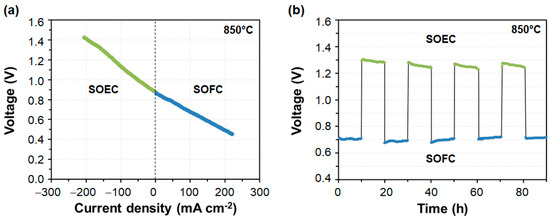
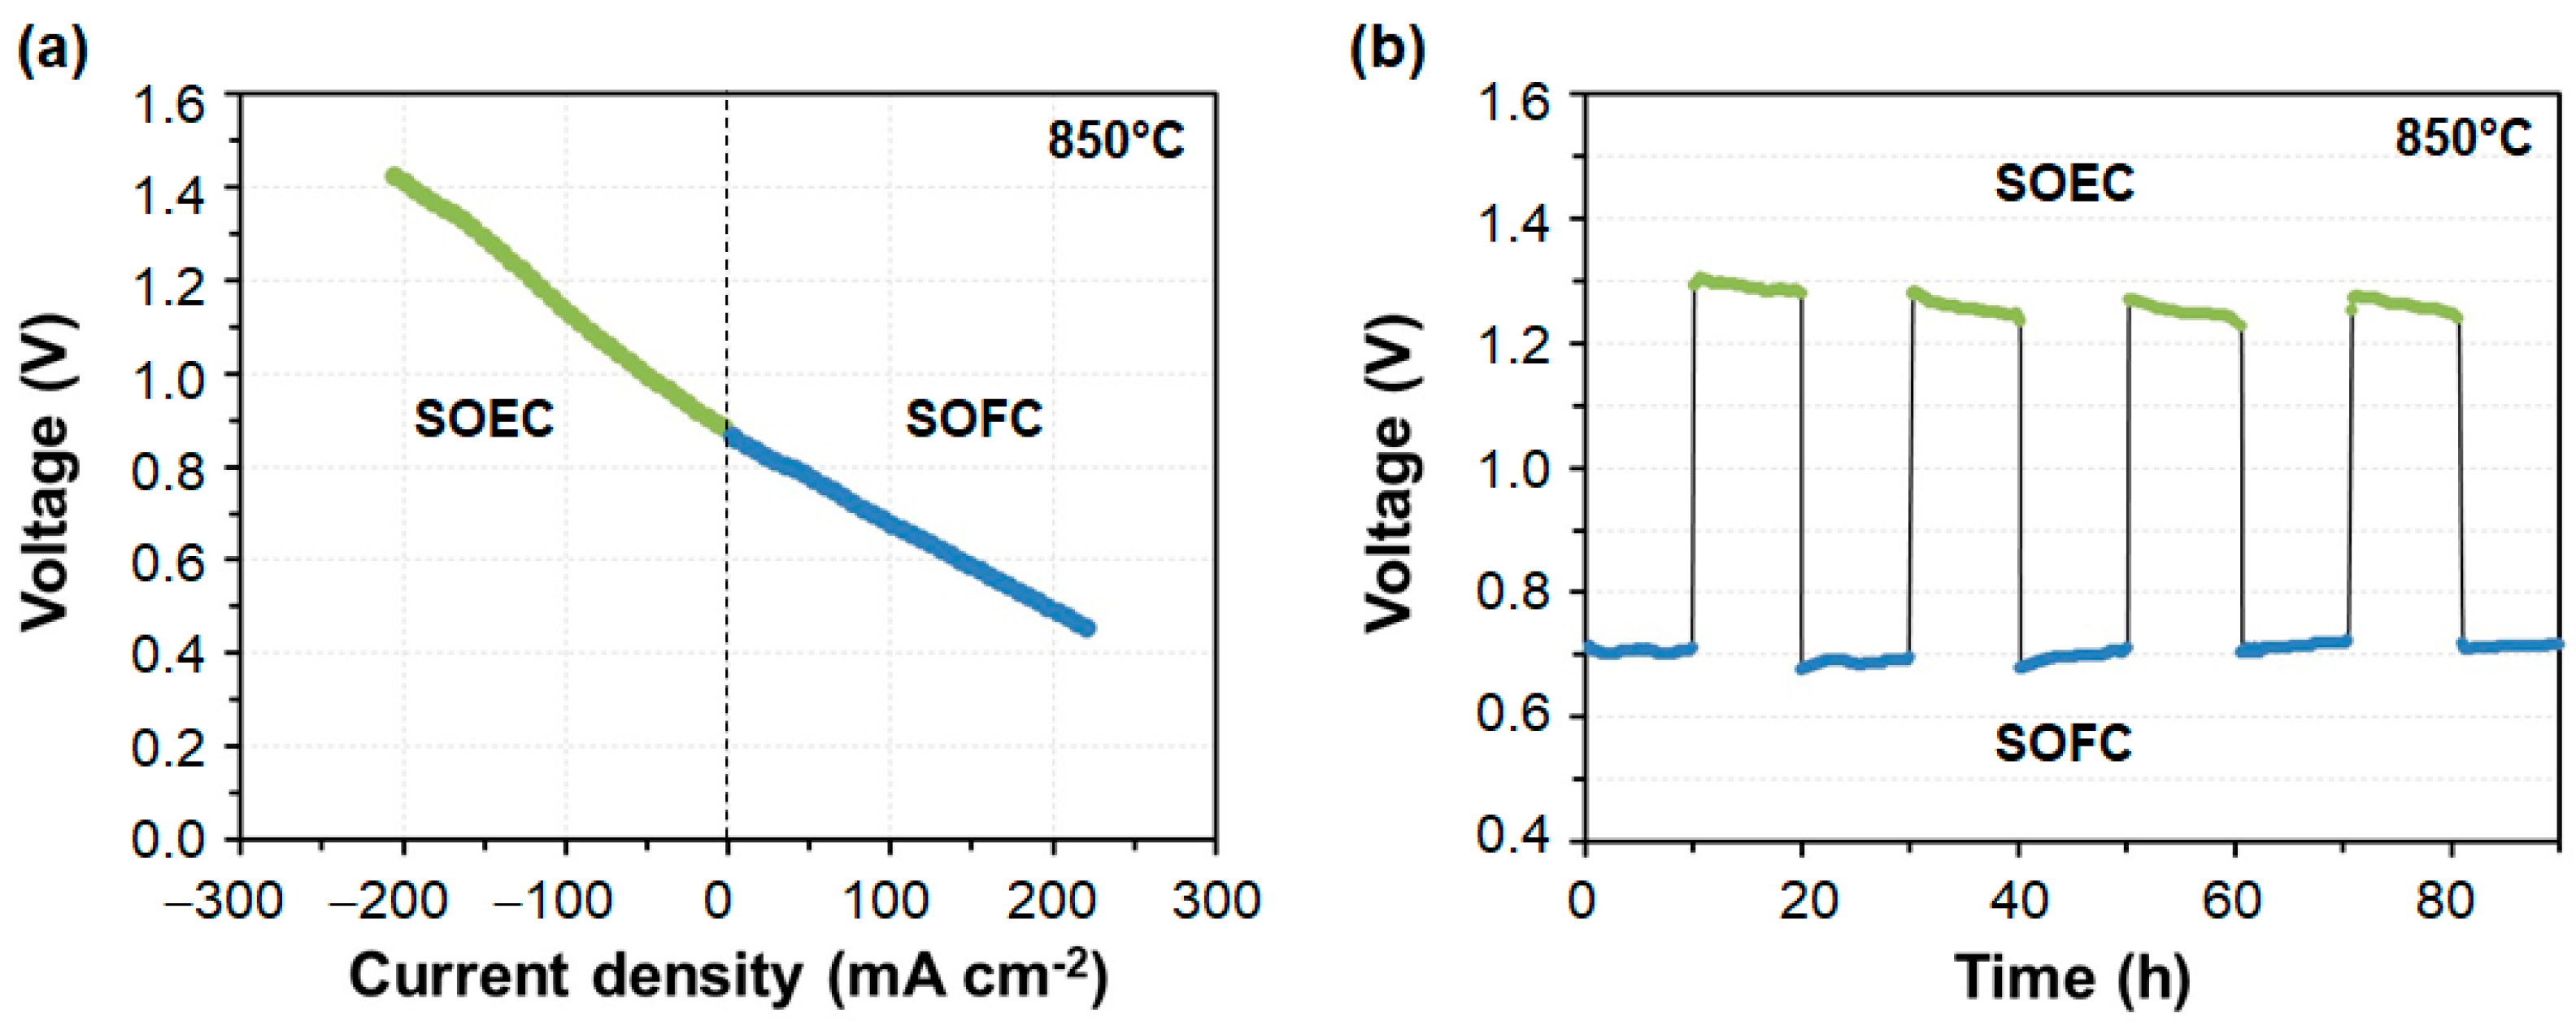
To evaluate the reversible operation capability of the SOCs, electrochemical measurements were conducted under both fuel cell (SOFC) and electrolysis (SOEC) operating modes at 850 °C. Figure 4 demonstrates not only the electrochemical reversibility of the device through the transition between negative and positive current densities, but also its operational stability during repeated switching between SOEC and SOFC conditions. In addition, the cycling test provides insight into the robustness of the electrode/electrolyte interfaces and the ability of the SOC to maintain a stable voltage response under alternating operating conditions. Figure 4a presents the I–V characteristics measured in both SOEC and SOFC modes under identical temperature conditions. The SOC exhibits a continuous and reversible transition between electrolysis and fuel cell operation, with the open-circuit voltage located close to 0.9 V. In SOEC mode, negative current densities up to approximately −200 mA cm−2 were achieved at voltages approaching 1.4 V, indicating efficient steam electrolysis activity under the supplied H2/H2O/N2 atmosphere. Conversely, in SOFC mode, the cell delivered positive current densities close to 250 mA cm−2 while the voltage decreased to nearly 0.4 V, confirming effective electrochemical oxidation of hydrogen and power generation capability. The relatively linear behavior observed in both operating regions confirms that the polarization losses are mainly dominated by ohmic contributions, while no abrupt voltage drop or mass transport limitation is detected within the explored current density range. Moreover, the smooth transition around zero current density indicates good reversibility of the electrochemical reactions and stable electrode kinetics under both anodic and cathodic polarization. The comparable slopes observed in SOEC and SOFC operation further suggest that the electrode architecture remains electrochemically active in both directions, which is a key requirement for reversible SOC applications.
Figure 4.
(a) I–V curves of the SOC measured at 850 °C in SOEC and SOFC modes. A steam/H2/N2 mixture (50/25/25 molar ratio) was supplied to the fuel electrode in SOEC mode, and H2/N2 (67/33 molar ratio) in SOFC mode, both at 100 mL min−1 cm−2. Synthetic air was supplied to the oxygen electrode at 150 mL min−1 cm−2. (b) Voltage evolution during reversible cycling at 850 °C, at −150 mA cm−2 in SOEC mode and 175 mA cm−2 in SOFC mode, switching the fuel-electrode atmosphere between SOEC and SOFC conditions for 90 h.
Figure 4b shows the galvanostatic cycling stability during alternating SOEC and SOFC operation over approximately 90 h. The SOC was operated at −150 mA cm−2 in electrolysis mode and at 175 mA cm−2 in fuel cell mode, while the fuel-side atmosphere was periodically switched between steam-containing and dry H2/N2 mixtures. The voltage response remained stable and highly reproducible during all cycles, demonstrating good reversibility of the cell under alternating operating conditions. No significant hysteresis was observed during the successive transitions between SOEC and SOFC operation, indicating that the mode switching itself did not induce any measurable irreversible effects. Beyond this reversible behavior, a slight improvement in performance was observed in both operation modes throughout the cycling test. In SOEC mode, the operating voltage gradually decreased from approximately 1.30 V to 1.25 V at constant current, whereas in SOFC mode the voltage increased from around 0.70 V to 0.73–0.74 V. These changes indicate a reduction in the overall polarization losses and improved electrochemical activity during operation. The slight performance enhancement observed under reversible operation may be attributed to the microstructural evolution that typically occurs during the initial stages of cell operation, or to other reversible processes reported in the literature, such as self-healing effects [51,52]. While these interpretations are plausible, further experimental evidence is required to identify the underlying mechanisms. In any case, the cell exhibited stable performance in both SOFC and SOEC modes throughout the duration of the cycling test, with no evidence of significant degradation or irreversible voltage drift.
3.4. Mid-Term Operation Performance Under SOFC Mode
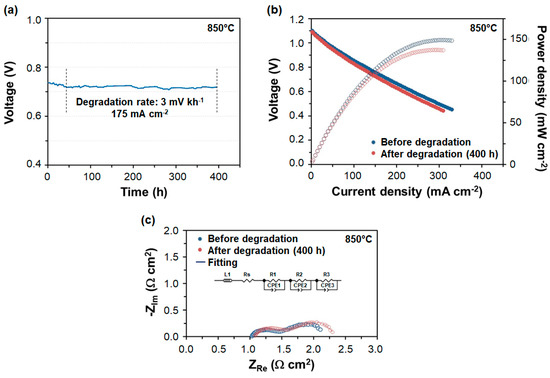
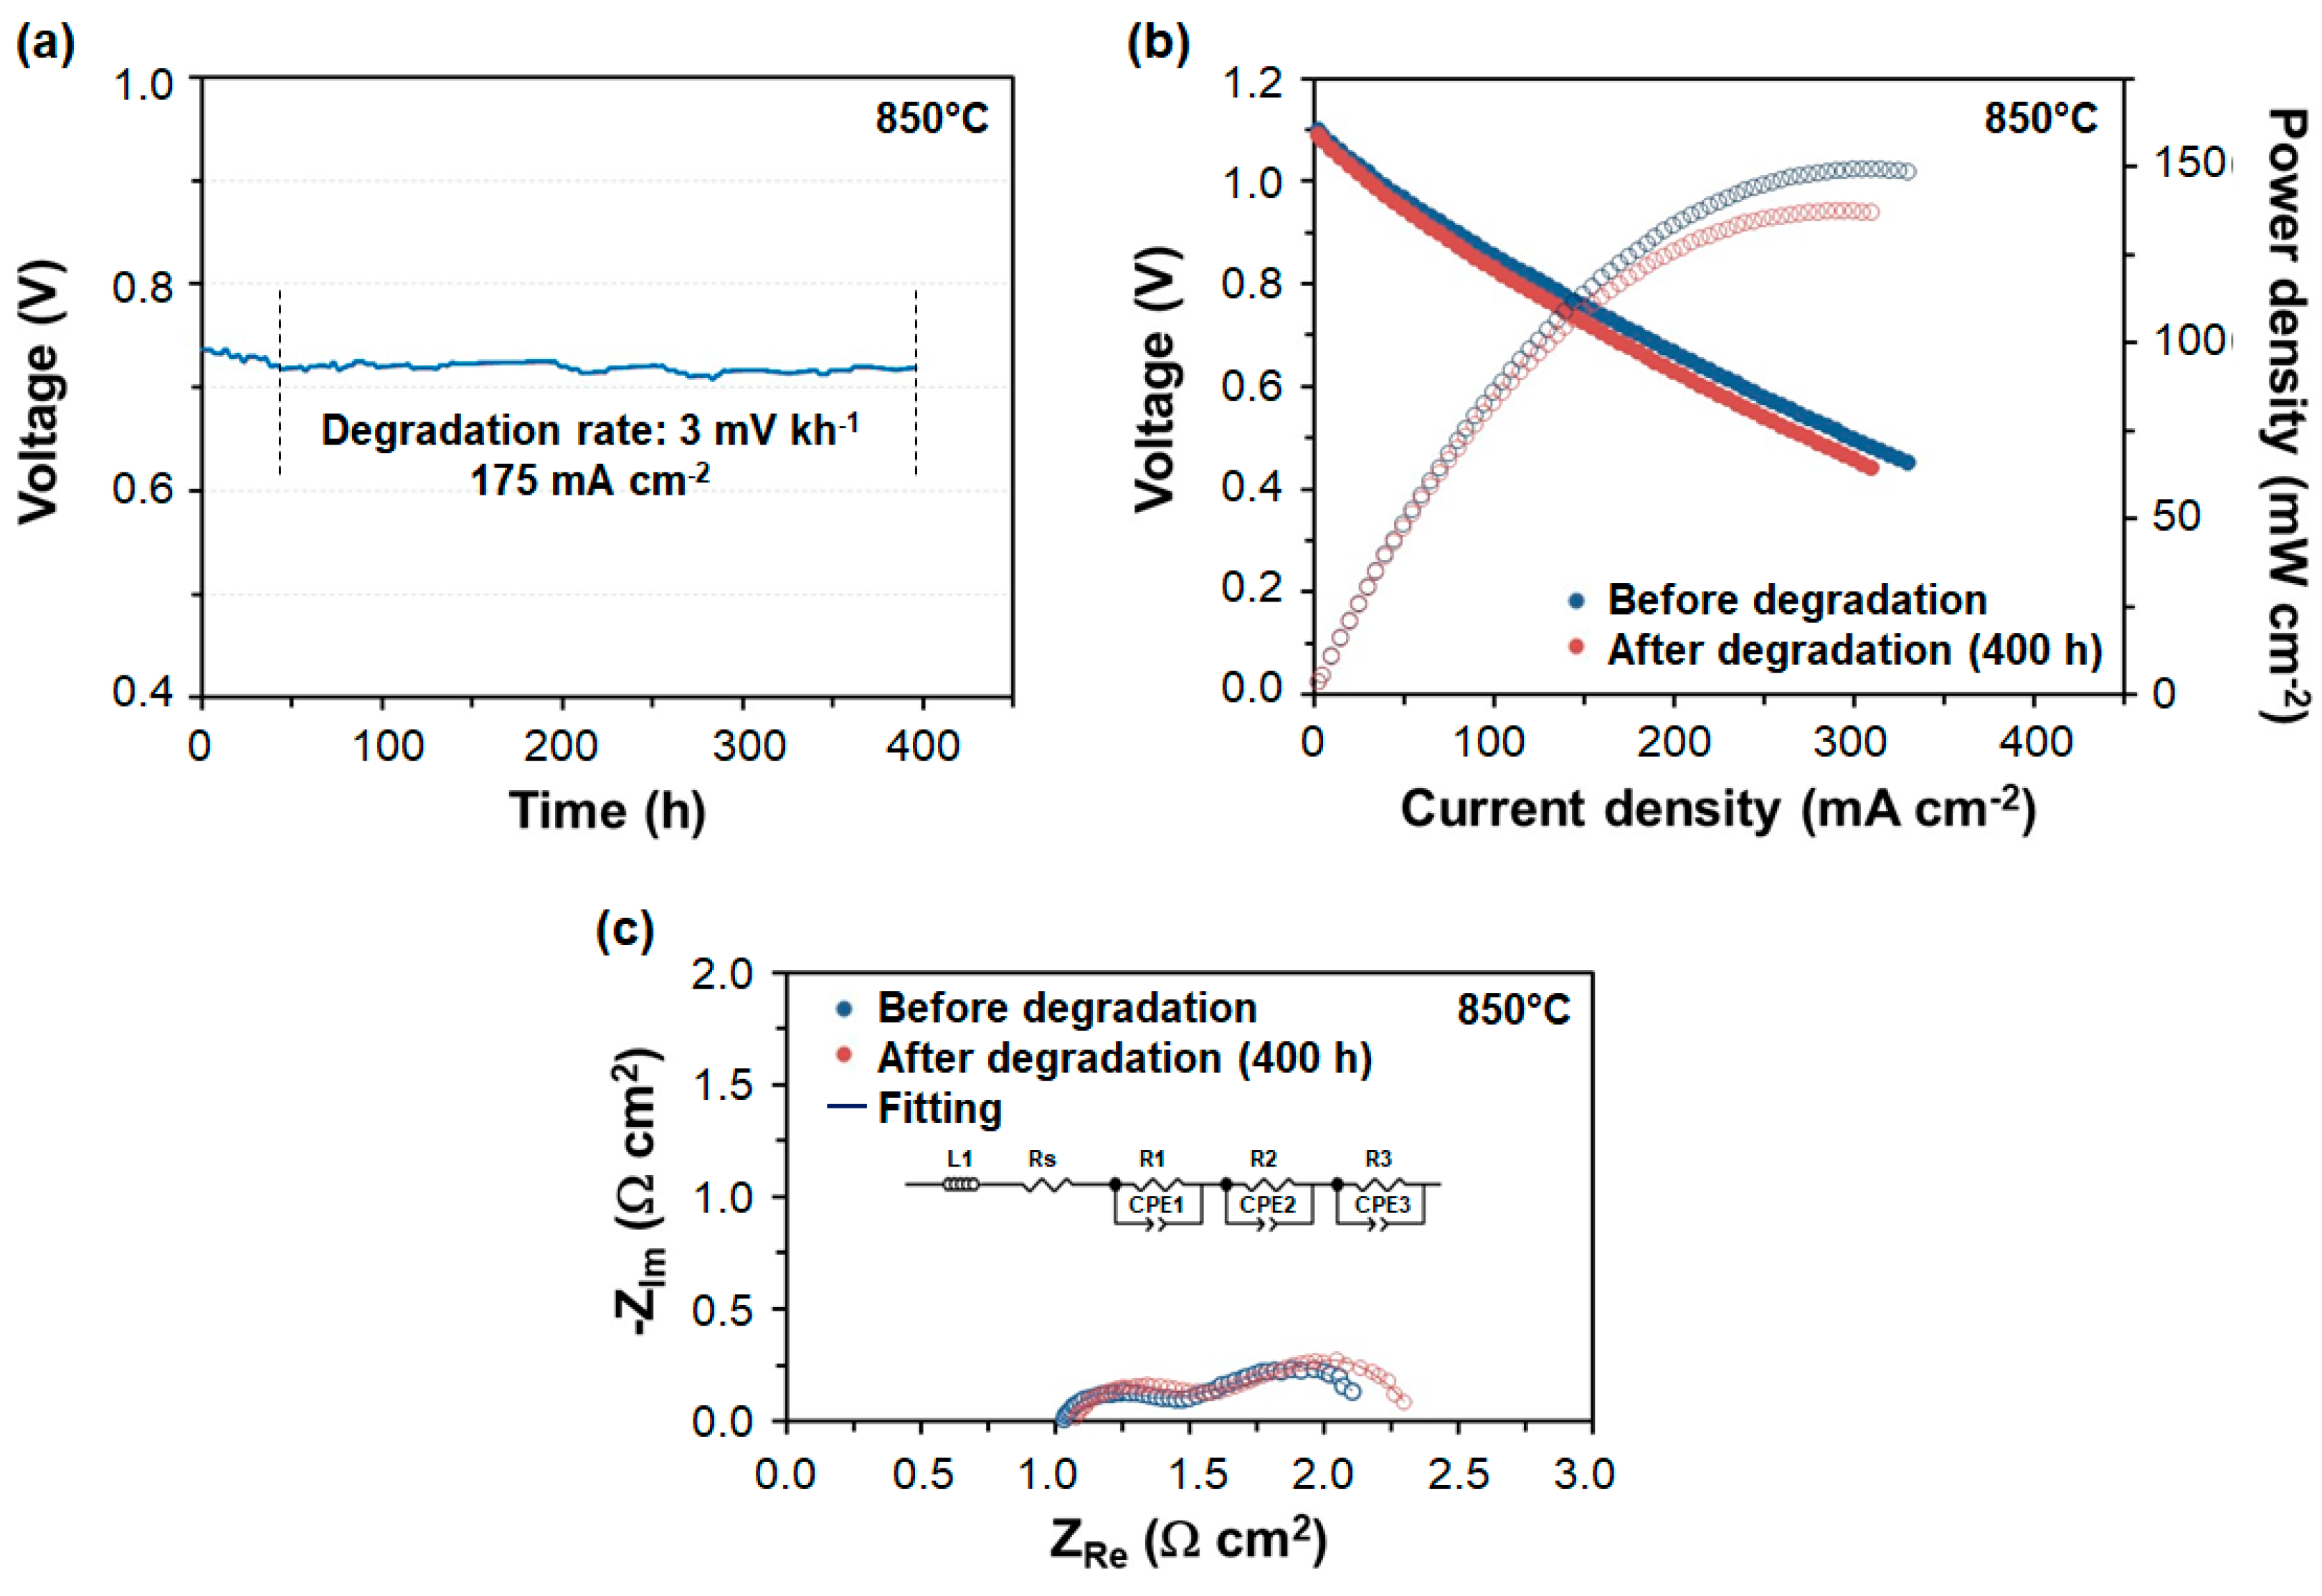
To analyze the evolution of the electrochemical performance during prolonged operation and to identify possible degradation phenomena through I–V and EIS measurements before and after the durability test, mid-term stability of the cell operating in SOFC mode at 850 °C under galvanostatic conditions was carried out. In this regard, the evolution of the operating voltage over time, together with the corresponding I–V and EIS analyses, provides valuable information about the stability of both ohmic and polarization contributions during cell operation (Figure 5). As shown in Figure 5a, the cell operated stably for approximately 400 h at 175 mA cm−2, maintaining a voltage close to 0.72–0.73 V. After an initial voltage decay, a slight recovery was observed between 150 and 300 h, possibly related to self-healing effects or microstructural rearrangements improving electrode/electrolyte interfaces. The degradation rate between 50 and 400 h was 3 mV kh−1 (0.4% kh−1), demonstrating good electrochemical stability throughout the test period. Overall, these results serve as a proof-of-concept demonstration, showing that the fabricated cells exhibit stable electrochemical performance. Although direct comparisons are limited by differences in cell architecture and operating conditions, the observed degradation rates are within the range reported for cells produced by other advanced manufacturing techniques [5,26,52,53,54,55]. For instance, previous works reported a degradation rate of <5.0% kh−1 at 850–900 °C during the stable period for 3D-printed electrolyte-supported cells [5,26]. Other studies exhibited degradation rates below 0.5% kh−1 at 900 °C for tape-cast electrolyte-supported cells [52,53], while negligible degradation during the stable operating period has been observed at 750 °C for tape-cast anode-supported cells [54,55]. The I–V curves in Figure 5b reveal only minor performance losses after the degradation test. The maximum power density decreased slightly from about 160 to 145 mW cm−2 after 400 h of operation. These results indicate that the cell largely preserved its electrochemical activity after the mid-term test. The Nyquist plots in Figure 5c show only moderate changes after operation. The ohmic resistance remained nearly constant at around 1.0 Ω cm2, whereas the total impedance increased slightly from approximately 2.2 to 2.5 Ω cm2. The enlargement of the low-frequency arc suggests a moderate increase in polarization resistance, likely associated with electrode-related processes such as gas diffusion or surface activity changes.
Figure 5.
(a) Mid-term evolution of a cell operated at 850 °C in galvanostatic SOFC mode at current density of 175 mA cm−2 under 67 H2/33 N2 at 100 mL min−1 cm−2 and 150 mL min−1 cm−2 of synthetic air atmospheres, (b) I–V curves and (c) the corresponding Nyquist plots from EIS measurements represented at 0.7 V in SOFC mode for the cell measured before and after the degradation test.
3.5. Post-Test Microstructural Analysis
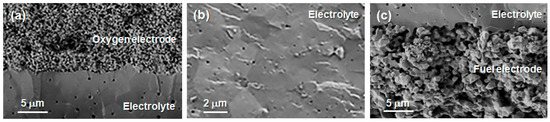
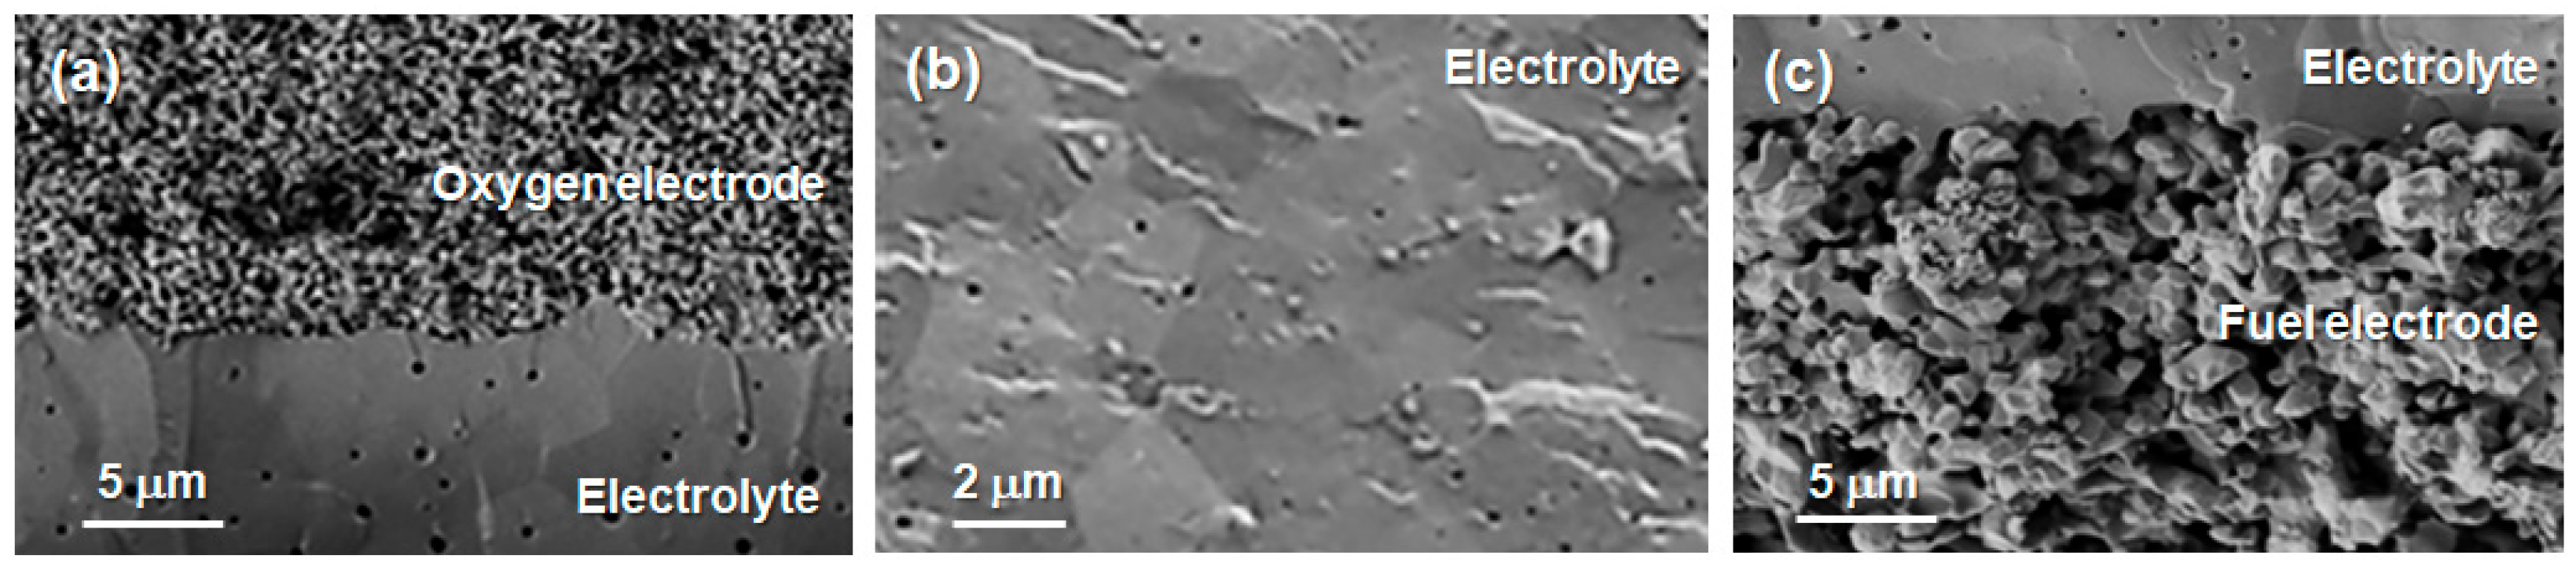
To complement the electrochemical stability results discussed previously, post-test microstructural characterization was carried out in order to identify the degradation mechanisms of the cell components and the electrode/electrolyte interfaces after mid-term SOFC operation (Figure 6). Figure 6a displays the cross-sectional SEM image of the oxygen electrode–electrolyte interface. A good interfacial contact was maintained after operation, without evident delamination or crack formation, indicating good adhesion between the oxygen electrode and the YSZ electrolyte. Figure 6b illustrates the electrolyte region, where the YSZ remains dense and homogeneous, with no visible microcracks or structural degradation. Only minor surface irregularities and isolated pores were observed, suggesting that the electrolyte preserved its structural integrity throughout the durability test. This observation is consistent with the small increase in ohmic resistance obtained from the EIS measurements. The fuel electrode–electrolyte interface is shown in Figure 6c. The fuel electrode maintained its porous morphology, which is essential for gas diffusion and electrochemical activity. No significant interfacial detachment or large voids were observed, confirming the stability of the electrode/electrolyte contact under the operating conditions. Although minor local heterogeneities and variations in porosity were detected near the interface, no severe microstructural degradation was identified. These results agree with the relatively small increase in polarization resistance observed after the durability test.
Figure 6.
SEM cross-section micrographs of (a) electrolyte–oxygen-electrode interface, (b) electrolyte–, and (c) electrolyte–fuel-electrode interface after 400 h of operation under SOFC mode at a current density of 175 mA cm−2 in (H2 + N2)/synthetic air atmospheres.
4. Conclusions
This work provides a proof-of-concept demonstration of the aqueous mold-casting/gel-casting fabrication approach by evaluating newly fabricated electrolyte-supported SOCs with a 350 µm thick electrolyte under reversible operating conditions. The results provide evidence of the feasibility of this cell configuration for reversible SOFC/SOEC operation, including cycling and durability testing. The dense YSZ electrolyte exhibited good gas tightness and remarkable adhesion to the porous Ni–YSZ fuel electrode and LSM–YSZ oxygen electrode, resulting in a well-integrated cell architecture. Electrochemical measurements revealed that cell performance strongly depended on temperature, with the best response obtained at 900 °C due to enhanced ionic conductivity and faster electrode kinetics. Under reversible operation at 850 °C, the SOC achieved current densities of 175 mA cm−2 in SOFC mode and −150 mA cm−2 in SOEC mode, exhibiting stable and reproducible switching behavior for 90 h of cycling. During mid-term SOFC operation at 175 mA cm−2 and 850 °C, the cell exhibited stable performance over 400 h, with a degradation rate of only 3 mV kh−1 (0.4% kh−1) after the initial stabilization period. Moreover, the maximum power density decreased only slightly from about 160 to 145 mW cm−2 after the durability test. Post-test SEM characterization confirmed the preservation of the electrolyte density and electrode porosity, with no significant cracks, delamination, or interfacial degradation observed after prolonged operation. These results demonstrate the feasibility of the proposed fabrication route and provide a proof-of-concept for producing electrolyte-supported reversible SOCs with reliable electrochemical performance under both SOFC and SOEC operating modes, thereby supporting its potential for reversible energy conversion and storage applications.
Author Contributions
Conceptualization, M.M., R.T. and A.H.; methodology, M.M., V.R. and R.T.; software, V.R. and R.T.; validation, M.M., V.R. and A.H.; formal analysis, M.M., V.R., R.T. and A.H.; investigation, M.M., V.R., R.T. and A.H.; resources, M.M. and A.H.; data curation, M.M., R.T. and A.H.; writing—original draft preparation, M.M.; writing—review and editing, V.R., R.T. and A.H.; visualization, M.M. and R.T.; supervision, M.M. and A.H.; project administration, M.M.; funding acquisition, M.M. and A.H. All authors have read and agreed to the published version of the manuscript.
Funding
This work was partially funded by the Erasmus Mundus Joint Master Program Hydrogen Systems and Enabling Technologies (HySET), and the work was carried out at the UPC Hydrogen Laboratory with support from the GreenSelfO2 (2025_OVT_279032) project funded by Ajuntament de Barcelona and Fundació La Caixa. This work was part of the Maria de Maeztu Units of Excellence Programme CEX2023–001300-M funded by MCIN/AEI/10.13039/501100011033. Additional funding was also received from the AGAUR (Agency for Administration of University and Research), under grant numbers 2021 SGR 01045 and 01053. M.M. is a Serra Húnter Fellow (Generalitat de Catalunya).
Data Availability Statement
The original contributions presented in this study are included in the article. Further inquiries can be directed to the corresponding author.
Acknowledgments
The authors thank Alejandro Martínez and Casimir Casas for their assistance during this research.
Conflicts of Interest
The authors declare no conflicts of interest.
References
- Singhal, S.C.; Kendall, K. High-Temperature Solid Oxide Fuel Cells: Fundamentals, Design, and Applications; Elsevier: Oxford, UK, 2003; p. 405. [Google Scholar]
- Qasem, N.A.A.; Abdulrahman, G.A.Q. A Recent Comprehensive Review of Fuel Cells: History, Types, and Applications. Int. J. Energy Res. 2024, 2024, 7271748. [Google Scholar] [CrossRef] [Scilit]
- Ruiz-Morales, J.C.; Tarancón, A.; Canales-Vázquez, J.; Méndez-Ramos, J.; Hernández-Afonso, L.; Acosta-Mora, P.; Marín Rueda, J.R.; Fernández-González, R. Three dimensional printing of components and functional devices for energy and environmental applications. Energy Environ. Sci. 2017, 10, 846–859. [Google Scholar] [CrossRef] [Scilit]
- Masciandaro, S.; Torrell, M.; Leone, P.; Tarancón, A. Three-dimensional printed yttria-stabilized zirconia self-supported electrolytes for solid oxide fuel cell applications. J. Eur. Ceram. Soc. 2019, 39, 9–16. [Google Scholar] [CrossRef] [Scilit]
- Pesce, A.; Hornés, A.; Núñez, M.; Morata, A.; Torrell, M.; Tarancón, A. 3D printing the next generation of enhanced solid oxide fuel and electrolysis cells. J. Mater. Chem. A 2020, 8, 16926–16932. [Google Scholar] [CrossRef] [Scilit]
- Cebollero, J.A.; Lahoz, R.; Laguna-Bercero, M.A.; Peña, J.I.; Larrea, A.; Orera, V.M. Characterization of laser-processed thin ceramic membranes for electrolyte-supported solid oxide fuel cells. Int. J. Hydrogen Energy 2017, 42, 13939–13948. [Google Scholar] [CrossRef] [Scilit]
- Cebollero, J.A.; Lahoz, R.; Laguna-Bercero, M.A.; Larrea, A. Tailoring the electrode-electrolyte interface of Solid Oxide Fuel Cells (SOFC) by laser micro-patterning to improve their electrochemical performance. J. Power Sources 2017, 360, 336–344. [Google Scholar] [CrossRef] [Scilit]
- Cebollero, J.A.; Laguna-Bercero, M.A.; Lahoz, R.; Silva, J.; Moreno, R.; Larrea, A. Optimization of laser-patterned YSZ-LSM composite cathode-electrolyte interfaces for solid oxide fuel cells. J. Eur. Ceram. Soc. 2019, 39, 3466–3474. [Google Scholar] [CrossRef] [Scilit]
- Cai, G.; Zhang, Y.; Dai, H.; He, S.; Ge, L.; Chen, H.; Guo, L. Modification of electrode/electrolyte interface by laser micro-processing for solid oxide fuel cell. Mater. Lett. 2017, 195, 232–235. [Google Scholar] [CrossRef] [Scilit]
- Zhang, Y.; Cai, G.; Gu, Y.; Ge, L.; Zheng, Y.; Chen, H.; Guo, L. Modifying the electrode-electrolyte interface of anode supported solid oxide fuel cells (SOFCs) by laser-machining. Energy Convers. Manag. 2018, 171, 1030–1037. [Google Scholar] [CrossRef] [Scilit]
- Farandos, N.M.; Kleiminger, L.; Li, T.; Hankin, A.; Kelsall, G.H. Three-dimensional Inkjet Printed Solid Oxide Electrochemical Reactors. I. Yttria-stabilized Zirconia Electrolyte. Electrochim. Acta 2016, 213, 324–331. [Google Scholar] [CrossRef] [Scilit]
- Salari, F.; Badihi Najafabadi, A.; Ghatee, M.; Golmohammad, M. Hybrid additive manufacturing of the modified electrolyte-electrode surface of planar solid oxide fuel cells. Int. J. Appl. Ceram. Technol. 2020, 17, 1554–1561. [Google Scholar] [CrossRef] [Scilit]
- Okabe, T.; Kim, Y.; Jiao, Z.; Shikazono, N.; Taniguchi, J. Fabrication process for micropatterned ceramics via UV-nanoimprint lithography using UV-curable binder. Jpn. J. Appl. Phys. 2018, 57, 106501. [Google Scholar] [CrossRef] [Scilit]
- Akama, R.; Okabe, T.; Sato, K.; Inaba, Y.; Shikazono, N.; Sciazko, A.; Taniguchi, J. Fabrication of a micropatterned composite electrode for solid oxide fuel cells via ultraviolet nanoimprint lithography. Microelectron. Eng. 2020, 225, 111277. [Google Scholar] [CrossRef] [Scilit]
- Xu, Y.; Tsumori, F.; Osada, T.; Miura, H. Improvement of solid oxide fuel cell by imprinted micropatterns on electrolyte. Micro Nano Lett. 2013, 8, 571–574. [Google Scholar] [CrossRef] [Scilit]
- Tsumori, F.; Xu, Y.; Tanaka, Y.; Osada, T.; Miura, H. Micrometer-scale Imprinting Process for Ceramic Sheet from Powder Compound Material. Procedia Eng. 2014, 8, 1433–1438. [Google Scholar] [CrossRef] [Scilit]
- Herbstritt, D.; Weber, A.; Ivers-Tiffée, E. Modelling and DC-polarisation of a three dimensional electrode/electrolyte interface. J. Eur. Ceram. Soc. 2001, 21, 1813–1816. [Google Scholar] [CrossRef] [Scilit]
- Wang, X.M.; Li, C.X.; Huang, J.Y.; Yang, G.J.; Li, C.J. Deposition mechanism of convex YSZ particles and effect of electrolyte/cathode interface structure on cathode performance of solid oxide fuel cell. Int. J. Hydrogen Energy 2014, 39, 13650–13657. [Google Scholar] [CrossRef] [Scilit]
- Dai, H.; He, S.; Chen, H.; Guo, L. A novel method of modifying electrolyte surface at mesoscale for intermediate-temperature solid oxide fuel cells. Ceram. Int. 2016, 42, 2045–2050. [Google Scholar] [CrossRef] [Scilit]
- Timurkutluk, C.; Altan, T.; Yildirim, F.; Onbilgin, S.; Yagiz, M.; Timurkutluk, B. Improving the electrochemical performance of solid oxide fuel cells by surface patterning of the electrolyte. J. Power Sources 2021, 512, 230489. [Google Scholar] [CrossRef] [Scilit]
- Timurkutluk, C.; Altan, T.; Onbilgin, S.; Yildirim, F.; Yagiz, M.; Timurkutluk, B. Mesh patterned electrolyte supports for high-performance solid oxide fuel cells. Int. J. Energy Res. 2022, 46, 12100–12112. [Google Scholar] [CrossRef] [Scilit]
- Razavi, S.A.; Fargas, G.; Serrano, I.; Laguna-Bercero, M.Á.; Llanes, L.; Llorca, J.; Morales, M. Cobalt-Zirconia coated monoliths fabricated by Direct Ink Writing for catalytic applications. J. Eur. Ceram. Soc. 2025, 45, 117063. [Google Scholar] [CrossRef] [Scilit]
- Razavi, S.A.; Fargas, G.; Vilella, T.; Serrano, I.; Laguna-Bercero, M.Á.; Llanes, L.; Rodríguez, D.; Ginebra, M.P.; Llorca, J.; Morales, M. Direct Ink Writing of cobalt-zirconia monoliths for catalytic applications: A novel single-step fabrication approach. J. Eur. Ceram. Soc. 2025, 45, 117137. [Google Scholar] [CrossRef] [Scilit]
- Razavi, S.A.; Fargas, G.; Serrano, I.; Laguna-Bercero, M.Á.; Vilella, T.; Llanes, L.; Rodríguez, D.; Ginebra, M.-P.; Llorca, J.; Morales, M. Direct recycling of 3D-printed Co-YDZ catalysts for ethanol steam reforming. J. Environ. Chem. Eng. 2025, 13, 120246. [Google Scholar] [CrossRef] [Scilit]
- Kostretsova, N.; Pesce, A.; Anelli, S.; Nuñez, M.; Morata, A.; Smeacetto, F.; Torrell, M.; Tarancón, A. Single-step fully 3D printed and co-sintered solid oxide fuel cells. J. Mater. Chem. A 2024, 12, 22960–22970. [Google Scholar] [CrossRef] [Scilit]
- Martos, A.M.; Márquez, S.; Pavlov, R.S.; Zambelli, W.; Anelli, S.; Nuñez, M.; Bernadet, L.; Brey, J.J.; Torrell, M.; Tarancón, A. 3D printing of reversible solid oxide cell stacks for efficient hydrogen production and power generation. J. Power Sources 2024, 609, 234704. [Google Scholar] [CrossRef] [Scilit]
- Ngo, T.D.; Kashani, A.; Imbalzano, G.; Nguyen, K.T.Q.; Hui, D. Additive manufacturing (3D printing): A review of materials, methods, applications and challenges. Compos. Part B Eng. 2018, 143, 172–196. [Google Scholar] [CrossRef] [Scilit]
- Ligon, S.C.; Liska, R.; Stampfl, J.; Gurr, M.; Mülhaupt, R. Polymers for 3D Printing and Customized Additive Manufacturing. Chem. Rev. 2017, 117, 10212–10290. [Google Scholar] [CrossRef] [Scilit] [PubMed]
- Xu, W.; Jambhulkar, S.; Zhu, Y.; Ravichandran, D.; Kakarla, M.; Vernon, B.; Lott, D.G.; Cornella, J.L.; Shefi, O.; Miquelard-Garnier, G.; et al. 3D printing for polymer/particle-based processing: A review. Compos. Part B Eng. 2021, 223, 109102. [Google Scholar] [CrossRef] [Scilit]
- Santacruz, I.; Nieto, M.I.; Moreno, R. Alumina bodies with near-to-theoretical density by aqueous gelcasting using concentrated agarose solutions. Ceram. Int. 2005, 31, 439–445. [Google Scholar] [CrossRef] [Scilit]
- Kok, W.H.; Yung, W.K.C.; Ang, D.T.C. Green gelcasting of aluminum nitride using environmental sustainable ovalbumin natural binder. J. Aust. Ceram. Soc. 2019, 55, 169–177. [Google Scholar] [CrossRef] [Scilit]
- He, X.; Su, B.; Zhou, X.; Yang, J.; Zhao, B.; Wang, X.; Yang, G.; Tang, Z.; Qiu, H. Gelcasting of alumina ceramics using an egg white protein binder system. Ceram. Silik. 2011, 55, 1–7. Available online: https://www.researchgate.net/publication/267299341_Gelcasting_of_alumina_ceramics_using_an_egg_white_protein_binder_system (accessed on 18 August 2026).
- Millán, A.J.; Nieto, M.I.; Moreno, R. Near-net shaping of aqueous alumina slurries using carrageenan. J. Eur. Ceram. Soc. 2002, 22, 297–303. [Google Scholar] [CrossRef] [Scilit]
- Xu, J.; Zhang, Y.; Gan, K.; Zhang, X.; Qu, Y.; Ma, N.; Yang, J. A novel gelcasting of alumina suspension using curdlan gelation. Ceram. Int. 2015, 41, 10520–10525. [Google Scholar] [CrossRef] [Scilit]
- Chen, Y.; Xie, Z.; Yang, J.; Huang, Y. Alumina casting based on gelation of gelatine. J. Eur. Ceram. Soc. 1999, 19, 271–275. [Google Scholar] [CrossRef] [Scilit]
- Jia, Y.; Kanno, Y.; Xie, Z.P. New gel-casting process for alumina ceramics based on gelation of alginate. J. Eur. Ceram. Soc. 2002, 22, 1911–1916. [Google Scholar] [CrossRef] [Scilit]
- Chen, L.; Song, X.L.; Ye, J.D.; Li, B. Colloidal In-Situ Consolidation Forming of Al2O3 Ceramics Using Modified Starch. Key Eng. Mater. 2007, 380-383, 1027–1032. [Google Scholar] [CrossRef] [Scilit]
- Yuan, L.; Liu, Z.; Hou, X.; Tian, C.; Zhu, Q.; Wang, S.; Ma, B.; Yu, J. A novel aqueous gel-casting for fabricating Al2O3-bonded fibrous mullite ceramics. J. Alloys Compd. 2019, 811, 152009. [Google Scholar] [CrossRef] [Scilit]
- Gilissen, R.; Erauw, J.P.; Smolders, A.; Vanswijgenhoven, E.; Luyten, J. Gelcasting, a near net shape technique. Mater. Des. 2000, 21, 251–257. [Google Scholar] [CrossRef] [Scilit]
- Rincón, A.; Giacomello, G.; Pasetto, M.; Bernardo, E. Novel ‘inorganic gel casting’ process for the manufacturing of glass foams. J. Eur. Ceram. Soc. 2017, 37, 2227–2234. [Google Scholar] [CrossRef] [Scilit]
- Su, B.; Dhara, S.; Wang, L. Green ceramic machining: A top-down approach for the rapid fabrication of complex-shaped ceramics. J. Eur. Ceram. Soc. 2008, 28, 2109–2115. [Google Scholar] [CrossRef] [Scilit]
- Omatete, O.O.; Janney, M.A.; Nunn, S.D. Gelcasting: From laboratory development toward industrial production. J. Eur. Ceram. Soc. 1997, 17, 407–413. [Google Scholar] [CrossRef] [Scilit]
- Morales, M.; Laguna-Bercero, M.A.; Navarro, M.E.; Espiell, F.; Segarra, M. The effect of anode support on the electrochemical performance of microtubular solid oxide fuel cells fabricated by gel-casting. RSC Adv. 2015, 5, 39350–39357. [Google Scholar] [CrossRef] [Scilit]
- Morales, M.; Espiell, F.; Segarra, M. Improvement of performance in low-temperature solid oxide fuel cells operated on ethanol and air mixtures using Cu–ZnO–Al2O3 catalyst layer. J. Power Sources 2015, 293, 366–372. [Google Scholar] [CrossRef] [Scilit]
- Morales, M.; Laguna-Bercero, M.Á. Influence of Anode Functional Layers on Electrochemical Performance and Mechanical Strength in Microtubular Solid Oxide Fuel Cells Fabricated by Gel-Casting. ACS Appl. Energy Mater. 2018, 1, 2024–2031. [Google Scholar] [CrossRef] [Scilit]
- Morales, M.; Laguna-Bercero, M.A.; Jiménez-Piqué, E. Direct-methane anode-supported Solid Oxide Fuel Cells fabricated by aqueous gel-casting. J. Eur. Ceram. Soc. 2022, 42, 5812–5820. [Google Scholar] [CrossRef] [Scilit]
- Huang, W.L.; Zhu, Q.; Xie, Z. Gel-cast anode substrates for solid oxide fuel cells. J. Power Sources 2006, 162, 464–468. [Google Scholar] [CrossRef] [Scilit]
- Li, G.; Ren, R. Preparation of YSZ-TZP solid electrolytes by gel-casting technology. J. Environ. Sci. 2011, 23, S170–S172. [Google Scholar] [CrossRef] [Scilit] [PubMed]
- Morales, M.; Roda, V.; García-González, S.; Torres, R.; Husar, A.; Jiménez-Piqué, E. Monolithic electrolyte-supported solid oxide fuel cells fabricated by gel-casting on 3D-printed moulds. J. Eur. Ceram. Soc. 2025, 45, 117379. [Google Scholar] [CrossRef] [Scilit]
- Wincewicz, K.C.; Cooper, J.S. Taxonomies of SOFC material and manufacturing alternatives. J. Power Sources 2005, 140, 280–296. [Google Scholar] [CrossRef] [Scilit]
- Graves, C.; Ebbesen, S.D.; Jensen, S.H.; Simonsen, S.B.; Mogensen, M.B. Eliminating degradation in solid oxide electrochemical cells by reversible operation. Nat. Mater. 2015, 14, 239–244. [Google Scholar] [CrossRef] [Scilit] [PubMed]
- Sohal, M.S.; O’Brien, J.E.; Stoots, C.M.; Hartvigsen, J.J.; Larsen, D.; Elangovan, S.; Housley, G.K. Critical Causes of Degradation in Integrated Laboratory Scale Cells During High Temperature Electrolysis; INL/EXT-09-16004; Idaho National Laboratory: Idaho Falls, ID, USA, 2009. [Google Scholar] [CrossRef] [Scilit][Green Version]
- Lang, M.; Lee, Y.S.; Lee, I.S.; Szabo, P.; Hong, J.; Cho, J.; Costa, R. Analysis of Electrochemical Degradation Phenomena of a 60-Cell SOC Stack Operated in Reversible SOFC/SOEC Cycling Mode. Appl. Energy 2025, 386, 125565. [Google Scholar] [CrossRef] [Scilit]
- Bernadet, L.; Morales, M.; Capdevila, X.G.; Ramos, F.; Monterde, M.C.; Calero, J.A.; Morata, A.; Torrell, M.; Tarancón, A. Reversible fuel electrode supported solid oxide cells fabricated by aqueous multilayered tape casting. J. Phys. Energy 2021, 3, 024002. [Google Scholar] [CrossRef] [Scilit]
- McPhail, S.J.; Frangini, S.; Laurencin, J.; Effori, E.; Abaza, A.; Padinjarethil, A.K.; Hagen, A.; Léon, A.; Brisse, A.; Vladikova, D.; et al. Addressing Planar Solid Oxide Cell Degradation Mechanisms: A Critical Review of Selected Components. Electrochem. Sci. Adv. 2022, 2, e2100024. [Google Scholar] [CrossRef] [Scilit]
Disclaimer/Publisher’s Note: The statements, opinions and data contained in all publications are solely those of the individual author(s) and contributor(s) and not of MDPI and/or the editor(s). MDPI and/or the editor(s) disclaim responsibility for any injury to people or property resulting from any ideas, methods, instructions or products referred to in the content. |
© 2026 by the authors. Licensee MDPI, Basel, Switzerland. This article is an open access article distributed under the terms and conditions of the Creative Commons Attribution (CC BY) license.