


Abstract
Poland’s energy transition represents a structurally complex case of decarbonization in a coal-dependent economy, where declining hard coal consumption, increasing renewable energy production, growing natural gas use, and continued economic expansion interact within the same energy–economic system. This study assesses the evolution of emission pressure in Poland between 2000 and 2023 using a Fuzzy Multi-Criteria Evaluation (FMCE) framework. The analysis integrates four system-level variables: gross domestic product, hard coal consumption, natural gas consumption, and renewable electricity production, the latter transformed into an inverse fuzzy variable representing insufficient renewable energy penetration. The FMCE-based emission pressure index was constructed using min–max normalization, continuous fuzzy membership degrees, weighted aggregation, and component-level decomposition. The results show that Poland’s emission pressure was highest in the early phase of the analyzed period, especially in 2000–2007, when the energy system remained strongly shaped by coal dependence. The years 2008–2013 formed an unstable transitional phase, while 2014–2018 showed a more stable moderate-pressure configuration. After 2018, the index declined markedly, indicating a shift toward lower emission pressure; however, only selected years reached the formal low-pressure category, which suggests that a stable low-emission regime has not yet been fully established. The decomposition confirms that hard coal was the dominant contributor to emission pressure for most of the period, although its relative contribution declined over time. Renewable energy development increasingly weakened emission pressure, while natural gas played an ambiguous transitional role by partly replacing coal but maintaining fossil-fuel dependence. The study contributes to energy-transition research by proposing an interpretable fuzzy composite index for tracking structural emission pressure over time. The findings underline the need for continued coal phase-down, accelerated renewable energy integration, grid modernization, and careful governance of natural gas as a transitional fuel in Poland’s pathway toward a lower-emission energy system.
1. Introduction
The energy transition in Poland is being implemented in line with the requirements of EU policy, as Poland has been a member of the European Union since 2004. Changes in the energy market, directed toward “clean” energy, are central to the restructuring of the energy system. In Poland, the energy transition involves a gradual move away from fossil fuels, especially coal, toward low- and zero-emission energy sources, including renewable energy and nuclear power. The Polish government treats these ongoing changes both as an obligation resulting from EU climate policy and as a condition for maintaining the competitiveness of the Polish economy. Poland is seeking to reduce carbon dioxide emissions in accordance with European Union climate and energy policy, including the European Green Deal, the Fit for 55 package, and the revised Renewable Energy Directive. At the EU level, these frameworks combine the objective of reducing net greenhouse gas emissions by at least 55% by 2030 with the target of reaching at least a 42.5% share of renewable energy in final energy consumption, with an aspiration to reach 45% [1]. By adopting this objective [2,3], Poland is transforming its systems of energy production, transmission, and consumption in order to gradually shift away from fossil fuels, such as coal, oil, and gas, toward low- and zero-emission sources, including renewable energy sources, nuclear power, and energy storage technologies. The need for energy transition stems primarily from the necessity to reduce CO2 emissions and mitigate climate change. The Paris Agreement of 2015 [4] established the global objective of limiting the increase in the Earth’s average temperature to well below 2 °C above pre-industrial levels, while pursuing efforts to limit the increase to 1.5 °C. The energy transition is a complex and long-term process. Poland is implementing its strategic priorities gradually. The current strategic document is the Energy Policy of Poland until 2040, adopted by the Polish government in 2021, which constitutes the official energy transition policy, referred to in Polish as PEP 2040 [5]. This document defines the strategic horizon for the entire energy sector in Poland. The main direction of the transition is the gradual reduction in coal’s share in the energy mix and the increasing importance of renewable energy sources, nuclear energy, and energy efficiency, including investments in transmission grid infrastructure and energy storage. Despite the growing body of literature on the energy transition in Poland and the European Union, existing studies remain dominated by econometric approaches that focus mainly on linear relationships between individual variables, such as GDP growth, energy consumption, renewable energy deployment, and carbon emissions.
The energy transition must not be viewed merely in terms of replacing fossil fuels with renewable energies but, instead, in the context of a sustainable transition that incorporates various transitions of structure, institutions, economy, and the environment all at once within the larger energy-economic system. Sustainability-driven energy transition does not mean the mere reduction in greenhouse gases or the decarbonization of energy sources alone but entails the creation of robust and diversified socio-technical systems that can effectively integrate concerns for climate protection with those for energy security and economic stability. This kind of complexity is best observed in countries that depend on coal, as their history, energy infrastructure, path dependency, and institutions affect the rate and trajectory of low-carbon transitions. As such, the study of sustainable transitions would necessitate an integrative approach to understanding the interrelated dynamics of economic growth, fossil fuel dependency, renewable energy, and environmental stresses.
Previous studies have usually analyzed these determinants either separately or within relatively simple regression models. Such an approach restricts the ability to capture the complex and multidimensional nature of the energy transition process. At the same time, limited attention has been given to the development of synthetic analytical frameworks that could combine economic, fossil-fuel, and renewable-energy dimensions into a single, coherent measure of emission pressure. This limitation is especially important in the Polish context, where the transition is structurally uneven and depends strongly on the interaction between the reduction in coal use, economic growth, and the development of renewable energy sources.
Previous research on energy transition has developed along several complementary lines. The first group of studies focuses on the structural transformation of national energy systems, especially in countries historically dependent on coal. This literature emphasizes path dependency, the persistence of fossil-fuel infrastructure, the political economy of coal phase-down, and the tension between decarbonization, energy security, and industrial competitiveness [6,7,8,9,10,11]. In the Polish case, these issues are particularly relevant because coal has long been not only a dominant energy carrier, but also an institutional and socioeconomic foundation of the national energy system [7,8,12,13]. As a result, Poland’s transition cannot be interpreted only as a technological substitution of coal by renewable energy sources but should be examined as a gradual reconfiguration of the energy–economic structure [7,8,14].
Other group of research examines the relationship between economic growth, energy consumption, renewable energy development, and carbon emissions. These studies often use econometric approaches to assess decoupling, causality, and long-term dependencies between GDP, fossil fuel use, and emissions [9,14,15,16]. They provide important evidence on whether economic growth can be separated from environmental pressure [15]. However, such approaches usually focus on the statistical relationships between selected variables and are less suited to representing the combined structural configuration of the energy system in a single synthetic measure [16,17,18]. This is important in transition economies where emission pressure is generated not by one isolated variable, but by the interaction of coal dependence, gas use, renewable energy expansion, and economic activity [17,18,19].
A next group of studies applies composite indicators and multi-criteria decision-making methods to energy and sustainability assessment. Methods such as AHP, TOPSIS, entropy weighting, DEA, and fuzzy approaches have been used to evaluate energy performance, sustainability, emission intensity, and policy alternatives [20,21,22,23]. These methods are valuable because they allow heterogeneous variables to be integrated into one analytical framework [20,21,22,23]. Fuzzy approaches are especially useful where system states are gradual, imprecise, and difficult to describe through binary classifications [24,25,26,27,28,29]. Nevertheless, many applications are oriented toward ranking countries, regions, technologies, or policy scenarios. Less attention has been devoted to the use of fuzzy composite assessment for tracing the annual evolution of emission pressure within one national energy–economic system. This creates a methodological and empirical gap that is addressed in the present study [25,26,27,28,29].
Against this background, the innovative contribution of this study is threefold. It develops a synthetic FMCE-based emission pressure index that integrates economic activity, hard coal consumption, natural gas consumption, and insufficient renewable energy penetration into one interpretable measure. It applies this index to Poland over the period 2000–2023, allowing the transition to be examined as a phased and uneven process rather than as a simple linear trend. It decomposes the index into component-level contributions, making it possible to identify the changing role of coal, gas, GDP, and renewable energy in shaping emission pressure over time. In this way, the study complements existing econometric and policy-oriented research by offering a fuzzy composite framework for diagnosing structural emission pressure in a coal-dependent energy system.
The research gap therefore relates not to the absence of fuzzy and multi-criteria methods in energy studies in general, but to their still limited use for tracing the long-term annual trajectory of emission pressure in the Polish energy–economic system. Fuzzy and multi-criteria approaches have already been applied in international energy research, for example to renewable energy planning, energy-policy evaluation, technology selection, location assessment, and low-carbon transition performance comparisons. However, these studies are usually oriented toward ranking alternatives, selecting technologies, comparing countries, or evaluating policy scenarios. Less attention has been given to the use of an FMCE-based composite index for following the year-by-year evolution of selected energy-related emission-pressure dimensions within one coal-dependent national economy.
Existing studies rarely provide synthetic measures capable of representing gradual, multidimensional, and configuration-based changes in energy-transition processes, although these processes are dynamic, uneven, and difficult to describe through simple deterministic classifications. In particular, there is a shortage of research applying Fuzzy Multi-Criteria Evaluation (FMCE) methods to assess how different elements of the energy–economic system jointly affect emission pressure over time. As a result, the structural decomposition of emission drivers and the identification of transition phases marked by different levels of environmental pressure remain insufficiently explored. This study addresses this gap by proposing a synthetic FMCE-based emission pressure index, which allows for a more integrated interpretation of Poland’s long-term energy transition.
The aim of this study is to examine changes in selected energy–economic dimensions of Poland’s emission pressure between 2000 and 2023 using the Fuzzy Multi-Criteria Evaluation (FMCE) approach. The study is guided by the following research questions:
- RQ1.
- How did the structure of Poland’s energy–economic system influence the level of emission pressure in the period 2000–2023?
- RQ2.
- To what extent did the reduction in hard coal consumption contribute to the decline in the composite emission-pressure index during Poland’s energy transition?
- RQ3.
- How can the Fuzzy Multi-Criteria Evaluation (FMCE) approach represent gradual and multidimensional relationships between economic growth, fossil fuel consumption, renewable energy development, and emission pressure in Poland?
The paper includes both theoretical and empirical components. The theoretical part consists of Section 2, “Related Works”, and Section 3, “Background of Analysis”. Section 3 also provides a conceptual transition to Section 4, “Materials and Methods”. The empirical results are presented in Section 5, followed by the discussion in Section 6. The final section, Section 7, presents the conclusions of the study.
The novelty of this study does not lie in the use of fuzzy or multi-criteria methods in energy research as such, since these methods have already been applied in many international energy contexts. Rather, the contribution lies in adapting an FMCE-based composite-index approach to trace the annual evolution of selected energy-related emission pressure in Poland, a coal-dependent economy undergoing a long-term transition between 2000 and 2023.
2. Related Works
Poland’s energy transition should be understood as a long-term restructuring process shaped simultaneously by international climate commitments and the regulatory framework of the European Union. The central policy context is provided by the European Green Deal, which establishes the objective of climate neutrality by 2050, and by the “Fit for 55” package, which requires a reduction in greenhouse gas emissions of at least 55% by 2030 compared with 1990 levels [2,3]. Within this framework, Poland occupies a specific and difficult position because its energy system has historically been based to a much greater extent on coal than those of most other EU countries [6]. The main national policy response is “Poland’s Energy Policy until 2040” (PEP2040) [5]. This document defines the transition pathway through three strategic pillars: ensuring a just transition, building a low- and zero-emission energy system, and improving air quality [14]. In practical terms, this means a progressive reduction in the use of coal, the introduction of nuclear power, and a rapid expansion of renewable energy sources, especially offshore wind and photovoltaic energy [7,30,31]. The transition is also expected to involve decentralized and bottom-up forms of energy production, including energy cooperatives [32]. Early cooperative projects encountered many barriers [33], but more recent initiatives have begun to expand at a much faster pace [34].
The historical structure of the Polish energy sector explains the scale of the current challenge. For decades, hard coal and lignite were treated not only as the dominant fuels, but also as guarantees of energy security and domestic resource independence [7]. At the start of the 2000s, coal generated more than 90% of Poland’s electricity. Although its share has declined in recent years, coal still remains the main source of electricity generation [8]. This continued dependence means that Poland is still one of the most carbon-intensive economies in the European Union, especially because electricity production remains highly emission-intensive [9].
The shift away from carbon-intensive energy production is associated with high financial and infrastructural burdens. Emissions generate direct economic pressure through the EU ETS, where increasing allowance prices raise energy costs and reduce the competitiveness of industry, particularly in energy-intensive sectors [10]. The social costs of the transition are also significant, as rising energy prices and uneven household capacities increase the risk of energy poverty [11].
Renewable energy sources constitute the fastest-growing element of the transformation. Their contribution to electricity generation has increased markedly in recent years, with photovoltaics becoming especially important due to the expansion of prosumer-based energy production [35,36,37,38]. Wind power is also gaining importance and already represents one of the principal renewable sources in the Polish system. Its further development is expected to depend strongly on offshore wind projects in the Baltic Sea [39]. However, the rapid increase in renewable capacity has revealed serious constraints in the existing infrastructure. Transmission networks are not sufficiently adapted to the scale and variability of renewable generation, which leads to curtailment and creates pressure for large-scale investments in grid modernization and energy storage [8].
The variability of renewable energy means that the Polish transition cannot rely on RES alone. Stabilizing technologies are also required. Natural gas is therefore treated as a bridging fuel that can support emission reduction while maintaining continuity of supply [31]. This role, however, creates additional vulnerability because greater reliance on gas increases exposure to imports, geopolitical risk, and price volatility [14]. In the longer term, nuclear power is expected to provide stable, low-emission baseload electricity [40]. Carbon capture and storage or utilization technologies are also discussed as supporting instruments, especially in sectors where emission reduction is technically difficult [41,42].
The transition also produces major socioeconomic consequences. The idea of a just transition is central because regions dependent on coal mining, particularly Upper Silesia, face the risk of structural decline, job losses, and social disruption [12]. Managing this process requires labor market restructuring and retraining programs for workers moving out of coal-related sectors [13]. Energy poverty remains another critical issue, especially where rising prices coincide with poor building efficiency and limited household investment capacity [10].
The literature increasingly analyzes Poland’s transition through the concept of decoupling, meaning the weakening or breaking of the link between economic growth and greenhouse gas emissions. Poland has achieved clear progress in this area, including relative decoupling and, in some periods, absolute decoupling [9]. Emission reductions in recent years appear to result mainly from technological change rather than from reduced economic activity. However, economic growth continues to be linked with emissions because fossil fuels still play a substantial role in the energy system [15]. This has led scholars to question whether classical analytical tools are sufficient. Regression-based and econometric approaches often assume linearity and independence between factors, which limits their usefulness in explaining energy transformation processes [16]. Energy transition is better described as nonlinear, multidimensional, and context-dependent, with relationships that are often gradual rather than clearly bounded [17,18]. For this reason, synthetic indicators and multi-criteria decision-making methods [MCDM] have become increasingly relevant, as they allow different types of variables to be combined into one analytical measure [20].
One important direction in this field is the construction of composite indices that measure energy sustainability, system performance, or emission intensity. These indices may be based on traditional weighted aggregation or on more advanced techniques such as TOPSIS, AHP, entropy-based approaches, and DEA [21,22]. In energy transition research, such measures help identify structural shifts in the system and compare changes over time or between countries [19]. Their results, however, are sensitive to methodological decisions, especially the choice of weights and normalization procedures [23].
Fuzzy logic methods have gained growing importance because they are well suited to situations in which relationships between variables are imprecise and transitions between states are gradual [24,25]. Fuzzy Multi-Criteria Evaluation [FMCE] is one approach that makes it possible to combine several analytical dimensions while recognizing that categories such as “high” or “low” emission pressure do not have sharp boundaries [26,27,28]. Such methods are already used in environmental risk assessment, energy-efficiency evaluation, and sustainability studies [29].
Although fuzzy and multi-criteria methods are increasingly used in energy and environmental research, they are still rarely applied to the Polish energy transition. Existing studies most often concentrate on sectoral assessments, policy analysis, or econometric modeling of the relationships between emissions, energy use, and economic growth [9,15]. Fewer studies attempt to build synthetic measures that combine economic development, fossil fuel consumption, and renewable energy growth within a single framework. The main unresolved problem is the lack of an approach that jointly accounts for four elements [18,19]: economic growth as a source of emission pressure, the continuing role of fossil fuels, especially coal and gas, the increasing importance of renewables in reducing pressure on emissions, and the changing configuration of these factors within the energy–economic structure [17].
This creates a need for an integrated measure capable of capturing these dimensions simultaneously. The present study responds to this need by applying Fuzzy Multi-Criteria Evaluation [FMCE] to construct an emission pressure index. The index is designed to reflect the configurational character of the Polish energy–economic system and to trace its structural evolution over time. A fuzzy approach is appropriate because the links between economic growth, the energy mix, and emissions are not linear or binary. Although descriptive threshold classes may be introduced at the final interpretation stage, the core FMCE procedure is based on continuous membership degrees rather than on deterministic classification.
Although fuzzy TOPSIS, AHP, entropy-based approaches, and DEA are widely used in energy and sustainability assessment, their analytical orientation differs from the purpose of the present study. Fuzzy TOPSIS is particularly useful when the aim is to rank a set of alternatives according to their distance from an ideal and an anti-ideal solution. AHP is especially valuable for structuring expert judgments and deriving hierarchical weights among criteria. Entropy-based methods are mainly applied when objective weights are expected to be derived from data dispersion, whereas DEA is designed to evaluate relative efficiency among comparable decision-making units. In contrast, the objective of this study is not to rank alternative energy systems, select the best policy option, or estimate efficiency frontiers. The aim is to trace the annual evolution of emission pressure within one national energy–economic system. For this reason, FMCE is appropriate because it allows heterogeneous variables to be transformed into continuous fuzzy membership degrees and then aggregated into an interpretable synthetic index. This makes it possible to examine gradual movement between emission-pressure states over time and to decompose the index into the contributions of its component variables.
3. Background of the Analysis
Poland’s energy market is undergoing a deep structural transformation, driven primarily by the need to reduce the dominance of coal and increase the role of renewable energy sources (RES) and natural gas. In this process, natural gas is treated as a transitional fuel, although its long-term use is also expected to decline. Coal still remains the foundation of the Polish energy system, but its importance is steadily decreasing. In 2000, hard coal and lignite accounted for more than 90–95% of energy production, whereas by 2025 their share had fallen to approximately 52–56% [43]. This illustrates the scale of the shift, although it also confirms that coal continues to play a major role in the national energy mix.
The gradual withdrawal from coal is also reflected in the planned reduction in mining activity and the decommissioning of older coal-fired power units. In the coming decade, coal is expected to remain in the system mainly as a reserve source supporting energy security. However, many 200 MW coal-fired units are scheduled for closure between 2030 and 2035. In recent years, the most direct path away from coal has been its substitution with natural gas, most of which is imported. Gas is still perceived in Poland as a fuel that can stabilize the system during the transition. New gas-fired power plants, such as the investment in Gryfino, are intended to replace retired coal units. However, replacing coal with gas does not fully resolve the problem of energy security. Poland has no significant domestic gas deposits, which means that a gas-based transition increases dependence on imports, including LNG supplies. This exposes the Polish energy system to price volatility on international markets. Although Poland has completely stopped importing coal and gas from Russia, it has simultaneously become more dependent on other external suppliers. In 2023, the level of energy import dependency reached 45% [44].
The renewable energy sector has developed much more dynamically. By 2025, RES accounted for more than 30% of total energy production in Poland, and in some months, such as June, electricity generated from renewable sources exceeded coal-based generation. This marks a major change compared with 2000, when renewables represented only about 1–2% of the energy mix and were based mainly on small hydropower plants and, to a limited extent, biomass. At that time, coal’s dominance in the Polish energy system was almost complete. The current expansion of RES is driven primarily by photovoltaics, including both prosumer installations and large-scale solar farms [43]. Wind energy is the second major renewable source and will soon be supplemented by offshore wind power. Onshore wind farms have already become one of the leading sources of renewable electricity, accounting for nearly 14% of electricity generation. However, the pace of renewable energy development is faster than the modernization of transmission infrastructure. As a result, grid constraints increasingly force temporary curtailment of wind and solar generation.
To present the dynamics of change in Poland’s key energy resources more clearly, an analysis was conducted using data for the period 2000–2023.
The trend data presented in Figure 1 indicate a clear increase in the role of renewable energy sources in Poland’s energy production, as shown on the Y2 axis. The lowest RES production level was recorded in 2003, at 2250 GWh, whereas by 2023 it had risen to 45,853 GWh. This growth reflects a substantial expansion of renewable generation capacity over the analyzed period. Hard coal consumption followed a different trajectory. Over the whole period, its average level amounted to 75,866 thousand tons, as shown on the Y1 axis. The highest consumption was recorded in 2003, when it reached 85,367 thousand tons, while the lowest level was 55,418 thousand tons. This indicates that coal consumption declined over time, although it remained structurally significant in Poland’s energy system. Carbon dioxide emissions also showed a gradual downward tendency, although the decline was not linear. Average CO2 emissions during the analyzed period amounted to 321,245.8 thousand tons, as presented on the Y1 axis. The lowest value was recorded at the end of the period and reached 283,619 thousand tons. For comparison, the highest value occurred in 2018, when emissions amounted to 336,992 thousand tons.
Figure 1.
Energy sources in Poland: dynamics Source: own analysis based on [45,46,47,48].
Despite the rapid growth of RES, whose share in electricity production reached 29.4%, the further development of renewable energy in Poland continues to be constrained by legislative and administrative barriers involving ministries, system operators, local governments, and other institutional actors [49]. At the same time, Poland remains one of the world’s most emission-intensive economies, both in terms of emissions per unit of GDP and in relation to energy consumption. In terms of economic emission intensity, only Kuwait, South Africa, Kazakhstan, and China rank higher. In 2024, the average price of CO2 emission allowances amounted to EUR 64.75 per ton, which was below expectations and reduced budget revenues from the EU ETS. Nevertheless, revenues from the sale of allowances still reached PLN 16.6 billion [44].
4. Materials and Methods
The analysis was based on official statistical data obtained from Statistics Poland. The study covered the years 2000–2023. This time frame was adopted deliberately, as it makes it possible to observe successive phases of Poland’s energy transition and to distinguish between the pre-accession period before 2004 and the period following Poland’s entry into the European Union. This distinction is analytically important because EU membership changed the institutional, regulatory, and investment conditions under which the Polish energy system developed.
The research period covers 24 years. From a methodological perspective, such a long observation window is appropriate for the analysis of structural change. It allows the study to move beyond short-term fluctuations and to identify longer-term tendencies, transition phases, and changes in the configuration of the energy system. At the same time, the period cannot be treated as internally uniform. The analyzed years were shaped by different regulatory regimes, changes in energy prices, technological development, and evolving environmental policy. As a result, Poland’s energy transformation should be interpreted as an uneven and phased process rather than as a simple linear trend.
The main purpose of the study is to identify the stage-based nature of Poland’s energy transition using a synthetic emission pressure index. The index was constructed with reference to the key energy sources determining the structure of the national energy mix. The analysis therefore focuses on the changing importance of fossil fuels and renewable energy sources within the broader energy system. It does not examine emission dynamics in isolation, but treats them as the outcome of structural relationships between the composition of energy production, the intensity of transition, and the pressure exerted on the environment.
The selection of variables was based on the specific purpose of the study, which is not to construct a complete sectoral inventory of all carbon-emission sources in Poland, but to assess structural emission pressure associated with the national energy–economic transition. For this reason, the model focuses on system-level variables directly connected with the energy mix and macroeconomic activity: GDP, hard coal consumption, natural gas consumption, and renewable electricity production. These variables were selected because they represent the main structural dimensions of Poland’s transition from a coal-based energy system toward a more diversified and lower-emission configuration. The model therefore does not directly include sector-specific emission sources such as transport, heavy industry, construction, agriculture, waste management, or household heating. These sectors are important sources of carbon emissions, but their inclusion would require a different sectoral model, based on disaggregated activity and emission data. In the present study, they are treated only indirectly through the broader macroeconomic and energy-system variables.
Four variables were used to represent selected system-level dimensions of energy-related emission pressure:
GDP—macroeconomic activity included as a broad background variable reflecting the scale of the economy, not as a substitute for sector-specific emission drivers: Gross Domestic Product at current prices, in millions of PLN, in Poland in 2000–2023 [50].
Coal—hard coal consumption included as a fossil-fuel variable associated with emission pressure, in thousand tons, in Poland in 2000–2023 [47,48].
Gas—natural gas consumption included as a fossil-fuel variable associated with emission pressure, while recognizing its lower carbon intensity relative to coal and its possible substitution role in the transition process: natural gas consumption, in PJ, in Poland in 2000–2023 [44].
RES—renewable energy production transformed into an inverse fuzzy set, RES_low, expressing insufficient renewable energy penetration as a factor increasing emission pressure: renewable electricity production, in GWh, in Poland in 2000–2023 [45,46].
Carbon emissions, expressed in thousand tons, were used as a contextual reference variable and were not included as a direct input variable in the FMCE index.
Renewable electricity production was measured in absolute terms, in GWh, rather than as a share of electricity generation or final energy consumption. This choice was made because the aim of the FMCE model is to capture the expansion of renewable generation capacity as one of the structural changes in the Polish energy system over time. Absolute RES production directly reflects the physical increase in renewable electricity supplied to the system, which is especially relevant in a long-term transition analysis covering the period 2000–2023. However, this variable should not be interpreted as a direct measure of renewable penetration in the energy mix. A share-based indicator, such as the RES share in electricity generation or final energy consumption, would better reflect the relative position of renewables within total demand. The use of absolute RES production therefore has an important limitation: if electricity demand grows, increasing RES production may coexist with only limited improvement in renewable penetration. For this reason, the variable RES_low in the FMCE model should be interpreted as an inverse indicator of insufficient renewable electricity expansion within the analyzed sample, not as a complete measure of renewable adequacy or system penetration.
Natural gas was included in the FMCE model as a positive contributor to emission pressure because it remains a fossil fuel and generates carbon emissions when consumed. This modeling decision captures the absolute fossil-fuel effect of gas. At the same time, the interpretation of natural gas in Poland’s energy transition is more ambiguous. In relative terms, gas may reduce emission intensity when it substitutes for coal, especially in electricity and heat generation. Therefore, gas can simultaneously act as a transitional substitute for coal and as a continuing source of fossil-fuel-based emission pressure. The FMCE model captures the latter effect by treating higher gas consumption as increasing emission pressure, while the discussion recognizes the former effect as a possible substitution mechanism within the transition process. This distinction is important because the role of gas depends on whether it is assessed in absolute terms as a fossil fuel or in relative terms as a lower-emission substitute for coal.
The selection of variables was guided by data availability, comparability across the full 2000–2023 period, and the objective of constructing a synthetic indicator of structural emission pressure rather than a complete physical model of the Polish energy system. GDP was included as a macroeconomic pressure variable. In the baseline specification, GDP at current prices was used because it reflects the nominal scale of economic activity and the economic expansion of the system over time. This choice has an important limitation: nominal GDP growth also includes inflation and changes in the general price level. Therefore, GDP in current prices should not be interpreted as a pure measure of real production growth. In this study, GDP is used only as a broad macroeconomic background variable within the fuzzy composite framework, while the interpretation of emission pressure is driven primarily by the energy variables. Future extensions of the model should test the sensitivity of the results using real GDP, GDP in constant prices, GDP per capita, or industrial output.
The coal variable used in the FMCE model refers to hard coal consumption. This choice was made to ensure consistency of the time series and to focus on the dominant coal-related component available for the entire period of analysis. Nevertheless, this is a limitation of the model because Poland’s coal dependence also includes lignite, which has played an important role in electricity generation. Therefore, the coal component in the FMCE index should be interpreted as a hard-coal-based proxy of coal-related emission pressure rather than as a complete measure of total coal dependence. The broader discussion of Poland’s coal-based energy system includes both hard coal and lignite, but the empirical model uses hard coal only. This distinction has been clarified in the revised manuscript to avoid conceptual ambiguity. Future research should extend the FMCE framework by including a combined coal variable covering both hard coal and lignite, provided that fully comparable long-term data are available.
To construct the synthetic emission pressure index, the study applied the Fuzzy Multi-Criteria Evaluation (FMCE) approach. This method enables the integration of heterogeneous variables describing the energy–economic system. In this study, FMCE is not used as a formal nonlinear econometric model, but as a composite-index framework that converts variables expressed in different units into comparable fuzzy membership degrees and aggregates them into a continuous, interpretable measure of relative emission pressure. In this study, FMCE is used as a complementary analytical layer alongside regression-based approaches, supporting a structural interpretation of the factors shaping emission pressure.
The choice of FMCE was motivated by the specific objective of the study. Unlike fuzzy TOPSIS, which is mainly designed to rank alternatives according to their distance from ideal solutions, and unlike AHP, which focuses on hierarchical preference elicitation and expert-based weighting, FMCE is better suited for constructing a continuous composite measure for a single system observed over time. In the present study, the purpose was not to compare several countries or policy variants, but to assess the changing degree of emission pressure in Poland from year to year. FMCE therefore provides three methodological advantages: it converts variables measured in different units into comparable fuzzy membership degrees, it represents gradual transitions between low, moderate, and high emission-pressure states, and it allows the final index to be decomposed into the contributions of GDP, coal, gas, and insufficient renewable energy penetration.
The research methodology is summarized in Figure 2. The analytical procedure was organized into successive stages, starting with data collection and initial organization, followed by the specification of the FMCE model and the application of statistical modeling procedures. The procedure was not purely mechanical. Some stages required iterative verification, especially during data preparation and harmonization, where it was necessary to ensure consistency between variables and comparability across the entire time series.
Figure 2.
Methodology of research. Source: Own elaboration.
The procedure should be interpreted as an FMCE-based composite-index approach using linear membership functions and constant weights, not as a full fuzzy-inference system with adaptive rules, stage-dependent coefficients, or overlapping fuzzy corridors.
The underlying assumption is that relative emission pressure can be approximated through the selected configuration of energy-related and macroeconomic variables. Therefore, the FMCE model summarizes the combined contribution of economic activity, fossil-fuel consumption, and renewable electricity production within the adopted composite-index structure. To ensure comparability across variables expressed in different units, all variables were normalized using min–max transformation. For each variable , the normalized value is defined as (formula (1)):
It is important to emphasize that the FMCE index is sample-relative rather than absolute. The value of 0 for a given component indicates the lowest observed value of that variable within the analyzed period, while the value of 1 indicates the highest observed value in the same sample. Therefore, a coal membership value close to 0 in 2023 does not mean that coal ceased to matter in Poland’s energy system; it means that hard coal consumption reached its lowest relative level within the 2000–2023 observation window. Similarly, (RES_low = 0) does not imply that renewable energy penetration became sufficient in an absolute technological, policy, or system-adequacy sense. It only means that renewable electricity production reached the highest level observed in the analyzed sample. Consequently, all fuzzy membership degrees and FMCE values should be interpreted as relative positions within the empirical trajectory of Poland’s energy–economic system, not as absolute assessments of decarbonization completion.
The use of min–max normalization in this study is interpreted as a linear fuzzy membership function defined over the empirical range of each variable observed in Poland between 2000 and 2023. The normalized value does not represent a probability or an absolute physical threshold of emission pressure. Instead, it expresses the relative degree to which a given annual observation belongs to the fuzzy set associated with higher emission pressure within the analyzed period. A value close to 0 indicates that the observation is located near the lowest empirical level recorded for a given variable, whereas a value close to 1 indicates proximity to the highest empirical level observed in the same time window. Thus, the membership functions used in the FMCE model are data-driven, monotonic, and relative to the national energy–economic trajectory analyzed in this paper.
For GDP, hard coal consumption, and natural gas consumption, higher normalized values were interpreted as higher membership in the fuzzy set “high emission pressure”, because these variables act as stimulants of emission pressure in the adopted model. For renewable energy production, the interpretation is reversed. Since higher renewable electricity production reduces emission pressure, an inverse membership function was applied. The variable (RES_low) therefore represents the degree of insufficient renewable energy penetration: high values of (RES_low) indicate weak renewable-energy development and thus stronger emission pressure, while low values indicate greater renewable-energy penetration and weaker emission pressure. This specification preserves the interpretability of the fuzzy sets by ensuring that all membership degrees included in the FMCE aggregation have the same directional meaning: higher values always correspond to stronger emission pressure.
For variables that increase emission pressure (GDP, coal, gas), the normalized value directly represents the degree of membership in the fuzzy set “high emission pressure” (Formula (2)):
In contrast, for renewable energy (RES), which reduces emission pressure, an inverse transformation was applied (Formula (3)):
This formulation ensures that higher RES values correspond to lower emission pressure within the fuzzy framework. The relative importance of each variable was incorporated through a weighting system derived from prior econometric analysis (ARDL-based sensitivity results). The weights were derived from prior ARDL-based sensitivity analysis and then normalized to sum to one. To reduce the risk that the results were driven solely by the weighting scheme, the robustness of the FMCE trajectory was additionally checked against alternative weighting assumptions, including equal weights and reduced coal-dominance scenarios. Let denote the weight assigned to variable , such that (Formula (4)):
The weights used in the model are (Formula (5)):
The large difference between the coal and gas weights should therefore be treated with caution. It does not imply that hard coal is physically ten times more emission-intensive than natural gas per unit of useful energy or electricity generation. In general, gas combustion is less carbon-intensive than coal combustion, although it still remains a fossil-fuel source of emissions. In the present index, the higher coal weight reflects the historical association between hard coal consumption and Poland’s emission-pressure trajectory during the analyzed period, rather than a universal emissions-factor ratio between coal and gas.
The weights used in Formula (5) were derived from prior ARDL-based sensitivity analysis linking the selected energy–economic variables with carbon-emission dynamics in Poland. The estimated relative effects were transformed into non-negative values and normalized so that the sum of all weights equaled one. This procedure resulted in the following weighting structure: (w_{GDP} = 0.0897), (w_{Coal} = 0.8111), (w_{Gas} = 0.0718), and (w_{RES_low} = 0.0274). The high weight assigned to hard coal should be interpreted as a modeling assumption based on the auxiliary ARDL-based sensitivity procedure and on the historically important role of coal in Poland’s emission-intensive energy system. It does not mean that the FMCE model independently proves coal to be the dominant causal driver of emissions. The lower weights assigned to GDP, gas, and RES_low indicate a smaller contribution within the adopted composite-index specification, not a general statement about their absolute physical or causal influence on carbon emissions.
To improve the transparency of the weighting procedure, an auxiliary ARDL-based sensitivity model was estimated for Poland over the period 2000–2023. The dependent variable was the logarithm of carbon emissions, while the explanatory variables were the logarithms of GDP, hard coal consumption, natural gas consumption, and renewable electricity production. Lag selection was based on the Akaike Information Criterion, with a maximum lag length of two years. The selected specification was ARDL (0, 2, 0, 1, 2). The model was used as an auxiliary procedure for validating the empirical importance of the variables included in the FMCE index, not as the main causal model of the study. The cumulative absolute effects obtained from the selected auxiliary ARDL model were used only to inform the baseline weighting scheme. They should not be interpreted as definitive evidence of the causal dominance of hard coal in carbon-emission dynamics, especially because the FMCE model includes a deliberately limited set of four system-level variables. Since the exact values of relative effects may depend on model specification, the baseline FMCE weighting scheme was additionally tested under equal-weight and reduced coal-dominance scenarios (Table 1).
Table 1.
Diagnostic statistics of the auxiliary ARDL model used for weight validation.
It should be emphasized that the weighting procedure does not demonstrate non-linearity in the transition process. The weights only determine the relative contribution of each component to the composite FMCE index. The uneven and non-linear character of Poland’s energy transition is inferred from the empirical trajectories of the underlying variables, especially the decline in hard coal consumption, the late acceleration of renewable electricity production, and the fluctuating path of carbon emissions shown in Figure 1. Therefore, the FMCE index should be interpreted as a synthetic and decomposable representation of these observed changes, not as a formal nonlinear transformation of the input variables.
To verify whether the FMCE trajectory depends excessively on the adopted ARDL-based weighting scheme, a sensitivity analysis was performed using three alternative weighting scenarios (Table 2). The baseline model was compared with equal weights and with two reduced coal-dominance scenarios, in which the coal weight was decreased to 0.60 and 0.50, while the remaining weights were redistributed proportionally among GDP, gas, and RES_low. The results show that the absolute values of the FMCE index are sensitive to the weighting scheme, which is expected in composite-index construction. Under the baseline ARDL-based weights, the average FMCE value declined from 0.793 in 2000–2007 to 0.336 in 2019–2023. When the coal weight was reduced to 0.60, the corresponding decline remained visible, from 0.646 to 0.430. Under the more restrictive coal-weight scenario of 0.50, the decline was weaker but still present, from 0.577 to 0.475. In contrast, the equal-weight scenario produced a much flatter trajectory, with the average FMCE value decreasing only from 0.528 to 0.508. This indicates that assigning equal importance to all variables partly offsets the decline in coal-related pressure through the increasing values of GDP_high and Gas_high. Therefore, the ARDL-based weighting scheme is justified because it better reflects the historically dominant emission role of coal in Poland’s energy system. At the same time, the sensitivity analysis confirms that the main direction of change remains visible under reduced coal-dominance assumptions, although the magnitude of the decline depends on the adopted weighting structure.
Table 2.
Sensitivity analysis of FMCE subperiod averages under alternative weighting schemes.
The classification into low, moderate, and high emission pressure should be interpreted only as a descriptive analytical device. The equal-width thresholds were adopted because the FMCE index is normalized to the interval [0, 1], which makes the classification transparent and reproducible. However, these thresholds are not statistically estimated cut-off points, policy-defined decarbonization targets, or externally validated regime boundaries. For this reason, the main interpretation of the results is based on the continuous FMCE trajectory, while the threshold classes are used only to improve the readability of the temporal pattern.
These values reflect the dominant role of coal in shaping emission pressure, as identified in the empirical analysis. The overall emission pressure index for year , denoted as , is calculated as a weighted linear aggregation of fuzzy membership degrees (Formula (6)):
Expanding for specific variables (Formula (7)):
The resulting index takes values in the interval , where higher values indicate stronger emission pressure. To better understand the internal structure of the index, a decomposition of the FMCE index into individual contributions was performed. The contribution of each variable is defined as (Formula (8)):
Thus (Formula (9)):
This decomposition allows for the identification of dominant drivers of emission pressure in each year and enables a dynamic structural analysis of the system. To capture long-term dynamics, the analysis was extended by grouping years into sub-periods and computing average FMCE values (Formula (10)):
where denotes a specific sub-period and is the number of years in that period.
The change between periods is defined as (Formula (11)):
This approach supports the descriptive identification of periods in which the transformation process changed its intensity. The FMCE index is understood as a composite indicator of selected energy-related emission pressure, representing the combined arrangement of the variables included in the model. The method is based on continuous membership degrees and therefore preserves the gradual character of changes in the index. However, the subsequent division of the FMCE values into low, moderate, and high classes is an additional descriptive step, not a formal fuzzy classification procedure or a statistically estimated regime model.
For interpretative purposes, the FMCE index was divided into three qualitative emission-pressure classes. Values from 0.000 to 0.333 were interpreted as low emission pressure, values from 0.334 to 0.666 as moderate emission pressure, and values from 0.667 to 1.000 as high emission pressure. These equal-width intervals were adopted because the FMCE index is normalized to the 0–1 range. However, this classification is a descriptive convention only. It does not represent statistically estimated thresholds, fuzzy corridors, or objectively separated transition regimes. Therefore, the study does not avoid classification in a literal sense; rather, it avoids treating the classes as rigid empirical regimes.
The fixed threshold ranges were used only as an interpretative device and not as statistically estimated boundaries between objectively separated regimes. Since the FMCE index is normalized to the interval [0, 1], the equal-width division into low, moderate, and high emission pressure provides a transparent and replicable classification rule. However, this approach is relatively rigid and may be sensitive to boundary values. For this reason, the classification should be interpreted as descriptive rather than deterministic. The main analytical result of the study is the continuous FMCE trajectory, whereas the threshold classes are used only to facilitate the interpretation of changes over time. To reduce the arbitrariness of stage interpretation, the empirical results additionally report within-stage dispersion using standard deviation, minimum, and maximum FMCE values.
The periodization used in the empirical interpretation was not treated as a set of formally estimated statistical regimes. It was derived from a combined interpretation of four elements: the continuous FMCE trajectory, changes in average FMCE values between subperiods, the stability or instability of threshold classes, and the broader energy-policy context of Poland’s transition. The first phase, 2000–2007, represents a period of consistently high emission pressure. The second phase, 2008–2013, reflects transitional instability, because the FMCE index alternated between high and moderate values. The third phase, 2014–2018, represents moderate stabilization, as the index remained within a narrower moderate-pressure range. The final phase, 2019–2023, captures the movement toward lower relative emission pressure within the analyzed sample. Therefore, the periodization should be understood as a descriptive and analytically justified structure supporting interpretation, not as a formal change-point model.
5. Results
The findings are reported in line with the methodological sequence adopted in the study and presented earlier in Figure 2 in Section 4. The organization of the results therefore mirrors the logic of the research procedure: first, the synthetic indicator is constructed, and then the structural patterns of the transition observed over time are interpreted.
Table 3 shows the values of the synthetic emission pressure index for Poland in 2000–2023, calculated using the Fuzzy Multi-Criteria Evaluation (FMCE) method. The index was developed through weighted aggregation of fuzzy membership degrees assigned to four variables: gross domestic product, hard coal consumption, natural gas consumption, and renewable energy production. GDP, hard coal, and natural gas were included as variables increasing emission pressure, while renewable energy was treated as a compensating factor that reduces environmental pressure within the energy system.
Table 3.
FMCE-based emission pressure index for Poland (2000–2023).
The table presents annual index values scaled from 0 to 1, together with qualitative classifications of emission pressure: low, moderate, and high. This format enables a synthetic assessment of long-term structural changes in Poland’s energy–economic system. The results also show that the transition did not proceed in a linear or uniform way. Some years point to relative stabilization, whereas others reflect transitional instability caused by shifts in the fuel structure, economic growth, and the gradual incorporation of renewable energy sources into the national energy mix.
The qualitative classification of the FMCE index was based on fixed threshold intervals. Values from 0.000 to 0.333 were classified as low emission pressure, values from 0.334 to 0.666 as moderate emission pressure, and values from 0.667 to 1.000 as high emission pressure. The same classification thresholds were applied consistently across all tables and figures. These thresholds should be treated as a descriptive convention, not as empirically estimated transition boundaries.
These thresholds should be understood as a transparent descriptive convention. They do not imply that the transition process is divided into objectively separated regimes. For this reason, the numerical FMCE trajectory and the sensitivity analysis of alternative thresholds are used to check whether the substantive interpretation depends on the adopted classification rule.
The values reported in Table 3 show that emission pressure changed markedly over time. In the first years of the analysis, the index remained relatively high, indicating that Poland’s energy–economic system was still dominated by emission-intensive conditions. Between 2000 and 2007, emission pressure stayed at an elevated level, which suggests that fossil fuels continued to shape the system’s structure to a considerable extent. The particularly high value recorded in 2003 reflects an especially unfavorable configuration of variables, mainly connected with the strong position of fossil fuel consumption in the national energy mix.
The years 2008–2013 can be interpreted as an unstable transitional phase. During this period, the FMCE index no longer remained uniformly high, but it did not yet form a stable moderate-pressure regime. Several years, including 2008, 2010, 2011, and 2013, still belonged to the high-pressure category, whereas 2009 and 2012 moved into the moderate category. This pattern indicates a partial weakening of emission pressure rather than a completed transition to a moderate regime.
In 2014–2018, emission pressure stabilized at a moderate level. The index remained close to intermediate values, suggesting a temporary balance between variables that increased emissions and variables that weakened emission pressure. Structurally, this means that the energy transition was progressing, but not yet strongly enough to create a stable low-emission configuration. A more visible change appeared after 2018, when the index began to fall more clearly.
After 2018, the FMCE index declined markedly, indicating a transition toward lower relative emission pressure within the analyzed sample. However, this result should not be interpreted as evidence that Poland reached an absolute low-emission state. According to the adopted threshold classification, only 2020 and 2023 fall into the low-emission-pressure category, and this classification refers to the normalized FMCE scale for the 2000–2023 period. The lowest value recorded in 2023 therefore indicates the greatest departure from the high-emission profile observed within the sample, not the full elimination of coal dependence or the achievement of sufficient renewable energy penetration in absolute policy terms.
Taken together, Figure 3 points to a long-term decline in emission pressure, although the course of this change was uneven and included phases of adjustment, slowdown, and temporary stabilization. The FMCE approach captures this process more fully than standard linear methods because it combines several interacting factors and accounts for their nonlinear and fuzzy relationships. The results therefore suggest that Poland’s energy transition should be interpreted as a gradual, multidimensional, and structurally embedded process. Its effects do not result from isolated changes in individual variables, but from broader reconfigurations within the whole energy–economic system.
Figure 3.
Trend of emission pressure in Poland with periods of energy transformation. Source: own research.
To validate the interpretative relevance of the FMCE index, the index values were compared with observed carbon emissions, which were used in this study as a contextual reference variable. The purpose of this comparison was not to transform the FMCE index into a causal econometric model, but to assess whether the synthetic emission-pressure measure captures a meaningful emission-related phenomenon. The results indicate a strong positive association between the FMCE index and observed CO2 emissions. The Pearson correlation coefficient between the FMCE index and carbon emissions for 2000–2023 equals (r = 0.815) (p = 0.0000012), while the Spearman rank correlation equals (ρ = 0.731) (p = 0.000050). The relationship is also visible in year-to-year changes, where the Pearson correlation between annual changes in the FMCE index and annual changes in CO2 emissions equals (r = 0.714) (p = 0.000132). The Spearman correlation for annual changes equals (ρ = 0.747) (p = 0.000042).
The validation confirms that the FMCE index is meaningfully related to observed emission dynamics (Table 4). The index captures several major turning points, including the decline in 2009, the weakening of emission pressure after 2014, the marked decrease in 2019–2020, and the lowest emission-pressure value in 2023. At the same time, the comparison also reveals some divergences. In 2017–2018, observed CO2 emissions remained high, while the FMCE index indicated only moderate emission pressure. In 2022, the FMCE index declined, whereas observed CO2 emissions increased. These divergences show that the FMCE index should not be interpreted as a direct substitute for measured emissions. Rather, it reflects the structural configuration of selected energy–economic variables that generate emission pressure. Actual emissions may also be affected by short-term production, weather conditions, electricity demand, fuel quality, imports, and operational factors not directly included in the FMCE model.
Table 4.
Validation of the FMCE index against observed CO2 emissions.
The proposed periodization is therefore based on the observed structure of the FMCE trajectory rather than on arbitrary calendar divisions alone (Table 5). The first period is characterized by consistently high index values, while the second period shows instability and movement between high and moderate pressure. The third period reflects a more stable moderate configuration, and the final period shows the strongest decline toward lower relative emission pressure. This interpretation supports the use of the four phases as descriptive analytical periods, while avoiding the overinterpretation of these phases as statistically estimated regimes.
Table 5.
Justification of the emission-pressure periodization.
Table 6 reports the degree to which selected macro-energy variables belong to fuzzy sets associated with high emission pressure in Poland between 2000 and 2023. For GDP, hard coal consumption, and natural gas consumption, the values express membership in the “high” category. Renewable energy sources were treated differently, using the inverse variable RES_low. Under this specification, insufficient renewable energy penetration is interpreted as a condition that strengthens emission pressure in the energy system.
Table 6.
Fuzzy membership degrees (2000–2023).
To make the variables comparable, all of them were transformed to a common 0–1 scale using min–max normalization. This step was required because the variables differ substantially in their original units, ranges, and empirical magnitudes. Standardization therefore made it possible to compare fuzzy membership degrees across dimensions that represent different aspects of the energy–economic system. Without this procedure, the interpretation of membership values would be methodologically weak and potentially misleading.
The membership values presented in Table 2 show a pronounced structural change in Poland’s energy–economic system over the analyzed period. The GDP_high variable rises almost continuously, moving from values close to zero at the beginning of the series to values approaching the maximum level in the final years. This trajectory reflects sustained economic growth in Poland. However, the relatively regular and stable course of this variable suggests that GDP acts mainly as a broad systemic condition rather than as the main source of short-term variation in emission pressure.
A different and more structurally significant pattern is visible for coal_high. In the early years of the analysis, this variable reaches high values, close to one, which confirms the dominant position of coal in the national energy structure. Over time, however, the indicator declines clearly, approaching values close to zero by 2023. This pattern points to a deep restructuring of the energy system, in which coal gradually loses its previous role as the central energy carrier. Although this decline was not entirely smooth and included year-to-year fluctuations, the overall direction of change remains clear.
The gas_high variable follows another path. Its values generally increase over time, but with greater volatility than in the case of GDP. At the beginning of the period, the membership degree in the high-gas-consumption category is relatively low. In later years, however, it rises, reaching its highest level around 2021. This indicates the growing role of natural gas as a transition fuel used partly to replace more emission-intensive sources. Its environmental meaning remains ambiguous. Compared with coal, gas may reduce emission intensity, but it also maintains the dependence of the energy system on fossil fuels.
The RES_low variable captures one of the most important dimensions of the transition, because it is defined inversely to renewable energy production. At the beginning of the analyzed period, RES_low takes values close to one, which means that renewable energy penetration was very limited and therefore associated with a high-emission system structure. In subsequent years, the value of this variable declines steadily, reaching levels close to zero by 2023. This reflects the growing importance of renewable energy sources and their increasing role in weakening emission pressure.
Taken together, the results confirm that Poland’s energy transition is a multidimensional process shaped by the interaction of several mechanisms: economic growth, the declining role of coal, the increasing use of natural gas, and the rapid development of renewable energy sources. The central effect of this transformation is a gradual movement away from a fossil-fuel-dominated, high-emission configuration toward a more diversified system in which emission-reducing factors become increasingly important.
Table 7 ranks the years from 2000 to 2023 according to the level of emission pressure measured by the FMCE index. Each year is assigned a normalized synthetic value ranging from 0 to 1 and a corresponding rank. Higher index values indicate stronger emission pressure resulting from the configuration of the energy–economic system. The ranking makes it possible to identify years with the highest and lowest emission pressure and to compare the relative position of each year within the full time series.
Table 7.
Ranking of emission pressure (FMCE).
The ranking based on the FMCE index shows that the strongest emission pressure was concentrated in the early years of the analyzed period. The highest index values occur in 2000–2007, with the peak recorded in 2003. This indicates that, at the beginning of the period, Poland’s energy system was still organized around a highly emission-intensive structure, dominated primarily by fossil fuels and especially coal. The high ranking positions of 2004–2007 further confirm that this configuration remained relatively stable and that mechanisms capable of reducing emission pressure were still weak at that stage.
The middle part of the ranking reflects a gradual but uneven reduction in emission pressure. Some years after 2008 still remained in the high-pressure category, particularly 2010, 2011, and 2013, which confirms the persistence of structural inertia in the Polish energy system. At the same time, the increasing number of moderate-pressure years after 2009 indicates that emission-reducing mechanisms were gradually becoming more visible.
The lowest positions in the ranking are occupied by the years after 2018, especially 2019–2023. This period is characterized by a visibly weaker level of emission pressure. The final year, 2023, ranks last, which means that it represents the configuration most distant from the high-emission profile observed at the beginning of the study period. This suggests that the final stage of the analysis was marked by a substantial structural shift toward a less emission-intensive energy model, reflected in the consistently lower values of the FMCE index.
Table 5 presents changes in Poland’s emission pressure across four subperiods distinguished on the basis of average FMCE index values. The mean value calculated for each subperiod represents the general level of emission pressure generated by the structure of the energy–economic system. The “Change” column shows both the direction and the scale of movement between consecutive stages. This approach makes it possible to describe changes in average FMCE values across predefined sub-periods and to identify periods in which the transformation process appears to have changed its intensity.
The first subperiod, 2000–2007, records the highest average index value, equal to 0.793. This indicates a consolidated high-emission configuration. During these years, the Polish energy system remained strongly dependent on conventional energy sources, especially coal, while alternative sources still played only a marginal role. Since this interval constitutes the baseline for comparison, no change value is reported for this stage.
The second subperiod, 2008–2013, shows a clear decrease in the average FMCE index to 0.655. This represents a reduction of approximately 0.138 points compared with the previous phase. The decline signals the beginning of a more visible structural transformation. It can be linked to the gradual weakening of coal dependence and the increasing role of alternative energy sources in the national energy system.
In the third subperiod, 2014–2018, the average index falls further to 0.569. However, the pace of decline becomes weaker, as shown by the smaller change value of −0.086. This suggests a phase of partial stabilization: the transition continued, but its intensity was lower than in the previous stage. The system was moving away from the high-emission model, although the transformation was still constrained by structural inertia.
The strongest shift appears in the final subperiod, 2019–2023. The average FMCE index drops sharply to 0.337, which is the largest reduction observed in the entire analysis, with a change of −0.232. This decline indicates a breakthrough phase in the transition and points to a substantial restructuring of the system toward a less emission-intensive energy model. Overall, Table 8 confirms that Poland’s energy transition did not follow a linear path. Instead, it developed unevenly, through identifiable phases of acceleration, with the cumulative effects becoming most visible in the final years of the analyzed period. The final subperiod, 2019–2023, shows the strongest decline in the average FMCE index, reaching 0.337. According to the adopted thresholds, this value still belongs to the moderate-pressure category, although it is located very close to the low-pressure boundary. Therefore, this period should be interpreted not as a fully established low-emission regime, but as a transition toward low emission pressure.
Table 8.
Structural change in emission pressure.
Figure 4 presents the average values of the FMCE index across four transition stages, together with ±1 standard deviation error bars calculated from annual FMCE values within each stage. In the first stage, covering 2000–2007, the average FMCE index reached 0.793, which indicates the highest level of emission pressure in the analyzed period. The low standard deviation in this stage, SD = 0.039, shows that annual FMCE values were relatively concentrated around the mean, suggesting a stable high-pressure configuration.
Figure 4.
Average FMCE values by transition stage with ±1 standard deviation error bars. Source: own research.
In the second stage, covering 2008–2013, the average FMCE value declined to 0.655. This represents a decrease of 0.138 compared with the previous stage. At the same time, the standard deviation increased to 0.092, which indicates greater internal variability of the index during this period. This stage can therefore be interpreted as a transitional phase, in which emission pressure began to decline, but the annual values still fluctuated considerably.
In the third stage, covering 2015–2018, the average FMCE index decreased further to 0.569, with a standard deviation of 0.065. The decline between the second and third stages amounted to 0.086. This stage reflects a moderate emission-pressure configuration, with lower dispersion than in the previous phase. The results suggest partial stabilization of the transition trajectory at a lower level of emission pressure.
The fourth stage, covering 2019–2023, shows the lowest average FMCE value, equal to 0.336. The decrease from the third stage amounted to 0.232, which is the largest inter-stage decline shown in the figure. However, this phase also has the highest standard deviation, SD = 0.162, indicating substantial internal variation between annual values. The figure shows a downward trajectory of the FMCE index across successive stages, from high emission pressure in 2000–2007 toward a lower-pressure configuration in 2020–2023.
To examine whether the interpretation of emission-pressure phases depends excessively on the fixed equal-width thresholds, an additional threshold sensitivity analysis was conducted. The baseline classification (0.000–0.333;0.334–0.666;0.667–1.000) was compared with two alternative classification rules: empirical terciles and a mean-based classification using the mean value of the FMCE index ± 0.5 standard deviation. For the full period, the mean FMCE value was 0.630 and the standard deviation was 0.179, which produced mean-based thresholds of 0.540 and 0.719. The empirical tercile thresholds were 0.580 and 0.743 (Table 9).
Table 9.
Threshold sensitivity analysis of emission-pressure classification.
The comparison shows that some boundary years change their class depending on the adopted classification rule. This is expected because emission pressure is treated as a gradual fuzzy phenomenon rather than as a sharply separated state. The main temporal interpretation remains stable. Under all three classification rules, the period 2000–2007 is dominated by high emission pressure, while the years after 2018 are consistently located in the lowest or lower-pressure part of the distribution. The period 2008–2013 remains transitional, and 2014–2018 represents an intermediate stabilization phase (Table 10). Therefore, the equal-width thresholds should be interpreted as a transparent descriptive tool, not as statistically estimated regime boundaries. The main findings of the study are based on the continuous FMCE trajectory, while the threshold classes only support the interpretation of this trajectory.
Table 10.
Classification stability across energy-transition subperiods.
Table 11 disaggregates the synthetic FMCE emission pressure index into the contributions made by its component variables in 2000–2023. For each year, the table shows how gross domestic product, hard coal consumption, natural gas consumption, and renewable energy sources contributed to the final index value. The contribution of each variable was obtained by combining its assigned weight with its fuzzy membership degree, which makes it possible to break down the overall emission pressure index into identifiable structural elements. This decomposition allows the analysis to move beyond the interpretation of the FMCE index as a single composite measure. It shows which variables were most responsible for shaping emission pressure in particular years and how their relative importance changed over time. In this way, the index becomes not only a synthetic indicator of emission pressure, but also a tool for examining the internal structure of that pressure within Poland’s energy–economic system. Methodologically, such a procedure strengthens the interpretability of the results. The final index value can be traced back to specific economic and energy-related components, making it possible to assess how changes in GDP, coal consumption, gas consumption, and renewable energy development influenced the broader structural trajectory of emission pressure.
Table 11.
Fuzzy contribution analysis (2000–2023).
Figure 5 presents the decomposition of the FMCE emission pressure index into the contributions of GDP, hard coal consumption, natural gas consumption, and insufficient renewable energy penetration. The graph shows that coal was the dominant contributor to emission pressure for most of the analyzed period, but its contribution declined substantially over time. At the same time, the contributions of GDP and natural gas became more visible in the later years, while the RES_low component decreased as renewable energy production expanded. This graphical presentation strengthens the interpretation that the decline in emission pressure resulted primarily from the weakening role of coal, but also from broader changes in the structure of the Polish energy–economic system.
Figure 5.
Decomposition of the FMCE emission pressure index by component, 2000–2023. Source: own preparation.
The decomposition of the FMCE index shows that hard coal consumption was the dominant component of emission pressure throughout most of the analyzed period. In the early years, its contribution clearly exceeded all other variables, reaching values above 0.7. This means that most of the total emission pressure generated by the Polish energy–economic system was attributable to coal. Such a structure indicates a highly concentrated energy model, in which emissions were shaped mainly by one carbon-intensive energy carrier. At this stage, the system was poorly diversified and strongly dependent on coal-based energy production.
In later years, the contribution of coal began to decrease, and this decline represents the most important structural tendency visible in Table 5. The reduction was not fully linear. It occurred in phases, with periods of slower adjustment and temporary stabilization. Nevertheless, the long-term direction is clear: by 2023, the coal component had fallen to values close to zero. This points to a fundamental reconfiguration of the energy system and to a substantial weakening of coal as the main source of emission pressure. The diminishing role of coal can therefore be treated as one of the key mechanisms of Poland’s energy transition.
GDP shows the opposite pattern. Its contribution increases systematically across the analyzed period. At the beginning, the GDP component is marginal, but its importance gradually rises and reaches its highest values in the final years of the series. However, even with this upward trend, GDP does not replace coal as the dominant source of emission pressure. Its contribution remains more limited, which suggests that economic growth itself is not the primary driver of emissions. Rather, GDP becomes an increasingly visible background factor reflecting the growing complexity of the relationship between economic development and the energy system.
Natural gas also increases its contribution over time, although its trajectory is more volatile than that of GDP. In the initial years, gas plays only a minor role in the structure of emission pressure. Its contribution becomes more noticeable in later periods, especially after 2014. This reflects the growing importance of natural gas in the transition process, mainly as a substitute for more emission-intensive fuels, particularly coal. At the same time, gas cannot be interpreted as a fully decarbonizing factor. It reduces emission intensity relative to coal, but it still belongs to the fossil-fuel segment of the energy system and therefore occupies an intermediate position.
The RES variable was included in the model as RES_low, which means that the index measures insufficient renewable energy penetration as a source of emission pressure. Higher RES_low values therefore indicate a weaker presence of renewable energy in the national energy mix. The relatively modest contribution of this component results from both the lower weight assigned to it and the structure of the index, in which the impact of renewables is partly indirect. In the final years of the period, the RES_low contribution falls toward zero, reflecting the expansion of renewable energy and the gradual decarbonization of the energy system.
From a dynamic perspective, the results show a clear movement away from a coal-dominated configuration toward a more diversified composition of selected energy–economic variables. This transformation should not be interpreted as evidence of a full infrastructural reorganization of the energy system, because the FMCE model does not include direct infrastructure indicators. Rather, it shows that within the adopted composite index, the declining role of coal was not fully offset by the rising contributions of GDP, natural gas, or RES_low. As a result, the total FMCE index decreases, indicating a reduction in relative emission pressure.
In synthetic terms, the decomposition indicates that the decline in the FMCE index is mainly associated with the decreasing contribution of hard coal within the selected set of variables. The main force behind the reduction in relative emission pressure is therefore the systematic weakening of the most carbon-intensive component included in the model. At the same time, the increasing contributions of GDP and natural gas show that the selected energy–economic configuration becomes more differentiated over time. This should not be interpreted as direct evidence of infrastructural change, but as a change in the composition of the variables included in the composite index.
6. Discussion
The results indicate a gradual decline in the FMCE-based emission-pressure index in Poland between 2000 and 2023. The highest values were recorded in the early part of the period, especially before 2008, when hard coal consumption remained high and renewable electricity production was still marginal. This pattern is consistent with energy transition theory, according to which energy-system transformation is usually gradual, institutionally embedded, and shaped by historically accumulated technological and infrastructural conditions [51,52,53]. The Polish case reflects these assumptions because the initial high FMCE values were associated with a fossil-fuel-based energy configuration, while the later decline of the index resulted mainly from the weakening contribution of hard coal and the increasing role of renewable electricity generation.
The FMCE trajectory should not be interpreted as a causal model of CO2 emissions. It is a composite indicator based on selected energy-related and macroeconomic variables. Its results show changes in the configuration of the variables included in the index, not direct infrastructural transformation of the whole energy system. In this limited sense, the observed decline in emission pressure reflects a movement away from a coal-dominated configuration toward a more diversified energy–economic pattern. Earlier studies on energy transition emphasize that such processes become visible when emission pressure begins to decline and when fossil-fuel dependence weakens over time [54,55,56,57,58,59,60]. The results of this study correspond with this view, although they do not prove that coal reduction alone caused the observed changes in emissions.
The decomposition of the FMCE index shows that hard coal made the largest contribution to emission pressure for most of the analyzed period. This result should be interpreted within the adopted weighting scheme and variable selection. It indicates that the decline in the index was mainly associated with the decreasing role of the coal component, while GDP and natural gas became more visible in the later phases. Renewable electricity production increasingly reduced relative emission pressure, whereas natural gas occupied an ambivalent position. On the one hand, gas may lower emission intensity when it substitutes coal. On the other hand, it remains a fossil fuel and therefore still contributes positively to the FMCE index. This supports a cautious interpretation of gas as a transitional fuel rather than as a long-term basis of a low-emission system.
The results also confirm that Poland’s transition did not follow a uniform trajectory. The index shows periods of decline, stabilization, and temporary fluctuation. This corresponds with theoretical approaches that describe energy transition as an evolutionary, multidimensional, and context-dependent process [61,62,63]. However, the term “structural change” should be used cautiously in this study. The model does not include direct infrastructure indicators, such as installed capacity by technology, grid capacity, storage capacity, power-plant retirements, or industrial process modernization. Therefore, the results show a change in the composition of selected energy–economic variables rather than a full infrastructural reorganization of the Polish energy system.
Some abrupt changes in the FMCE trajectory can also be interpreted in relation to external macroeconomic shocks. The decline around 2008–2009 coincided with the global financial crisis, which affected industrial activity, energy demand, and emission dynamics in many economies. Therefore, the lower value observed in 2009 should not be attributed only to the internal logic of the energy transition. Similarly, the sharp decline in 2020 occurred during the COVID-19 pandemic, when restrictions on economic activity temporarily reduced energy demand and emissions. The rebound in 2021 suggests that part of this decline was temporary. These episodes indicate that the FMCE trajectory reflects both longer-term changes in the selected energy–economic configuration and short-term disturbances caused by external events.
The results can also be interpreted through the lens of decoupling theory, which assumes that economic growth may gradually become separated from environmental degradation and greenhouse gas emissions [64,65,66]. During the analyzed period, Poland recorded economic growth, while the FMCE index declined, especially in the later years. This suggests a partial weakening of the link between economic development and emission pressure. However, this process should not be understood as complete decarbonization. The decomposition results show that fossil fuels, first hard coal and later natural gas, continued to play an important role in the Polish energy system. This is consistent with contemporary interpretations of decoupling, which emphasize that decoupling in transition economies is usually incomplete, gradual, and dependent on institutional adaptation, technological change, and the development of low-emission solutions [67,68,69].
From a governance perspective, the Polish transition remains shaped by the interaction between EU climate policy, national energy strategy, market conditions, energy-security concerns, and investment capacity. The decreasing role of coal and the expansion of renewable energy cannot be explained only by technological substitution. They also depend on regulatory frameworks, infrastructure constraints, administrative coordination, and the involvement of public and private stakeholders. Energy transformation therefore requires coordination across multiple levels of administration and participation of a broad range of actors [70]. In this context, the FMCE index may be treated as a diagnostic tool that organizes selected dimensions of emission pressure into one transparent trajectory, but it should not replace sectoral emission inventories, infrastructure-based analyses, or causal econometric models.
The comparison with Matukhno [71] helps clarify the analytical status of the index developed in this paper. The FMCE index should not be treated as a complete climate-policy performance indicator or as a direct substitute for emission inventories. Rather, it is a focused diagnostic measure of selected structural emission-pressure dimensions. Its value lies in showing how fossil-fuel dependence, renewable electricity expansion, and macroeconomic activity jointly shaped relative emission pressure in Poland between 2000 and 2023. Therefore, the approach complements broader composite-index and climate-policy assessment frameworks by offering a more detailed longitudinal view of one coal-dependent economy undergoing transition.
7. Conclusions
The most valuable findings of this study are related to the identification of structural changes in Poland’s emission pressure over time. The FMCE index shows that the highest emission pressure was concentrated in the early phase of the analyzed period, especially in 2000–2007, when the Polish energy system remained strongly dependent on hard coal. The results also confirm that the transition did not follow a simple linear path, but developed through distinguishable phases: high emission pressure, transitional instability, moderate stabilization, and a recent movement toward lower emission pressure. The decomposition of the FMCE index demonstrates that hard coal was the dominant contributor to emission pressure for most of the period, although its role declined substantially over time. Renewable energy development increasingly weakened emission pressure, but its effect depended on broader system conditions, including grid capacity, storage potential, and the ability to integrate variable renewable generation. Natural gas played an ambiguous role, as it supported the reduction in coal dependence while at the same time maintaining fossil-fuel pressure within the energy system. Overall, the study shows that the FMCE approach provides an interpretable tool for tracing structural emission pressure over time and for identifying the changing contribution of individual energy–economic factors.
This study examined the structural transformation of Poland’s energy–economic system between 2000 and 2023 using a Fuzzy Multi-Criteria Evaluation framework and a synthetic emission pressure index. The first research question concerned how the structure of Poland’s energy–economic system influenced emission pressure over time. The results show that emission pressure was highest in the early phase of the analyzed period, especially in 2000–2007, when the system was still strongly shaped by hard coal consumption. The following years did not show a simple linear transition. Instead, the FMCE trajectory indicates a phased process, with transitional instability in 2008–2013, moderate stabilization in 2014–2018, and a movement toward lower relative emission pressure after 2019.
The second research question concerned the contribution of hard coal reduction to the decline in emission pressure. The decomposition of the FMCE index shows that hard coal was the dominant contributor to emission pressure for most of the analyzed period. Its relative contribution weakened over time, which was associated with the downward movement of the composite index. However, this decline should be interpreted as a relative structural change within the analyzed sample, not as evidence that coal ceased to matter in Poland’s energy system. The findings also show that renewable electricity expansion contributed to the weakening of the RES_low component, while natural gas played an ambiguous role as both a fossil-fuel pressure factor and a possible transitional substitute for coal.
The third research question concerned the usefulness of the FMCE approach for representing gradual and multidimensional relationships between economic growth, fossil fuel consumption, renewable energy development, and emission pressure. The study shows that FMCE provides an interpretable tool for integrating heterogeneous energy–economic variables into one composite measure. Its main empirical contribution is the identification of structural phases in Poland’s emission pressure and the decomposition of the index into component-level contributions. The validation against observed CO2 emissions further indicates that the FMCE index is meaningfully related to actual emission dynamics, although it should not be interpreted as a causal econometric model.
A key contribution of the study is the construction of a composite FMCE-based interpretation showing that, under the adopted variable selection and weighting scheme, the decline in the emission-pressure index was mainly associated with the gradual weakening of hard-coal dependence.
From a practical perspective, the findings underline the need for continued hard coal phase-down, faster renewable electricity integration, grid modernization, and careful governance of natural gas in Poland’s energy transition. The results suggest that reducing emission pressure requires not only expanding renewable generation, but also addressing system-level constraints such as grid capacity, storage, fossil-fuel lock-in, and the interaction between economic growth and energy demand. The proposed FMCE framework can therefore support policy-oriented diagnosis by showing how different energy–economic components jointly shape relative emission pressure over time.
Most valuable conclusions of the paper:
- Poland’s emission pressure decreased in 2000–2023, but not in a simple linear way; the transition occurred through distinct phases, with fluctuations and temporary reversals.
- Hard coal was the dominant source of emission pressure in the FMCE index, and the decline of coal consumption was the main factor behind the observed reduction in the synthetic pressure index.
- Renewable electricity growth increasingly reduced emission pressure, because the RES_low component weakened as renewable production expanded, especially in the later part of the period.
- Natural gas cannot be interpreted only as a clean transition fuel; it may partly replace coal, but in the model it remains a fossil-fuel component contributing to emission pressure.
- The FMCE index is valuable as a diagnostic tool, because it combines GDP, hard coal, natural gas, and insufficient renewable penetration into one decomposable measure showing how Poland’s energy-transition structure changed over time.
8. Limitations and Future Research
The study has some limitations that should be mentioned. The FMCE index is relative to the analyzed 2000–2023 period and should not be interpreted as an absolute measure of decarbonization or emission performance. Its values show Poland’s position within the adopted empirical sample, not universal thresholds of low or high emission pressure. The model also includes only four system-level variables: GDP, hard coal consumption, natural gas consumption, and renewable electricity production. Therefore, it does not directly capture lignite, sectoral emissions, transport, industry, household heating, agriculture, waste, or other detailed sources of carbon emissions.
Limitations also concern variable specification and model interpretation. GDP is measured in current prices, so it reflects not only real economic growth but also inflation and changes in the general price level. Renewable energy is represented by absolute electricity production rather than by its share in total electricity generation or final energy consumption. The results are also influenced by the adopted weighting scheme, although alternative weighting scenarios were used to check robustness. Finally, the FMCE framework should be understood as a synthetic diagnostic tool, not as a causal econometric model; therefore, the findings indicate structural patterns of emission pressure rather than direct causal effects.
Future research should extend the FMCE framework beyond the Polish case and test its usefulness in other coal-dependent or fossil-fuel-dependent economies. The model could also be developed by using alternative variable specifications, such as real GDP or industrial output instead of nominal GDP, a combined hard coal and lignite variable, RES share indicators instead of absolute renewable electricity production, and additional variables reflecting storage capacity, grid flexibility, carbon pricing, energy imports, and climate-policy instruments. Further studies could also compare ARDL-based weights with expert-based, entropy-based, and scenario-based weighting schemes. The FMCE approach could be combined with formal change-point analysis, econometric validation, or energy-system modeling to better distinguish structural emission pressure from short-term fluctuations in observed CO2 emissions.
Author Contributions
Conceptualization, R.W. (Radosław Wolniak), B.G., M.J. and R.W. (Robert Wolny); methodology, R.W. (Radosław Wolniak); software, B.G.; validation, B.G. and W.W.G.; formal analysis, R.W. (Radosław Wolniak); investigation, R.W. (Robert Wolny); resources, B.G. and R.W. (Robert Wolny); data curation, B.G. and R.W. (Robert Wolny); writing—original draft preparation, B.G., M.J., R.W. (Radosław Wolniak) and R.W. (Robert Wolny); writing—review and editing, B.G., R.W. (Radosław Wolniak), M.J., R.W. (Robert Wolny) and W.W.G.; visualization, B.G.; supervision, B.G.; project administration, R.W. (Radosław Wolniak); funding acquisition, R.W. (Radosław Wolniak). All authors have read and agreed to the published version of the manuscript.
Funding
This research received no external funding.
Data Availability Statement
The original contributions presented in this study are included in the article. Further inquiries can be directed to the corresponding author.
Conflicts of Interest
The authors declare no conflicts of interest.
References
- European Commission. The European Green Deal; COM(2019) 640 final; European Commission: Brussels, Belgium, 2019. [Google Scholar]
- European Commission. “Fit for 55”: Delivering the EU’s 2030 Climate Target on the Way to Climate Neutrality; COM(2021) 550 final; European Commission: Brussels, Belgium, 2021. [Google Scholar]
- European Parliament; Council of the European Union. Directive (EU) 2023/2413 of the European Parliament and of the Council of 18 October 2023 Amending Directive (EU) 2018/2001 as Regards the Promotion of Energy from Renewable Sources. Off. J. Eur. Union 2023. Available online: https://eur-lex.europa.eu/eli/dir/2023/2413/oj/eng (accessed on 30 April 2026).
- United Nations. Paris Agreement. United Nations Framework Convention on Climate Change (UNFCCC); United Nations: Paris, France, 2015. [Google Scholar]
- Energy Policy of Poland Until 2040 (EPP2040); Ministry of Climate and Environment: Warsow, Poland, 2021. Available online: https://www.gov.pl/web/climate/energy-policy-of-poland-until-2040-epp2040 (accessed on 30 April 2026).
- Musibau, H.; Gold, K.L.; Abdulrasheed, Z.; Muili, H.A. Poland’s Net-Zero Pathways: Moderating Role of Carbon Tax and Renewable Energy on Electricity Generation. J. Environ. Manag. 2025, 380, 124848. [Google Scholar] [CrossRef] [Scilit]
- Sadowska, B.; Wójcik-Jurkiewicz, M.; Zimon, G.; Lulek, A.; Stępnicka, N.; Walasek, R. The Business Model in Energy Sector Reporting—A Case Study from Poland: A Pilot Study. Energies 2023, 16, 1955. [Google Scholar] [CrossRef] [Scilit]
- Aydın, B.; Stecuła, K.; Olczak, P.; Kulpa, J.; Stecuła, B. Exploring the Green Horizon: Recent Research on Renewable Energy in Poland—A Review. Energies 2025, 18, 1695. [Google Scholar] [CrossRef] [Scilit]
- Raihan, A.; Voumik, L.C.; Zimon, G.; Sadowska, B.; Rashid, M. Prioritising Sustainability: How Economic Growth, Energy Use, Forest Area, and Globalization Impact on Greenhouse Gas Emissions and Load Capacity in Poland? Int. J. Sustain. Energy 2024, 43, 2361410. [Google Scholar] [CrossRef] [Scilit]
- Piwowar, A.; Dzikuć, M. The Economic and Social Dimension of Energy Transformation in the Face of the Energy Crisis: The Case of Poland. Energies 2024, 17, 403. [Google Scholar] [CrossRef] [Scilit]
- Gajdzik, B.; Nagaj, R.; Žuromskaitė-Nagaj, B.; Wolniak, R. Industrial Energy Efficiency Versus Energy Poverty in the European Union: Macroeconomic and Social Relationships. Energies 2026, 19, 267. [Google Scholar] [CrossRef] [Scilit]
- Martin, M.; Broughel, A. Just Energy Transition: Navigating Poland’s Transition Away from Coal Mining. Prog. Energy 2025, 7, 023001. [Google Scholar] [CrossRef] [Scilit]
- Sokołowski, J.; Frankowski, J.; Mazurkiewicz, J.; Lewandowski, P. Hard coal phase-out and the labour market transition pathways: The case of Poland. Environ. Innov. Soc. Transit. 2022, 43, 80–98. [Google Scholar] [CrossRef] [Scilit]
- Kochanek, E. Poland’s Energy Transformation in the Context of the Challenges of the European Green Deal. Rocz. Inst. Eur. Srod.-Wschod. 2022, 20, 81–108. [Google Scholar] [CrossRef] [Scilit]
- Suproń, B.; Myszczyszyn, J. Impact of Renewable and Non-Renewable Energy Consumption and CO2 Emissions on Economic Growth in the Visegrad Countries. Energies 2023, 16, 7163. [Google Scholar] [CrossRef] [Scilit]
- Stern, D.I. The Role of Energy in Economic Growth. Ann. N. Y. Acad. Sci. 2011, 1219, 26–51. [Google Scholar] [CrossRef] [Scilit] [PubMed]
- Ang, B.W. Decomposition Analysis for Policymaking in Energy: Which Is the Preferred Method? Energy Policy 2004, 32, 1131–1139. [Google Scholar] [CrossRef] [Scilit]
- Sovacool, B.K. How Long Will It Take? Conceptualizing the Temporal Dynamics of Energy Transitions. Energy Res. Soc. Sci. 2016, 13, 202–215. [Google Scholar] [CrossRef] [Scilit]
- International Energy Agency. World Energy Outlook 2021; IEA: Paris, France, 2021; Available online: https://www.iea.org/reports/world-energy-outlook-2021 (accessed on 25 April 2026).
- Figueira, J.; Greco, S.; Ehrgott, M. Multicriteria Decision Analysis: State of the Art Surveys; Springer: New York, NY, USA, 2016. [Google Scholar]
- Zhou, P.; Ang, B.W.; Poh, K.L. A Survey of Data Envelopment Analysis in Energy and Environmental Studies. Eur. J. Oper. Res. 2008, 189, 1–18. [Google Scholar] [CrossRef] [Scilit]
- Wang, Q.; Wang, L. Renewable energy consumption and economic growth in OECD countries: A nonlinear panel data analysis. Energy 2020, 207, 118200. [Google Scholar] [CrossRef] [Scilit]
- OECD. Handbook on Constructing Composite Indicators: Methodology and User Guide; OECD Publishing: Paris, France, 2008; Available online: https://www.oecd.org/content/dam/oecd/en/publications/reports/2008/08/handbook-on-constructing-composite-indicators-methodology-and-user-guide_g1gh9301/9789264043466-en.pdf (accessed on 28 April 2026).
- Zadeh, L.A. Fuzzy Sets. Inf. Control 1965, 8, 338–353. [Google Scholar] [CrossRef] [Scilit]
- Zimmermann, H.-J. Fuzzy Set Theory—And Its Applications, 4th ed.; Springer: Berlin/Heidelberg, Germany, 2011. [Google Scholar]
- Munda, G. Multiple criteria decision analysis and sustainable development. In Multiple Criteria Decision Analysis: State of the Art Surveys; Figueira, J., Greco, S., Ehrgott, M., Eds.; Springer: New York, NY, USA, 2005; pp. 1235–1267. [Google Scholar]
- Kahraman, C. (Ed.) Fuzzy Multi-Criteria Decision Making: Theory and Applications with Recent Developments; Springer: New York, NY, USA, 2008. [Google Scholar]
- Doukas, H.; Karakosta, C.; Psarras, J. Supporting Sustainable Energy Decision Making Using Fuzzy Cognitive Maps. Energy Policy 2010, 38, 3864–3877. [Google Scholar] [CrossRef] [Scilit]
- Şengül, Ü.; Eren, M.; Shiraz, S.E.; Gezder, V.; Şengül, A.B. Fuzzy TOPSIS method for ranking renewable energy supply systems in Turkey. Renew. Energy 2015, 75, 617–625. [Google Scholar] [CrossRef] [Scilit]
- Lenarczyk, A.; Jaskólski, M.; Bućko, P. The Application of a Multi-Criteria Decision-Making for Indication of Directions of the Development of Renewable Energy Sources in the Context of Energy Policy. Energies 2022, 15, 9629. [Google Scholar] [CrossRef] [Scilit]
- Janikowska, O.; Ahmed, J. Comparative Energy Transformation Management: Poland and Germany’s Path to Sustainability; Scientific Papers of Silesian University of Technology, Organization and Management Series, No. 221; Silesian University of Technology Publishing House: Gliwice, Poland, 2025. [Google Scholar] [CrossRef] [Scilit]
- Republic of Poland. Act of 20 February 2015 on Renewable Energy Sources; Journal of Laws of 2015, item 478, as amended; Climate Change Laws of the World: London, UK, 2015. [Google Scholar]
- Gajdzik, B.; Jaciow, M.; Wolniak, R.; Wolny, R.; Grebski, W.W. Diagnosis of the Development of Energy Cooperatives in Poland—A Case Study of a Renewable Energy Cooperative in the Upper Silesian Region. Energies 2024, 17, 647. [Google Scholar] [CrossRef] [Scilit]
- Jasiński, J.; Kozakiewicz, M.; Sołtysik, M. Determinants of Energy Cooperatives’ Development in Rural Areas—Evidence from Poland. Energies 2021, 14, 319. [Google Scholar] [CrossRef] [Scilit]
- Olczak, P.; Olek, M.; Matuszewska, D.; Dyczko, A.; Mania, T. Monofacial and Bifacial Micro PV Installation as Element of Energy Transition—The Case of Poland. Energies 2021, 14, 499. [Google Scholar] [CrossRef] [Scilit]
- Gajdzik, B.; Jaciow, M.; Wolniak, R.; Wolny, R.; Grebski, W.W. Energy Behaviors of Prosumers in Example of Polish Households. Energies 2023, 16, 3186. [Google Scholar] [CrossRef] [Scilit]
- Igliński, B.; Piechota, G.; Kiełkowska, U.; Kujawski, W.; Pietrzak, M.B.; Skrzatek, M. The assessment of solar photovoltaic in Poland: The photovoltaics potential, perspectives and development. Clean Technol. Environ. Policy 2022, 25, 281–298. [Google Scholar] [CrossRef] [Scilit] [PubMed]
- Gajdzik, B.; Wolniak, R.; Nagaj, R.; Žuromskaitė-Nagaj, B.; Grebski, W. Energy Waste as a Side-Effect of Photovoltaic Development: Net Impact of Photovoltaics on CO2 Emissions in European Union Countries. Energies 2025, 18, 78. [Google Scholar] [CrossRef] [Scilit]
- Janaszek, A.; Nartowska, E.; Rozenvalde, A.; Zotovs, I. Comparison of the Use of Renewable Energy Sources (RES) by Poland and Latvia in the Perspective of the Environmental Objectives Set by the European Union. Civ. Environ. Eng. Rep. 2023, 33, 111–128. [Google Scholar] [CrossRef] [Scilit]
- Lipka, M. Future Polish Zero-Carbon Energy Mix Combining Renewable and Nuclear Energy Sources. Arab. J. Sci. Eng. 2023, 50, 3177–3186. [Google Scholar] [CrossRef] [Scilit]
- Rybak, A.; Joostberens, J. Scenarios of Carbon Capture and Storage Importance in the Process of Energy System Transformation in Poland. Energies 2025, 18, 2278. [Google Scholar] [CrossRef] [Scilit]
- Gajdzik, B.; Wolniak, R.; Sączewska-Piotrowska, A.; Grebski, W.W. Polish Steel Production Under Conditions of Decarbonization—Steel Volume Forecasts Using Time Series and Multiple Linear Regression. Energies 2025, 18, 1627. [Google Scholar] [CrossRef] [Scilit]
- Dusiło, M. Transformacja Energetyczna w Polsce. Edycja 2023. Forum Energii. April 2023. Available online: https://www.cire.pl/files/portal/186/news/332418/d6e83ec558e69cc4c8e518a9e4f79696c49daf9e7de2b152793fcc65d24ce4d7.pdf (accessed on 6 May 2026).
- Kwidziński, K.; Dusiło, M. Transformacja Energetyczna w Polsce. Edycja 2025. Forum Energii. Forum Energii. July 2025. Available online: https://www.forum-energii.eu/transformacja-energetyczna-polski-edycja-2025 (accessed on 30 April 2026).
- Statistics Poland. Energy from Renewable Sources in 2024; Statistics Poland: Warsaw, Poland, 2025. Available online: https://stat.gov.pl/obszary-tematyczne/srodowisko-energia/energia/energia-ze-zrodel-odnawialnych-w-2024-r-,3,19.html (accessed on 2 May 2026). (In Polish)
- Statistics Poland. Environmental Protection 2025; Statistics Poland: Warsaw, Poland, 2026. Available online: https://stat.gov.pl/obszary-tematyczne/srodowisko-energia/srodowisko/ochrona-srodowiska-2025,1,26.html (accessed on 2 May 2026). (In Polish)
- Statistics Poland. Energy. Consumption of Fuels and Energy Carriers 2024; Statistics Poland: Warsaw, Poland, 2025. Available online: https://stat.gov.pl/obszary-tematyczne/srodowisko-energia/energia/zuzycie-paliw-i-nosnikow-energii-w-2024-r-,6,19.html (accessed on 2 May 2026). (In Polish)
- Statistics Poland. Fuel Energy Economy in the Years 2023–2024; Statistics Poland: Warsaw, Poland, 2025. Available online: https://stat.gov.pl/obszary-tematyczne/srodowisko-energia/energia/gospodarka-paliwowo-energetyczna-w-latach-2023-i-2024,4,20.html (accessed on 26 April 2026). (In Polish)
- Gajdzik, B.; Wolniak, R.; Nagaj, R.; Grebski, W.W.; Romanyshyn, T. Barriers to Renewable Energy Source (RES) Installations as Determinants of Energy Consumption in EU Countries. Energies 2023, 16, 7364. [Google Scholar] [CrossRef] [Scilit]
- Statistics Poland. National Accounts; Statistics Poland: Warsaw, Poland, 2024. Available online: https://stat.gov.pl/obszary-tematyczne/rachunki-narodowe/roczne-rachunki-narodowe/informacja-glownego-urzedu-statystycznego-w-sprawie-skorygowanego-szacunku-produktu-krajowego-brutto-za-2024-r-,9,11.html (accessed on 26 April 2026). (In Polish)
- Atutxa, E.; Calvo-Sotomayor, I.; Mendizabal, X. Governing beyond market and state: A grounded theory of public–commons partnerships in Spain’s energy transition. Energy Res. Soc. Sci. 2026, 131, 104528. [Google Scholar] [CrossRef] [Scilit]
- Aasa, O.P.; Phoya, S.; Monko, R.J.; Musonda, I. A theory-based decision support framework for energy transition: Pluralized perspective. Front. Sustain. 2026, 6, 1703098. [Google Scholar] [CrossRef] [Scilit]
- Liu, Z.; Qian, Q.K.; Li, B.; Jin, C.; Visscher, H. Dutch householders’ intentions to adopt shallow geothermal systems for energy transition of existing buildings: A theory of planned behavior approach. Energy Build. 2025, 347, 116386. [Google Scholar] [CrossRef] [Scilit]
- Conde, J.J.; Takano-Rojas, H. Rethinking energy transition: Approaches from social representations theory. Energy Res. Soc. Sci. 2025, 122, 104001. [Google Scholar] [CrossRef] [Scilit]
- Passaro, R.; Quinto, I.; Scandurra, G.; Thomas, A. Applying the Theory of Planned Behaviour to Predict Investment Intention in Energy Transition by Small Businesses’ Owners. Bus. Strategy Environ. 2025, 35, 5378–5393. [Google Scholar] [CrossRef] [Scilit]
- Grande-Acosta, G.K.; Islas-Samperio, J.M.; Carrasco-Gonzalez, F. Energy Transition Policy of the Mexican Electricity Sector: A Representation in Terms of the Theory of Change. Energies 2024, 17, 5259. [Google Scholar] [CrossRef] [Scilit]
- Libertson, F. Misalignments of theory and practice: Exploring Swedish energy utilities’ understandings of energy justice, flexibility capital, and just energy transitions. Energy Res. Soc. Sci. 2024, 111, 103471. [Google Scholar] [CrossRef] [Scilit]
- Streimikiene, D. Low-carbon Energy Transition from the Lens of Feminist Theories. Contemp. Econ. 2023, 17, 4. [Google Scholar] [CrossRef] [Scilit]
- Peng, M.; Tan, L.; Li, H.; Zhao, W.; Hao, J. Energy Transitions in Yunnan Province Based on Production Function Theory. Energies 2023, 16, 7299. [Google Scholar] [CrossRef] [Scilit]
- Gajdzik, B.; Wolniak, R.; Balaga, D.; Grebski, W. Carbon Emissions Modeling of Coal and Natural Gas Use in Poland’s Net-Zero Energy Transition. Resources 2026, 15, 58. [Google Scholar] [CrossRef] [Scilit]
- Gajdzik, B.; Nagaj, R.; Wolniak, R.; Grebski, W.-W. Mechanisms Shaping Greenhouse Gas Emission Intensity Through the Integration of Power Generation Availability Indicators and Energy Intensity Measures: Case Study of Poland. Energies 2026, 19, 1378. [Google Scholar] [CrossRef] [Scilit]
- Gajdzik, B.; Wolniak, R.; Grebski, W.-W. Poland’s Renewable Energy Transition (2010–2023): A Fuzzy Time Series and Multi-Criteria Assessment of Transition Quality in Electricity Production. Energies 2026, 19, 1248. [Google Scholar] [CrossRef] [Scilit]
- Pietrzak, M.B.; Igliński, B.; Kujawski, W.; Iwański, P. Energy Transition in Poland—Assessment of the Renewable Energy Sector. Energies 2021, 14, 2046. [Google Scholar] [CrossRef] [Scilit]
- Hoa, P.X.; Thu, N.T.P.; Xuan, V.N. Innovation renewable energy and environmental sustainability in Norway: Evidence from ARDL bounds testing. Discov. Sustain. 2026, 7, 501. [Google Scholar] [CrossRef] [Scilit]
- Olah, J.; Amin, M.B.; Hasan, M.; Hossain, M.S.; Rahaman, M.A. Drivers of circular economy transition towards sustainability: A panel data analysis across 18 EU countries. Sustain. Horiz. 2026, 19, 100192. [Google Scholar] [CrossRef] [Scilit]
- Sun, J.; Osmadi, A.; Liu, F.; Chen, K. Economic–environmental synergy in construction: An integrated CCD-PDA-GCA framework for 30 developed economies. Sustainability 2026, 18, 3765. [Google Scholar] [CrossRef] [Scilit]
- Chen, H.; Peng, X.; Wang, Z.; Bo, Y. Research on decoupling relationship among energy consumption, carbon emissions, and economic growth under dual carbon goals in China. In Proceedings of the 2023 3rd Power System and Green Energy Conference (PSGEC 2023); IEEE: New York, NY, USA, 2023. [Google Scholar]
- Hao, F. Toward a low-carbon economy: A study of the economy’s impact on China’s CO2 emissions, 1997–2021. Chin. J. Sociol. 2026, 12, 20–44. [Google Scholar] [CrossRef] [Scilit]
- Palmer, G.; Floyd, J. Unravelling connections: Energy, economic growth, and decoupling through a historical lens. New Political Econ. 2025, 30, 4. [Google Scholar] [CrossRef] [Scilit]
- Zhou, C.; Richardson-Barlow, C. A new framework for collaborative climate governance: Linking consensus building and collective action. Policy Politics 2026, 54, 1–22. [Google Scholar] [CrossRef] [Scilit]
- Matukhno, O.; Stanytsina, V.; Dobrovolska, O.; Artemchuk, V. An Exploratory Protocol for Sustainability-Oriented Cross-Index Assessment of National Climate Policy Effectiveness. Sustainability 2026, 18, 3444. [Google Scholar] [CrossRef] [Scilit]
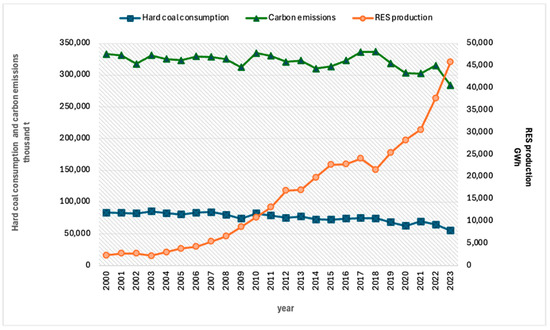
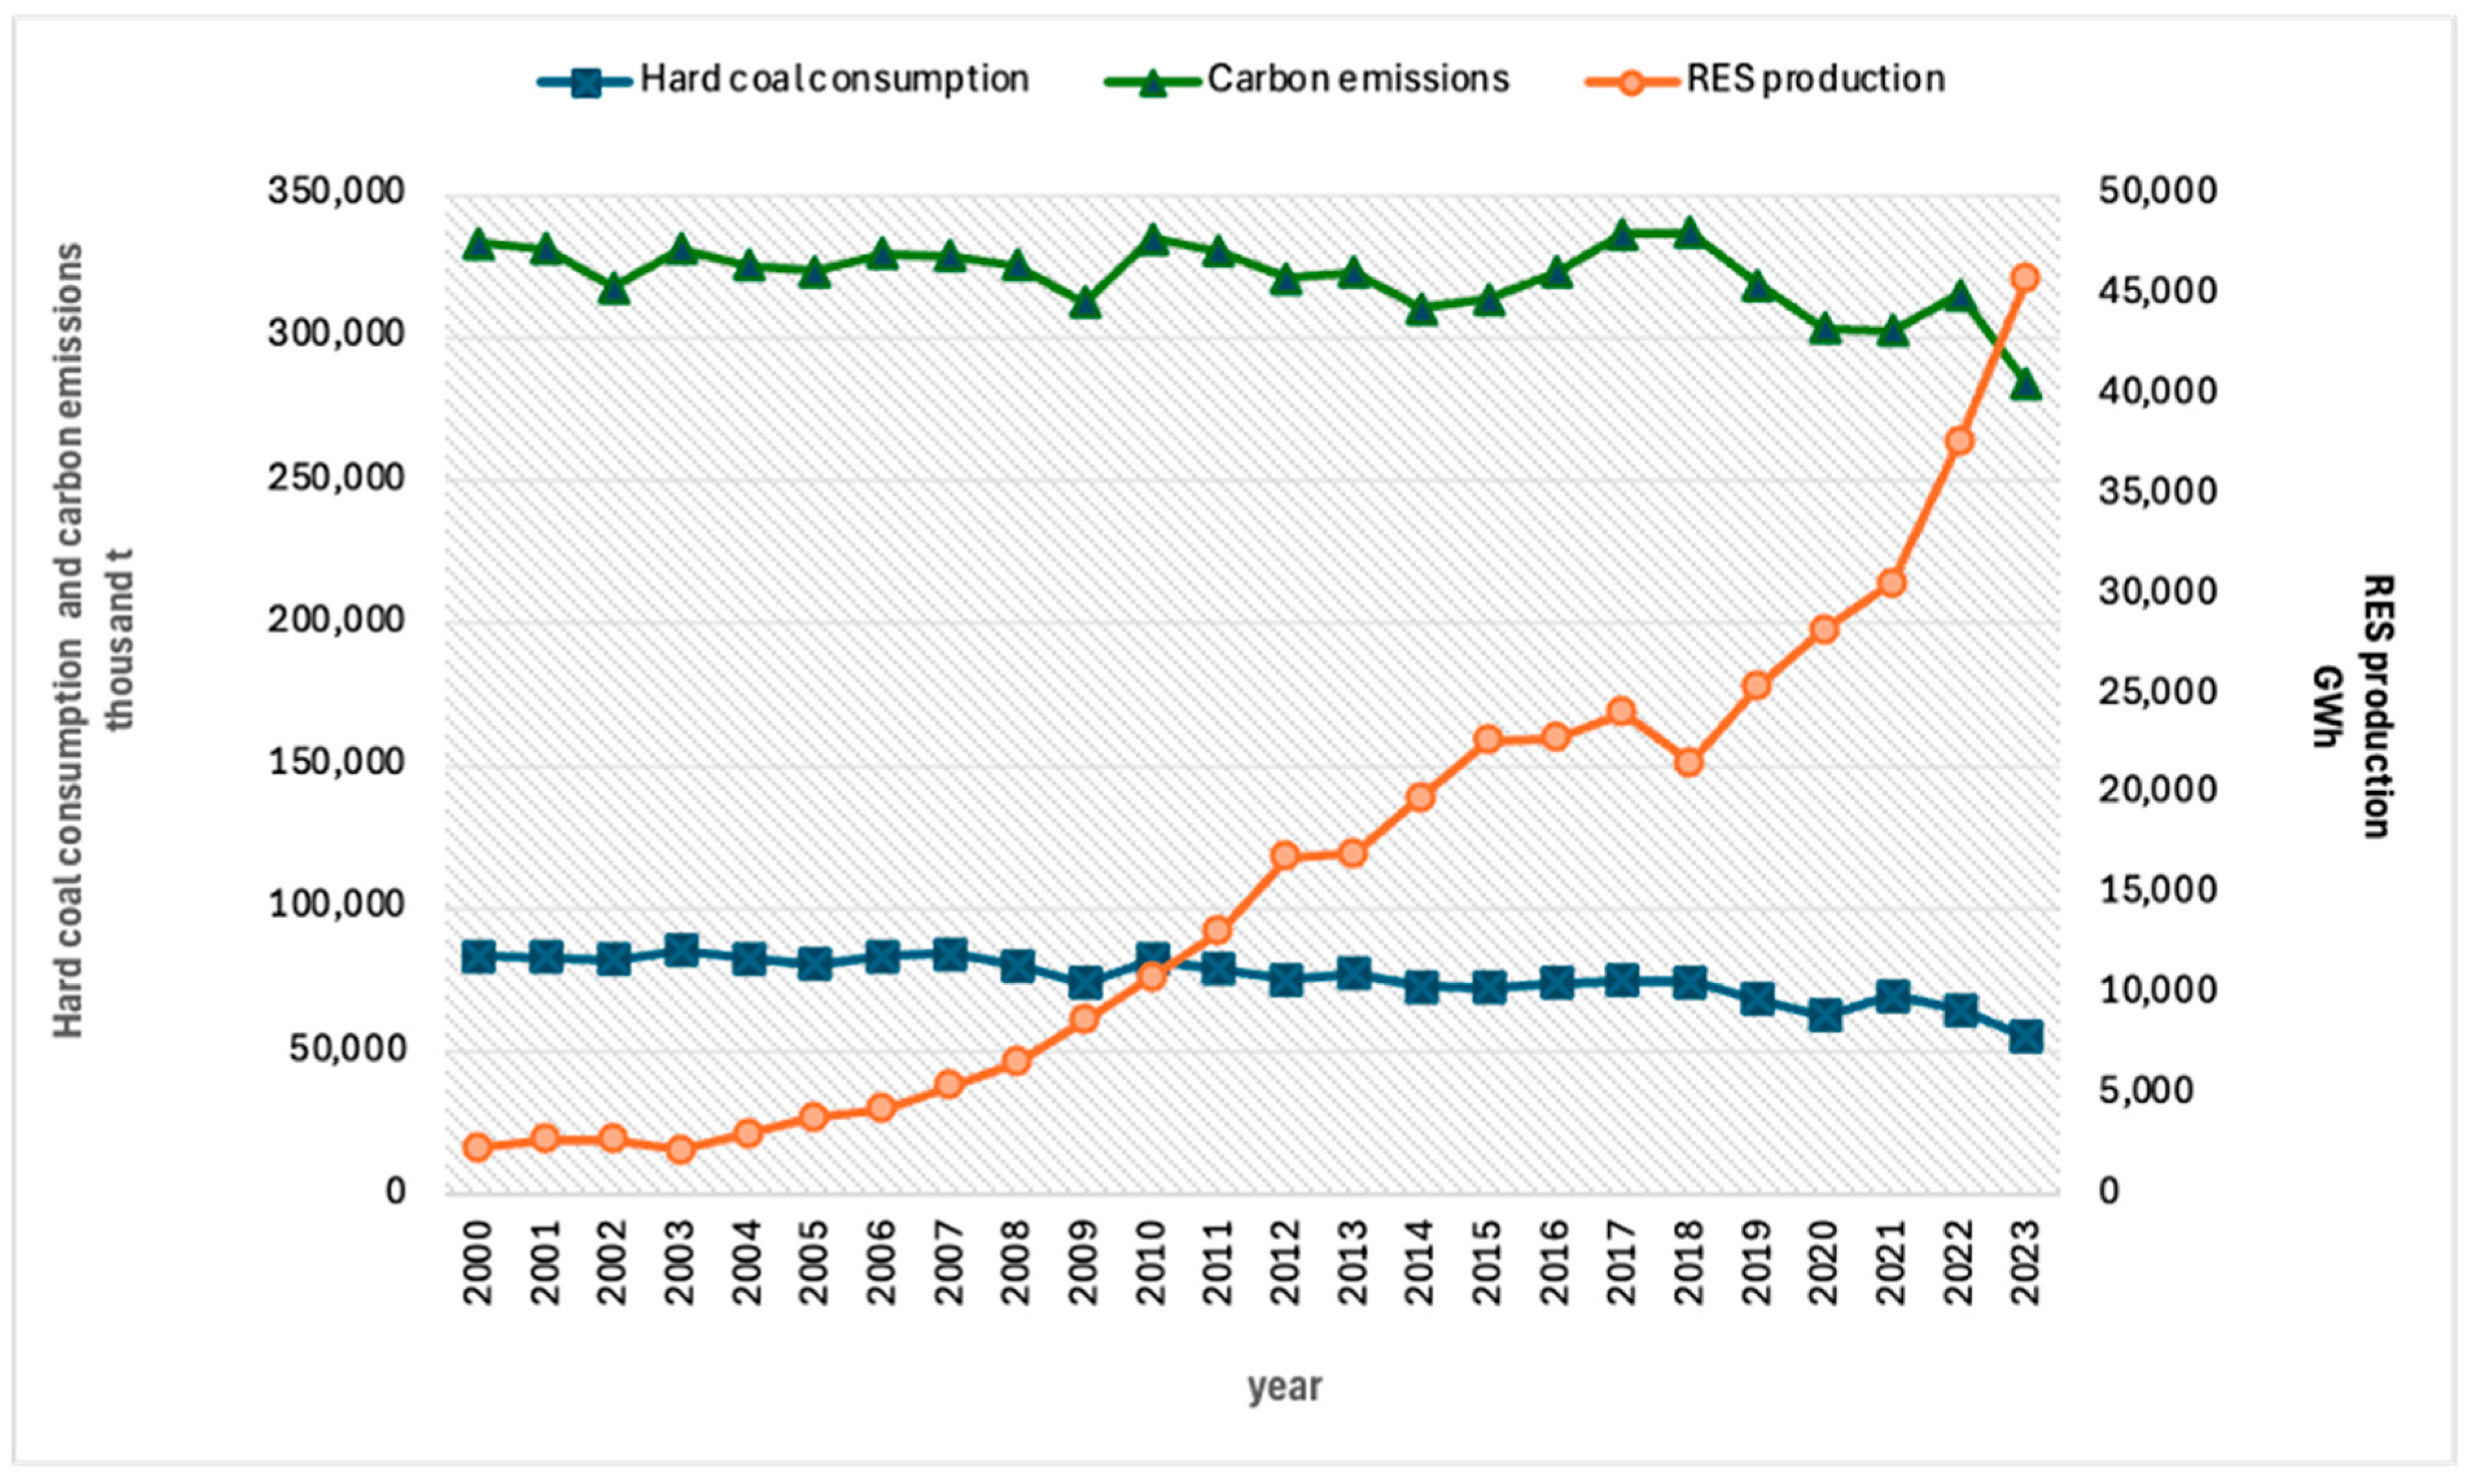
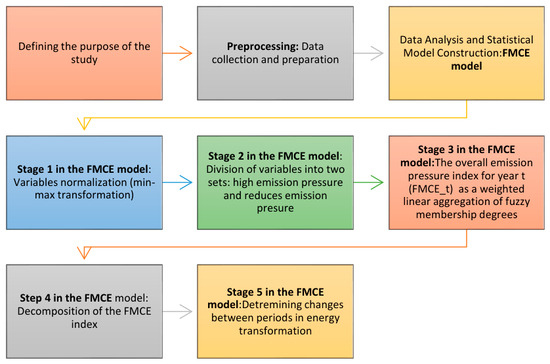
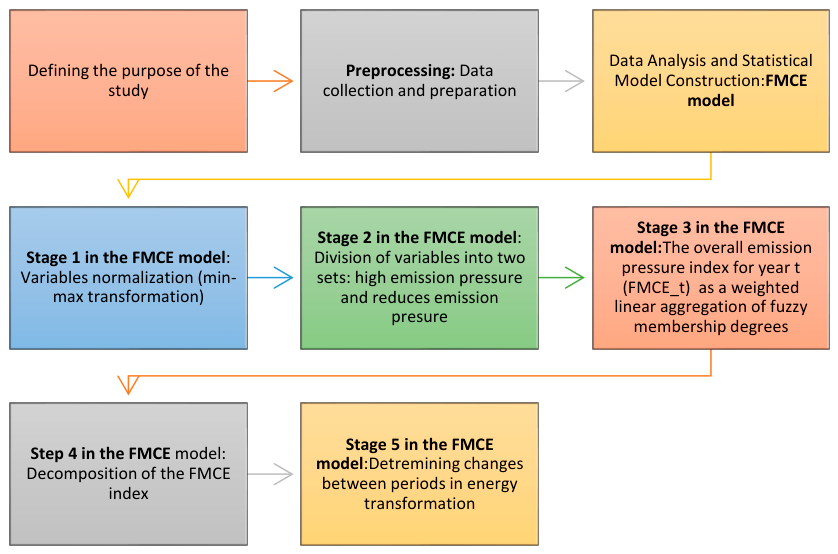
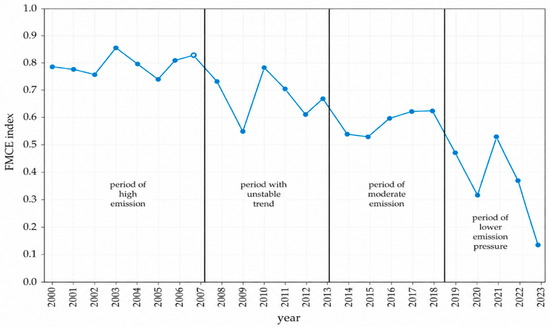
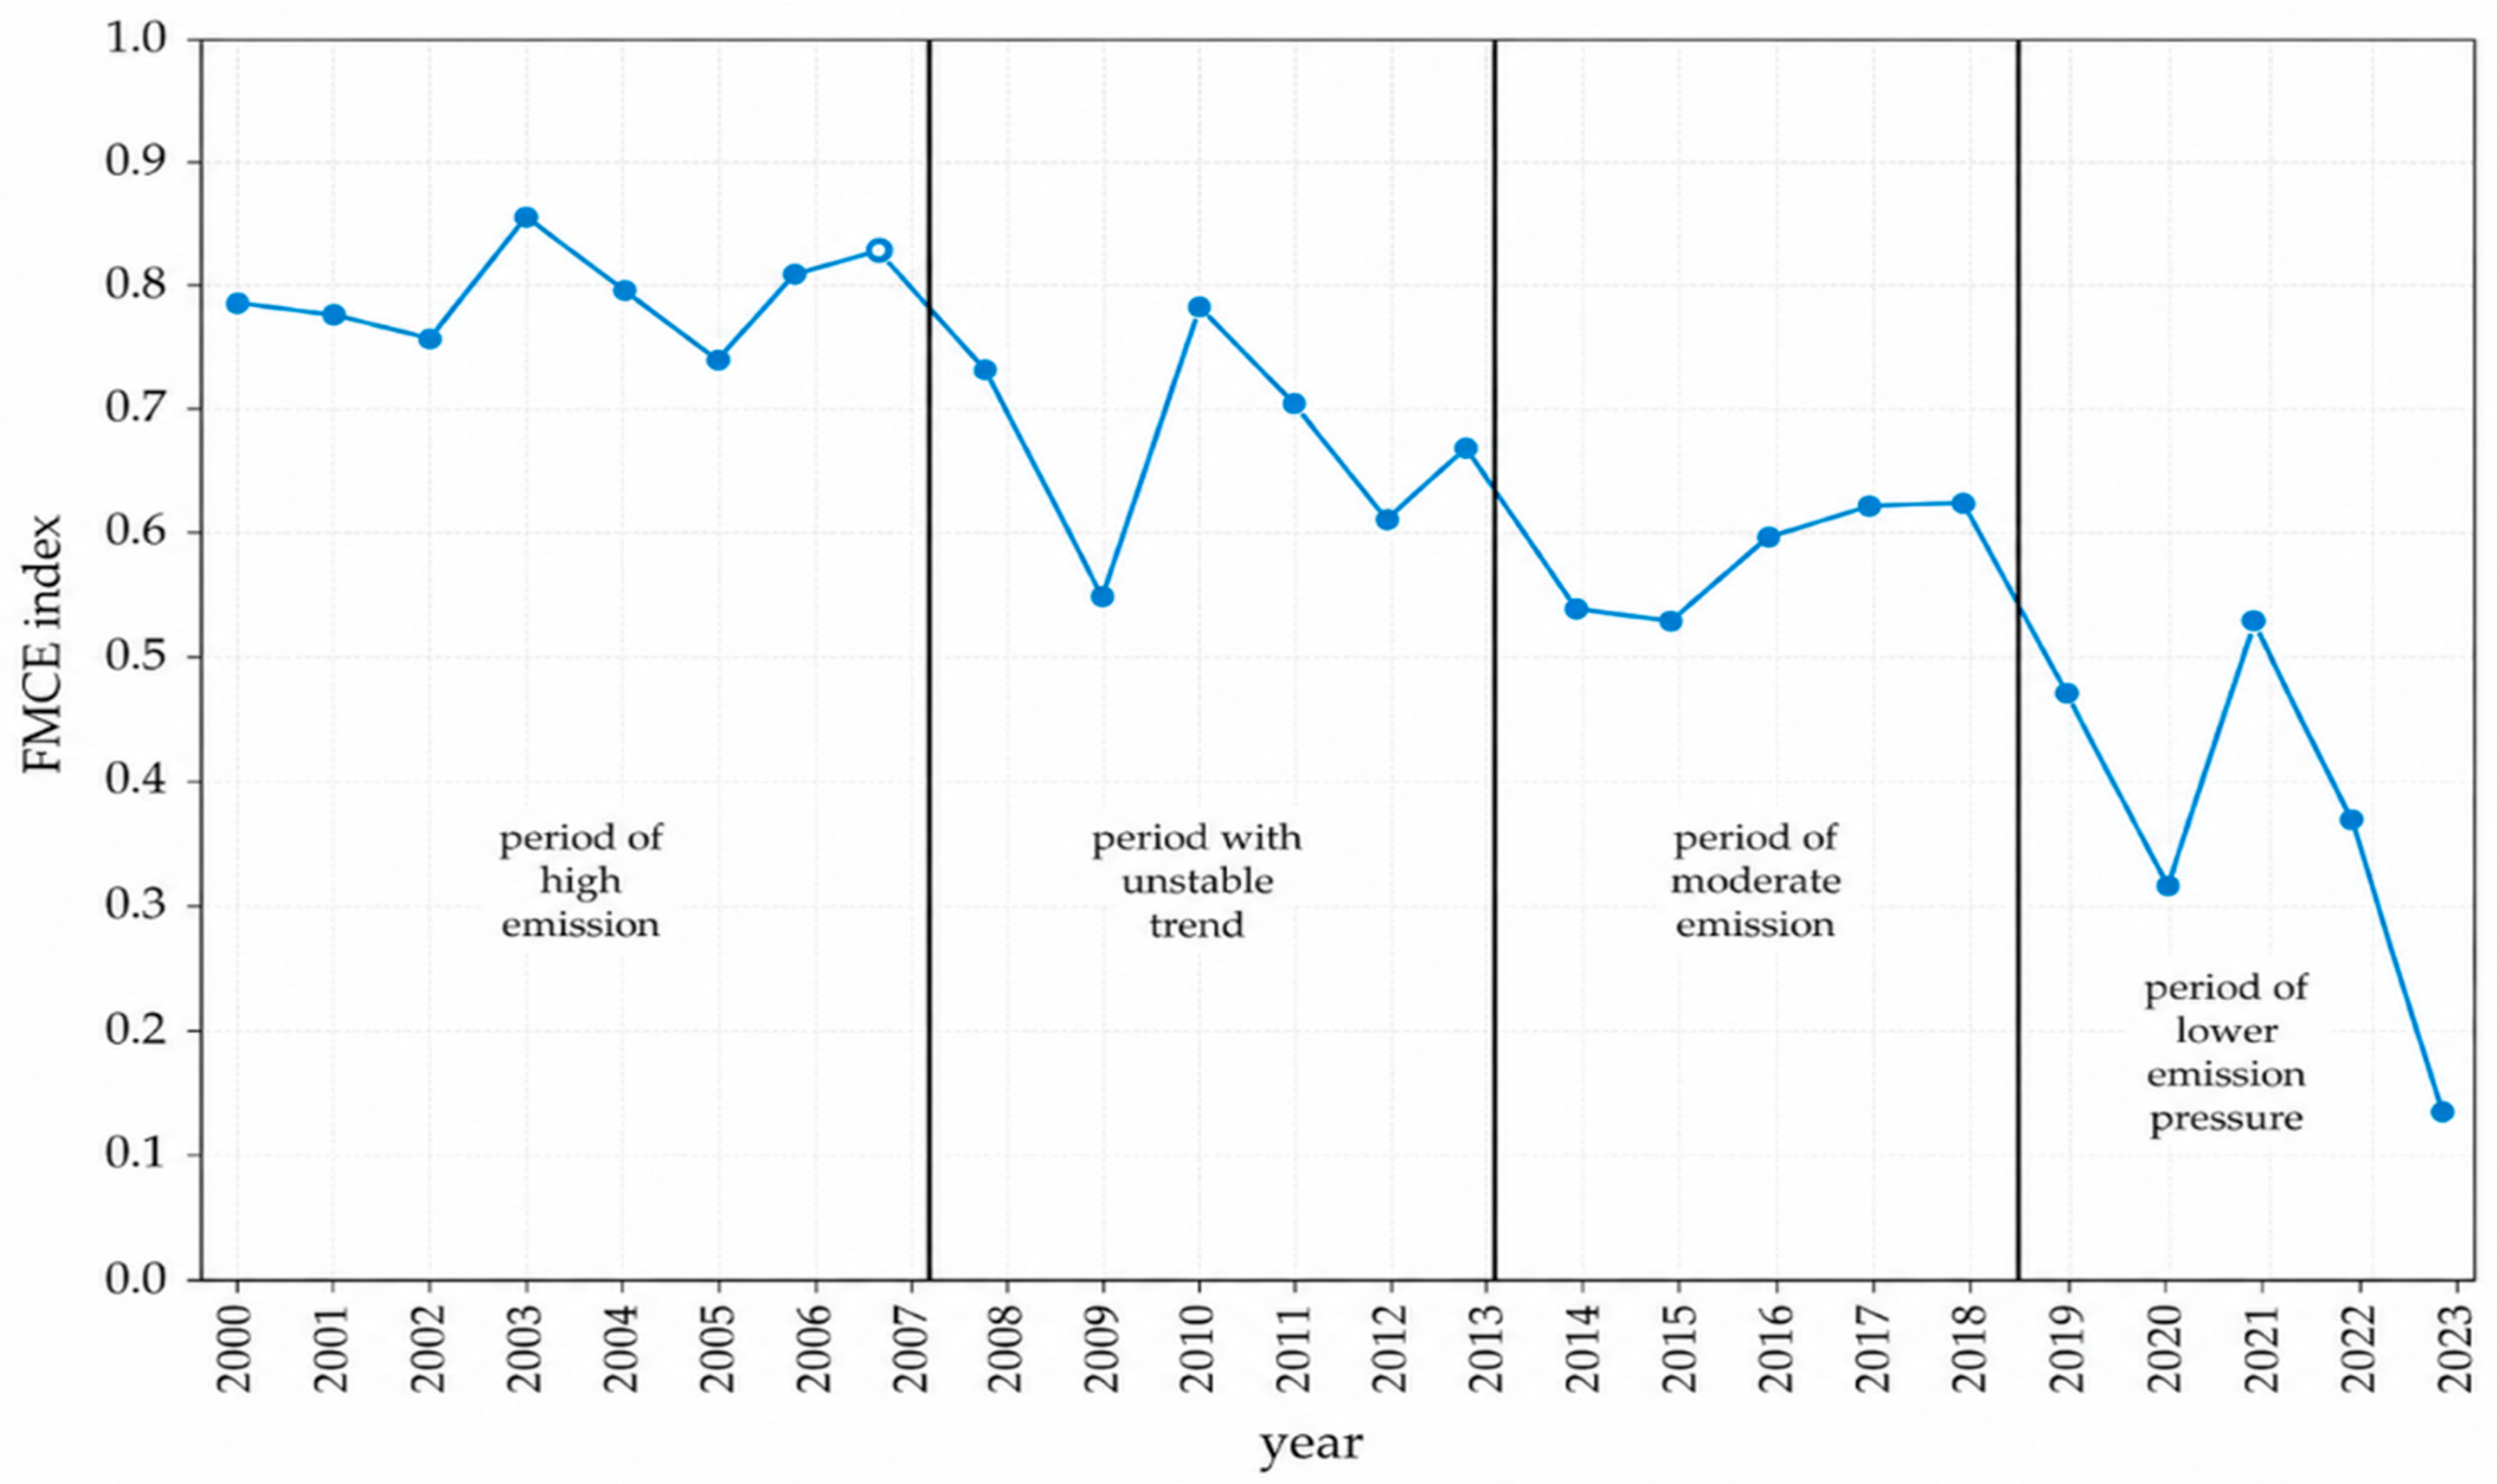
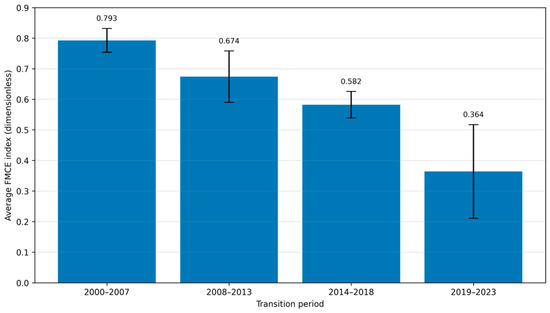
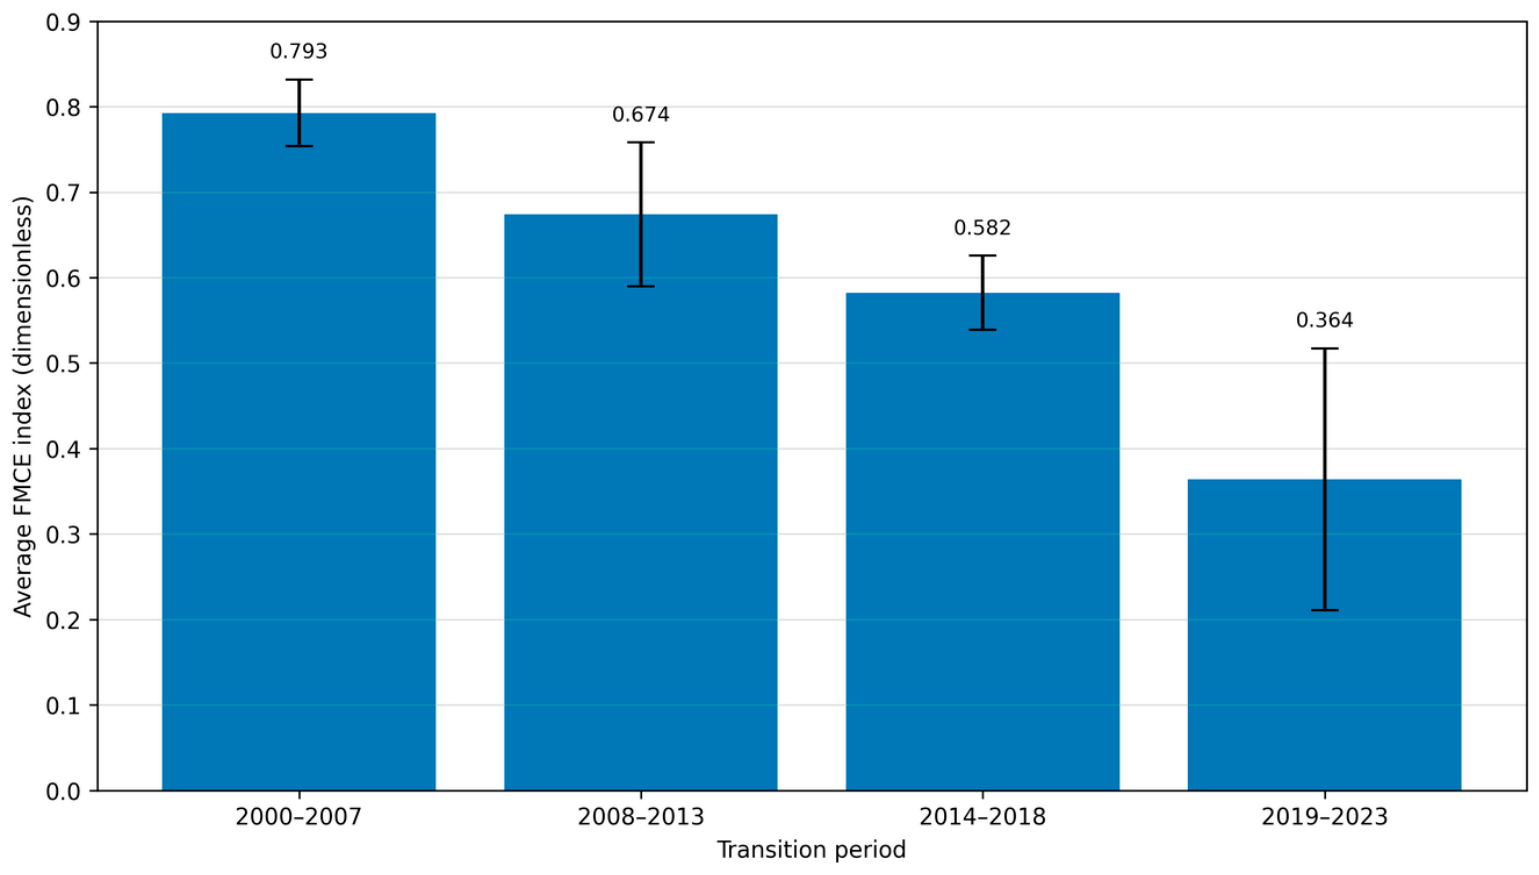
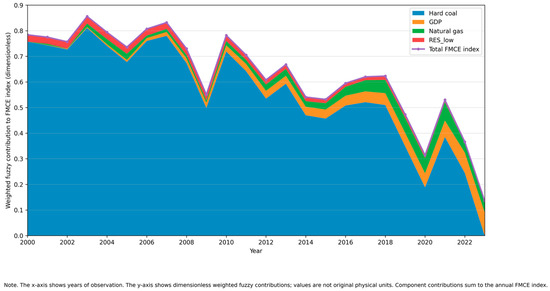
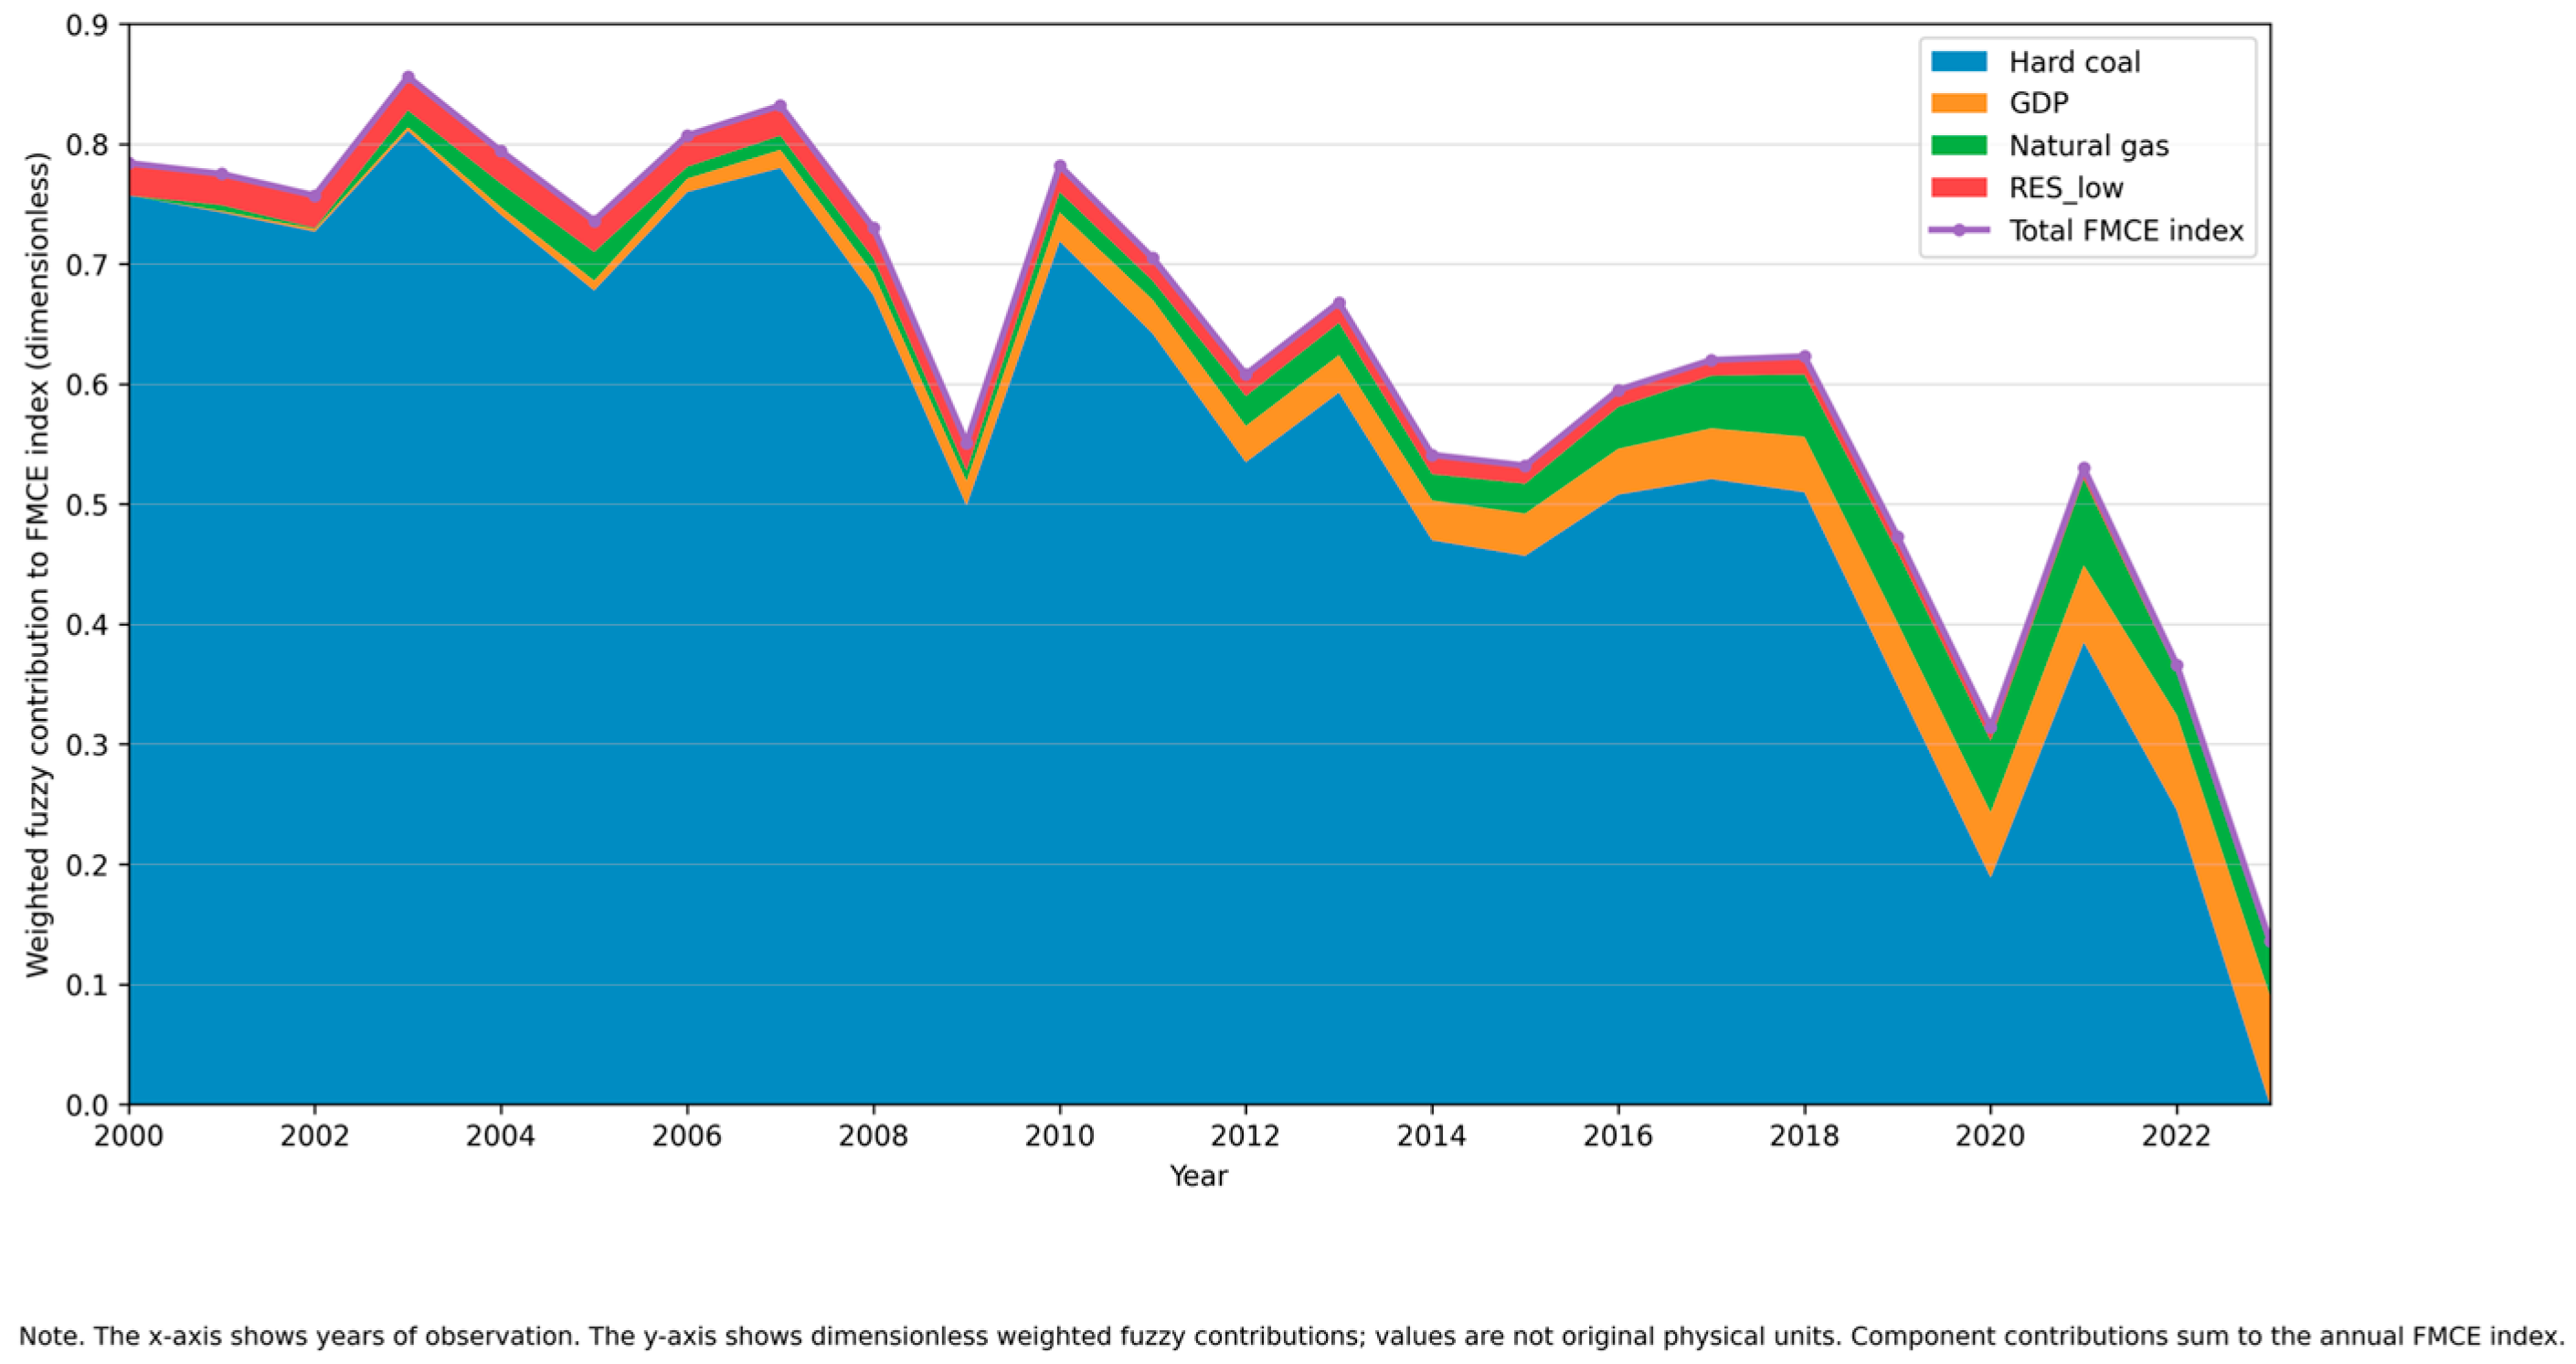

Disclaimer/Publisher’s Note: The statements, opinions and data contained in all publications are solely those of the individual author(s) and contributor(s) and not of MDPI and/or the editor(s). MDPI and/or the editor(s) disclaim responsibility for any injury to people or property resulting from any ideas, methods, instructions or products referred to in the content. |
© 2026 by the authors. Licensee MDPI, Basel, Switzerland. This article is an open access article distributed under the terms and conditions of the Creative Commons Attribution (CC BY) license.