


Abstract
With the rapid expansion of urban metro networks, transformer direct current (DC) bias caused by stray currents from multiple metro lines has become increasingly prominent. To evaluate and mitigate DC bias currents under complex coupling conditions, a coupling model of multiple metro lines and the regional power grid is established based on the superposition principle. Field measurements are further used to validate the model and demonstrate the necessity of considering multi-line coupling. Subsequently, dynamic operating conditions involving multiple trains are simulated to evaluate the magnitude and dynamic distribution characteristics of transformer DC bias currents in the regional power grid. To address the pronounced time-varying behavior of these currents and the limited adaptability of conventional static mitigation strategies, a dynamic iterative mitigation model is proposed for the optimized and incremental allocation of DC bias suppression devices. The results show that, under the simulation period and regional power grid conditions specified in this study, the proposed model can reasonably capture the dynamic characteristics of transformer DC bias currents. Compared with a conventional threshold-triggered strategy, the proposed method reduces the number of required suppression devices by approximately one third.
1. Introduction
In recent years, urban metro networks in China have expanded rapidly, with the total operating mileage exceeding 10,000 km and the trend toward networked development becoming increasingly pronounced [1]. However, in metro systems employing direct current (DC) traction power supply, rail-to-earth insulation is inherently imperfect, and insulation damage and performance degradation may occur during long-term operation. As a result, part of the traction return current leaks into the earth, forming metro stray currents. As the density of metro networks continues to increase, metro stray currents significantly alter the ground potential distribution in nearby regional power grids and create potential differences among substations. These potential differences provide a path for stray currents to enter transformer neutral points, thereby causing severe transformer DC bias in urban alternating current (AC) power grids [2]. Under DC bias, transformers may exhibit intensified vibration, increased noise, abnormal temperature rise, and increased additional losses. In particular, the abnormal temperature rise may further increase the thermal stress imposed on the transformer oil–paper insulation system, thereby indirectly accelerating transformer insulation aging and threatening the safe and stable operation of urban power grids [3,4].
To address stray currents in metro systems, previous studies have examined their formation mechanisms, modeling and simulation methods, and distribution characteristics. Equivalent resistance networks and simulation models that incorporate metro DC traction power supply and return current systems have been developed to analyze stray current distribution under dynamic train operating conditions [5,6,7]. By considering rails, track structures, and earthing and bonding connections, resistance network models can be used to assess rail potential and stray-current risks [8]. Aatif et al. [9] developed a simulation model for rail potential and stray current in a medium-voltage DC railway electrification system, through which the variation characteristics of stray currents under different operating scenarios, such as different traction substation grounding schemes, were investigated. To further improve simulation accuracy, the operating logic of protective devices, such as overvoltage protection devices and platform screen doors, has also been incorporated into simulation models, and its influence on stray current distribution has been analyzed [10,11]. In addition, factors such as local high insulation of rails and uneven line parameters have been considered in relevant models to analyze their effects on stray current distribution and DC bias currents, and corresponding physical mitigation methods have been proposed [12,13]. Overall, these studies provide an important foundation for the modeling and simulation of stray currents in metro systems, the analysis of corrosion risks to metallic structures, and subsequent research on transformer DC bias.
As the problem of transformer DC bias has become increasingly prominent, the coupling effect between metro systems and urban regional power grids has attracted growing attention. Based on the formation mechanisms and propagation paths of stray currents, coupled relationships between metro systems and AC power grids have been established to calculate the distribution of transformer DC bias currents caused by metro stray currents [14,15]. These models reveal the mechanism by which metro stray currents induce transformer DC bias through propagation paths such as soil and grounding grids, thereby providing a foundation for metro–power grid coupling analysis. Cao et al. [16] analyzed the periodic characteristic relationship between traction currents and substation neutral currents based on the wavelet transform method, and proposed a contribution analysis method for evaluating the influence of different metro lines on transformer neutral currents. Wu et al. [17] calculated metro stray currents using the Galerkin finite element method, and combined the results with ANSYS calculations of the induced geoelectric field to obtain the corresponding DC bias currents.
However, most existing models are still developed based on a single metro line and its nearby local power grid, which makes it difficult to fully consider the coupling effect between multiple metro lines and the regional power grid. As a result, the calculated currents may contain errors, making it difficult to support coordinated mitigation of transformer DC bias in regional power grids. In contrast, a multi-metro-line coupling model can simultaneously consider stray currents generated by multiple metro lines and their superimposed effects in the regional power grid. Therefore, it is more suitable for the evaluation and mitigation of transformer DC bias currents under the development of networked metro systems.
With regard to the mitigation of transformer DC bias, a neutral switching device based on power electronic switches has been proposed for high-voltage direct current (HVDC) transmission systems operating in monopolar ground-return mode, where transformer DC bias may occur due to ground-return currents [18]. The effectiveness of this device in suppressing DC bias was verified through simulations and experiments. For coordinated mitigation at the regional power grid level, Wang et al. [19] considered the topology of the AC power grid and introduced a DC-bias current index to characterize the influence of DC bias. On this basis, the optimal configuration of suppression devices was determined using a combined capacitor–resistor optimization method and an improved roulette wheel selection algorithm. For transformer DC bias caused by geomagnetic disturbances, an optimal placement method for neutral DC-blocking devices has also been proposed, in which equipment thermal limits and power system operation constraints are considered [20]. This method provides a reference for the reasonable allocation of DC bias suppression devices in power grids. Guo et al. [3] established a coupled model of the metro system and the power grid, and particle swarm optimization was used to determine the resistance values of current-limiting devices at different substations, thereby forming a systematic mitigation scheme.
However, DC bias currents induced by metro stray currents exhibit significant dynamic characteristics, including large amplitude fluctuations and rapid directional changes. Conventional static mitigation strategies cannot effectively address the dynamic transfer of these currents, which is caused by variations in traction current and train position. Therefore, their effectiveness remains limited in terms of both targeted application and system-level coordination.
Against this background, this study establishes a coupling model of multiple metro lines and the regional power grid based on the superposition principle, considering the actual coupling conditions between metro lines and the urban grid as well as the electrical connections among substations. Based on the developed model, dynamic multi-train operating conditions are simulated to evaluate the magnitude and dynamic distribution characteristics of transformer DC bias currents in the regional power grid. To cope with the time-varying behavior of these currents and the difficulty of their mitigation, a dynamic iterative mitigation model for time-varying DC bias currents is further proposed. The model explicitly considers variations in traction current and train position, carries out dynamic assessment by inheriting and updating the mitigation scheme from the previous time step, and introduces a multi-objective optimization algorithm to determine a hybrid allocation of suppression devices. The results show that the proposed model effectively overcomes the limitations of conventional static mitigation methods and provides theoretical and technical support for the safe operation of urban power grids under the influence of multi-source stray currents.
2. Model and Calculation Method
2.1. Mechanism Analysis of Transformer DC Bias Caused by Stray Currents
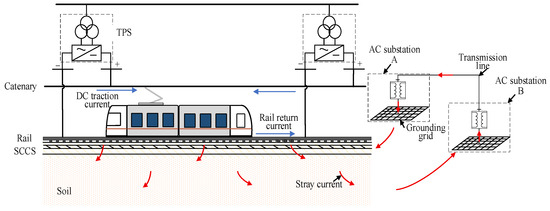
The generation of metro stray currents is closely related to the insulation condition of the DC traction power supply system and the return current system. As shown in Figure 1, in a metro DC traction power supply system, the traction current flows from the catenary to the train and returns to the negative terminal of the traction power substation (TPS) through the rails. Since the rails cannot be perfectly insulated from the earth and insulation defects may occur in practice, part of the traction current leaks into the stray current collection system (SCCS), tunnel structure, and surrounding soil during the return process, thereby forming metro stray currents. These stray currents may cause fluctuations in the grounding-grid-to-soil potential of urban substations, and these fluctuations are closely related to metro operating conditions [21]. The potential differences formed among nearby substations may further drive stray current intrusion into neutral-grounded transformers through grounding grids, thereby leading to transformer DC bias, which is manifested by intensified vibration and increased noise.
Figure 1.
Schematic diagram of metro stray current leakage and intrusion into the regional power grid.
With the networked development of urban rail transit, multiple metro lines intersect with one another and form complex coupling relationships with the regional power grid, causing transformers to be simultaneously affected by dynamic stray current interference from multiple metro lines. Under such conditions, a single-line metro model can no longer accurately evaluate the level of DC bias currents resulting from the combined action of multi-source metro stray currents. Therefore, this study proposes a coupling model of multiple metro lines and the regional power grid based on the superposition principle, together with a dynamic mitigation strategy, in order to improve the calculation accuracy and mitigation effectiveness of DC bias currents.
2.2. Analysis Based on the Superposition Principle
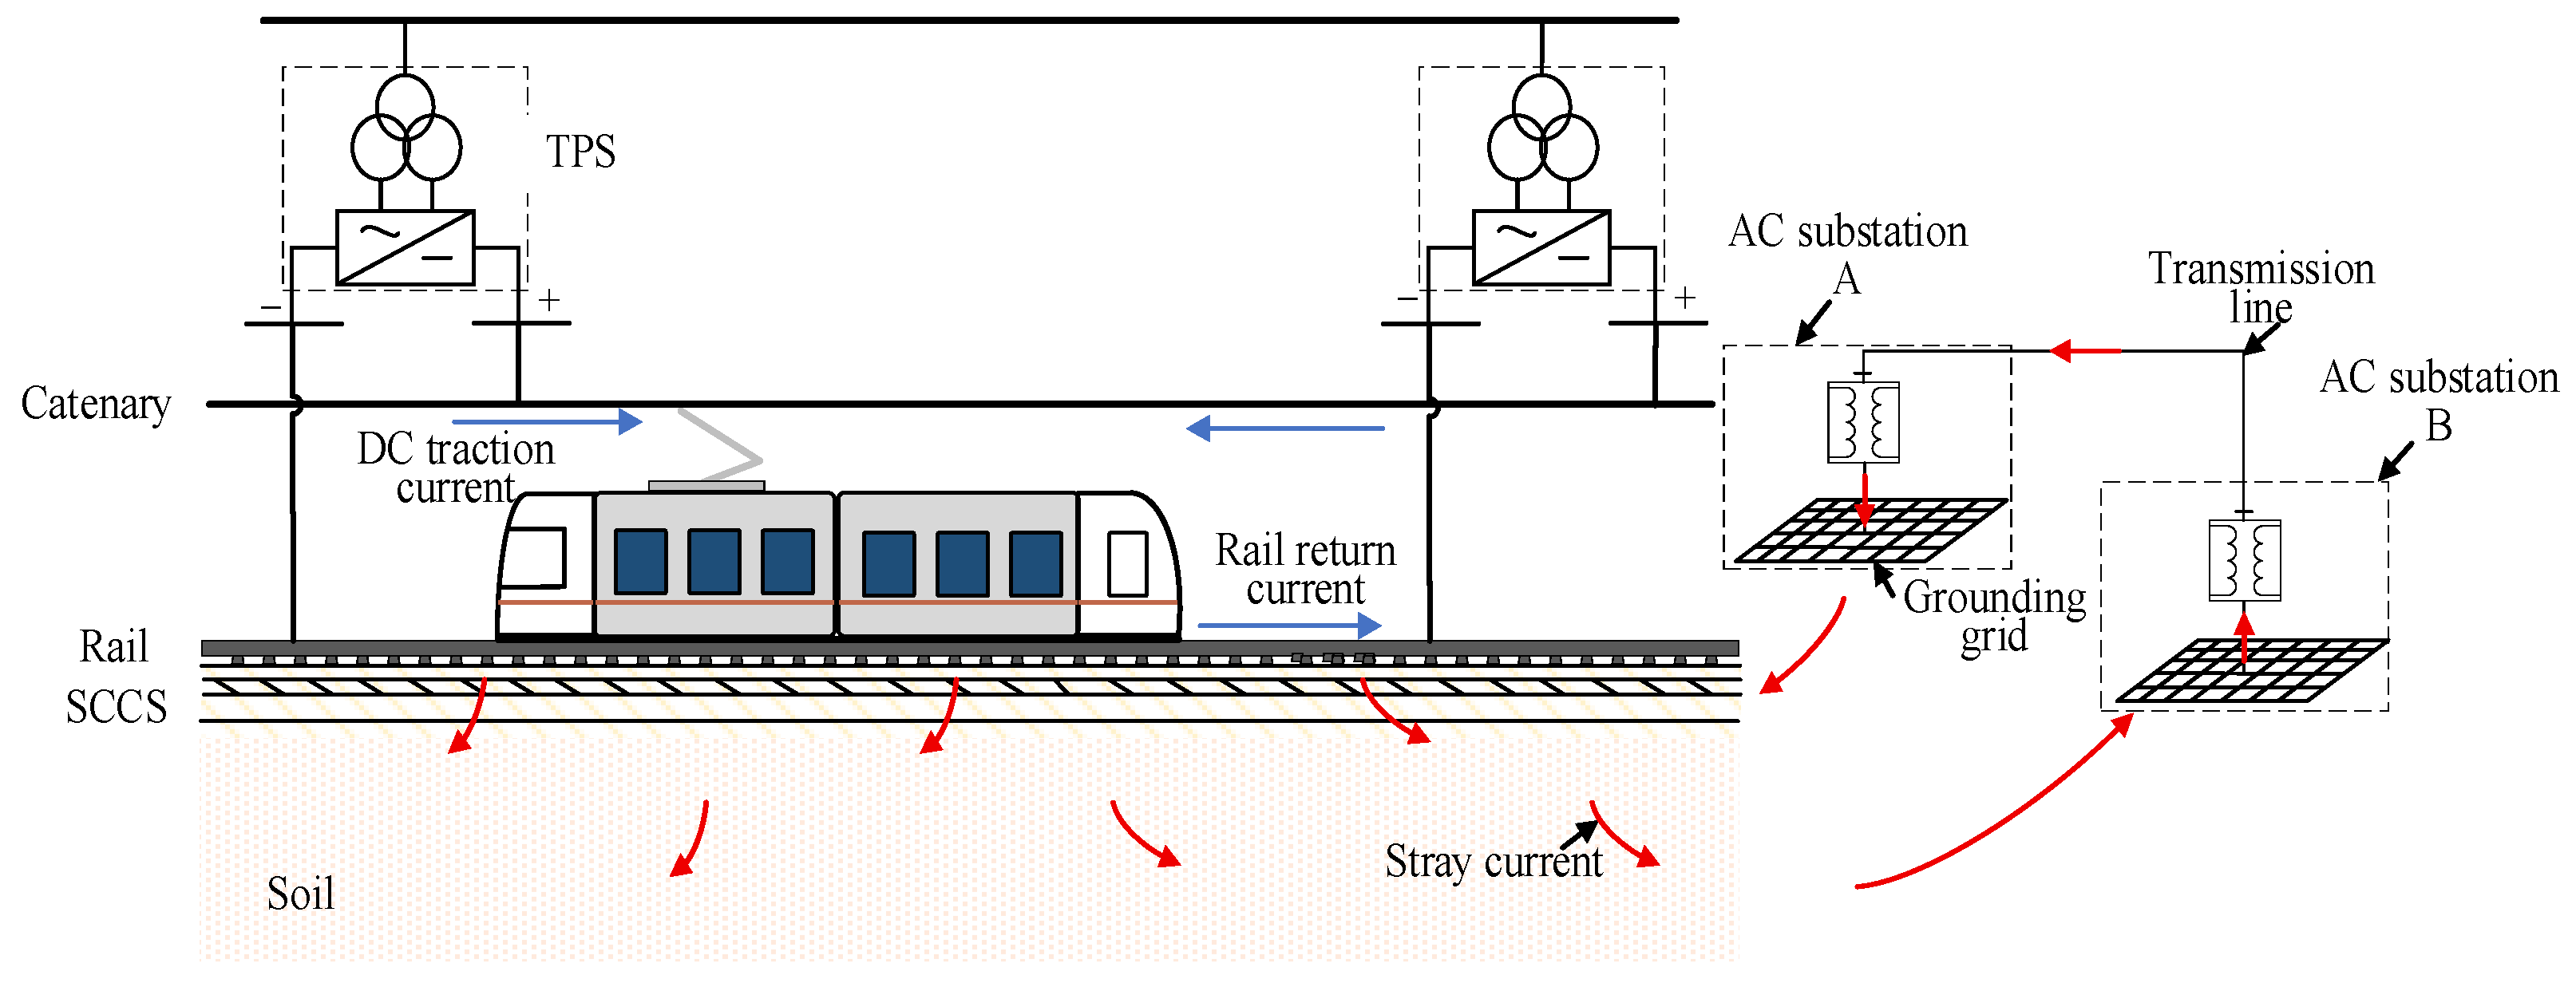
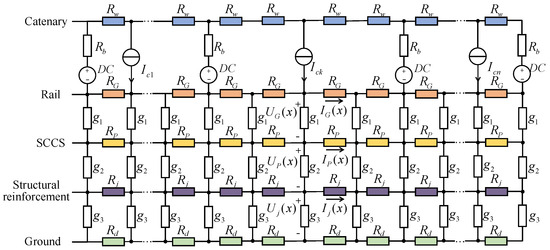
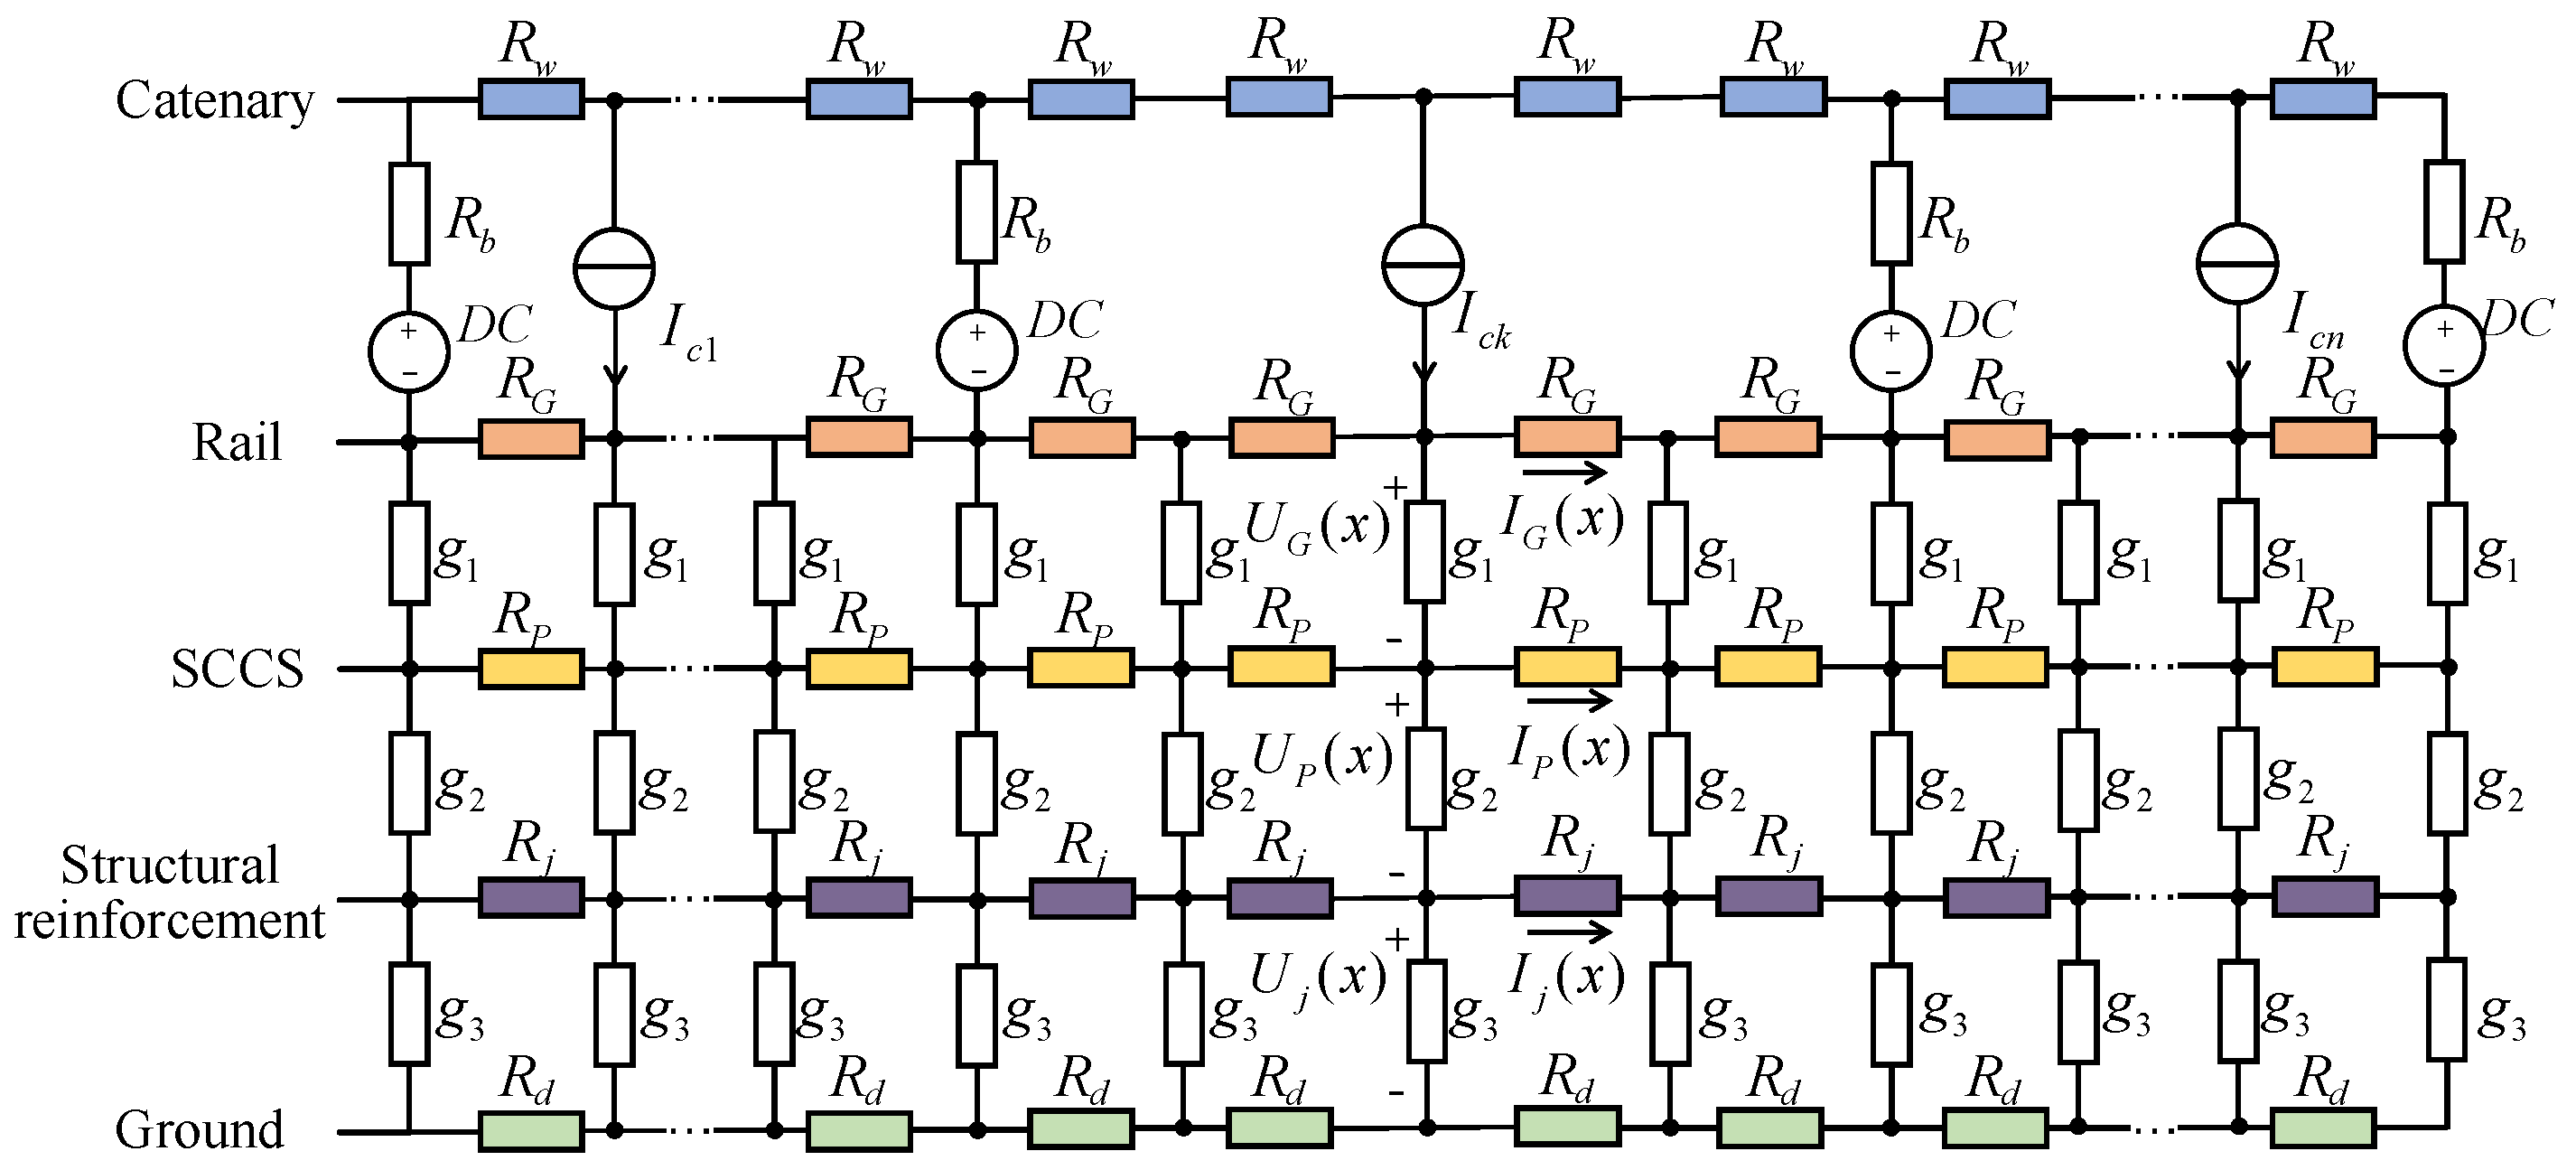
To accurately analyze the distribution characteristics of stray currents, the complex metro system is represented as a multilayer parallel DC resistive network model, as shown in Figure 2. From top to bottom, the model consists of the catenary, rails, SCCS, structural reinforcement, and earth [22]. Each layer is represented by a resistive conductor continuously distributed along the longitudinal direction of the line, while the insulation structures and other media between adjacent layers are represented by transition conductances per unit length. Under DC conditions, the longitudinal resistance of each conductor and the interlayer transition conductances are assumed to be uniformly distributed along the line and remain constant.
Figure 2.
Equivalent resistive network model.
In the equivalent resistive network model described above, the TPS is represented by a series branch composed of a voltage source and an internal resistance, while the train is represented by a movable current source. Under the operating condition of a single train, the potential and current distributions in each conductor layer of the model can be obtained from Kirchhoff’s voltage and current laws [22].
where , , and denote the potentials between the rail and the SCCS, between the SCCS and the structural reinforcement, and between the structural reinforcement and the earth, respectively, under the i-th single-train current source. , , and denote the longitudinal currents in the rail, the SCCS, and the structural reinforcement, respectively. , , , and represent the longitudinal resistances per unit length of the rail, the SCCS, the structural reinforcement, and the earth, respectively. , , and represent the transition conductance per unit length between the rail and the SCCS, between the SCCS and the structural reinforcement, and between the structural reinforcement and the earth, respectively.
For a section supplied by multiple TPSs, let the positions of the Ns substations along the line be denoted by ( = 1, 2, …, Ns), and let the current supplied by each substation be (i = 1, 2, …, Ns). According to the relationship between the total current supplied by the TPSs and the train traction current, the equivalent current at position x can be expressed as . Here, x denotes the longitudinal coordinate along the line (), where K is the total line length. The analytical expression of is given as follows:
where denotes the position of the k-th single-train current source, and denotes the current of that source.
In the solution process, train positions and traction-current characteristics are incorporated into the model as constraints. The model is then spatially discretized and numerically solved in MATLAB 2023A to obtain the solution of the first-order nonhomogeneous differential equations. Under DC conditions, the equivalent resistive network model is linear, and the currents and potentials of each structure under multi-train operating conditions can therefore be determined using the superposition principle. Specifically, when Nt trains operate simultaneously along the line, the total potential and current at an arbitrary observation point x can be regarded as the algebraic sum of the responses produced at that point by each train acting independently as a current source. Let the positions of the train current sources along the line be denoted by (i = 1, 2, …, Nt). The distributions of the physical variables under multi-train operation can be expressed as follows:
For
where , , and denote the potentials between the rail and the SCCS, between the SCCS and the structural reinforcement, and between the structural reinforcement and the earth, respectively, under multi-train current-source conditions. , , and denote the longitudinal currents in the rail, the SCCS, and the structural reinforcement, respectively.
Accordingly, the differential expression of the stray current under multi-train current-source conditions can be obtained as follows:
where denotes the rail-to-earth transition resistance, and denotes the rail-to-earth potential.
The rail-to-earth potential is given as follows:
Based on the differential expression of stray current and the uniformly layered soil model described above, the total ground potential variation induced by multiple stray current sources at an arbitrary location can be obtained by superposition using the method of images. By combining this result with the equivalent DC resistance of the transformer, the corresponding transformer DC bias current under the influence of multiple stray current sources can be calculated. To address the computational problem under complex coupling conditions involving multiple metro lines and the regional power grid, and considering that the calculation of transformer DC bias currents under multiple stray current sources satisfies the superposition principle, this study develops a coupling model of multiple metro lines and the regional power grid using CDEGS V15.4 software, thereby enabling quantitative evaluation of transformer DC bias currents.
2.3. Modeling Method
To efficiently and accurately construct a coupling model of multiple metro lines and the regional power grid in CDEGS, the overall modeling procedure is carried out in three steps: metro network decomposition, DC equivalence of the regional power grid, and coupling-model construction based on geographic coordinate transformation.
According to the topological characteristics and structural layout of the metro line, each single-line system is divided into a power supply subsystem and a return-current subsystem. On the power supply side, the catenaries of the up and down lines are respectively represented by longitudinal conductors distributed along the line, while the TPS is represented by vertical conductors connecting the busbar, the catenary, and the rail. The return-current subsystem mainly includes the rail, equalizing line, and SCCS. The rail and other metallic structures, such as the SCCS, are electrically connected by equalizing lines, thereby forming a longitudinal parallel connection. Using the equivalent parallel-conductor method, the longitudinally parallel structures in the up and down lines are each represented by a single longitudinal conductor distributed along the line, which can effectively reduce the number of conductors and computational nodes in the simulation model [23]. The longitudinal resistance per unit length of the equivalent longitudinal conductor is determined according to the parallel-resistance relationship, as shown in the following equation:
where n is the total number of longitudinal conductors in either the up or down line, and is the longitudinal resistance per unit length of a single longitudinal conductor.
For the conductor radius, a surface-area-equivalent method is adopted in this study, rather than a strict electromagnetic equivalent-radius method. Since the surface areas of the structural conductors in the metro system affect the distribution of stray currents, the lateral surface area of the equivalent longitudinal conductor in the model is assumed to be equal to the sum of the lateral surface areas of the original parallel conductors. Accordingly, the equivalent radius of the equivalent longitudinal conductor can be obtained as follows:
where n is the total number of longitudinal conductors in either the up or down line, is the radius of a single longitudinal conductor, and L is the length of the conductor.
To simulate dynamic train operation, each train is represented by a movable current-source conductor connected to the catenary and the rail, respectively, with equal currents injected in opposite directions. The magnitude and direction of the injected current are strictly determined by the train operating condition. Under traction conditions, the current on the catenary side is set to be negative, whereas that on the rail side is positive. Under regenerative braking conditions, the current polarity is reversed.
Second, for the construction of the DC equivalent model of the regional power grid, the network topology is represented as a DC network composed of substation nodes and transmission line branches. As the entry point through which stray currents intrude into the regional power grid, the substation grounding grid can be represented by a meshed topology according to its grounding resistance (such as a 4 4 or 16 16 grid). Because the high- and low-voltage windings of a non-autotransformer are electrically isolated, they can be represented separately by single-branch resistive conductors. By contrast, in an autotransformer, the high- and medium-voltage windings are not only electromagnetically coupled but also form a physical DC path through the common winding, and therefore must be represented by a branched resistive conductor. DC bias currents flow through the regional power grid via transmission lines. According to the topology and connection relationships of the transmission network, each transmission line is represented in the model as a conductor branch connecting the windings of neutral-grounded transformers.
To accurately reproduce the actual geographic locations of the systems involved, a coordinate transformation method is adopted to enable batch modeling of a large number of conductors. Taking the selected reference longitude and latitude (, ) as the origin, the actual geographic coordinates (, ) of all metro-line stations, turning points, and substations are converted into the Cartesian coordinates (xᵢ, yᵢ) required by the simulation model, as shown in the following equation:
where and denote the longitude and latitude of the i-th point, respectively, while and denote the reference longitude and latitude selected as the coordinate origin, respectively. and are the distance conversion coefficients in the longitude and latitude directions, respectively. The coefficients and were determined from the local linear relationship between the longitude/latitude differences and the corresponding planar distances in the study area.
In this study, the longitude and latitude coordinates are expressed in degrees, while the converted xᵢ and yᵢ coordinates are expressed in meters. According to the local coordinate conversion relationship of the study area, and are set to 119.453° and 30.19244°, respectively, while and are taken as 97.75 × 10³ m/degree and 112.17 × 10³ m/degree, respectively. Through this transformation, the geographic coordinates of metro stations, line turning points, and substations can be converted into the Cartesian coordinate values required for batch modeling in CDEGS.
After the equivalent conductors containing geographic information and electrical parameters are imported into the simulation software in batches, the nodes are connected by transmission-line branches according to the electrical connections among substations in the regional power grid. Meanwhile, equivalent connection branches are introduced at metro-line intersections and transfer stations to realistically represent conditions in which multiple lines share a grounding grid or are electrically interconnected. In this way, a coupling model of multiple metro lines and the regional power grid is established.
2.4. Coupling Model of Multiple Metro Lines and the Regional Power Grid
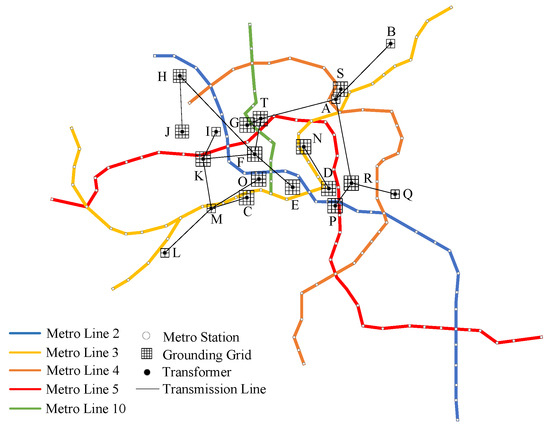
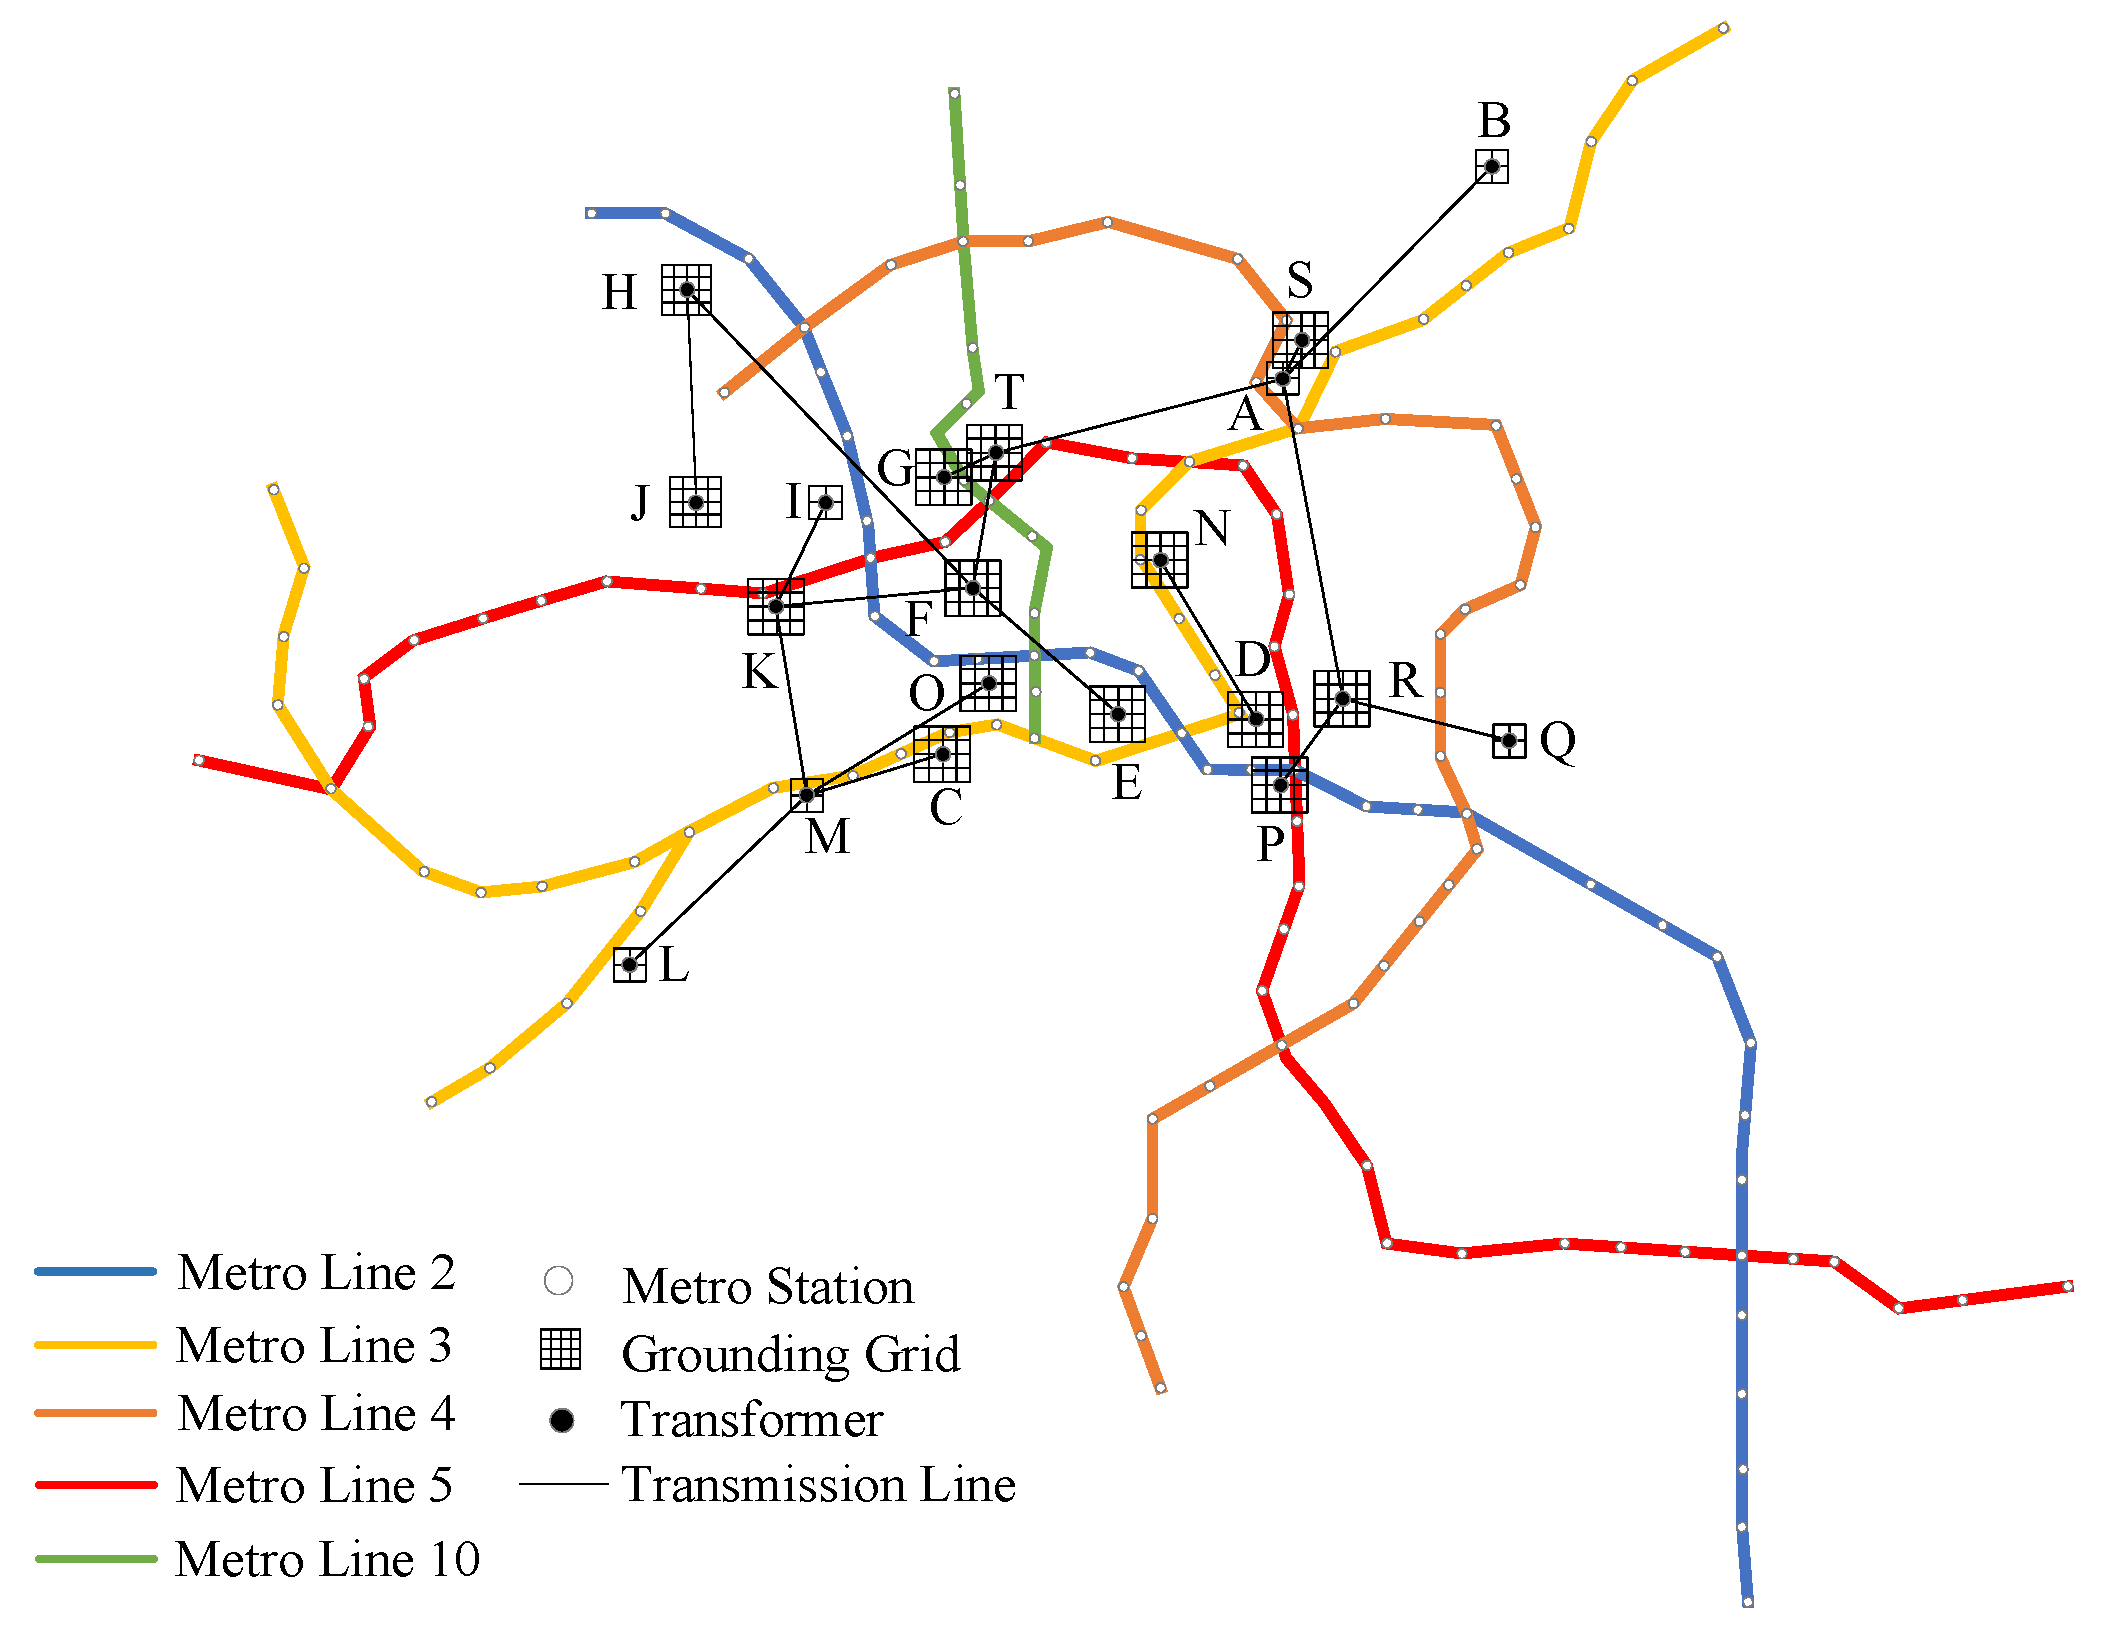
Based on the modeling method described above, a coupling model of multiple metro lines and the regional power grid is developed according to the actual geographic distribution and electrical connections of the Hangzhou metro lines and substations, as shown in Figure 3. The model includes five complete metro lines and 20 substations rated at 110 kV and above within the surrounding area.
Figure 3.
Coupling model of multiple metro lines and the regional power grid.
This model is mainly used to verify the capability of the proposed coupling model of multiple metro lines and the regional power grid to calculate transformer DC bias currents under dynamic train operating conditions, and to demonstrate the necessity of establishing such a multi-line metro-grid coupling model through comparison with the single-metro-line coupling model.
The equivalent-conductor parameters and layered-soil resistivity parameters used in the model are listed in Table 1. In this study, the metro-side model parameters were determined with reference to relevant studies on metro stray currents and the structural parameters of the metro system [23]; the power-grid-side parameters were obtained from the collected data of the regional power grid; and the soil resistivity parameters were determined based on the soil resistivity data of the study area, together with relevant studies on soil models [24]. To reproduce the dynamic operating conditions of actual metro trains and to carry out DC bias current calculation and model validation, train operation data collected during the early departure period from 6:00 to 6:14 were used in the simulation study. During this period, the train density on the Hangzhou metro lines was relatively low, and the operating conditions were therefore more controllable.
Table 1.
Model parameters.
3. Model Validation and Dynamic Assessment of DC Bias Currents
3.1. Analysis of Train Operating Characteristics and Monitoring Data
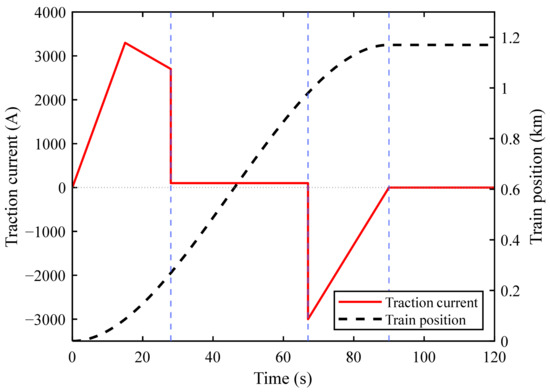
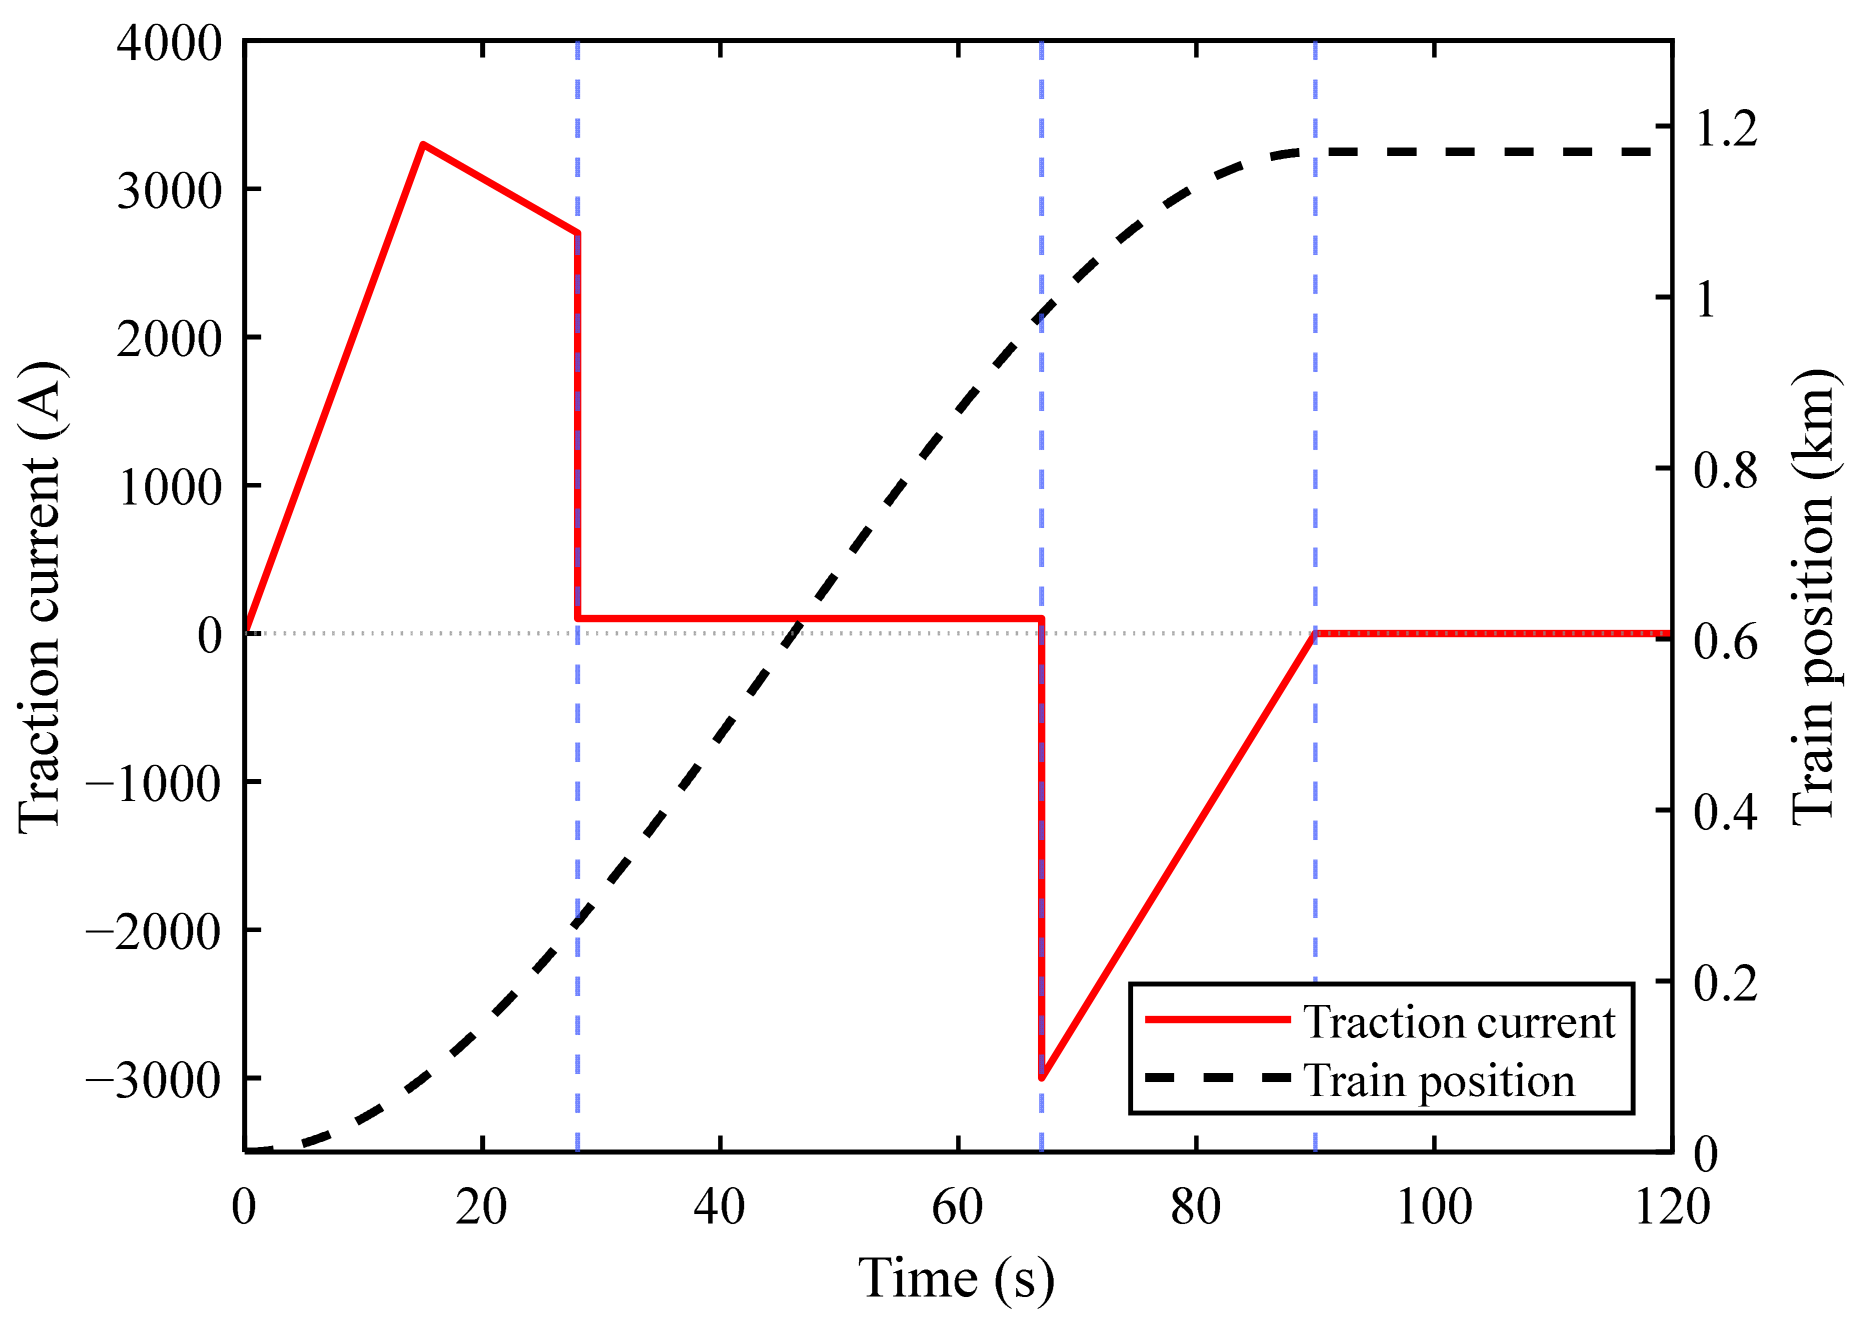
When a metro train operates between stations, different traction strategies all involve three basic operating conditions: traction acceleration, coasting, and braking deceleration. Under these conditions, the train traction current and spatial position vary dynamically with time. Through simulation and the power-flow calculation method, the dynamic data of train traction current and position over the complete operation process can be obtained, from which the equivalent train excitation used for validating the coupling model is derived. Figure 4 shows the dynamic curves of traction current and position when the train operates between stations, in which the positive and negative values of the traction current are related to the current direction convention.
Figure 4.
Dynamic curves of train traction current and position.
In this study, the current supplied by the DC traction power supply system during train traction acceleration is defined as positive, whereas the current fed back to the power supply system during regenerative braking is defined as negative. Therefore, the positive current corresponds to the train traction acceleration process, while the negative current corresponds to the regenerative braking process. Since the regenerative braking process is generally shorter than the traction acceleration process, the negative current may exhibit an approximately triangular variation. The polarity reversal in Figure 4 is caused by the switching of the train among different operating conditions. By applying the corresponding train excitations at different time instants according to the early departure timetables of trains on each metro line, the simulation of DC bias currents can be carried out.
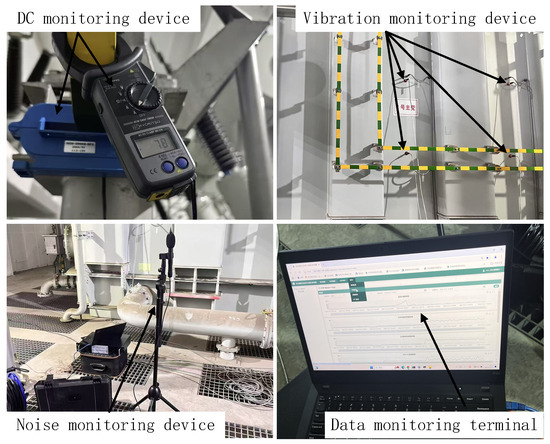
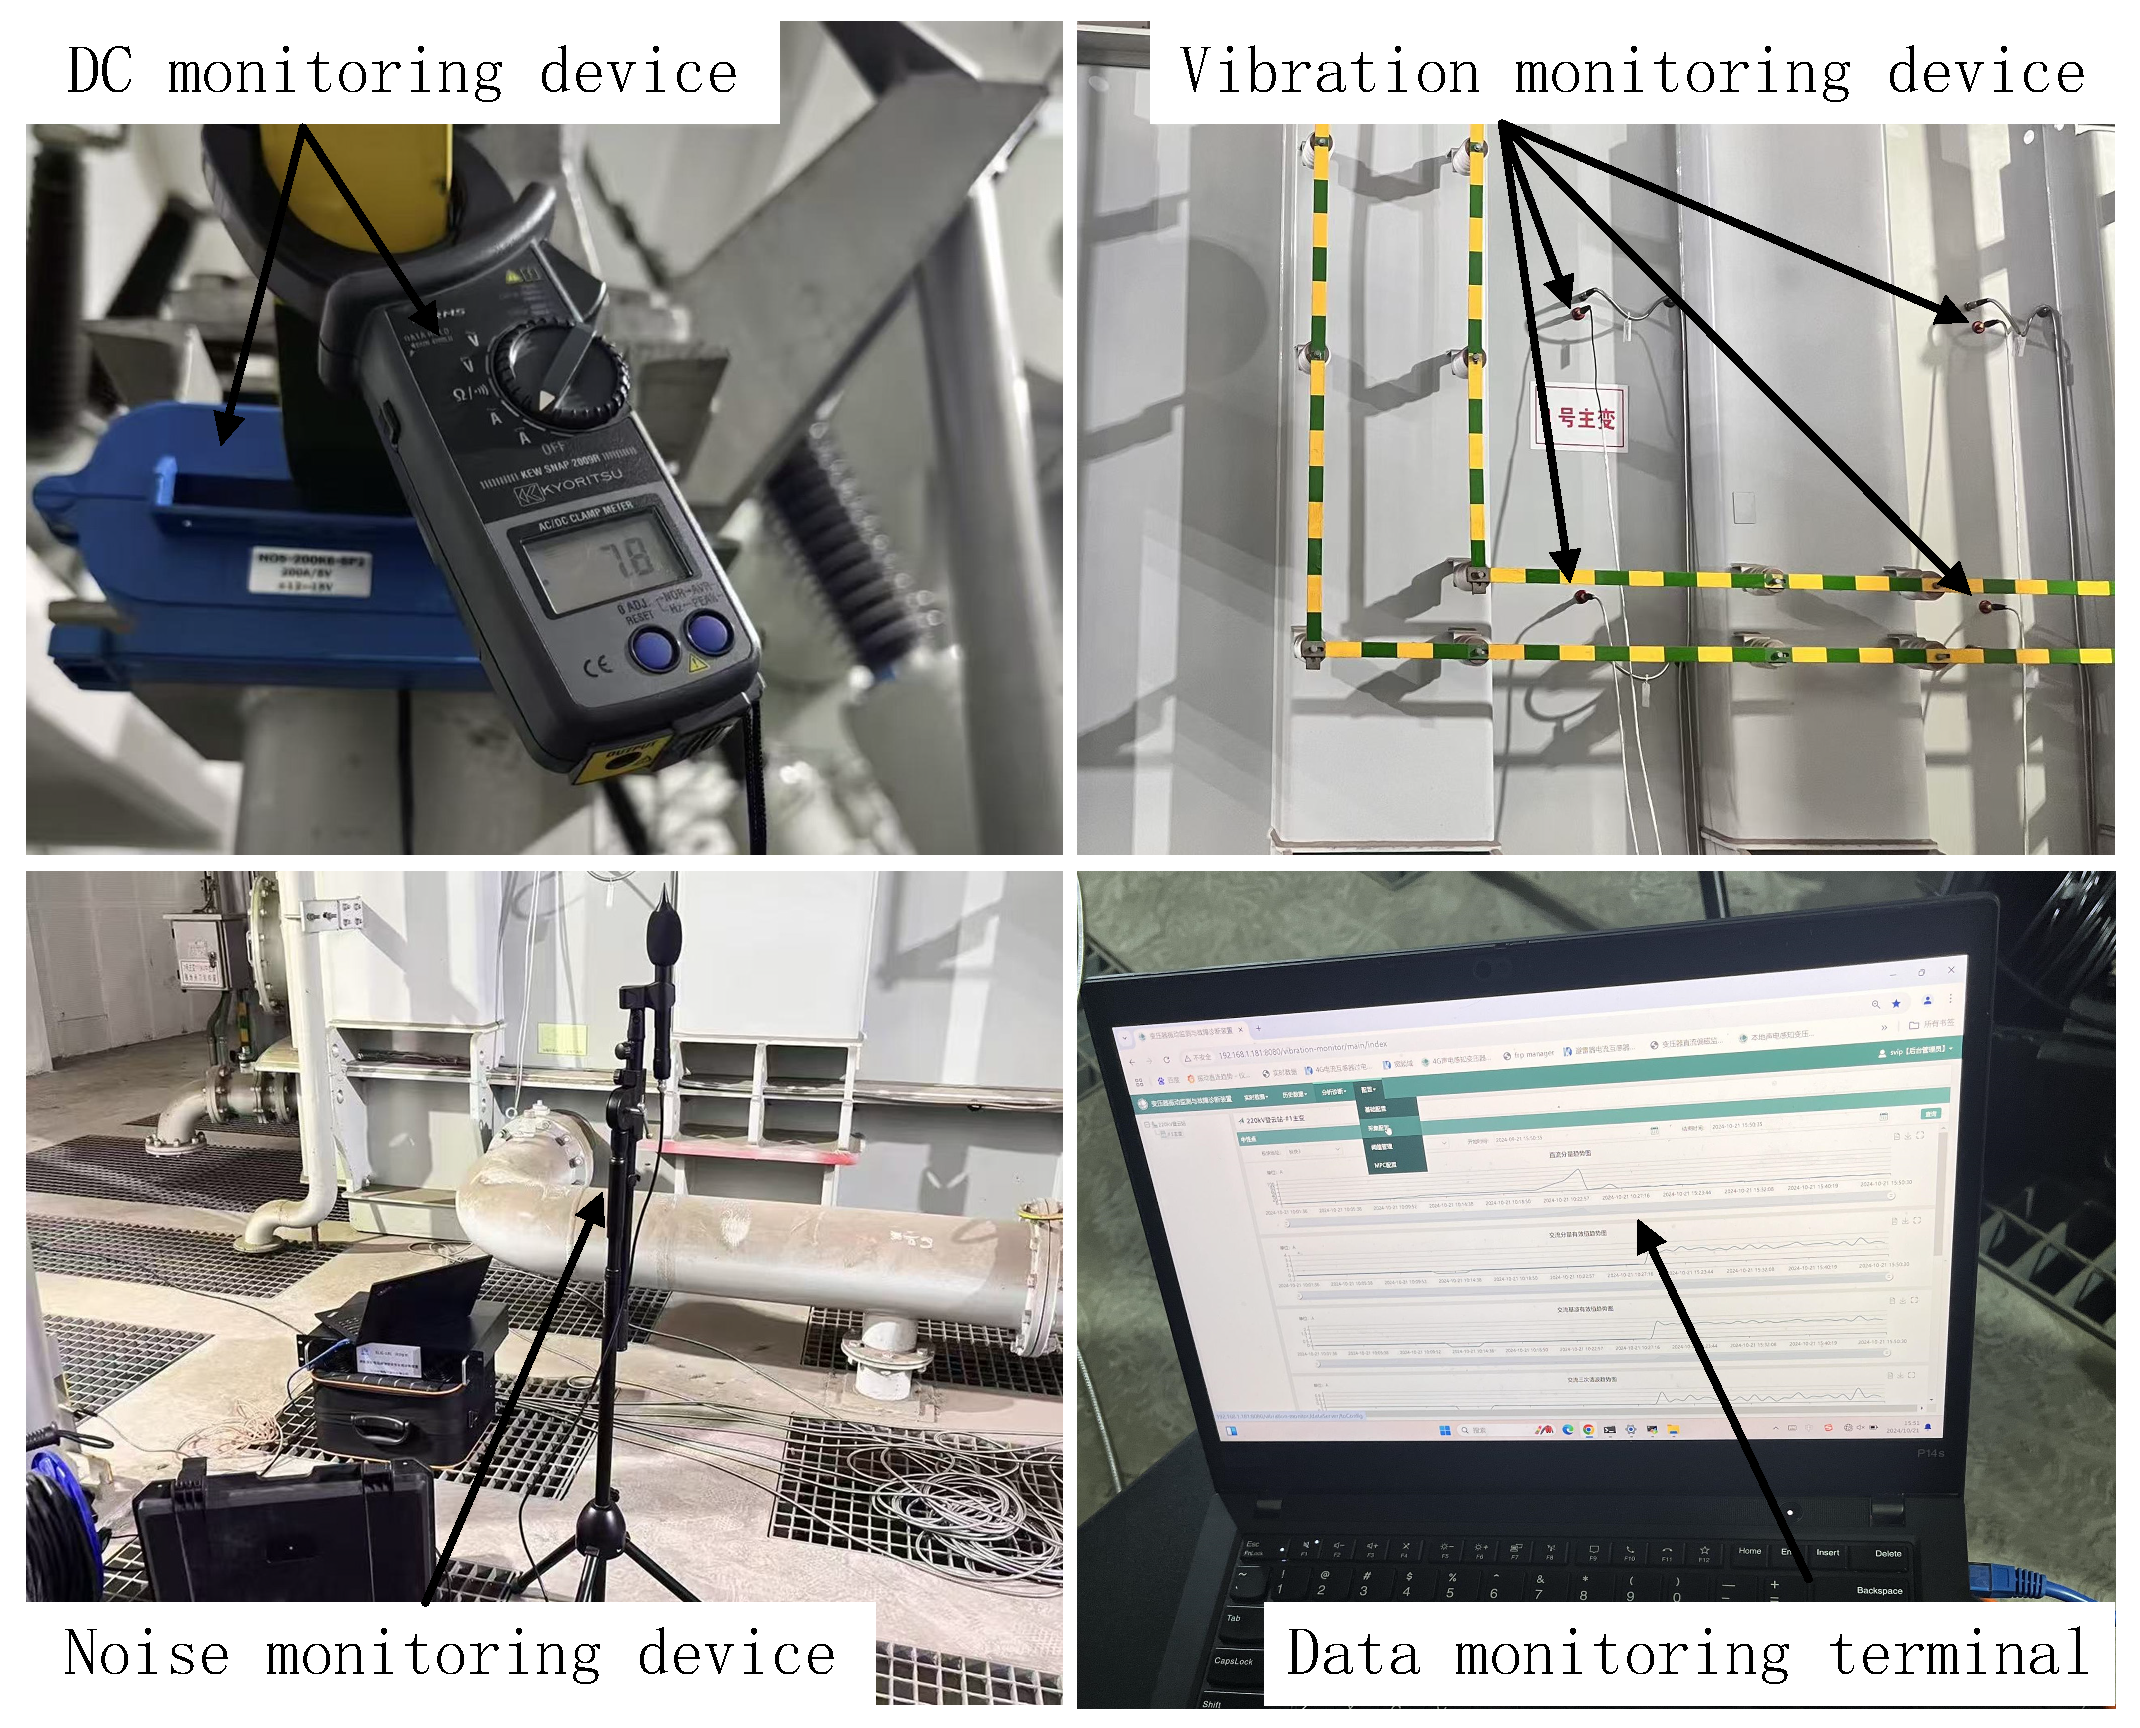
To validate the coupling model of multiple metro lines and the regional power grid, substations with abnormal operating phenomena were selected in the Hangzhou regional power grid, where synchronous multi-parameter monitoring of transformer neutral-point DC, vibration, and noise was carried out. The field monitoring system mainly consisted of a neutral-point DC current monitoring device, vibration monitoring devices, a noise monitoring device, a data acquisition module, and a data monitoring terminal. The transformer neutral-point DC current was measured using an HOS200 AC/DC current sensor (Hangzhou Kelin Electric Co., Ltd., Hangzhou, China), with an AC/DC measurement range of −200 A to +200 A and an allowable measurement error within 5%. The sensor was installed on the transformer neutral grounding conductor to obtain the neutral-point DC current signal without interrupting the grounding connection.
The vibration signals were measured using IEPE vibration acceleration sensors (Hangzhou Kelin Electric Co., Ltd., Hangzhou, China) fixed on the outer wall of the transformer tank, with six measuring points arranged from top to bottom and from left to right. The vibration sensors have a sensitivity of 100 mV/g and an amplitude measurement range of 0.05–10 g. The noise signal was collected using a sound-pressure sensor (Hangzhou Aihua Instruments Co., Ltd., Hangzhou, China) with a sensitivity of 50 mV/Pa. According to the instrument specifications, the measurable sound-pressure-level range is 17–140 dB. In this study, the collected noise signal is expressed as sound pressure in Pa. The sound-pressure sensor was arranged at a fixed measuring point located approximately 1 m away from the transformer body and approximately 1 m above the ground. All monitored signals were synchronously recorded for more than 3 d, with a recording interval of 1 min, and the raw sound-pressure data were sampled at 8192 Hz. The layout of the field measurement devices is shown in Figure 5.
Figure 5.
Field monitoring setup.
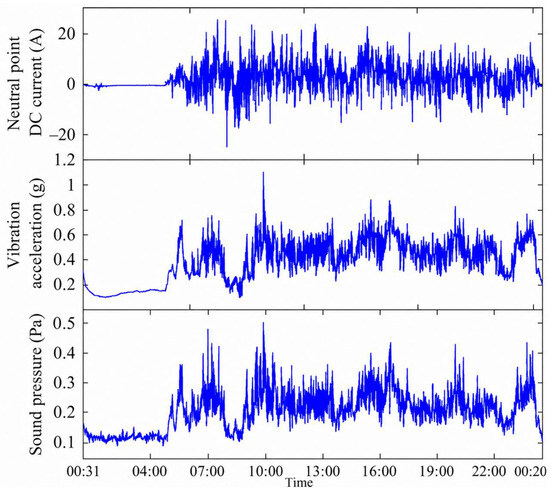
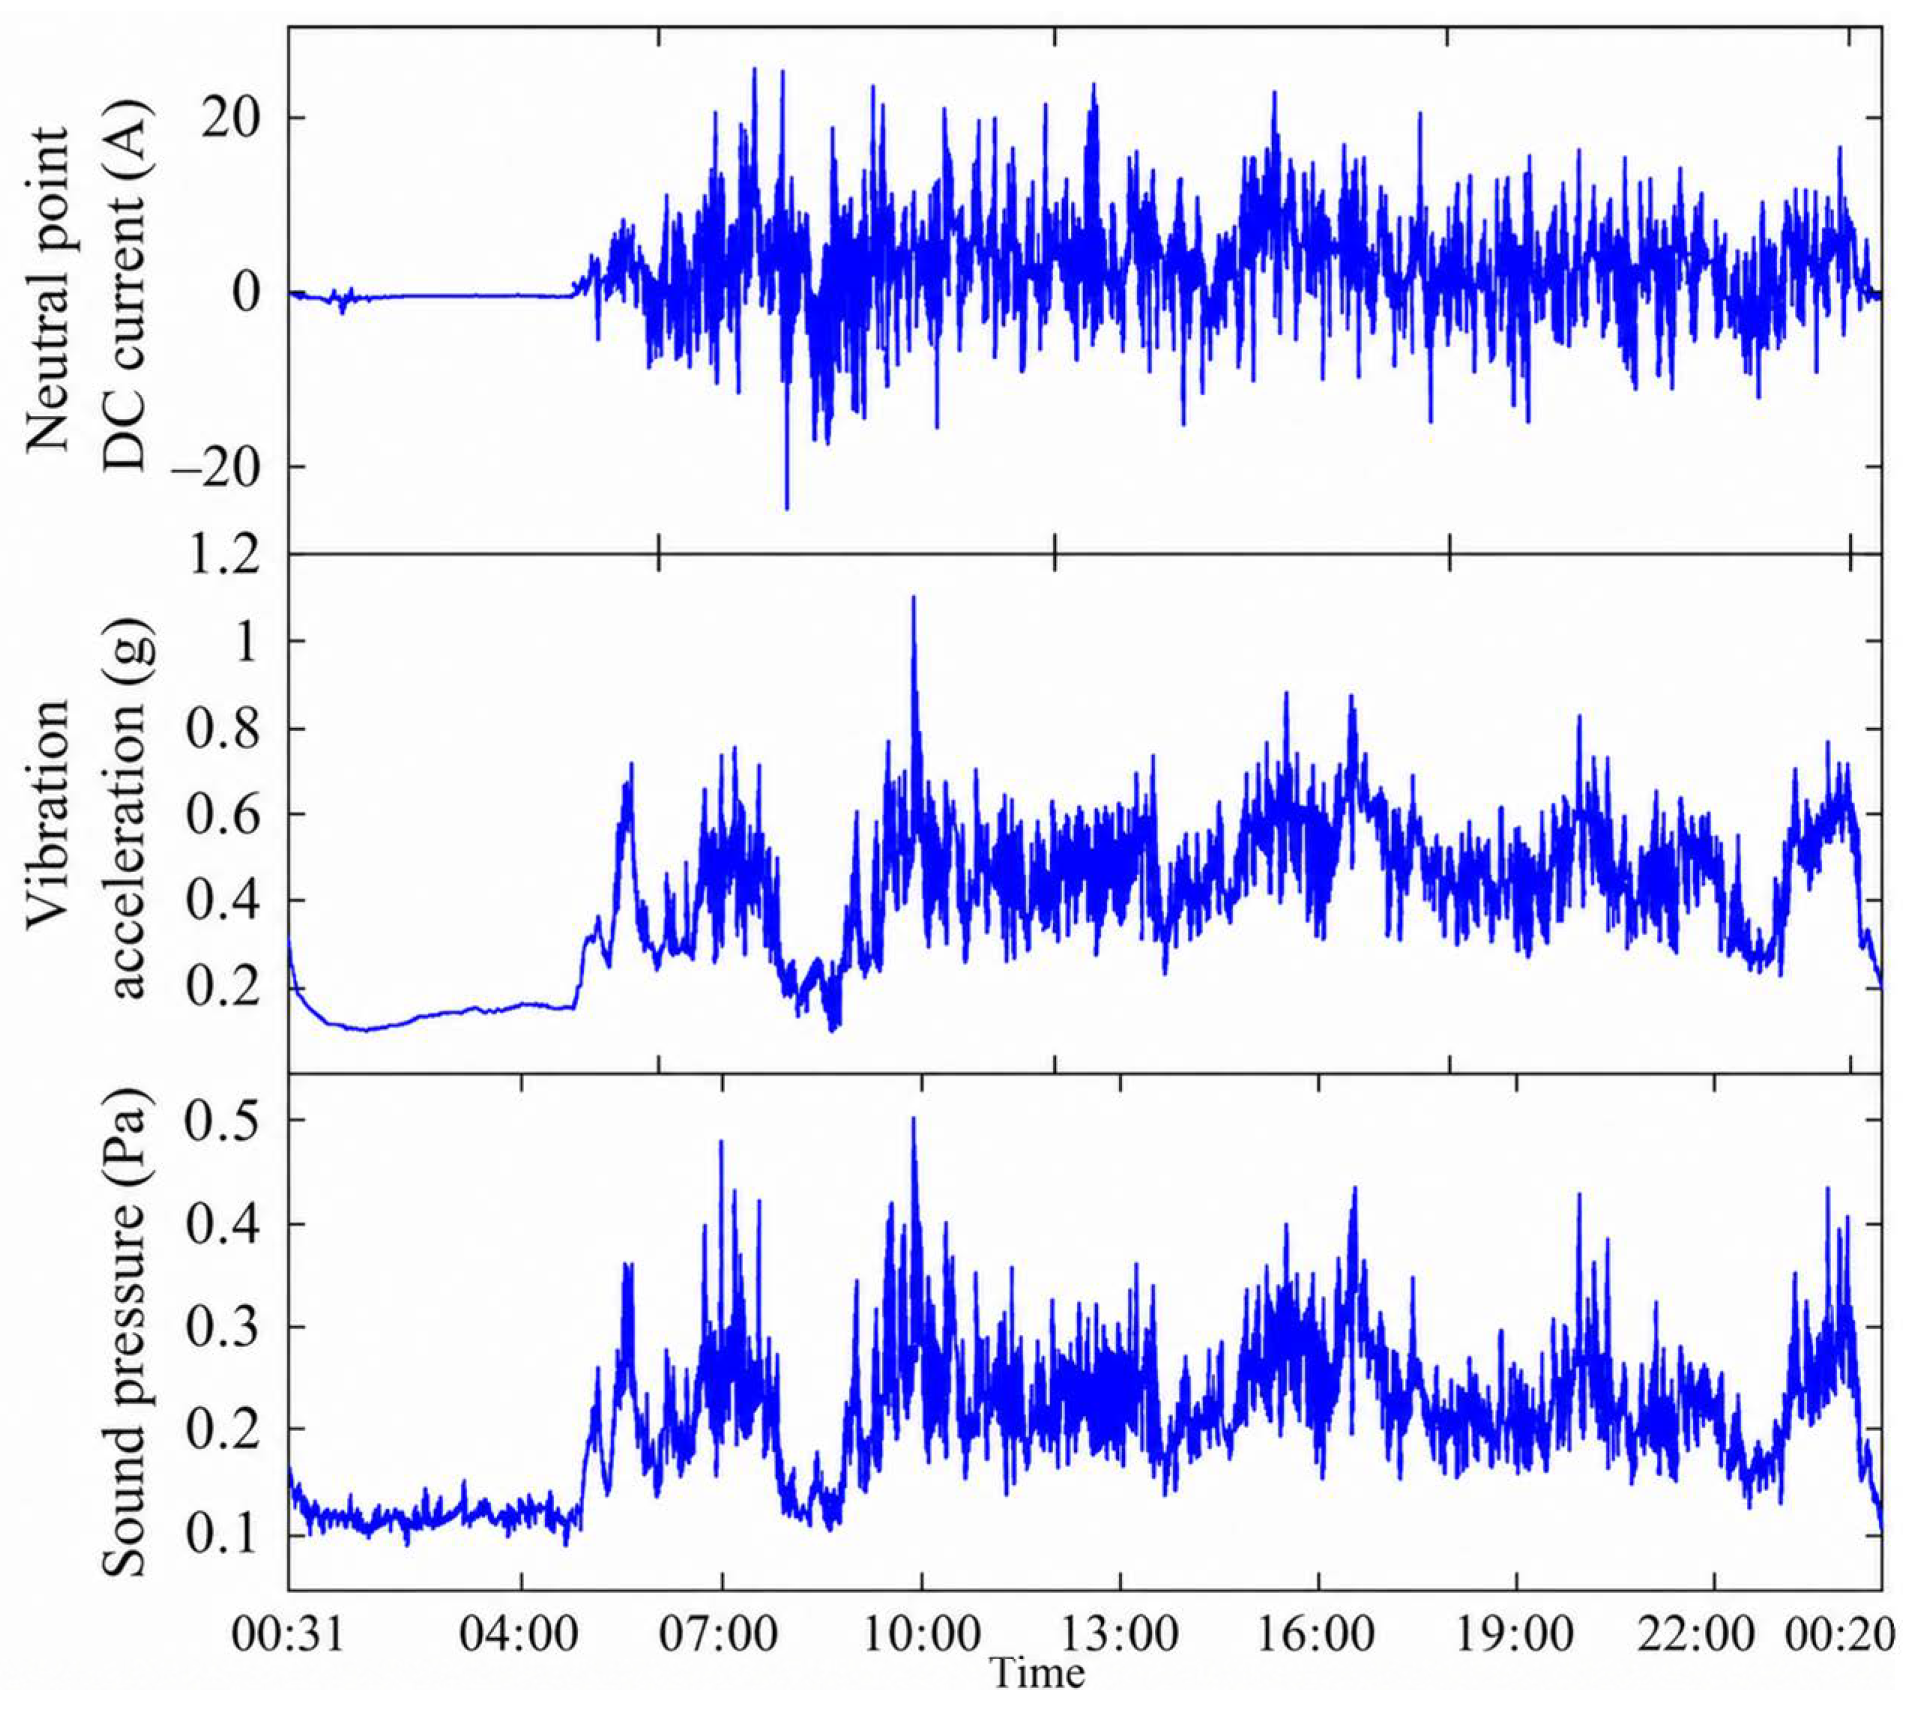
It should be noted that the field monitoring data were mainly used to analyze the synchronous variation relationship among transformer neutral-point DC, vibration, and noise, and to provide engineering validation for the proposed multi-metro-line and regional power grid coupling model. In this study, the quantitative validation of the model is mainly based on the comparison between the measured time series of transformer neutral-point DC current and the simulated results. The vibration and noise signals are used as auxiliary monitoring quantities to analyze the correlation between abnormal transformer operating phenomena and metro operating periods. Analysis of the measured data indicates a strong correlation among the monitored physical quantities, and their variation patterns are shown in Figure 6.
Figure 6.
Field monitoring data of the transformer.
The monitoring results show that the transformer neutral-point DC exhibits pronounced non-periodic fluctuations, with a peak value exceeding 20 A. The vibration acceleration and sound pressure of the transformer show strong temporal consistency with the fluctuation of the neutral-point DC current, and their peak values reach 1.1 g and 0.5 Pa, respectively. The sound pressure of 0.5 Pa corresponds to approximately 88 dB. Further analysis of the monitoring data shows that the abnormal fluctuations of the monitored physical quantities are mainly concentrated in the period from 05:20 each day to 00:31 the following day, whereas they almost completely disappear between 00:31 and 05:20. The temporal distribution characteristics of these abnormal fluctuations are consistent with the operating and shutdown periods of a nearby metro line located approximately 400 m in straight-line distance from the monitored substation. In addition, the operating records of the HVDC system in the power grid were checked during the measurement period, and no monopolar earth-return operation or abnormal grounding-electrode current condition that could significantly affect the regional ground potential was found. Therefore, the influence of the HVDC system on the measured neutral-point DC current can be excluded. These results indicate that the abnormal vibration and noise of the transformer are closely related to transformer DC bias caused by the intrusion of metro stray currents.
3.2. Model Validation
To accurately evaluate the influence of metro stray currents on the regional power grid, overcoming the limitations of conventional single-line coupling models is essential. In this study, Substation A in the Hangzhou regional power grid, as shown in Figure 3, is selected for case analysis. This substation is located within the area enclosed by Metro Lines 3 and 4, approximately 700 m from Line 3 and 200 m from Line 4. In the preliminary analysis, single-line coupling models of the regional power grid with Metro Line 3 and Metro Line 4 were established separately.
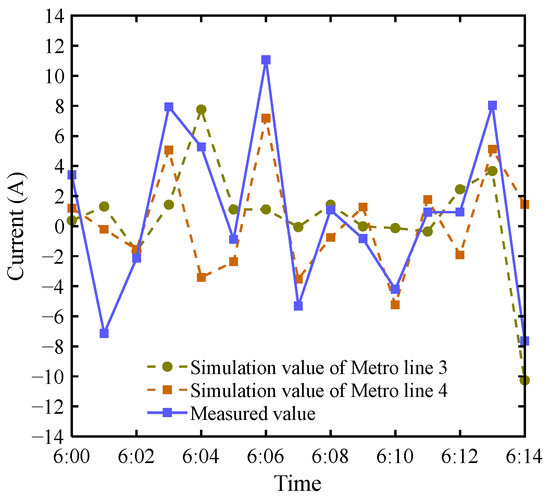
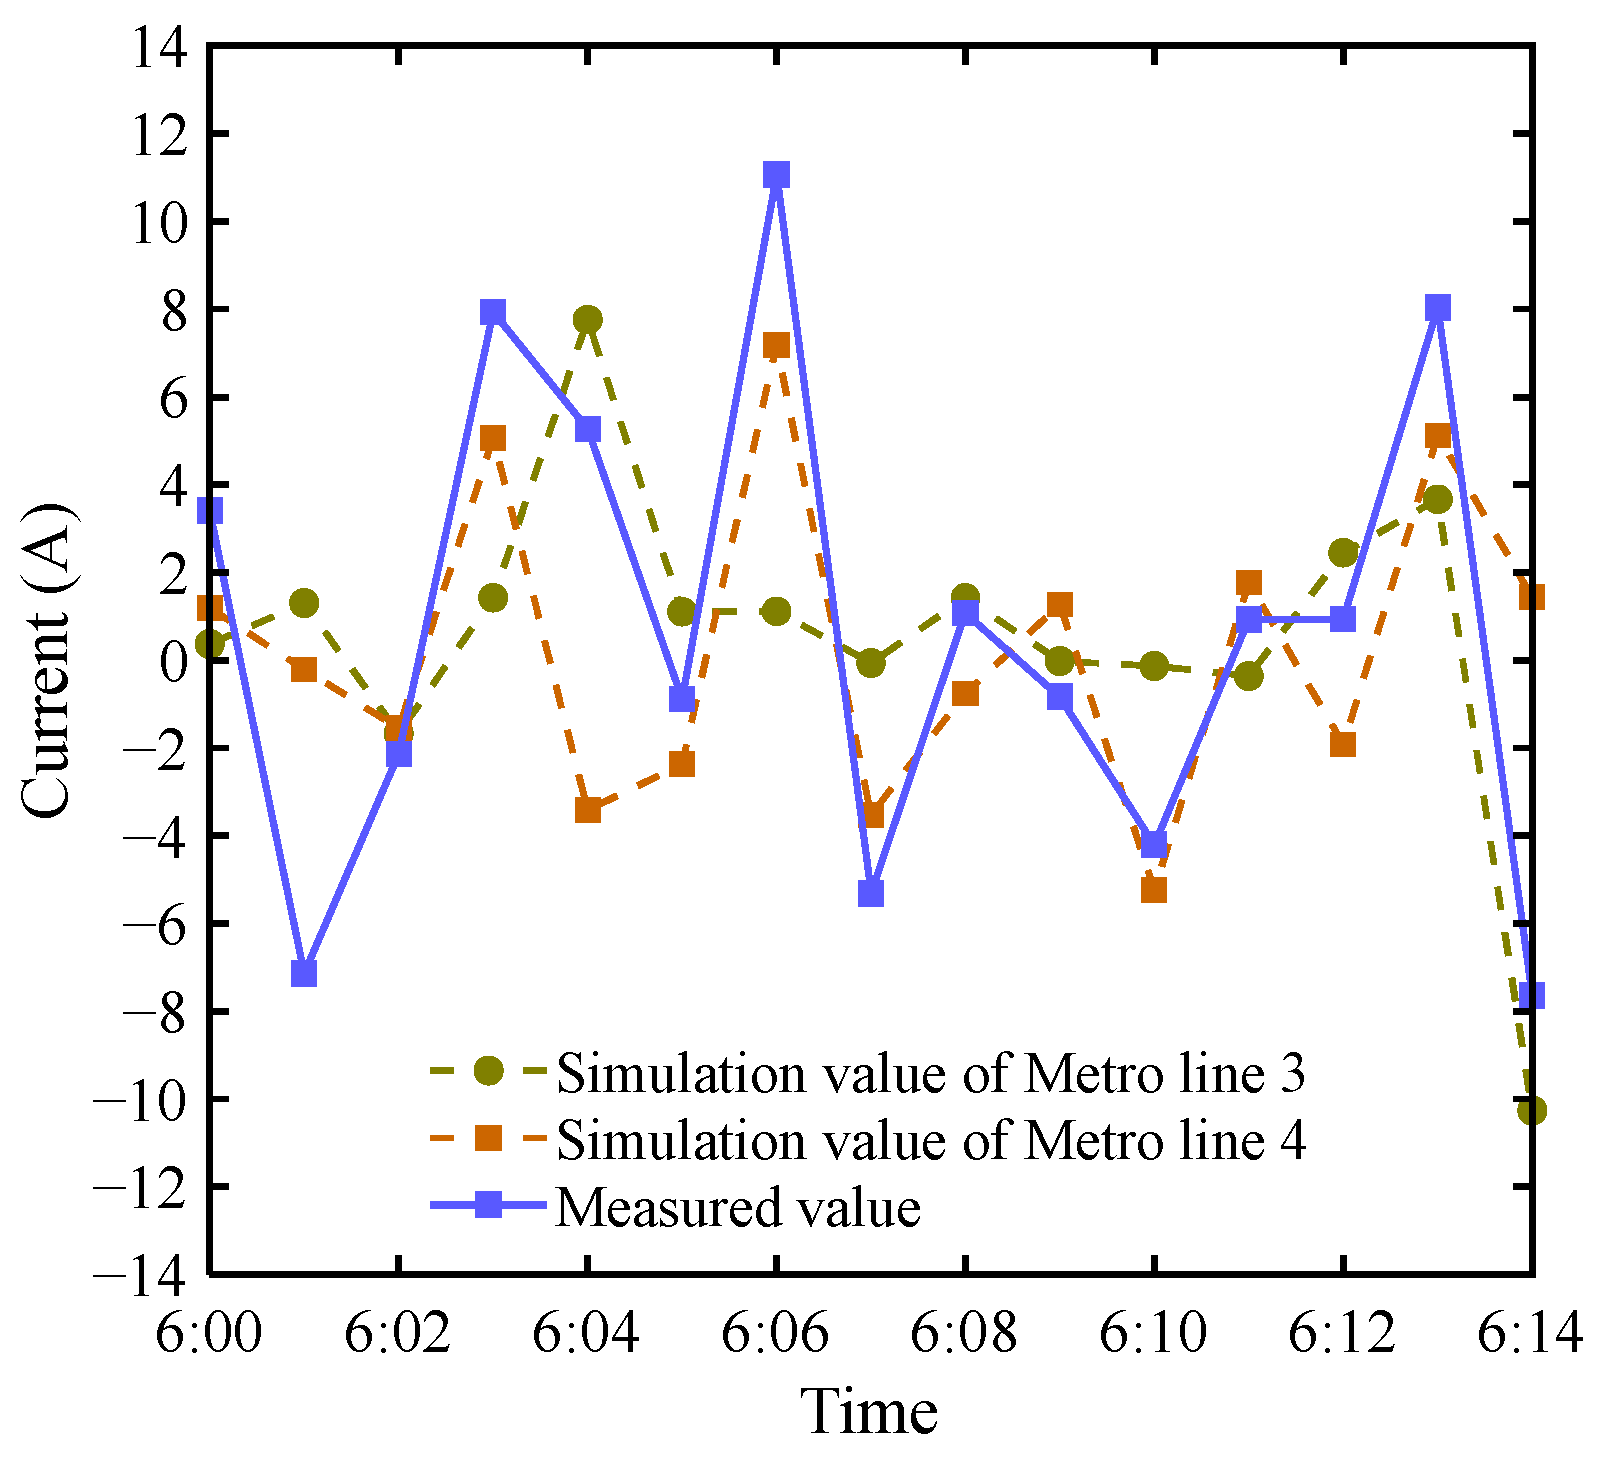
As shown in Figure 7, the DC bias currents obtained from the single-line coupling models are only partially consistent with the measured data in terms of variation trend, and clear discrepancies remain in their magnitudes. The relative errors of the peak values reach as high as 90% and 34%, respectively, which are well beyond the acceptable range for practical engineering applications. To quantitatively analyze the influence of each metro line on transformer DC bias, the DC bias current time series calculated by the corresponding single-metro-line coupling models were compared. The contribution ratio of each metro line was calculated according to the proportion of the absolute DC bias current caused by that line to the sum of the absolute DC bias currents caused by the two metro lines acting separately. The calculation results show that, although Metro Line 3 is farther away from the substation, its contribution to the DC bias current still reaches 45%, indicating that the influence of stray currents on transformer DC bias has obvious multi-source characteristics and high complexity. If only a single metro line is considered, the model cannot accurately capture the level of DC bias currents under the combined action of multiple stray current sources.
Figure 7.
Distribution of DC bias currents obtained from the single-line coupling model.
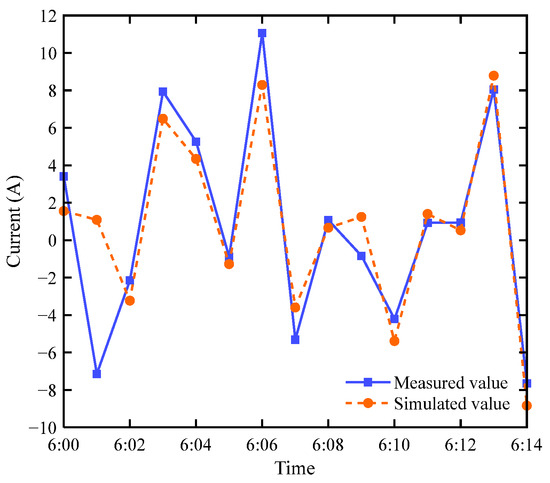
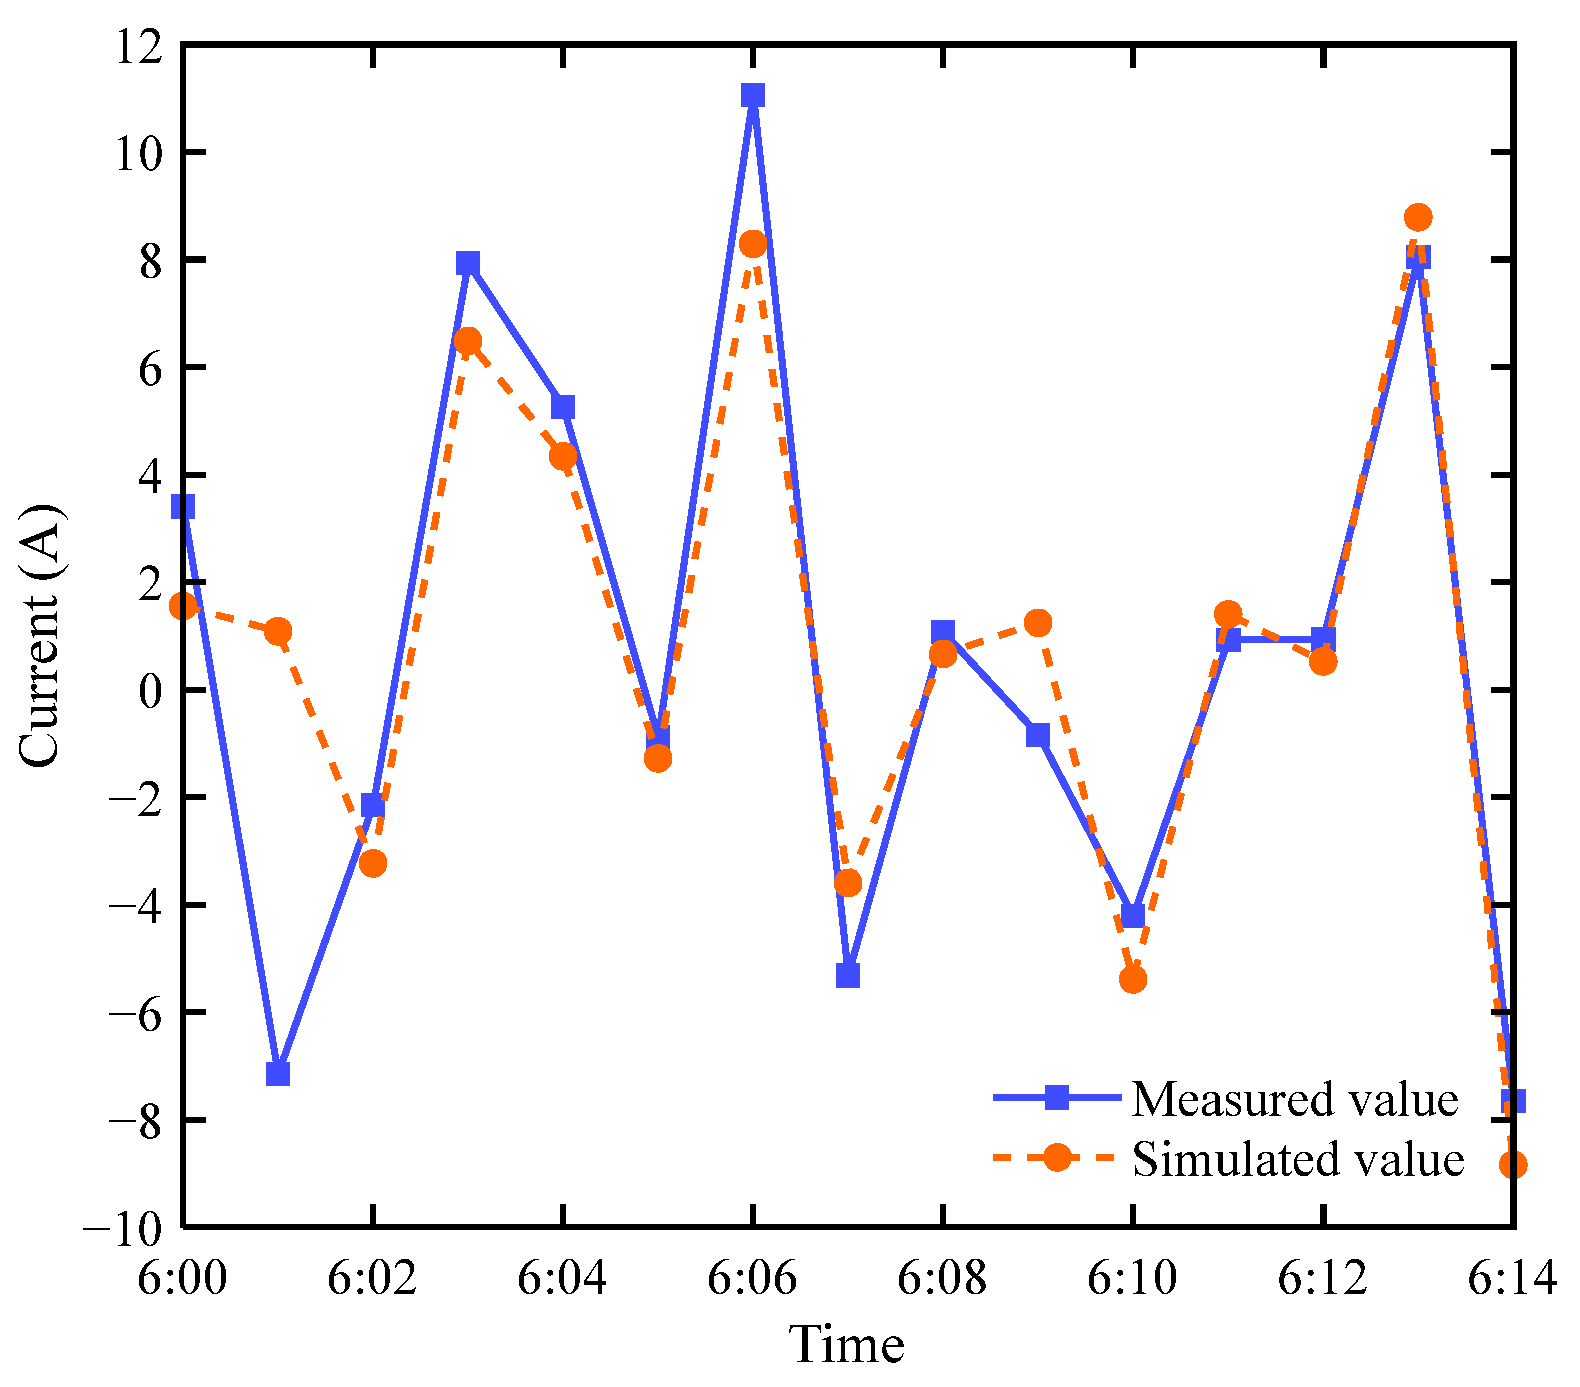
To verify the necessity of the coupling model of multiple metro lines and the regional power grid, a coupling model between Metro Lines 3 and 4 and the regional power grid was established, and the train operation data during the early departure period from 06:00 to 06:14 were input into the model for simulation. To ensure the comparability between the simulated results and the measured data, the simulated values at the corresponding time instants were extracted based on the 1 min recording interval of the measured data, and were then compared with the measured values. The corresponding current distributions are shown in Figure 8. The results show that the DC bias currents calculated by the proposed model are in good agreement with the measured values in terms of both magnitude and direction variation, and can reflect the dynamic distribution characteristics of transformer DC bias currents. For the high-amplitude DC bias current data points exceeding 8 A, the relative error analysis was performed based on the absolute deviation between the simulated and measured values and its percentage relative to the measured value. A total of three corresponding sampling points were used to calculate the mean relative error. The results show that the mean relative error between the simulated and measured values is 16%, and the absolute differences in the positive and negative peaks are 2.99 A and 1.18 A, respectively. These deviations represent the differences between the model calculation results and the measured value, rather than the calibration errors of a single measuring instrument. This indicates that, compared with the single-line coupling model, the proposed coupling model of multiple metro lines and the regional power grid provides better agreement with the measured transformer neutral-point DC.
Figure 8.
Distribution of DC bias currents obtained from the multi-metro-line coupling model during the early departure period.
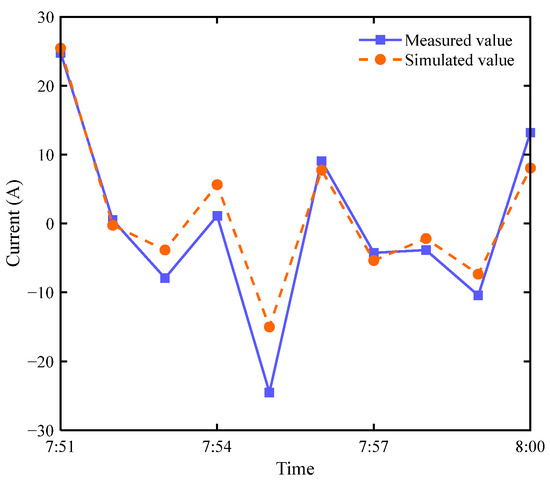
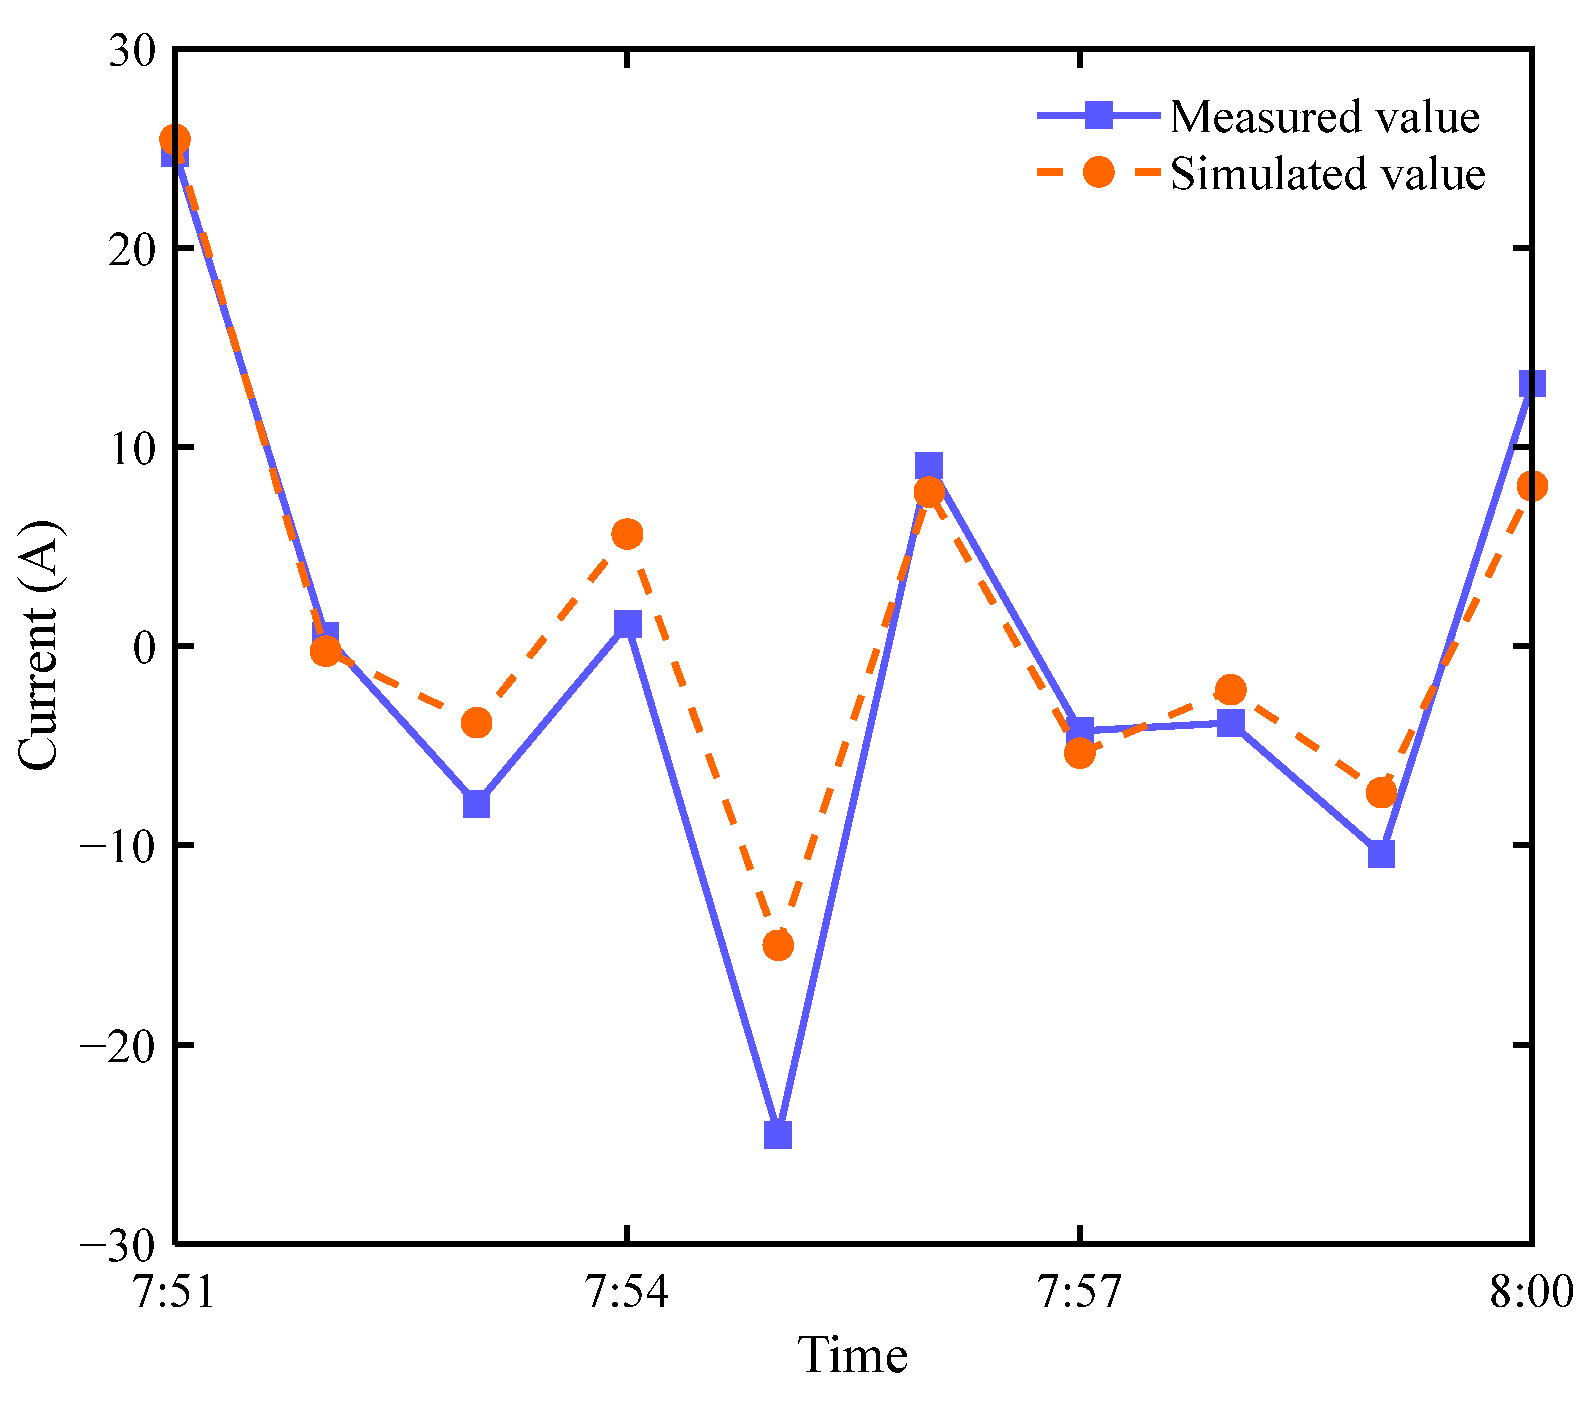
To further analyze the applicability of the proposed model under different metro operating conditions, the train operation data during a partial morning peak interval from 07:51 to 08:00 were selected for supplementary calculation on the basis of the validation during the early departure period, and the measured data at the corresponding time instants were extracted for comparative analysis. The results are shown in Figure 9.
Figure 9.
Comparison between simulated and measured DC bias currents during the morning peak period.
It can be seen that, under the morning peak operating condition, the transformer DC bias currents calculated by the model can still reasonably reflect the main variation trend and peak characteristics of the measured currents. Compared with the early departure period, the train density on the line increases significantly during this period, and the operating conditions of multiple trains become more complex and change more frequently, resulting in more complicated stray-current distributions and transformer DC bias current fluctuations. Therefore, the mean relative error between the simulated and measured values increases compared with that during the early departure period, reaching approximately 21%. However, considering the agreement in the current variation trend and amplitude characteristics, the error remains within an acceptable range for engineering evaluation.
Under actual metro train operating conditions, transformer DC bias currents fluctuate in real time with train operation. Owing to the combined influence of the field measurement environment, model simplification, and simulated train operation data, together with systematic factors such as weak current contributions from other buried metallic structures, some deviations still exist between the simulated and measured DC bias currents in low-current intervals. From an engineering application perspective, according to the principles of transformer DC bias mitigation, the distribution characteristics of DC bias currents during high-amplitude intervals are of greater relevance to mitigation. Based on the validation results during both the early departure period and the morning peak period, for the high-amplitude DC bias current data points, the mean relative error between the simulated and measured values does not exceed 25%, indicating that the error of the proposed model remains within an acceptable engineering range. Moreover, the model can effectively capture the variation characteristics of DC bias currents under the combined influence of multiple stray-current sources. This further supports the applicability and necessity of establishing the coupling model of multiple metro lines and the regional power grid based on the superposition principle.
3.3. Dynamic Assessment and Analysis of DC Bias Currents in the Regional Power Grid
3.3.1. Construction and Calculation of the Regional Power Grid Coupling Model
After model validation, the validated modeling method is further applied to the dynamic assessment of the regional power grid and to provide the basis for the subsequent mitigation analysis. Based on the modeling method described above, the Hangzhou regional power grid model, including 72 substations rated at 110 kV and above, is coupled with the models of five metro lines to construct a coupling model of multiple metro lines and the regional power grid. Field measurements indicate that the fluctuation characteristics of transformer DC bias currents are strongly correlated with metro operating periods, and that the morning and evening peak periods, namely 7:00–9:00 and 17:30–20:00, are the primary intervals during which current peaks occur. Further analysis shows that trains operate periodically according to the departure headway, causing transformer DC bias currents to exhibit a corresponding periodic fluctuation pattern.
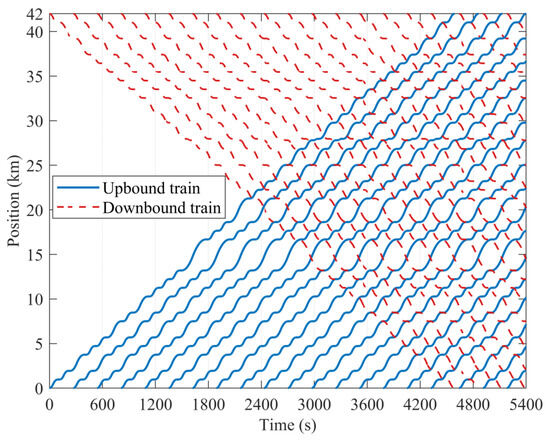
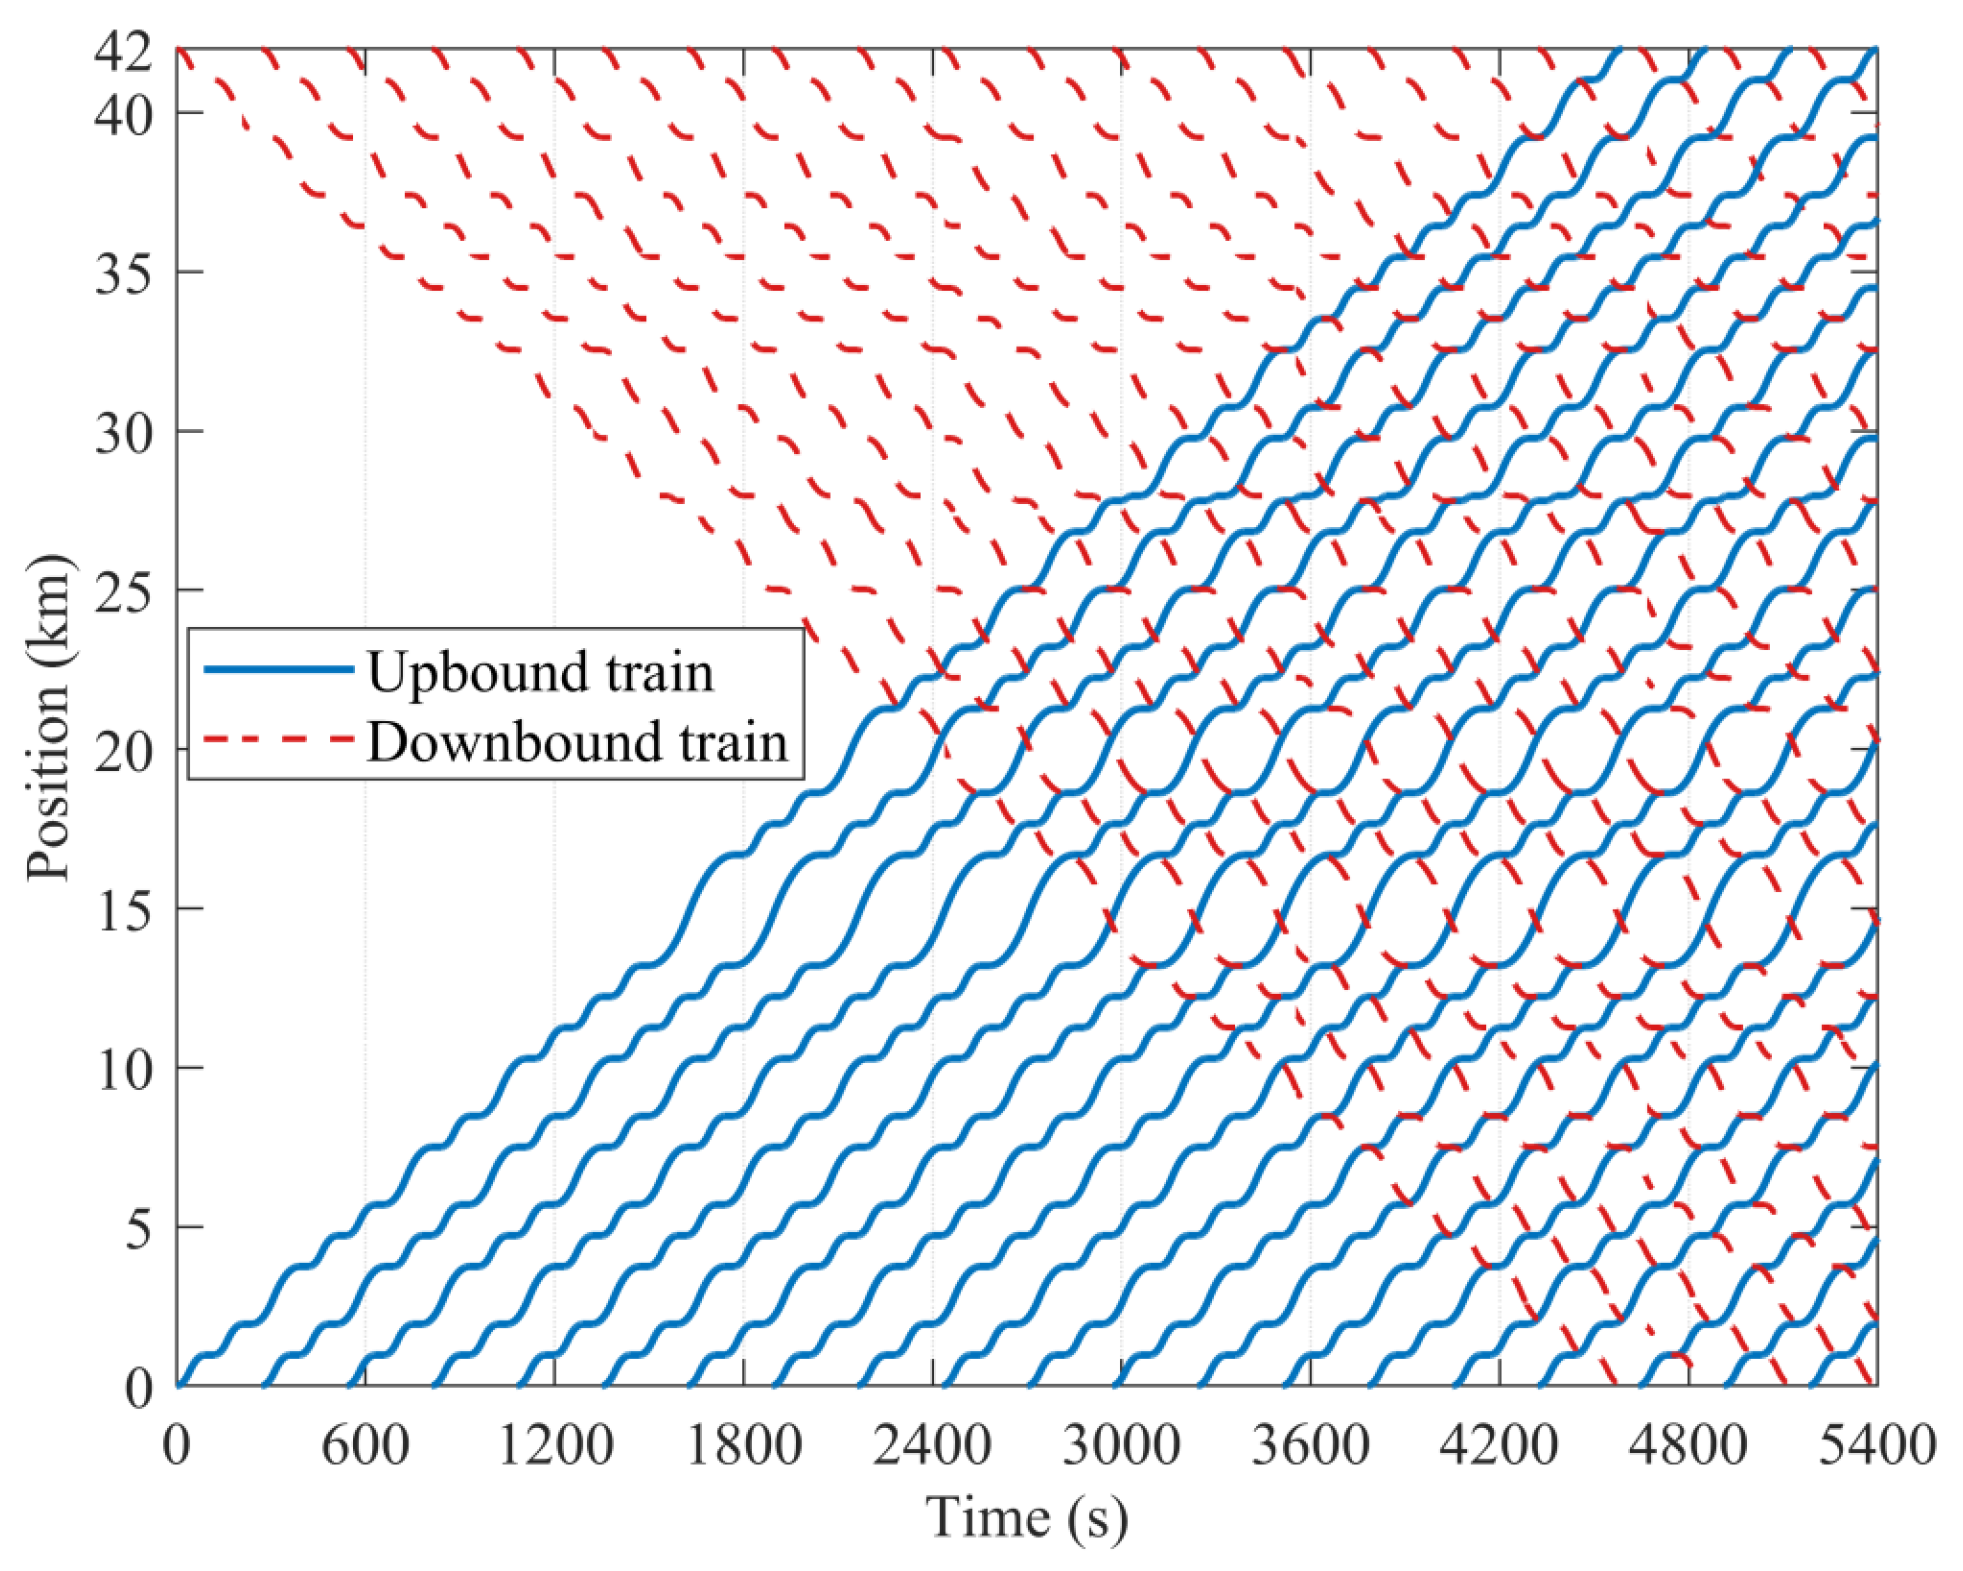
Therefore, in this study, the dynamic operating characteristic curves of trains during peak periods are obtained through traction power-flow calculations according to the departure headways, dwell times, and relevant line information of each metro line. Taking Metro Line 2 as an example, its departure headway during the peak period is set to 4.5 min, and the dwell time is set to 30 s. Based on these settings, the train operating characteristics along the entire Metro Line 2, as shown in Figure 10, are obtained through simulation. During the peak period, the maximum number of trains simultaneously operating in both directions on Metro Line 2 reaches 34. Since the number of trains operating on each metro line remains at a relatively high level after 4600 s, this interval can represent a typical heavy-load operating condition of the metro system. Therefore, the train operation data during the peak period from 4600 s to 4830 s are selected for dynamic simulation. Within this simulation interval, the maximum number of simultaneously operating trains on all metro lines exceeds 150. In the subsequent simulation of transformer DC bias currents in the 72-substation regional power grid, the train operation data of all metro lines are input into the model according to their corresponding operating conditions.
Figure 10.
Train operating characteristics of Metro Line 2.
3.3.2. Evaluation Results and Characteristic Analysis of Transformer DC Bias Currents
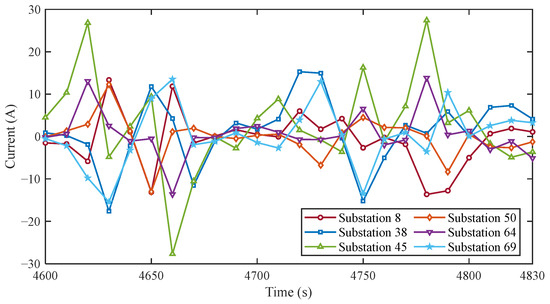
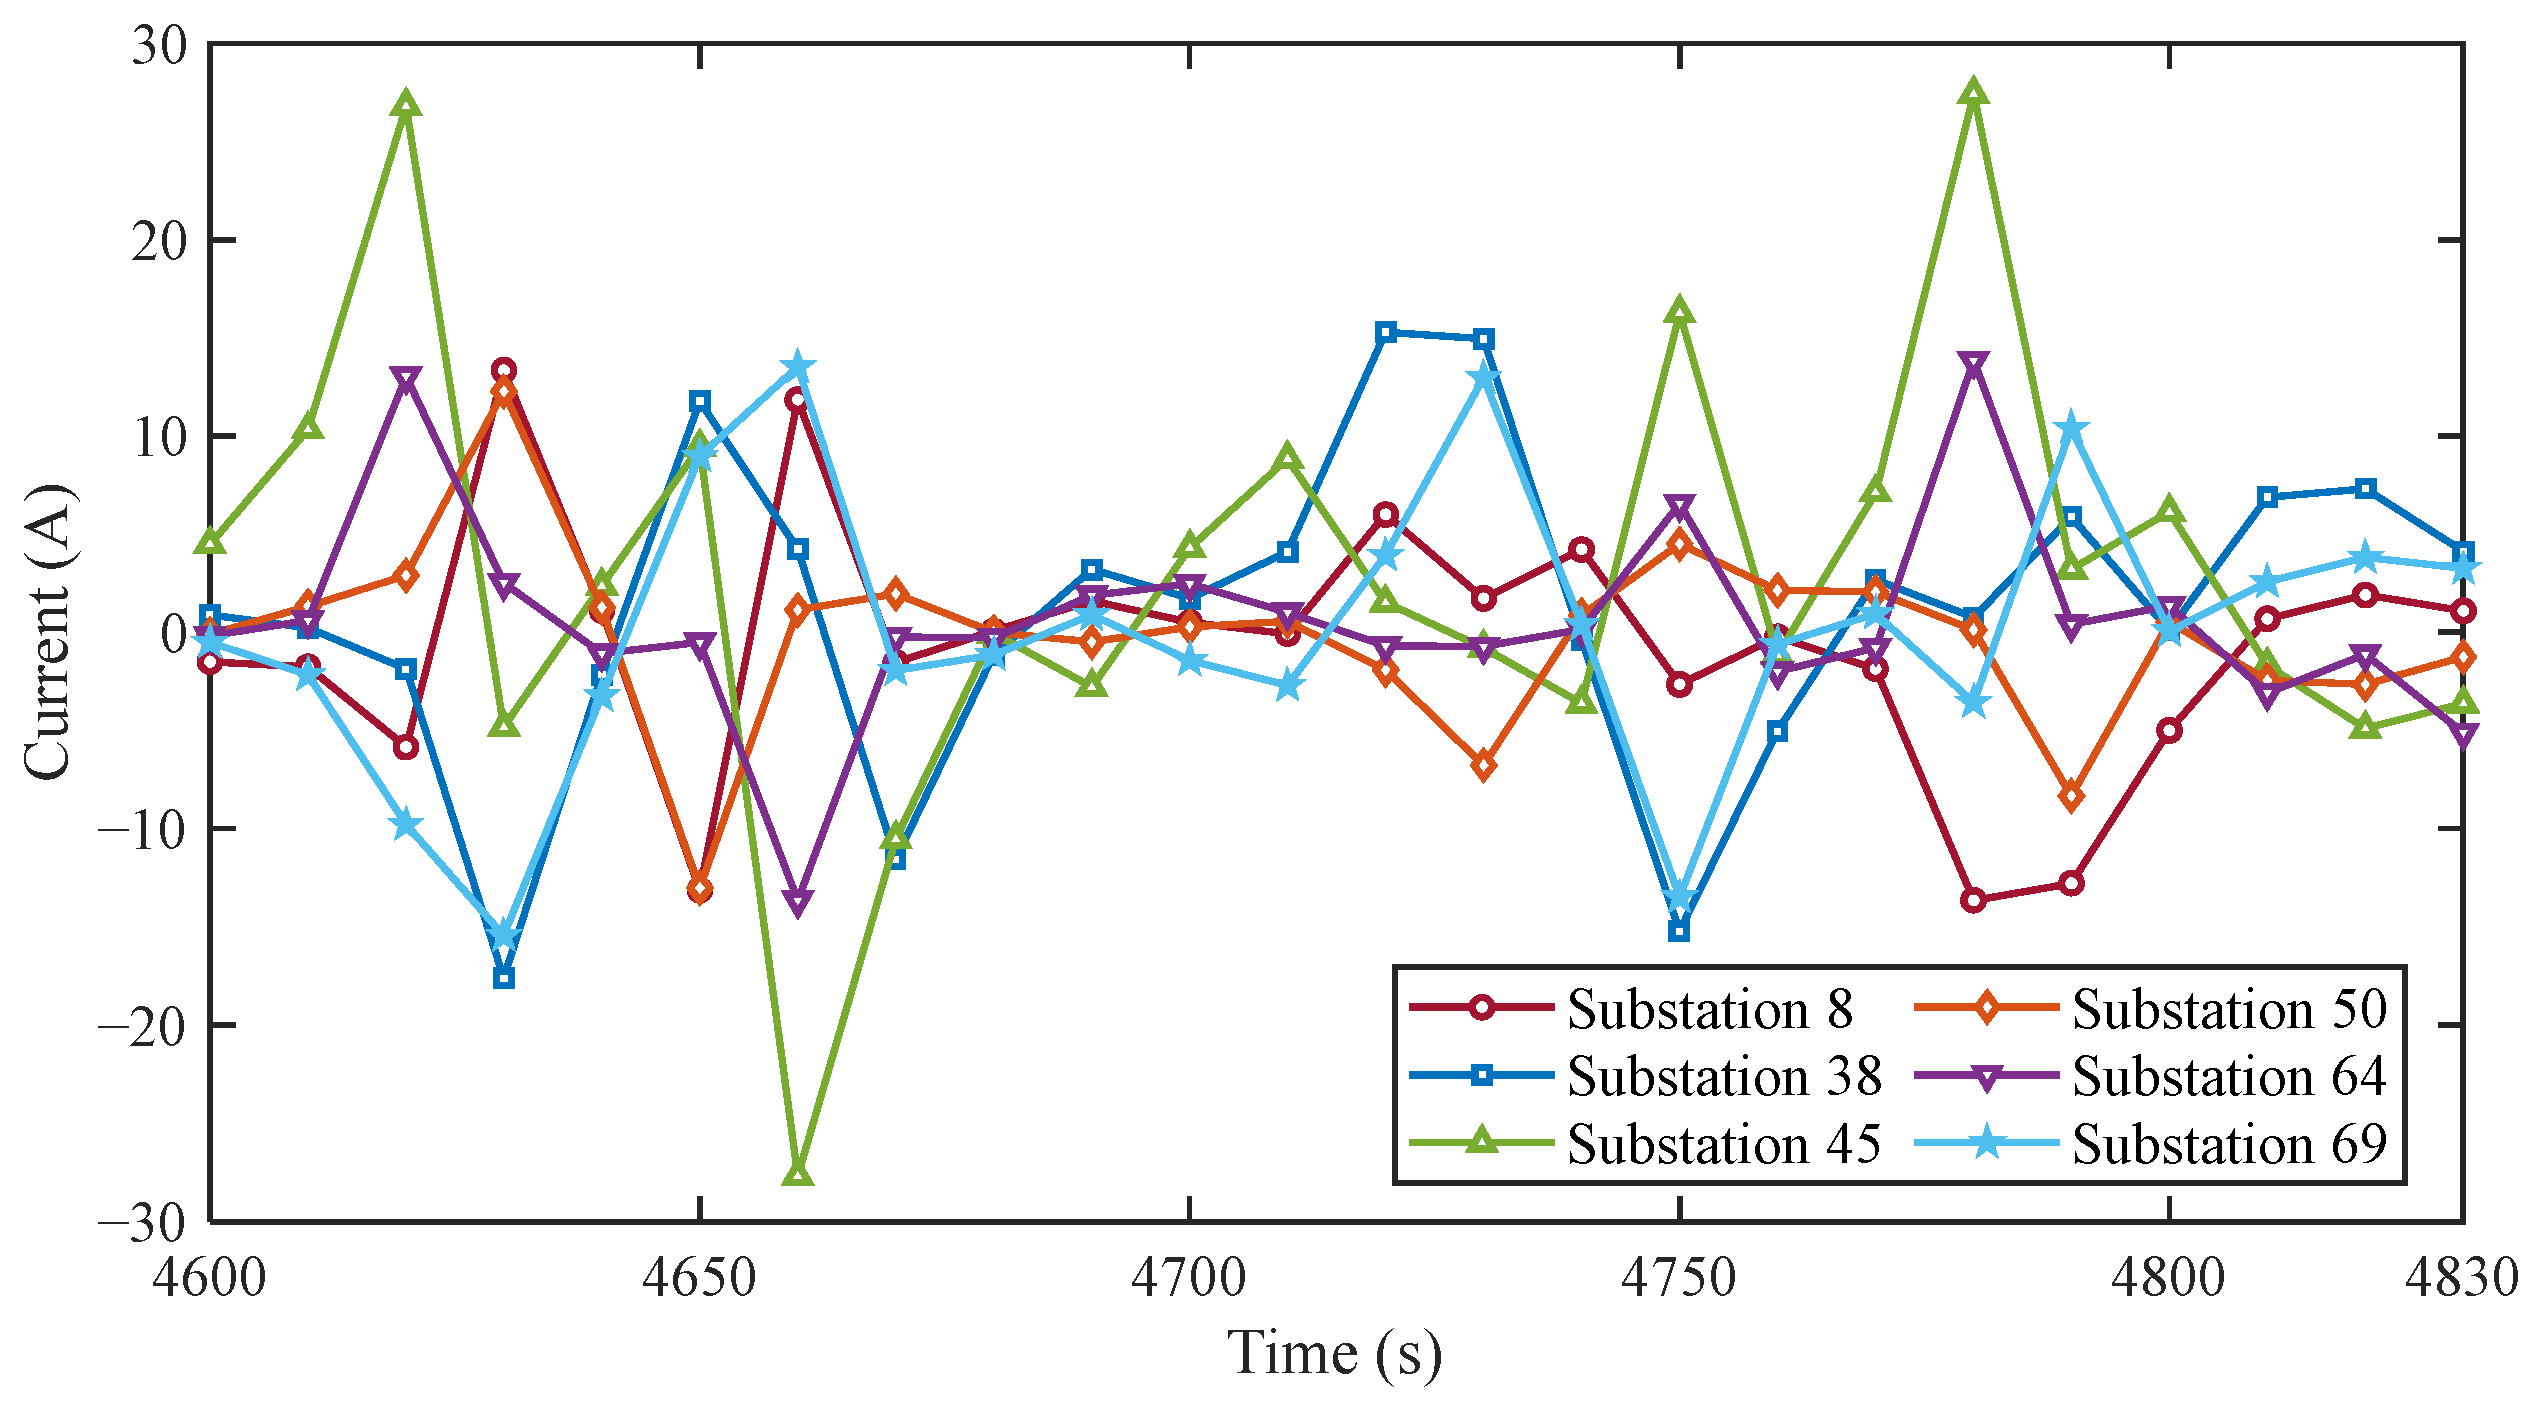
For convenience of analysis, the 72 substations are indexed uniformly. The results show that the peak and average values of DC bias currents differ markedly in magnitude among the substations. Taking Substation 45, which is the most severely affected, as an example, its positive and negative peak values are 27.41 A and −27.68 A, respectively, whereas the average absolute current over the entire simulation period is only 6.17 A, which is much lower than the peak values. This result indicates that the influence of stray currents on transformers is dominated by transient impacts associated with changes in train operating conditions, rather than by a stable DC component. A further analysis of the substations in the regional power grid shows that the peak DC bias currents exceed 10 A at nine substations, namely Substations 8, 30, 36, 38, 40, 45, 50, 64, and 69. To further analyze the relationship between transformer DC bias currents and the spatial distribution of substations, the spatial relationship between the above substations and nearby metro lines is summarized in Table 2.
Table 2.
Spatial relationship between substations with peak DC bias currents exceeding 10 A and metro lines.
In this study, the distance from each substation to the nearest metro line and the number of metro lines within 2 km are adopted as analysis indicators to describe the spatial correlation in the target regional power grid. As shown in Table 2, substations with higher DC bias currents are generally affected by two or more metro lines within 2 km, indicating that transformer DC bias currents are related to the distance to nearby metro lines and the combined influence of multiple metro lines. Among these substations, Substation 45 has the largest simulated absolute peak value of DC bias current. This may be mainly because its distances to the nearby metro lines are approximately 0.2 km and 0.7 km, respectively, and it is jointly affected by Metro Lines 3 and 4. Under dynamic train operating conditions, changes in train operating conditions further affect the rail-to-earth potential and stray-current distribution, which may lead to a larger DC bias current at this substation.
Figure 11 shows the dynamic variation characteristics of transformer DC bias currents at several substations during the simulation period. The dynamic waveforms further show that transformer DC bias currents exhibit pronounced fluctuations together with alternating positive and negative variations. This dynamic behavior is mainly determined by train operating conditions. Transitions between traction and braking change the rail-to-earth potential distribution and alter both the magnitude and direction of the stray currents intruding into the regional power grid, thereby causing dynamic variations in the magnitude and direction of the DC bias current. For Substation 45, the current amplitude remains relatively low during the interval from 4680 s to 4740 s, mainly because trains on the nearby lines are in the coasting state or approaching station stops during this period, which reduces the stray currents entering the substation.
Figure 11.
Dynamic distribution of transformer DC bias currents.
4. Dynamic Iterative Mitigation Model for Transformer DC Bias
4.1. DC Bias Current Threshold and Selection of Suppression Devices
Based on the above evaluation results of transformer DC bias currents at substations in the Hangzhou regional power grid, it can be seen that relatively high DC bias currents occur at multiple substations. However, transformer DC bias is not judged simply by the presence of a DC bias current, but rather by whether the current exceeds the transformer’s own tolerance limit. Because transformers have a certain tolerance margin for DC, the excitation current waveform remains essentially normal and the equipment operation is not significantly affected as long as the current stays within the allowable range. Therefore, this section determines appropriate DC bias current thresholds in combination with relevant standards and equipment parameters.
According to the Technical Guide for HVDC Grounding Electrodes [25], the allowable DC passing through transformer windings is related to the transformer structure. In general, when detailed manufacturer data are not available, the allowable DC current limits for single-phase transformers, three-phase five-limb transformers, and three-phase three-limb transformers can be taken as 0.3%, 0.5%, and 0.7% of the rated current, respectively. For a three-phase transformer, the rated current can be calculated from its rated capacity and voltage level as follows:
where is the rated current of the transformer, is the rated capacity, and is the rated voltage.
Therefore, according to the rated capacities, voltage levels, and structural forms of the transformers in the regional power grid, the DC bias current limits of different transformers can be calculated, as shown in Table 3. The substations investigated in this study are mainly at the 220 kV and 110 kV voltage levels. The calculation results in the table show that the maximum DC bias current limit of transformers at the 220 kV voltage level is approximately 10 A, while the DC bias current limit of a typical 110 kV transformer is approximately 9 A. In recent years, with the improvement of manufacturing processes, the tolerance of transformers to DC bias currents has increased. Combined with the practical engineering conditions of the Zhejiang power grid and the criterion reported in Reference [26], 10 A is adopted in this study as the DC bias current threshold for screening heavily affected substations and for the subsequent DC bias mitigation analysis.
Table 3.
Maximum DC bias current limits for transformers.
By comparing the simulated DC bias currents with the threshold defined above, the analysis shows that, within the simulation period, DC bias currents at nine substations in the Hangzhou regional power grid exceed the specified threshold, indicating that these substations are at risk of transformer DC bias. The identification numbers of these substations and their absolute peak values of simulated DC bias currents are listed in Table 4. The peak DC bias currents listed in Table 4 are simulated absolute peak values obtained from the validated multi-metro-line and regional power grid coupling model under dynamic train operating conditions.
Table 4.
Absolute peak values of simulated DC bias currents at different substations.
4.2. Multi-Objective Optimal Allocation Model
Existing mitigation strategies for transformer DC bias caused by metro stray currents often follow an “install-on-threshold-exceedance” principle. In this strategy, the absolute peak values of transformer DC bias currents at all substations are first assessed, and the substations where the specified threshold is exceeded are identified as mitigation targets. The type of suppression device is then selected according to the mitigation requirement of transformer DC bias at each substation, the allocation cost, and the engineering applicability of different devices.
However, under a complex power-grid topology, this strategy tends to increase both the number of suppression devices and the overall cost. In addition, due to the network coupling reflected by the grid impedance matrix, changing the grounding parameters at a local substation may shift the stray-current flow path, thereby causing the DC bias current at other nearby substations to exceed the threshold. Because the direct-coupling model is difficult to integrate directly with an iterative optimization algorithm, its application to the rapid and coordinated optimal allocation of DC bias suppression devices in the regional power grid is limited. To overcome this difficulty, transformer DC bias mitigation is investigated from the perspective of the entire regional power grid. An indirect-coupling-based calculation model for transformer DC bias currents in the regional power grid is established, into which the substation ground potentials obtained at each time step from the direct coupling method are introduced as inputs. On this basis, a multi-objective optimal allocation model is further developed by combining the calculation model with a multi-objective optimization algorithm, so as to balance the cost of mitigation and the overall operational security of the power grid.
Based on the characteristics and applicability of existing DC bias suppression devices, a hybrid allocation strategy involving different types of suppression devices is proposed. Under this strategy, the neutral point of each transformer in the power grid can be assigned one of three states: no mitigation, installation of a capacitive DC-blocking device, or installation of a resistive current-limiting device. To achieve coordinated optimization of devices over the entire network, a multi-valued coding strategy is introduced to discretize the decision variables, and a gene sequence corresponding to the mitigation mode of each substation node in the regional power grid is constructed, as listed in Table 5. Assuming that the regional power grid contains N substations, the decision vector is defined as = [, , …, ], where ∈ {0, 1, 2}.
Table 5.
Coding definition for suppression device allocation.
According to the coding definition in Table 5, the suppression devices are introduced into the DC-equivalent network of the regional power grid through the neutral grounding branch of each transformer. When = 1, the resistive current-limiting device is represented by adding a 3 Ω series resistance. When = 2, the capacitive DC-blocking device is represented by treating the corresponding neutral grounding branch as an open circuit for the DC component, since the impedance of a capacitor tends to infinity under DC conditions.
Based on the defined decision variables, two minimization objective functions are constructed to guide the optimization process. The first objective is to minimize the number of DC bias suppression devices installed in the regional power grid. The model calculates the number of installed devices by counting the total number of nonzero entries in the encoded decision vector, and the corresponding objective function is given as follows:
where denotes the value of the decision variable at the i-th substation node. is the sign function, which takes the value 0 when and 1 when .
The second objective is to minimize the total absolute DC bias in the network, which is defined as the sum of the absolute values of transformer DC bias currents over the regional power grid. The corresponding objective function is given as follows:
where denotes the transformer DC bias current at the i-th substation node under the decision vector X.
Meanwhile, to satisfy the mitigation requirement that the transformer DC bias current at every substation node in the regional power grid should remain below the specified threshold, a constraint is imposed in the optimization model, as shown in the following equation. That is, the transformer DC bias current at any substation node must not exceed the prescribed threshold .
In summary, the optimization model established for the allocation of DC bias suppression devices is a multi-objective discrete optimization problem. In this model, the mitigation cost is represented by the number of installed DC bias suppression devices and is implemented by Equation (11). The security of the regional power grid is reflected by Equations (12) and (13), which are used to minimize the total absolute DC bias current over the whole network and to constrain the DC bias current at each substation node to remain below the specified threshold. Therefore, the elitist Non-dominated Sorting Genetic Algorithm II (NSGA-II) is adopted as the solution method.
In the implementation of NSGA-II, each individual is represented by the decision vector X, in which each gene corresponds to the mitigation mode of one substation node in the regional power grid. For each device allocation scheme generated by the algorithm, the corresponding DC bias currents are calculated using the indirect-coupling-based calculation model, and the objective function values are then evaluated. Solutions that do not satisfy the constraints are penalized, whereas feasible solutions are iteratively updated through fast non-dominated sorting, crowding-distance calculation, selection, crossover, mutation, and elitist retention. When the maximum number of generations is reached, the final allocation scheme can be selected from the obtained Pareto solution set.
4.3. Dynamic Iterative Mitigation Strategy for Time-Varying Characteristics
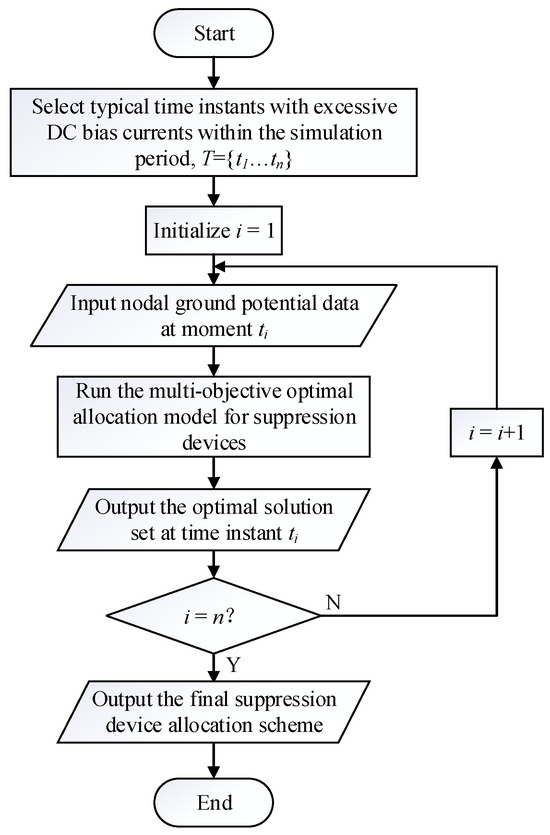
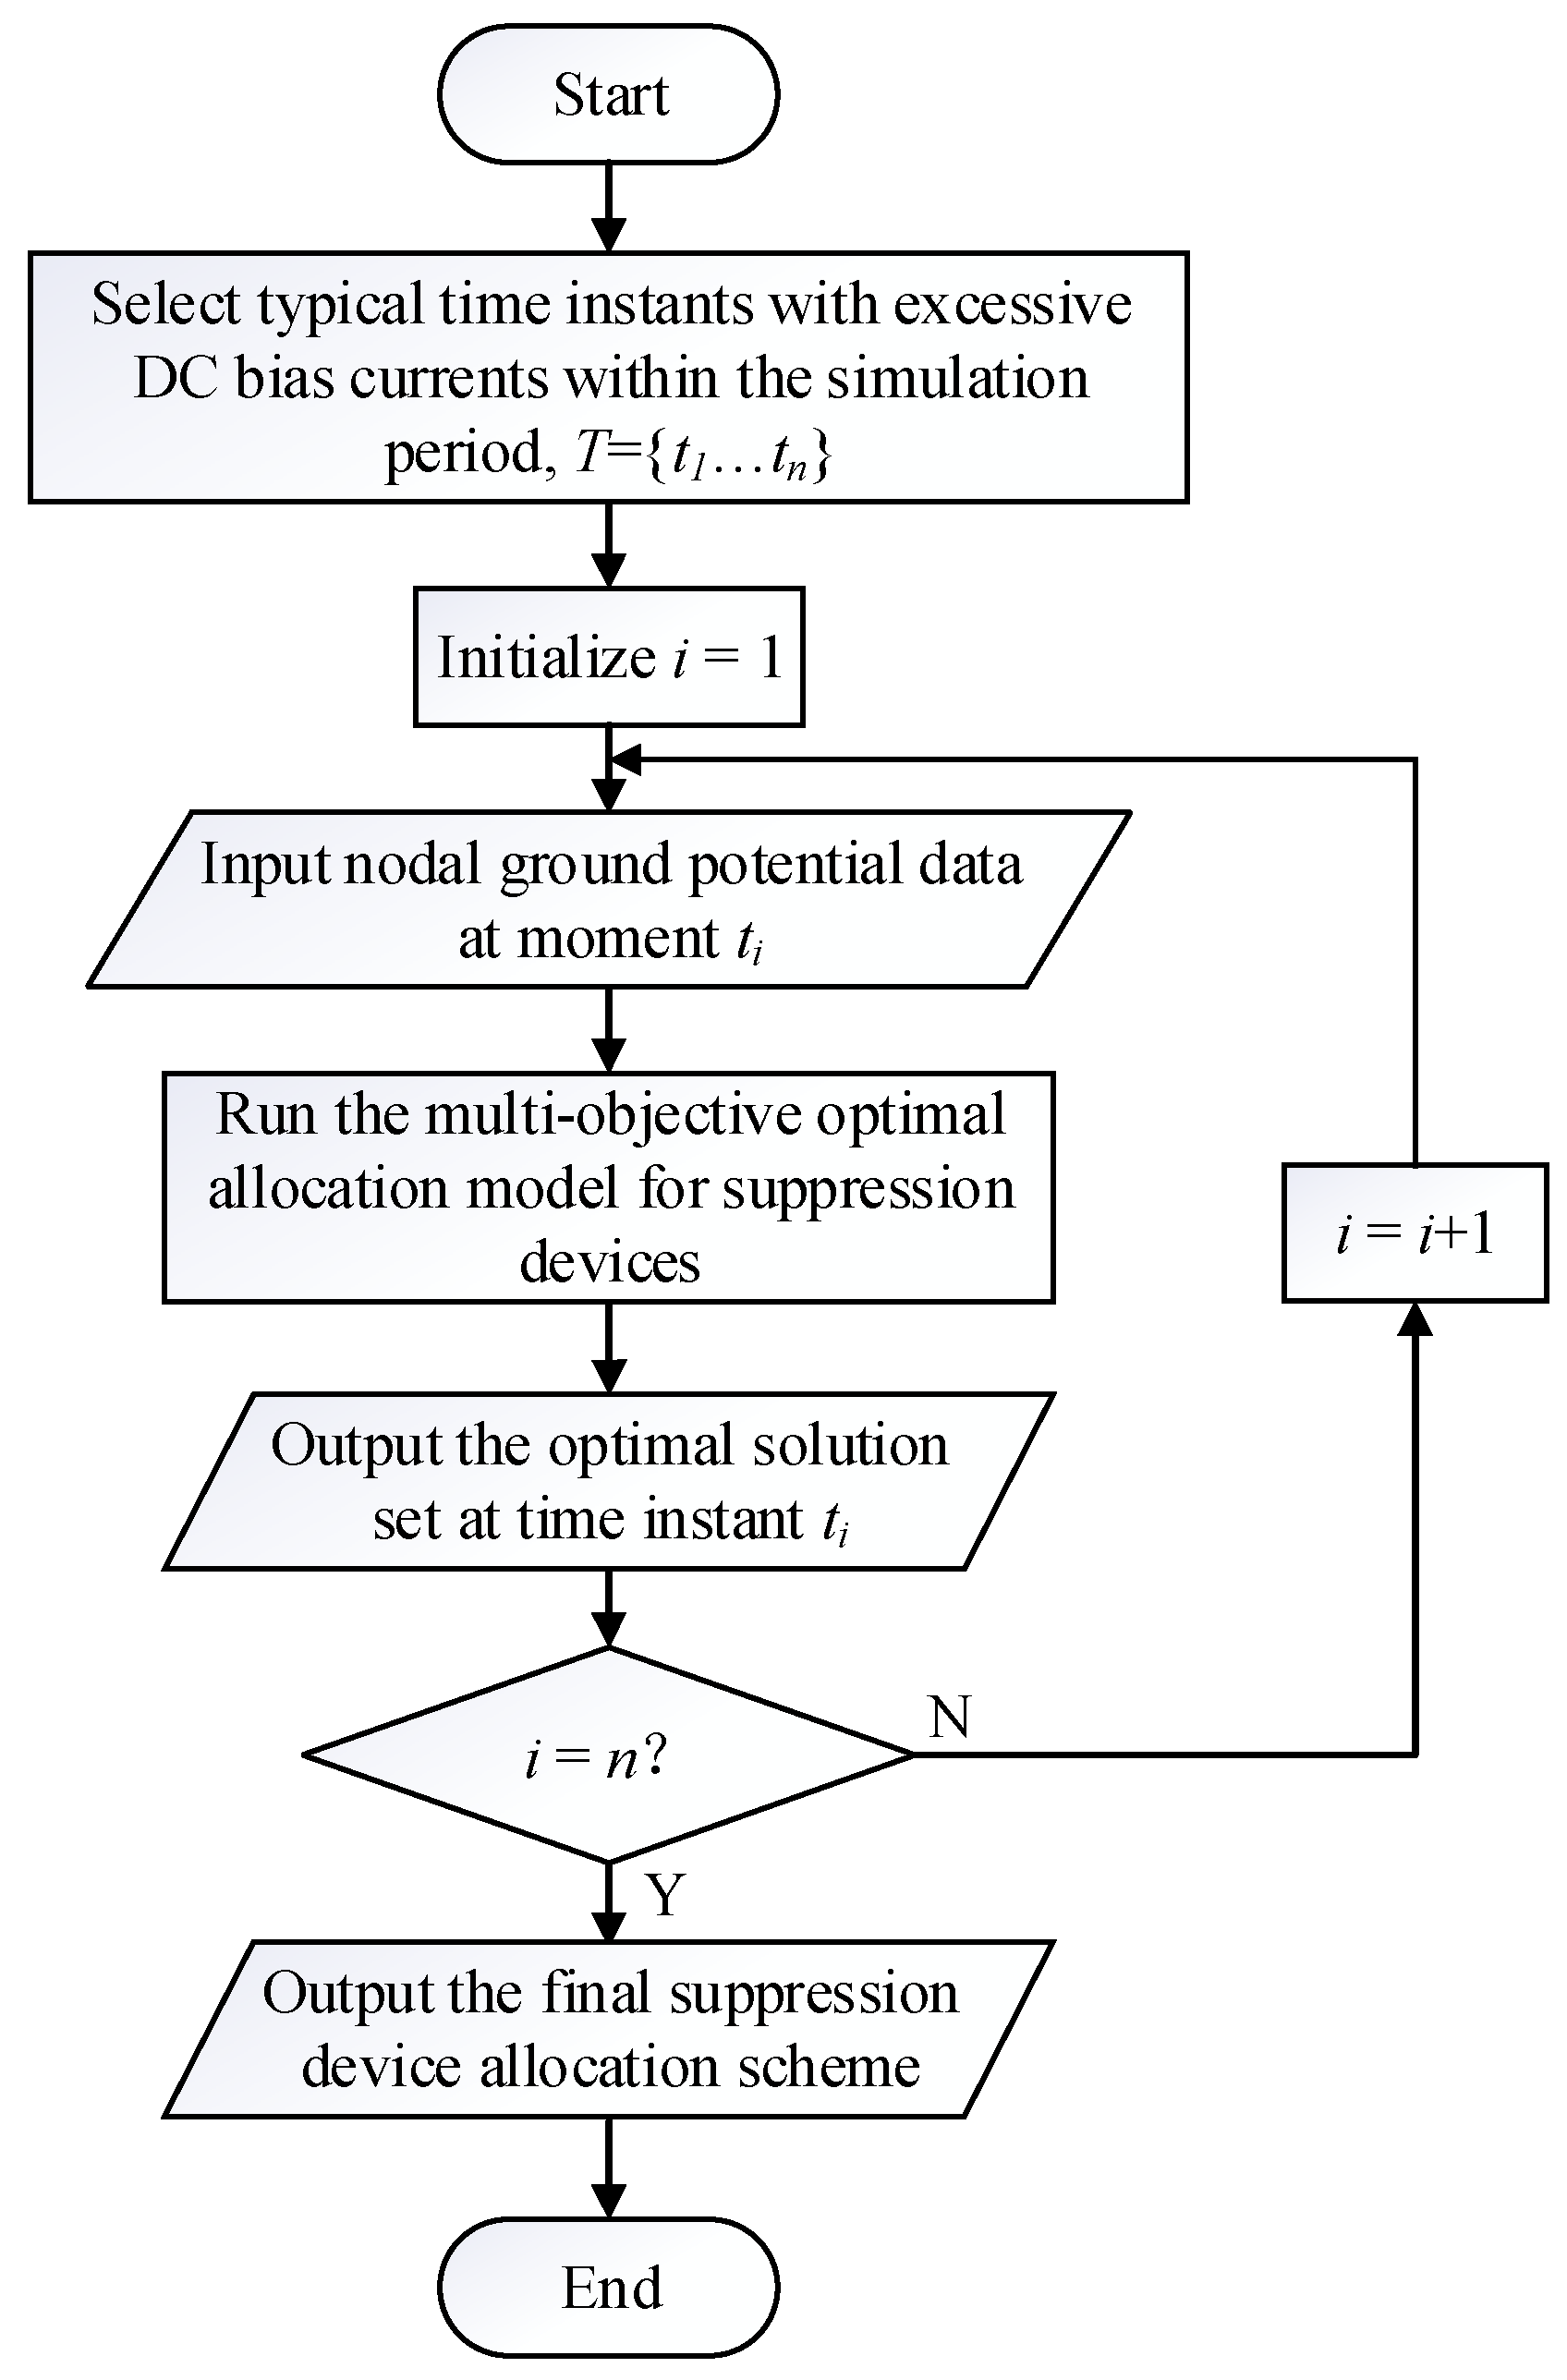
Because metro stray currents exhibit pronounced time-varying characteristics, the instants at which DC bias currents exceed the prescribed threshold are not synchronized among different substations. As a result, a static optimal allocation scheme of suppression devices obtained for a single time instant is often unable to cover all risk substations over an entire train operating cycle. For example, some substations whose DC bias currents remain within the safety threshold at 4630 s may still exceed the threshold at other time instants within the simulation period. Therefore, this section proposes a dynamic iterative mitigation strategy for time-varying DC bias currents. The optimization procedure for suppression device allocation with the dynamic iterative strategy is shown in Figure 12.
Figure 12.
Flowchart of the dynamic iterative mitigation strategy.
The core of this strategy lies in mitigation-scheme inheritance and incremental device deployment. First, all typical critical time instants at which the current exceeds the threshold within the simulation period are extracted in chronological order to form the set T = {t1, …, tn}. Taking the critical instants at which transformer DC bias currents exceed the threshold as triggering conditions, the initial optimal scheme at t1 is obtained using the optimization-based suppression device allocation model described above. When the process advances to t2, the algorithm inherits the allocation scheme at t1 as the initial condition and evaluates the current DC bias level in the regional power grid. Only when the inherited scheme fails to satisfy the mitigation requirement at t2 are additional suppression devices deployed on top of the existing configuration. This iterative process then proceeds in chronological order until all threshold-exceeding instants have been covered.
5. Results and Discussion
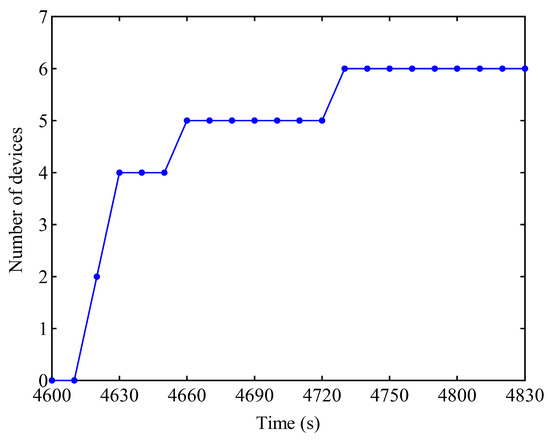
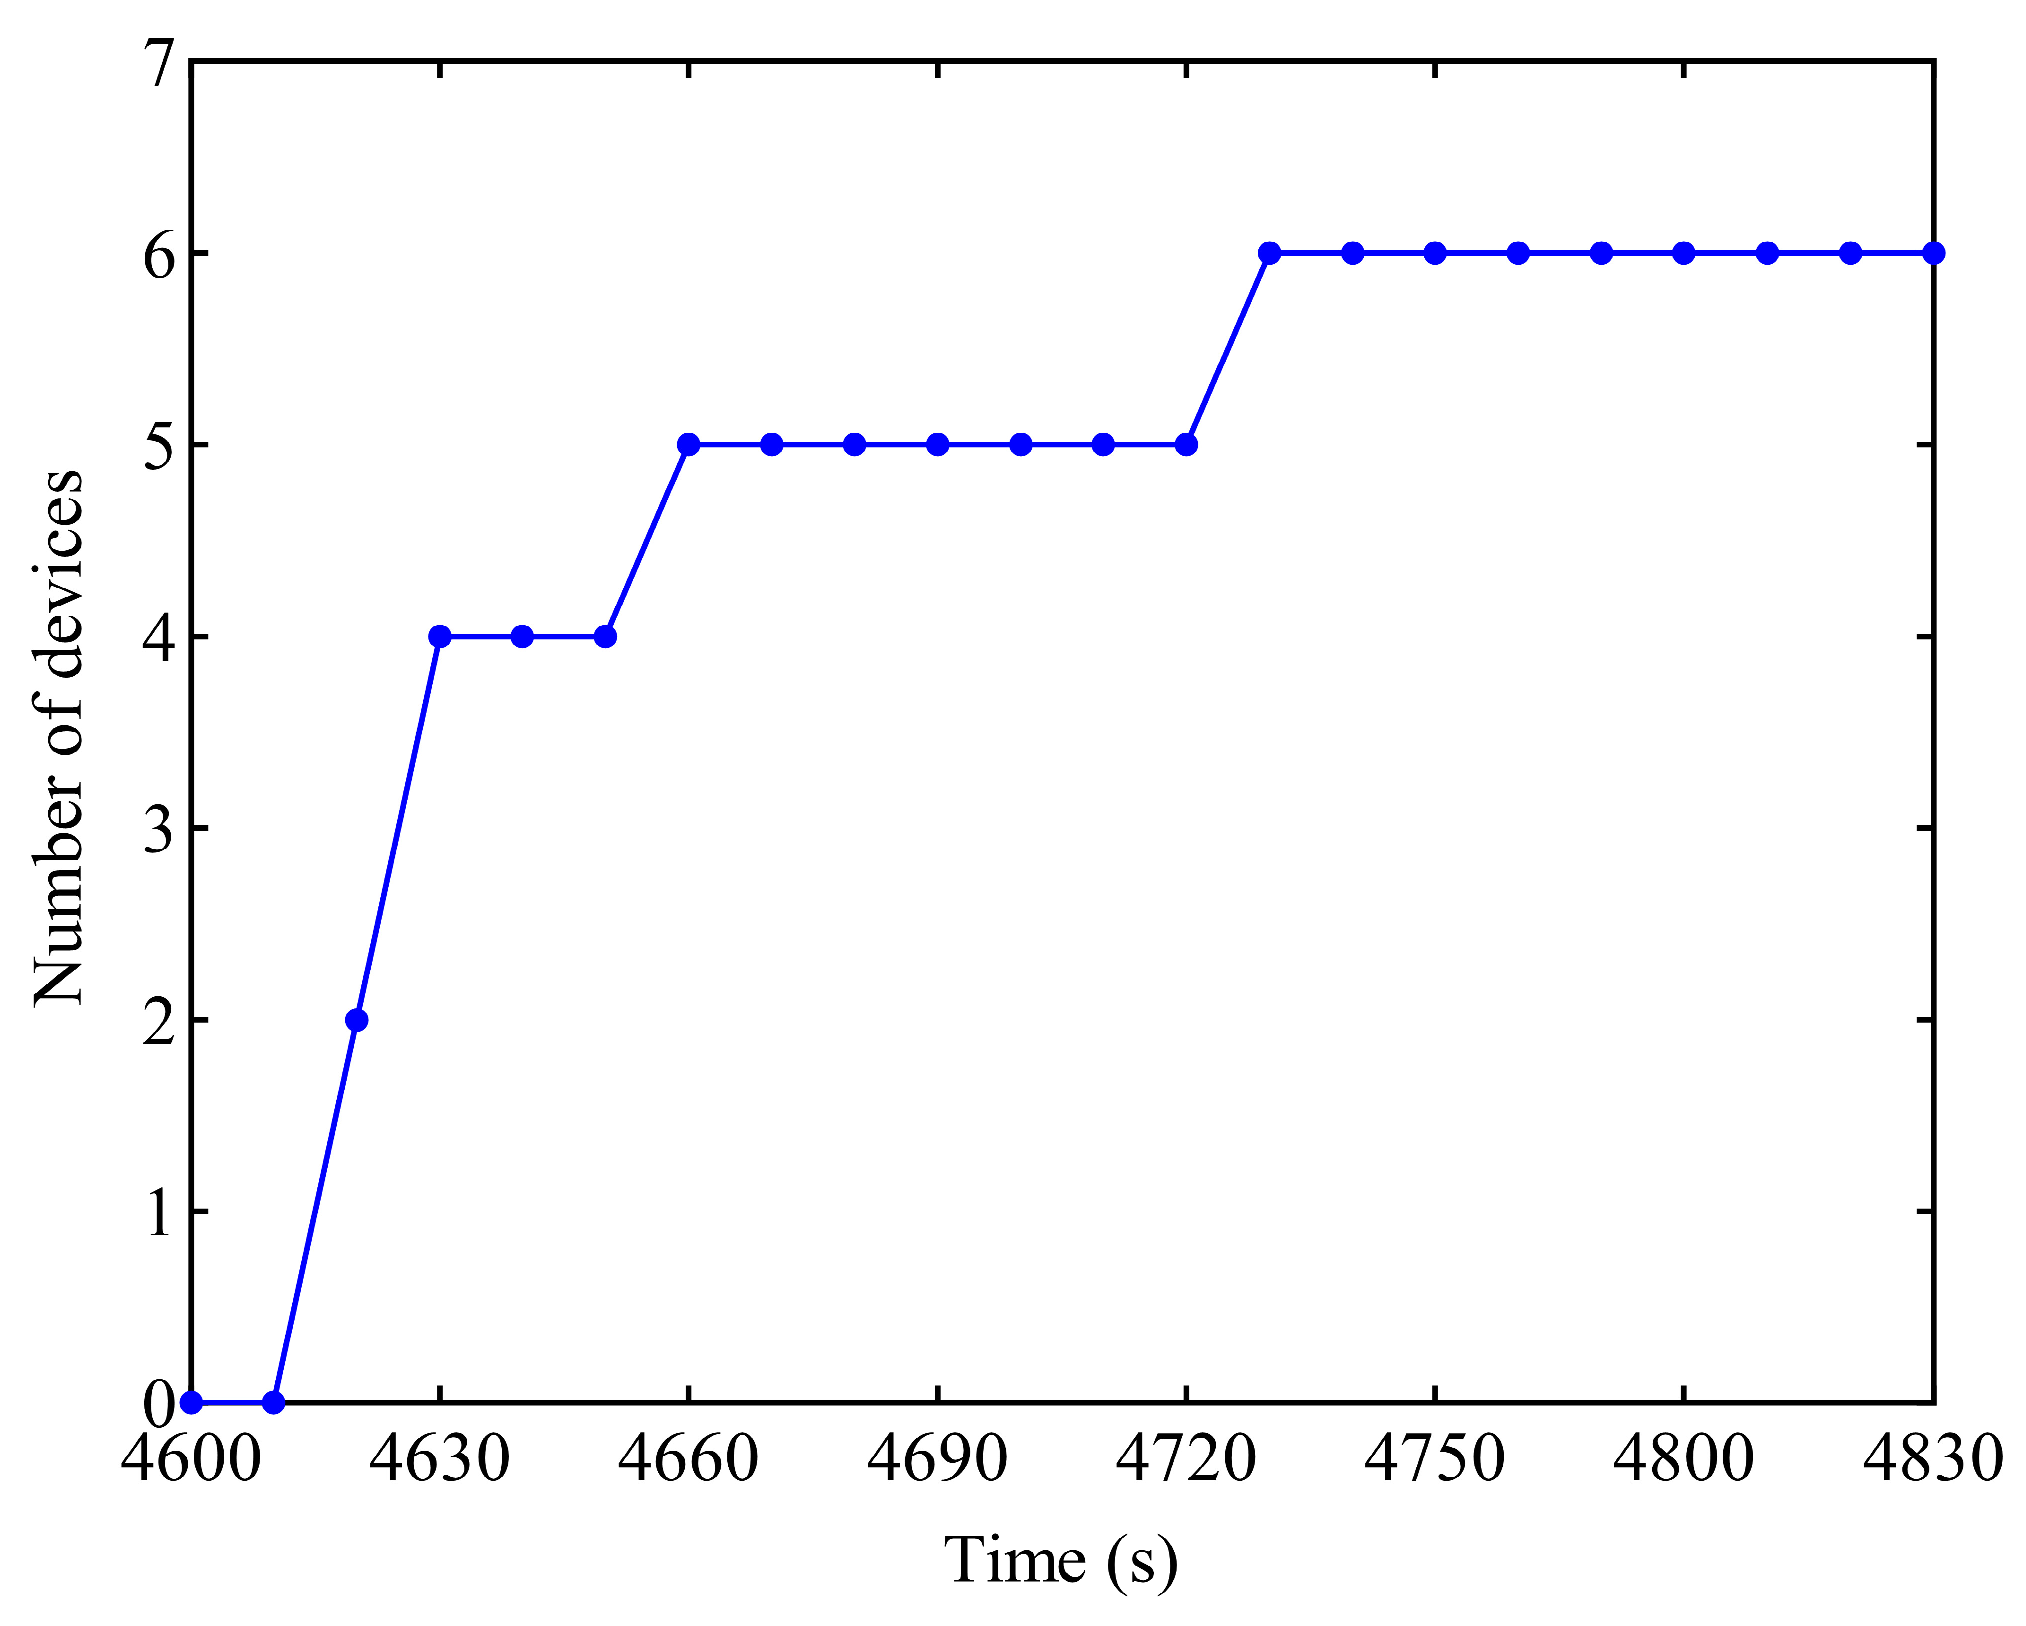
Based on the above calculation and assessment of dynamic DC bias currents in the regional power grid, 10 typical time instants at which threshold exceedance occurs at substations during the simulation period are identified. The dynamic iterative mitigation strategy proposed in this study is then applied to optimize the allocation of suppression devices over the entire simulation period. The initial population size is set to 150, the maximum number of iterations for the optimization process at each time instant is 100, the crossover rate is 0.8, and the mutation rate is 0.2. These parameters are determined based on preliminary trial calculations. Under these settings, the optimization results can remain stable, while the algorithm maintains good search capability and population diversity. To illustrate the search trajectory of the dynamic iterative mitigation strategy and its adaptability to time-varying operating conditions, Figure 13 presents the time evolution of the cumulative number of suppression devices allocated over the entire network during the simulation period. The threshold-exceeding conditions of transformer DC bias currents at substations in the regional power grid at typical time instants, as well as the corresponding sums of absolute DC bias currents under the mitigation scheme, are listed in Table 6.
Figure 13.
Dynamic iterative process of DC bias suppression device allocation.
Table 6.
Typical threshold-exceeding time instants and corresponding sums of absolute DC bias currents.
As shown in Figure 13, the dynamic iterative process demonstrates the effectiveness of the proposed mitigation strategy. At the initial instant of 4600 s, no transformer in the regional power grid has a DC bias current exceeding the prescribed threshold, and therefore no suppression device is allocated. At 4620 s, threshold exceedance occurs at two substations, and an optimization scheme with two suppression devices is obtained, reducing the sum of the absolute values of transformer DC bias currents over the entire network to 199 A while keeping the current at each substation below the prescribed threshold. As train operating conditions change, new threshold exceedance occurs at 4630 s, and the algorithm adds two more suppression devices on the basis of the scheme inherited from the previous time instant, further reducing the sum of the absolute values of DC bias currents over the network to 170 A. After subsequent time-step iterations, the total number of suppression devices configured across the network reaches six by 4730 s, which is sufficient to meet the mitigation requirements of the regional power grid. Thereafter, although threshold-exceeding conditions still occur at some subsequent time instants, the allocation scheme inherited from the previous time instant already satisfies the mitigation requirements, and no further device deployment is needed. These results show that the proposed dynamic iterative mitigation strategy can meet the mitigation requirements while effectively avoiding unnecessary device installation and redundant allocation.
The final optimal allocation scheme of suppression devices for the entire regional power grid is listed in Table 7, which is selected from the obtained Pareto solution set by comprehensively balancing and .
Table 7.
Final optimal allocation scheme of suppression devices.
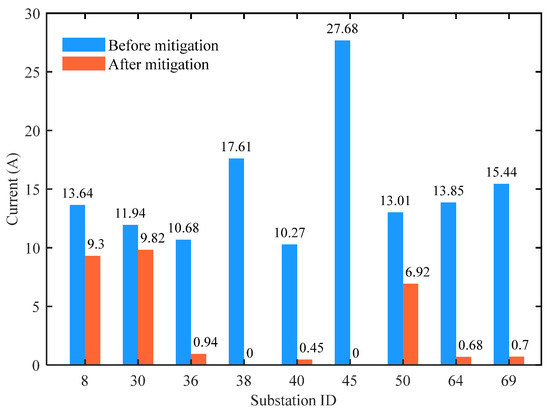
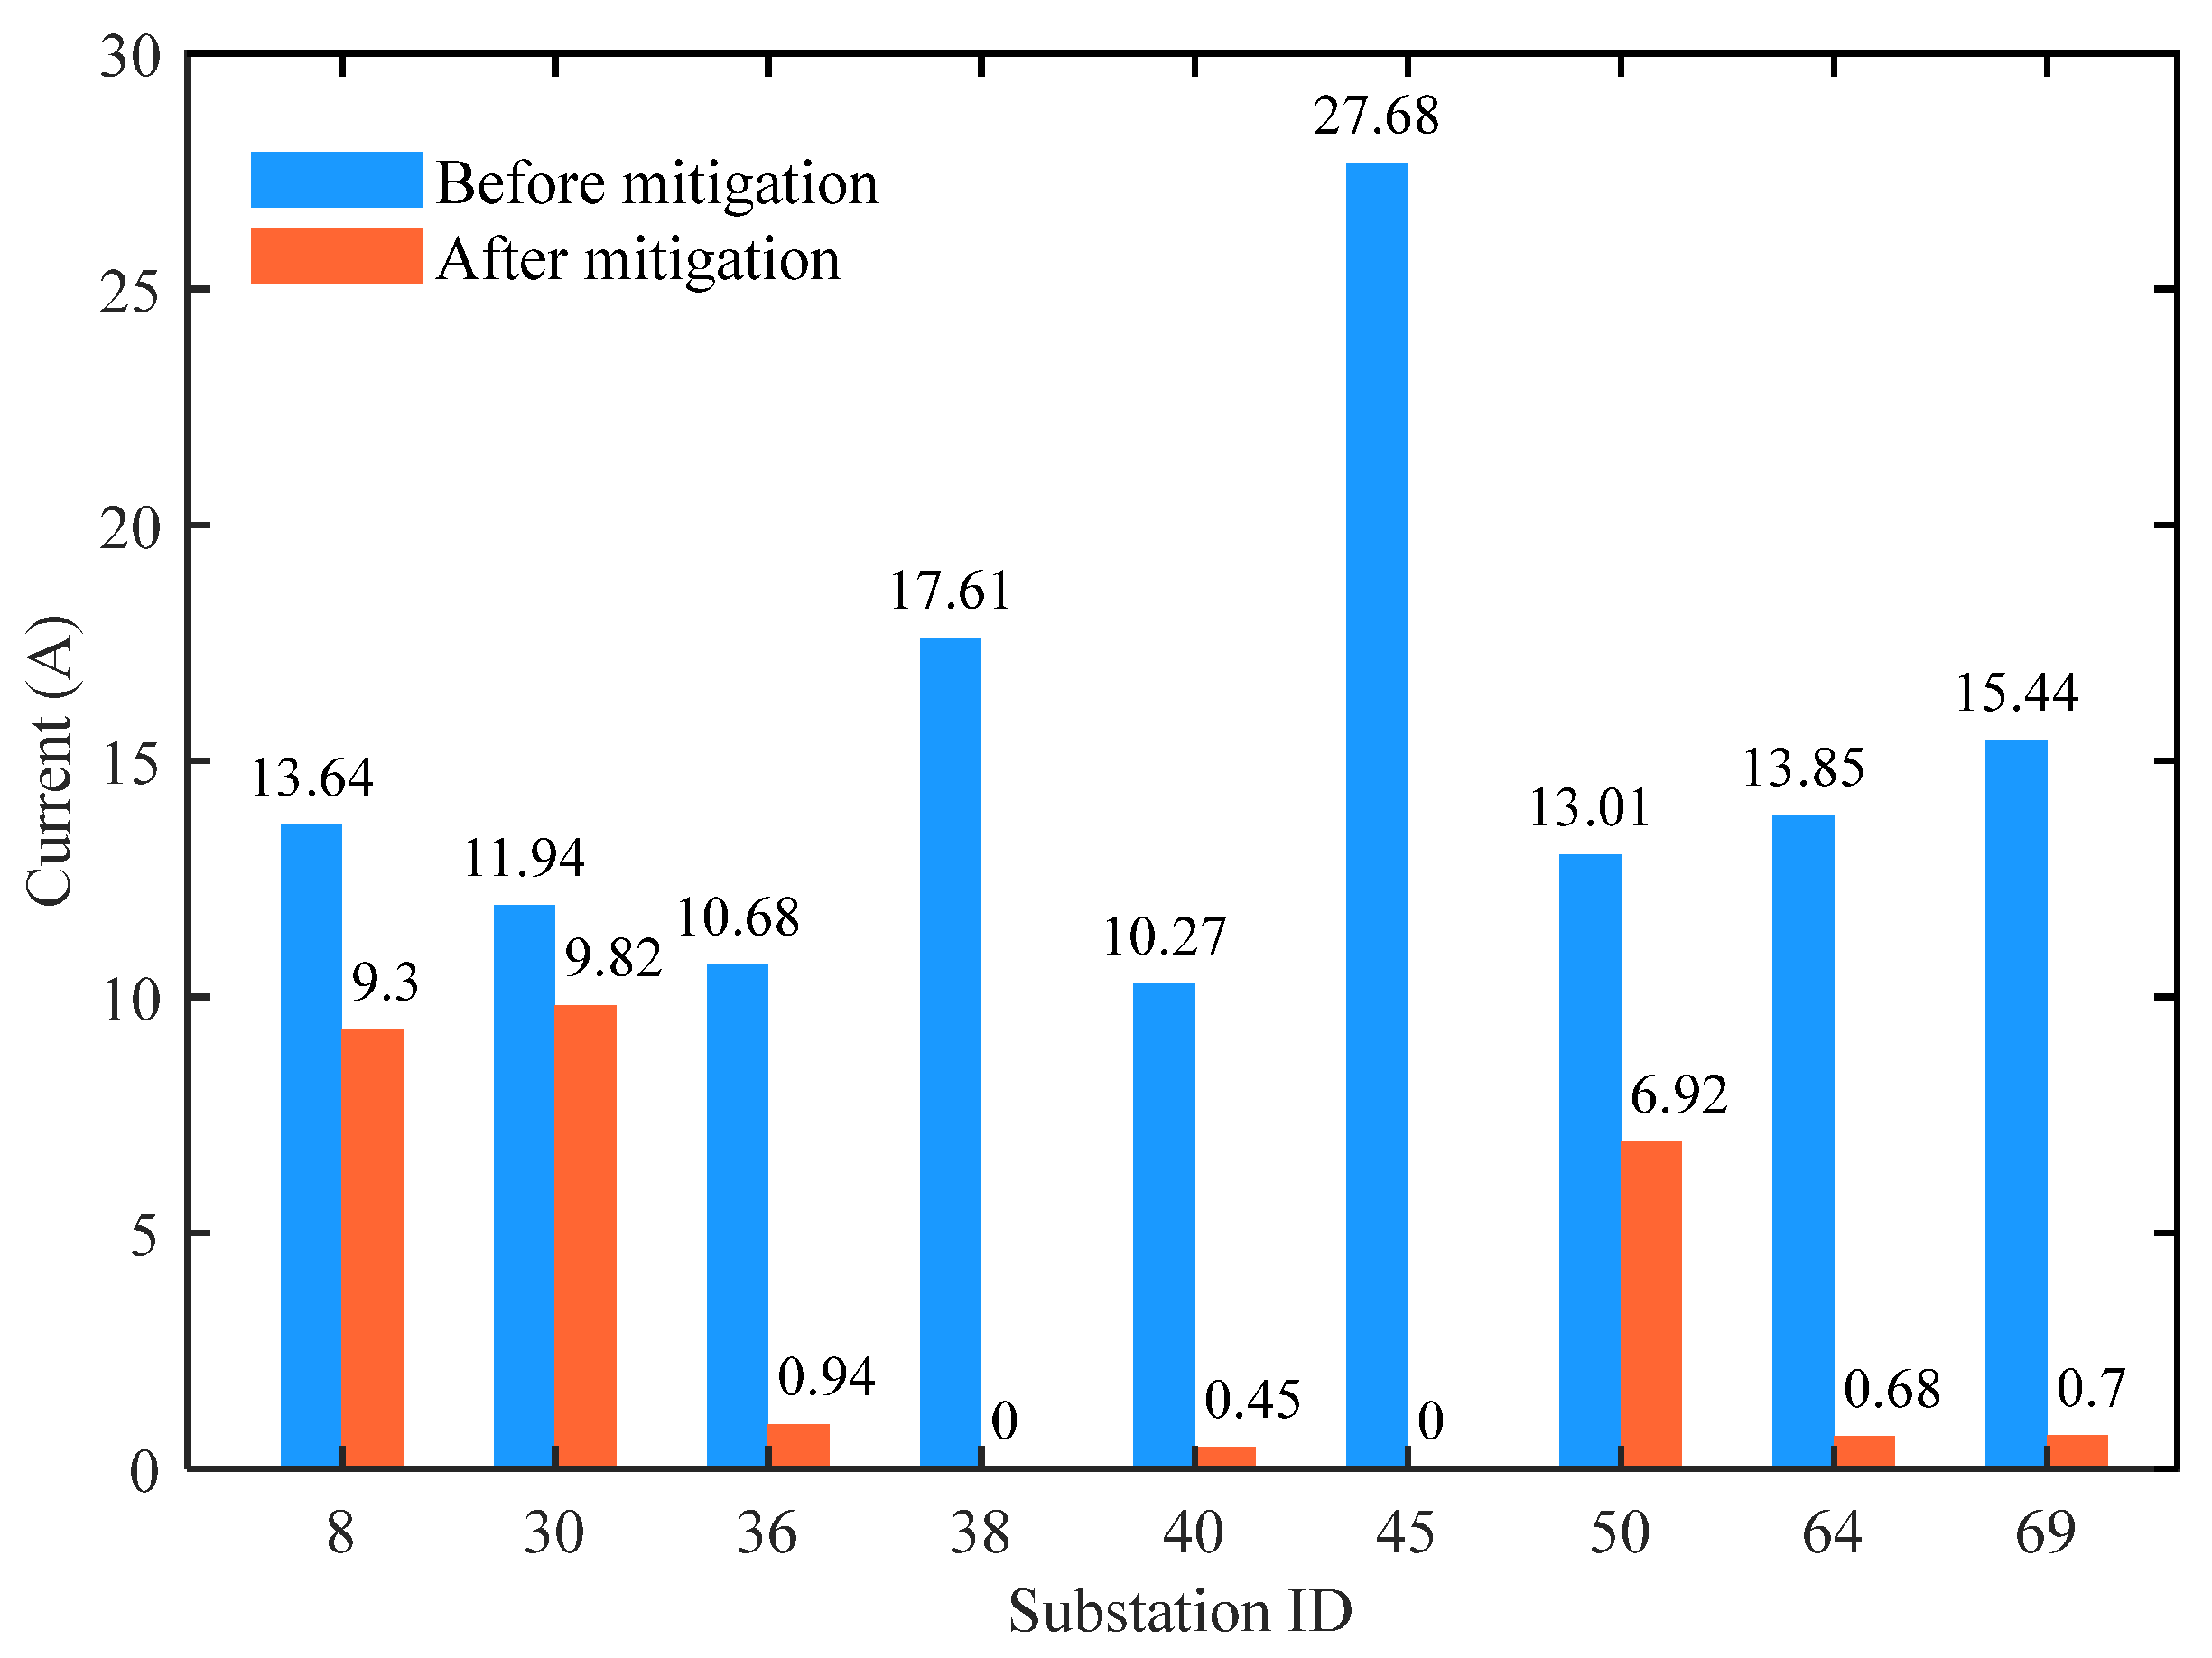
There is a trade-off between the two objective functions. Reducing the number of suppression devices can decrease , but it may increase and lead to cases where some substations fail to satisfy the constraints, namely, the transformer DC bias currents at these substations exceed the specified threshold. Therefore, the final allocation scheme shown in Table 7 is selected in this study, which keeps a relatively small number of suppression devices while satisfying the mitigation requirements. The comparison of the absolute peak values of transformer DC bias currents before and after mitigation is shown in Figure 14.
Figure 14.
Comparison of absolute peak DC bias currents before and after mitigation under the dynamic allocation scheme.
The differentiated allocation shown in Table 7 is obtained from the Pareto-based system-level optimization. In the final allocation scheme, capacitive DC-blocking devices are allocated to Substations 38 and 45, reducing their DC bias currents to nearly 0 A. During the Pareto optimization process, different combinations of suppression devices change the redistribution of DC in the regional power grid, thereby further affecting the total absolute DC bias current over the whole network, F2, and the satisfaction of the current-limit constraints at different substations. Therefore, capacitive DC-blocking devices are finally allocated to Substations 38 and 45 because this configuration is more effective in reducing the total absolute DC bias current over the whole network while satisfying the current-limit constraints. For Substations 36, 40, 64, and 69, resistive current-limiting devices are retained in the selected Pareto solution because they are sufficient to keep the corresponding DC bias currents below the specified threshold while causing smaller changes in the equivalent parameters of the neutral grounding branches.
In addition, by considering the electrical connections among substations in the regional power grid, the algorithm can perform system-level calculation and optimization of the DC network topology. Therefore, even for the remaining substations without suppression devices, their DC bias currents can satisfy the mitigation requirements through the redistribution of DC over the whole network.
The number of suppression devices required by different mitigation strategies depends on their corresponding allocation rules or optimization results. Since transformer DC bias currents exceed the specified threshold at nine substations in the regional power grid, the conventional mitigation strategy requires nine suppression devices. However, this strategy does not consider the coupling relationships among substations, which may lead to redundant device allocation and makes it difficult to effectively adapt to the redistribution of DC in the regional power grid. By contrast, the proposed dynamic iterative mitigation model is formulated from a system-wide optimization perspective and comprehensively considers the threshold exceedance of transformer DC bias currents at different time instants, thereby determining the final six-device allocation scheme. Therefore, the proposed method reduces redundant device allocation and improves the mitigation effect under time-varying operating conditions.
These results indicate that the proposed model is suitable for multi-source and time-varying DC bias mitigation problems. For larger regional power grids, the computational burden of the model increases with the dimension of the decision vector and the number of coupled operating conditions. In practical applications, candidate substations can be screened according to the calculated DC bias current levels, and the allocation schemes inherited from adjacent time instants can be used to reduce repeated optimization, thereby improving computational efficiency.
6. Conclusions
This study systematically investigates the dynamic influence of stray currents from multiple metro lines on the regional power grid. Conventional single-line models show limited accuracy under complex operating conditions. To address this problem, a coupling model of multiple metro lines and the regional power grid is established based on the superposition principle. The model is preliminarily validated by comparing selected field measurement data with simulated results. It is then applied to assess transformer DC bias currents in the regional power grid.
On this basis, taking the Hangzhou regional power grid as a case study, a dynamic iterative mitigation model for time-varying transformer DC bias currents is proposed. The model balances mitigation effectiveness and device allocation cost through a multi-objective allocation framework and effectively mitigates the dynamic DC bias current caused by metro stray currents by introducing an iterative mechanism based on critical time instants. The results show that the proposed model satisfies the DC bias mitigation requirements of all substations in the network. Compared with the conventional local “install-on-threshold-exceedance” scheme, it reduces the number of suppression devices by approximately one third. In this case study, this system-wide mitigation scheme was shown to reduce the transfer of DC bias risk to neighboring substations, reduce redundant and repeated device allocation, and improve the efficiency of the mitigation planning process.
Supplementary Materials
The following supporting information can be downloaded at: https://www.mdpi.com/article/10.3390/en19133016/s1.
Author Contributions
Conceptualization, H.Z., J.L. and G.Z.; methodology, H.Z. and G.Z.; software, H.Z. and J.C.; validation, H.Z., G.Z., J.L. and B.Y.; investigation, H.Z. and G.Z.; resources, J.L. and B.Y.; data curation, H.Z. and J.C.; writing—original draft preparation, H.Z.; writing—review and editing, H.Z. and G.Z.; visualization, H.Z.; supervision, G.Z., J.L. and B.Y.; project administration, J.L. and B.Y.; funding acquisition, G.Z., J.L. and B.Y. All authors have read and agreed to the published version of the manuscript.
Funding
This research was funded by the National Natural Science Foundation of China (No. 52377017) and the Science and Technology Project of State Grid Zhejiang Electric Power Co., Ltd. (No. 5211DS25000K).
Data Availability Statement
The data used in the analysis presented in this paper are not publicly available due to confidentiality requirements and restrictions from the data owner. Relevant data may be made available from the authors upon reasonable request and subject to approval by the data owner/Supplementary Materials.
Conflicts of Interest
The funder Science and Technology Project of State Grid Zhejiang Electric Power Co., Ltd. had a role in the collection, analyses or interpretation of data.
Nomenclature
| Longitudinal coordinate along the metro line (km) | |
| Potential between the rail and the stray current collection system under the i-th single-train current source (V) | |
| Potential between the stray current collection system and the structural reinforcement under the i-th single-train current source (V) | |
| Potential between the structural reinforcement and the earth under the i-th single-train current source (V) | |
| Longitudinal current in the rail under the i-th single-train current source (A) | |
| Longitudinal current in the stray current collection system under the i-th single-train current source (A) | |
| Longitudinal current in the structural reinforcement under the i-th single-train current source (A) | |
| Longitudinal resistance per unit length of the rail (Ω/km) | |
| Longitudinal resistance per unit length of the stray current collection system (Ω/km) | |
| Longitudinal resistance per unit length of the structural reinforcement (Ω/km) | |
| Longitudinal resistance per unit length of the eartht(Ω/km) | |
| Transition conductance per unit length between the rail and the stray current collection system (S/km) | |
| Transition conductance per unit length between the stray current collection system and the structural reinforcement (S/km) | |
| Transition conductance per unit length between the structural reinforcement and the earth (S/km) | |
| Equivalent train current at position x (A) | |
| Position of the i-th traction power substation along the line (km) | |
| Current supplied by the i-th traction power substation (A) | |
| Ns | Number of traction power substations along the line (–) |
| K | Total length of the metro line (km) |
| Position of the i-th train current source along the line (km) | |
| Current of the k-th single-train current source (A) | |
| Nt | Number of trains operating simultaneously along the line (–) |
| Potential between the rail and the stray current collection system under multi-train current-source conditions (V) | |
| Potential between the stray current collection system and the structural reinforcement under multi-train current-source conditions (V) | |
| Potential between the structural reinforcement and the earth under multi-train current-source conditions (V) | |
| Longitudinal current in the rail under multi-train current-source conditions (A) | |
| Longitudinal current in the stray current collection system under multi-train current-source conditions (A) | |
| Longitudinal current in the structural reinforcement under multi-train current-source conditions (A) | |
| Stray current under multi-train current-source conditions (A) | |
| Rail-to-earth potential under multi-train current-source conditions (V) | |
| Rail-to-earth transition resistance (Ω·km) | |
| Longitudinal resistance per unit length of a single longitudinal conductor (Ω/km) | |
| Longitudinal resistance per unit length of an equivalent longitudinal conductor (Ω/km) | |
| n | Number of longitudinal conductors in either the up or down line (–) |
| Radius of a single longitudinal conductor (m) | |
| Radius of the equivalent longitudinal conductor (m) | |
| L | Length of the conductor (m) |
| Longitude of the i-th point (degree) | |
| Latitude of the i-th point (degree) | |
| Reference longitude selected as the coordinate origin (degree) | |
| Reference latitude selected as the coordinate origin (degree) | |
| xᵢ | Converted Cartesian coordinate of the i-th point in the longitude direction in the coordinate transformation model (m) |
| yᵢ | Converted Cartesian coordinate of the i-th point in the latitude direction in the coordinate transformation model (m) |
| Distance conversion coefficient in the longitude direction (m/degree) | |
| Distance conversion coefficient in the latitude direction (m/degree) | |
| Rated current of the transformer (A) | |
| Rated capacity of the transformer (MVA) | |
| Rated voltage of the transformer (kV) | |
| Decision vector for suppression device allocation (–) | |
| Objective function representing the number of installed DC bias suppression devices (–) | |
| Objective function representing the sum of absolute transformer DC bias currents over the regional power grid (A) | |
| Sign function used to determine whether a suppression device is installed (–) | |
| Transformer DC bias current at the i-th substation node under the decision vector X (A) | |
| Specified threshold of transformer DC bias current (A) | |
| Number of substation nodes in the regional power grid (–) | |
| Abbreviations | |
| DC | Direct Current |
| AC | Alternating Current |
| TPS | Traction Power Substation |
| SCCS | Stray Current Collection System |
| HVDC | High-Voltage Direct Current |
| NSGA-II | Non-dominated Sorting Genetic Algorithm II |
References
- Ministry of Transport of the People’s Republic of China. National Urban Rail Transit Operating Mileage Exceeds 11,710 km. Available online: https://www.mot.gov.cn/xinwen/jiaotongyaowen/202601/t20260129_4199263.html (accessed on 15 June 2026).
- Wang, A.; Lin, S.; Wu, G.; Li, X. Mitigation strategy of neutral-point DC for transformer caused by metro stray currents. Electronics 2024, 13, 2467. [Google Scholar] [CrossRef] [Scilit]
- Guo, Y.; Du, Q.; Liu, Y.; Yang, F.; Chen, L.; Zhang, X.; Xiao, S.; Li, C.; Wu, G. Systematic protective scheme for mega-city power systems against stray currents caused by metro systems. High Volt. 2023, 8, 943–953. [Google Scholar] [CrossRef] [Scilit]
- Li, J.; He, Z.; Grzybowski, S. Electrical aging lifetime model of oil-impregnated paper under pulsating DC voltage influenced by temperature. IEEE Trans. Dielectr. Electr. Insul. 2013, 20, 1992–1997. [Google Scholar] [CrossRef] [Scilit]
- Liu, W.; Liu, F.; Pan, Z.; Yang, Z.; Niu, J. A unified model of DC traction power supply system and stray current dissipation. IEEE Trans. Reliab. 2025, 74, 4194–4206. [Google Scholar] [CrossRef] [Scilit]
- Liu, W.; Zhou, L.; Pan, Z.; Bhatti, A.A.; Huang, X.; Zhang, J. Dynamic diffusion model of stray current in DC traction power supply system. IEEE Trans. Power Deliv. 2023, 38, 2170–2182. [Google Scholar] [CrossRef] [Scilit]
- Charalambous, C.A.; Aylott, P. Dynamic stray current evaluations on cut-and-cover sections of DC metro systems. IEEE Trans. Veh. Technol. 2014, 63, 3530–3538. [Google Scholar] [CrossRef] [Scilit]
- Chuchit, T.; Kulworawanichpong, T. Stray current assessment for DC transit systems based on modelling of earthing and bonding. Electr. Eng. 2019, 101, 81–90. [Google Scholar] [CrossRef] [Scilit]
- Aatif, S.; Hu, H.; Rafiq, F.; He, Z. Analysis of rail potential and stray current in MVDC railway electrification system. Railw. Eng. Sci. 2021, 29, 394–407. [Google Scholar] [CrossRef] [Scilit]
- Xiao, N.; Liu, J.; Wu, J.; Zeng, H.; Tan, Z.; Zeng, P.; Niu, W.; Chen, P.; Huang, H.; Xu, K.; et al. Analysis on rail potential distribution characteristics considering OVPD in metro system. IEEE Access 2021, 9, 141295–141306. [Google Scholar] [CrossRef] [Scilit]
- Zhou, Q.; Lin, S.; Zhang, W. Analysis and mitigation of stray current in modern metro systems with OVPD and PSD. IEEE Trans. Transp. Electrif. 2024, 10, 3153–3166. [Google Scholar] [CrossRef] [Scilit]
- Du, G.; Xia, Y.; Li, Q.; Zhang, G.; Zheng, Z.; Guo, X.; Huang, W. Method for mitigating stray current in DC metro line with local high insulation. Electr. Eng. 2025, 107, 11199–11208. [Google Scholar] [CrossRef] [Scilit]
- Yang, G.; Ma, X.; Cao, Z. Modeling and dynamic analysis of uneven parameter metro stray current distribution. Electr. Eng. 2024, 106, 2021–2032. [Google Scholar] [CrossRef] [Scilit]
- Li, C.; Du, Q.; Guo, Y.; Liu, Y.; Yang, F.; Chen, L.; Zhang, X.; Huang, G.; Gao, G.; Wu, G. Modeling of stray currents from metro intruding into power system considering the complex geological conditions in modern megacities. IEEE Trans. Transp. Electrif. 2023, 9, 1653–1663. [Google Scholar] [CrossRef] [Scilit]
- Wang, A.; Lin, S.; Hu, Z.; Li, J.; Wang, F.; Wu, G.; He, Z. Evaluation model of DC current distribution in AC power systems caused by stray current of DC metro systems. IEEE Trans. Power Deliv. 2021, 36, 114–123. [Google Scholar] [CrossRef] [Scilit]
- Cao, Y.; Xiao, S.; Yan, J.; Liu, C.; Li, T.; Liu, X.; Wu, G.; Guo, Y.; Hou, J.; He, Y.; et al. Contribution analysis of neutral current for the substations invaded by stray current from multiple metro lines. Int. J. Electr. Power Energy Syst. 2025, 169, 110773. [Google Scholar] [CrossRef] [Scilit]
- Wu, W.; Chen, W.; Li, L. Calculation and analysis of DC magnetic bias current of urban main transformer under the action of stray current. Mob. Inf. Syst. 2021, 2021, 4806136. [Google Scholar] [CrossRef] [Scilit]
- Yang, M.; Deswal, D.; de León, F. Mitigation of half-cycle saturation of adjacent transformers during HVDC monopolar operation—Part I: Mitigation principle and device design. IEEE Trans. Power Deliv. 2019, 34, 2232–2239. [Google Scholar] [CrossRef] [Scilit]
- Wang, D.; Liu, C. Combination optimization configuration method of capacitance and resistance devices for suppressing DC bias in transformers. Energies 2019, 12, 1813. [Google Scholar] [CrossRef] [Scilit]
- Rezaei-Zare, A.; Etemadi, A.H. Optimal placement of GIC blocking devices considering equipment thermal limits and power system operation constraints. IEEE Trans. Power Deliv. 2018, 33, 200–208. [Google Scholar] [CrossRef] [Scilit]
- Ma, Y.; Lin, S.; Zou, Q.; Li, Y.; Zhou, Q. An identification method for ground potential of grounding grid in urban substations considering metro stray current. IEEE Trans. Instrum. Meas. 2024, 73, 3532512. [Google Scholar] [CrossRef] [Scilit]
- Yang, X.; Wang, M.; Zheng, T.Q.; Sun, X. Modelling and simulation of stray current in urban rail transit—A review. Urban Rail Transit 2024, 10, 189–199. [Google Scholar] [CrossRef] [Scilit]
- Wei, R.; Liu, J.; Gao, H.; Chen, T.; Yan, Q.; Kong, W. Study on the Effect of the Metal Path on the Distribution of Metro Stray Currents in the Power Grid. J. Electr. Eng. 2023, 18, 90–98. [Google Scholar] [CrossRef]
- Ni, Y.; Yu, K.; Zeng, X.; Leng, Y.; Peng, P.; Zhou, W.; Xie, Y. A correlation analysis on transformer DC bias current caused by metro stray current. J. Electr. Power Sci. Technol. 2021, 36, 136–143. [Google Scholar] [CrossRef]
- DL/T 437-2012; Technical Guide of HVDC Earth Electrode System. China Electric Power Press: Beijing, China, 2012. (In Chinese)
- Zou, G.; Yao, H.; He, W.; Sun, X.; Wu, Z.; Wang, W. DC Bias Suppression of Receiving-end Power Grid in ±800 kV Xiluodu-Zhexi UHVDC Project. High Volt. Eng. 2016, 42, 543–550. [Google Scholar] [CrossRef]

Disclaimer/Publisher’s Note: The statements, opinions and data contained in all publications are solely those of the individual author(s) and contributor(s) and not of MDPI and/or the editor(s). MDPI and/or the editor(s) disclaim responsibility for any injury to people or property resulting from any ideas, methods, instructions or products referred to in the content. |
© 2026 by the authors. Licensee MDPI, Basel, Switzerland. This article is an open access article distributed under the terms and conditions of the Creative Commons Attribution (CC BY) license.