


Abstract
The aviation sector is under pressure to reduce greenhouse gas emissions. Proton exchange membrane fuel cell (PEMFC) systems are considered a promising option for sustainable aviation because of their high efficiency and suitability for electric propulsion. However, their performance deteriorates at high altitudes because reduced ambient pressure lowers the oxygen partial pressure at the cathode. This study investigated aviation PEMFC systems employing different air compression strategies under aircraft operating conditions. Three air supply configurations were examined: no compressor, a single-stage compressor, and a double-stage compressor. Among these, the double-stage configuration most effectively improved the reactant supply and stack output at high altitudes. Although the double-stage configuration increased compressor parasitic power consumption and required additional heat rejection through intercooling, its higher gross stack output compensated for these penalties and produced the highest net output. Achieving the same output with the no-compressor or single-stage compressor configuration would require additional cells and a larger stack. The system-specific power analysis showed that the double-stage configuration provided the most favorable mass-based performance. These results suggest that a double-stage-compressor configuration can be an effective air supply strategy for aviation PEMFC systems under high-altitude conditions.
1. Introduction
In 2022, the International Civil Aviation Organization (ICAO) adopted the Long-Term Aspirational Goal (LTAG), which aims to achieve net-zero carbon emissions from international aviation by 2050 [1]. Unlike approaches based primarily on carbon offsetting, the LTAG emphasizes the need for direct emission reductions within the aviation sector and calls on member states to establish and implement national action plans within a defined timeframe [1].
Hydrogen-based propulsion is considered a promising route for reducing aviation emissions [2,3]. Among the available hydrogen technologies, proton exchange membrane fuel cells (PEMFCs) are of particular interest for aircraft applications because of their high efficiency, relatively low operating temperature, and fast dynamic response [4]. Since PEMFC systems produce electricity directly and can be integrated with electric propulsion architectures, they are also suitable for future hydrogen–electric aircraft platforms [2,4].
In recent years, research on PEMFC systems has expanded significantly, and increasingly sophisticated modeling techniques have been developed to capture their dynamic behavior. For instance, Liu et al. [5] introduced a multitask learning framework using LSTM with temporal pattern attention to enhance the dynamic modeling accuracy of automotive PEMFCs. Additionally, Dong et al. [6] proposed an improved data-driven approach for PEMFC degradation prediction and remaining useful life estimation based on an improved gated recurrent unit network and a voltage integral indicator. These recent studies show that PEMFC research has been progressing in various directions, including system modeling, performance prediction, and condition assessment.
However, aviation PEMFC systems face additional challenges associated with flight environments, including reduced ambient pressure, low temperature, oxygen supply limitations, and increased air compression requirements at high altitudes. The application of PEMFC systems in aviation remains particularly technically challenging because their performance is strongly affected by the partial pressures of the reactant gases [7]. In PEMFC systems, hydrogen is supplied from a high-pressure storage tank through pressure regulation, whereas air must be compressed to increase the oxygen partial pressure at the cathode. As altitude increases, the ambient pressure decreases, which lowers the absolute inlet pressure of the compressor. As a result, even when the same compressor system is used, the oxygen partial pressure supplied to the fuel cell is reduced, leading to slower reaction kinetics and difficulties in maintaining the required air flow rate [8,9]. This ultimately results in a decline in the output performance of the PEMFC system.
Nevertheless, recent industrial efforts further demonstrate the practical potential of hydrogen fuel cell propulsion. In 2023, ZeroAvia demonstrated the applicability of hydrogen–electric propulsion by flying a Dornier 228 (Dornier GmbH, Oberpfaffenhofen, Germany) equipped with a hydrogen fuel cell–electric powertrain in place of the left-wing engine, completing a total of 12 successful test flights [10]. In addition, Joby Aviation, through its subsidiary H2FLY, completed the world’s first piloted flight of a liquid-hydrogen-powered electric aircraft in 2023 [11]. Airbus has also proposed a 1.2 MW-class hydrogen propulsion system and completed end-to-end testing of major components, including the fuel cell stack, electric motor, and heat exchanger, with an integrated ground test planned for 2027 [12]. These cases indicate that hydrogen fuel cell propulsion is moving from conceptual studies toward practical aviation demonstrations.
Previous studies have shown that maintaining PEMFC performance at high altitudes requires more than simply increasing airflow. Hordé et al. [13] demonstrated that the reduction in ambient pressure with altitude lowers cell output, although part of this loss can be offset by increasing the air stoichiometric ratio. This approach, however, has its own drawbacks. Excess air can dry the membrane by removing water from the MEA, and the higher airflow demand also increases compressor power consumption. Zhang et al. [14] proposed a more balanced approach for aviation fuel cells by maintaining high cathode pressure while avoiding excessively high cathode stoichiometry. In their analysis, higher cathode pressure improved gas transport through the diffusion layer, whereas lower stoichiometry helped to alleviate membrane dehydration. This comparison suggests that pressurization, rather than simply increasing airflow, is a more effective strategy for high-altitude PEMFC air supply design.
Campanari et al. [7] improved electrical efficiency by applying a turbocharger to the air supply system of a PEMFC system for an aircraft auxiliary power unit and derived an optimal operating pressure range of 0.8 to 2.5 bar. Schröter et al. [8] investigated the effect of low ambient pressure at an altitude of 3000 m using a 64 kW fuel cell stack. The researchers reported that pressure losses and reduced ambient pressure significantly influence the compressor performance of the air supply system in aviation PEMFCs, resulting in an approximately 20% reduction in the maximum system output. However, as altitude further increases, ambient pressure continues to decrease, and the required pressure ratio correspondingly becomes higher. High-pressure-ratio operation increases compressor power consumption and outlet temperature, which may lead to reduced efficiency and degraded durability [7]. To overcome these limitations, double-stage compression has recently attracted increasing attention for high-altitude applications [15,16]. By dividing the compression process into two stages, the load on each stage can be reduced, thereby improving operating stability and lowering the surge risk [15]. However, previous studies on double-stage compressors have mainly focused on automotive fuel cell systems or relatively low-altitude conditions, at around 2000 m [15,17,18]. For the practical application of PEMFC air supply systems in aircraft, their applicability must be verified at higher altitudes, where the ambient pressure is further reduced and the required compressor pressure ratio becomes significantly higher.
This study compared the output characteristics of a PEMFC system under different air compressor configurations at the selected aircraft operating altitude. In particular, the influence of single-stage and double-stage-compressor configurations on stack performance and net system output under altitude conditions has not been sufficiently investigated. Accordingly, this study focused on the effect of compressor configuration on the performance of an aviation PEMFC air supply system. The Dornier 228, which has been used by ZeroAvia (Everett, WA, USA) as a test aircraft, was selected as the reference aircraft in this study. As a twin-turboprop aircraft, the Dornier 228 demonstrated the feasibility of hydrogen–electric propulsion through the replacement of one conventional engine with the ZA600 hydrogen fuel cell powertrain [19]. The ZA600 is a 600 kW-class hydrogen–electric propulsion system designed to meet EASA CS-E certification requirements and serves as a representative example of aviation fuel cell propulsion systems currently under development. Therefore, this aircraft–powertrain combination provides an appropriate platform for evaluating the operating conditions and air supply system performance of aviation hydrogen fuel cell systems. Its practical service ceiling of 25,000 ft was adopted as the reference operating altitude. Based on these conditions, the output characteristics of the PEMFC system were analyzed for three air supply configurations—no-compressor, single-stage compressor, and double-stage compressor—at an altitude of 25,000 ft. In addition, the effects of net power variation on the required stack size and system-specific power were evaluated.
2. System Design
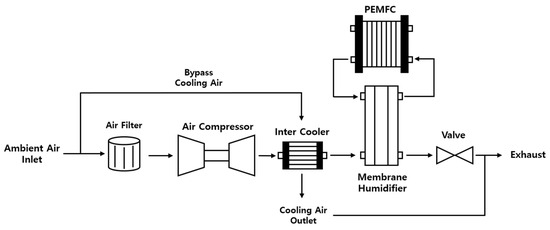
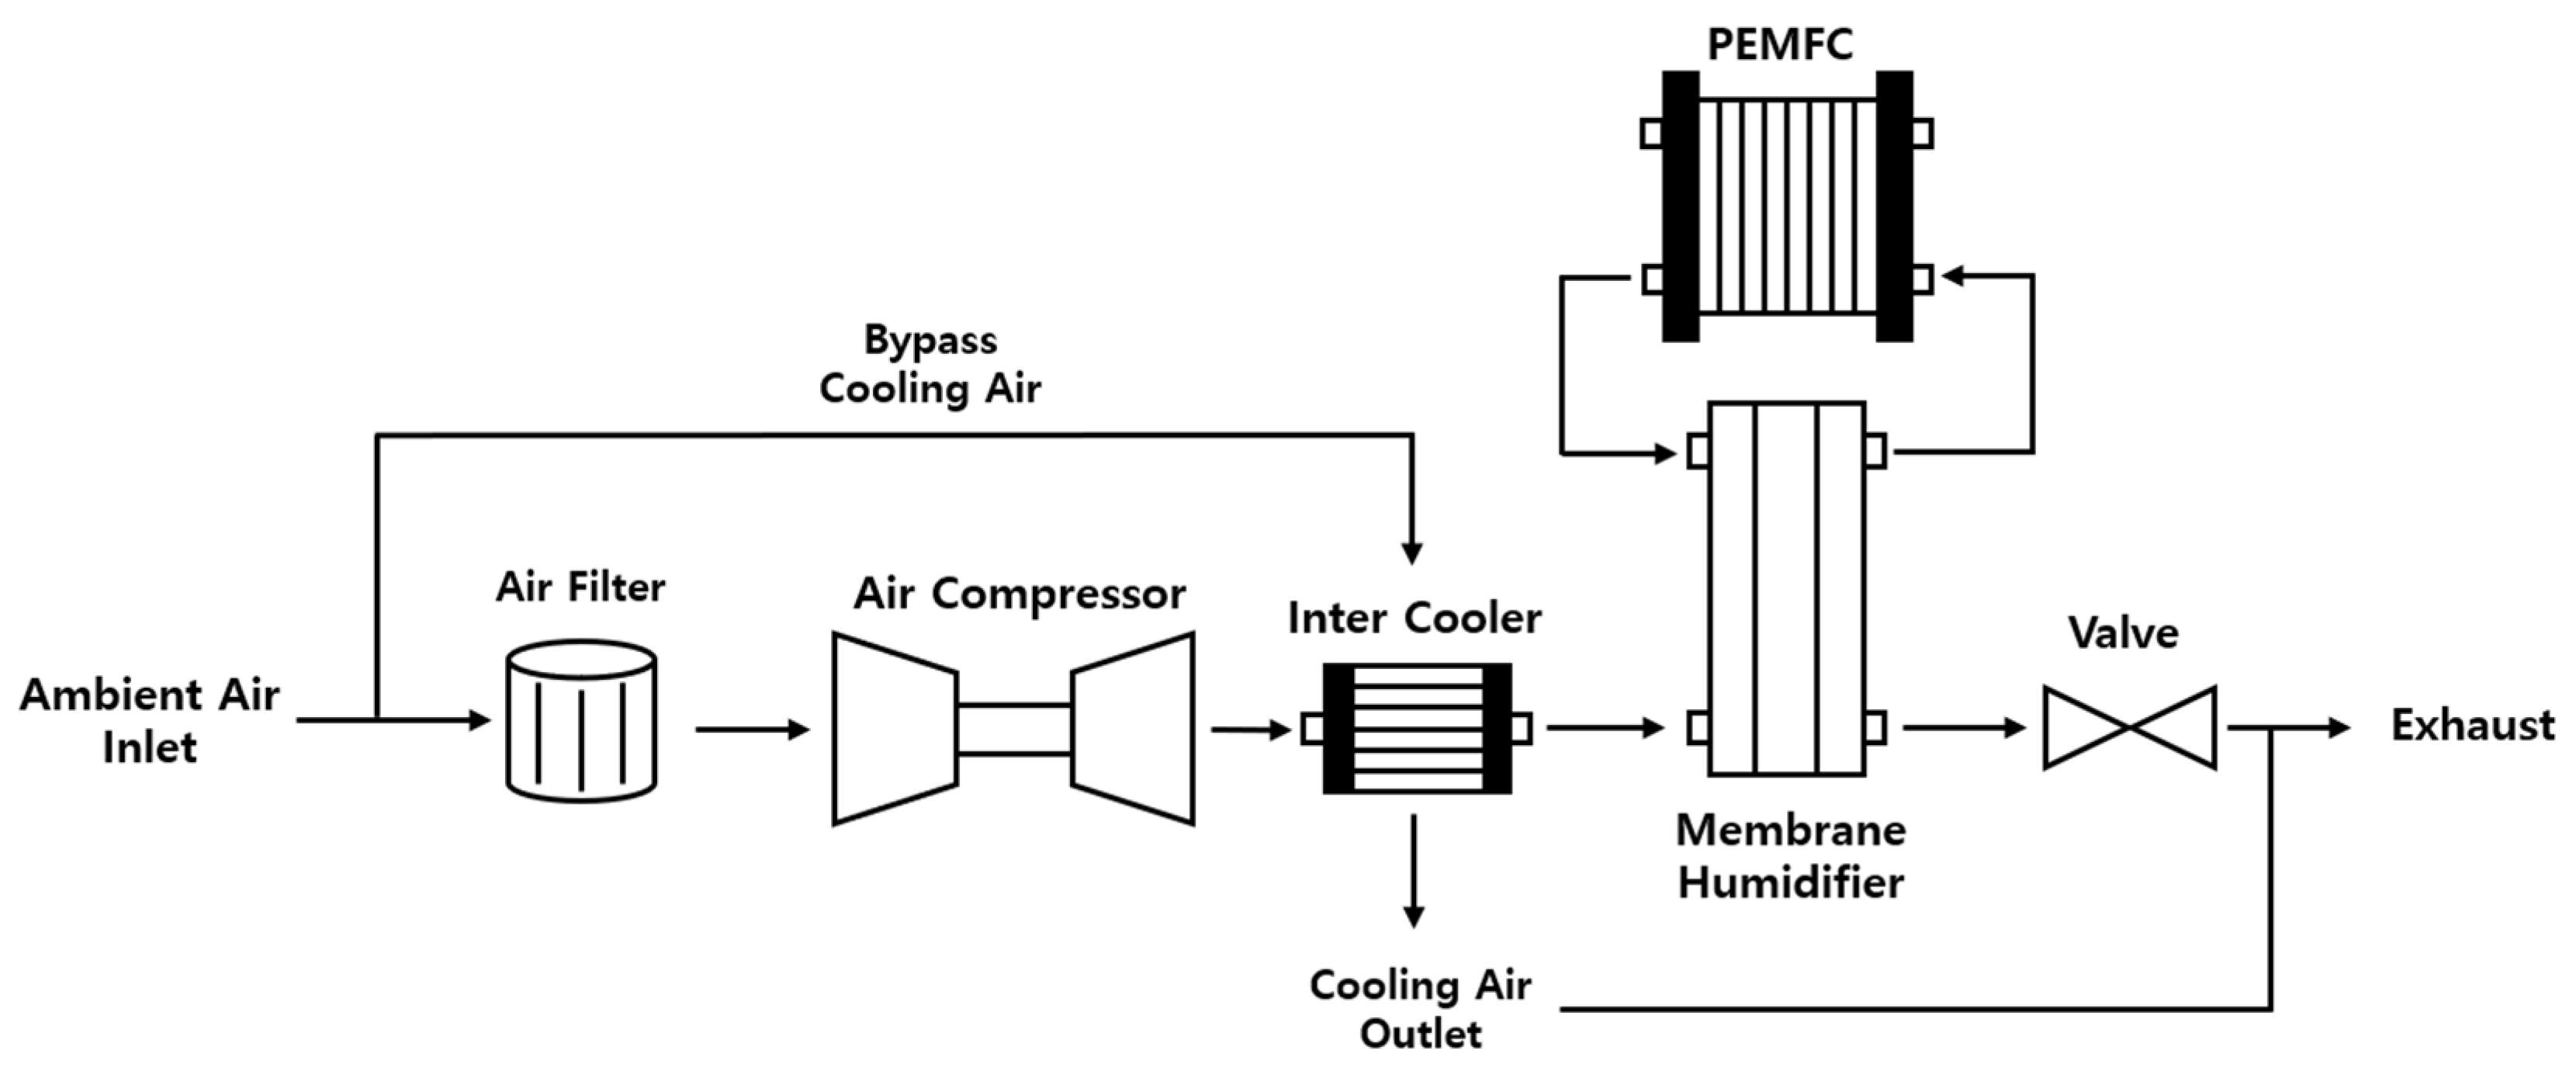
A PEMFC air supply system consists of an air filter, an air compressor, an intercooler, a membrane humidifier, and a flow control device to supply compressed air to the cathode of the fuel cell stack [20,21]. Ambient air passes through the filter before entering the compressor, where it is pressurized to the desired cathode pressure. In this configuration, the incoming ambient air is divided into two flow paths: the main reactant air flow is supplied to the PEMFC cathode, and the bypass cooling air flow is used for intercooler heat rejection [22]. The compressed reactant air then passes through the intercooler, where the temperature rise caused by air compression is reduced by the bypass cooling air. Since the air-cooled intercooler does not require parasitic power for cooling or additional cooling devices such as a fan or a coolant pump, it offers an advantage in terms of system mass. The compressed air then receives the required moisture through the membrane humidifier before being supplied to the stack. After the electrochemical reaction, the remaining air and generated water are discharged together with the cooling air from the intercooler, while some moisture is transferred to the membrane humidifier before being expelled externally. A schematic diagram of the PEMFC air supply system is shown in Figure 1.
Figure 1.
A schematic diagram of the PEMFC air supply system.
In this study, all calculations were implemented in MATLAB R2025b (MathWorks, Natick, MA, USA) based on the governing equations and boundary conditions described in this section.
2.1. Target Aircraft and Propulsion System
In this study, the service ceiling of the Dornier 228 and the cell configuration of the ZA600 power pack were used as the main design inputs for defining the operating environment and stack model. The ZA600 consists of four fuel cell power packs, each providing an output of 200 kW, and each power pack is composed of two stacks connected in series [10]. Table 1 shows the specifications for the ZA600 single power pack, and Table 2 shows the specifications for the Dornier 228.
Table 1.
Specifications of ZA600 single PEMFC power pack.
Table 2.
Specifications of the Dornier 228.
An altitude of 25,000 ft was considered the highest and most demanding operating condition for the reference aircraft, where the reduction in ambient pressure most strongly affects cathode pressurization and compressor loading. The ambient temperature and pressure at the selected altitude were calculated using the International Standard Atmosphere (ISA) model [23]:
represents the variation in ambient air temperature with altitude based on the standard atmospheric lapse rate [24]:
represents the ambient pressure at a given altitude using the barometric relation considering the temperature lapse rate in the standard atmosphere. and represent the standard atmospheric pressure and temperature, respectively.
2.2. Boundary Conditions
To simplify the performance analysis of the PEMFC stack and the air compressor, several boundary conditions and assumptions were defined, which are summarized as follows:
- Air was assumed to behave as an ideal gas as a simplifying assumption for the comparative analysis conducted in this study.
- The ambient conditions were defined at an altitude of 25,000 ft.
- The aircraft was assumed to undergo uniform linear motion.
- The operating temperature of the PEMFC stack was fixed at 80 °C.
- The compression process was assumed to be isentropic.
2.3. PEMFC Stack Power Model
The power output of the PEMFC stack can be expressed as the product of the stack current, cell voltage, and number of cells [21]:
and represent the stack power and current of the PEMFC, respectively, denotes the voltage of a single cell, and is the number of cells in the stack. The cell voltage is calculated by subtracting the voltage losses associated with electrochemical reactions from the reversible voltage [25]:
represents the thermodynamic reversible voltage, denotes the activation loss associated with the electrochemical reaction kinetics at the electrodes, represents the ohmic loss caused by ionic and electronic conduction, and denotes the concentration loss resulting from mass transport limitations.
The thermodynamic reversible voltage of a PEMFC represents the theoretical maximum voltage determined by the operating temperature and the partial pressures of the reactant gases, and it can be expressed via the Nernst equation as follows [25]:
represents the standard reversible voltage, is the universal gas constant, and is the Faraday constant. , , and represent the partial pressures of hydrogen, oxygen, and water, respectively. In this study, the operating temperature of the PEMFC was fixed at 80 °C. Under this condition, the product water was assumed to be in the liquid phase, and its activity was taken as unity [26]. As a result, the water-related term in the Nernst equation is neglected, and the equation can be simplified as follows [25]:
The partial pressure of oxygen in air can be expressed as follows [26]:
Activation loss is the voltage loss caused by the activation energy barrier of the electrochemical reaction and can be expressed using the Tafel equation as follows [25]:
is the charge transfer coefficient representing the electrode reaction rate, and denotes the number of electrons involved in the electrochemical reaction. represents the current density, while denotes the exchange current density corresponding to the electrode reaction rate.
The exchange current density varies with the oxygen partial pressure, and the relationship is expressed as follows [26,27]:
represents the exchange current density at standard atmospheric pressure. The exchange current density is proportional to the oxygen partial pressure. Therefore, an increase in oxygen partial pressure increases the exchange current density, which reduces the activation loss by enhancing the electrochemical reaction kinetics.
Ohmic loss is caused by the resistance to ionic and electronic conduction within the fuel cell and can be expressed as follows [28]:
represents the total ohmic resistance of the fuel cell. In this study, the ohmic resistance was assumed to be constant since oxygen partial pressure primarily influences the activation and concentration losses, whereas ohmic loss is mainly associated with membrane hydration and ionic/electronic conduction [25].
Concentration loss arises from the mass transport limitations of reactant gases and is expressed as follows [24]:
is a constant associated with concentration loss, and denotes the limiting current density. The limiting current density represents the maximum current density determined by the mass transport limitation of reactants and can be expressed as follows [25]:
represents the effective diffusion coefficient of oxygen, denotes the oxygen concentration, and is the thickness of the diffusion layer. The relationship between oxygen concentration and oxygen partial pressure can be expressed as follows [25]:
The oxygen concentration is proportional to the oxygen partial pressure. Therefore, an increase in cathode pressure increases the limiting current density, which reduces the concentration loss in the high-current-density region.
2.4. PEMFC Air Supply Power Model
The power model of the PEMFC air supply system considers the compressor power required for air compression and the cooling load of the intercooler used to remove the temperature rise caused by the compression process [21]:
is the power required for the air supply system, is the compressor power required for air compression, and represents the cooling load of the intercooler. In this study, the compressor power was treated as an internal parasitic load and subtracted from the gross stack power. The intercooler was modeled as a ram-air heat rejection component; therefore, its thermal load was calculated, but not converted into auxiliary electrical power.
The compressor power required for air compression is calculated based on the isentropic air compression process and can be expressed as follows [28,29]:
is the mass flow rate of air supplied to the PEMFC system, is the specific heat capacity of air at constant pressure, and denotes the isentropic efficiency of the compressor. and represent the outlet and inlet pressures of the compressor, respectively, and is the specific heat ratio of air.
The air mass flow rate supplied to the PEMFC system is determined based on the oxygen consumption required for the electrochemical reaction and the air stoichiometric ratio, and can be expressed as follows [21]:
is the air stoichiometric ratio, is the molar mass of air, and represents the oxygen mole fraction in air.
The cooling load required to reduce the temperature rise caused by the air compression process can be calculated as follows [21]:
represents the change in air temperature between the compressor outlet temperature and the intercooler outlet temperature. This cooling load represents the thermal duty that must be rejected by the intercooler and was used to determine the required capacity of the air-cooled heat exchanger.
The isentropic efficiency of the compressor is defined as follows [30]:
denotes the compressor inlet temperature, is the ideal outlet temperature under isentropic air compression, and is the actual outlet temperature. The ideal outlet temperature for the isentropic air compression process can be expressed as follows [30]:
denotes the pressure ratio. Using this efficiency relation, the actual outlet temperature can be calculated from Equation (20) [30]:
These expressions represent the thermodynamic relation between the compressor inlet and outlet conditions during the air compression process.
2.5. PEMFC Air Supply Model
In this study, the compressor power was treated as the parasitic electrical load and was subtracted from the gross stack power to determine the net stack power. The net power of the PEMFC system, considering the compressor power consumption of the air supply system, can be calculated as follows [21]:
is the net power of the PEMFC system. Table 3 summarizes the main parameters used in this study.
Table 3.
Operating conditions and model parameters.
2.6. PEMFC Stack Size and Specific Power Estimation
The required stack size was estimated based on the number of cells needed to achieve the target net power. The number of cells required to achieve the target net power was calculated based on the proportional relationship between the net stack power and the number of cells:
denotes the required number of cells, and and represent the target and reference net stack powers, respectively.
The corresponding stack length was then estimated, and the results were compared under both the 0.7 V operating condition and the maximum power condition. The stack length was calculated as the product of the number of cells and the thickness of a single cell. The thickness of a single cell was defined as the sum of the thicknesses of the bipolar plate, the gas diffusion layer, the catalyst layer, and the membrane, and can be expressed as follows:
represents the total stack length, and , , , and correspond to the thicknesses of the bipolar plate, the gas diffusion layer, the catalyst layer, and the membrane, respectively. The thickness values of the PEMFC stack components used in this study are summarized in Table 4.
Table 4.
Thickness of PEMFC components.
In addition, the specific power was calculated for each compressor configuration to evaluate the mass penalty of the air supply system. The piping mass was not included in the system-specific power calculation because it strongly depends on the detailed aircraft installation layout and duct routing. Since the present study focuses on the relative comparison of different compressor configurations, only the masses of the main components, namely the PEMFC stack, the compressor, and the intercooler, were considered. The specific power of the PEMFC stack and the air supply system was defined as
is the system-specific power, and , , and are the masses of the PEMFC stack, the compressor, and the intercooler, respectively.
3. Results
3.1. PEMFC Voltage
3.1.1. Reversible Voltage
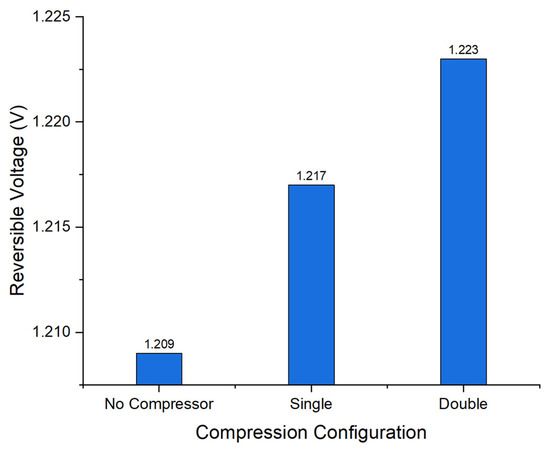
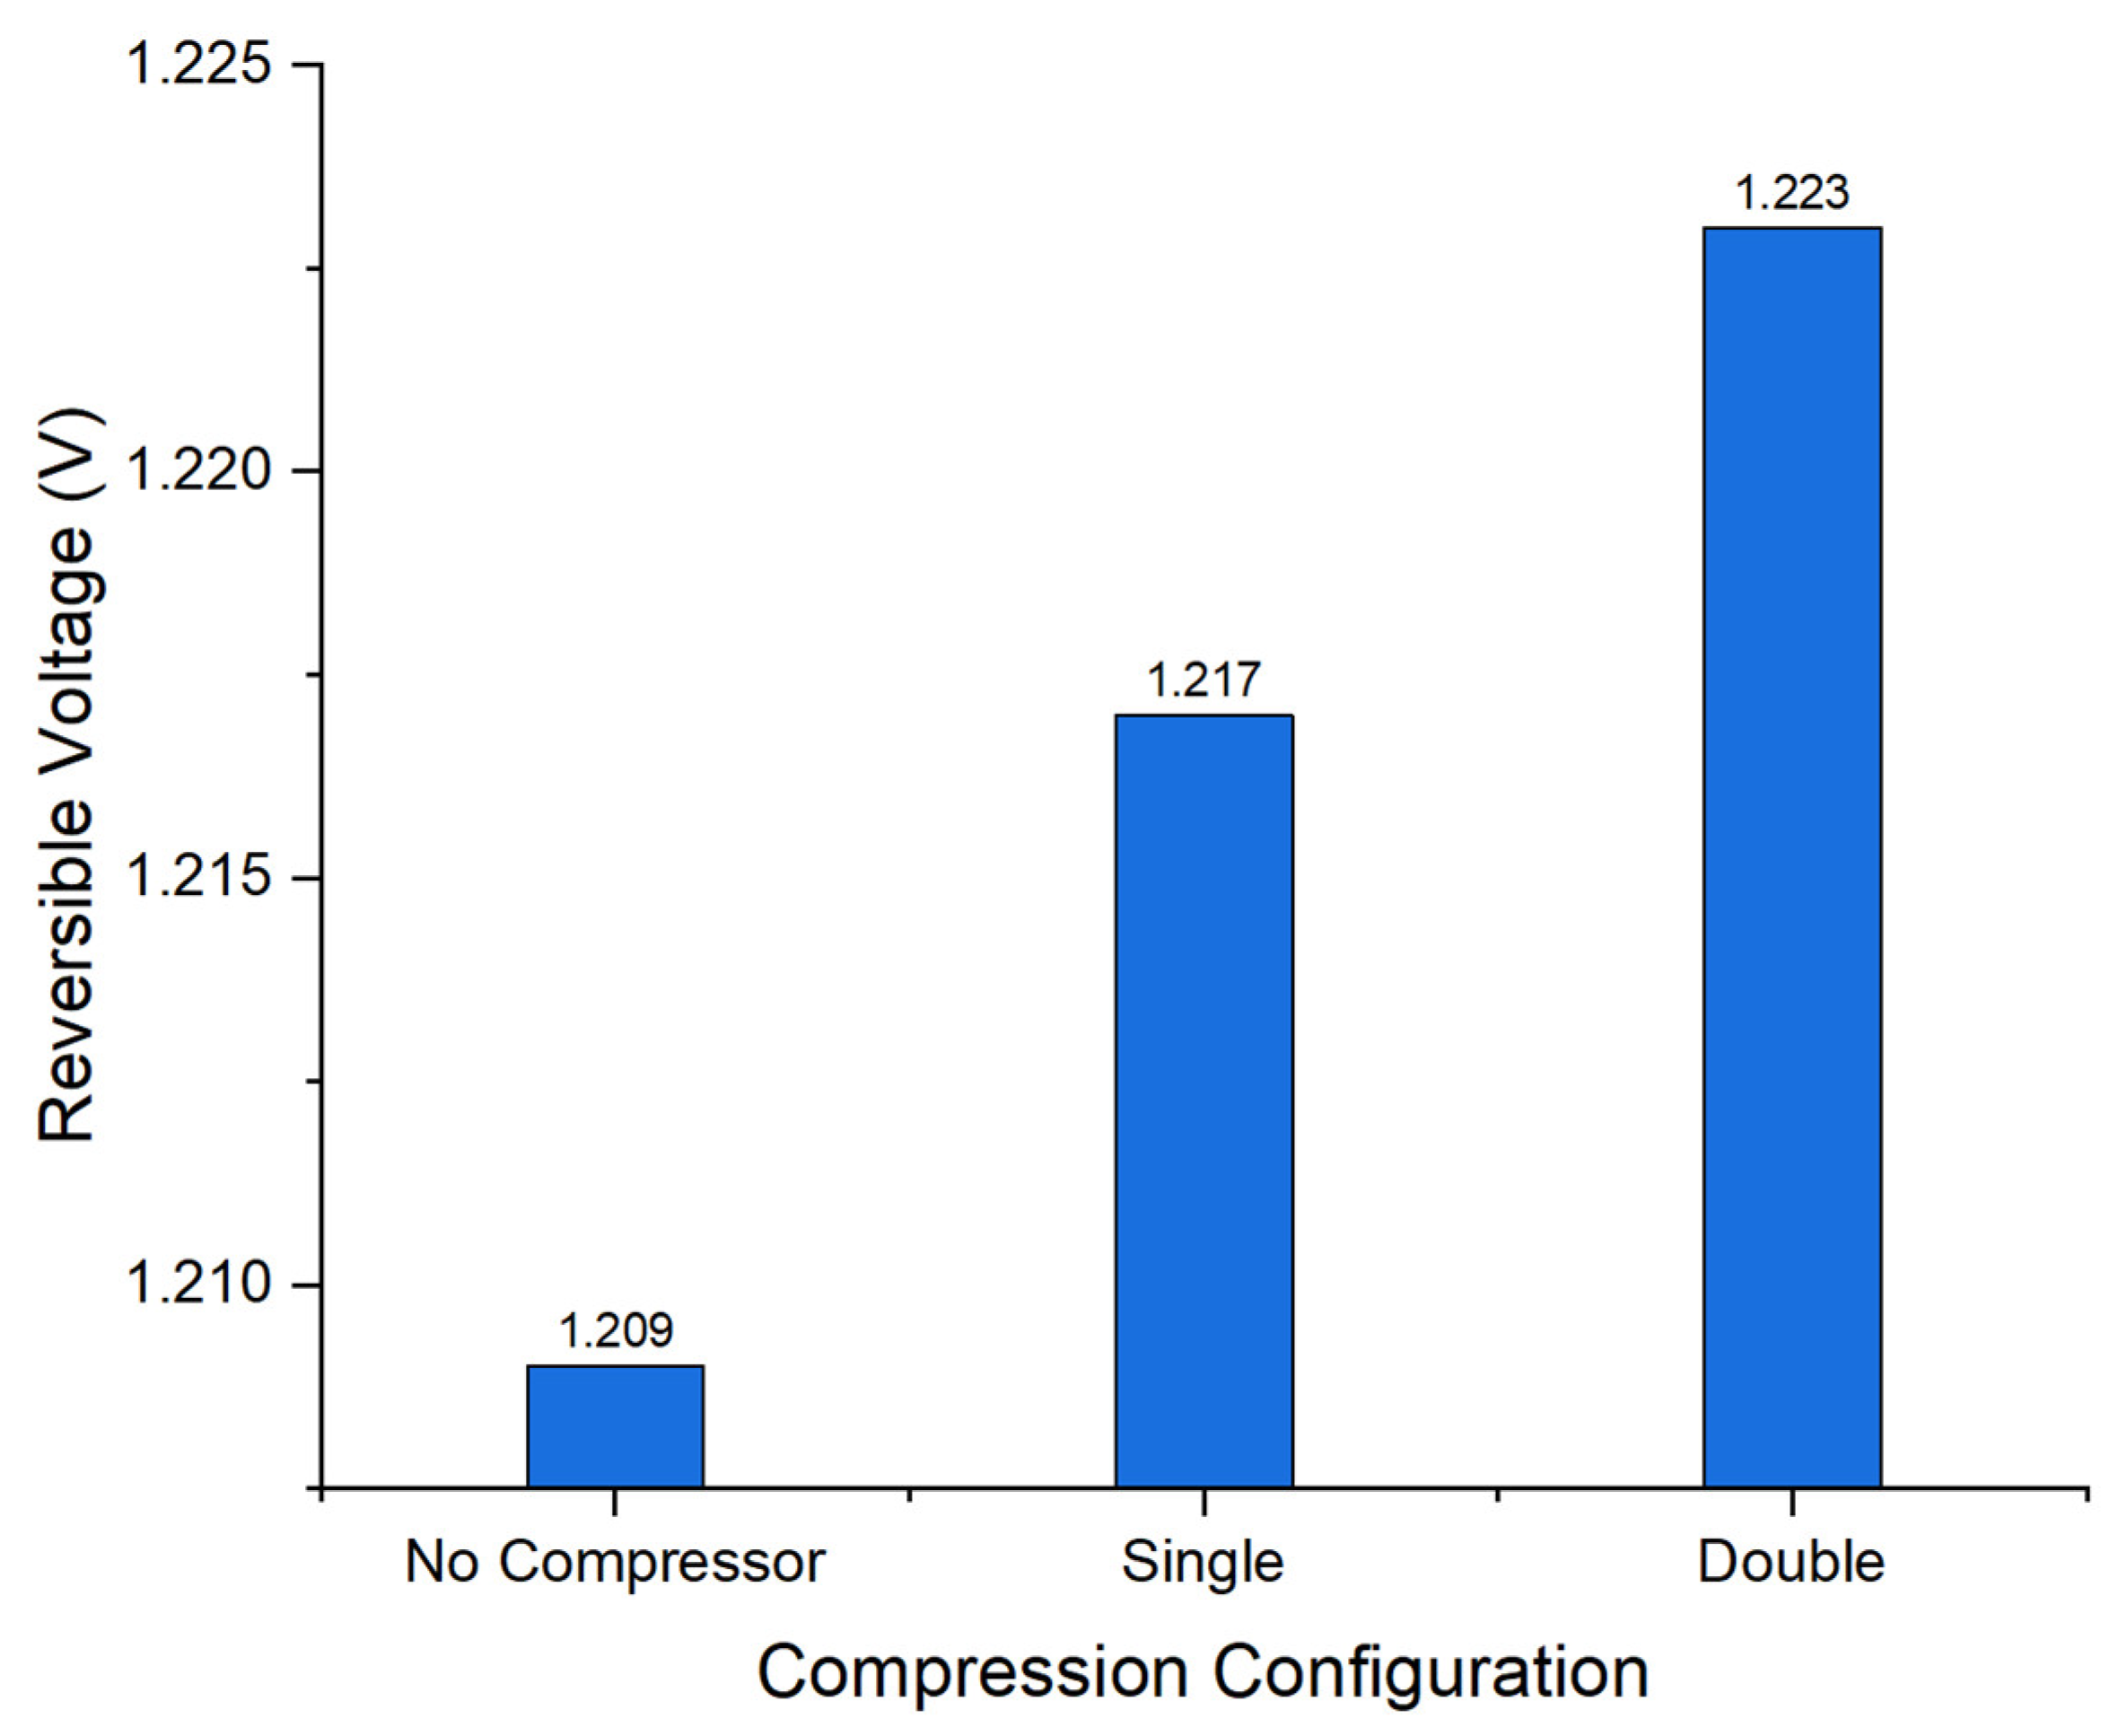
The reversible voltage under different compressor configurations was calculated based on the Nernst equation, and the results are presented in Figure 2.
Figure 2.
Reversible voltage under different compressor configurations at 25,000 ft.
Figure 2 shows the reversible cell voltage under different compressor configurations at an altitude of 25,000 ft. Overall, the reversible voltage increases as the air compression ratio increases. Specifically, the reversible voltage was calculated as 1.209 V without a compressor, 1.217 V with a single-stage compressor, and 1.223 V with a double-stage compressor. The difference between the no-compressor case and the double-stage-compressor case is approximately 0.014 V. This trend is attributed to the increase in oxygen partial pressure at higher air compression ratios, which raises the Nernst potential. However, the effect of pressure on the reversible voltage is relatively small because the pressure term appears in logarithmic form in the Nernst equation. Therefore, the direct contribution of compressors to reversible voltage improvement is limited.
3.1.2. Activation Loss Voltage
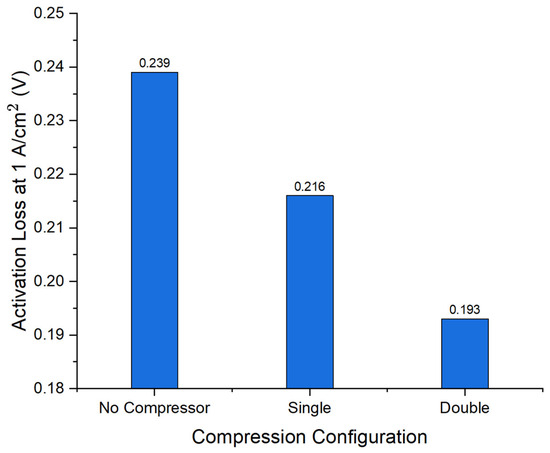
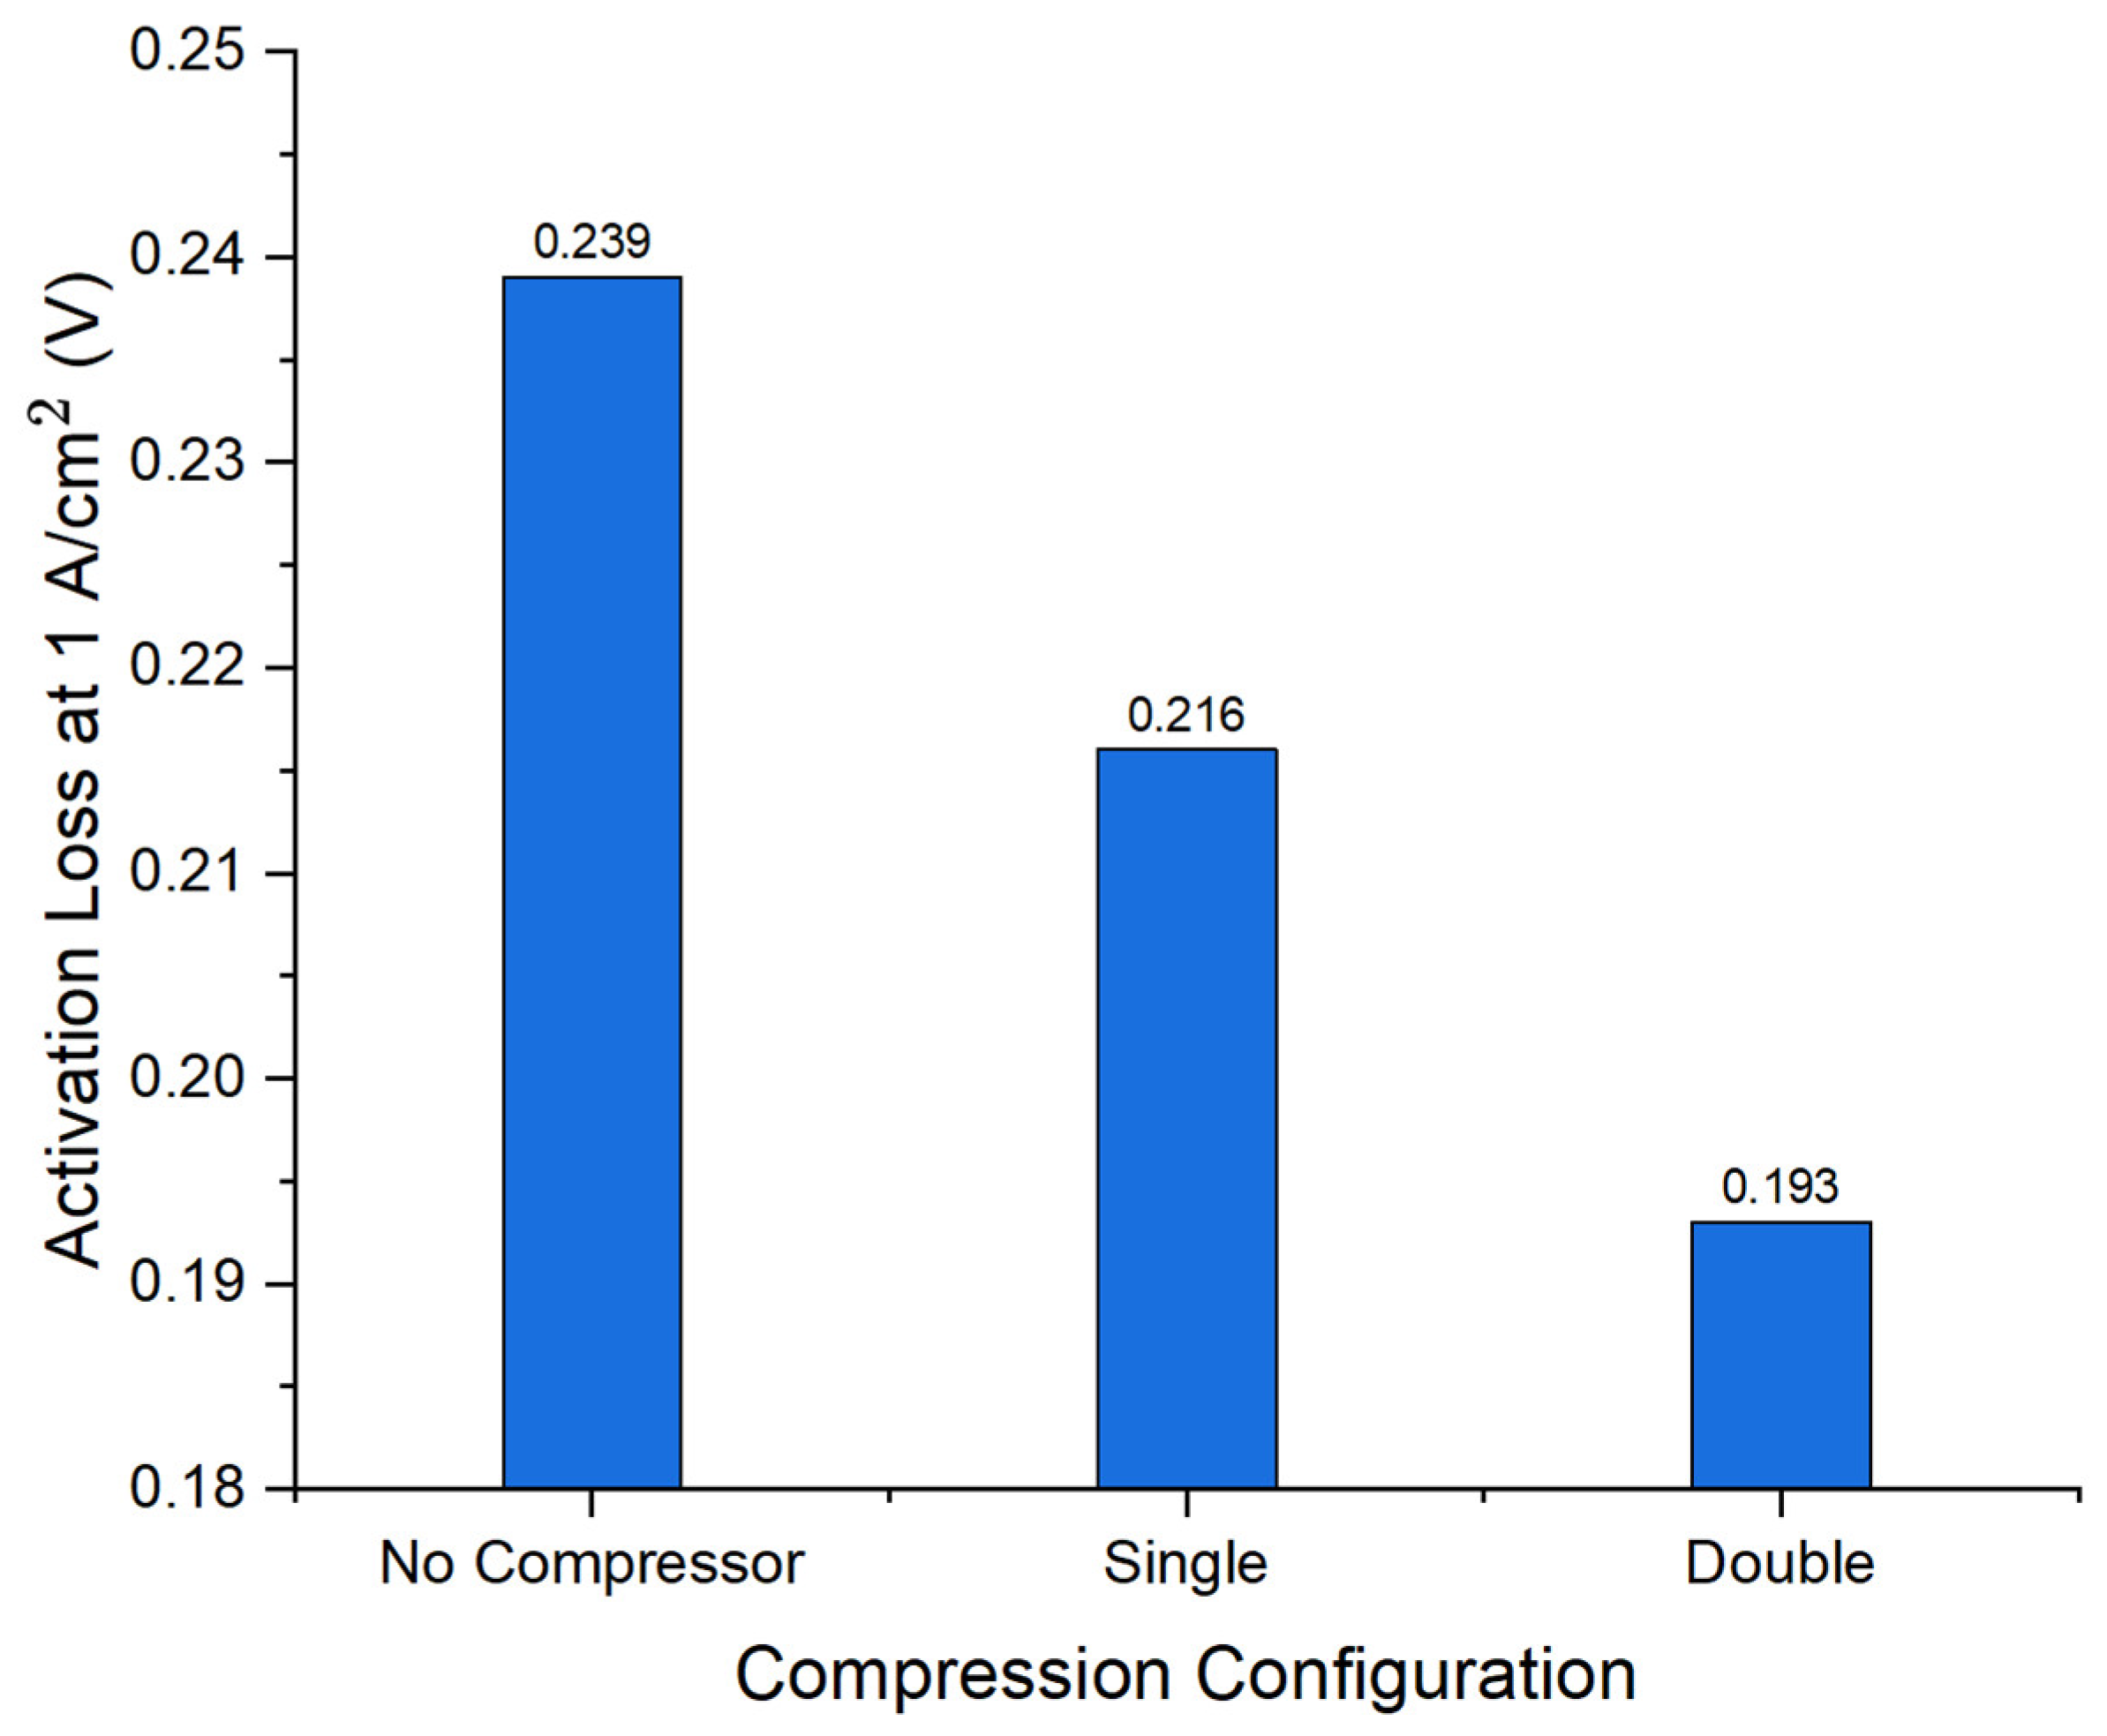
The activation loss under different compressor configurations was evaluated at a current density of 1 A/cm2, and the results are presented in Figure 3.
Figure 3.
Activation loss under different compressor configurations at 25,000 ft.
Figure 3 compares the activation loss for the three compressor configurations at a current density of 1 A/cm2. The no-compressor case shows the highest activation loss, 0.239 V, while the double-stage compressor case shows the lowest value, 0.193 V. The single-stage case result is between these two values at 0.216 V, which is 0.023 V higher than the double-stage case result. This behavior can be explained using the Tafel equation, where the activation loss depends on the logarithmic term ln(j/j0). As the oxygen partial pressure increases, the exchange current density j0 also increases. This reduces the ratio j/j0 and leads to a lower activation loss. From the no-compressor case to the double-stage-compressor case, the activation loss decreases by about 0.046 V. This reduction is larger than the increase in reversible voltage, suggesting that the performance gain from air compression is mainly related to improved electrochemical reaction kinetics and reduced activation loss, rather than to the reversible voltage increase alone.
3.1.3. Concentration Loss Voltage
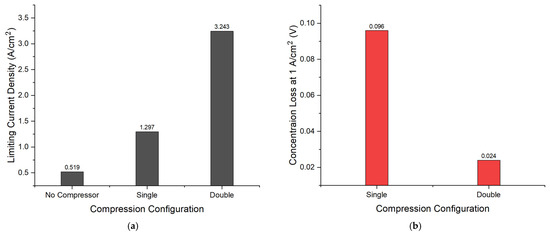
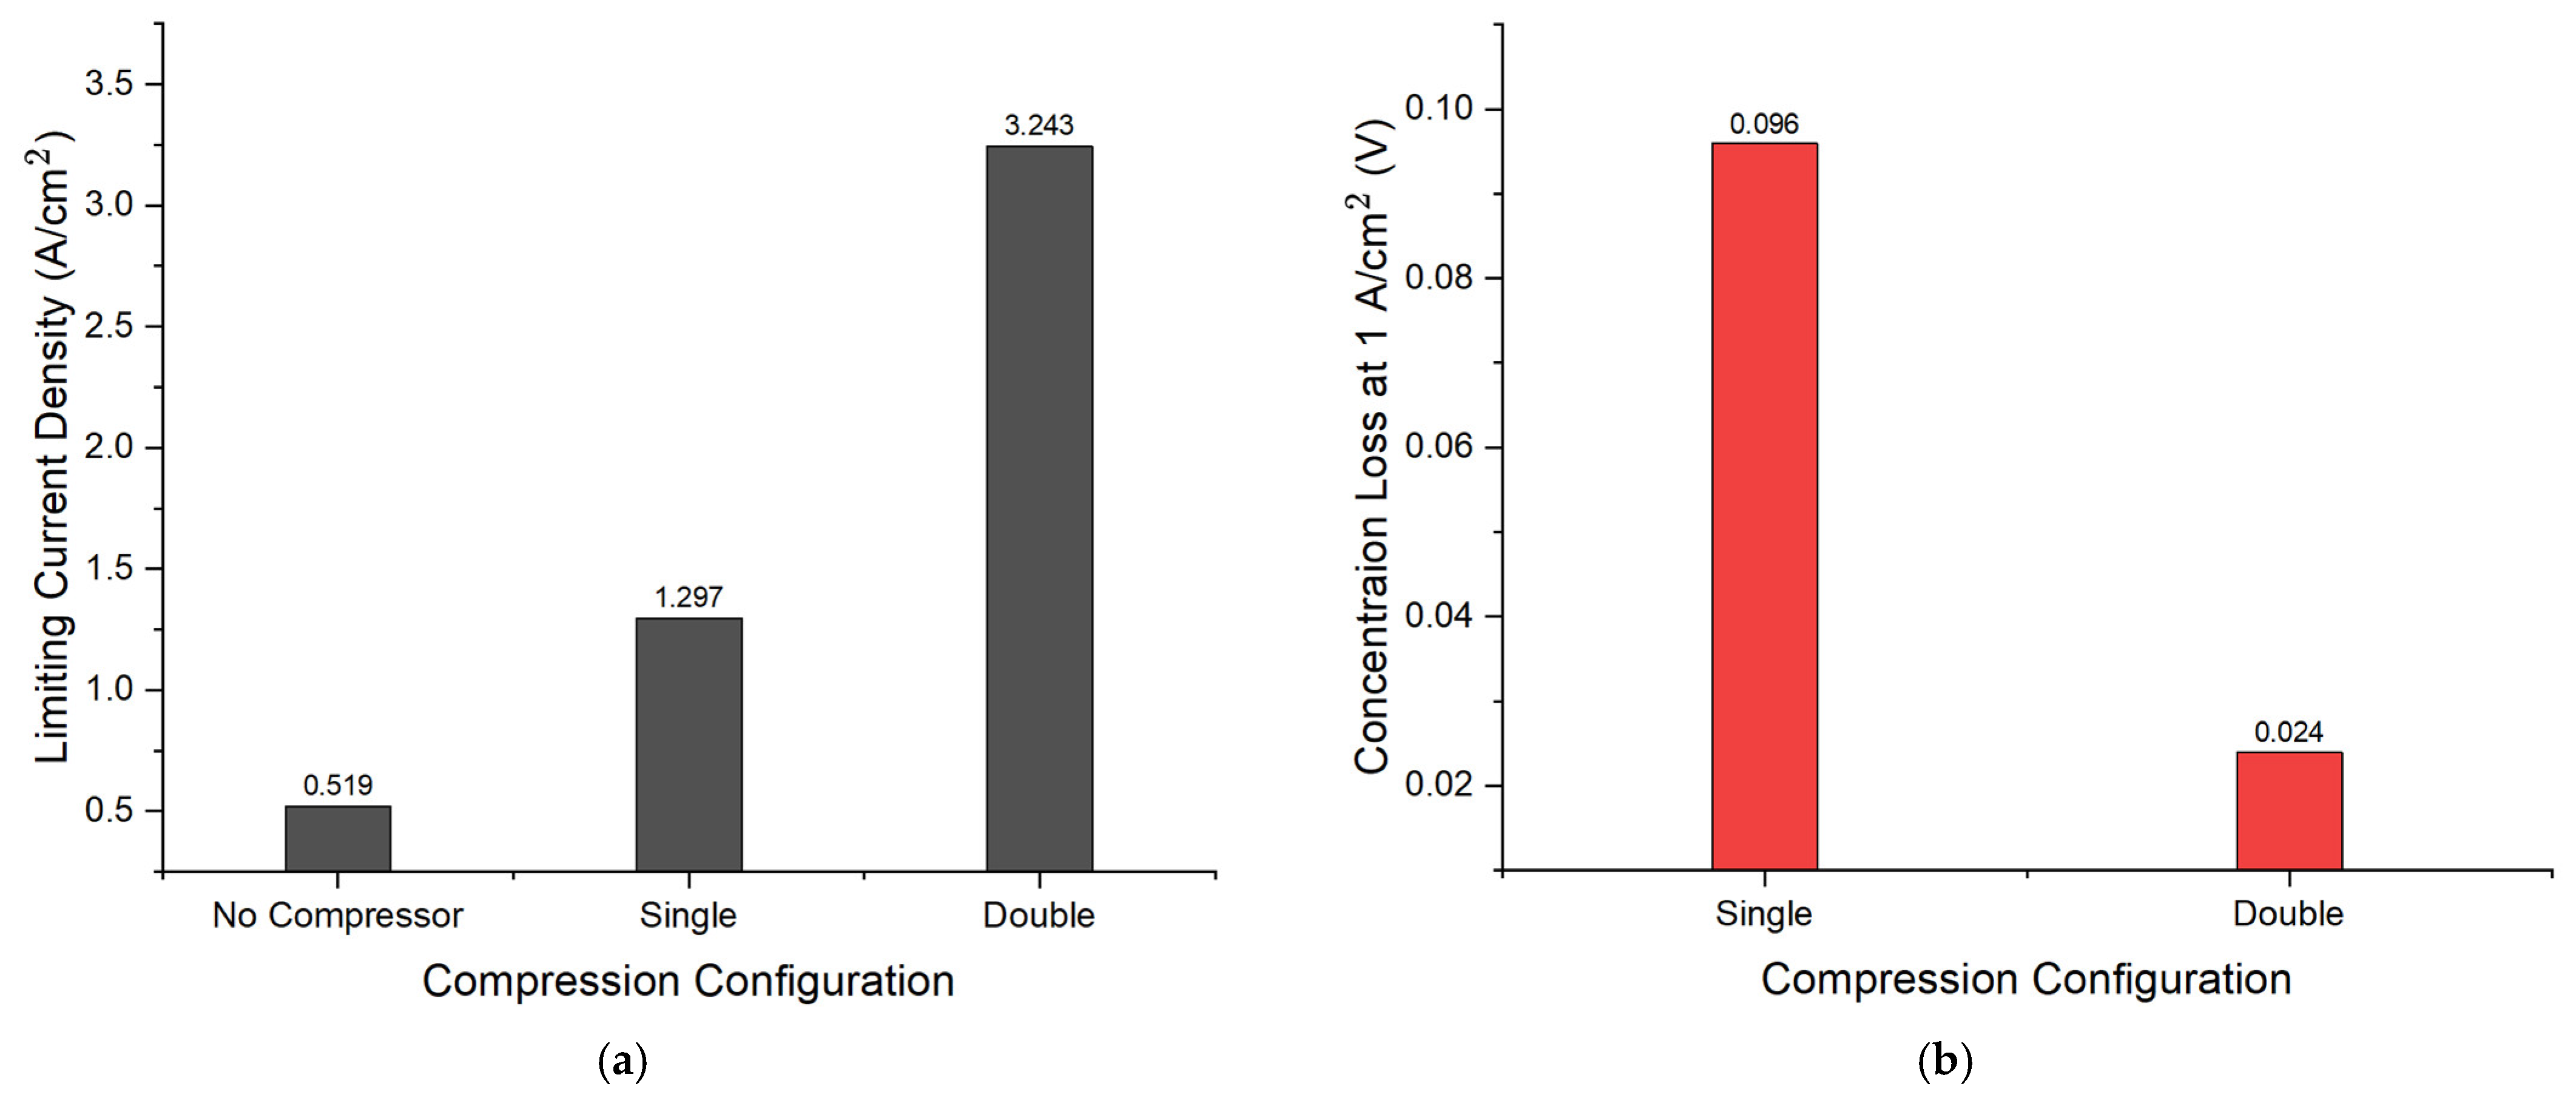
The concentration loss under different compressor configurations was analyzed based on the limiting current density and the concentration loss at 1 A/cm2, as shown in Figure 4.
Figure 4.
Concentration loss under different compressor configurations at 25,000 ft: (a) limiting current density; (b) concentration loss at 1 A/cm2.
Figure 4a shows the limiting current density under different compressor configurations. As the limiting current density increases, the PEMFC can operate stably in a higher current density region. In contrast, a lower limiting current density restricts the operating range and reduces the maximum achievable performance. Figure 4a shows that the limiting current density increases from 0.519 A/cm2 in the no-compressor case to 1.297 A/cm2 under the single-stage-compressor case, which is approximately 2.5 times higher. Under the double-stage-compressor case, it further increases to 3.243 A/cm2, corresponding to an increase of about 2.5 times compared with the single-stage case. These results indicate that the limiting current density significantly increases as the air compression ratio increases. This behavior is mainly attributed to the increase in oxygen partial pressure at the cathode. According to Equations (12) and (13), the oxygen concentration is proportional to the oxygen partial pressure, and the limiting current density increases with oxygen concentration. Therefore, higher cathode pressure improves the oxygen transport capability of the PEMFC under high-altitude conditions.
Figure 4b shows the concentration loss evaluated at 1 A/cm2. The no-compressor case is omitted, since its limiting current density is only 0.519 A/cm2, and therefore does not reach the reference operating point. This indicates that, without air compression, the PEMFC cannot maintain stable operation at 1 A/cm2 because the operating current density exceeds the limiting current density. At this current density, the concentration loss is 0.096 V for the single-stage-compressor case and 0.024 V for the double-stage-compressor case. The lower loss in the double-stage case is associated with a higher limiting current density, which reduces the ratio in the concentration loss equation and alleviates concentration polarization in the high-current region. These results show that air compression has a more pronounced effect on mass transport limitations than on reversible voltage and activation loss, especially under high-altitude conditions where oxygen availability is limited.
3.1.4. PEMFC Voltage and Power Performance
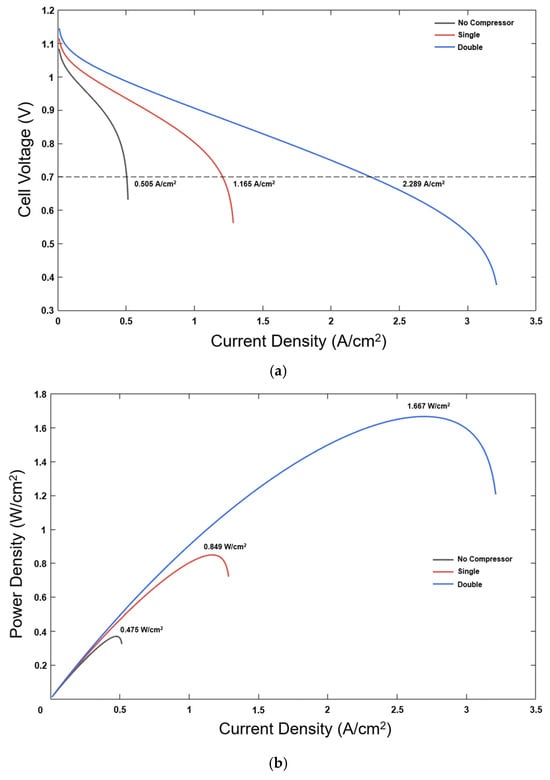
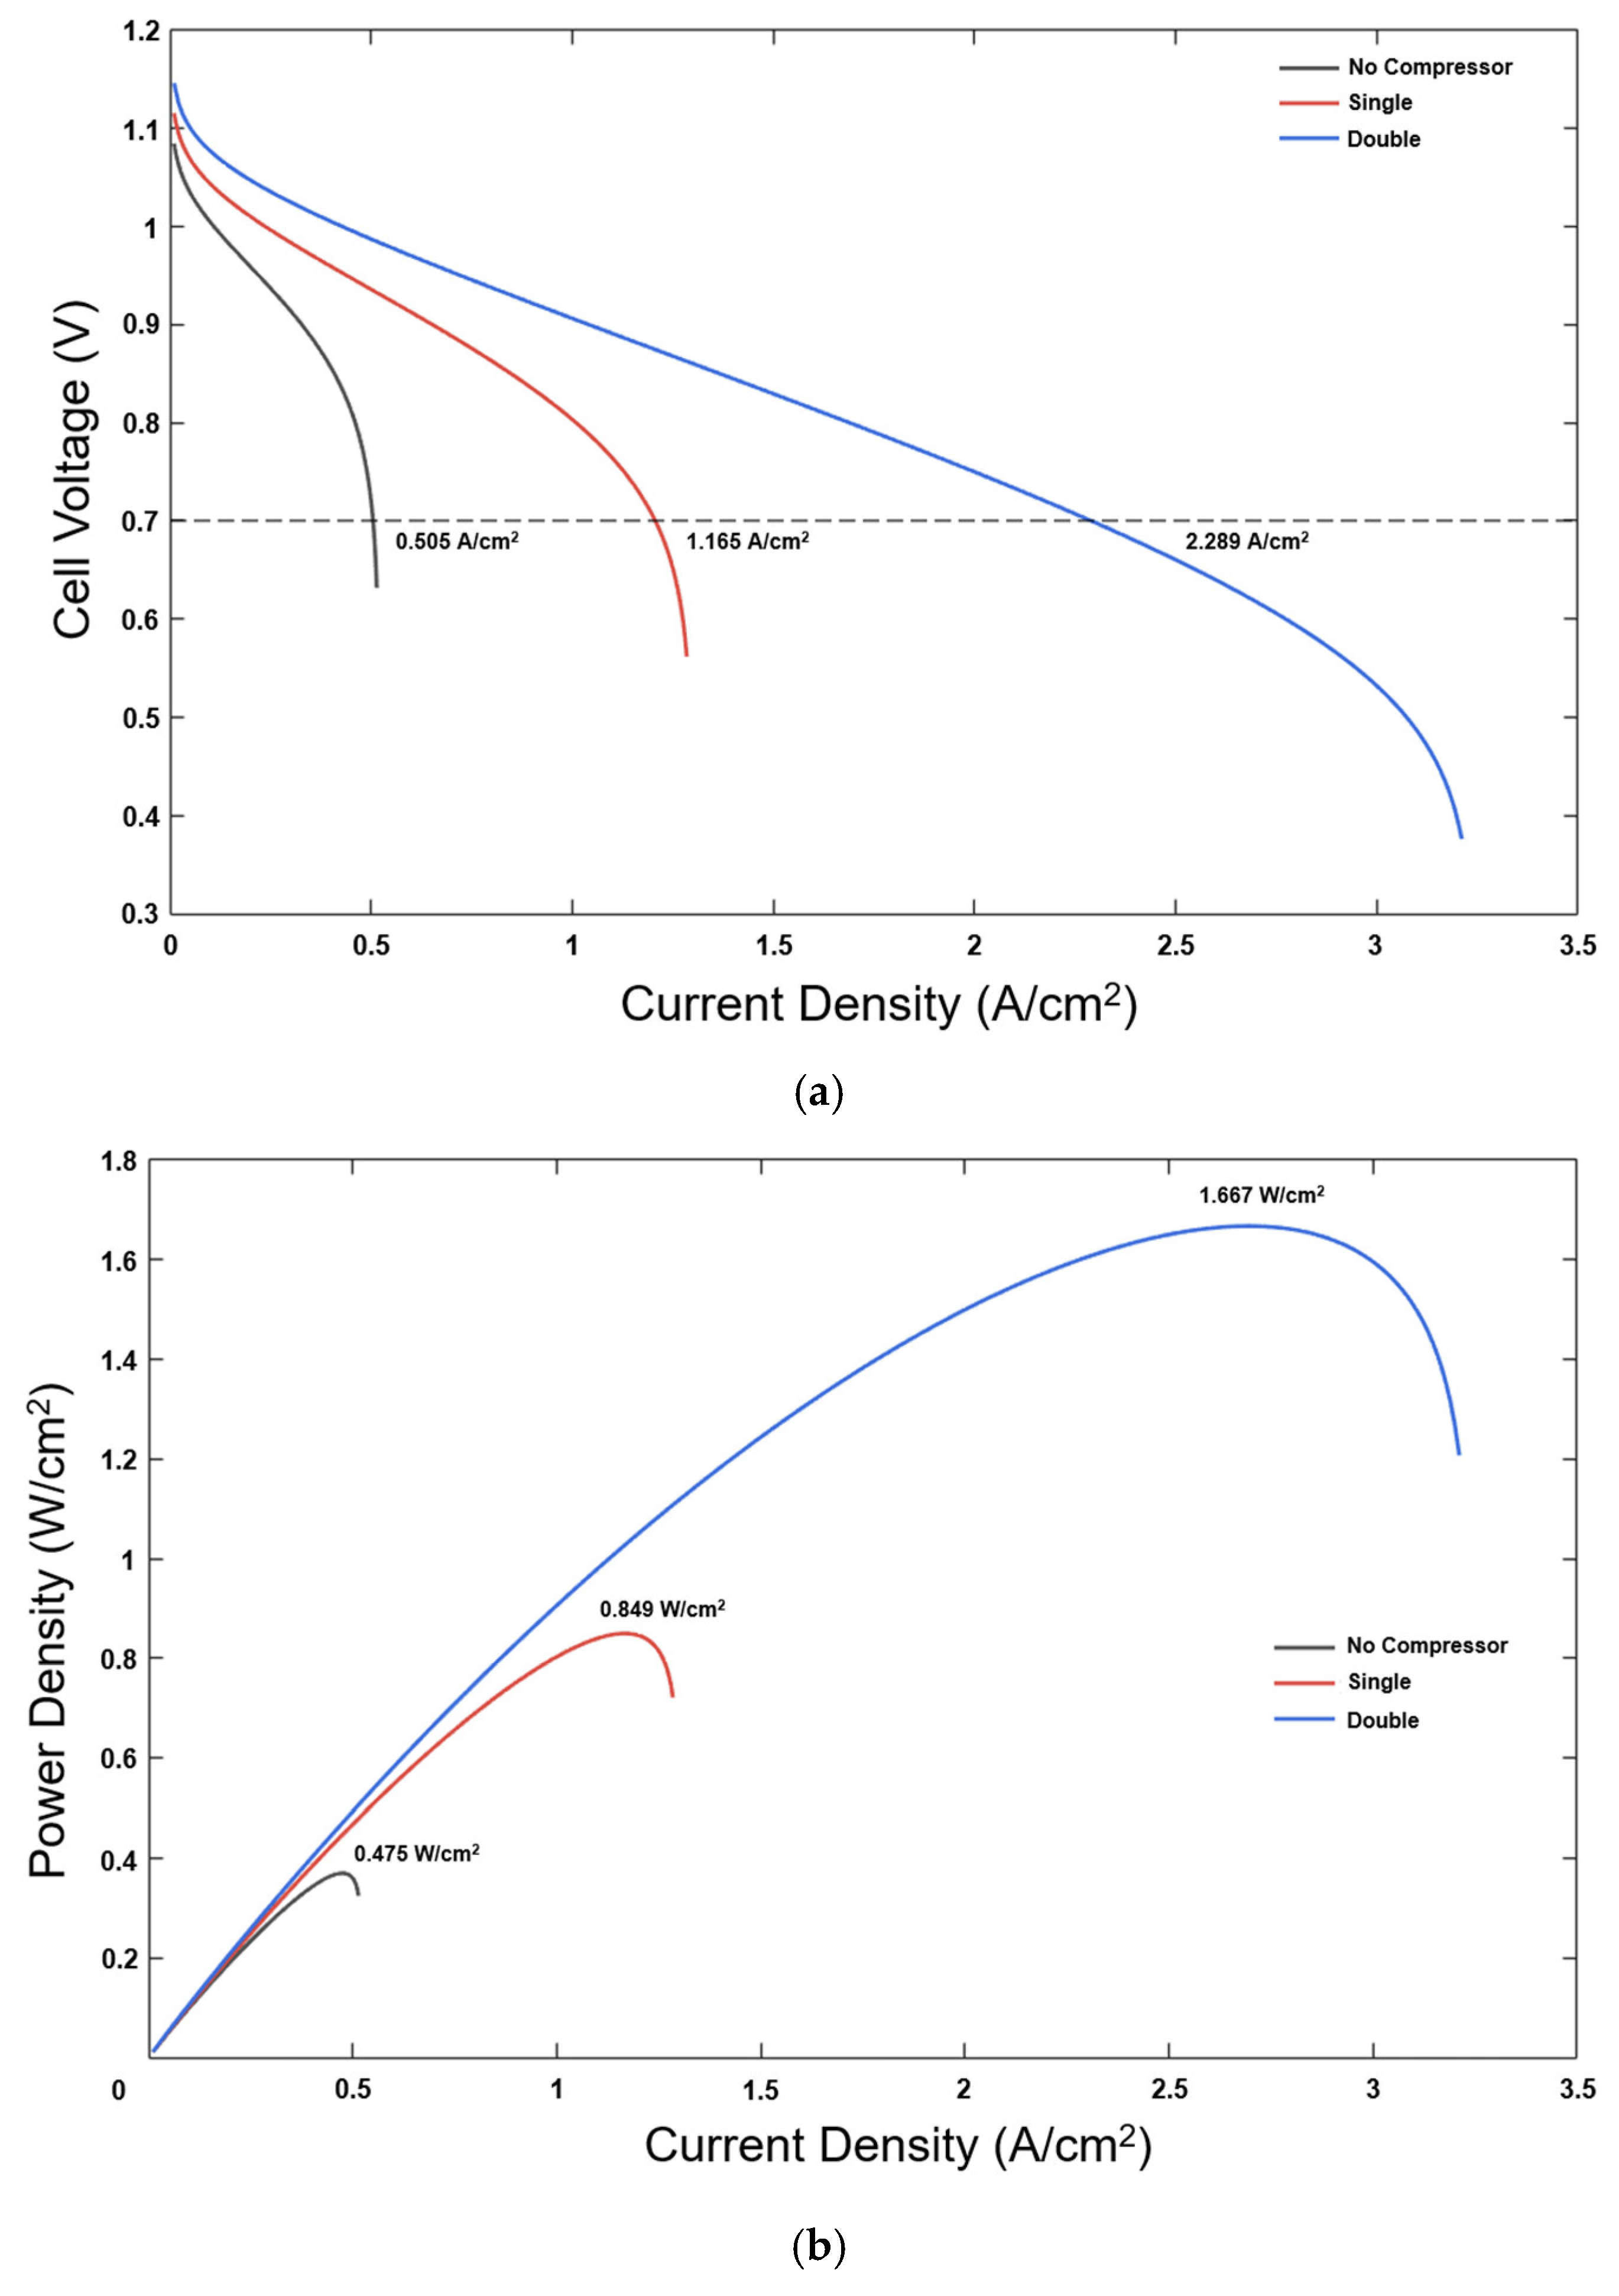
Figure 5 presents the PEMFC voltage and power performance under different compressor configurations.
Figure 5.
PEMFC performance with different compressor configurations: (a) j–V curves with the dashed line indicating the reference cell voltage of 0.7 V; (b) j–P curves.
Figure 5a shows the polarization curves of the PEMFC under different compressor configurations at an altitude of 25,000 ft. The cell voltage decreases with increasing current density in all cases owing to activation, ohmic, and concentration losses. However, the degree of voltage drop differs significantly depending on the compressor configuration. The no-compressor case shows a rapid voltage decrease and reaches the reference voltage of 0.7 V at only 0.505 A/cm2. This behavior is closely related to the low limiting current density under the no-compressor condition. As discussed previously, the limiting current density without air compression is 0.519 A/cm2, which is very close to the current density at 0.7 V. Therefore, the no-compressor case operates near the mass transport limit even at the reference voltage, resulting in a steep voltage drop in the high-current region.
With air compression, the PEMFC maintains a higher cell voltage over a wider current density range. At 0.7 V, the current density increases to 1.165 A/cm2 for the single-stage case and 2.289 A/cm2 for the double-stage case. These values are approximately 2.3 and 4.5 times the value obtained for the no-compressor case, respectively. The increase is too large to be explained by the change in reversible voltage alone, since the reversible voltage increases by only 0.014 V from the no-compressor case to the double-stage case. The main contribution comes from the reduction in electrochemical losses due to improved oxygen availability. A higher cathode pressure increases the oxygen partial pressure, which helps reduce activation loss, and also increases the oxygen concentration and limiting current density, delaying the onset of concentration polarization.
The difference between the single-stage and double-stage cases becomes more evident in the high-current region. Although the single-stage case extends the operating range compared with the no-compressor case, the current density at 0.7 V is still close to its limiting current density of 1.297 A/cm2. This means that mass transport limitation is already becoming significant in the single-stage case. In the double-stage case, the limiting current density increases to 3.243 A/cm2, providing a much larger margin from the operating current density. Therefore, concentration polarization is reduced, allowing the PEMFC to operate at a much higher current density.
Figure 5b shows the corresponding power density curves. The maximum power density increases from 0.475 W/cm2 in the no-compressor case to 0.849 W/cm2 in the single-stage-compressor case and 1.667 W/cm2 in the double-stage-compressor case, respectively. Therefore, the double-stage-compressor case provides approximately 3.5 times higher maximum power density than the no-compressor case, and nearly twice that of the single-stage case. This trend follows directly from the improvement in the polarization curve. Since the double-stage case maintains a higher voltage over a wider current density range, the product of voltage and current density remains high until a much larger current density is reached.
The results confirm that air compression is needed to maintain PEMFC performance under high-altitude conditions. The improvement, however, is not mainly caused by the increase in reversible voltage, but rather the reduction in activation loss and the alleviation of mass transport limitations caused by the higher oxygen partial pressure. Since the double-stage configuration provides a higher overall air compression ratio, it maintains the cell voltage over a wider current density range and produces a higher power density than the single-stage configuration. Based on these results, the double-stage configuration is more favorable than the single-stage configuration for aviation PEMFC applications in terms of stack performance.
3.2. Air Supply System Power Calculation Results
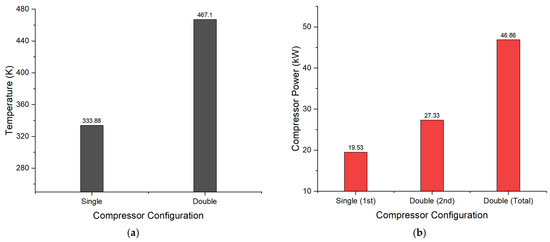
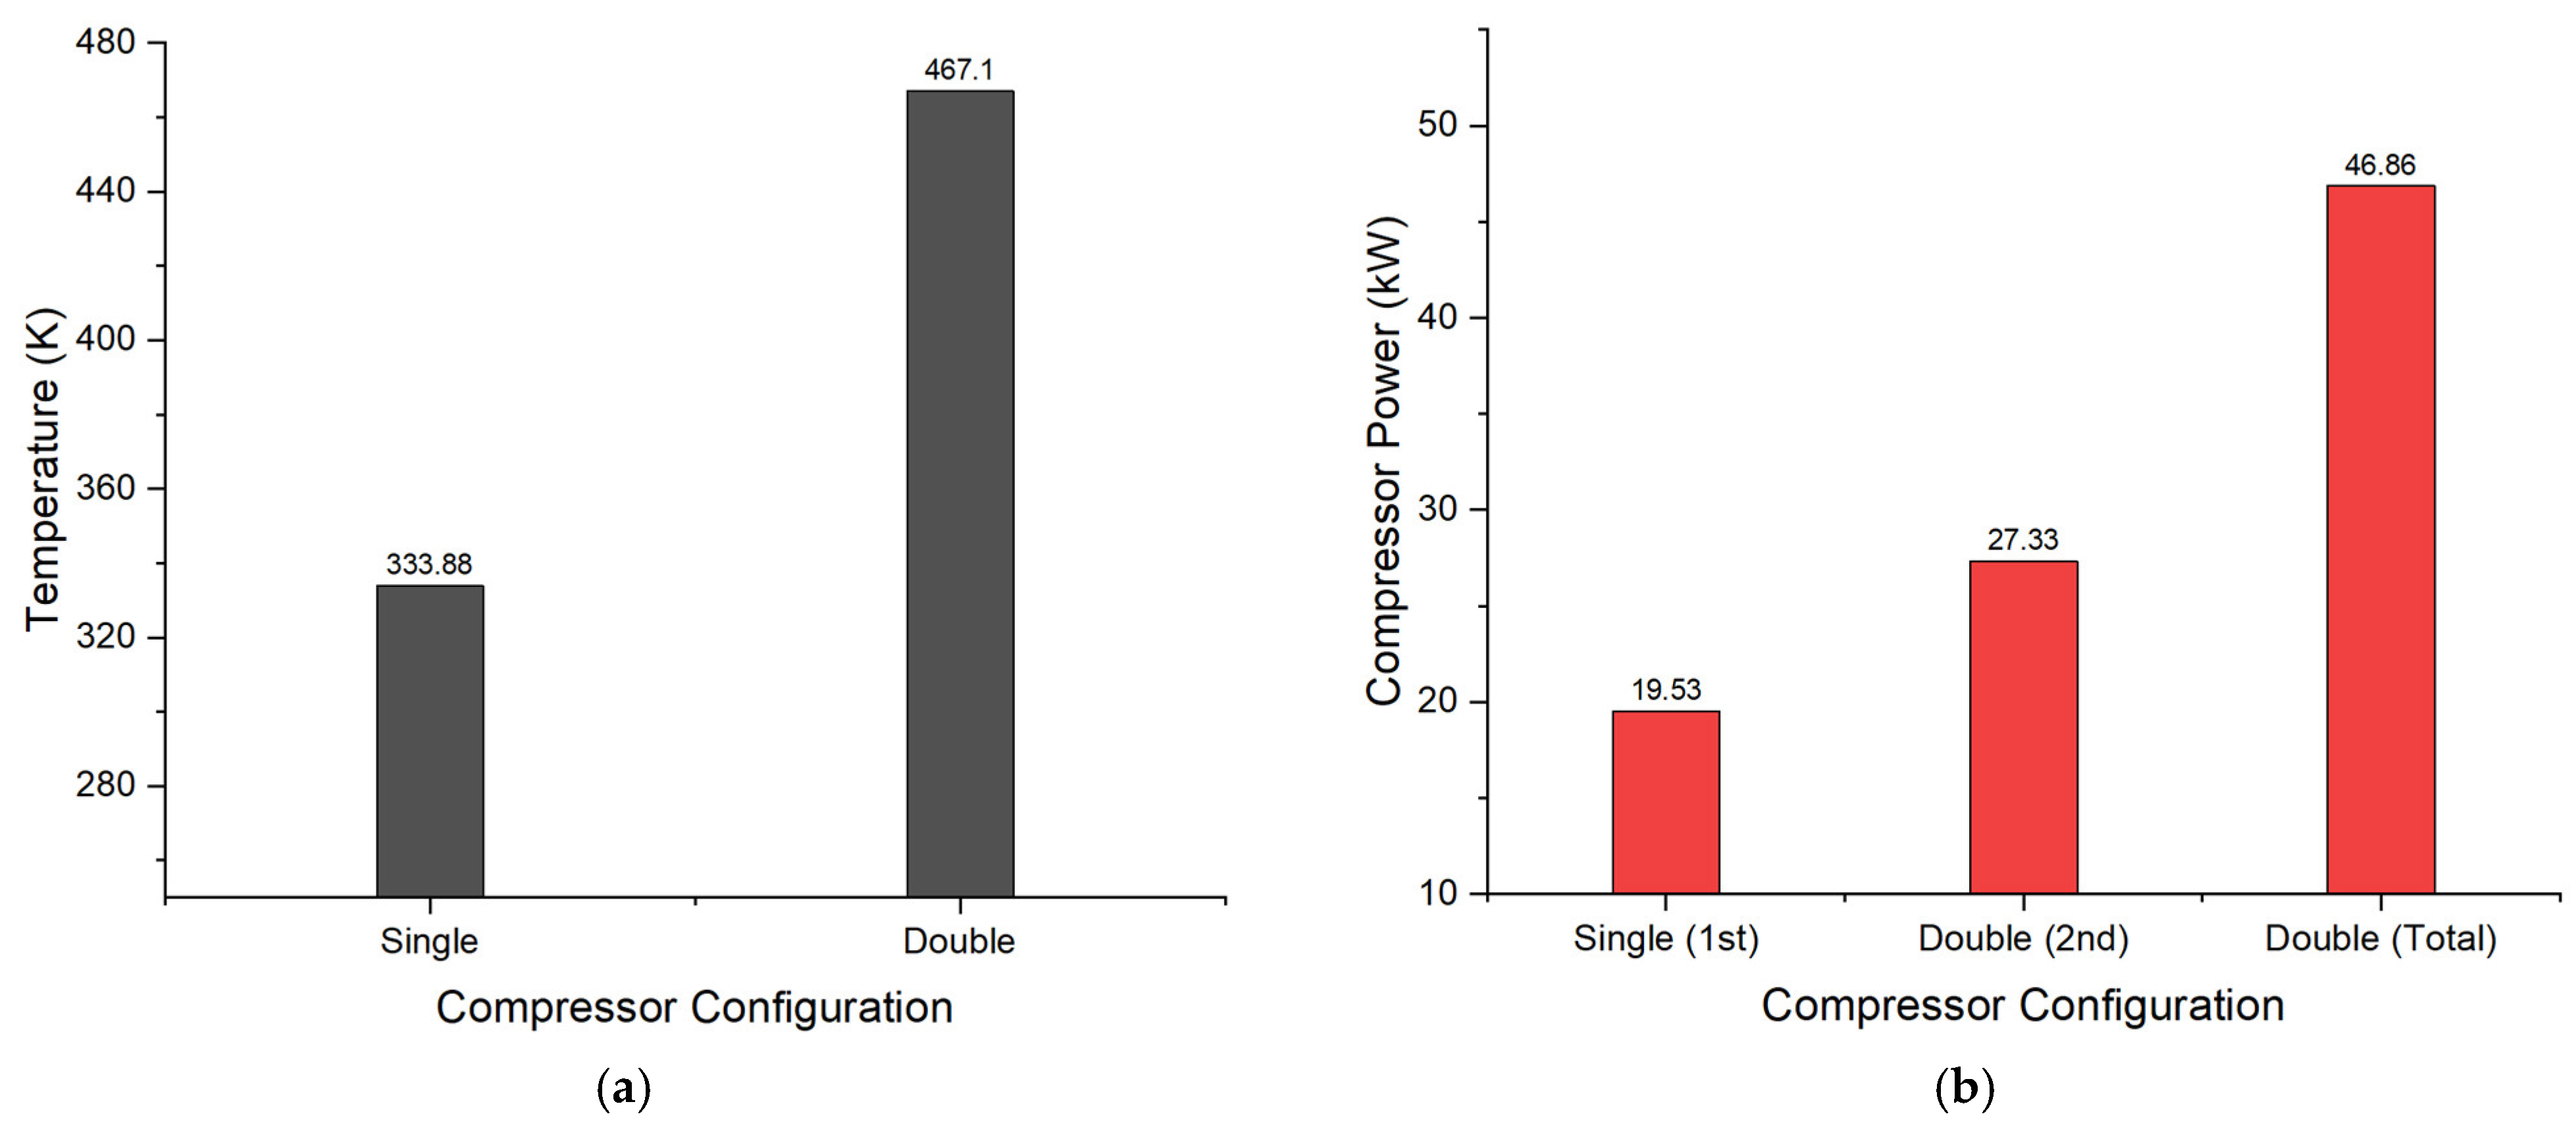
An increase in pressure ratio leads to a higher compressor outlet temperature, which means that thermal management is important in the PEMFC air supply system. Higher air compression also increases the compressor power demand. Figure 6 shows the compressor outlet temperature and power consumption for each compressor configuration. Figure 6a compares the compressor outlet temperature at each compression stage. In the single-stage system, the compressor outlet temperature increased to 333.88 K, corresponding to a temperature rise of 95.23 K. This temperature is lower than the reference PEMFC operating temperature of 353.15 K; therefore, additional intercooling is not considered necessary in this case. In contrast, the final outlet temperature of the double-stage system increased to 467.10 K, corresponding to a total temperature rise of 228.45 K from the ambient inlet condition. Such a high cathode inlet temperature may cause membrane drying and reduce ionic conductivity. For this reason, intercooling is required for the stable operation of the double-stage configuration.
Figure 6.
Compressor thermal and power performance under different compressor configurations at 25,000 ft: (a) compressor outlet temperature at each stage; (b) compressor power at each stage.
Figure 6b shows the compressor power consumption at each compression stage. The compressor consumes 19.5 kW during the first compression stage and 27.3 kW during the second compression stage, resulting in a total compressor power consumption of 46.9 kW for the double-stage system. Although both stages have the same pressure ratio of 2.5, more power is required in the second stage because the inlet air has already been heated during the first compression process. Therefore, the performance improvement obtained from the double-stage-compressor configuration is accompanied by higher parasitic power consumption and a larger thermal load in the air supply system.
3.3. PEMFC Stack Net Power Calculation Results
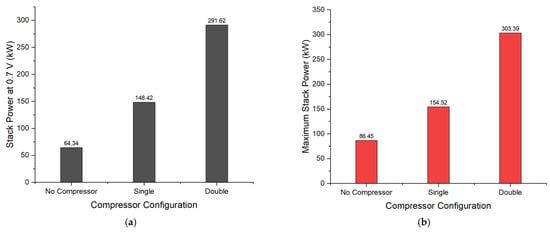
Prior to evaluating the net stack power, the gross stack power was calculated. The stack was assumed to consist of 910 cells, each with an active area of 200 cm. For comparison, the stack output was evaluated at a fixed voltage of 0.7 V and under the maximum power condition. The results are presented in Figure 7.
Figure 7.
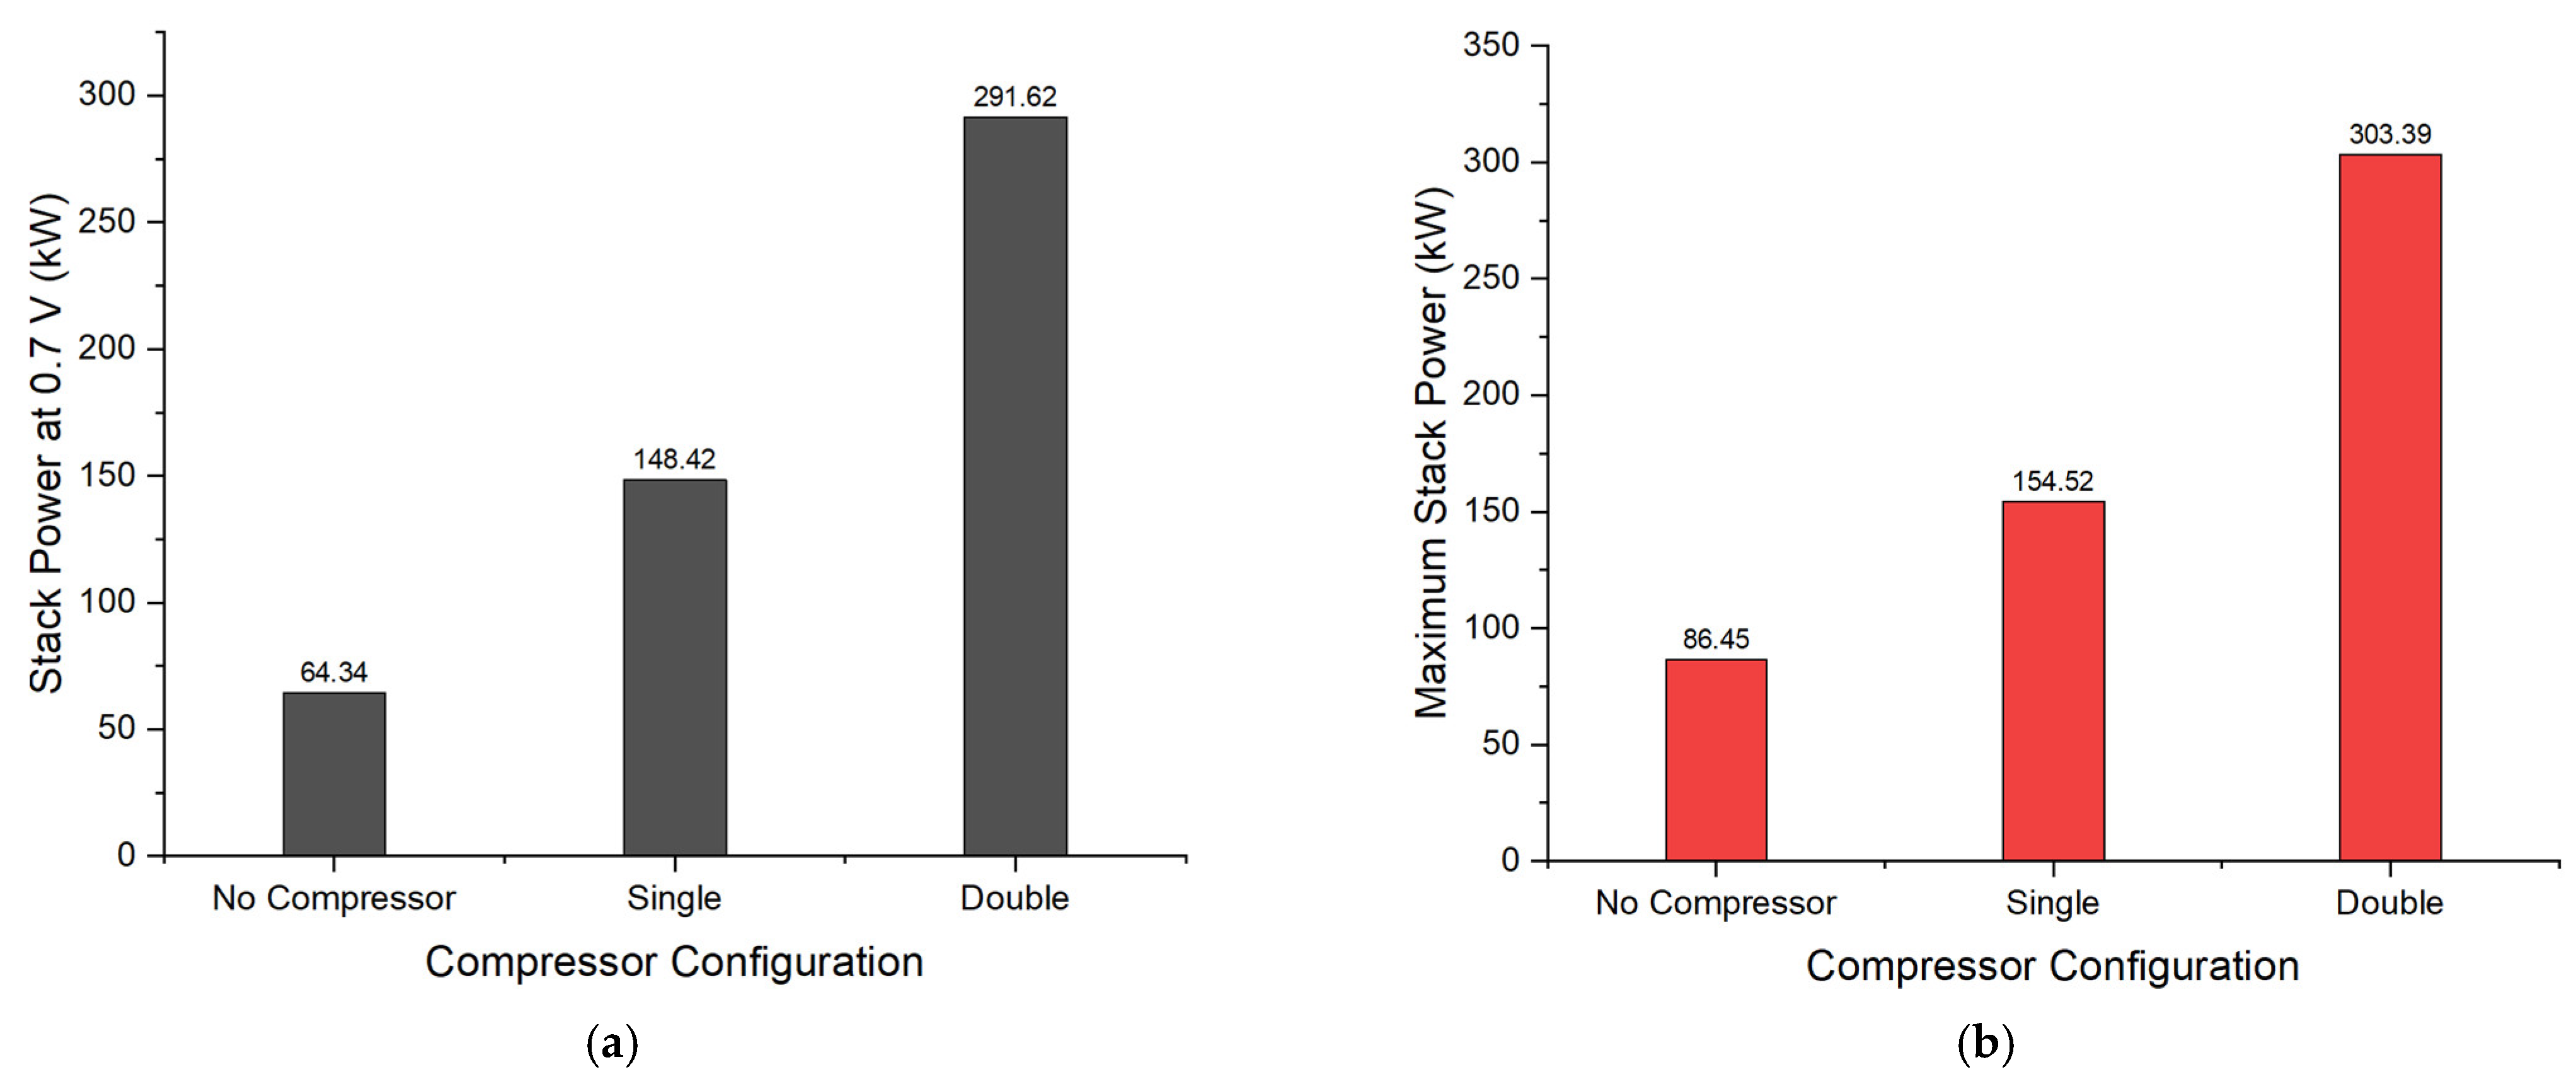
Comparison of gross stack power under different compressor configurations: (a) stack power at 0.7 V; (b) maximum stack power.
Figure 7a shows the gross stack power at a fixed voltage of 0.7 V. The calculated powers are 64.34, 148.42, and 291.62 kW for the no-compressor, single-stage, and double-stage configurations, respectively. The stack power of the double-stage configuration is approximately 1.96 times that of the single-stage configuration. This increase is directly related to the expansion of the operating current density range shown in Figure 5a. At the same cell voltage of 0.7 V, higher air compression ratios allow the PEMFC to operate at a higher current density because oxygen availability at the cathode is improved and mass transport limitations are alleviated.
Figure 7b shows the gross stack power under the maximum power condition. The gross stack power is 86.45 kW in the no-compressor case, 154.52 kW in the single-stage-compressor case, and 303.39 kW in the double-stage-compressor case. The stack power of the double-stage configuration is about 1.97 times that of the single-stage case. This result follows the power density behavior shown in Figure 5b, where the double-stage configuration maintains a higher cell voltage over a wider current density range. As the compressor stage increases, the gross stack power also increases because of the higher air supply pressure. Since the gross stack power alone cannot represent the actual usable output, the compressor power consumption was included in the following net power analysis, which is shown in Figure 8.
Figure 8.
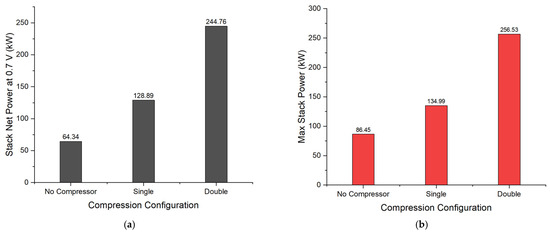
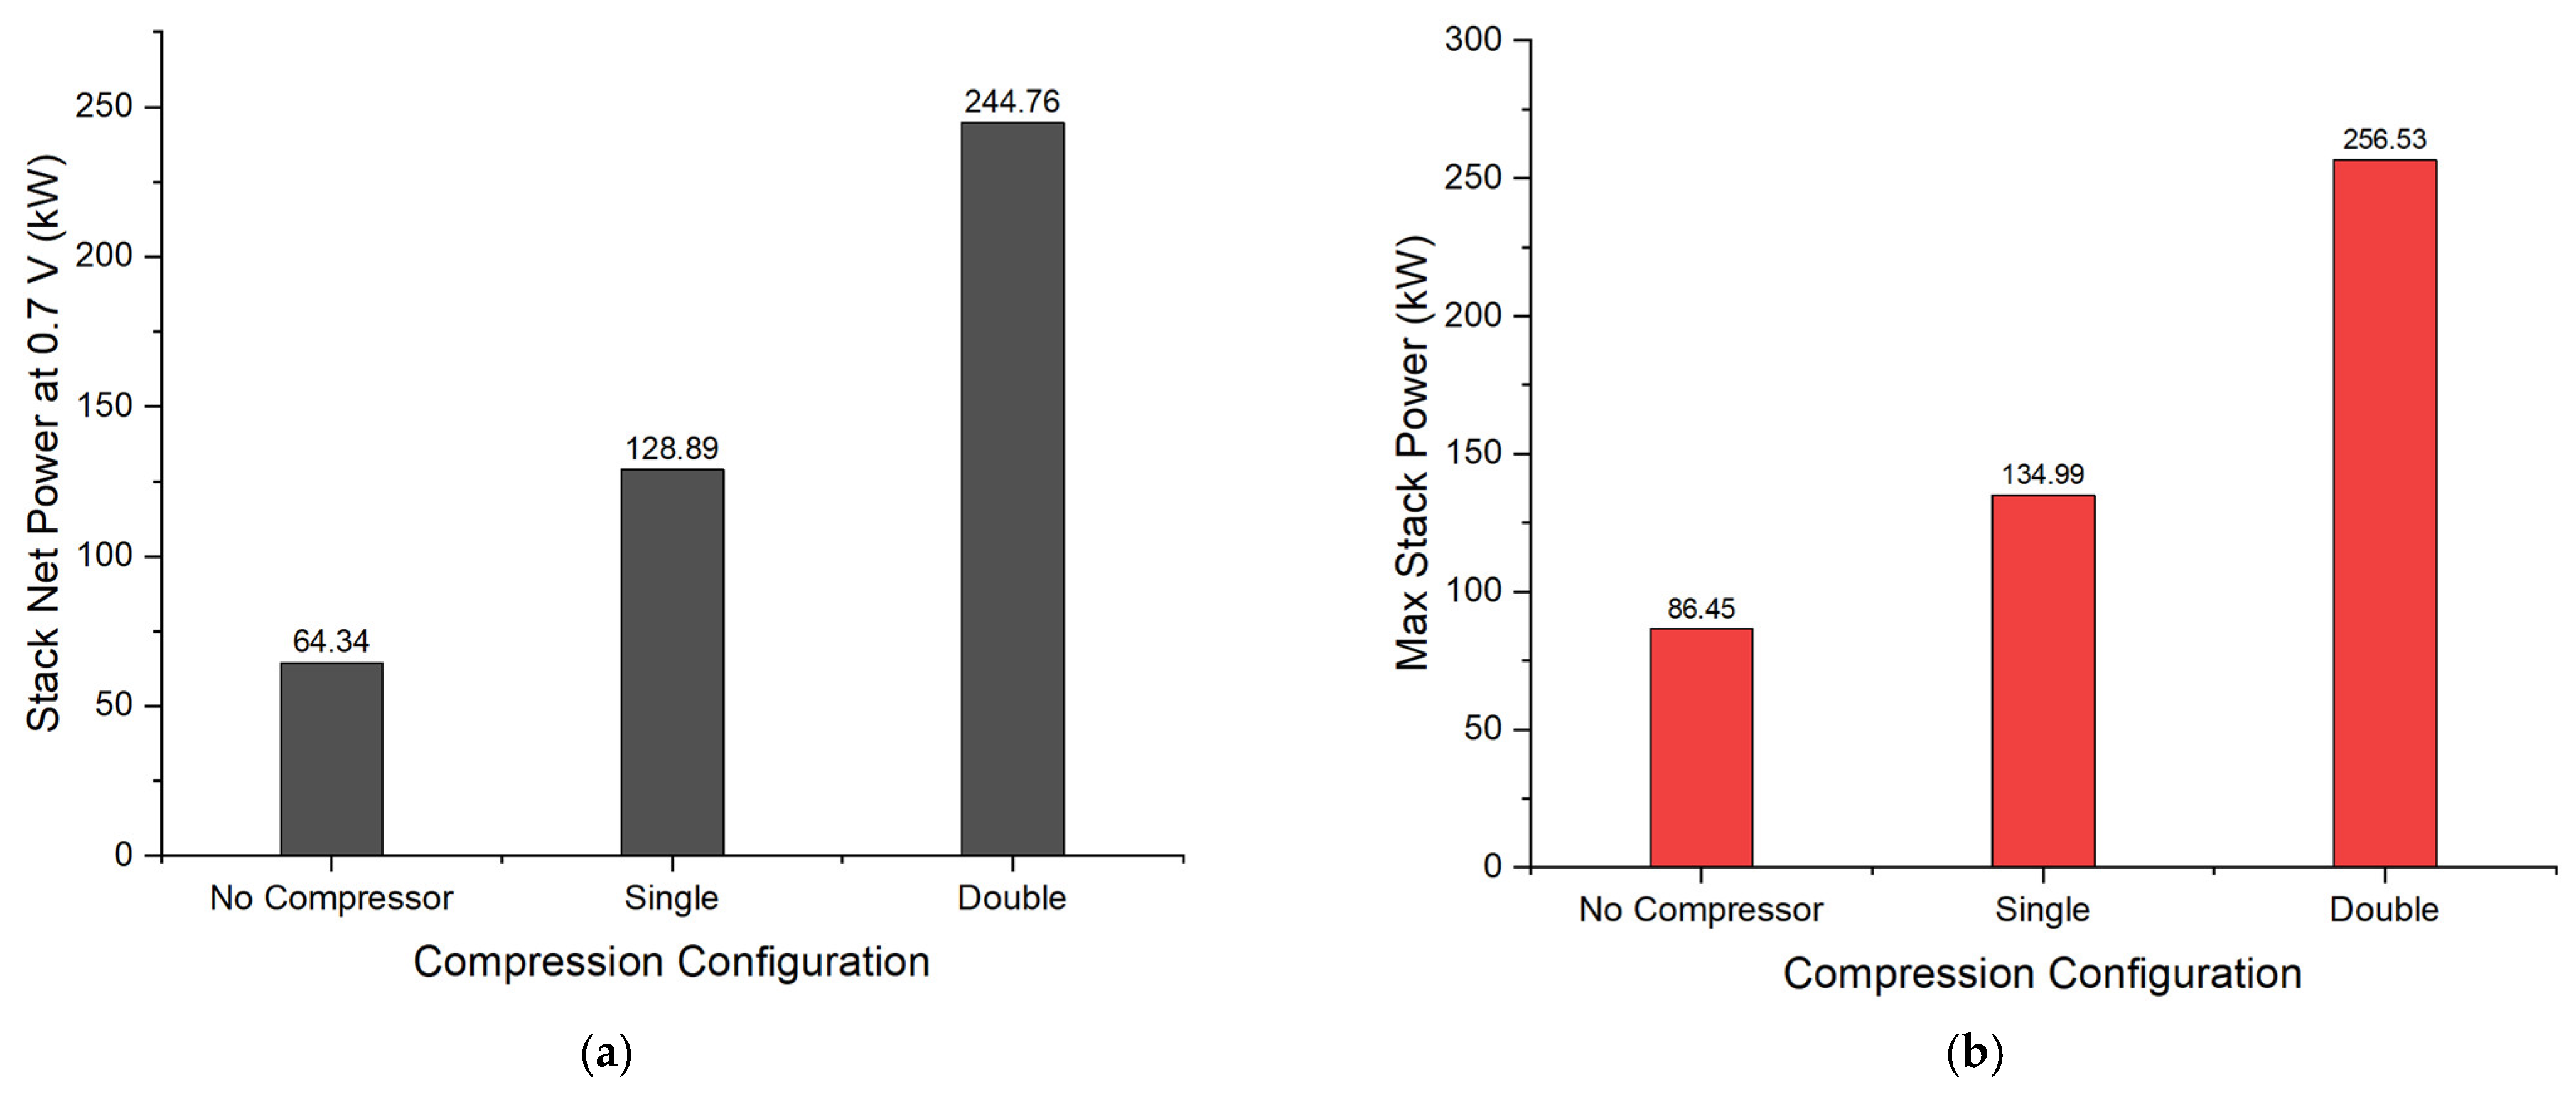
Comparison of net stack power under different compressor configurations: (a) net stack power at 0.7 V; (b) maximum net stack power.
Figure 8a shows the net stack output under cell voltage conditions of 0.7 V. In the absence of a compressor, the parasitic power consumption required for air compression is not reached, so the net output is equal to the gross stack output. The net output was found to be 128.89 kW in the single-stage-compressor system, while it increased to 244.76 kW in the double-stage-compressor system. These values represent a decrease of 13.2% and 16.1%, respectively, relative to the gross stack output under each condition due to the compressor power consumption of the air supply system. Although the parasitic power loss was greater in the double-stage-compressor system, the net output was 115.87 kW higher than that of the single-stage-compressor system, showing an improvement of approximately 1.9 times. This indicates that the increase in gross stack output obtained by higher cathode pressure is sufficiently larger than the additional compressor power required for the double-stage compressor. In other words, the electrochemical performance gain obtained by improved oxygen availability, reduced activation loss, and alleviated concentration polarization remains dominant even after accounting for the parasitic power consumption of the compressor.
Figure 8b shows the net stack power at the maximum power condition. The net power is 86.45 kW in the no-compressor case, 134.99 kW in the single-stage-compressor case, and 256.53 kW in the double-stage-compressor case. Compared with the gross stack power, the net power decreases by 12.6% in the single-stage case and by 15.4% in the double-stage case because of the compressor power required by the air supply system. The double-stage system therefore has a larger parasitic power loss, but its net power is still 121.54 kW higher than that of the single-stage system, corresponding to an increase of about 1.9 times. A similar tendency is observed in the fixed-voltage case, indicating that the improvement obtained from the double-stage-compressor configuration is maintained even after compressor power consumption is considered. However, this does not mean that the double-stage system is always preferable, because the higher compressor power, outlet temperature, and additional component mass can affect the final system design.
3.4. PEMFC Stack Length Estimation Based on Net Power
The effect of compressor configuration on stack size was evaluated using the estimation method described in Section 2.6. Based on the required cell number and stack length relations, the stack size needed for the no-compressor and single-stage-compressor configurations to match the net performance of the double-stage-compressor configuration was calculated under both the 0.7 V operating condition and the maximum power condition. Table 5 shows the required number of cells for each configuration to achieve the same net power as the double-stage-compressor configuration, along with the corresponding increase in stack length.
Table 5.
Required cell number and stack length increase for each configuration to achieve the same net power as the double-stage-compressor case.
At the fixed 0.7 V condition, achieving the same net power as the double-stage-compressor case required 3462 cells for the no-compressor configuration and 1729 cells for the single-stage-compressor configuration. Compared with the reference 910-cell stack, these correspond to additional 2552 and 819 cells, resulting in stack length increases of 2105.4 mm and 675.68 mm, respectively. Under the maximum power condition, the no-compressor and single-stage-compressor configurations required 2701 and 1730 cells, corresponding to additional 1791 and 820 cells and stack length increases of 1477.58 mm and 676.5 mm, respectively.
These results indicate that reducing the compressor stage can lead to a substantial increase in the required stack size when the same net power is required. In particular, the no-compressor case requires a much larger increase in cell number and stack length than the single-stage-compressor case. From an aircraft integration perspective, this increase in stack size may make it more difficult to secure packaging space and may also be disadvantageous in terms of system mass and layout design.
3.5. System-Specific Power Estimation
The system-specific power of the PEMFC system was estimated for each air compression configuration by considering the masses of the PEMFC stack, compressor, and intercooler. In this analysis, the system-specific power was compared under both identical-stack and equal-net-power conditions to evaluate the mass-based performance from different system-size perspectives. The compressor and intercooler specifications used in this study are summarized in Table 6 and Table 7, respectively.
Table 6.
Specifications of ROTREX EK40C [34].
Table 7.
Specifications of Rangsons Aerospace intercooler [35].
3.5.1. System-Specific Power Under Identical Stack Conditions
For the identical-stack comparison, the total system mass was calculated by considering the PEMFC stack, compressor, and intercooler masses, as summarized in Table 8. The stack mass was fixed at 88.2 kg for all configurations based on the ZeroAvia ZA600 specifications listed in Table 1. The single-stage configuration used one Rotrex EK40C compressor (Copenhagen, Denmark) with a mass of 32.8 kg, while the double-stage configuration used two identical compressor units, giving a compressor mass of 65.6 kg. The intercooler mass of 5.5 kg was only included for the double-stage configuration. Based on these component masses, the system-specific power was calculated, as shown in Figure 9.
Table 8.
Component and total masses for each compressor configuration under identical stack conditions.
Figure 9.
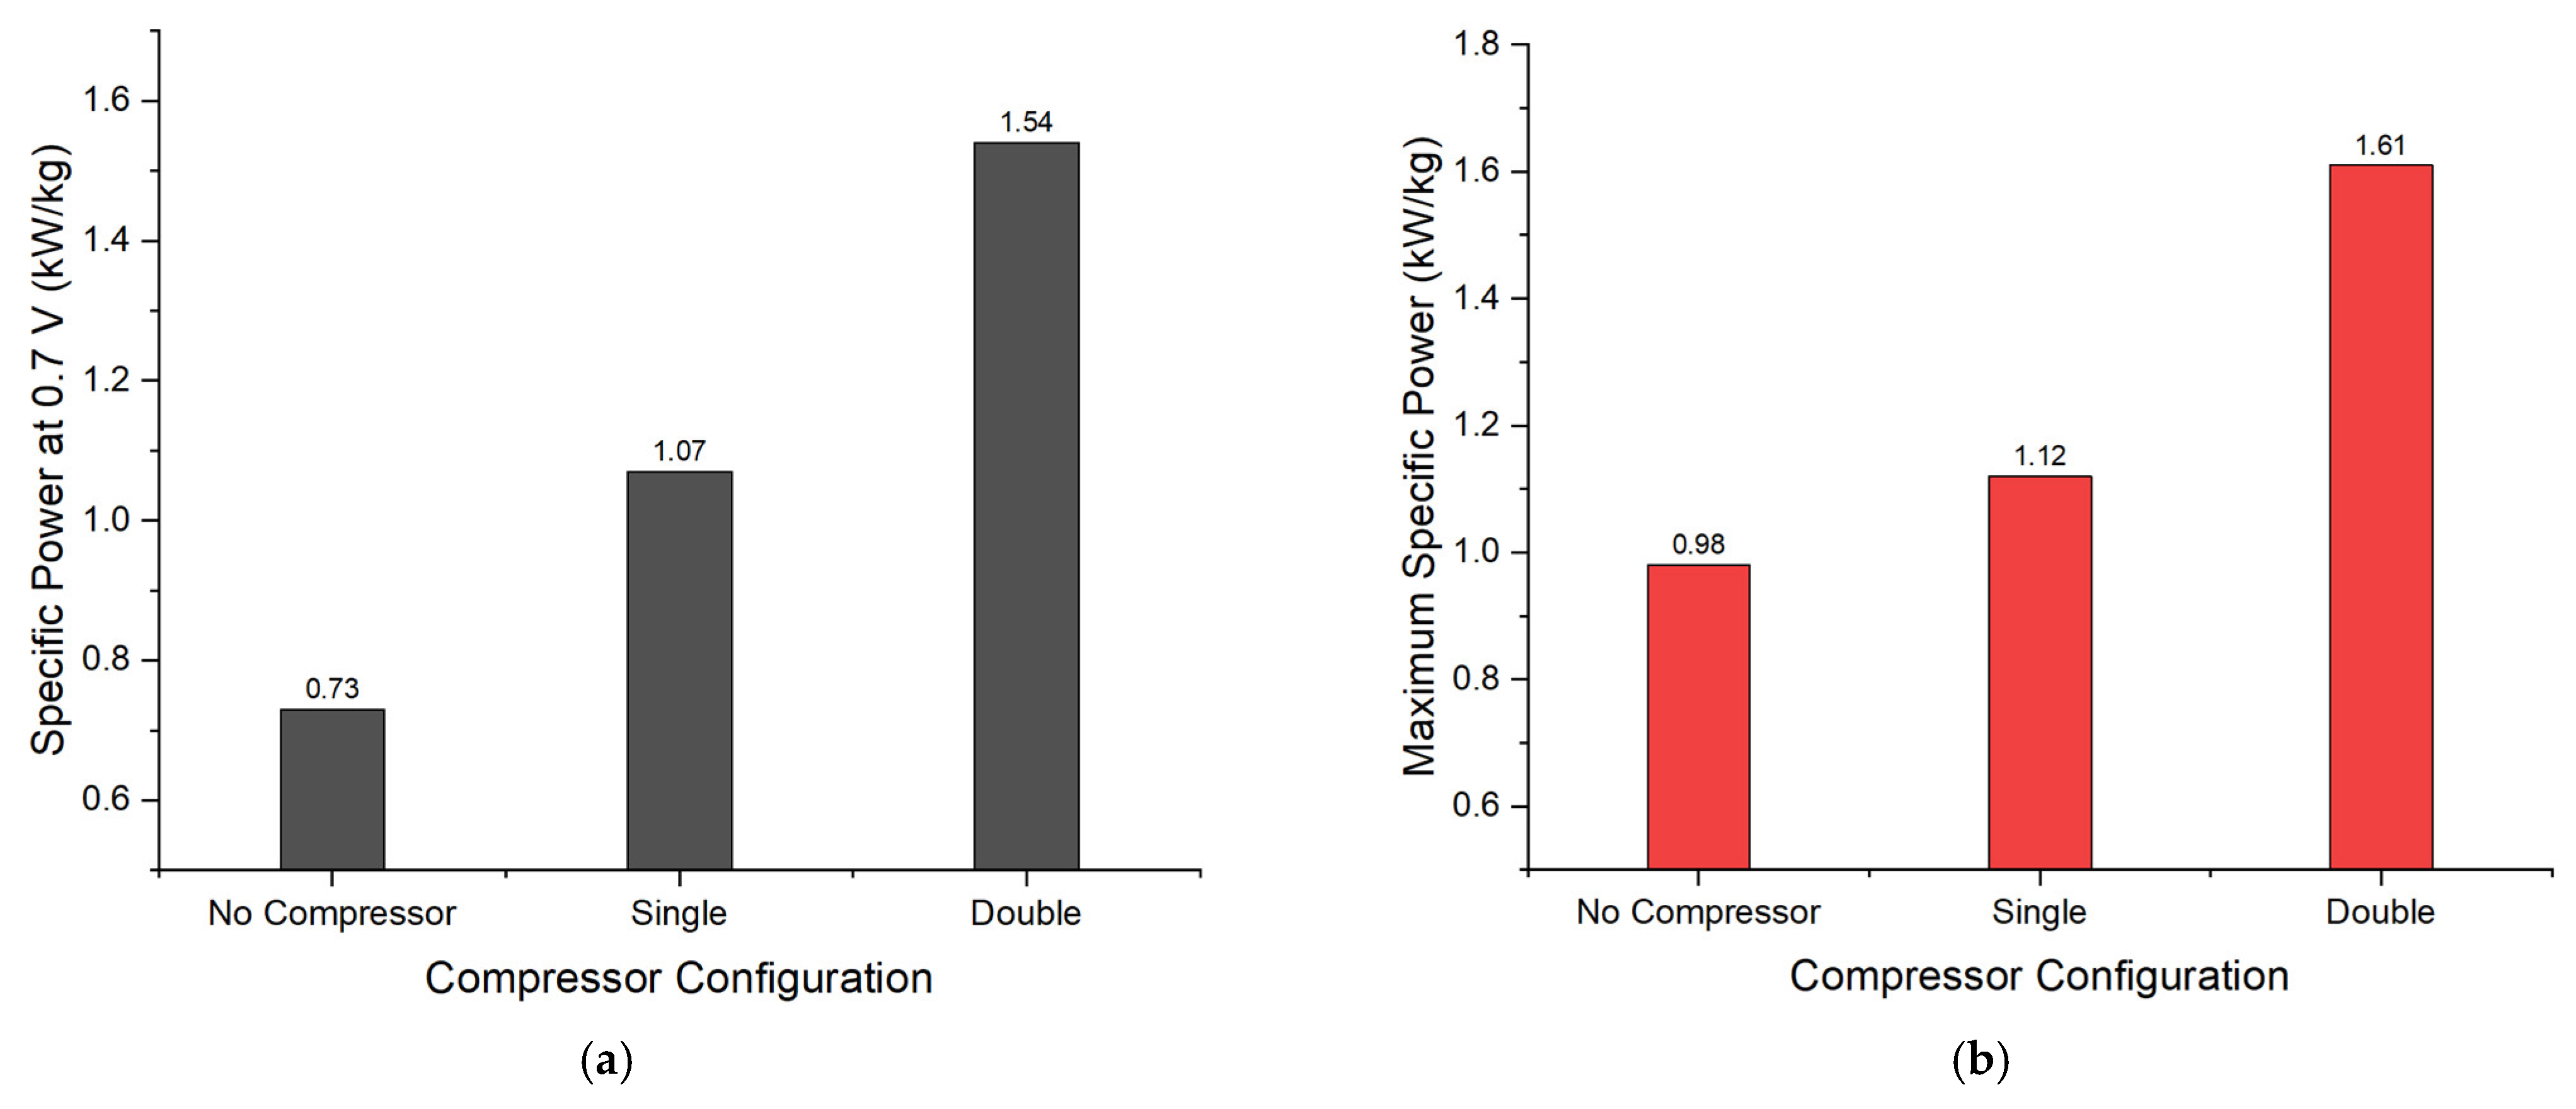
Comparison of system-specific power under identical stack conditions: (a) fixed 0.7 V condition; (b) maximum power condition.
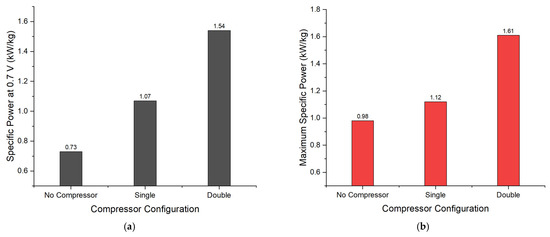
Figure 9a shows the system-specific power at a fixed cell voltage of 0.7 V. The system-specific power was calculated to be 0.73, 1.07, and 1.54 kW/kg for the no-compressor, single-stage, and double-stage configurations, respectively. Although the double-stage configuration has the largest total system mass due to the additional compressor and intercooler, it still provides the highest system-specific power. Compared with the single-stage configuration, the double-stage configuration increases the net stack power by approximately 1.90 times, whereas the system-specific power increases by approximately 1.44 times. The increase in system specific output is smaller than the increase in net stack output due to the additional mass of the second compressor and intercooler. Nevertheless, the double-stage configuration still shows a higher system-specific power than the single-stage configuration, indicating that the increase in net stack power obtained with higher cathode pressure is greater than the mass penalty of the air supply system.
Figure 9b shows the maximum system-specific power for each compressor configuration. The calculated values were 0.98 kW/kg for the no-compressor case, 1.12 kW/kg for the single-stage-compressor case, and 1.61 kW/kg for the double-stage-compressor case. The double-stage-compressor configuration shows the highest value, even though it includes the additional mass of the second compressor and intercooler. This result indicates that the increase in net stack power obtained under the maximum power condition is large enough to offset the mass penalty of the additional air supply components.
Overall, under the identical-stack condition, the double-stage-compressor configuration provides the most favorable mass-based performance among the three configurations. Although it increases compressor power, outlet temperature, and system mass, the higher overall air compression ratio improves oxygen availability at the cathode, expands the operating current density range, and increases the net stack power.
3.5.2. System-Specific Power Under Equal-Net-Power Conditions
For the equal-net-power comparison, the stack mass was recalculated using the required number of cells listed in Table 5. The mass per cell was estimated as 0.0969 kg/cell based on the reference stack mass of 88.2 kg and 910 cells. The estimated masses of the PEMFC stack and air supply system components under the 0.7 V and maximum power conditions are summarized in Table 9 and Table 10, respectively. Using these estimated masses, the system-specific power under the equal-net-power condition was calculated, and the results are presented in Figure 10.
Table 9.
Estimated component and total masses for each compressor configuration under the equal-net-power condition at 0.7 V.
Table 10.
Estimated component and total masses for each compressor configuration under the equal-net-power condition at maximum power.
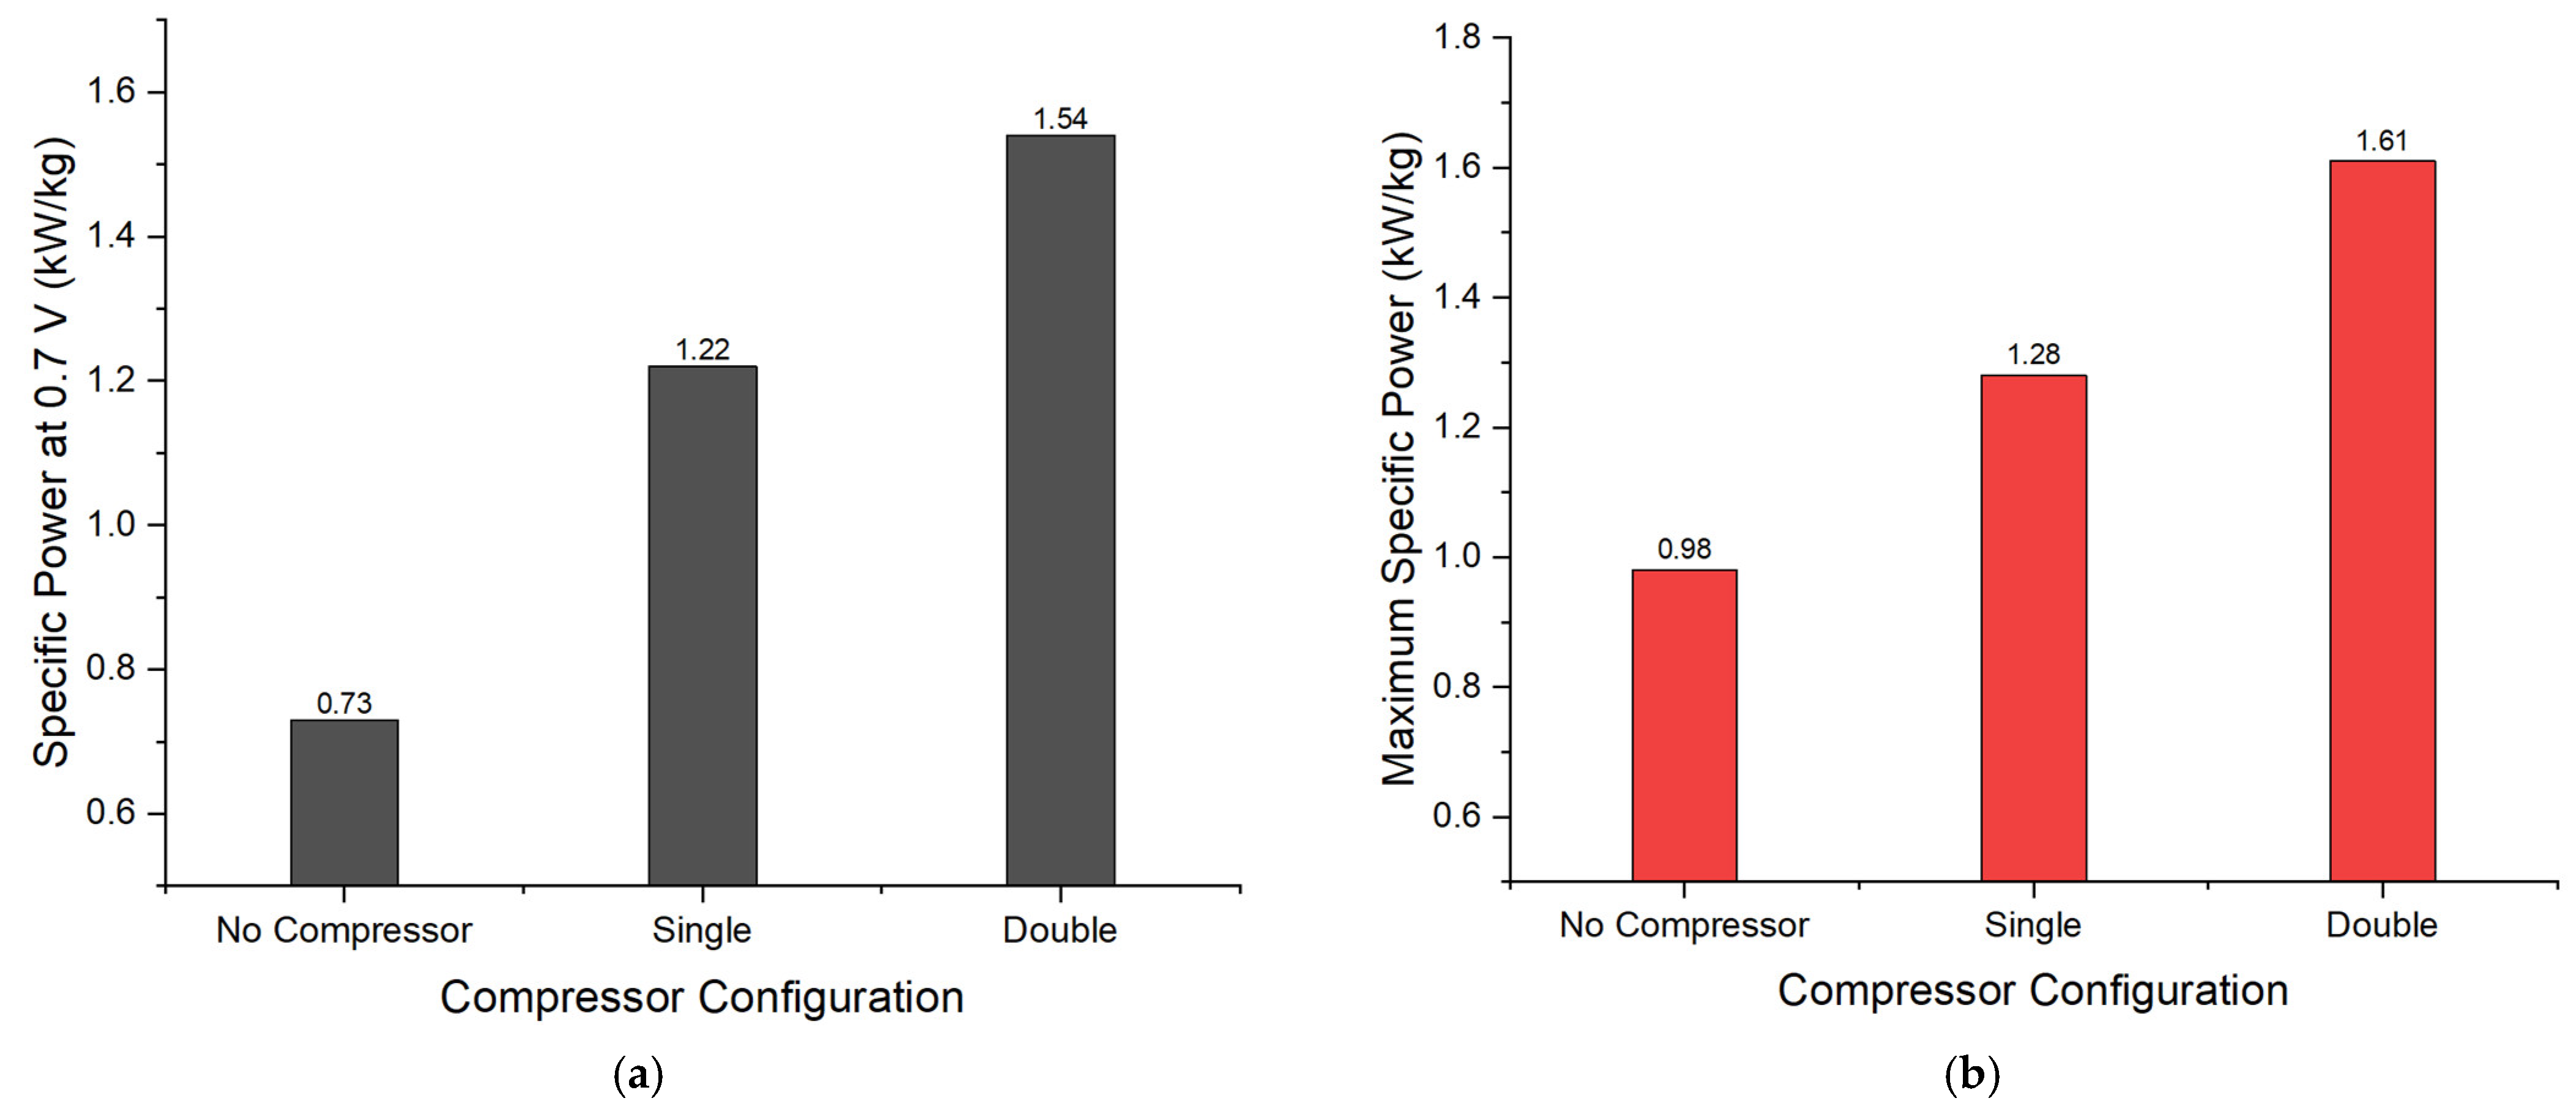
Figure 10.
Comparison of system-specific power under equal-net-power conditions: (a) fixed 0.7 V condition; (b) maximum power condition.
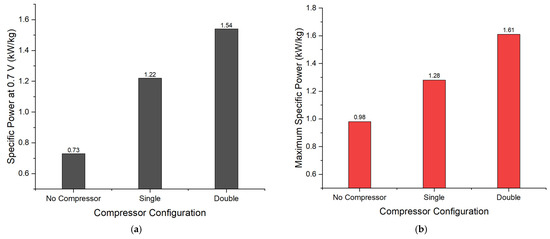
Figure 10a shows the system-specific power at the fixed 0.7 V condition. The system-specific power was calculated to be 0.73, 1.22, and 1.54 kW/kg for the no-compressor, single-stage-compressor, and double-stage-compressor configurations, respectively. Figure 10b shows the system-specific power under the maximum power condition. The corresponding values were 0.98, 1.28, and 1.61 kW/kg, respectively. In both operating conditions, the double-stage-compressor configuration showed the highest system-specific power.
Compared with the identical-stack condition, the system-specific power of the double-stage-compressor configuration remains unchanged because it was used as the reference case for the equal-net-power comparison. The no-compressor case also shows little change in system-specific power because both the net power and stack mass increase in proportion to the number of cells. In contrast, the system-specific power of the single-stage-compressor configuration increases under equal-net-power conditions. This is because the number of stack cells was increased to match the target net power, while the compressor mass remained unchanged. Therefore, as the overall system scale increased, the fraction of the fixed compressor mass in the total system mass decreased, resulting in improved system-specific power.
Even under equal-net-power conditions, the double-stage-compressor configuration still provides the most favorable mass-based performance. This result indicates that the higher net power obtained by increased cathode pressure is sufficient to compensate for the additional mass of the second compressor and intercooler. Therefore, the double-stage-compressor configuration is considered more suitable for aviation PEMFC applications, where both high net power and high system-specific power are important.
4. Conclusions
To investigate the effect of reduced ambient pressure on the performance of aviation PEMFC systems, this study evaluated the output characteristics and system-specific power of a PEMFC air supply system at the service ceiling of the Dornier 228 selected as the reference aircraft, namely 25,000 ft. To evaluate both the performance improvement and system penalties associated with different air supply strategies under high-altitude conditions, three configurations were compared: no compressor, single-stage compressor, and double-stage compressor. In particular, the electrochemical performance improvement of the PEMFC caused by increased cathode pressure and the additional power consumption and mass increase resulting from compressor implementation were considered simultaneously. For this purpose, the PEMFC voltage characteristics, stack output, compressor power consumption, required stack size, and system-specific power were analyzed. The main findings are summarized as follows:
- A higher air compression ratio improved PEMFC performance, but this improvement was mainly attributed to the reduction in activation and concentration losses rather than the direct increase in reversible voltage. This improvement is attributed to enhanced cathode reaction kinetics and mass transport characteristics, caused by the increase in oxygen partial pressure.
- The polarization and power density analyses showed that the double-stage-compressor configuration provided the widest operating range and the highest power density. This was because the increase in cathode pressure improved oxygen transport characteristics and increased the limiting current density, thereby alleviating concentration loss in the high-current-density region.
- The double-stage-compressor configuration increased both the compressor outlet temperature and compressor power consumption. Therefore, intercooling was required to maintain an appropriate temperature for the air entering the PEMFC stack. Since a ram-air-based air-cooled intercooler was utilized in this study, the intercooler cooling load was treated as a heat rejection requirement rather than additional auxiliary power.
- Even after subtracting compressor power from the gross stack power, the double-stage-compressor configuration showed the highest net stack power. This is considered to be because the stack output improvement caused by the increase in oxygen partial pressure was greater than the additional parasitic power required for air compression.
- When the no-compressor and single-stage-compressor configurations were resized to achieve the same net performance as the double-stage-compressor configuration, much larger stacks were required. This suggests that reducing or eliminating air compression may lower compressor-related penalties, but can also increase the required cell number, stack length, packaging volume, and system mass.
- The advantage of the double-stage-compressor configuration was also confirmed in the system-specific power analysis. Although this configuration showed the largest increase in system mass due to the additional compressor and intercooler, its higher net output compensated for the effect of the increased mass.
Under the operating conditions considered in this study, the double-stage-compressor configuration showed the best performance in terms of stack performance, net output, and system-specific power. Therefore, the double-stage-compressor configuration can be considered an effective air supply strategy for improving PEMFC performance under low-pressure conditions. In addition, this study quantitatively compared the system-level trade-off between the performance improvement achieved by cathode pressurization and the penalties associated with compressor power consumption, stack-size variation, and additional component mass. These results indicate that, when evaluating air supply strategies for high-altitude aviation PEMFC systems, compressor parasitic power, oxygen supply capability, required stack size, and mass-based system performance should be considered together. However, for practical application in aviation PEMFC systems, intercooler requirements, thermal management burden, pressure losses, and component integration within the aircraft should be further considered.
Based on the present results, future work will extend the analysis to more realistic aircraft operating conditions. In particular, the dynamic response of the air supply system will be evaluated under variations in altitude and power demand. A detailed design of the ram-air-based intercooler will also be developed by considering heat exchange performance, pressure loss, ducting effects, and installation constraints. In addition, the system-level mass analysis will be expanded to include auxiliary components such as piping, ducts, and heat exchanger hardware. Experimental verification under simulated altitude conditions is also planned to further assess the applicability of the proposed air supply strategy.
Author Contributions
Conceptualization, J.J. and S.-G.K.; methodology, J.J. and S.-G.K.; validation, J.J.; formal analysis, J.J.; investigation, J.J.; resources, S.-G.K.; data curation, J.J.; writing—original draft preparation, J.J.; writing—review and editing, J.J.; visualization, J.J.; supervision, S.-G.K.; project administration, S.-G.K.; funding acquisition, S.-G.K. All authors have read and agreed to the published version of the manuscript.
Funding
This research was supported by the Gyeonggi-do Regional Research Center (GRRC) program funded by Gyeonggi Province (GRRC Korea Aerospace University 2023-B04).
Data Availability Statement
The data presented in this study are available in the article.
Conflicts of Interest
The authors declare no conflicts of interest.
References
- International Civil Aviation Organization (ICAO). Long-Term Aspirational Goal (LTAG) for International Aviation. Available online: https://www.icao.int/environmental-protection/LTAG (accessed on 26 March 2026).
- Adler, E.J.; Martins, J.R.R.A. Hydrogen-powered aircraft: Fundamental concepts, key technologies, and environmental impacts. Prog. Aerosp. Sci. 2023, 141, 100922. [Google Scholar] [CrossRef] [Scilit]
- Soleymani, M.; Mostafavi, V.; Hebert, M.; Kelouwani, S.; Boulon, L. Hydrogen propulsion systems for aircraft: A review on recent advances and ongoing challenges. Int. J. Hydrogen Energy 2024, 91, 137–171. [Google Scholar] [CrossRef] [Scilit]
- Kazula, S.; Klöckner, C.; Stathopoulos, P.; Isikveren, A.T.; Hornung, M. Review of fuel cell technologies and evaluation of their potential and challenges for electrified propulsion systems in commercial aviation. J. Glob. Power Propuls. Soc. 2023, 7, 158036. [Google Scholar] [CrossRef] [Scilit]
- Liu, Z.; Zhou, Q.; Sun, P.; Xu, S. A Multitask Learning Framework with LSTM-TPA for Dynamic Modeling of Automotive Fuel Cell Systems. IEEE Trans. Transp. Electrif. 2026, 12, 1532–1542. [Google Scholar] [CrossRef] [Scilit]
- Dong, Y.; Wang, W.; Cao, Y.; Cao, M.; Zhou, X.; Hou, X. An improved data-driven approach and a voltage integral indicator for remaining useful life estimation of proton exchange membrane fuel cells. J. Power Sources 2025, 640, 236726. [Google Scholar] [CrossRef] [Scilit]
- Campanari, S.; Manzolini, G.; Beretti, A.; Wollrab, U. Performance assessment of turbocharged PEM fuel cell systems for civil aircraft onboard power production. J. Eng. Gas Turbines Power 2008, 130, 021701. [Google Scholar] [CrossRef] [Scilit]
- Schröter, J.; Graf, T.; Frank, D.; Bauer, C.; Kallo, J.; Willich, C. Influence of pressure losses on compressor performance in a pressurized fuel cell air supply system for airplane applications. Int. J. Hydrogen Energy 2021, 46, 21151–21159. [Google Scholar] [CrossRef] [Scilit]
- Wu, Y.; Bao, H.; Fu, J.; Wang, X.; Liu, J. Review of recent developments in fuel cell centrifugal air compressor: Comprehensive performance and testing techniques. Int. J. Hydrogen Energy 2023, 48, 32039–32055. [Google Scholar] [CrossRef] [Scilit]
- ZeroAvia Makes Aviation History, Flying World’s Largest Zero-Emission Aircraft. Available online: https://zeroavia.com/do228-first-flight/ (accessed on 26 March 2026).
- Joby Subsidiary H2FLY Completes World’s First Piloted Flight of Liquid Hydrogen-Powered Electric Aircraft. Available online: https://www.jobyaviation.com/news/joby-subsidiary-h2fly-completes-worlds-first-piloted-flight-of-liquid-hydrogen-powered-electric-aircraft (accessed on 26 March 2026).
- Airbus ZEROe: Our Hydrogen-Powered Aircraft. Available online: https://www.airbus.com/en/innovation/energy-transition/hydrogen/zeroe-our-hydrogen-powered-aircraft (accessed on 26 March 2026).
- Hordé, T.; Achard, P.; Metkemeijer, R. PEMFC application for aviation: Experimental and numerical study of sensitivity to altitude. Int. J. Hydrogen Energy 2012, 37, 10818–10829. [Google Scholar] [CrossRef] [Scilit]
- Zhang, Y.; Hu, Z.; Xu, L.; Liu, H.; Ye, K.; Li, J.; Ouyang, M. Fuel cell system for aviation applications: Modeling, parameter sensitivity, and control. Energy Convers. Manag. 2024, 312, 118555. [Google Scholar] [CrossRef] [Scilit]
- Liu, Y.; Chen, M.; Lei, J.; He, S.; Zhou, J.; Liu, Y. Modeling and performance optimization of a two-stage centrifugal air compressor for high-power water-cooled fuel cell in plateau environments. Therm. Sci. Eng. Prog. 2025, 68, 103473. [Google Scholar] [CrossRef] [Scilit]
- Guo, Y.; Yang, X.; He, L.; Ju, Q.; Hou, Y.; Chen, S. Experimental study on expanding the efficient operating range of two-stage series high-speed centrifugal air compressors. Case Stud. Therm. Eng. 2025, 75, 107144. [Google Scholar] [CrossRef] [Scilit]
- Hu, D.; Liu, J.; Yi, F.; Yang, Q.; Zhou, J. Enhancing heat dissipation to improve efficiency of two-stage electric air compressor for fuel cell vehicle. Energy Convers. Manag. 2022, 251, 115007. [Google Scholar] [CrossRef] [Scilit]
- Wang, W.; Yang, D.; Guo, L.; Wu, R.; Zhou, X.; Zhang, Q.; Kong, Q.; Hu, L. Enhancement of the operating range of a two-stage compressor for fuel cell vehicles by adopting a leading-edge inclination angle impeller. J. Mech. Sci. Technol. 2026, 40, 1155–1170. [Google Scholar] [CrossRef] [Scilit]
- Flight Testing. Available online: https://zeroavia.com/flight-testing/ (accessed on 31 March 2026).
- Chen, H.; Liu, Z.; Ye, X.; Yi, L.; Xu, S.; Zhang, T. Air flow and pressure optimization for air supply in proton exchange membrane fuel cell system. Energy 2022, 238, 121949. [Google Scholar] [CrossRef] [Scilit]
- Datta, A. PEM Fuel Cell Model for Conceptual Design of Hydrogen eVTOL Aircraft; NASA/CR-20210000284; NASA Ames Research Center: Moffett Field, CA, USA, 2021.
- Zhao, X. Aero Engine Intercooling: Conceptual Design and Experimental Validation of an Aero Engine Intercooler. Ph.D. Thesis, Chalmers University of Technology, Gothenburg, Sweden, 2016. [Google Scholar]
- ISO 2533:1975; ISO Standard Atmosphere. International Organization for Standardization: Geneva, Switzerland, 1975.
- Haji, S. Analytical modeling of PEM fuel cell i–V curve. Renew. Energy 2011, 36, 451–458. [Google Scholar] [CrossRef] [Scilit]
- O’Hayre, R.; Cha, S.W.; Colella, W.G.; Prinz, F.B. Fuel Cell Fundamentals, 3rd ed.; Wiley: Hoboken, NJ, USA, 2016. [Google Scholar]
- Pratt, J.W.; Brouwer, J.; Samuelsen, G.S. Performance of proton exchange membrane fuel cell at high-altitude conditions. J. Propuls. Power 2007, 23, 313–319. [Google Scholar] [CrossRef] [Scilit]
- Qin, Y.; Du, Q.; Fan, M.; Chang, Y.; Yin, Y. Study on the operating pressure effect on the performance of a proton exchange membrane fuel cell power system. Energy Convers. Manag. 2017, 142, 357–365. [Google Scholar] [CrossRef] [Scilit]
- Markiewicz, M.; Zalitis, C.; Kucernak, A. Performance measurements and modelling of the ORR on fuel cell electrocatalysts—The modified double trap model. Electrochim. Acta 2015, 179, 126–136. [Google Scholar] [CrossRef] [Scilit]
- Chen, Z.; Huang, H.; Shi, T.; Peng, X.; Feng, J. Efficiency improvement and thermo-economic analysis of proton exchange membrane fuel cell system with energy recovery for both air and hydrogen. Appl. Therm. Eng. 2023, 233, 121114. [Google Scholar] [CrossRef] [Scilit]
- Çengel, Y.A.; Boles, M.A.; Kanoğlu, M. Thermodynamics: An Engineering Approach, 9th ed.; McGraw-Hill Education: New York, NY, USA, 2018. [Google Scholar]
- Acar, M.C.; Korkmaz, H.G.; Toros, S.; Müller, M. Investigation and evaluation of formability of thin metallic bipolar plates by stamping process. Int. J. Hydrogen Energy 2025, 99, 203–211. [Google Scholar] [CrossRef] [Scilit]
- Tian, C.; Yuan, F.; Deng, T.; He, Q.; Hu, C.; Chen, Y.; Liu, W. Coupled optimization of auxiliary channels and porosity gradient of GDL for PEMFC. Energy 2024, 301, 131734. [Google Scholar] [CrossRef] [Scilit]
- Sharma, P.; Pandey, O.P. Proton Exchange Membrane Fuel Cells: Fundamentals, Advanced Technologies, and Practical Applications. In PEM Fuel Cells; Elsevier: Amsterdam, The Netherlands, 2022. [Google Scholar]
- Rotrex A/S. EK40 Technical Datasheet: 40 kW Fuel Cell Air Compressor, Rev. 1.10. Available online: https://rotrex-fuel-cell-compressor.com/wp-content/uploads/2024/11/Rotrex-Technical-Datasheet-EK40-Rev1.10.pdf (accessed on 1 May 2026).
- Rangsons Aerospace Private Limited. Thermal Management—Heat Exchanger, POD Cooling & Cold Plates. Available online: https://rangsonsaerospace.com/heat-exchanger-pod-cooling-cold-plates/ (accessed on 1 May 2026).

Disclaimer/Publisher’s Note: The statements, opinions and data contained in all publications are solely those of the individual author(s) and contributor(s) and not of MDPI and/or the editor(s). MDPI and/or the editor(s) disclaim responsibility for any injury to people or property resulting from any ideas, methods, instructions or products referred to in the content. |
© 2026 by the authors. Licensee MDPI, Basel, Switzerland. This article is an open access article distributed under the terms and conditions of the Creative Commons Attribution (CC BY) license.