


Abstract
Hydrogen refueling protocols such as SAE J2601 are designed to limit the temperature rise of hydrogen within the storage tank during refueling. However, the temperature distribution inside the tank is inherently non-uniform, and resulting thermal stratification may cause local temperatures to exceed prescribed limits when the protocol is applied based solely on measurements from a single thermocouple. Therefore, it is very important to estimate the maximum temperature behavior inside the tank during the filling process. A total of 64 CFD simulations are carried out to investigate the effect of the spatial temperature inhomogeneity. The results reveal that the temperature limit (<85 °C) imposed by SAE J2601 is satisfied even by the maximum temperatures in all the 64 cases. However, in some cases for the largest tank (10 kg) filling, it is found that the mass flow rate limit (<60 g/s) is exceeded at low initial pressure conditions. Mass flow rates of 75 g/s or more are calculated under conditions of 25 °C or lower. The increased mass flow rate is understood as the effect of assumption that the pressure drop from a hydrogen refueling station to the inlet of an on-board tank is neglected.
1. Introduction
Fuel cell electric vehicles (FCEVs) utilize electricity generated through electrochemical reactions between oxygen and compressed hydrogen stored in on-board tanks. As they emit no tailpipe greenhouse gases and produce only pure water as a byproduct, FCEVs have emerged as a promising alternative to internal combustion engine vehicles (ICEVs). Reflecting this potential, the Government of South Korea has designated hydrogen energy as one of the central pillars of its national decarbonization and economic strategy.
FCEVs are expected to provide consumers with a driving range and refueling experience comparable to those of internal combustion engine vehicles (ICEVs) [1]. Regarding driving range, most commercially available FCEVs have already achieved performance levels similar to ICEVs. Current light-duty passenger FCEVs typically offer driving distances exceeding 500 km when the on-board hydrogen tanks are fully charged to 70 MPa [2]. However, meeting the target refueling time of approximately 3–5 min for light-duty vehicles remains technically challenging. Several engineering constraints such as limitations in hydrogen pre-cooling, nozzle flow rates, and station compressor capacities continue to hinder further reductions in refueling duration, underscoring the need for continued technological advancement in hydrogen refueling infrastructure.
Most commercial FCEVs employ compressed gaseous hydrogen storage at nominal pressure levels of 35 MPa or 70 MPa [3,4], as modern high-pressure tanks provide an effective balance between cost, gravimetric efficiency, and structural robustness. In such systems, two types of internal liners are commonly used: metal liners in Type III tanks and polymer liners in Type IV tanks [5]. During rapid refueling, the compression of hydrogen into on-board tanks leads to a substantial temperature increase in the gas, which consequently elevates the temperature of the tank structure. The safety of fully wrapped composite tanks (Types III and IV), which represent the predominant technology for compressed hydrogen storage in mobility applications [6], is maintained only within specified thermal limits, as excessive temperatures can compromise liner integrity, resin performance, and overall mechanical stability. Therefore, international standards such as ISO/TS 15869:2009 [7] stipulate that the average hydrogen temperature during refueling must not exceed 85 °C for both Type III and Type IV tanks to ensure safe operation. Additional requirements regarding localized temperature limits and allowable pressure ramp rates are also enforced in practice to further mitigate thermal stress during fast filling.
Hydrogen refueling protocols have been developed to ensure that on-board storage tanks remain within their allowable pressure and temperature limits during the filling process. These protocols define standardized procedures that hydrogen refueling stations must follow to safely and efficiently deliver compressed hydrogen to vehicles. Among them, SAE J2601 [8], which was established by the Society of Automotive Engineers (SAE) for light-duty gaseous hydrogen fueling, has become the globally recognized benchmark standard. In South Korea, regulatory authorities are considering the formal adoption of SAE J2601, or modified variants thereof, for evaluating the performance and safety compliance of domestic HRSs. The increased reliance on standardized fueling protocols underscores the importance of consistent station operation, interoperability across vehicle platforms, and reliable fast fill performance in support of the expanding hydrogen mobility ecosystem.
SAE J2601 was developed to enable hydrogen refueling stations to deliver approximately 5–10 kg of hydrogen to FCEVs within a target duration of 3–5 min [8]. The standard was established based on a thermodynamic modeling approach, and its applicability and reliability have been validated through a series of controlled experiments [9]. In general, two main categories of models have been employed to investigate the evolution of hydrogen temperature inside on-board storage tanks during fast filling: analytical thermodynamic models and computational fluid dynamics (CFD) models. Numerous thermodynamic models [10,11,12] grounded in fundamental physical principles have been proposed to analyze the thermal and volumetric property variations of hydrogen under high-pressure filling. These models typically incorporate mass and energy conservation equations coupled with a real gas equation of state [13,14,15] and an appropriate heat transfer formulation [16,17], forming the core analytical framework. Recently, Kuroki et al. [18] expanded the scope of thermodynamic modeling by accounting for the influence of the entire fueling line, and developed an integrated model capable of predicting temperature, pressure, and mass flow behavior from the breakaway to the on-board tank. Thermodynamic models can also be directly applied to simulate the blow down or emptying process of compressed hydrogen tanks [19,20] without significant modifications. These models provide spatially averaged gas temperatures and tank wall surface averaged temperatures with relatively low computational cost.
In contrast, CFD models [21,22,23,24,25] have been employed to capture detailed flow behavior and non-uniform temperature distributions within the tanks. These models solve the Navier–Stokes equations alongside mass and energy balance equations to account for complex fluid dynamic and thermal phenomena. To ensure physically realistic predictions, turbulence models [26,27,28], as well as real gas and heat transfer models, must be incorporated. Owing to the iterative nature of their numerical solution schemes, CFD simulations require significantly greater computational time and resources than thermodynamic models.
Experimental studies employing multiple internal sensors in both Type III and Type IV tanks have demonstrated that the gas temperature within the tank is inherently non-uniform during fast refueling, and that the peak temperature rise is strongly influenced by parameters such as mass filling rate, initial tank pressure, and ambient temperature [29,30,31,32]. In the case of Type IV tanks, temperature differences of up to 28 °C have been reported in experimental measurements [33,34]. For Type III tanks, the high thermal conductivity of the metal liner facilitates rapid temperature equalization shortly after the end of the filling process, resulting in the internal gas temperature becoming nearly uniform. In contrast, Type IV tanks exhibit persistent temperature stratification due to the low thermal conductivity of the polymer liner. As a result, the maximum local gas temperature may exceed the safety limit of 85 °C even when the average tank temperature remains within acceptable bounds, imposing concentrated thermal loads on the tank wall materials and potentially accelerating material degradation.
A substantial body of research on CFD-based modeling has demonstrated that such models serve as a valuable tool for predicting spatially resolved temperature distributions within on-board hydrogen storage tanks during fast refueling. For Type III tanks, numerous studies have applied CFD simulations to analyze hydrogen filling processes; however, most investigations have been limited to final pressures up to 35 MPa [23,35,36,37,38,39]. CFD-based studies on hydrogen tank refueling consistently investigate thermal and flow characteristics under high-pressure fast-filling conditions, highlighting the influence of real gas effects, turbulence modeling, and heat transfer coupling on temperature rise and distribution [23,35,39]. In addition, variations in tank materials, geometric simplifications, and validation approaches demonstrate their impact on predicting temperature and pressure evolution during refueling [36,38]. Furthermore, optimization of refueling strategies, including pressure ramping and pre-cooling, shows significant potential in mitigating maximum temperature rise and improving overall filling efficiency [37]. CFD models have also been employed for Type IV tanks under both low-pressure conditions (< 35 MPa) [40] and high-pressure fast fills approaching 70 MPa [22,37,41,42,43]. The investigations emphasize the importance of accurately capturing thermal behavior under fast-filling conditions, with comparisons between 1D, reduced-order, and full 3D models highlighting trade-offs between computational efficiency and prediction accuracy, particularly for temperature evolution and wall heat transfer [40,42,43]. Several studies further demonstrate that operating parameters such as pressure ramp rate, pre-cooling conditions, and initial tank temperature significantly influence the maximum gas temperature, state of charge, and overall thermal response during refueling [22,41,44]. Moreover, optimized refueling strategies, including partial pre-cooling and controlled pressure profiles, have been shown to effectively reduce peak temperatures while minimizing energy consumption [37]. Nevertheless, existing CFD studies for both tank types have largely focused on replicating the specific experimental setups of individual research groups. Consequently, modeling efforts have generally addressed only a single tank geometry and configuration corresponding to the experimental apparatus.
Several studies further adopted axisymmetric assumptions for tanks approximated as cylindrical geometries [7,24,35,37,38,44]. However, this simplification imposes inherent limitations. When a tank is positioned horizontally, pre-cooled hydrogen entering the vessel tends to sink to the bottom region due to buoyancy effects, producing a significant temperature gradient between the upper and lower zones of the gas. This behavior, commonly referred to as thermal stratification [45], is a well-documented phenomenon during hydrogen fast filling, yet it cannot be accurately captured by axisymmetric models because they restrict the representation of asymmetrical flow and temperature fields.
Compared with Type III tanks, Type IV tanks are approximately 20% lighter while offering the same volumetric hydrogen storage capacity, and, therefore, most commercial light-duty FCEVs adopt Type IV tanks rather than Type III. In the present study, a CFD-based approach is employed to investigate the temperature evolution within a Type IV tank, with emphasis on the coupling between thermal behavior and internal flow characteristics. Following the specifications reported in SAE J2601, inlet and ambient boundary conditions are defined for four representative on-board tank sizes. Three-dimensional simulations incorporating buoyancy effects are conducted to capture thermal stratification, and the resulting maximum gas temperatures under each scenario are evaluated to determine compliance with the safety limit of 85 °C. This assessment is particularly important because the fueling protocol presumes a spatially uniform temperature distribution within the tank, which does not reflect actual conditions observed during fast fills. The CFD methodology, thus, serves as a valuable complement to experimental investigations and enhances the understanding of thermal phenomena occurring during hydrogen refueling, thereby supporting the refinement and broader implementation of standardized fueling protocols.
2. Brief Introduction of SAE J2601 Hydrogen Refueling Protocol
The automated control procedure governing hydrogen transfer into fuel cell electric vehicles (FCEVs) is referred to as the refueling protocol, whose primary objective is to ensure safe refueling by preventing thermal and mechanical damage to on-board hydrogen storage systems. During fast filling, hydrogen temperature rises due to compression heating and thermodynamic effects; thus, the protocol must regulate fueling conditions to maintain temperatures within allowable limits while achieving high state of charge (SOC) within a consumer-acceptable duration. These competing requirements necessitate a balance among fast filling, thermal management, and operational safety. To address this, the Society of Automotive Engineers (SAE) introduced SAE J2601 in 2014, enabling rapid and safe refueling within defined safety margins [8]. The standard specifies key operational constraints, including a maximum mass flow rate of 60 g/s, hydrogen temperature limit of 85 °C, and pressure limit of 87.5 MPa. It applies to both communication fueling, which utilizes real-time tank data, and non-communication fueling, which relies on pressure feedback, resulting in differences in control accuracy and SOC prediction. The protocol also defines boundary conditions—ambient temperature (−40 °C to 50 °C), hydrogen delivery temperature (−40 °C to −17.5 °C), and initial tank pressure (>0.5 MPa)—to ensure reliable prediction of temperature rise and consistent safety performance.
SAE J2601 covers two pressure classes, H35 and H70, with three delivery temperature categories (T40, T30, T20), and CHSS volumes ranging from 49.7 L to 248.6 L, categorized by stored hydrogen mass. The SOC is defined as a density ratio relative to 70 MPa and 15 °C conditions. The protocol provides two fueling methodologies: a look-up table-based approach and a formula-based (MC) approach. The look-up table method employs predefined pressure ramp rates (PRRs) derived from validated simulations and experiments [46], where the average pressure ramp rate (APRR) and target pressure are selected based on ambient temperature and initial pressure; APRR typically decreases with increasing ambient temperature, and additional strategies such as top-off control are applied at low initial pressures. In contrast, the MC method dynamically adjusts the pressure ramp rate using real-time temperature measurements and empirical correlations dependent on operating conditions. Although this approach can reduce fueling time, it generally results in higher final gas temperatures compared to the look-up table method, indicating a trade-off between refueling efficiency and thermal safety [47].
3. Equations for Unsteady Hydrogen Filling Process Simulation
3.1. Governing Equations
The governing equations of a simulation model are derived from the conservation of mass, momentum, and energy. These are described by the continuity equation (Equation (1)), the unsteady Favre-averaged Navier–Stokes equations including turbulence effects (Equation (2)), and the total energy equation (Equation (3)), respectively.
where is density of a fluid, is velocity vector, is effective stress tensor, is specific internal energy of a fluid, and is general effective thermal conductivity. In Equation (2), the gravitational effect is applied to reflect the downward flow behavior of cold hydrogen introduced into CHSS. The potential energy is neglected in Equation (3) because of horizontal refueling.
By solving the governing equations in conjunction with the following equations, the velocity field (), pressure (), and temperature () of the fluid within the modeled domain can be determined.
where is specific enthalpy and is the unit tensor. is divided into molecular stress tensors () and turbulent stress tensors (). The turbulence effect is further considered by using a turbulence model. In Equation (5), represents dynamic viscosity while denotes turbulent viscosity. The effective thermal conductivity () can be separated into molecular thermal conductivity () and turbulent thermal conductivity (), which is given by the ratio of turbulent viscosity to the turbulent Prandtl number ().
3.2. Turbulence Model
Turbulence exhibits complex behavior across a wide range of spatial and temporal scales, making it challenging to analyze and predict a flow pattern accurately. The practical method for considering a turbulence effect is a numerical analysis technique developed to simulate turbulent flow phenomena caused by the irregular and chaotic motion of fluids. Models based on the concept aim to balance accuracy and efficiency by averaging or approximating turbulent fluctuations while maintaining sufficient predictive capabilities for practical applications. Turbulence models are generally based on the Reynolds-averaged Navier–Stokes (RANS) equations and include transport equations to represent turbulence effects [48]. These equations describe key turbulence characteristics such as the generation, dissipation, and diffusion of turbulent kinetic energy, which are essential for accurately describing a flow behavior in various engineering applications.
Over the years, numerous turbulence models have been developed and validated for various flow conditions. As for the hydrogen refueling process, the realizable k–ε model has been demonstrated to provide satisfactory results for hydrogen filling processes [24]. This model incorporates transport equations for turbulent kinetic energy (k) and dissipation rate (ε) to consider the generation, dissipation, and diffusion of turbulence. Compared to the standard k–ε model, the realizable version offers improved physical consistency and enhanced predictive capability in complex flow patterns. Due to these advantages, the realizable k–ε model offers stable and reliable analysis even under high-pressure and high-temperature variations typically observed in the hydrogen filling processes [24,49]. Consequently, it has become a widely adopted tool for the efficient design and performance evaluation of hydrogen storage and refueling systems.
3.3. Equation of State
To simulate an FCEV refueling process, various hydrogen properties such as density, viscosity, and thermal conductivity are required and, thus, securing reliable property data is essential for accurate computational simulations. The thermodynamic properties can be obtained from an equation of state (EOS) and/or experimental methods. In the chemical process simulation, various EOSs are used, including the ideal gas law for the simple molecules under a moderate condition and more advanced models such as van der Waals (vdW), Soave–Redlich–Kwong (SRK), and Peng–Robinson (PR). However, such cubic equations of state (vdW, SRK, and PR) are particularly useful for reflecting real gas behavior of hydrocarbons.
Hydrogen would experience extremely high-pressure conditions during a refueling process. Accurate estimation of hydrogen properties in high-pressure environments is quite challenging. Bourgeois et al. [50] proposed that utilizing property data provided by the National Institute of Standards and Technology (NIST) is a more appropriate approach than using an EOS for simulating the temperature increase of hydrogen in pressurized environments.
Recently, an innovative study [51] introduced a machine learning method to correlate hydrogen properties with a simple polynomial equation (Equation (7)). The correlation equation accurately reproduces the property data from NIST with an average relative error of around 0.04% for density at the hydrogen refueling condition. It can be easily embedded into a CFD tool and enables faster calculations compared with the direct use of NIST data, which inevitably involves numerous repeated interpolation and retrieval processes, leading to increased computation time.
In this study, the machine-learning-based correlation equation of the fifth order (n = 5) [51] is applied as it has been successfully used for the hydrogen refueling process analysis [52]. The equation expresses density (denoted as Y in Equation (7)) as a function of temperature T (K) and pressure P (MPa). It is highly recommended within the temperature range of 223.15 to 373.15 K and the pressure range of 0.1 to 100.1 MPa. The coefficients () in Equation (7) for density (mol/L) are listed in Table 1.
Table 1.
Coefficients for density in Equation (7).
3.4. Heat Transfer Model
The heat transfer within the cylinder wall and its interaction with the surrounding environment are modeled through transient conduction and external convection mechanisms. The governing equation for heat conduction in the wall is expressed as
which describes the temporal evolution of thermal energy within the solid domain as a function of spatial temperature gradients. This formulation accounts for one-dimensional heat diffusion across the wall thickness, assuming homogeneous material properties.
At the outer boundary, heat exchange between the tank wall and the ambient is represented by a convective heat flux given by [53,54]
where the heat transfer rate is driven by the temperature difference between the wall surface and the surrounding environment.
Here, , , , and denote the density, specific enthalpy, temperature, and thermal conductivity of the wall material, respectively. The parameter represents the effective heat transfer area, while corresponds to the convective heat transfer coefficient characterizing the external flow conditions. is the ambient temperature.
4. Storage Tank Set-Up for CFD Simulation
The flow and temperature analyses of hydrogen in storage tank have been performed with a commercial CFD software, COMSOL Multiphysics V6.0 [55]. The main purpose of the present investigation is to obtain 3D simulation results during hydrogen refueling processes that are following SAE J2601 protocol.
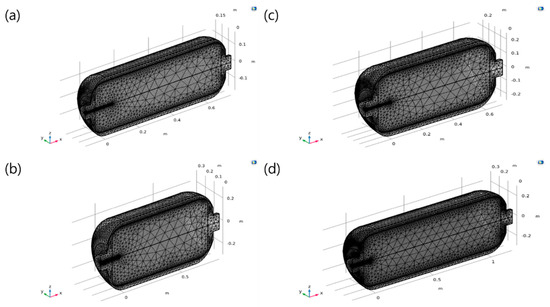
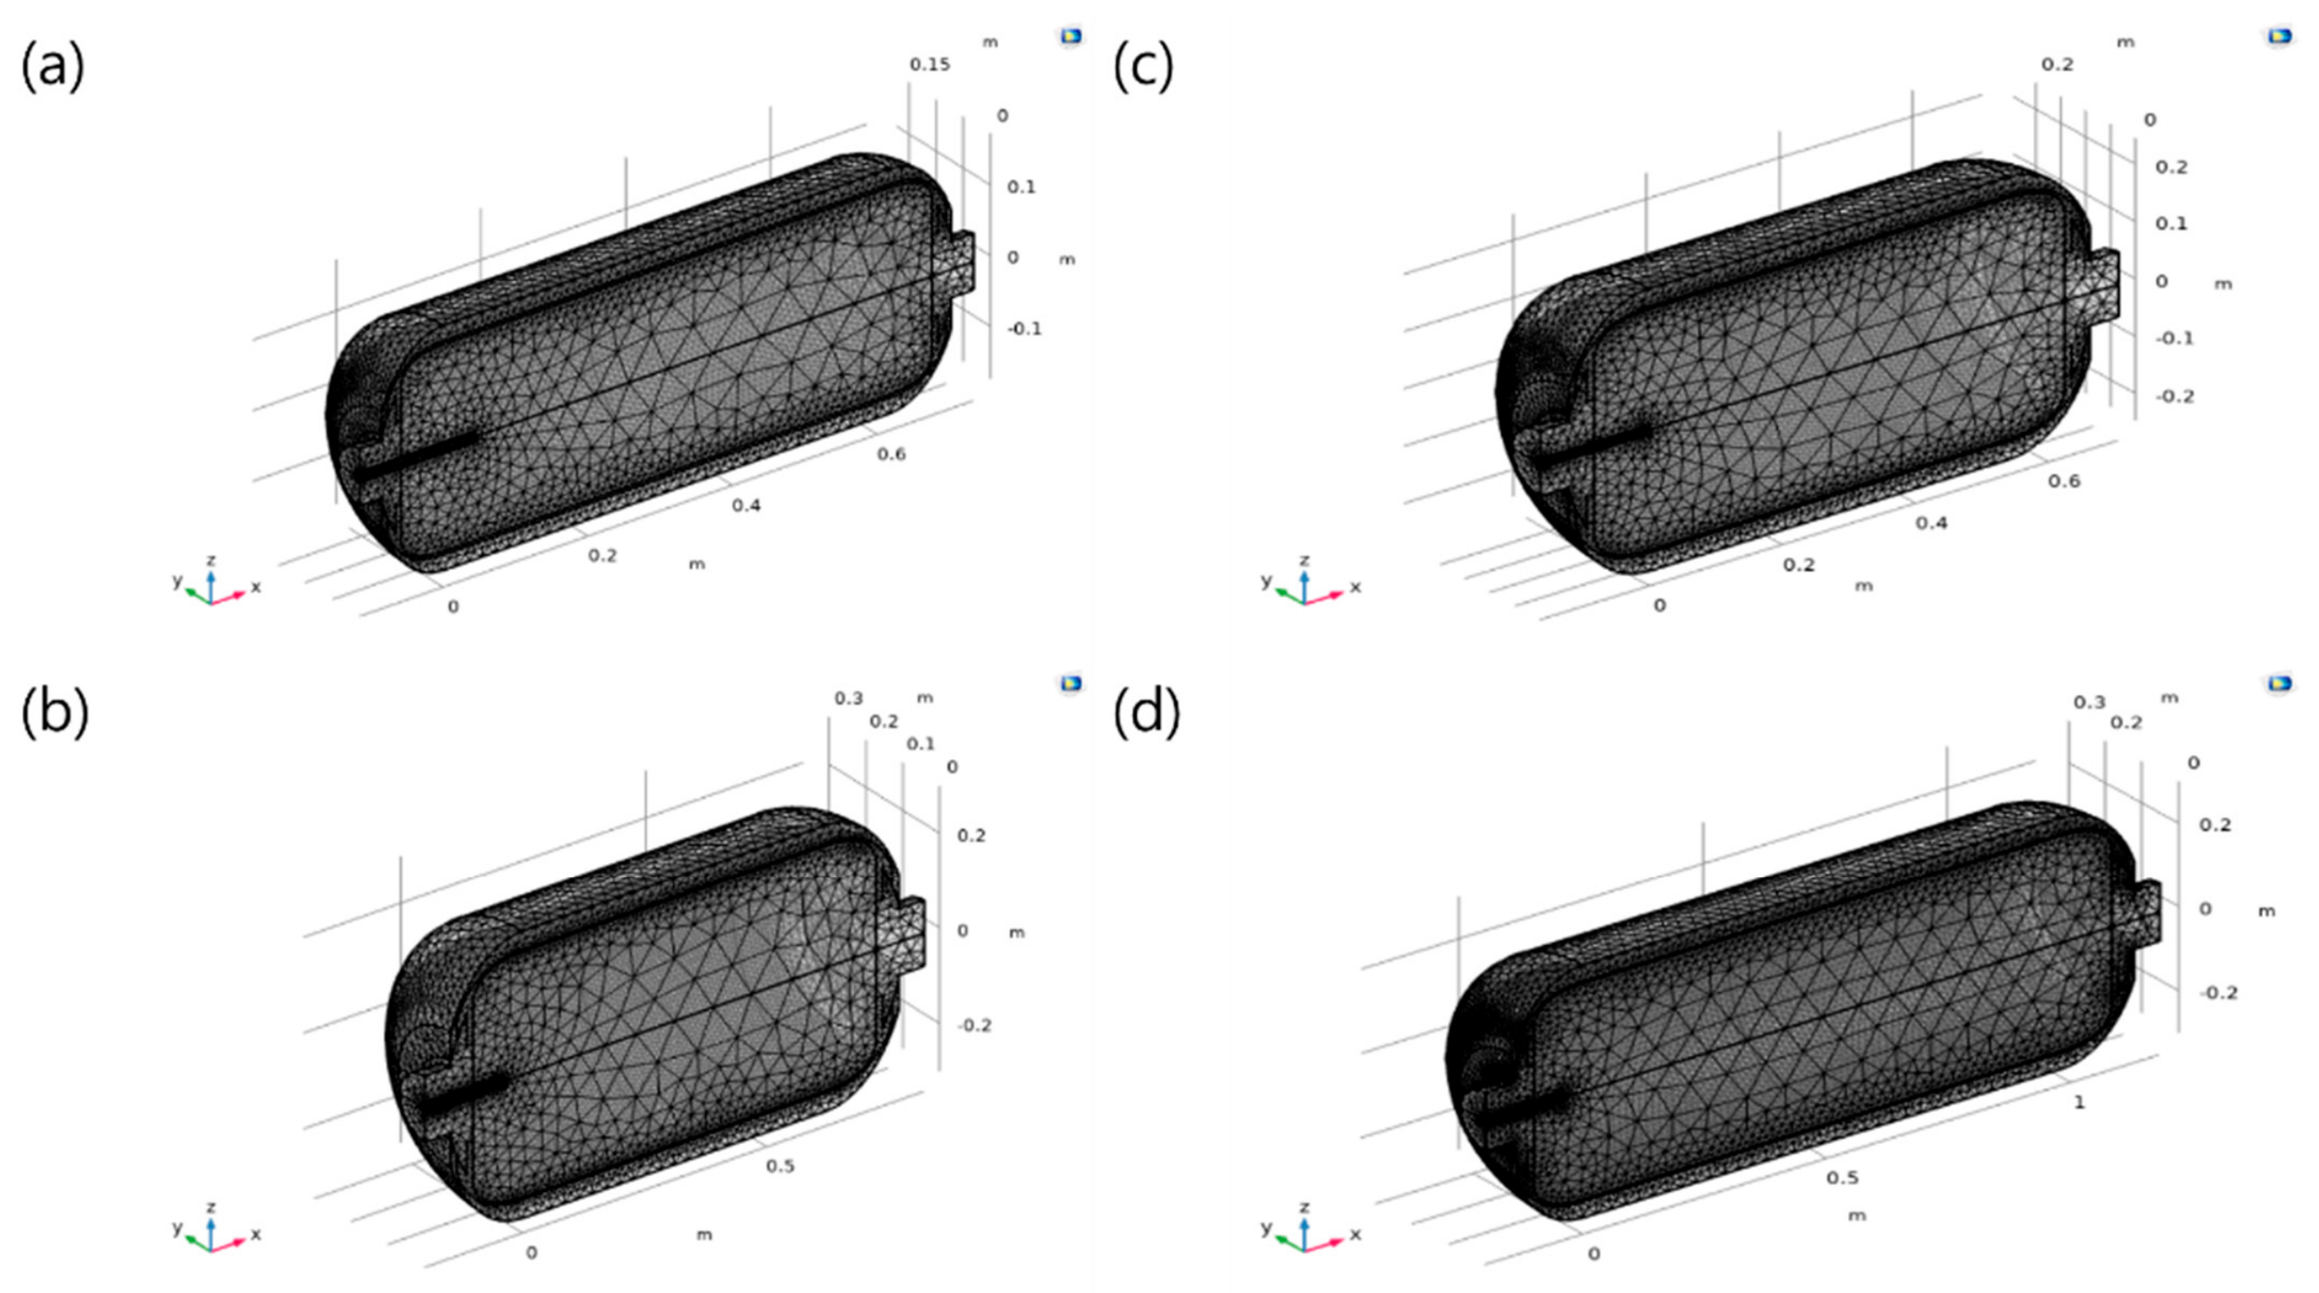
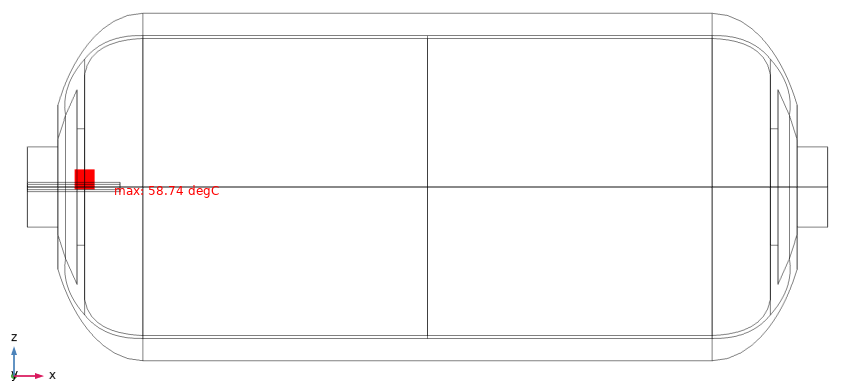
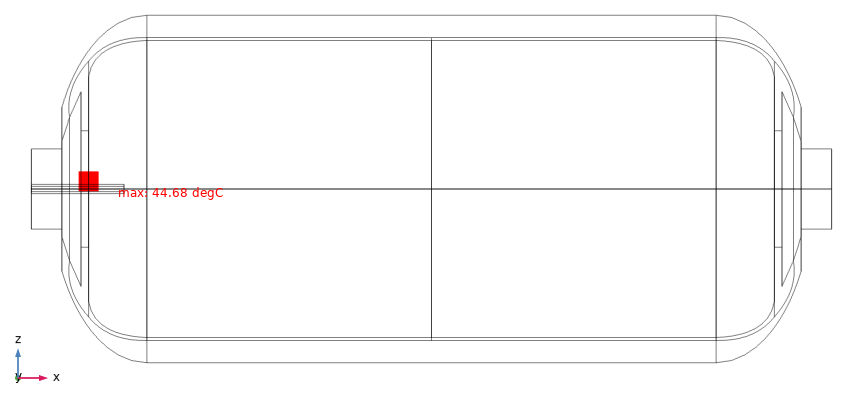
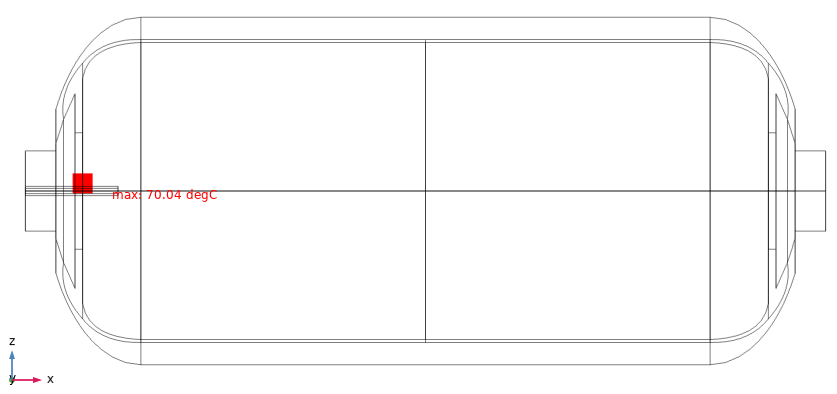
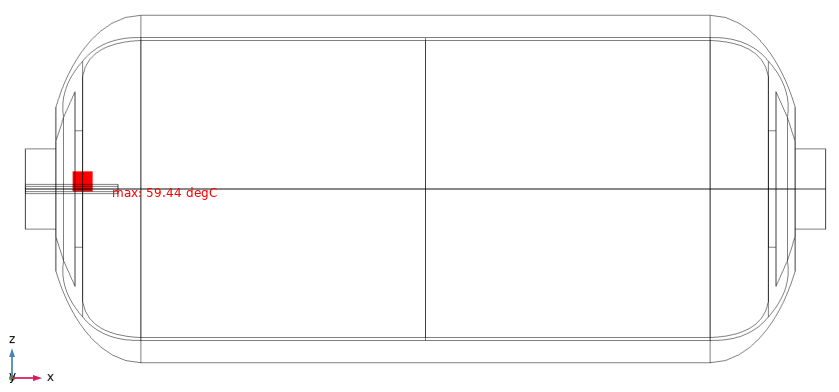
In SAE J2601, CHSS is classified into four categories based on capacity; A, B, C, and D for 2 kg, 4 kg, 7 kg, and 10 kg, respectively, when hydrogen is compressed up to 70 MPa at 15 °C. Therefore, the tank structure models are constructed according to specifications presented by SAE J2601. Four physical models for different sizes of Type IV tank are built and meshed, as shown in Figure 1, of which specifications are summarized in Table 2. For a faster calculation, the halves of the actual tanks are modeled by considering symmetric aspect. The internal gas volumes of the models listed in Table 2 are twice those of the simulated tank model volumes. The tank models show a little difference in volume due to the shape and thickness of the tank structural materials, but the external dimensions are set to be the same as the SAE J2601 values.
Figure 1.
Mesh structure of the storage tank: (a) CHSS A, (b) CHSS B, (c) CHSS C, and (d) CHSS D.
Table 2.
Tank specifications in SAE J2601 and model.
The number of meshes presented in Table 2 is the result of using the extra-fine setting provided by the software. The number of meshes can be increased by 2 to 5 times using the extremely fine setting, and the reliability of the mesh setting was confirmed in this study because it was found that the final temperature differed from the result calculated using the extremely fine setting by within 0.1 °C.
The material properties of the tank components are summarized in Table 3. The Type IV tanks are composed of an inner liner surrounded by carbon fiber reinforced plastic (CFRP). The light non-metallic liner plays a crucial role in storing hydrogen gas without leakage. The outer CFRP layer provides excellent pressure resistance while maintaining a lightweight structure, ensuring stable performance even under extreme pressure conditions. Moreover, CFRP exhibits low hydrogen permeability, offering high reliability for long-term storage. For hydrogen injection into a tank, an inlet pipe is inserted into a tank, and bosses are installed at both ends to facilitate high-pressure filling and secure connections. These bosses ensure a robust linkage between the tank and external systems, supporting safe and efficient operation.
Table 3.
Material properties of Type IV storage tank [8].
5. Results and Discussion
In the present study, the CFD calculation in a tank is carried out for hydrogen filling process under H70-T40 condition. Look-up tables on non-communication refueling given by SAE J2601 are referred to set the inlet pressure with time. For each type of the storage tank, 16 initial conditions are selected by combining four Tamb (−10, 10, 25, and 35 °C) and four P0 (0.5, 5, 15, and 30 MPa). The initial temperature of the vehicle is assumed to be equal to Tamb. Therefore, the boundary condition at the tank inlet is defined using APRR from the SAE J2601 look-up table in conjunction with the specified initial pressure.
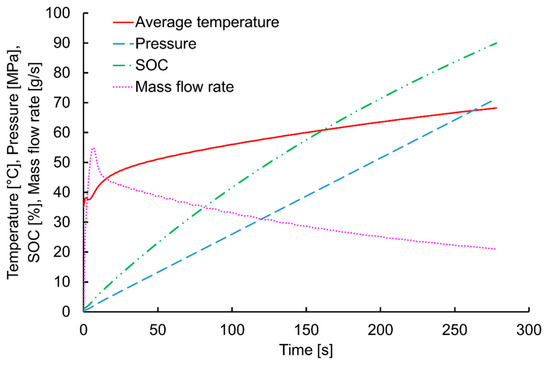
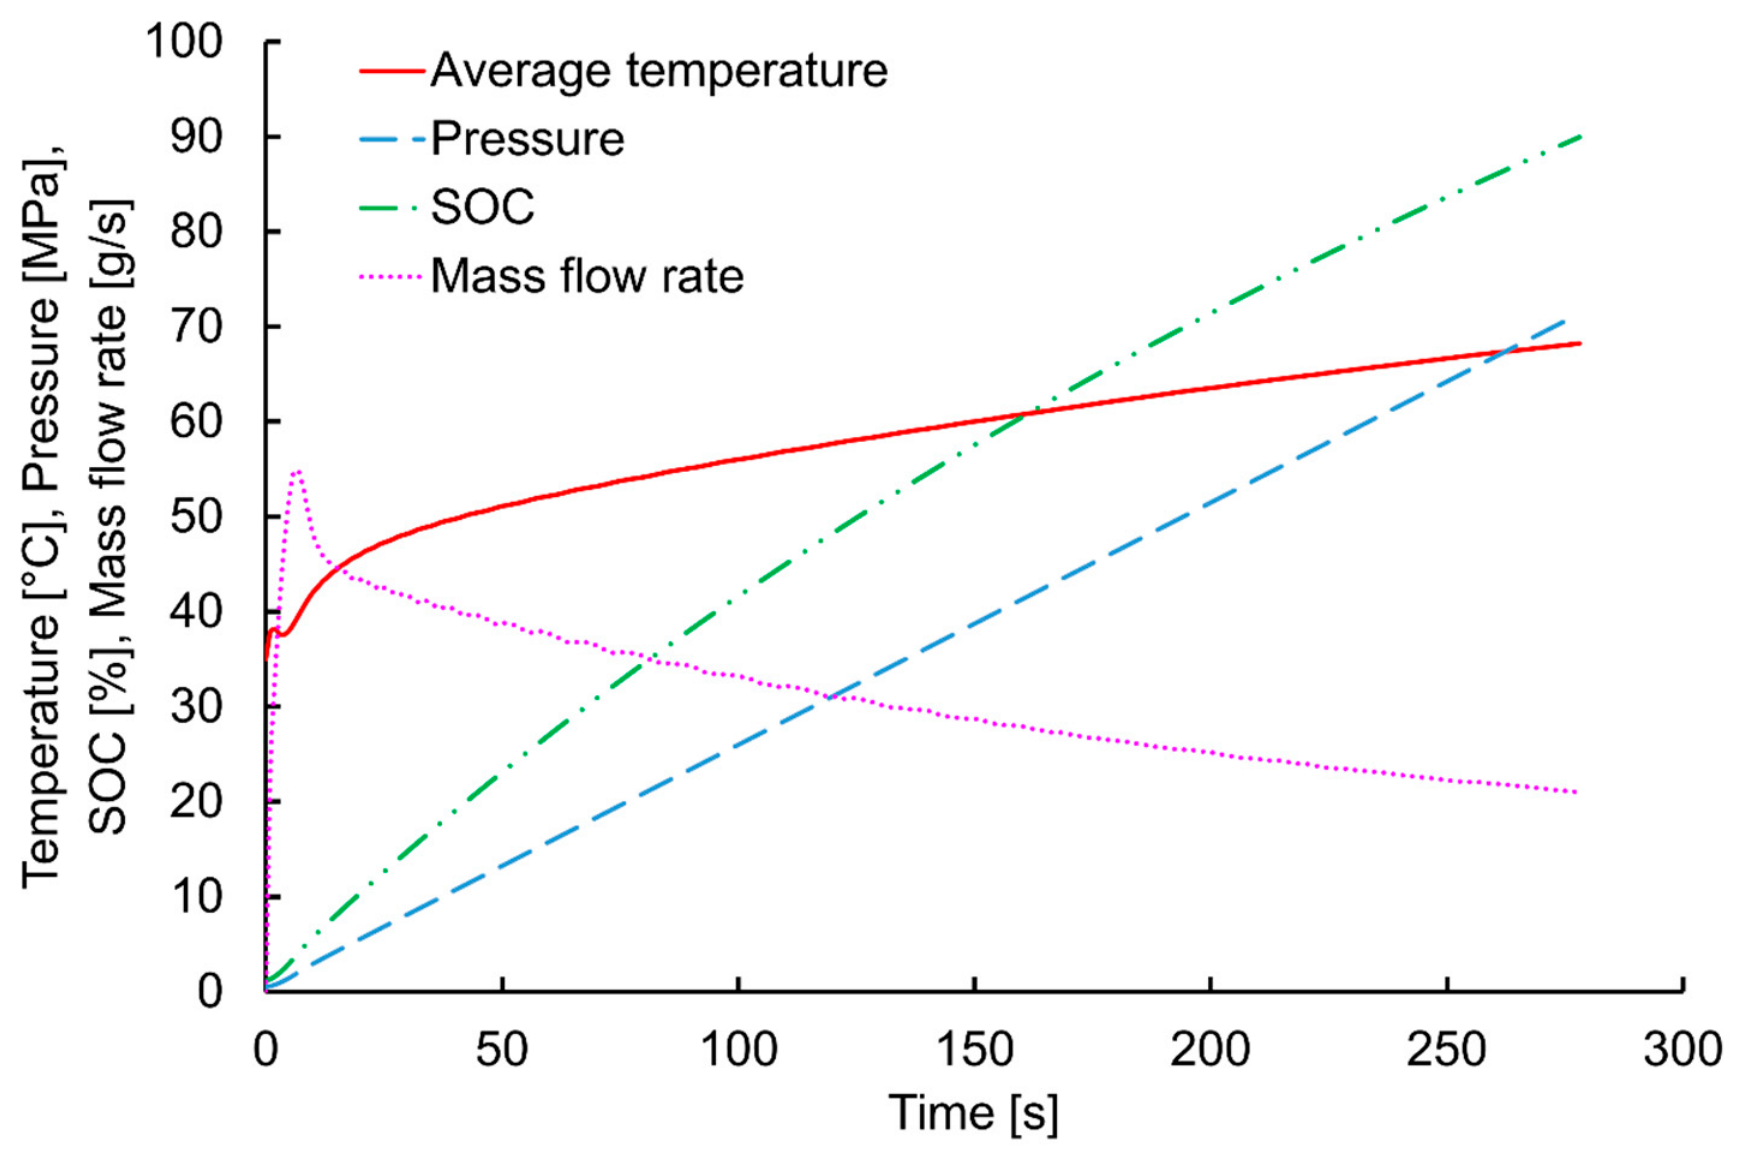
A commercial CFD software (COMSOL Multiphysics) is used to analyze the flow behavior in a tank. Average temperature, pressure, SOC, and mass flow rate with time are calculated to examine the refueling limitation during a filling process. As an illustration, Figure 2 presents typical plots for average temperature, pressure, SOC, and mass flow rate behavior. As an inlet pressure increases according to an APRR, the average temperature and pressure of hydrogen inside the tank increase monotonically. Therefore, the process limitations for temperature and pressure can be examined by calculating the temperature and pressure values at the end of a fill. However, as the mass flow rate depends on the pressure difference between the refueling station and the vehicle tank, the maximum flow rate is rapidly increased at the beginning of a fill, and the flow rate tends to decrease as the pressure difference decreases.
Figure 2.
Illustration of simulation results for average temperature, pressure, SOC, and mass flow rate (CHSS D at initial condition of Tamb = 35 °C and P0 = 0.5 MPa).
The filling process time ranged from 80 to 500 s, depending on the initial conditions (initial pressure and ambient temperature) and capacity of a tank. All the 64 simulations showed similar results to Figure 2 except for the refueling time.
5.1. Flow Patterns and Temperature Stratification in a Tank
The flow of a fluid within a storage tank has a significant impact on the average temperature and local temperature. Typically, the hydrogen temperature within a tank is measured and monitored at one location where a sensor is positioned, so determining the difference between the local temperature and the measured temperature is necessary to safely apply the hydrogen refueling protocols. In addition, accurately measuring temperature in fluid systems is very difficult [56,57]. Therefore, to reduce errors in temperature monitoring, it is necessary to predict temperature distributions through CFD studies.
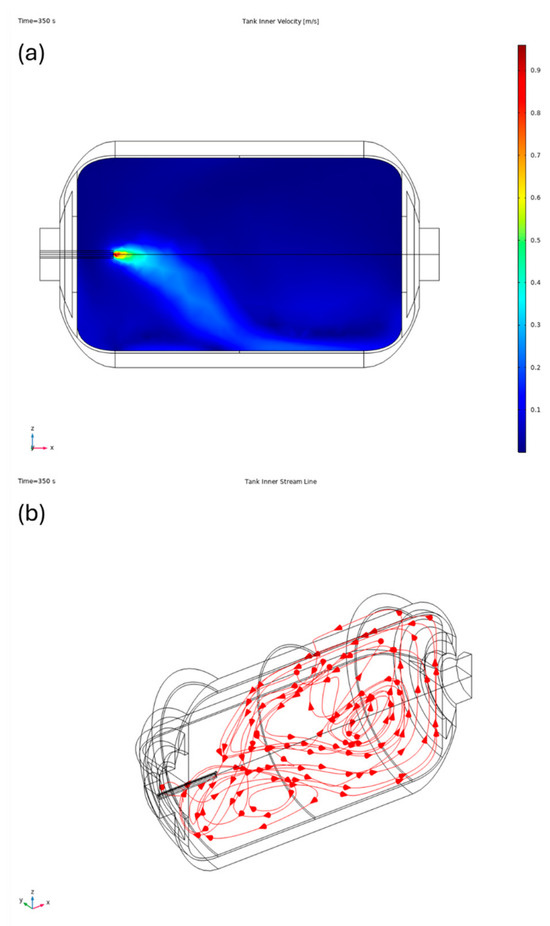
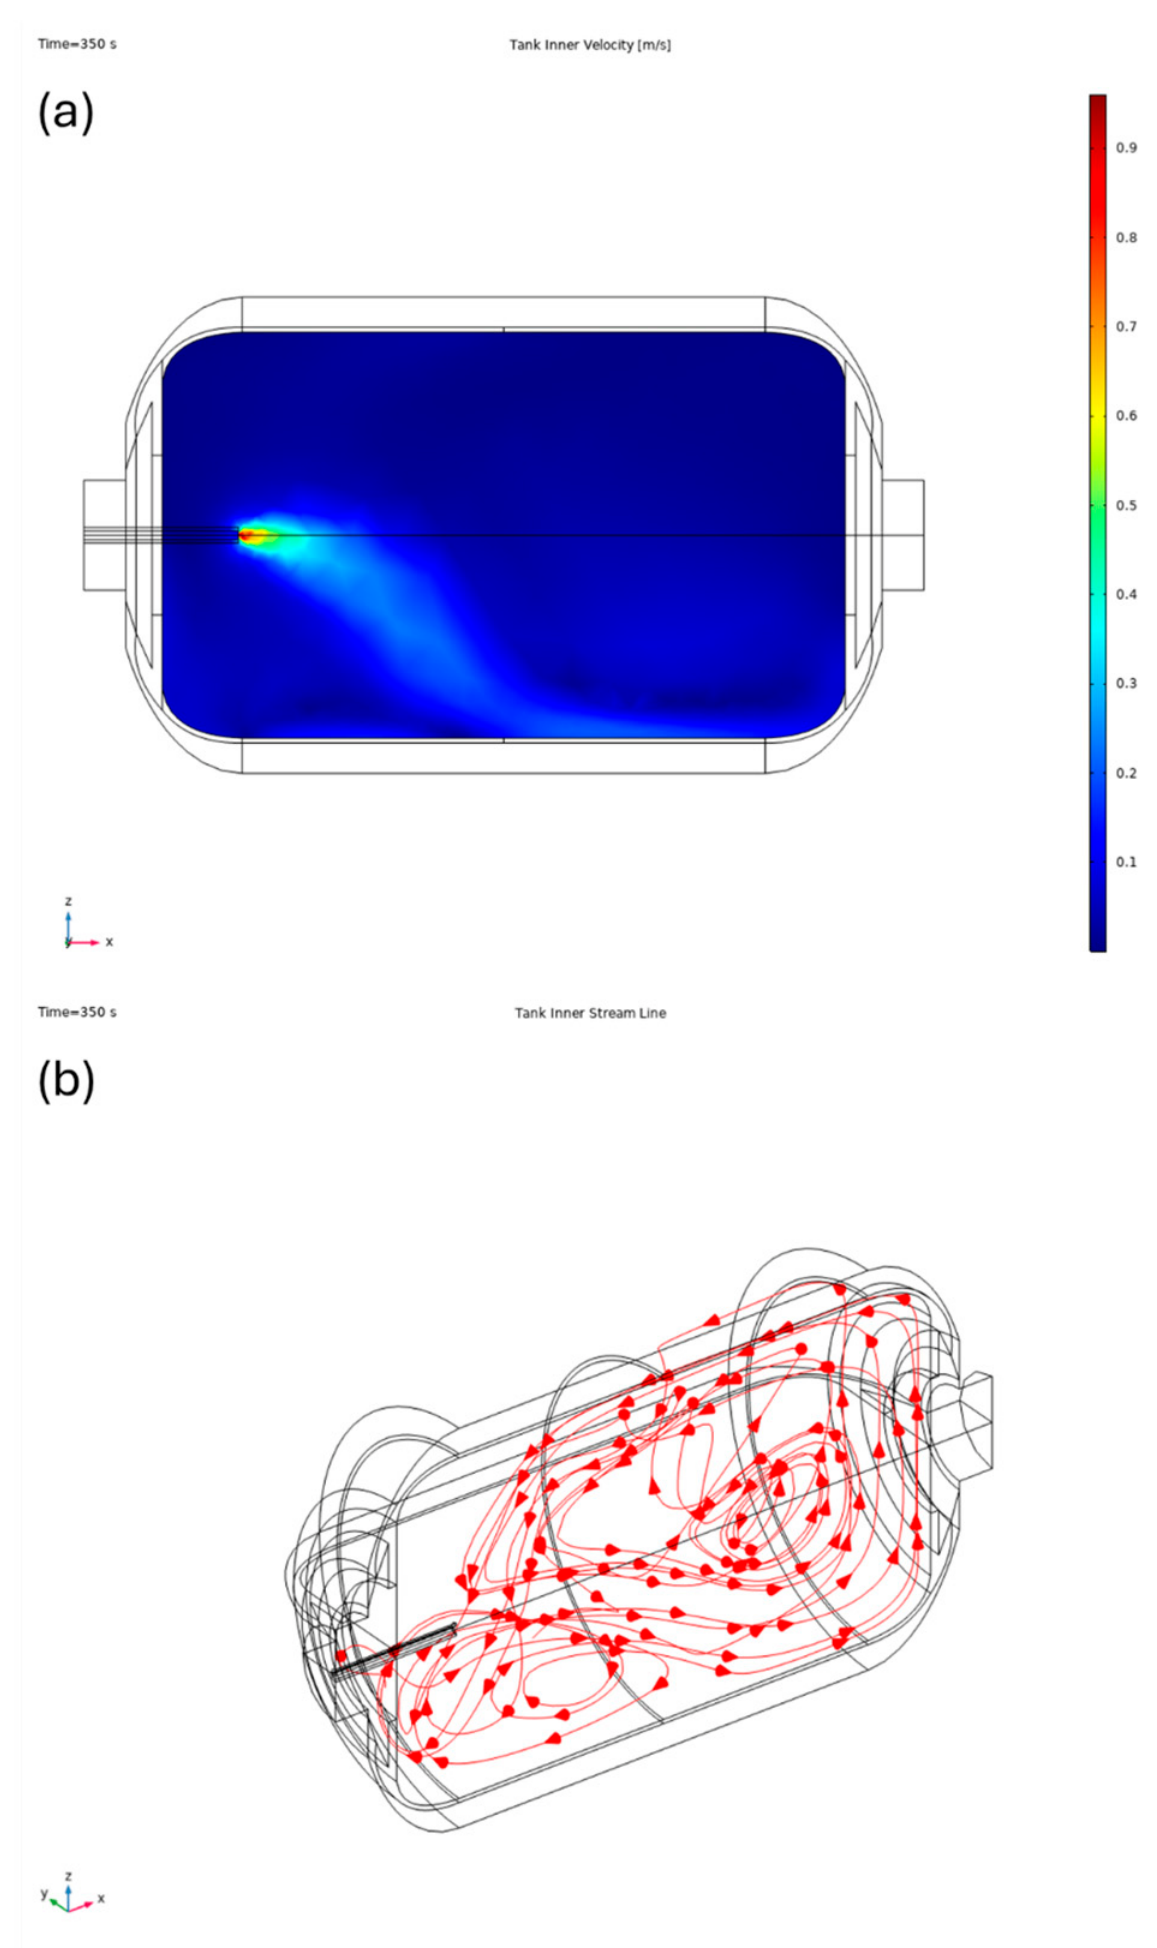
Velocity and streamline inside a hydrogen tank during the filling process are illustrated in Figure 3 using the result of CHSS B fill under the conditions of Tamb = 35 °C and P0 = 0.5 MPa. The pre-cooled and denser hydrogen entering a tank sinks downward due to the gravitational force, and the flow pattern shows an asymmetric distribution with respect to the central axis of the tank. Consequently, the incoming hydrogen does not disperse uniformly throughout the volume of a tank. The hydrogen entering the tank flows along the bottom of the tank and rises after reaching the rear wall. This phenomenon causes a rotational flow in the rear region and leads to the formation of localized circulation zones, causing a temperature difference between the front and rear of the tank.
Figure 3.
Flow pattern of hydrogen in CHSS B at the initial condition of Tamb = 35 °C and P0 = 0.5 MPa: (a) velocity (m/s) and (b) streamline.
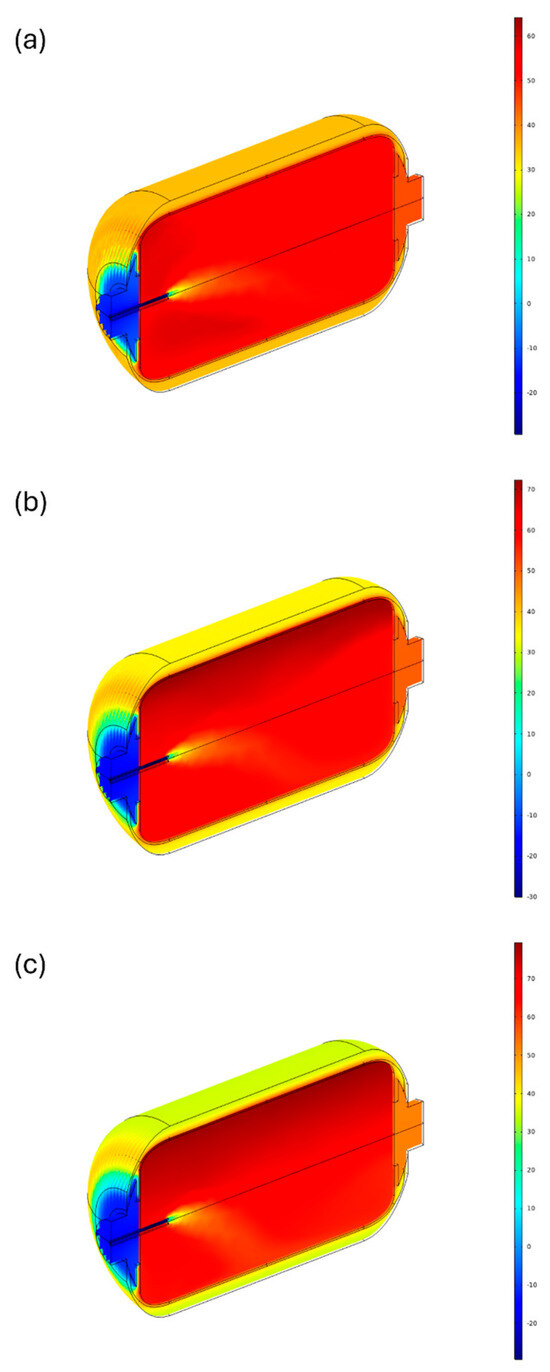
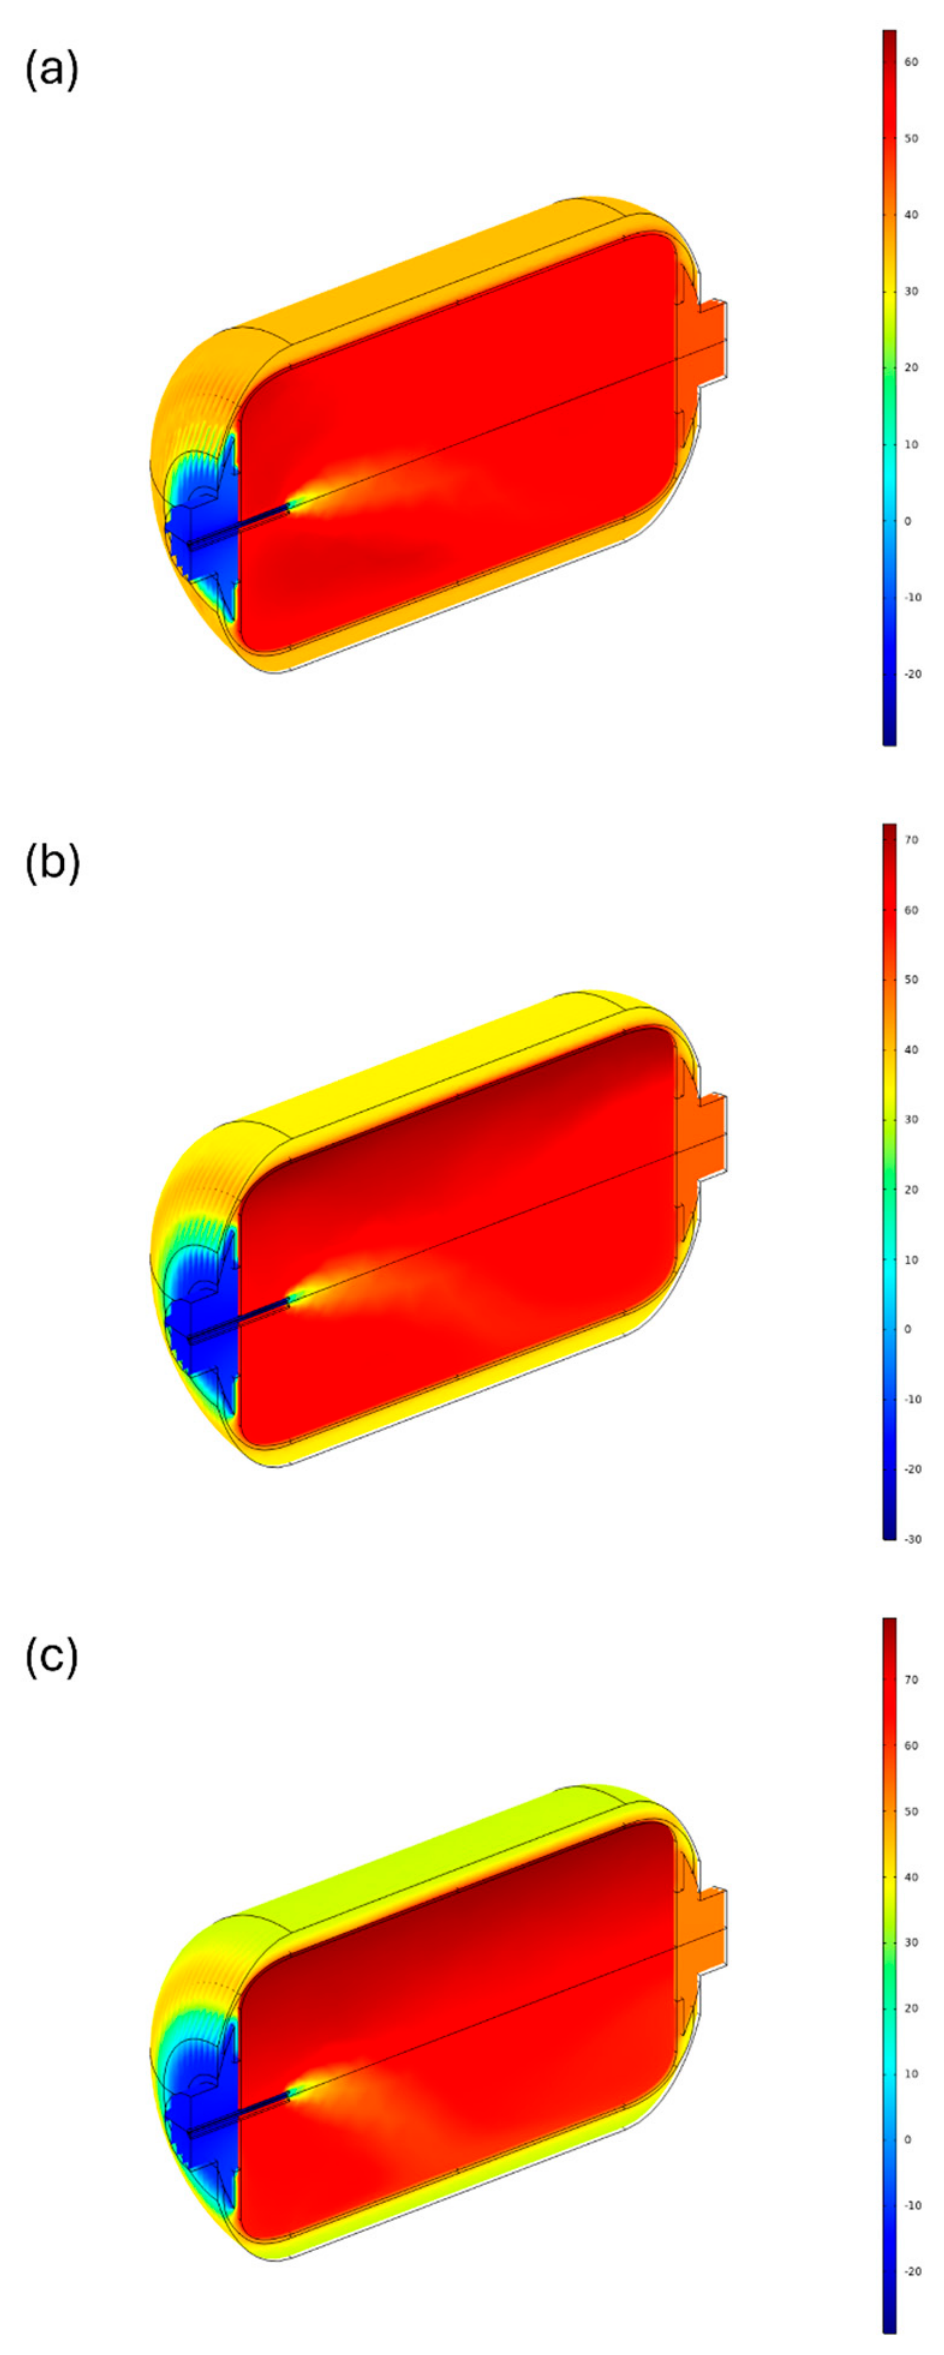
The pressure of the hydrogen inside the tank increases due to the inflow of hydrogen, and the increased pressure generates compression heat. Meanwhile, the temperature at the front of the tank structure is lowered by the inflowing cooled hydrogen. Therefore, as shown in Figure 4, the front of the tank has the lowest temperature, and the cylindrical CFRP wrapping with low thermal conductivity has a temperature lower than the temperature of the hydrogen inside the tank. The rear boss shows a temperature similar to the hydrogen temperature due to high thermal conductivity.
Figure 4.
Temperature of a hydrogen filling CHSS B at the initial condition of Tamb = 35 °C and P0 = 0.5 MPa: (a) 1/3 of a filling time, (b) 2/3 of a filling time, (c) end of fill.
As a refueling process proceeds, the temperature increases in all areas except the front of the tank, and the temperature of the hydrogen in the upper part of the tank becomes hotter than the lower part. A quantitative comparison of the average hydrogen temperature and the maximum temperature in a tank is described in the following sections.
5.2. Average and Maximum Hydrogen Temperatures Inside a Storage Tank
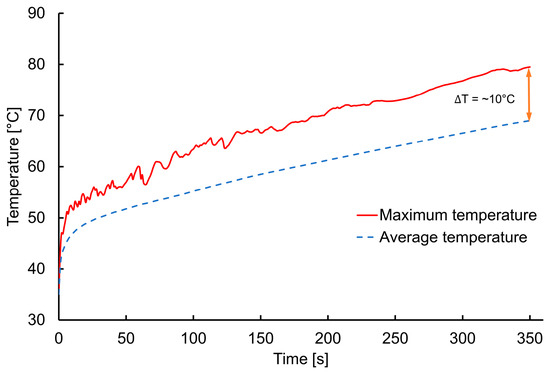
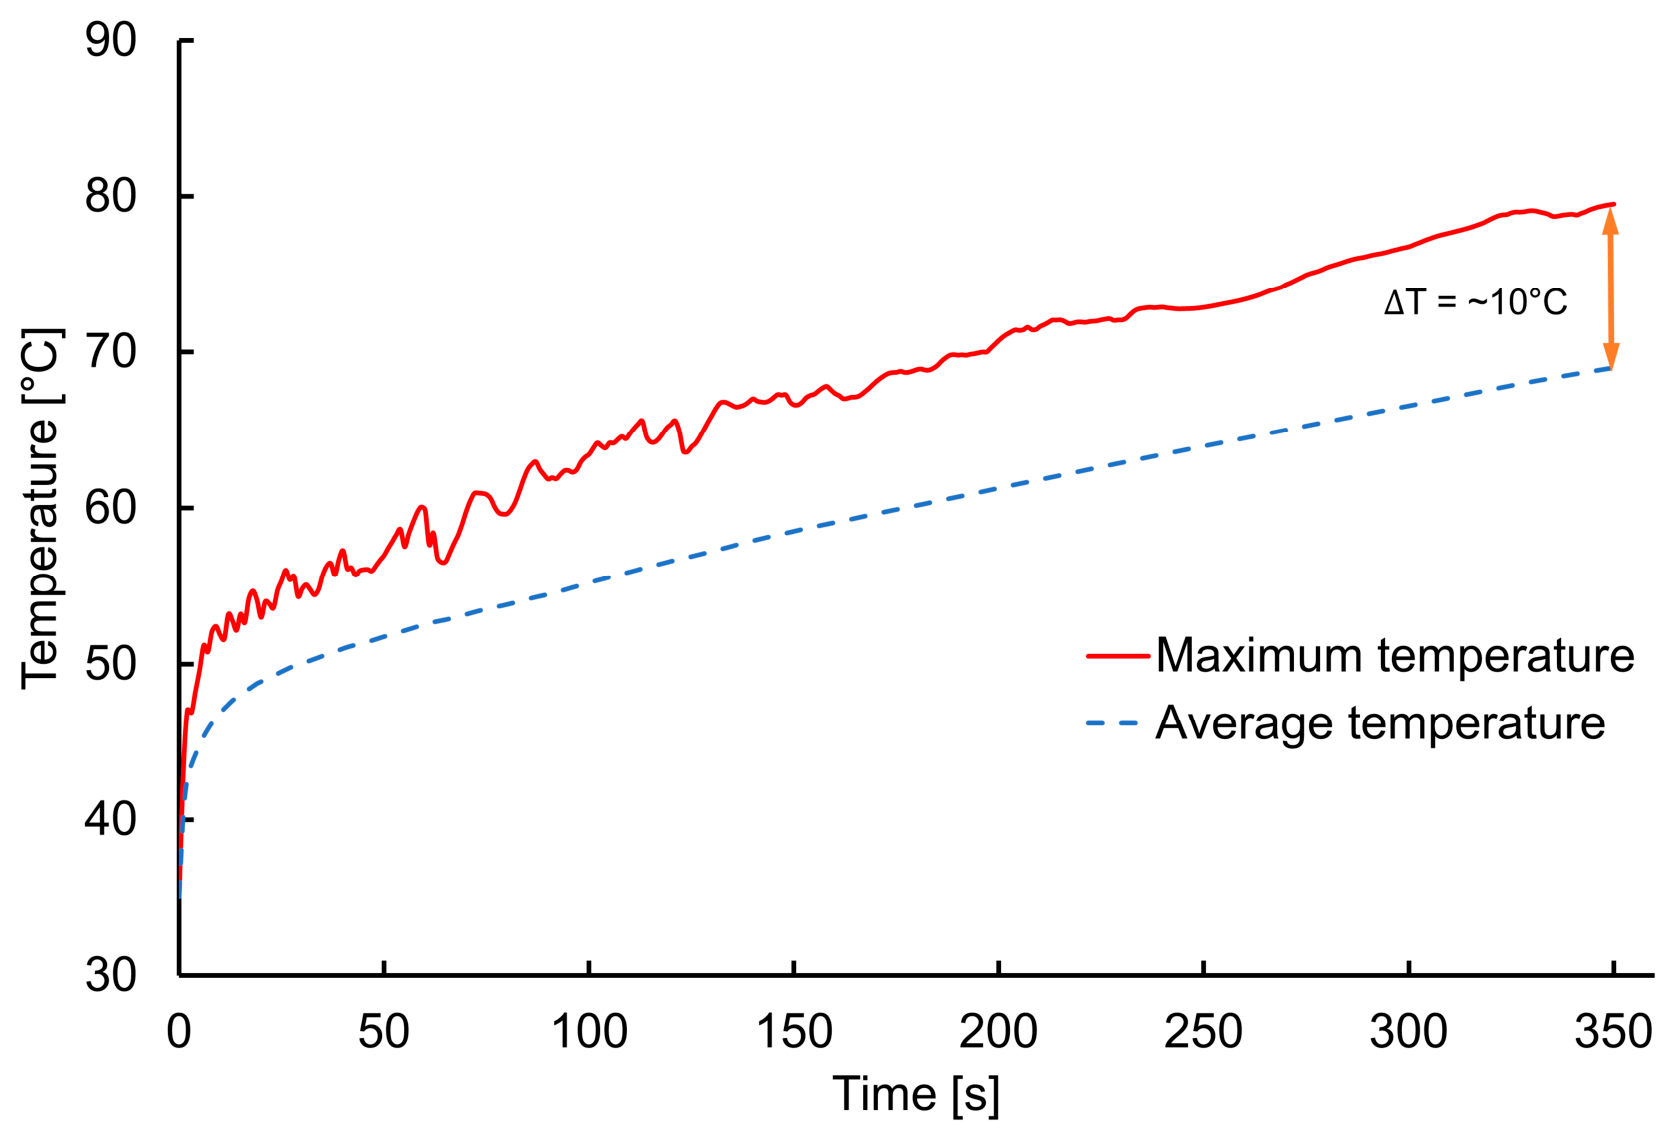
The average and maximum temperatures of hydrogen in the tank are compared and plotted in Figure 5, which is an example presenting the results of a 4 kg tank fill at the initial conditions of Tamb = 35 °C and P0 = 0.5 MPa. As presented in Figure 5, the difference between the maximum temperature and the average temperature becomes increasingly larger, and in the case of the example, the final state shows a difference of about 10.5 °C (maximum temperature = 79.5 °C and average temperature = 69.0 °C).
Figure 5.
Average and maximum temperature for a CHSS B filling at the initial condition of Tamb = 35 °C and P0 = 0.5 MPa.
As for the maximum temperature, the location where the maximum temperature appears is not fixed and continuously changes corresponding to the flow pattern within the tank. Therefore, the maximum temperature curve presented in Figure 5 rises while fluctuating.
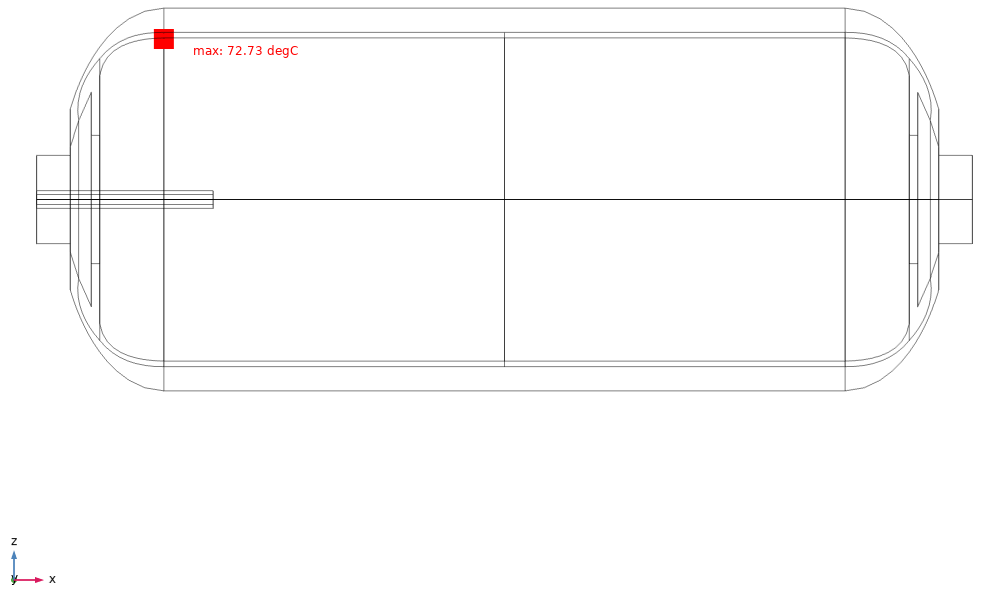
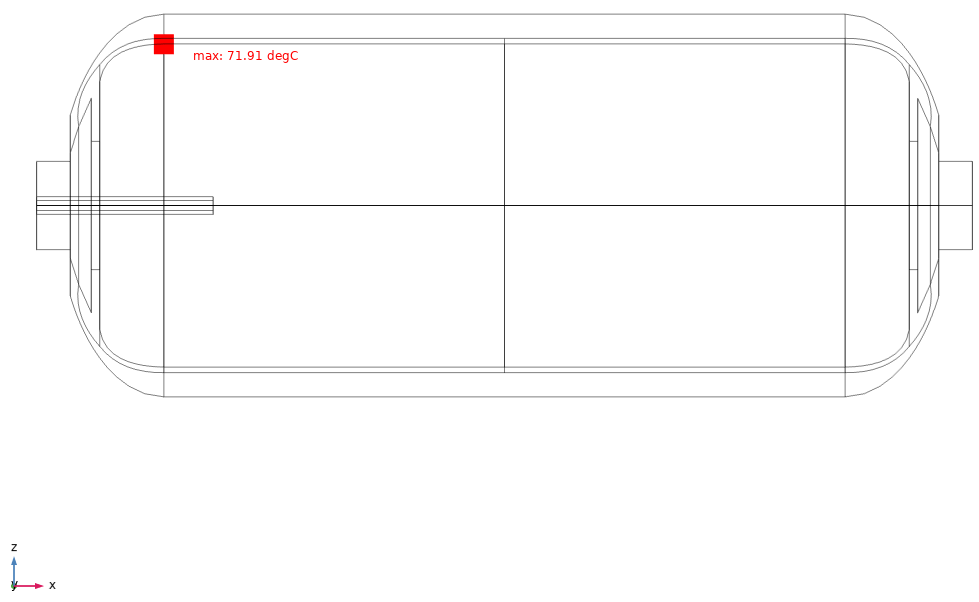
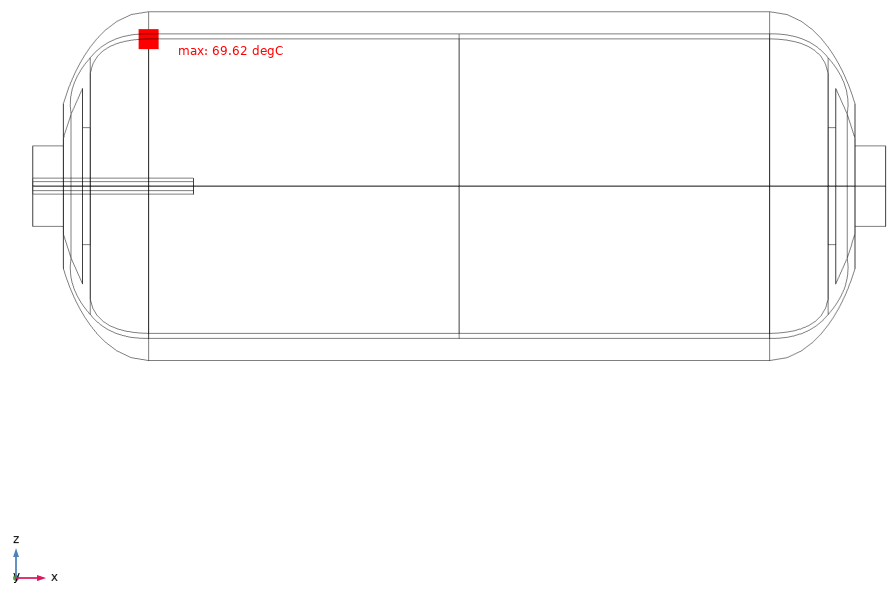
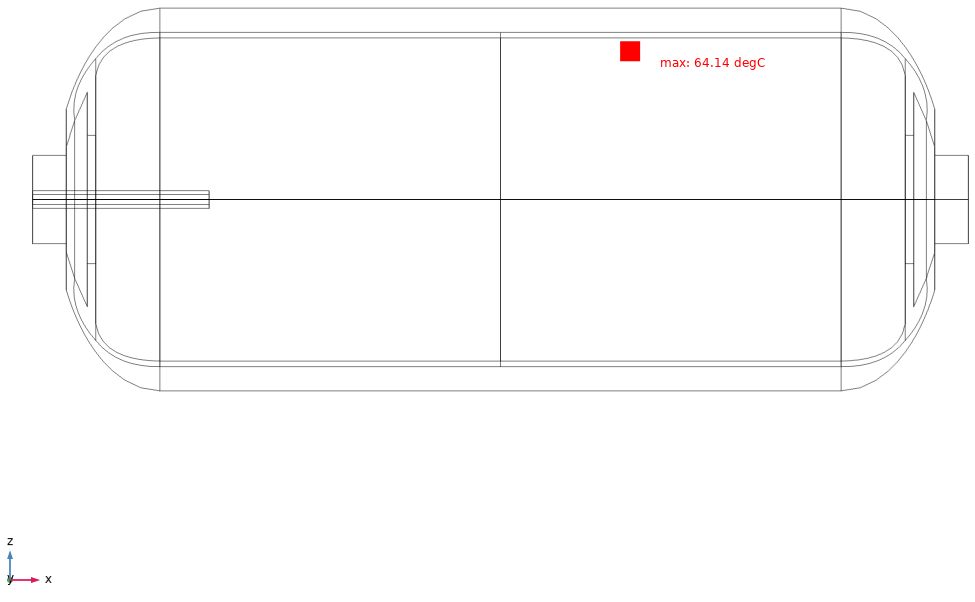
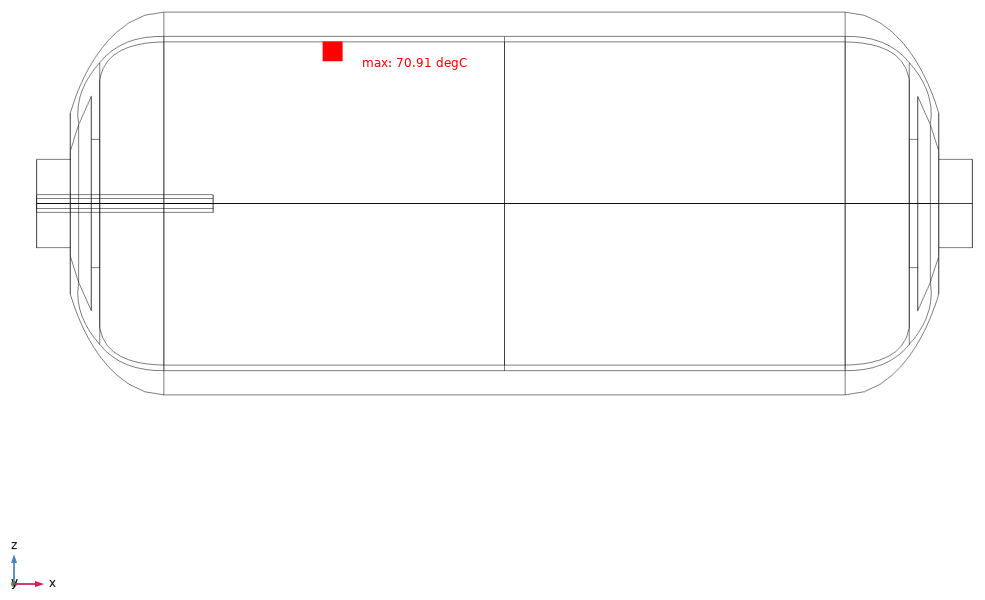
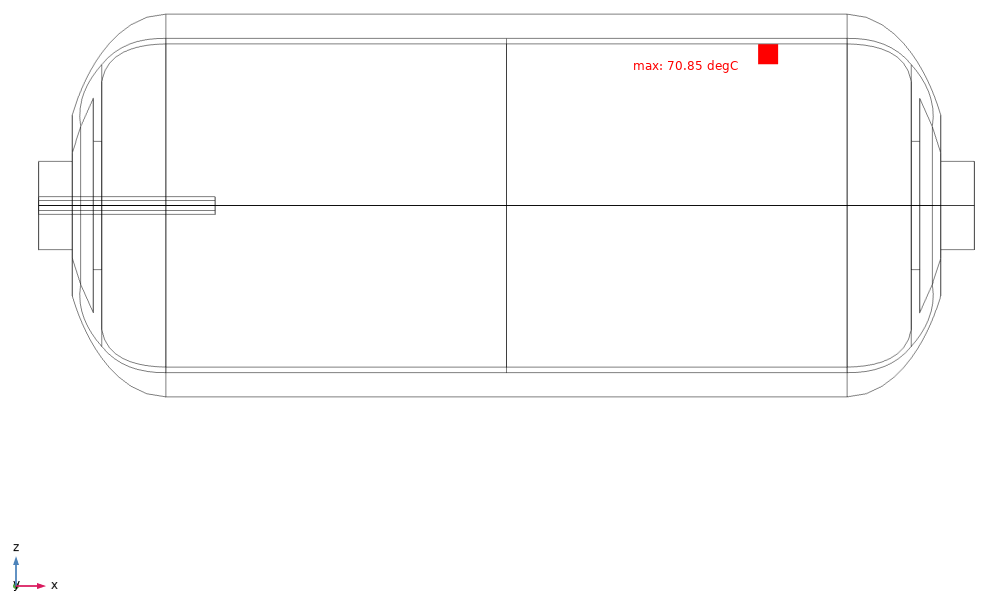
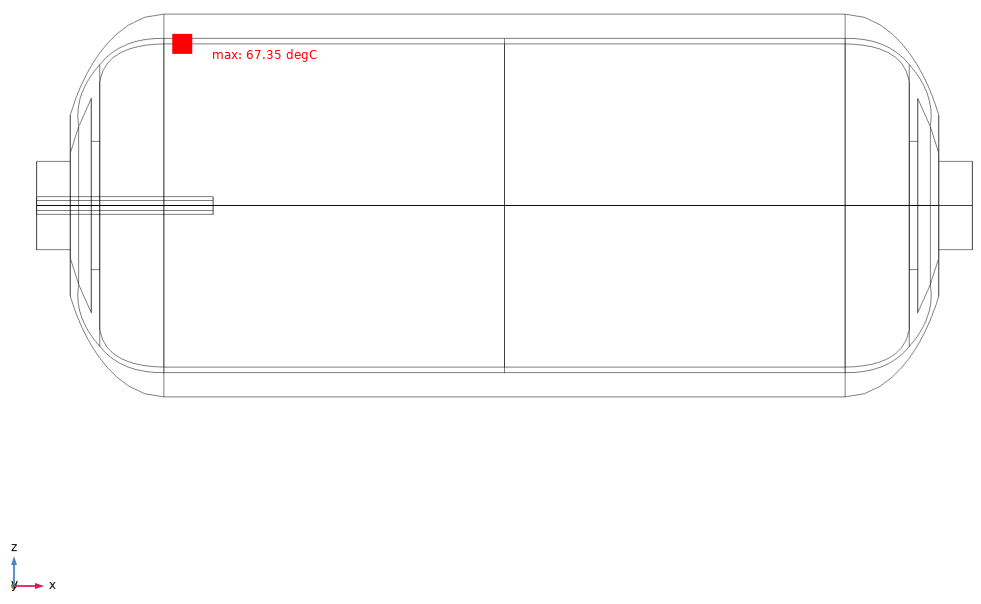
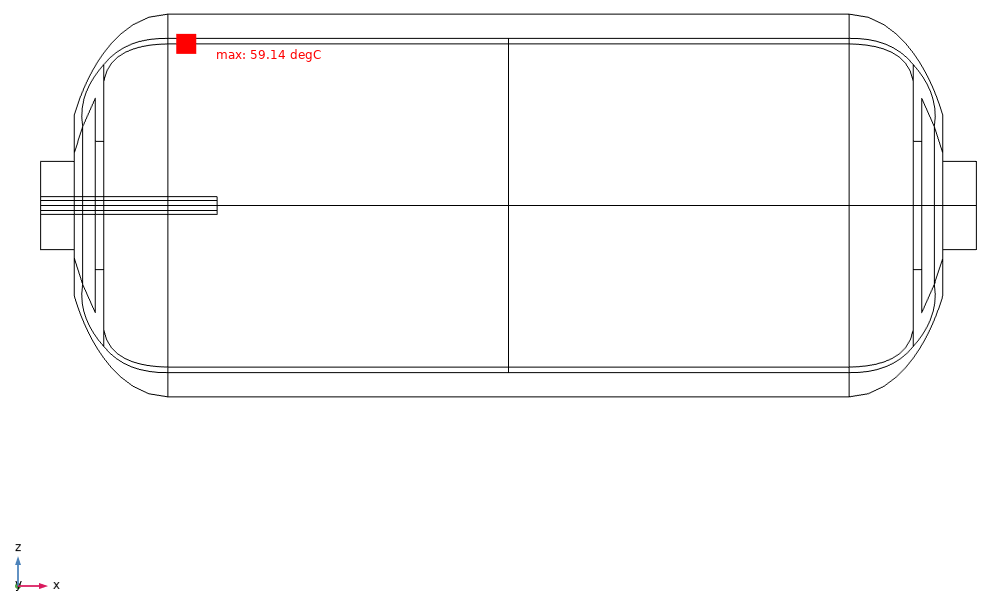
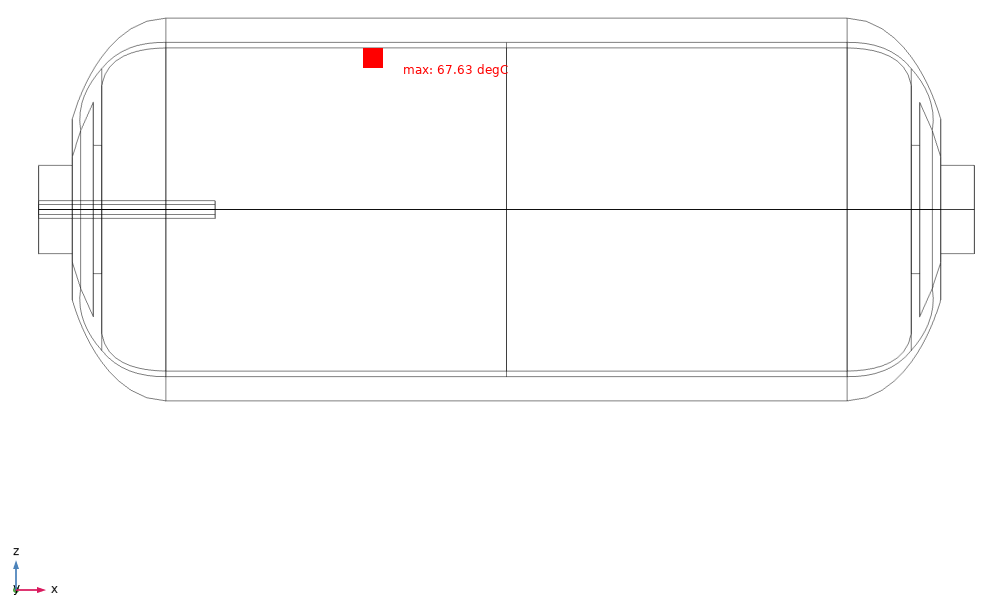
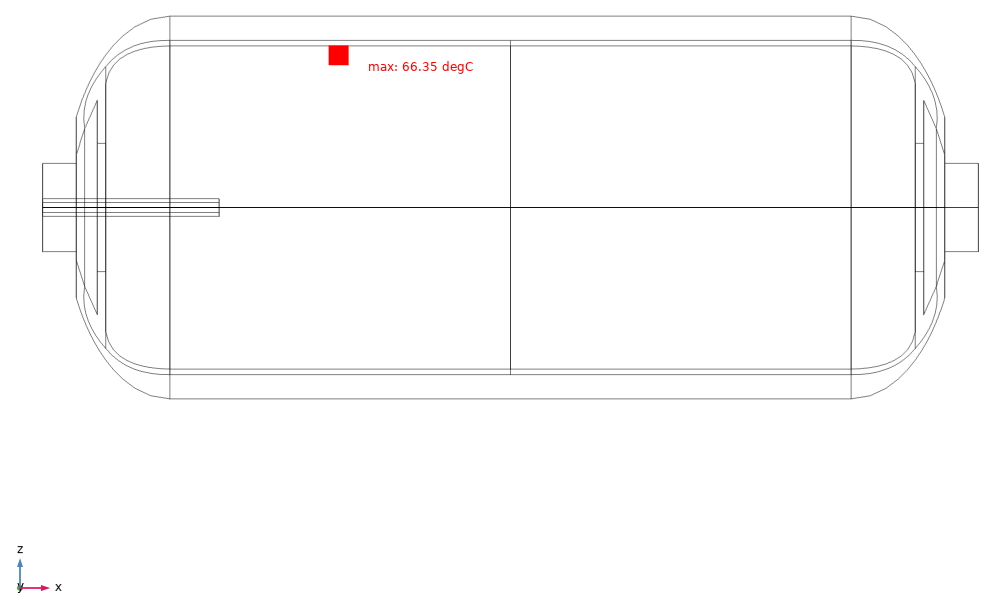
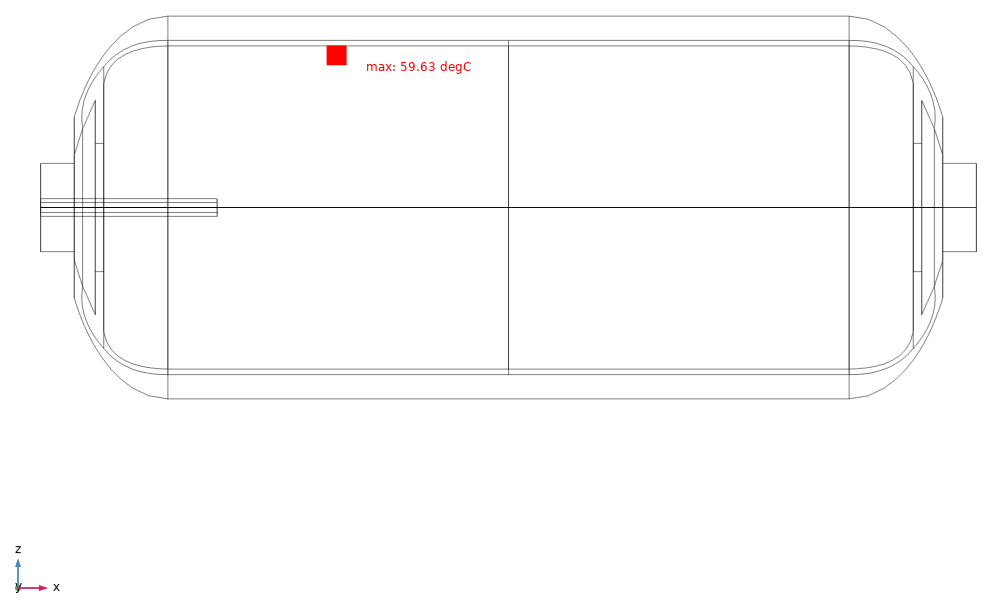
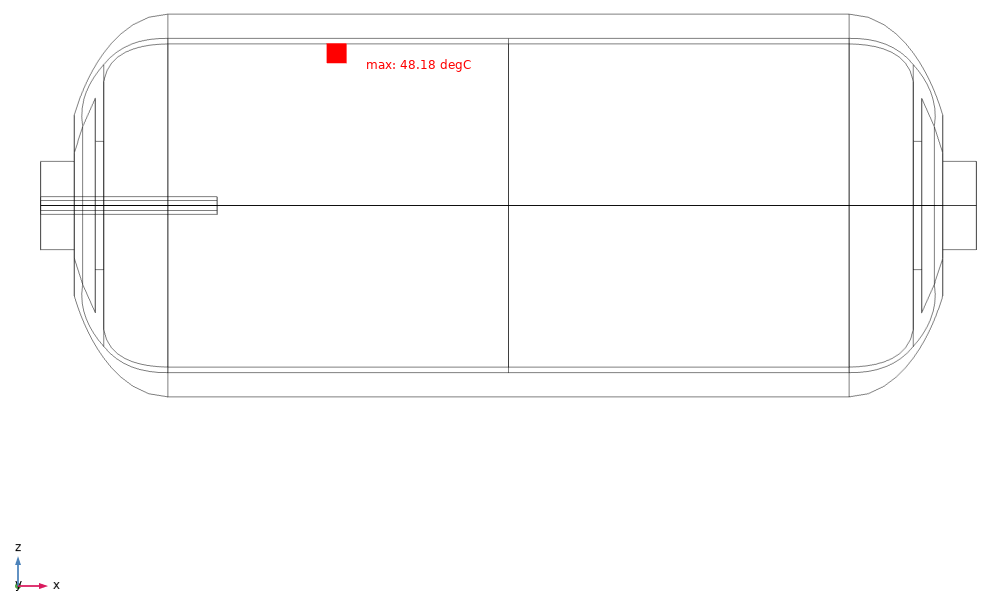
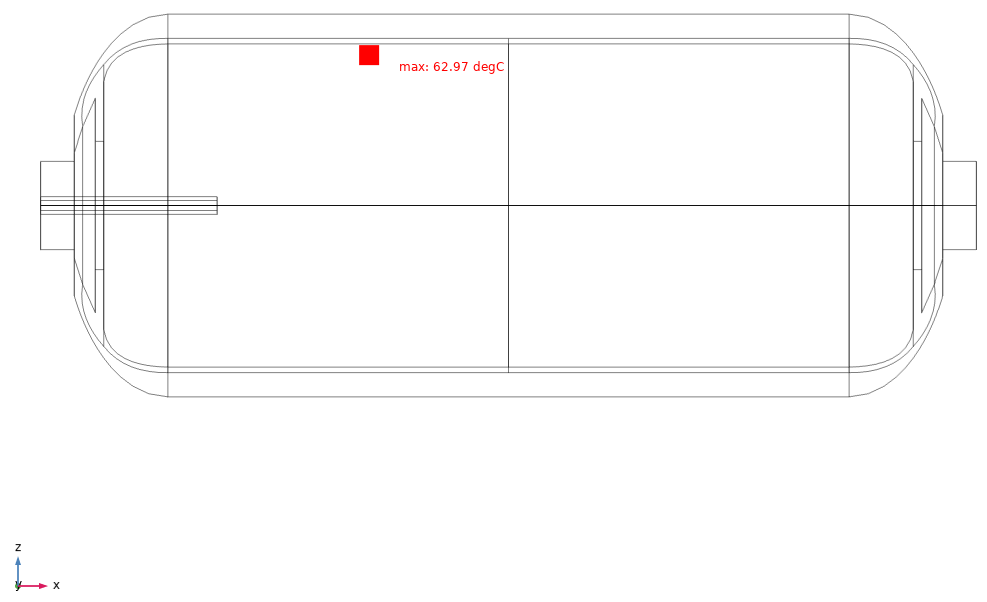
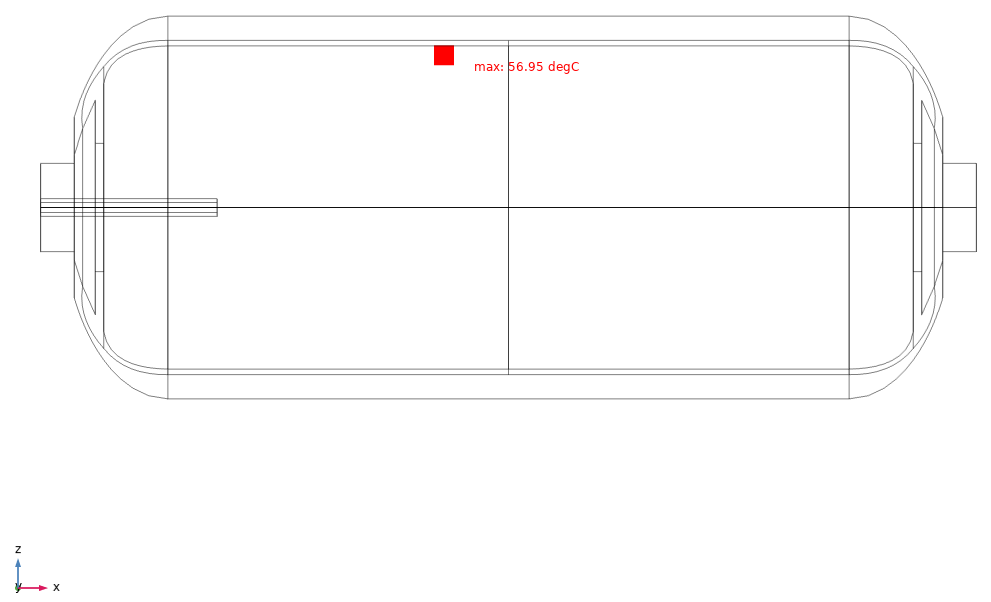
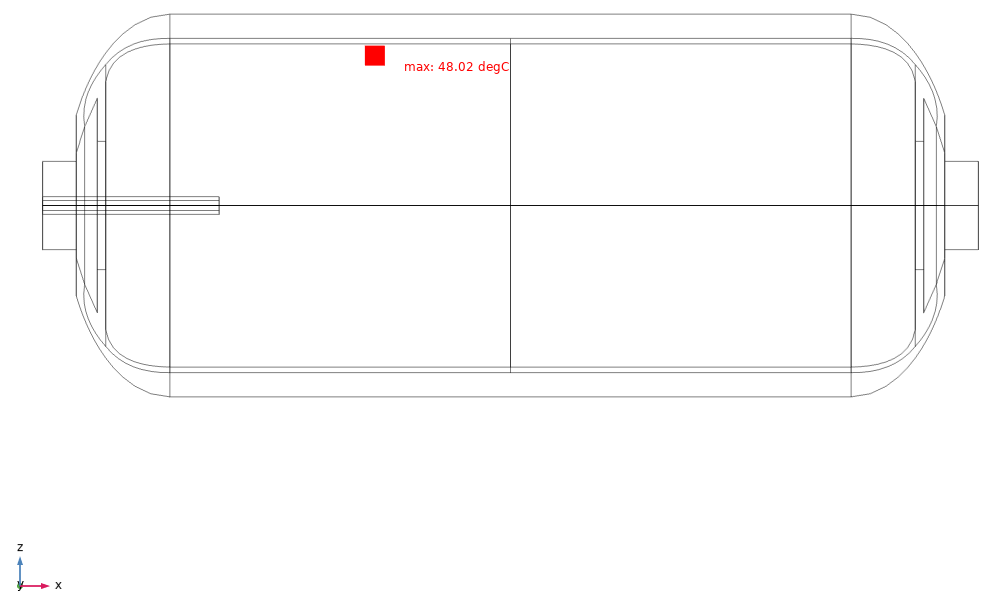
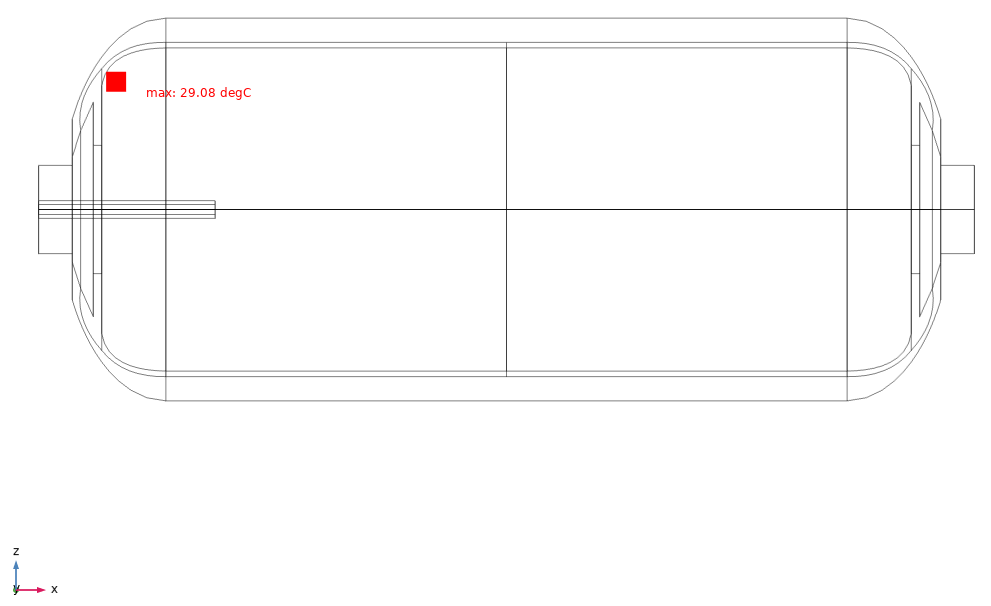
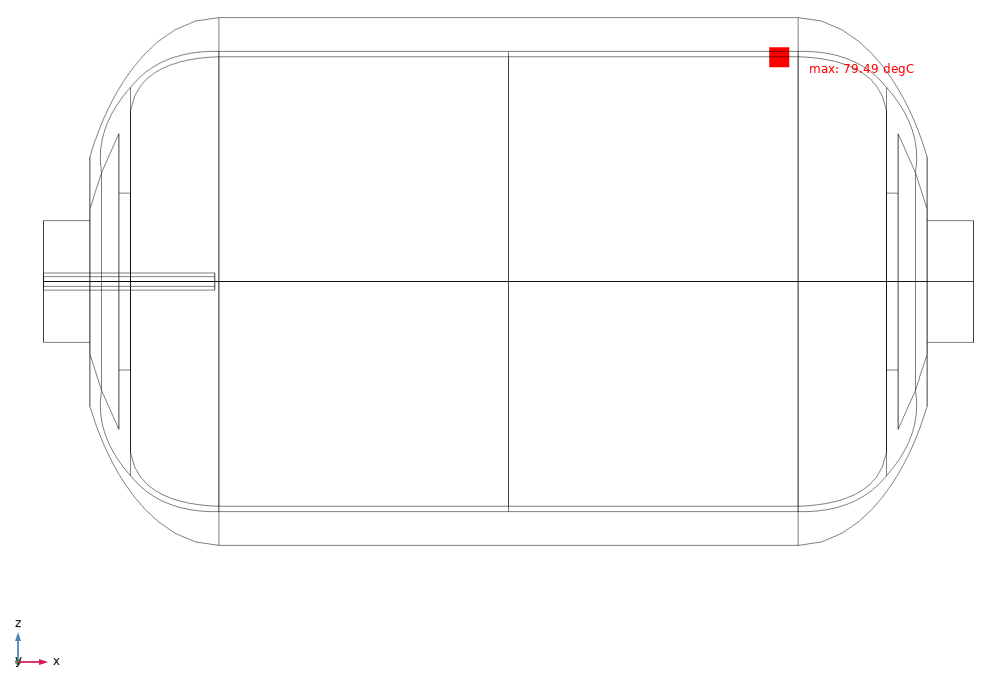
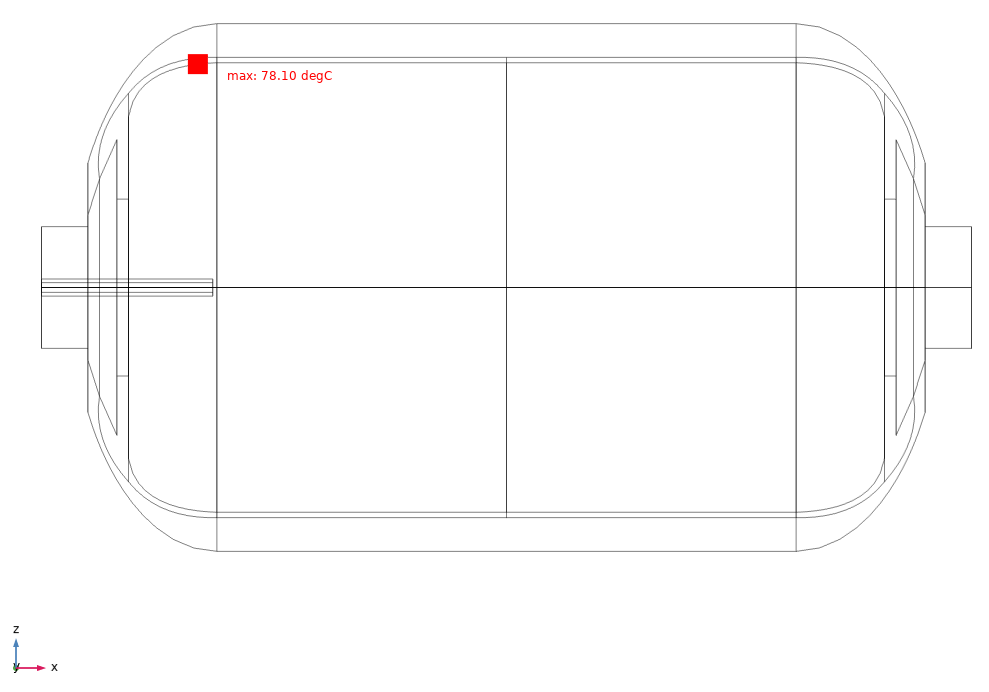
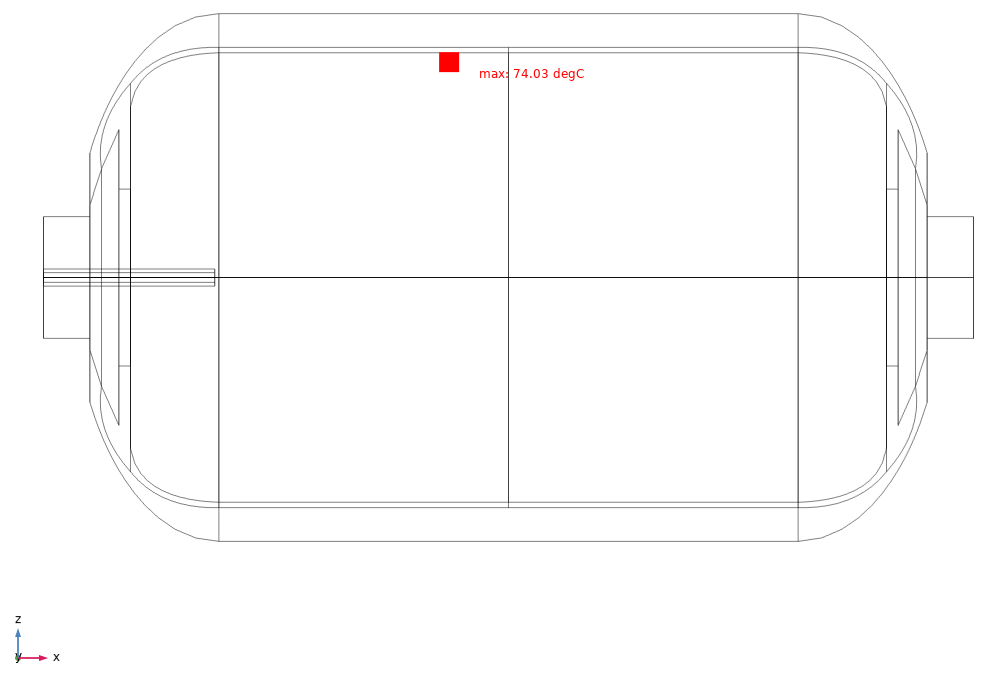
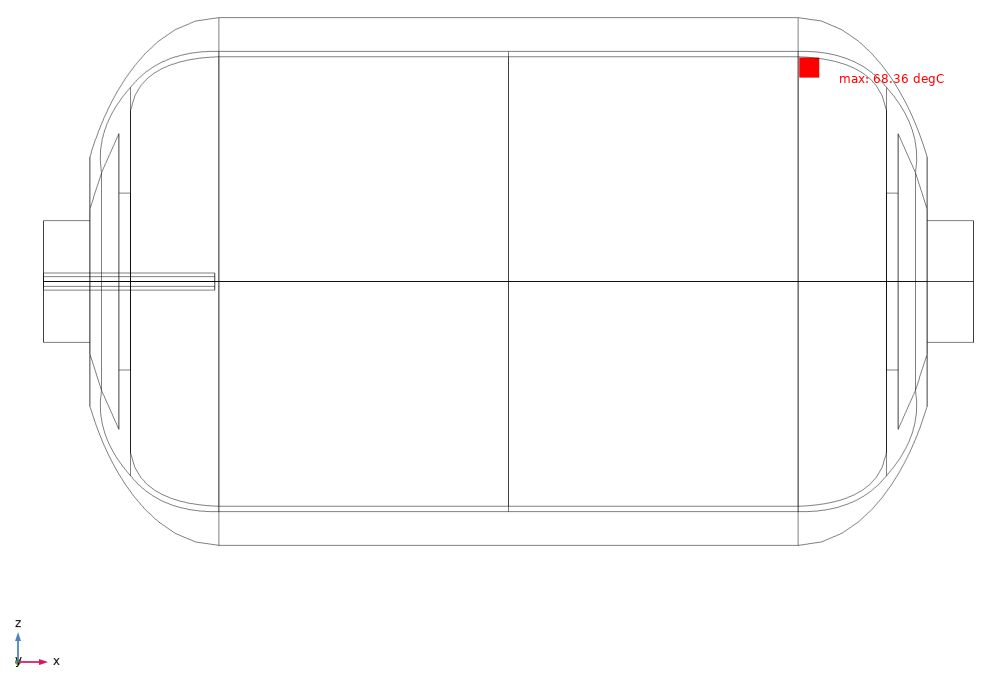
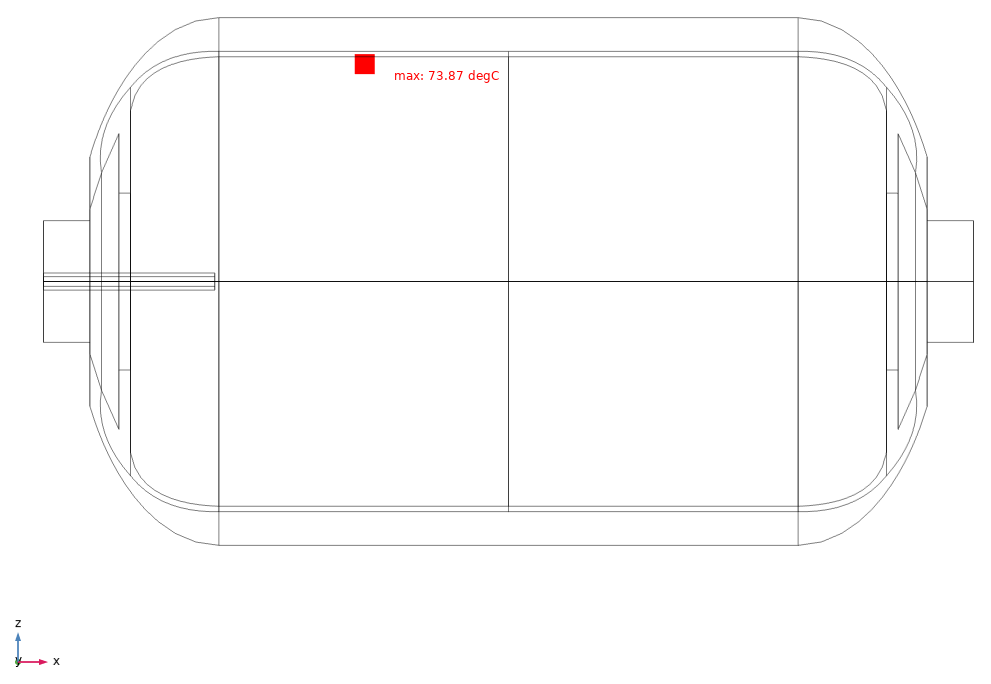
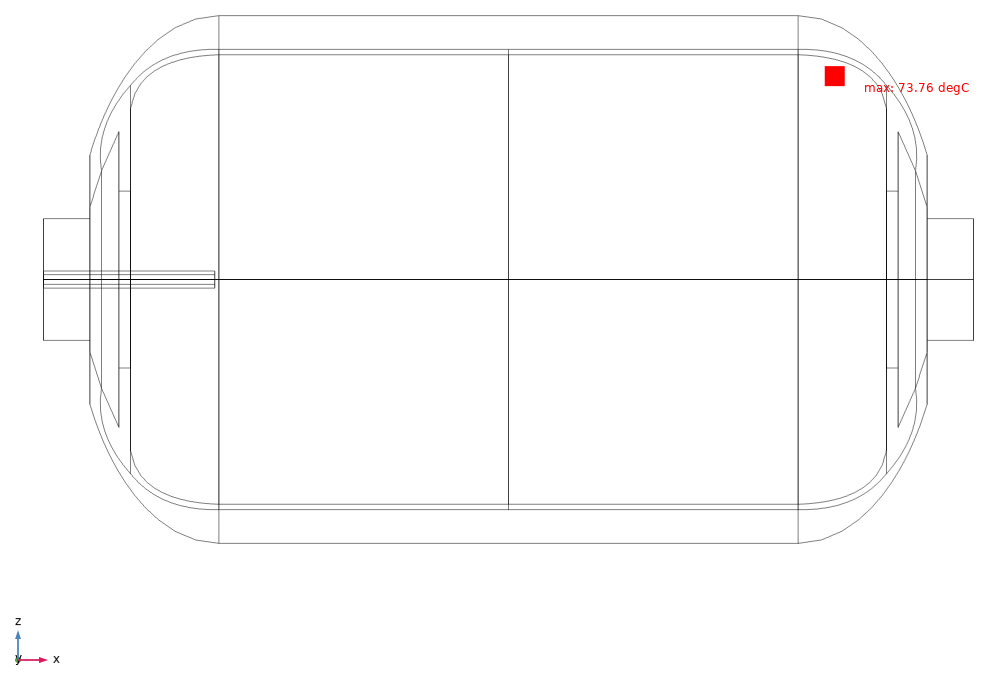
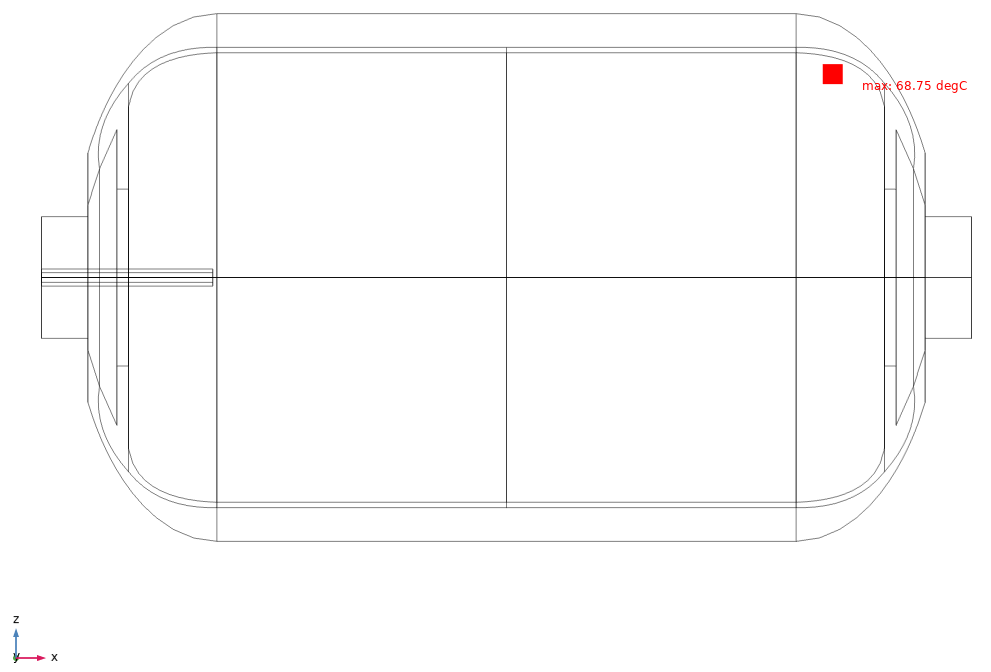
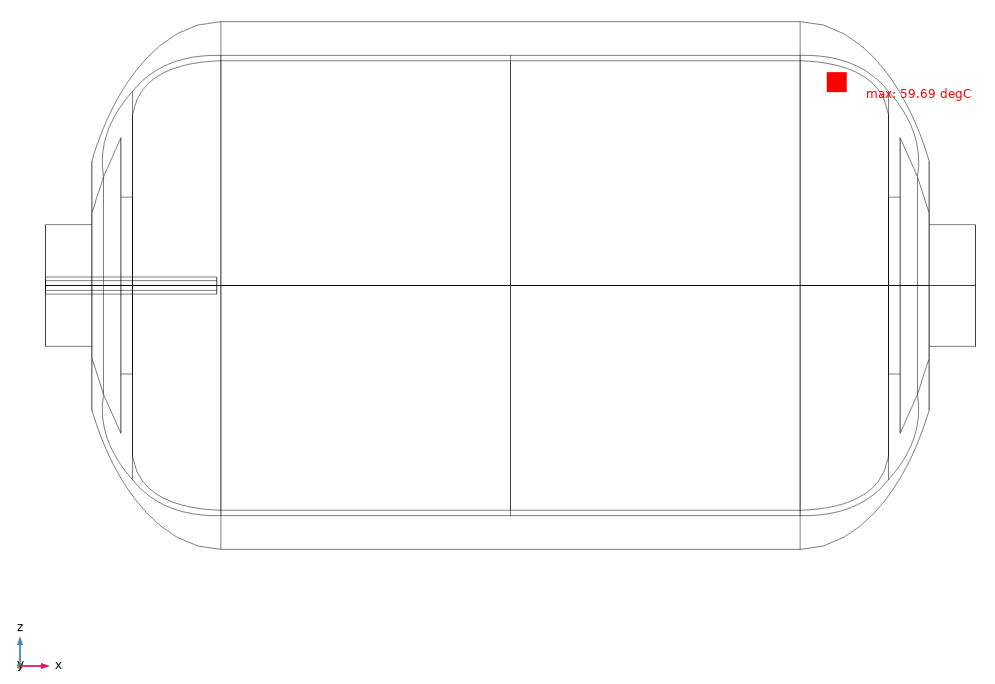
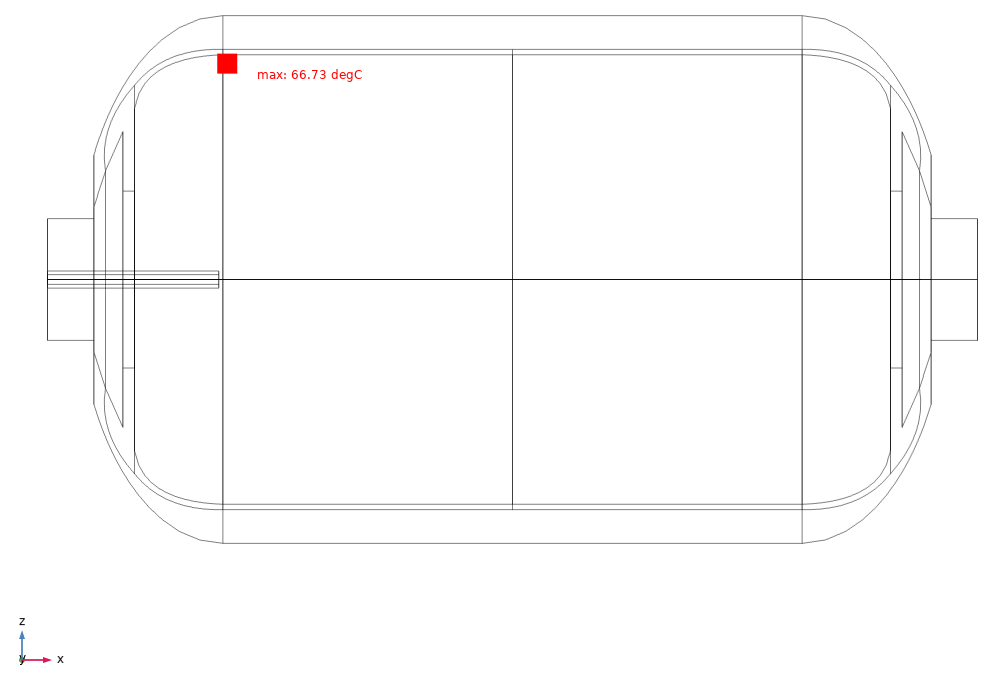
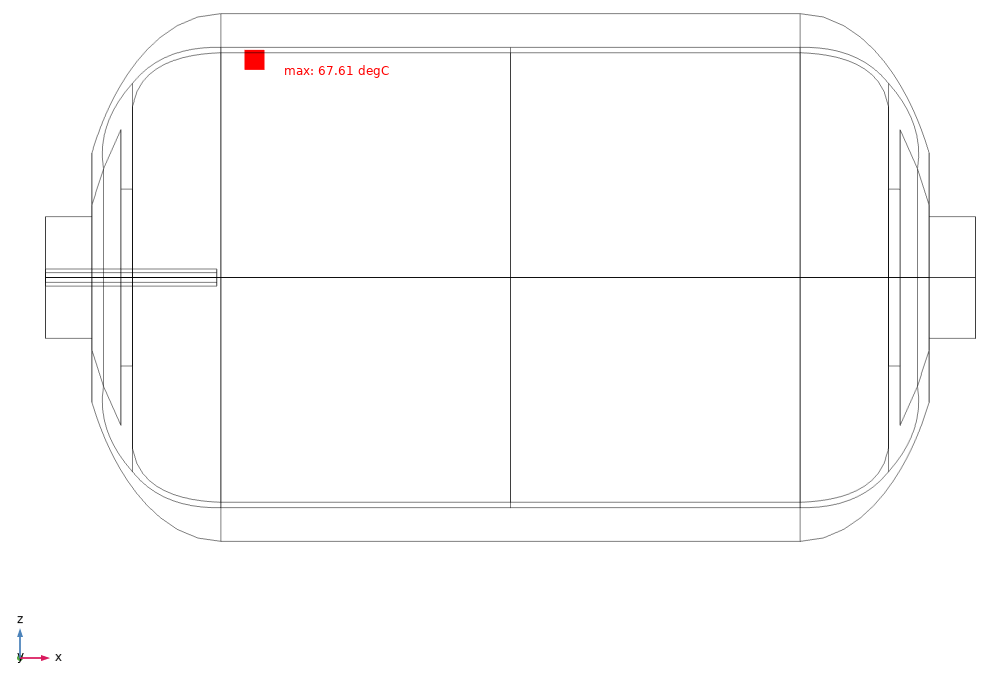
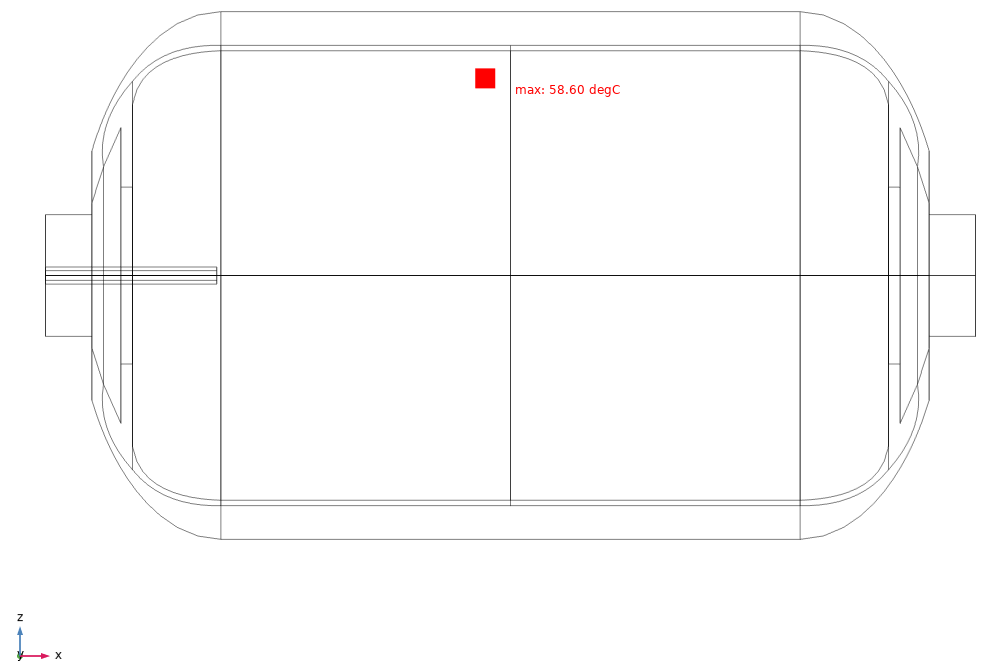
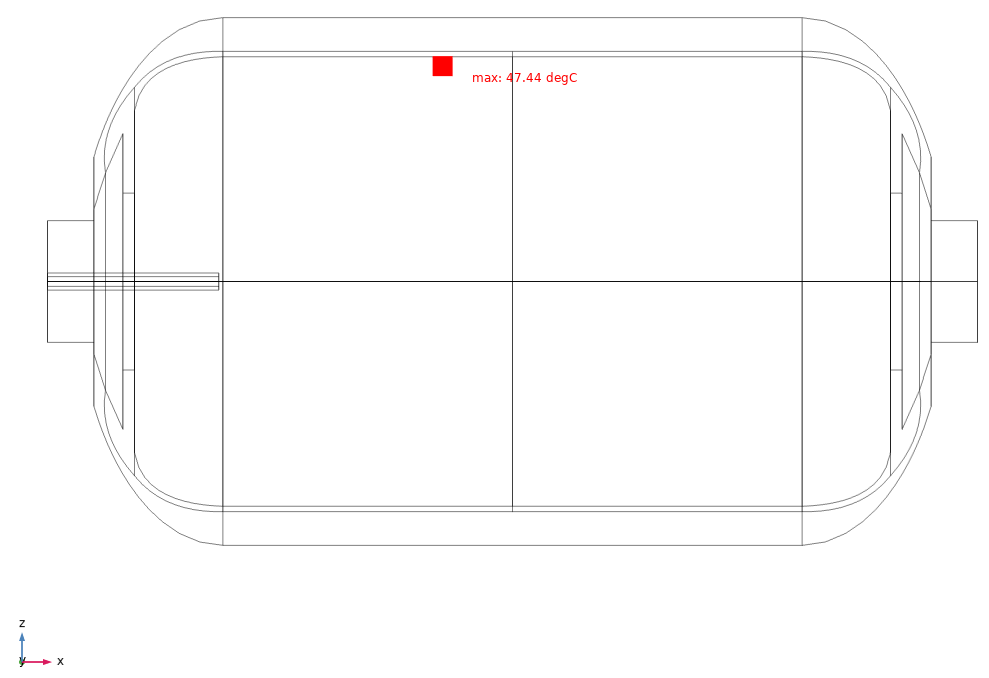
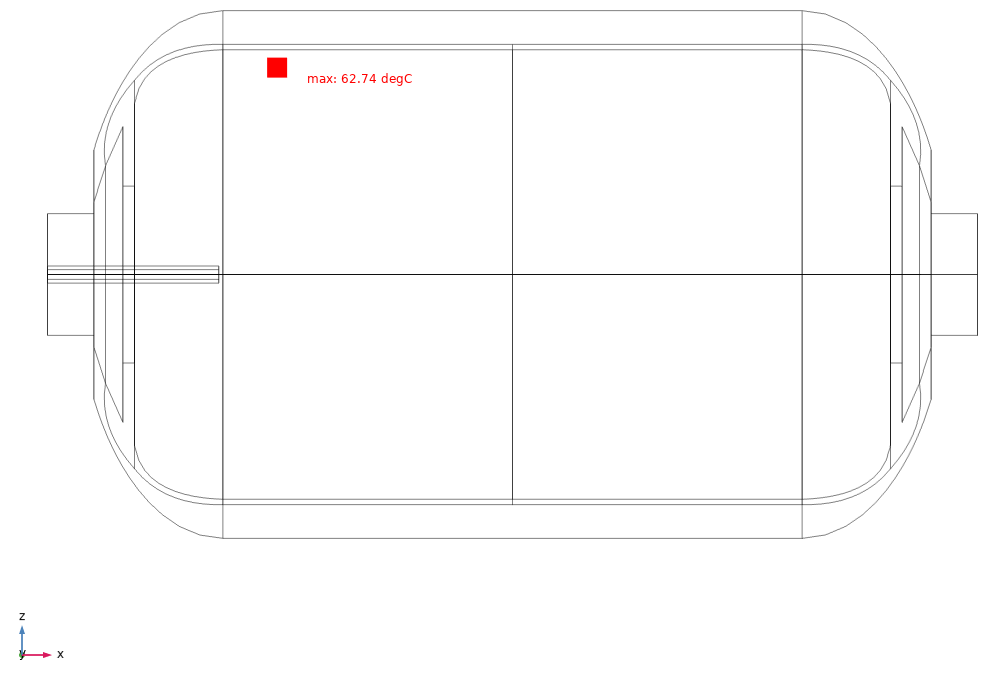
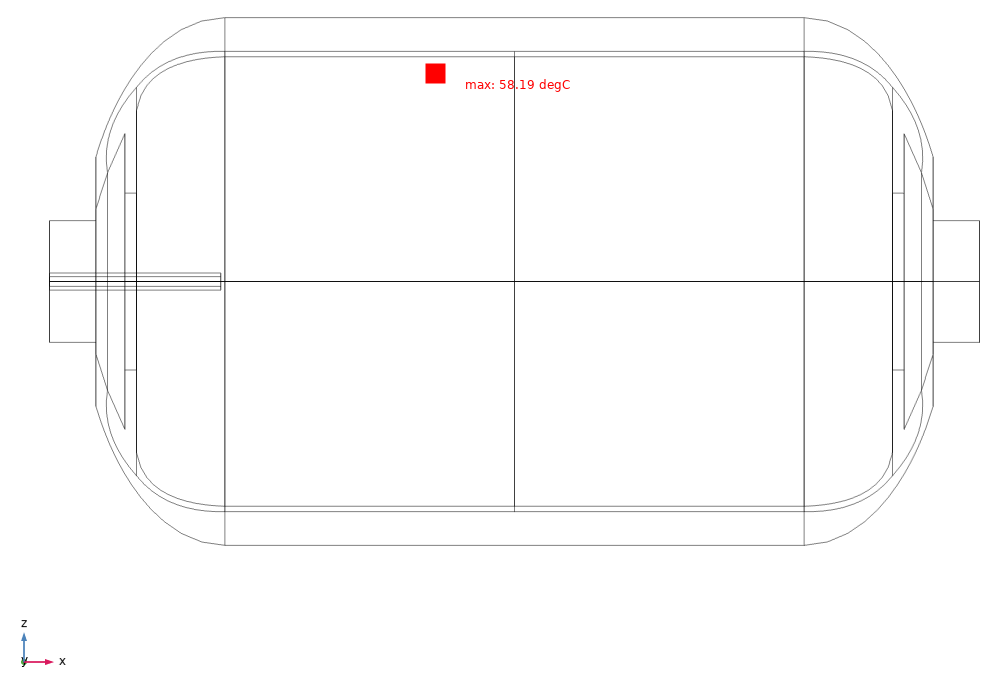
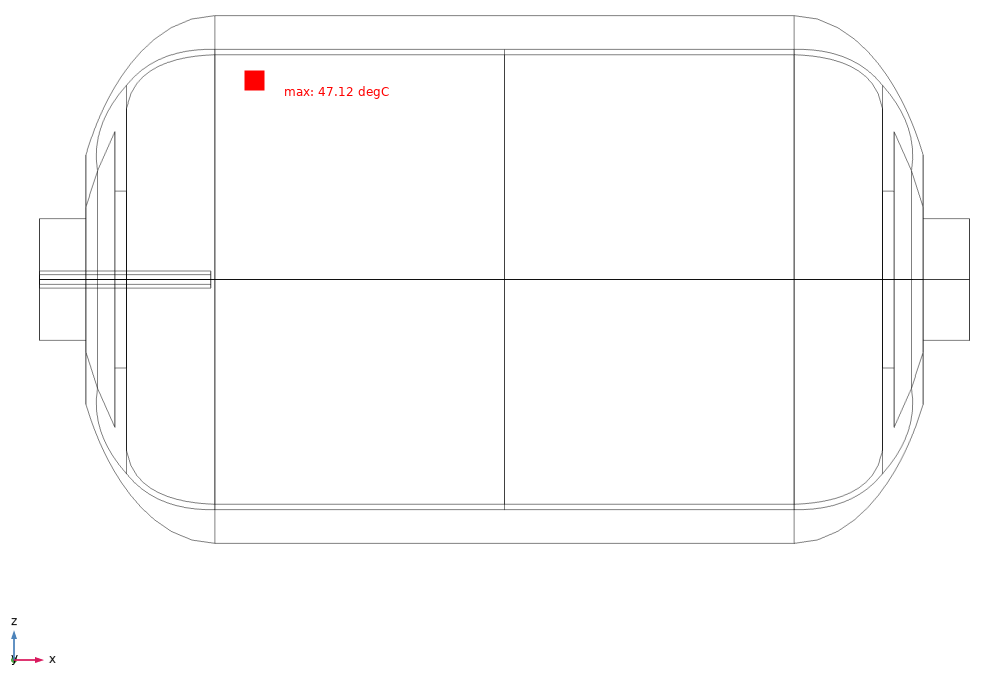
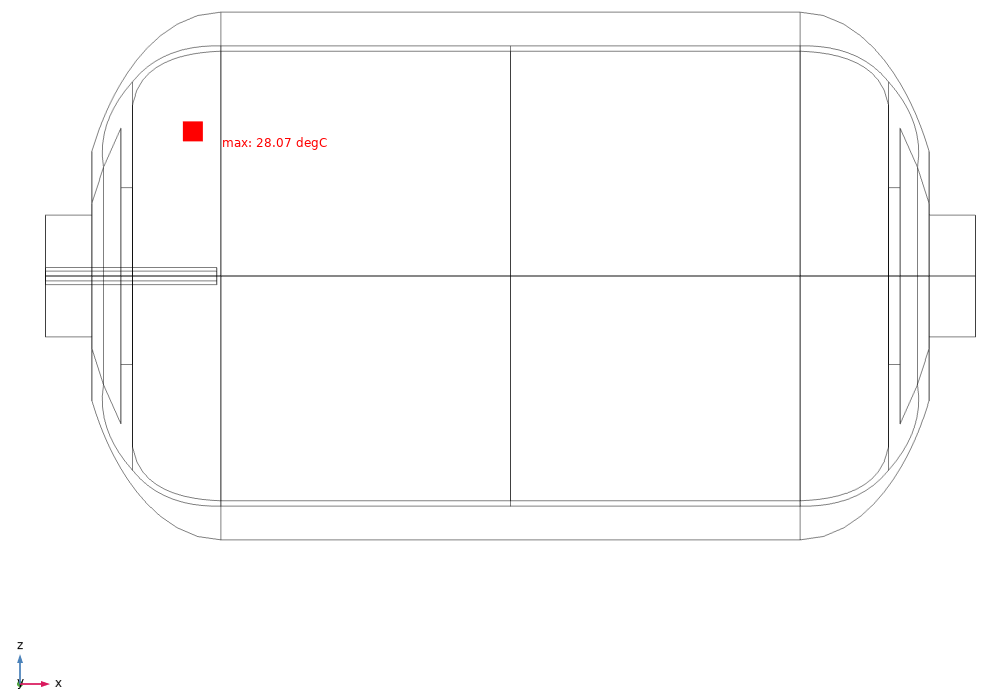
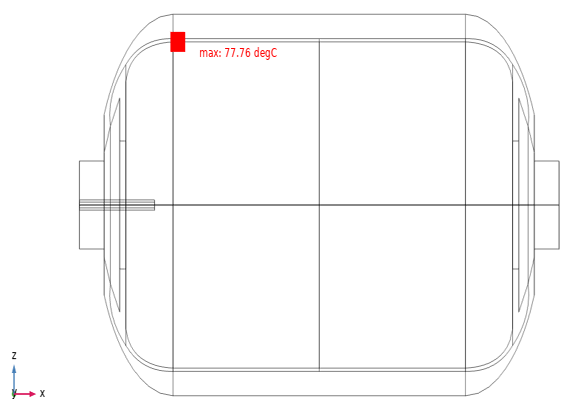
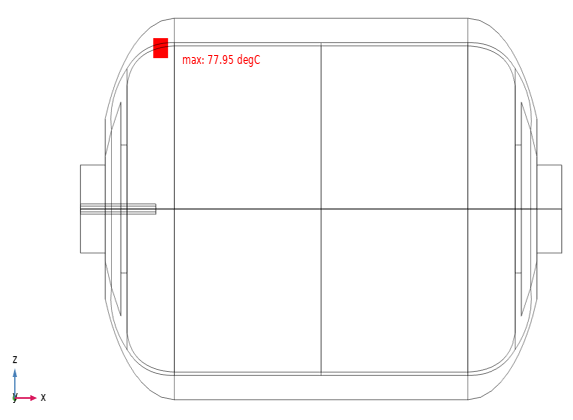
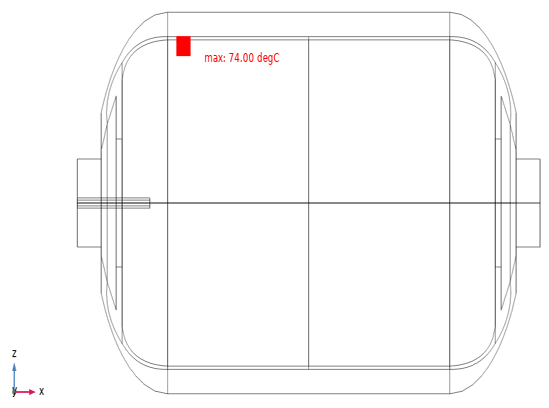
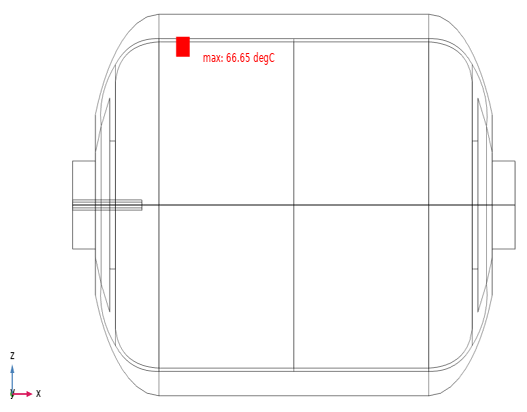
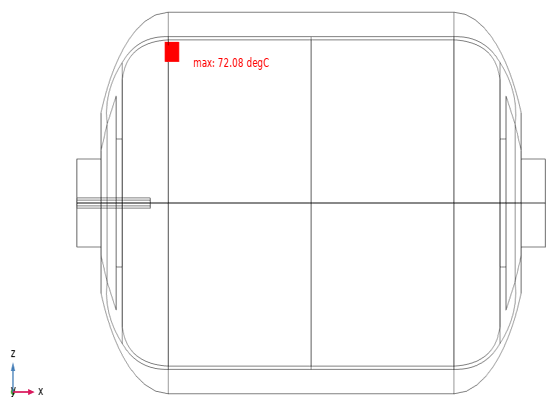
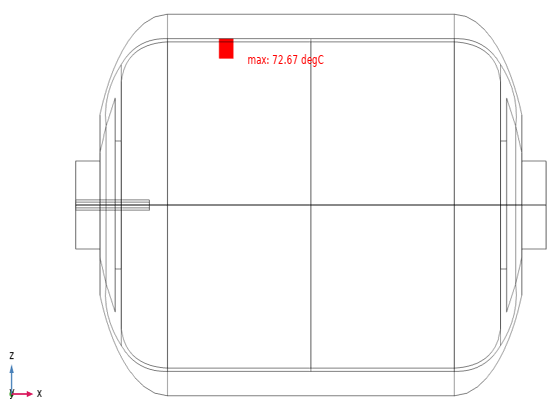
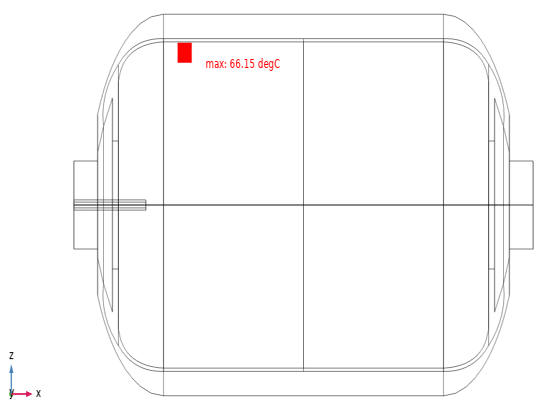
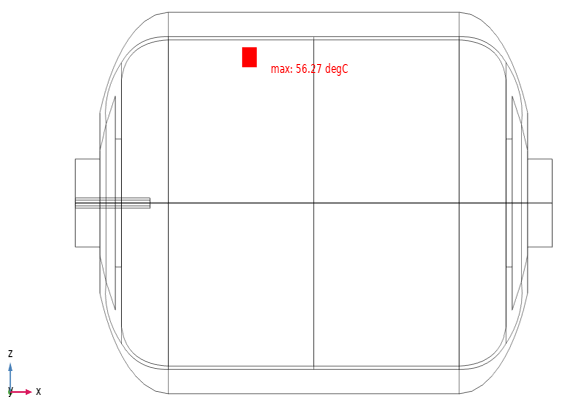
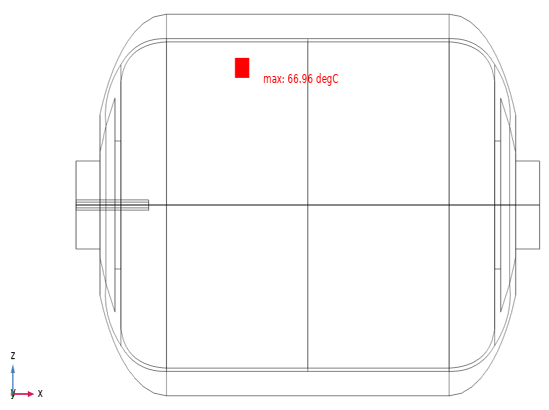
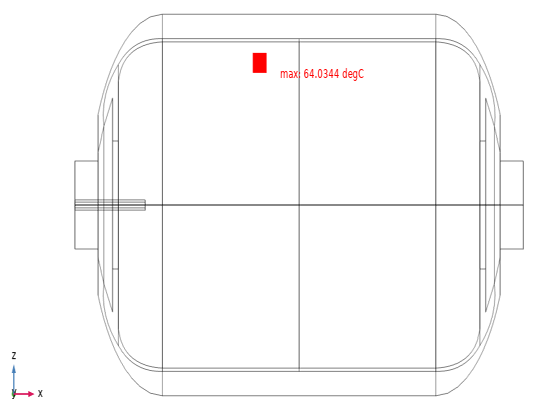
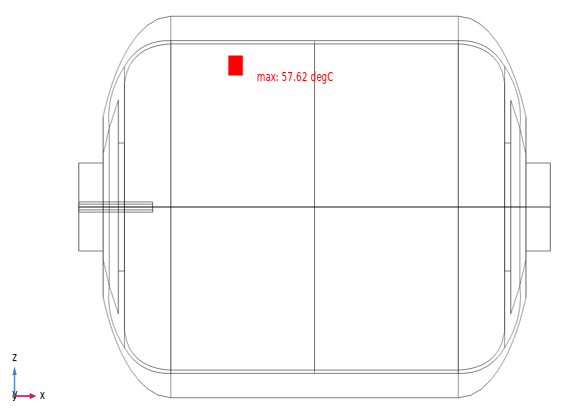
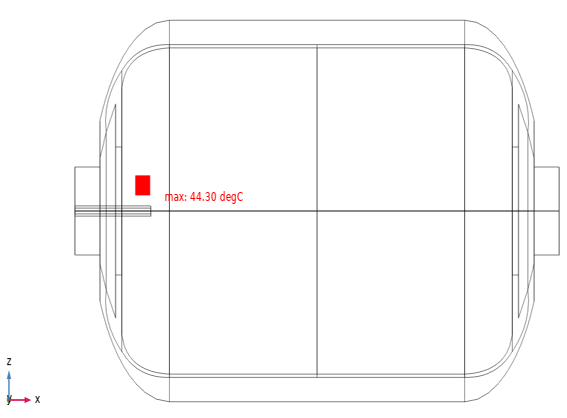
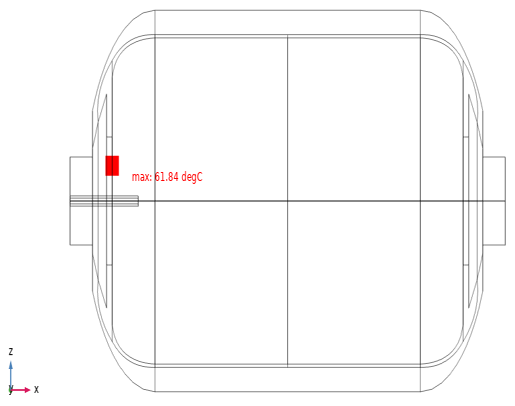
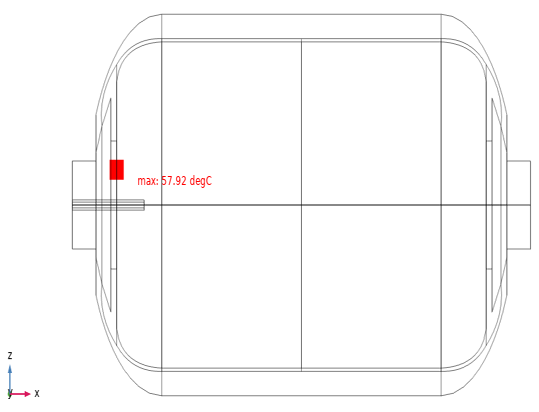
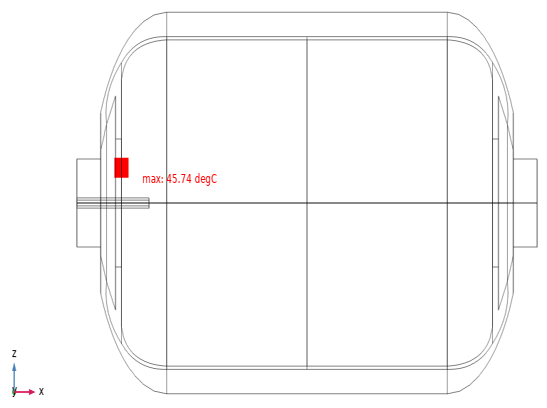
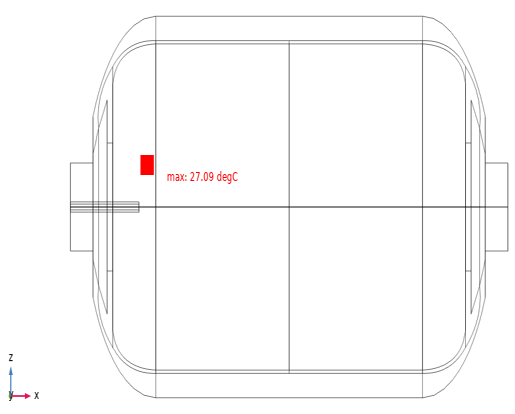
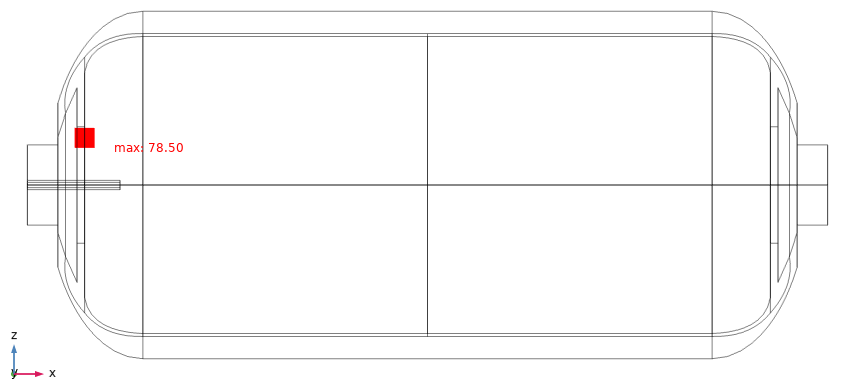
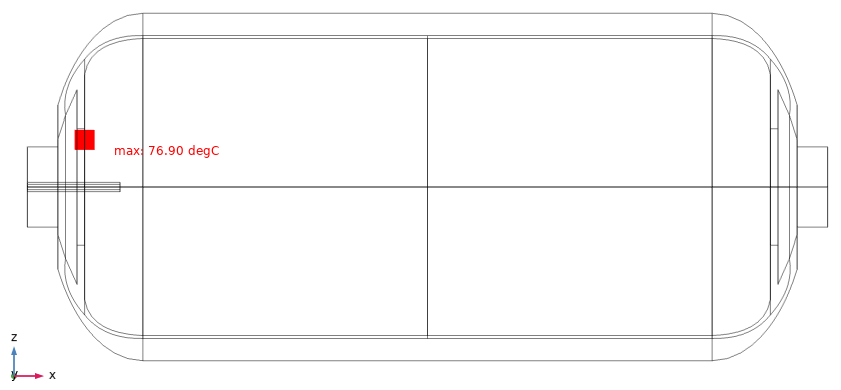
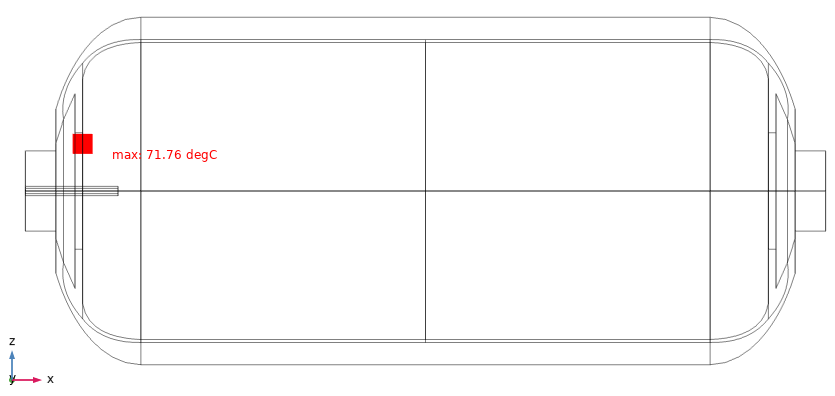
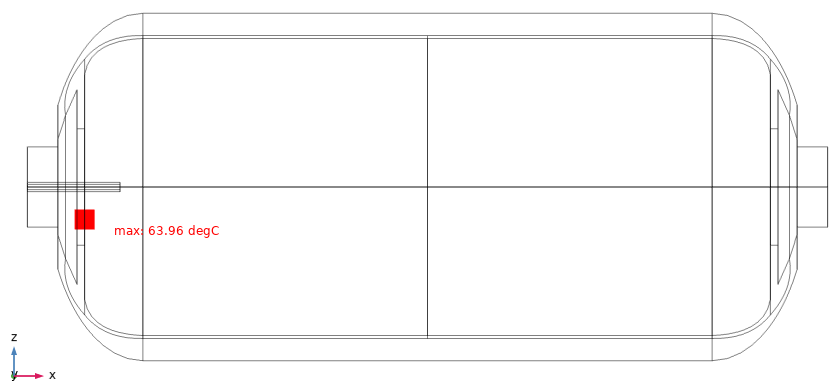
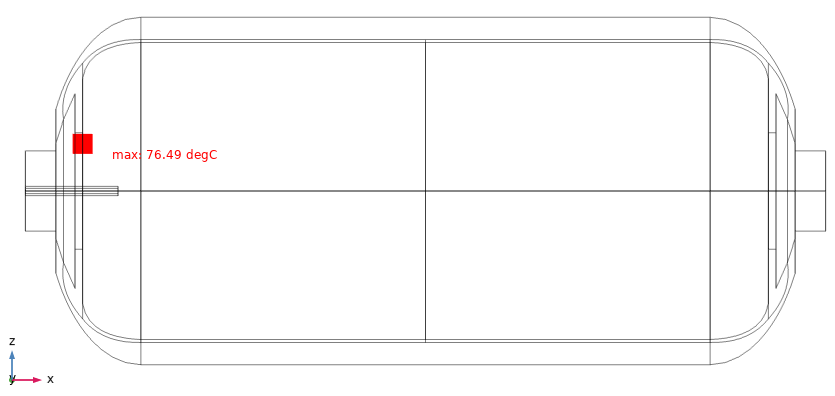
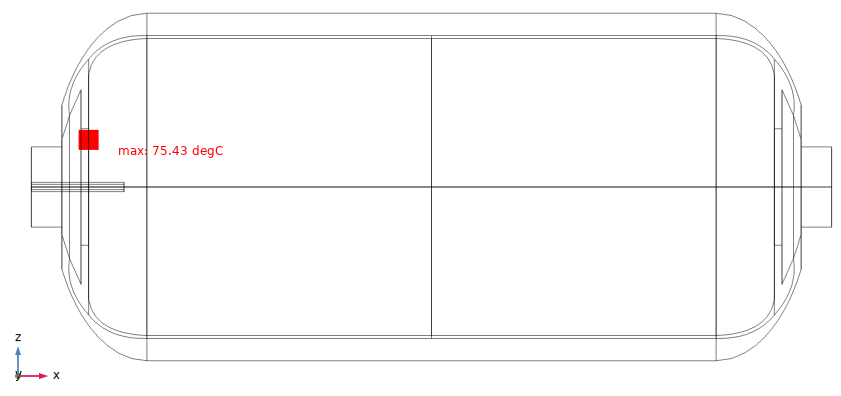
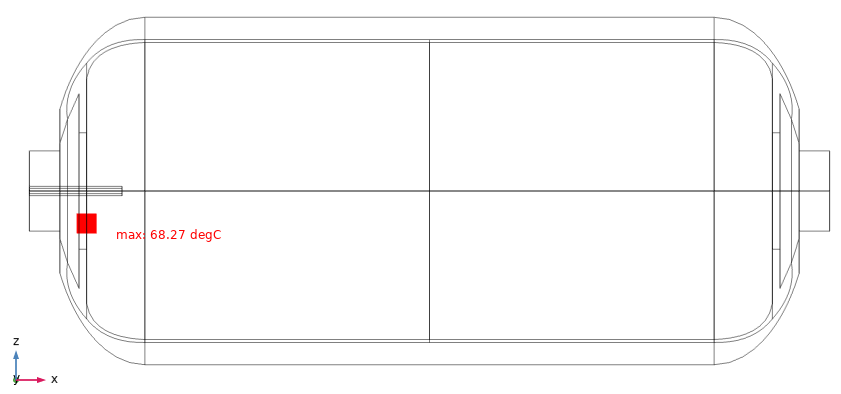
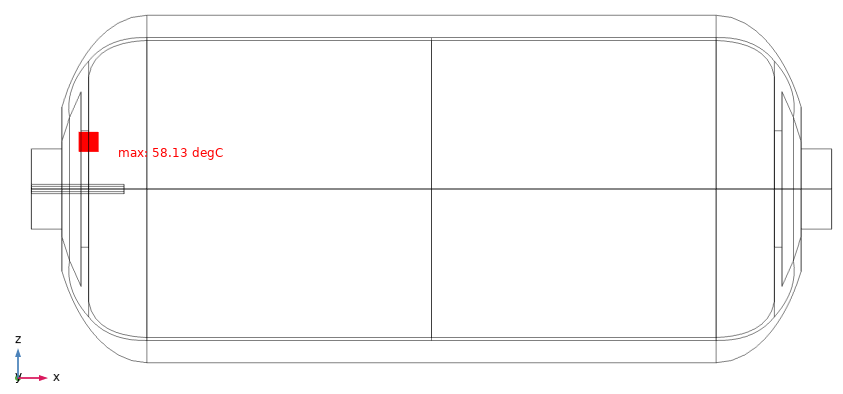
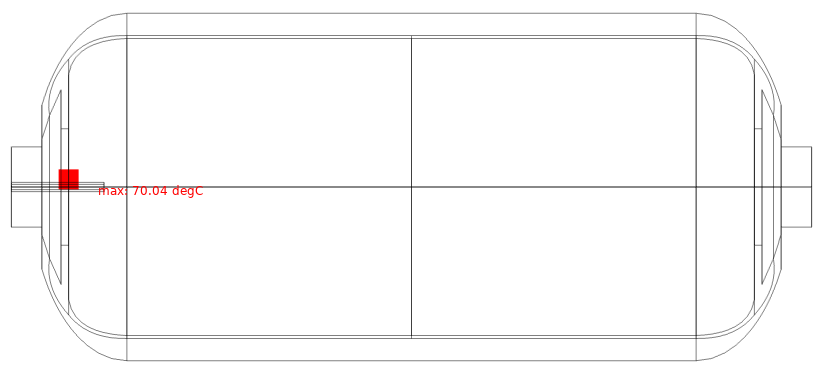
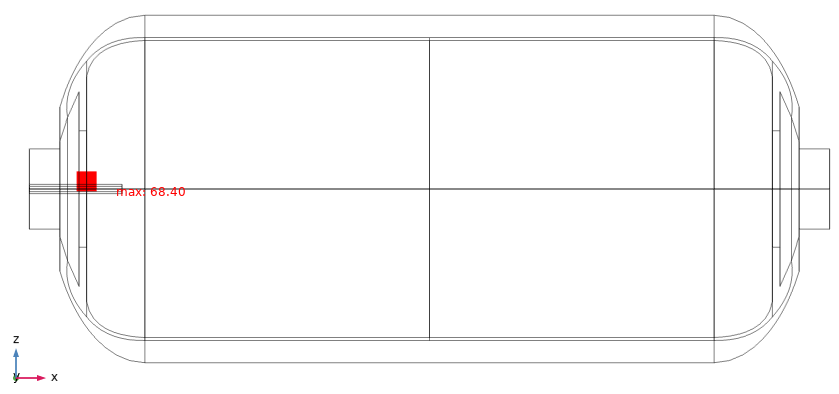
The points where the maximum temperature appears at the end of filling are summarized in Table 4, Table 5, Table 6 and Table 7 with respect to the initial conditions. In most cases, the maximum temperature is found at the top of the tank, but for CHSS D, the maximum temperature is predicted to occur close to the centerline (see Table 7). The temperature distribution with time is closely related to the flow pattern within the tank. As the length of the tank increases, the velocity of the inflowing hydrogen decreases when it reaches the rear wall of the tank, and the magnitude of the rising flow decreases. Therefore, unlike other tanks, it is analyzed that the maximum temperature occurs near the centerline in CHSS D. However, it could be suggested that the temperature at the top of a tank should be considered if the aim is for a more effective refueling method is proposed for horizontal fillings, as even in CHSS D the maximum temperature does not differ significantly from the temperature at tank top region.
Table 4.
Maximum temperature point for CHSS A at the end of refueling.
Table 5.
Maximum temperature point for CHSS B at the end of refueling.
Table 6.
Maximum temperature point for CHSS C at the end of refueling.
Table 7.
Maximum temperature point for CHSS D at the end of refueling.
Table 8, Table 9, Table 10 and Table 11 contain the maximum and average temperatures with respect to the initial conditions. The estimated SOCs are also presented in each table. In general, the difference between the average temperature and the maximum temperature becomes smaller when an initial pressure is high, as a smaller amount of hydrogen is filled and the refueling time is short. However, under conditions of low initial pressures, the difference between the two temperatures is not very large compared to the high initial pressure conditions because the refueling time is relatively long and heat is released by thermal interaction with the atmosphere. The temperature difference varies depending on initial conditions and tank dimensions, but is generally not greater than 10 °C. In addition, it is predicted that the maximum temperatures for all the conditions would not exceed the limits of SAE J2601.
Table 8.
Maximum and average temperature with SOC for CHSS A filling.
Table 9.
Maximum and average temperature with SOC for CHSS B filling.
Table 10.
Maximum and average temperature with SOC for CHSS C filling.
Table 11.
Maximum and average temperature with SOC for CHSS D filling.
As for the SOC, it is calculated to be lower in CHSS D compared to other tanks. It is not appropriate to quantitatively compare the SOC because the target pressure presented in SAE J2601 varies depending on initial conditions and the refueling times are also different, but it is found that most of the SOCs are over 85%.
5.3. Maximum Mass Flow Rate
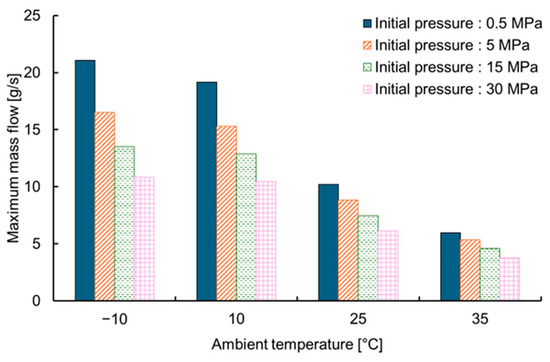
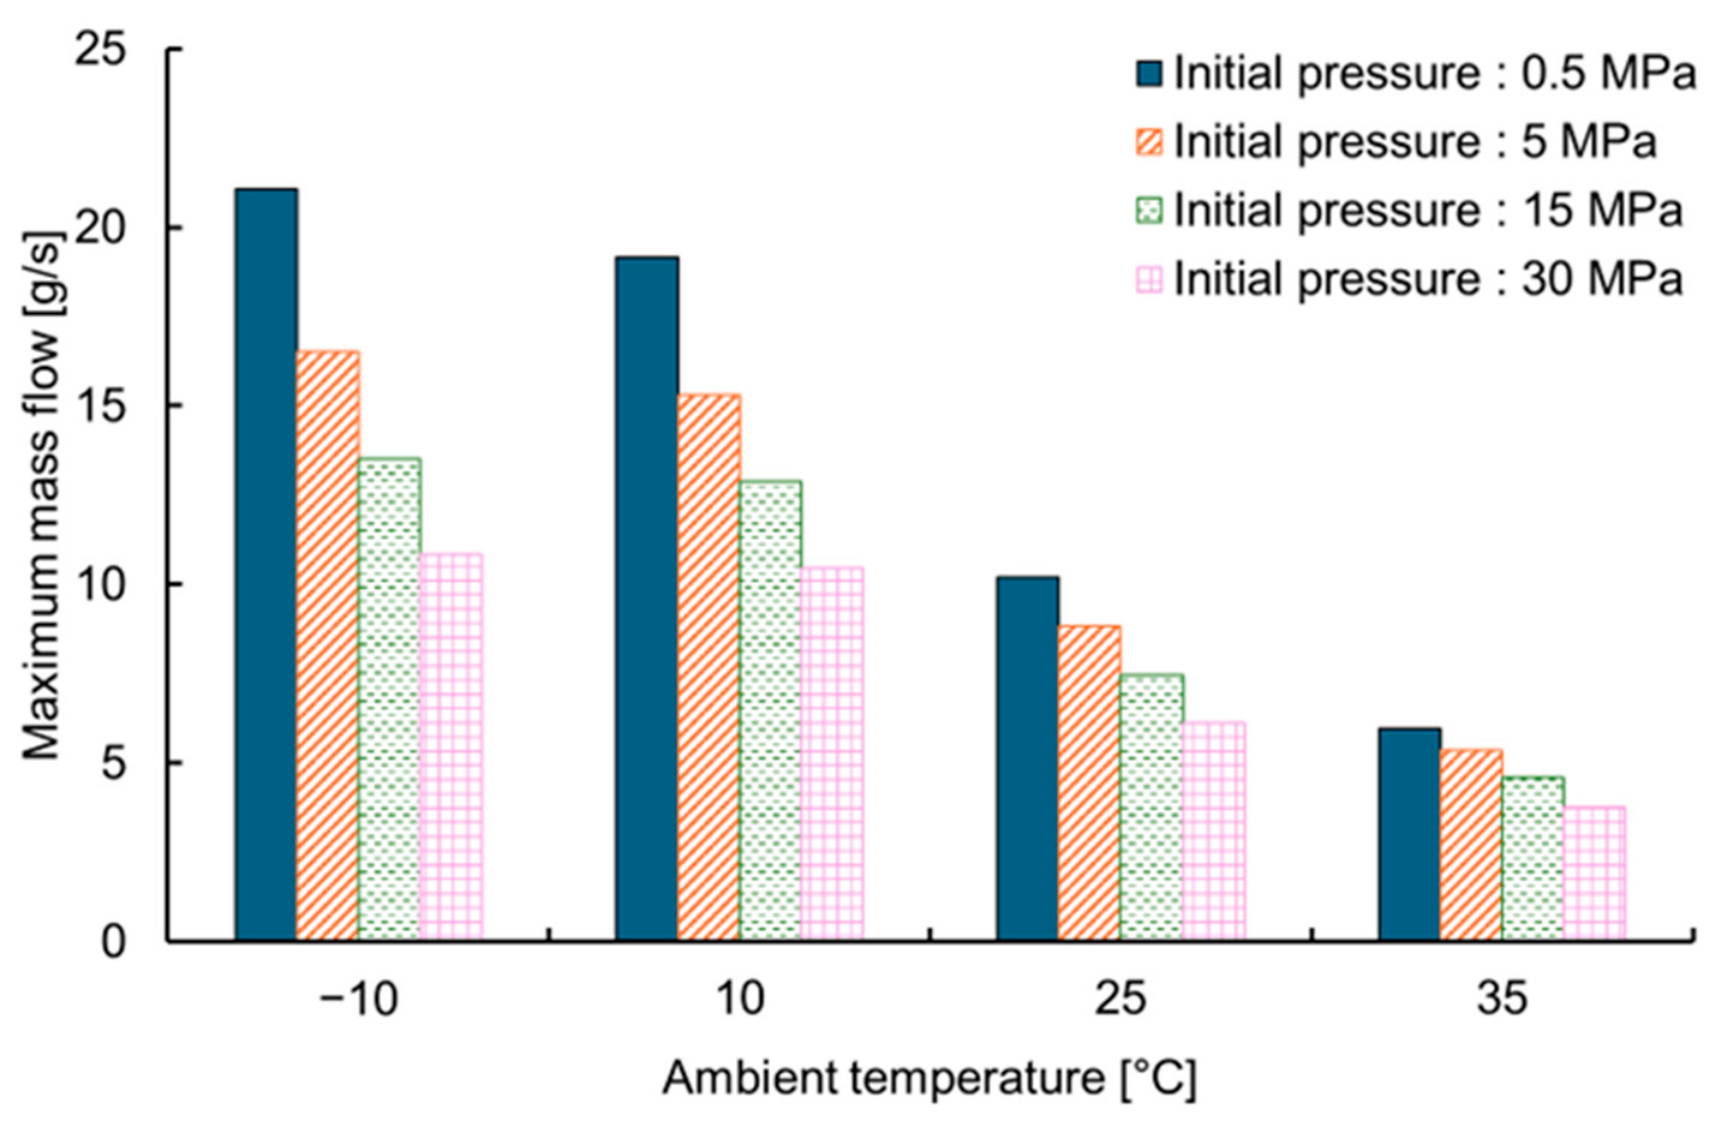
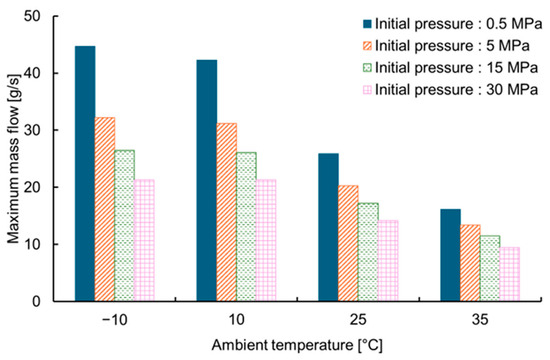
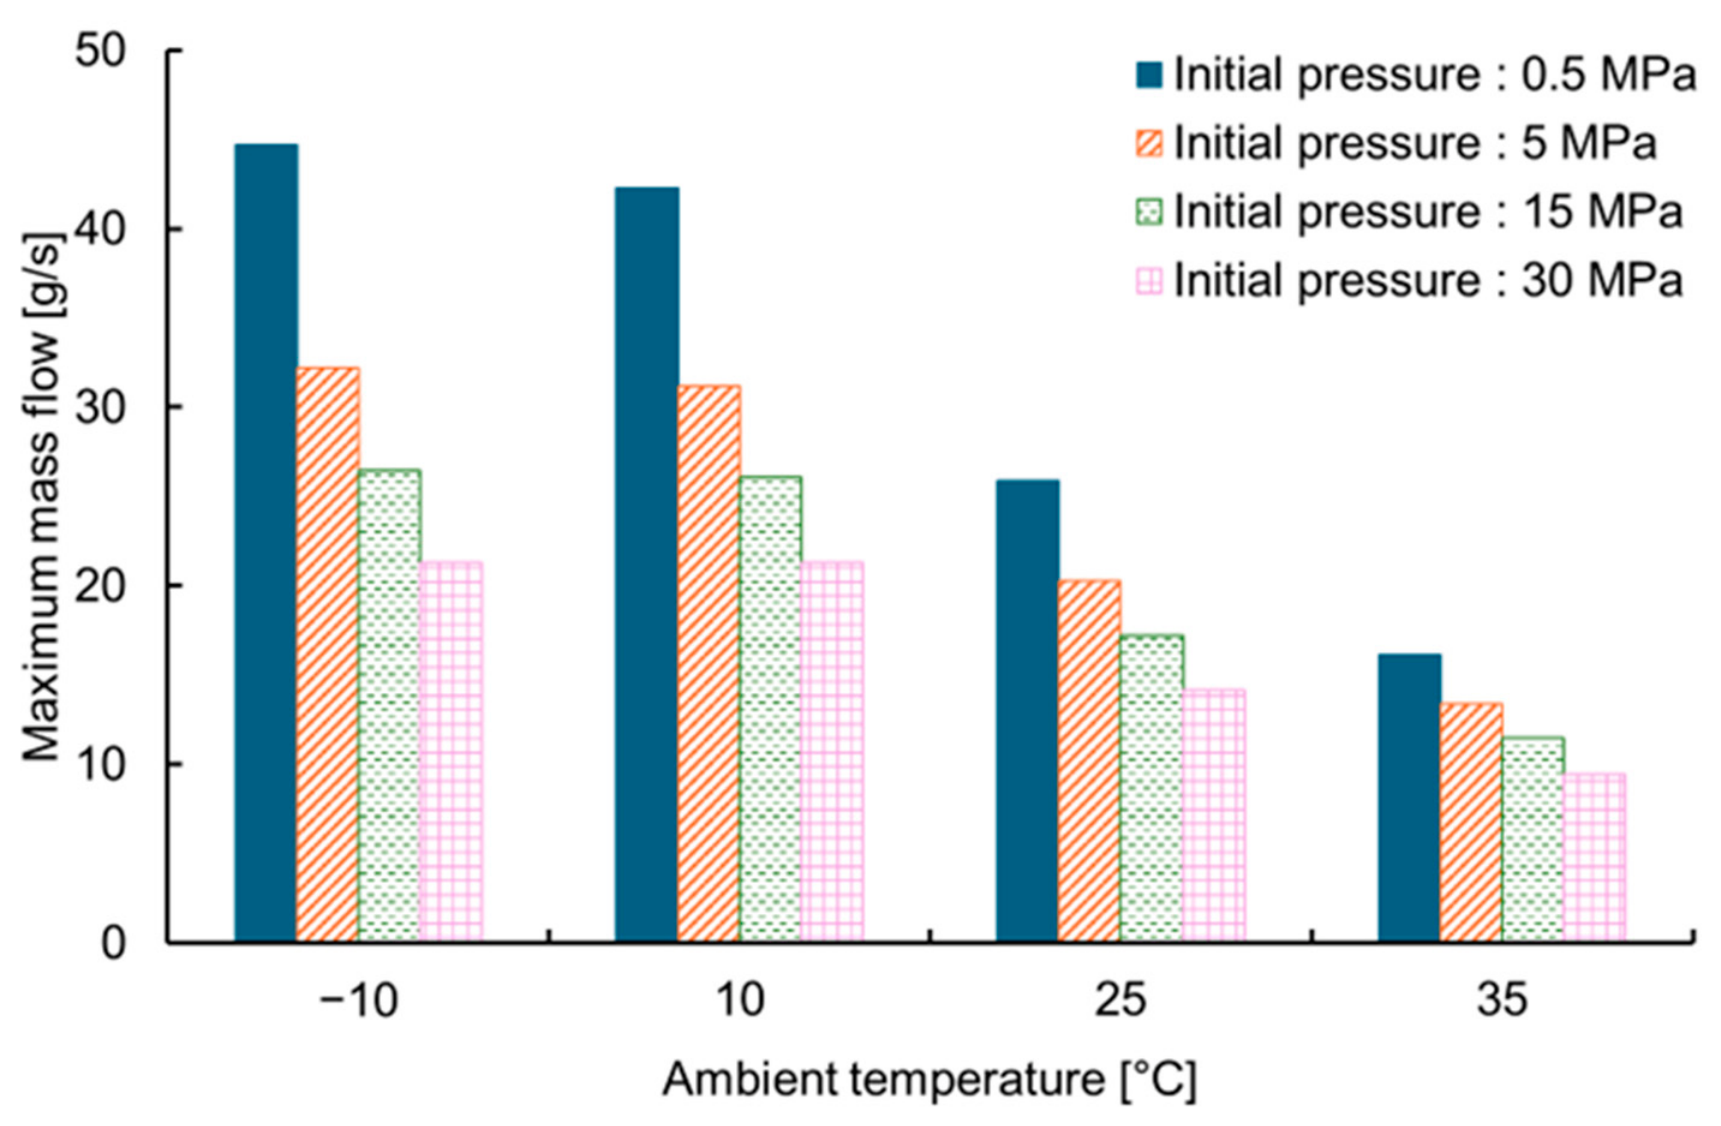
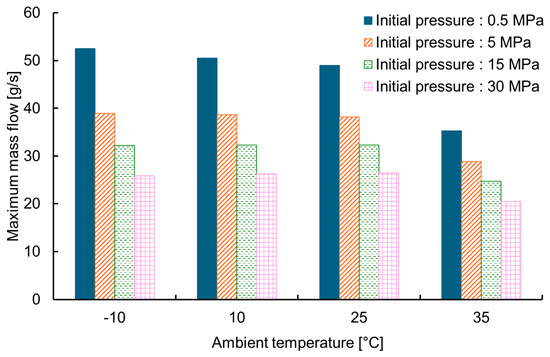
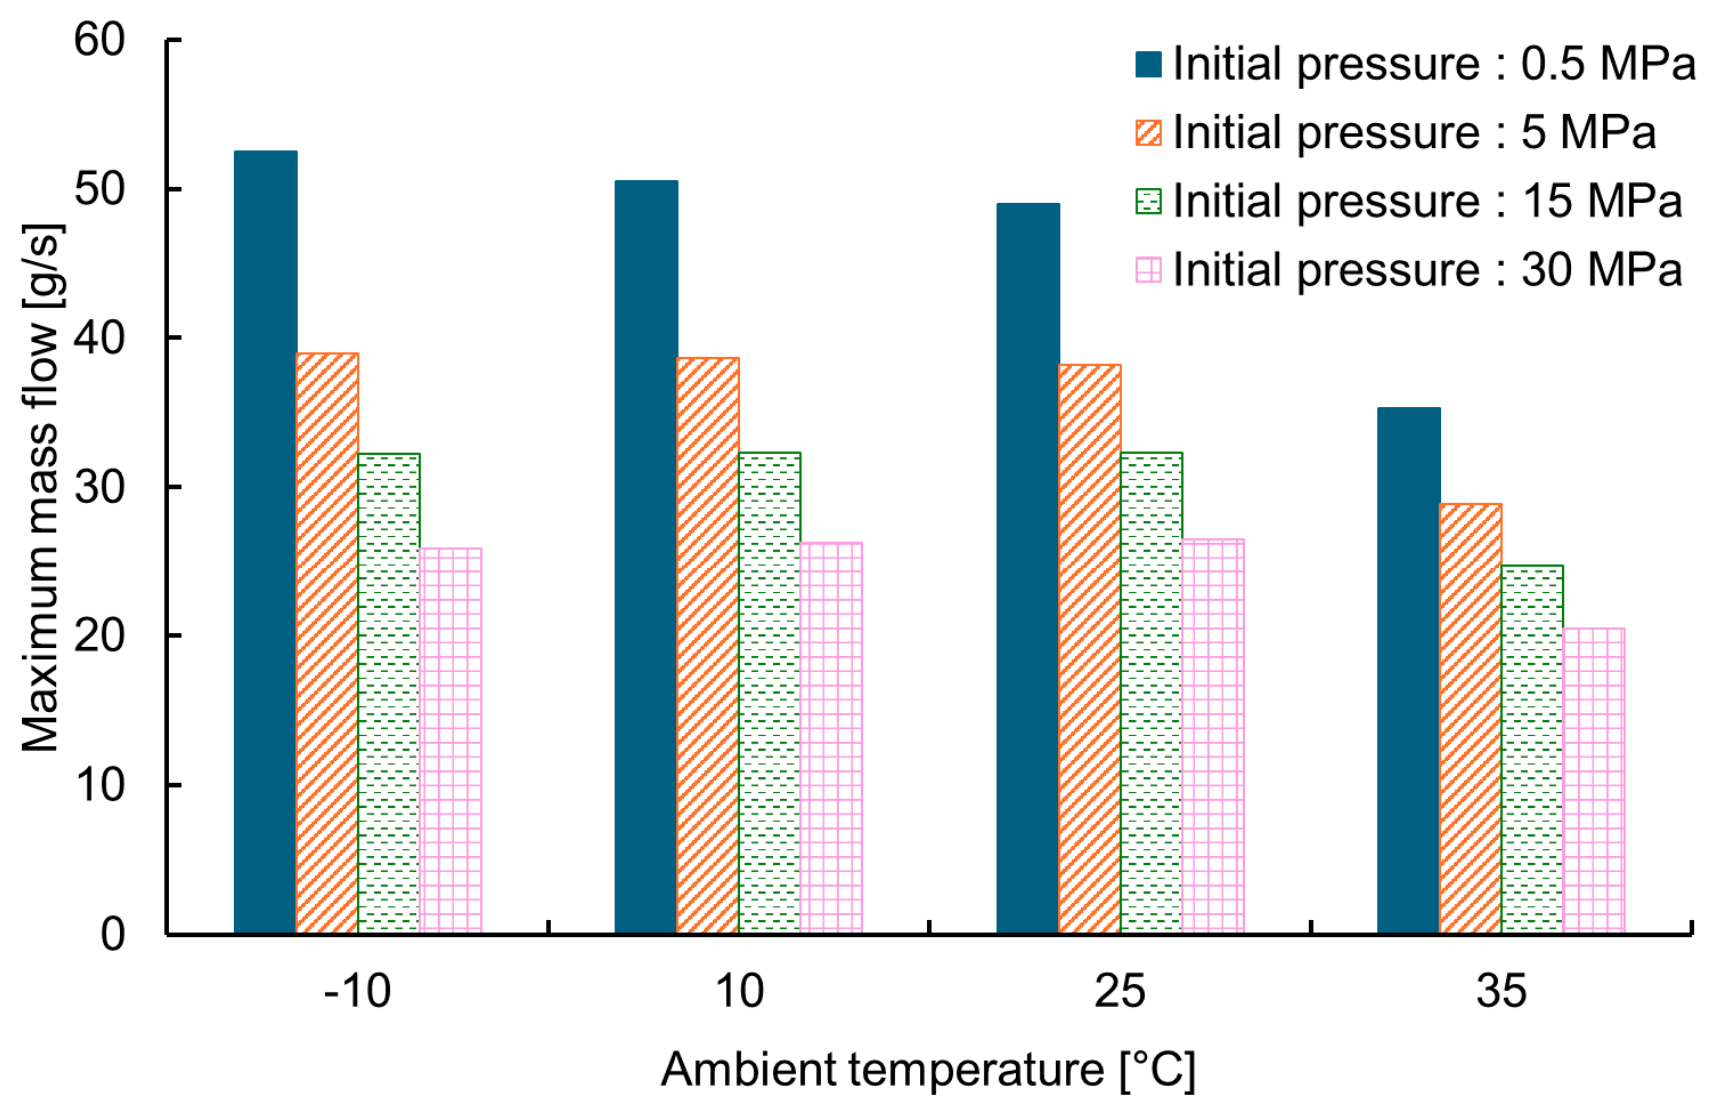
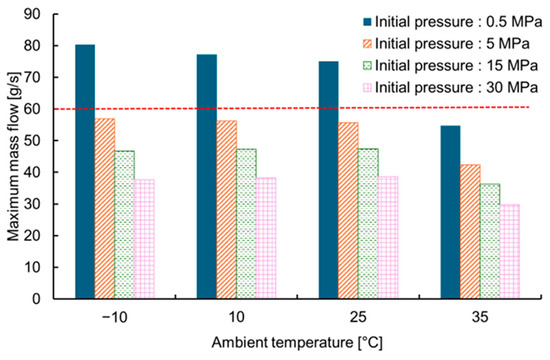
One of the important limitations imposed in SAE J2601 is the maximum mass flow rate. The simulation results on the maximum mass flow rate are shown in Figure 6, Figure 7, Figure 8 and Figure 9. The maximum mass flow rate is found to decrease with increasing initial pressure and ambient temperature. Meanwhile, as the tank capacity increases, the maximum mass flow rate increases accordingly.
Figure 6.
Maximum mass flow rate of CHSS A with initial pressure and ambient temperature.
Figure 7.
Maximum mass flow rate of CHSS B with initial pressure and ambient temperature.
Figure 8.
Maximum mass flow rate of CHSS C with initial pressure and ambient temperature.
Figure 9.
Maximum mass flow rate of CHSS D with initial pressure and ambient temperature.
As for CHSS A, B, and C, all of the estimated mass flow rates are lower than the limitation of 60 g/s. However, hydrogen flow rates are found to be fairly larger than the limitation under low initial pressure conditions in CHSS D (see Figure 9). A peak flow occurs at the beginning of the refueling process when the greatest pressure difference exists between the hydrogen refueling station and the vehicle. In an actual vehicle refueling process, significant pressure drops occur throughout the line from the refueling station to the vehicle, such as nozzle and receptacle. The pressure drop occurring in the pipeline is not considered in the present work as the specifications of a hydrogen line is a characteristic of the refueling station and the vehicle. If the pressure is included, the mass flow rate is expected to decrease because the pressure at the tank inlet will be lower. However, whether these effects would result in mass flow rates below the limiting flow rate remains to be elucidated in further studies.
6. Conclusions
In this work, CFD simulations on the hydrogen filling process were carried out according to the widely accepted hydrogen refueling protocol SAE J2601. A total of 64 simulations were performed with 16 initial conditions for each of the four types of tanks to obtain results on the internal flow and temperature distribution.
The flow pattern inside the tank is closely related to the temperature distribution. Pre-cooled hydrogen flows into the tank and sinks to the bottom, creating a temperature difference between the top and bottom of the tank. The maximum temperature at the end of the refueling process is typically found at the top of the tank, although the exact location appears to vary depending on initial conditions and tank geometry.
The maximum temperatures were calculated and it was found that under a certain condition the maximum temperature exceeds the average temperature by over 10 °C. But the maximum temperatures for all the cases did not exceed the temperature limited by the hydrogen refueling protocol. These temperature differences will need to be taken into account when developing more efficient protocols. In addition, a hydrogen injection method must be developed to reduce the difference between the maximum temperature and the average temperature. An efficient protocol can be readily developed when temperature stratification is alleviated.
In CHSS D filling, it was found that the maximum mass flow rate at low initial pressures exceeds the limiting value of the hydrogen refueling protocol. The results are thought to be due to the effect of neglecting the pressure drop between the hydrogen refueling station and a vehicle. In practice, significant pressure drops occur at the connection of the nozzle and the receptacle, but the pressure drop through a refueling line is not reflected in the present study as it depends on the vehicle and refueling station design.
Current hydrogen refueling protocols have been developed based on thermodynamic models that assume a uniform temperature within the hydrogen storage tank. However, hydrogen temperature stratification within the tank occurs, and CFD studies should be supported to analyze the temperature inhomogeneity. The results of the present study will be used to develop more efficient hydrogen refueling protocols and analyze the safety of hydrogen storage tanks.
Author Contributions
Conceptualization, J.K.; methodology, G.S.S.; software, H.M.S.; validation, G.S.S., H.M.S. and B.H.P.; investigation, G.S.S. and H.M.S.; data curation, G.S.S. and B.H.P.; writing—original draft preparation, G.S.S. and H.M.S.; writing—review and editing, B.H.P.; supervision, J.K. and B.H.P.; G.S.S. and H.M.S. contributed equally to this work. All authors have read and agreed to the published version of the manuscript.
Funding
This research was supported by the Korea Institute of Energy Technology Evaluation and Planning (KETEP) and the Ministry of Climate, Energy and Environment (MCEE) of the Republic of Korea (Project No. RS-2024-00432233, RS-2025-02317950, and RS-2025-25455291).
Data Availability Statement
The original contributions presented in the study are included in the article; further inquiries can be directed to the corresponding author.
Conflicts of Interest
Author Joonho Kim was employed by the company Korea Hydro & Nuclear Power. The remaining authors declare that the research was conducted in the absence of any commercial or financial relationships that could be construed as potential conflicts of interest. The authors declare that this study received funding from Korea Institute of Energy Technology Evaluation and Planning (KETEP). The funder was not involved in the study design, collection, analysis, interpretation of data, the writing of this article or the decision to submit it for publication.
Abbreviations
The following abbreviations are used in this manuscript:
| APRR | Average pressure ramp rate |
| CFD | Computational fluid dynamics |
| CFRP | Carbon fiber reinforced plastic |
| CHSS | Compressed hydrogen storage system |
| DNS | Direct numerical simulation |
| EOS | Equation of state |
| FCEV | Fuel cell electric vehicle |
| HRS | Hydrogen refueling station |
| ICEV | Internal combustion engine vehicle |
| NIST | National Institute of Standards and Technology |
| NWP | Nominal working pressure |
| RANS | Reynolds-averaged Navier–Stokes |
| RK | Redlick–Kwong |
| PR | Peng–Robinson |
| PRR | Pressure ramp rate |
| SAE | Society of Automotive Engineers |
| SOC | State of charge |
| SRK | Soave–Redlich–Kwong |
| vdW | van der Waals |
References
- Sahin, H. Hydrogen refueling of a fuel cell electric vehicle. Int. J. Hydrogen Energy 2024, 75, 604–612. [Google Scholar] [CrossRef] [Scilit]
- Li, M.; Bai, Y.; Zhang, C.; Song, Y.; Jiang, S.; Grouset, D.; Zhang, M. Review on the research of hydrogen storage system fast refueling in fuel cell vehicle. Int. J. Hydrogen Energy 2019, 44, 10677–10693. [Google Scholar] [CrossRef] [Scilit]
- Maus, S.; Hapke, J.; Ranong, C.N.; Wüchner, E.; Friedlmeier, G.; Wenger, D. Filling procedure for vehicles with compressed hydrogen tanks. Int. J. Hydrogen Energy 2008, 33, 4612–4621. [Google Scholar] [CrossRef] [Scilit]
- Franzky, S. High-pressure 825 bar hydrogen storage. Fuel Cells Bull. 2002, 2002, 9–10. [Google Scholar] [CrossRef] [Scilit]
- Barthélémy, H.; Weber, M.; Barbier, F. Hydrogen storage: Recent improvements and industrial perspectives. Int. J. Hydrogen Energy 2017, 42, 7254–7262. [Google Scholar] [CrossRef] [Scilit]
- Zheng, J.; Liu, X.; Xu, P.; Liu, P.; Zhao, Y.; Yang, J. Development of high pressure gaseous hydrogen storage technologies. Int. J. Hydrogen Energy 2012, 37, 1048–1057. [Google Scholar] [CrossRef] [Scilit]
- ISO/TS 15869:2009; Gaseous Hydrogen and Hydrogen Blends—Land Vehicle Fuel Tanks. International Organization for Standardization (ISO): Geneva, Switzerland, 2009.
- SAE. Fueling Protocols for Light Duty Gaseous Hydrogen Surface Vehicles; SAE International: Warrendale, PA, USA, 2020. [Google Scholar]
- Reddi, K.; Elgowainy, A.; Rustagi, N.; Gupta, E. Impact of hydrogen SAE J2601 fueling methods on fueling time of light-duty fuel cell electric vehicles. Int. J. Hydrogen Energy 2017, 42, 16675–16685. [Google Scholar] [CrossRef] [Scilit]
- Bourgeois, T.; Ammouri, F.; Weber, M.; Knapik, C. Evaluating the temperature inside a tank during a filling with highly-pressurized gas. Int. J. Hydrogen Energy 2015, 40, 11748–11755. [Google Scholar] [CrossRef] [Scilit]
- De Miguel, N.; Cebolla, R.O.; Acosta, B.; Moretto, P.; Harskamp, F.; Bonato, C. Compressed hydrogen tanks for on-board application: Thermal behaviour during cycling. Int. J. Hydrogen Energy 2015, 40, 6449–6458. [Google Scholar] [CrossRef] [Scilit]
- Kuroki, T.; Sakoda, N.; Shinzato, K.; Monde, M.; Takata, Y. Dynamic simulation for optimal hydrogen refueling method to Fuel Cell Vehicle tanks. Int. J. Hydrogen Energy 2018, 43, 5714–5721. [Google Scholar] [CrossRef] [Scilit]
- Lemmon, E.W.; Huber, M.L.; Leachman, J.W. Revised standardized equation for hydrogen gas densities for fuel consumption applications. J. Res. Natl. Inst. Stand. Technol. 2008, 113, 341. [Google Scholar] [CrossRef] [Scilit] [PubMed]
- Nasrifar, K. Comparative study of eleven equations of state in predicting the thermodynamic properties of hydrogen. Int. J. Hydrogen Energy 2010, 35, 3802–3811. [Google Scholar] [CrossRef] [Scilit]
- Park, B.H. Calculation and Comparison of Thermodynamic Properties of Hydrogen Using Equations of State for Compressed Hydrogen Storage. Trans. Korean Hydrog. New Energy Soc. 2020, 31, 184–193. [Google Scholar] [CrossRef] [Scilit]
- Wang, L.; Ye, F.; Xiao, J.; Bénard, P.; Chahine, R. Heat transfer analysis for fast filling of on-board hydrogen tank. Energy Procedia 2019, 158, 1910–1916. [Google Scholar] [CrossRef] [Scilit]
- Xiao, J.; Ma, S.; Wang, X.; Deng, S.; Yang, T.; Bénard, P. Effect of hydrogen refueling parameters on final state of charge. Energies 2019, 12, 645. [Google Scholar] [CrossRef] [Scilit]
- Kuroki, T.; Nagasawa, K.; Peters, M.; Leighton, D.; Kurtz, J.; Sakoda, N.; Monde, M.; Takata, Y. Thermodynamic modeling of hydrogen fueling process from high-pressure storage tank to vehicle tank. Int. J. Hydrogen Energy 2021, 46, 22004–22017. [Google Scholar] [CrossRef] [Scilit]
- Zhao, L.; Li, F.; Li, Z.; Zhang, L.; He, G.; Zhao, Q.; Yuan, J.; Di, J.; Zhou, C. Thermodynamic analysis of the emptying process of compressed hydrogen tanks. Int. J. Hydrogen Energy 2019, 44, 3993–4005. [Google Scholar] [CrossRef] [Scilit]
- Xiao, J.; Bénard, P.; Chahine, R. Charge-discharge cycle thermodynamics for compression hydrogen storage system. Int. J. Hydrogen Energy 2016, 41, 5531–5539. [Google Scholar] [CrossRef] [Scilit]
- Takagi, Y.; Sugie, N.; Takeda, K.; Okano, Y.; Eguchi, T.; Hirota, K. Numerical investigation of the thermal behavior in a hydrogen tank during fast filling process. In Proceedings of the ASME/JSME Thermal Engineering Joint Conference, Honolulu, HI, USA, 13–17 March 2011; p. T10037. [Google Scholar]
- Galassi, M.C.; Baraldi, D.; Iborra, B.A.; Moretto, P. CFD analysis of fast filling scenarios for 70 MPa hydrogen type IV tanks. Int. J. Hydrogen Energy 2012, 37, 6886–6892. [Google Scholar] [CrossRef] [Scilit]
- Suryan, A.; Kim, H.D.; Setoguchi, T. Three dimensional numerical computations on the fast filling of a hydrogen tank under different conditions. Int. J. Hydrogen Energy 2012, 37, 7600–7611. [Google Scholar] [CrossRef] [Scilit]
- Suryan, A.; Kim, H.D.; Setoguchi, T. Comparative study of turbulence models performance for refueling of compressed hydrogen tanks. Int. J. Hydrogen Energy 2013, 38, 9562–9569. [Google Scholar] [CrossRef] [Scilit]
- Melideo, D.; Baraldi, D.; Acosta-Iborra, B.; Cebolla, R.O.; Moretto, P. CFD simulations of filling and emptying of hydrogen tanks. Int. J. Hydrogen Energy 2017, 42, 7304–7313. [Google Scholar] [CrossRef] [Scilit]
- Launder, B.E.; Sharma, B.I. Application of the energy-dissipation model of turbulence to the calculation of flow near a spinning disc. Lett. Heat Mass Transf. 1974, 1, 131–137. [Google Scholar] [CrossRef] [Scilit]
- Speziale, C.G. On nonlinear kl and k-ε models of turbulence. J. Fluid Mech. 1987, 178, 459–475. [Google Scholar] [CrossRef] [Scilit]
- Shih, T.-H.; Liou, W.W.; Shabbir, A.; Yang, Z.; Zhu, J. A new k-ϵ eddy viscosity model for high reynolds number turbulent flows. Comput. Fluids 1995, 24, 227–238. [Google Scholar] [CrossRef] [Scilit]
- Dicken, C.; Merida, W. Measured effects of filling time and initial mass on the temperature distribution within a hydrogen cylinder during refuelling. J. Power Sources 2007, 165, 324–336. [Google Scholar] [CrossRef] [Scilit]
- Liu, Y.-L.; Zhao, Y.-Z.; Zhao, L.; Li, X.; Chen, H.-g.; Zhang, L.-F.; Zhao, H.; Sheng, R.-H.; Xie, T.; Hu, D.-H. Experimental studies on temperature rise within a hydrogen cylinder during refueling. Int. J. Hydrogen Energy 2010, 35, 2627–2632. [Google Scholar] [CrossRef] [Scilit]
- Cebolla, R.O.; Acosta, B.; Moretto, P.; Frischauf, N.; Harskamp, F.; Bonato, C.; Baraldi, D. Hydrogen tank first filling experiments at the JRC-IET GasTeF facility. Int. J. Hydrogen Energy 2014, 39, 6261–6267. [Google Scholar] [CrossRef] [Scilit]
- Guo, J.; Yang, J.; Zhao, Y.; Pan, X.; Zhang, L.; Zhao, L.; Zheng, J. Investigations on temperature variation within a type III cylinder during the hydrogen gas cycling test. Int. J. Hydrogen Energy 2014, 39, 13926–13934. [Google Scholar] [CrossRef] [Scilit]
- Liss, W.E.; Richards, M.E.; Kountz, K.; Kriha, K. Development and Validation testing of Hydrogen fast-fill fueling algorithms. In Proceedings of the 15th World Hydrogen Energy Conference, Yokohama, Japan, 27 June–2 July 2004. [Google Scholar]
- Hirotani, R.; Tomioka, J.; Maeda, Y.; Mitsuishi, H.; Watanabe, S. Thermal behavior in hydrogen storage tank for fuel cell vehicle on fast filling. In Proceedings of the 16th World Hydrogen Energy Conference, Lyon, France, 13–16 June 2006. [Google Scholar]
- Zhao, L.; Liu, Y.; Yang, J.; Zhao, Y.; Zheng, J.; Bie, H.; Liu, X. Numerical simulation of temperature rise within hydrogen vehicle cylinder during refueling. Int. J. Hydrogen Energy 2010, 35, 8092–8100. [Google Scholar] [CrossRef] [Scilit]
- Heitsch, M.; Baraldi, D.; Moretto, P. Numerical investigations on the fast filling of hydrogen tanks. Int. J. Hydrogen Energy 2011, 36, 2606–2612. [Google Scholar] [CrossRef] [Scilit]
- Melideo, D.; Baraldi, D. CFD analysis of fast filling strategies for hydrogen tanks and their effects on key-parameters. Int. J. Hydrogen Energy 2015, 40, 735–745. [Google Scholar] [CrossRef] [Scilit]
- Dicken, C.; Merida, W. Modeling the transient temperature distribution within a hydrogen cylinder during refueling. Numer. Heat Transf. Part A Appl. 2007, 53, 685–708. [Google Scholar] [CrossRef] [Scilit]
- Setoguchi, T.; Alam, M.; Monde, M.; Kim, H. Characteristics of turbulent confined jets during fast filling of H2 tank at high pressure. Int. J. Aeroacoustics 2013, 12, 455–474. [Google Scholar] [CrossRef] [Scilit]
- Johnson, T.; Bozinoski, R.; Ye, J.; Sartor, G.; Zheng, J.; Yang, J. Thermal model development and validation for rapid filling of high pressure hydrogen tanks. Int. J. Hydrogen Energy 2015, 40, 9803–9814. [Google Scholar] [CrossRef] [Scilit]
- Melideo, D.; Baraldi, D.; Galassi, M.C.; Cebolla, R.O.; Iborra, B.A.; Moretto, P. CFD model performance benchmark of fast filling simulations of hydrogen tanks with pre-cooling. Int. J. Hydrogen Energy 2014, 39, 4389–4395. [Google Scholar] [CrossRef] [Scilit]
- Immel, R.; Mack-Gardner, A. Development and validation of a numerical thermal simulation model for compressed hydrogen gas storage tanks. SAE Int. J. Engines 2011, 4, 1850–1861. [Google Scholar] [CrossRef] [Scilit]
- Galassi, M.C.; Papanikolaou, E.; Heitsch, M.; Baraldi, D.; Iborra, B.A.; Moretto, P. Assessment of CFD models for hydrogen fast filling simulations. Int. J. Hydrogen Energy 2014, 39, 6252–6260. [Google Scholar] [CrossRef] [Scilit]
- De Miguel, N.; Acosta, B.; Baraldi, D.; Melideo, R.; Cebolla, R.O.; Moretto, P. The role of initial tank temperature on refuelling of on-board hydrogen tanks. Int. J. Hydrogen Energy 2016, 41, 8606–8615. [Google Scholar] [CrossRef] [Scilit]
- Melideo, D.; Baraldi, D.; Echevarria, N.D.M.; Iborra, B.A. Effects of some key-parameters on the thermal stratification in hydrogen tanks during the filling process. Int. J. Hydrogen Energy 2019, 44, 13569–13582. [Google Scholar] [CrossRef] [Scilit]
- Schneider, J.; Meadows, G.; Wistoft-Ibsen, M.; Mathison, S.; Shim, J. Hydrogen Fueling Standardization: Enabling ZEVs with “Same as Today” Fueling and FCEV Range and Safety. In Proceedings of the International Conference on Hydrogen Safety (ICHS 2015), Yokohama, Japan, 19–21 October 2015. [Google Scholar]
- Mathison, S.; Handa, K.; McGuire, T.; Brown, T.; Goldstein, T.; Johnston, M. Field validation of the MC default fill hydrogen fueling protocol. SAE Int. J. Altern. Powertrains 2015, 4, 130–144. [Google Scholar] [CrossRef] [Scilit]
- Wilcox, D.C. Turbulence Modeling for CFD; DCW Industries: La Canada, CA, USA, 1998; Volume 2. [Google Scholar]
- Seo, H.M.; Park, B.H. Application of EOS Based on Machine Learning Method on CFD Study of Rapid Hydrogen Refueling Process: HM Seo and BH Park. Korean J. Chem. Eng. 2025, 42, 1637–1653. [Google Scholar] [CrossRef] [Scilit]
- Bourgeois, T.; Ammouri, F.; Baraldi, D.; Moretto, P. The temperature evolution in compressed gas filling processes: A review. Int. J. Hydrogen Energy 2018, 43, 2268–2292. [Google Scholar] [CrossRef] [Scilit]
- Park, B.H.; Chae, C.K. Development of correlation equations on hydrogen properties for hydrogen refueling process by machine learning approach. Int. J. Hydrogen Energy 2022, 47, 4185–4195. [Google Scholar] [CrossRef] [Scilit]
- Park, B.H.; Joe, C.H. Investigation of configuration on multi-tank cascade system at hydrogen refueling stations with mass flow rate. Int. J. Hydrogen Energy 2024, 49, 1140–1153. [Google Scholar] [CrossRef] [Scilit]
- Yuan, K.; Liu, Z.; Li, X. Effects of structure parameter and material property on thermal performance of on-board hydrogen storage tanks during fast refueling. Int. J. Hydrogen Energy 2024, 81, 1145–1155. [Google Scholar] [CrossRef] [Scilit]
- Ma, X. CFD-based study on optimized rapid filling strategies for vehicle hydrogen cylinders. Int. J. Hydrogen Energy 2025, 100, 1176–1187. [Google Scholar] [CrossRef] [Scilit]
- COMSOL. COMSOL Multiphysics User Guide; V6.0; COMSOL: Burlington, MA, USA, 2021. [Google Scholar]
- Sun, Z.; Yao, Q.; Jin, H.; Xu, Y.; Hang, W.; Chen, H.; Li, K.; Shi, L.; Gu, J.; Zhang, Q. A novel in-situ sensor calibration method for building thermal systems based on virtual samples and autoencoder. Energy 2024, 297, 131314. [Google Scholar] [CrossRef] [Scilit]
- Yan, Q.; Li, L.; Tan, Y. Energy transfer characteristics of surface vortex heat flow under non-isothermal conditions based on the lattice Boltzmann method. Processes 2026, 14, 378. [Google Scholar] [CrossRef] [Scilit]

Disclaimer/Publisher’s Note: The statements, opinions and data contained in all publications are solely those of the individual author(s) and contributor(s) and not of MDPI and/or the editor(s). MDPI and/or the editor(s) disclaim responsibility for any injury to people or property resulting from any ideas, methods, instructions or products referred to in the content. |
© 2026 by the authors. Licensee MDPI, Basel, Switzerland. This article is an open access article distributed under the terms and conditions of the Creative Commons Attribution (CC BY) license.