


Abstract
Recent trends in the photovoltaic (PV) technology industry are moving towards utilizing bifacial PV panels. Unlike traditional PV panels, bifacial PV panels can yield energy from both sides of the panel. Manufacturers specify that bifacial PV panels can harness up to 30% more energy than traditional PV panels. Hence, bifacial PV panels are becoming a common approach at low solar irradiance conditions to yield more energy. However, a bifacial PV panel increases PV inverter loading. The PV inverter is the most unreliable component in the entire PV system. This results in a negative impact on PV system reliability and cost. Hence, it is necessary to anticipate the inverter’s reliability when used in bifacial PV panels. This paper analyzes the reliability, i.e., lifetime, of PV inverters, considering both monofacial and bifacial PV panels for the analysis. Results showed that the increase in bifacial energy yield could significantly affect PV inverter reliability performance, especially in locations where the average mission profile is relatively high.
1. Introduction
In recent years, the use of photovoltaic (PV) panels experienced a fast growth rate, reducing their costs and increasing the utilization of renewable energy in the power grid. According to recent studies [1,2], the generation cost of PV energy is projected to decrease by 1.9 INR per unit in India, whereas in residential areas of the USA, it would reduce by 0.05 USD per unit by the year 2030. Among the several approaches to, e.g., enhancing efficiency, improving reliability, etc., one recent solution is the bifacial PV panel, which is used to harness more energy at a relatively low cost. The bifacial PV panel yields more energy in off-peak periods. This requires the PV inverter to function at nearly the rated power for a more significant period as compared to the traditional panel.
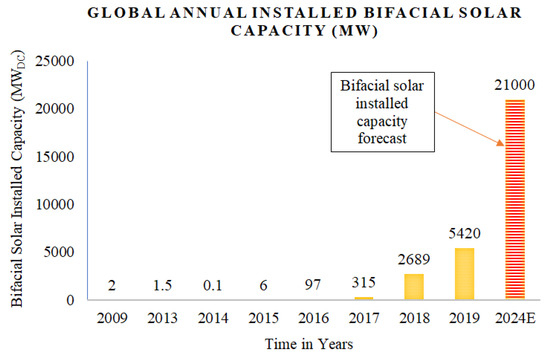
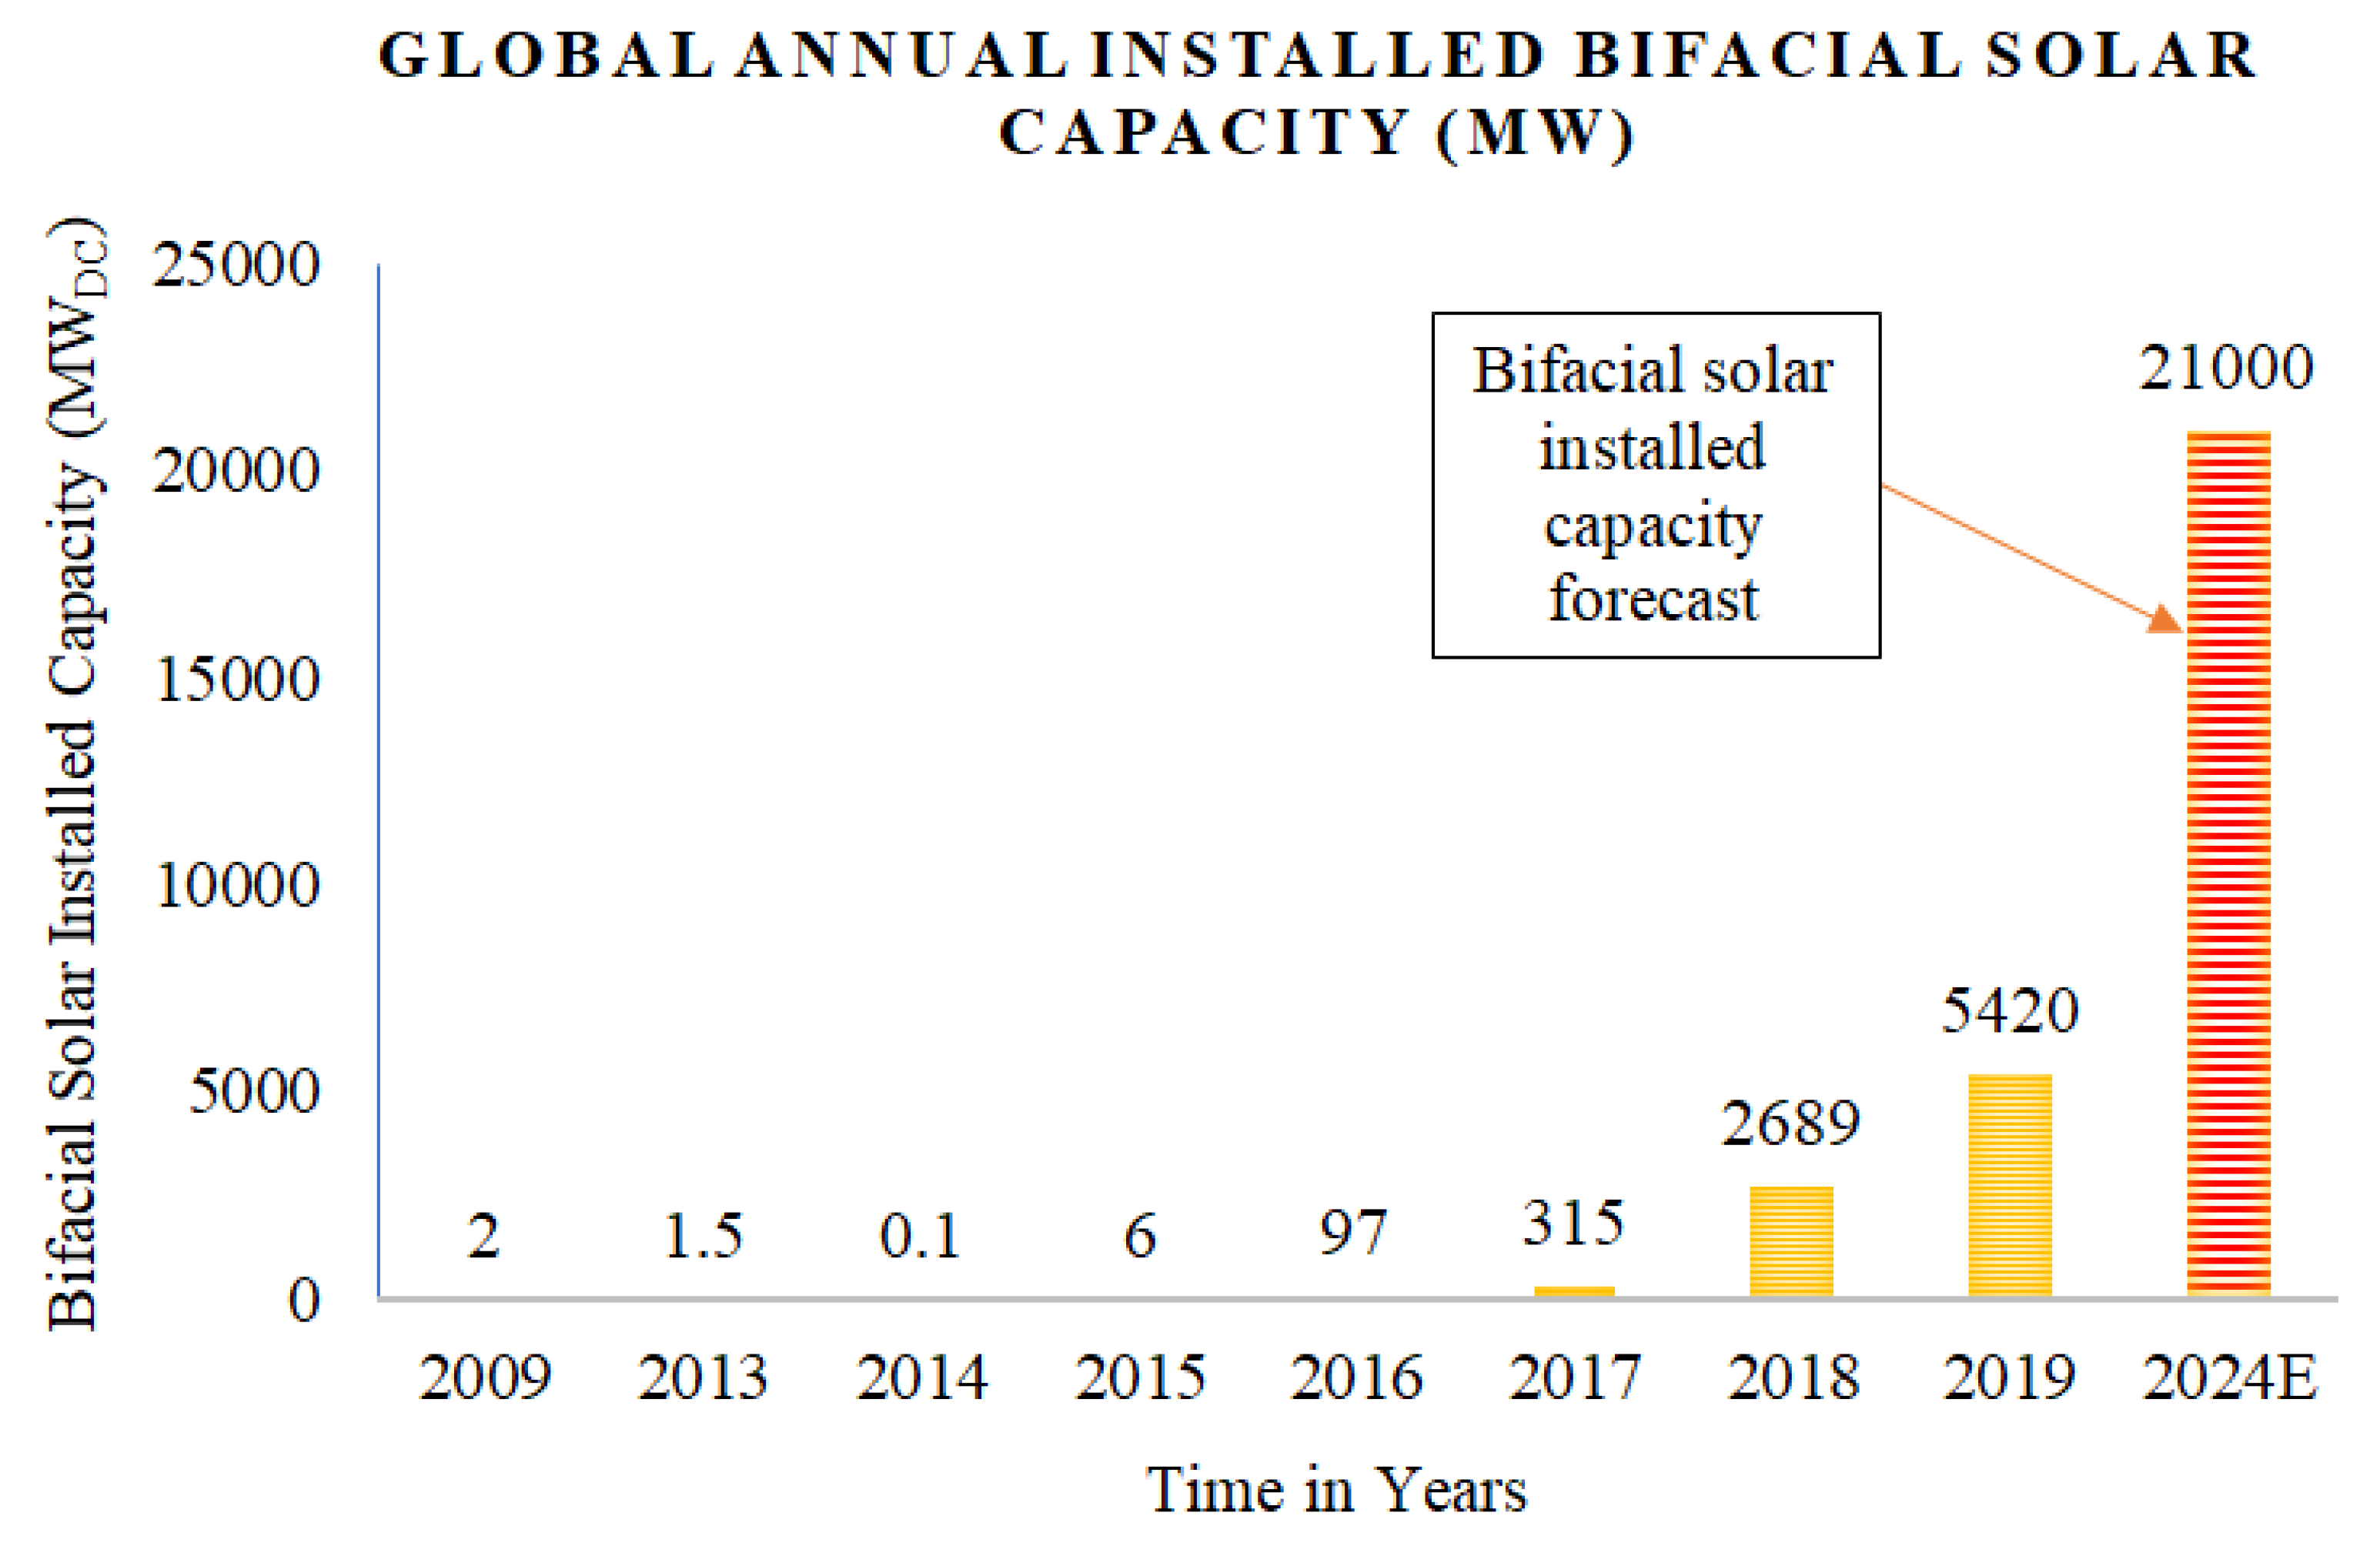
Unlike monofacial PV panels, bifacial PV panels are designed to yield more energy on low solar irradiance days. Manufacturers including LONGi, Trina solar, LG, Silfab, etc., started manufacturing bifacial PV panels and reported a 30% increase in energy yield. By the end of August 2019, approximately twenty countries had installed bifacial PV panels; the total installed capacity was 8530.6 MW. Bifacial solar installed capacity exhibits an increasing trend, and by 2024, it is expected to reach 21,000 MW, as shown in Figure 1 [3].
Figure 1.
Global annual installed bifacial solar capacity.
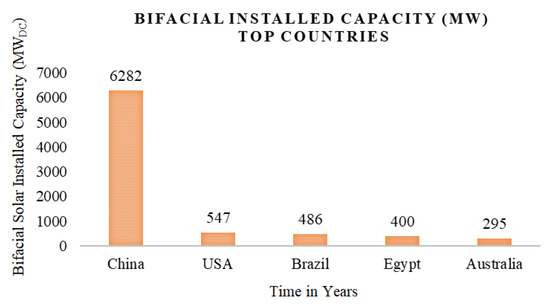
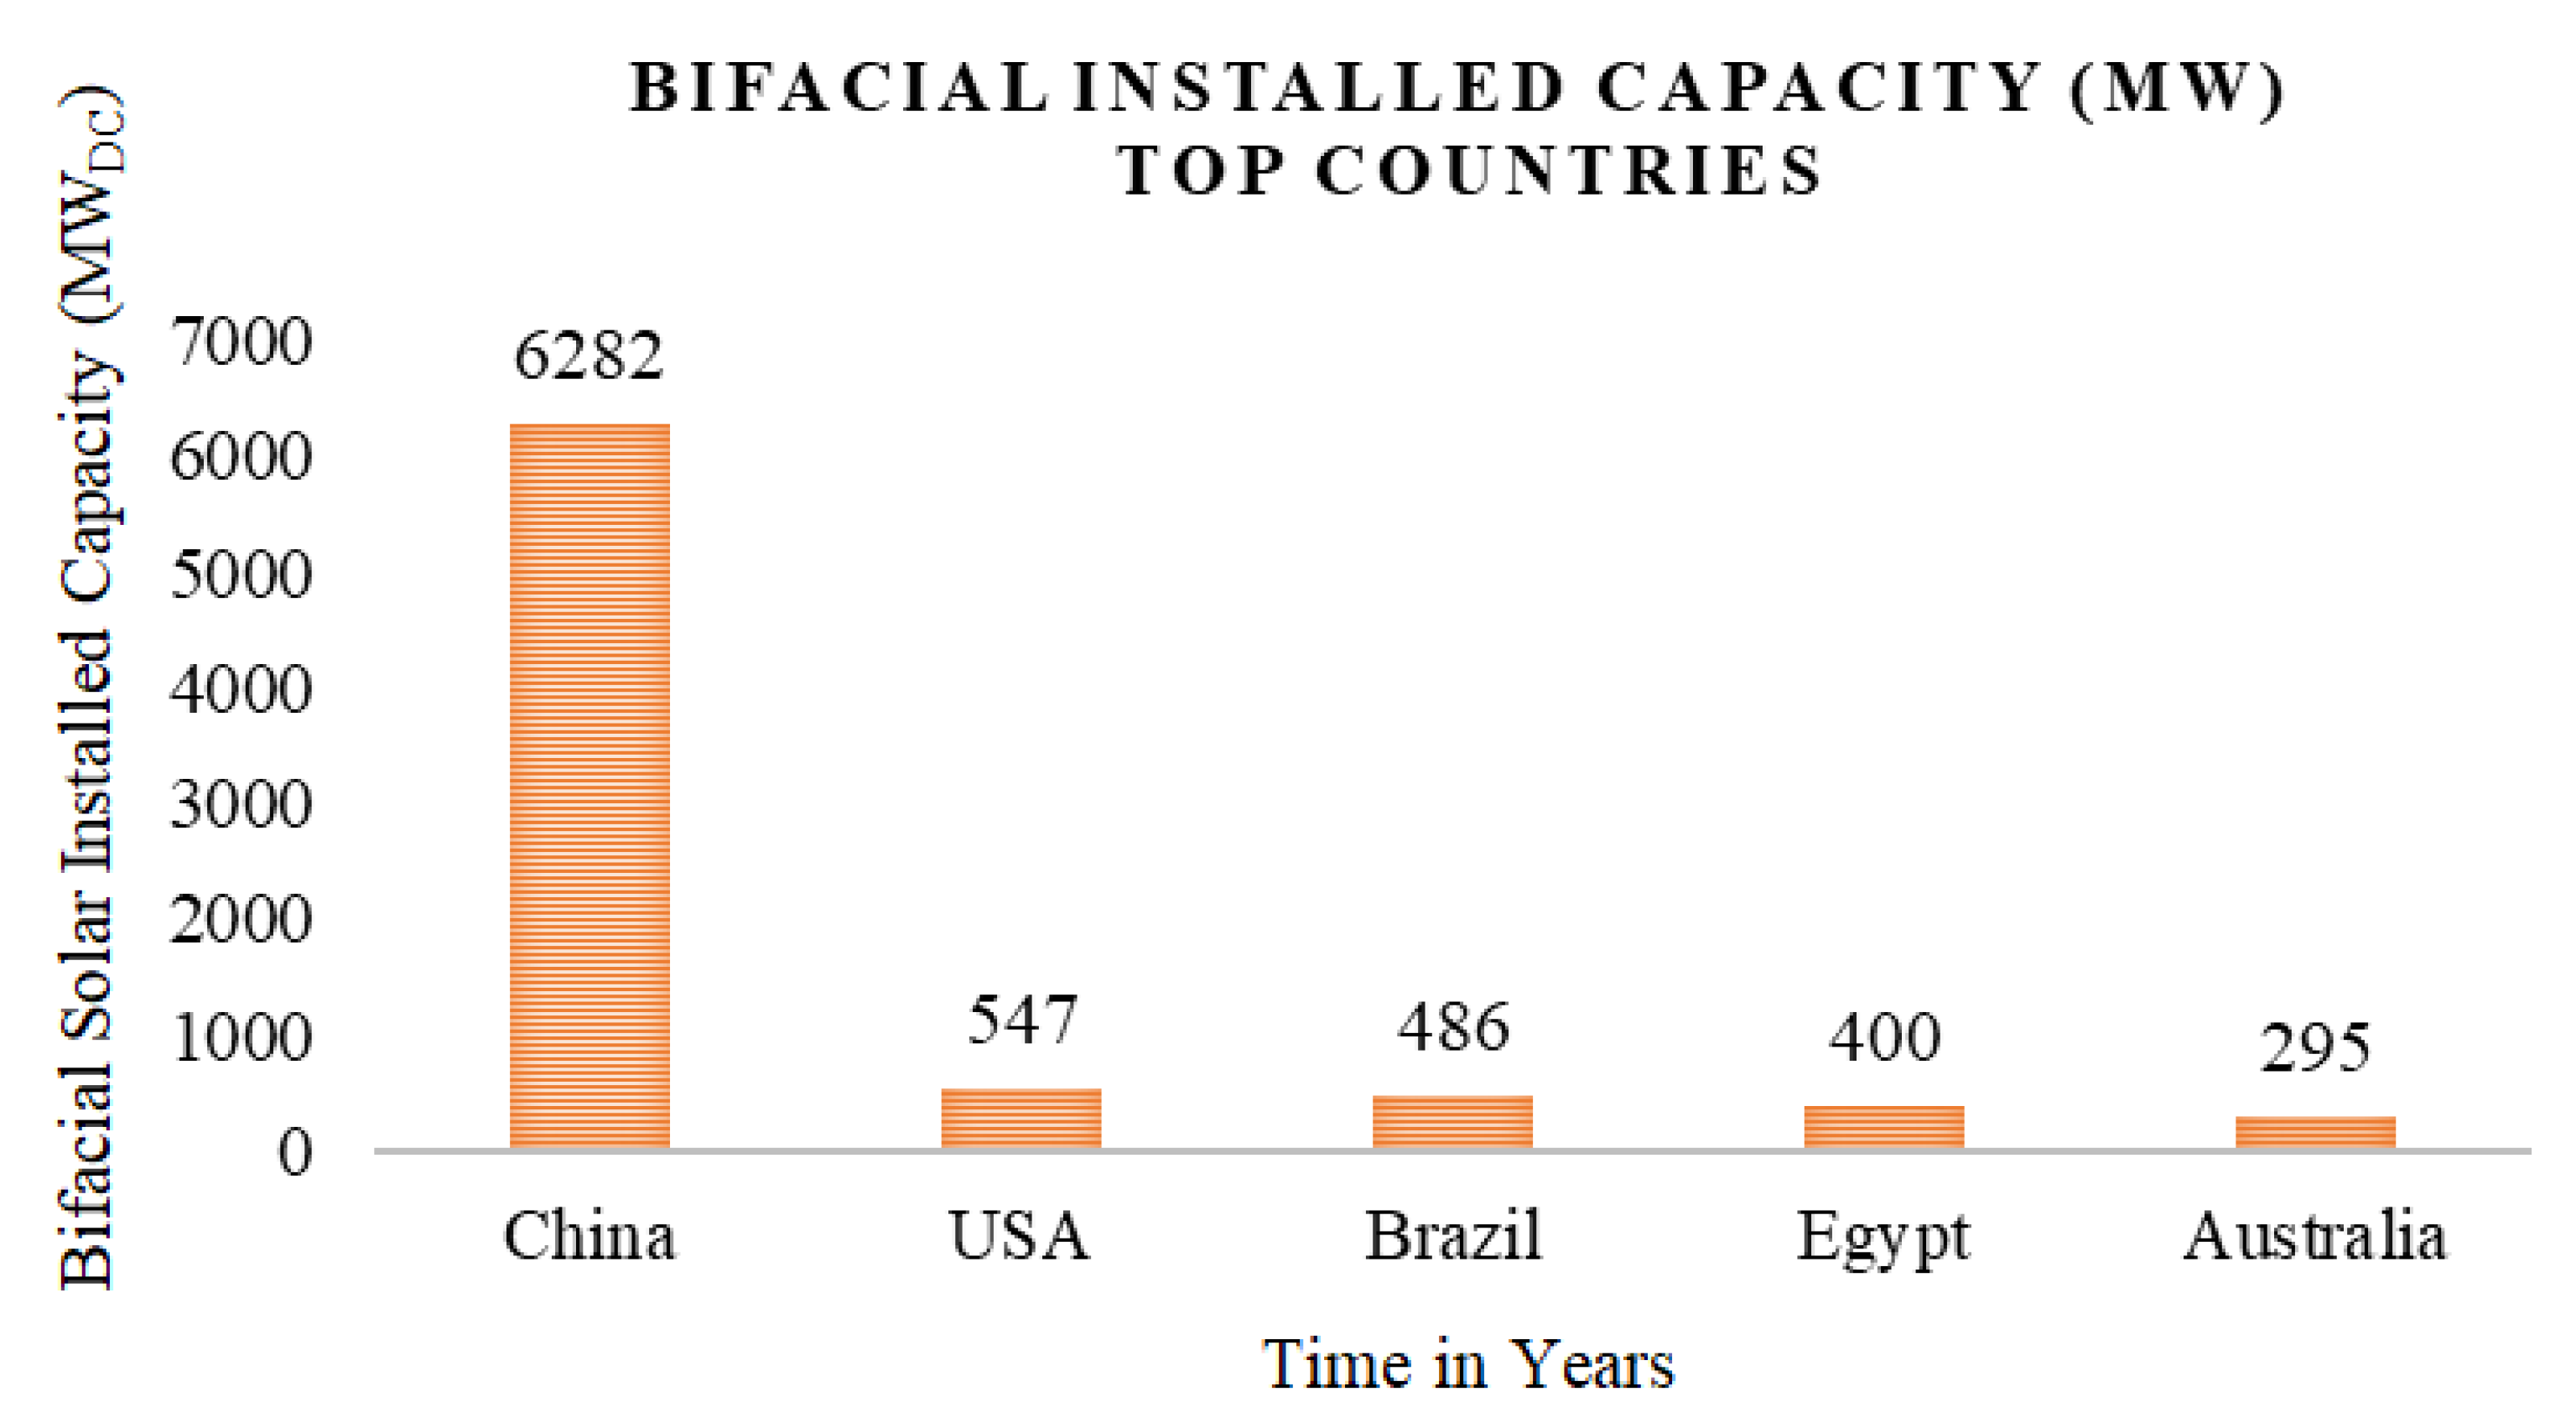
The top five countries with the highest bifacial solar installed capacity are shown in Figure 2. China leads with 6282 MW, exceeding the rest of the world combined [3]. Taiwan, Mexico, and Oman have approximately 100 MW of bifacial solar capacity installed. In bifacial projects in European countries approximately 10–35 MW are installed.
Figure 2.
Top five countries with the highest bifacial solar installed capacity.
The PV inverters in bifacial PV panels operate at nearly the rated power for a more extended period. This increases the thermal stress upon the PV inverter, which inevitably affects its performance in terms of lifetime and reliability. Hence, detailed reliability analysis (lifetime) of PV inverters must be quantified.
The impact of bifacial PV panels on the reliability of inverters has not been reported in prior literature. This paper analyzes the reliability performance of critical components in the PV inverter, i.e., power devices (Insulated Gate Bipolar Transistor-IGBT), at both the component level and the system level. Mission profile-based reliability analyses were carried out in India (relatively hot) at latitude of 17.7394° N and longitude of 78.2846° E and Denmark (relatively cold) at latitude of 57.0488° N and longitude of 9.9217° E over the course of one year. The mission profile (solar irradiance and ambient temperature) at the India location was logged at Hyderabad, Telangana; the mission profile at the Denmark location was taken from MERRA-2 Re-Analysis [4].
2. Reliability Analysis of PV Inverter
Initially, for reliability analysis of PV inverters, identification of critical components is required. The critical component of a PV inverter is the power semiconductor switch. A survey of power semiconductor manufacturing industries was conducted by [5] and concluded that 31% of critical components are power semiconductor switches. Hence, it is needed to anticipate the reliability of power semiconductor switches in PV inverters. In this paper, an insulated-gate bipolar transistor (IGBT) was considered as the power semiconductor switch for reliability analysis. The reliability of the IGBT was analyzed first, i.e., component-level reliability, after which system-level (PV inverter) reliability could be analyzed by combining the reliabilities of all the individual components. The flowchart for the reliability analysis of PV inverters is shown in Figure 3.
Figure 3.
Flowchart for reliability analysis.
2.1. Mission Profile
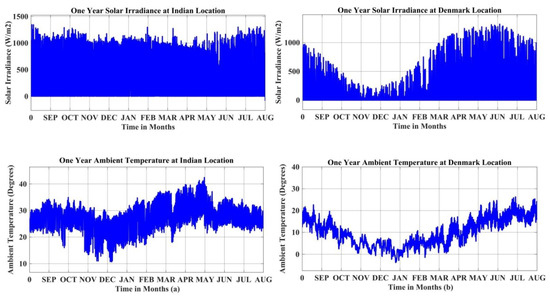
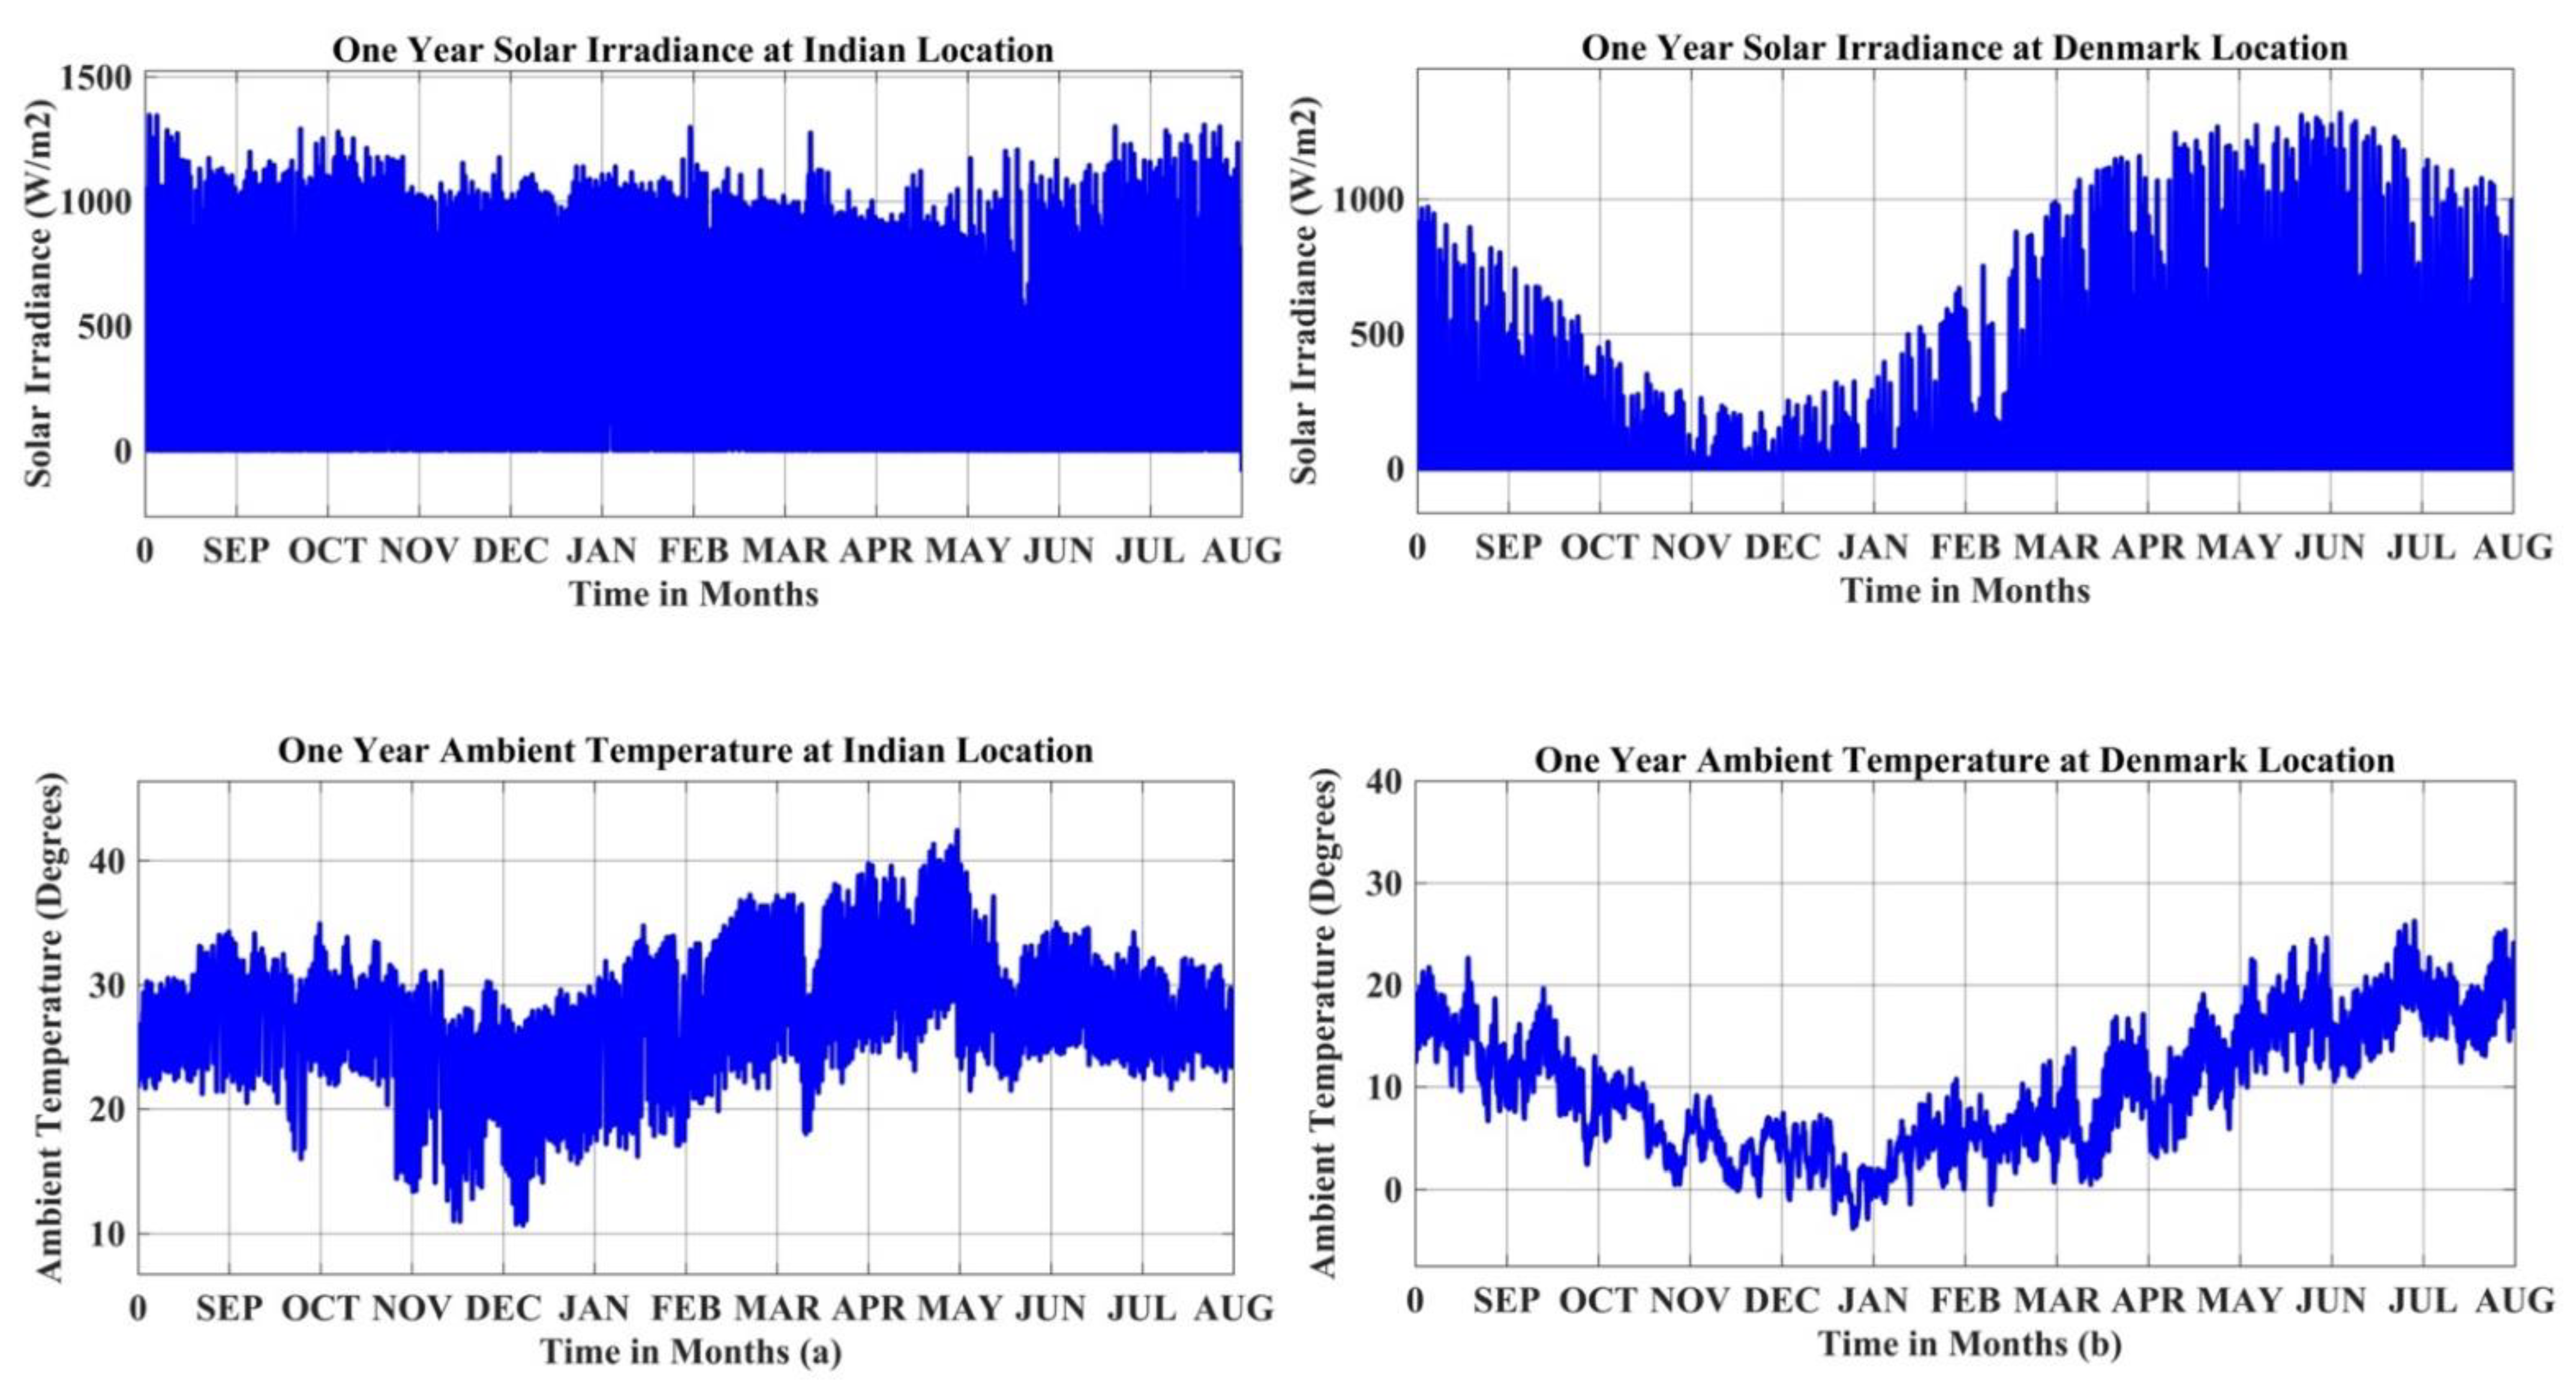
Environmental factors such as solar irradiance and ambient temperature, also called a mission profile, affect PV inverters’ reliability performance. Hence, mission profile-based reliability analysis was carried out at locations in Hyderabad, India (relatively hot; BSh) and Aalborg, Denmark (relatively cold; Cfb), as shown in Figure 4a,b. It can be inferred from the mission profiles that the yearly average solar irradiance recorded at the India location was relatively high throughout the year, i.e., 173,503.9 Wh/m2, while at the Denmark location it was low from October to March, therefore totaling only 96,662.6 Wh/m2. The ambient temperature varied enormously at the Demark location, including negative values as low as −3.79 °C. At the India location the ambient temperature recorded positive values all year round with a maximum temperature of 42.47 °C.
Figure 4.
(a) Yearly mission profile data at the India location; (b) Yearly mission profile data at the Denmark location.
2.2. Junction Temperature Estimation
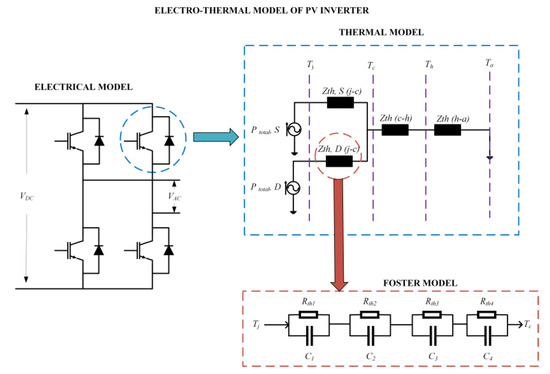
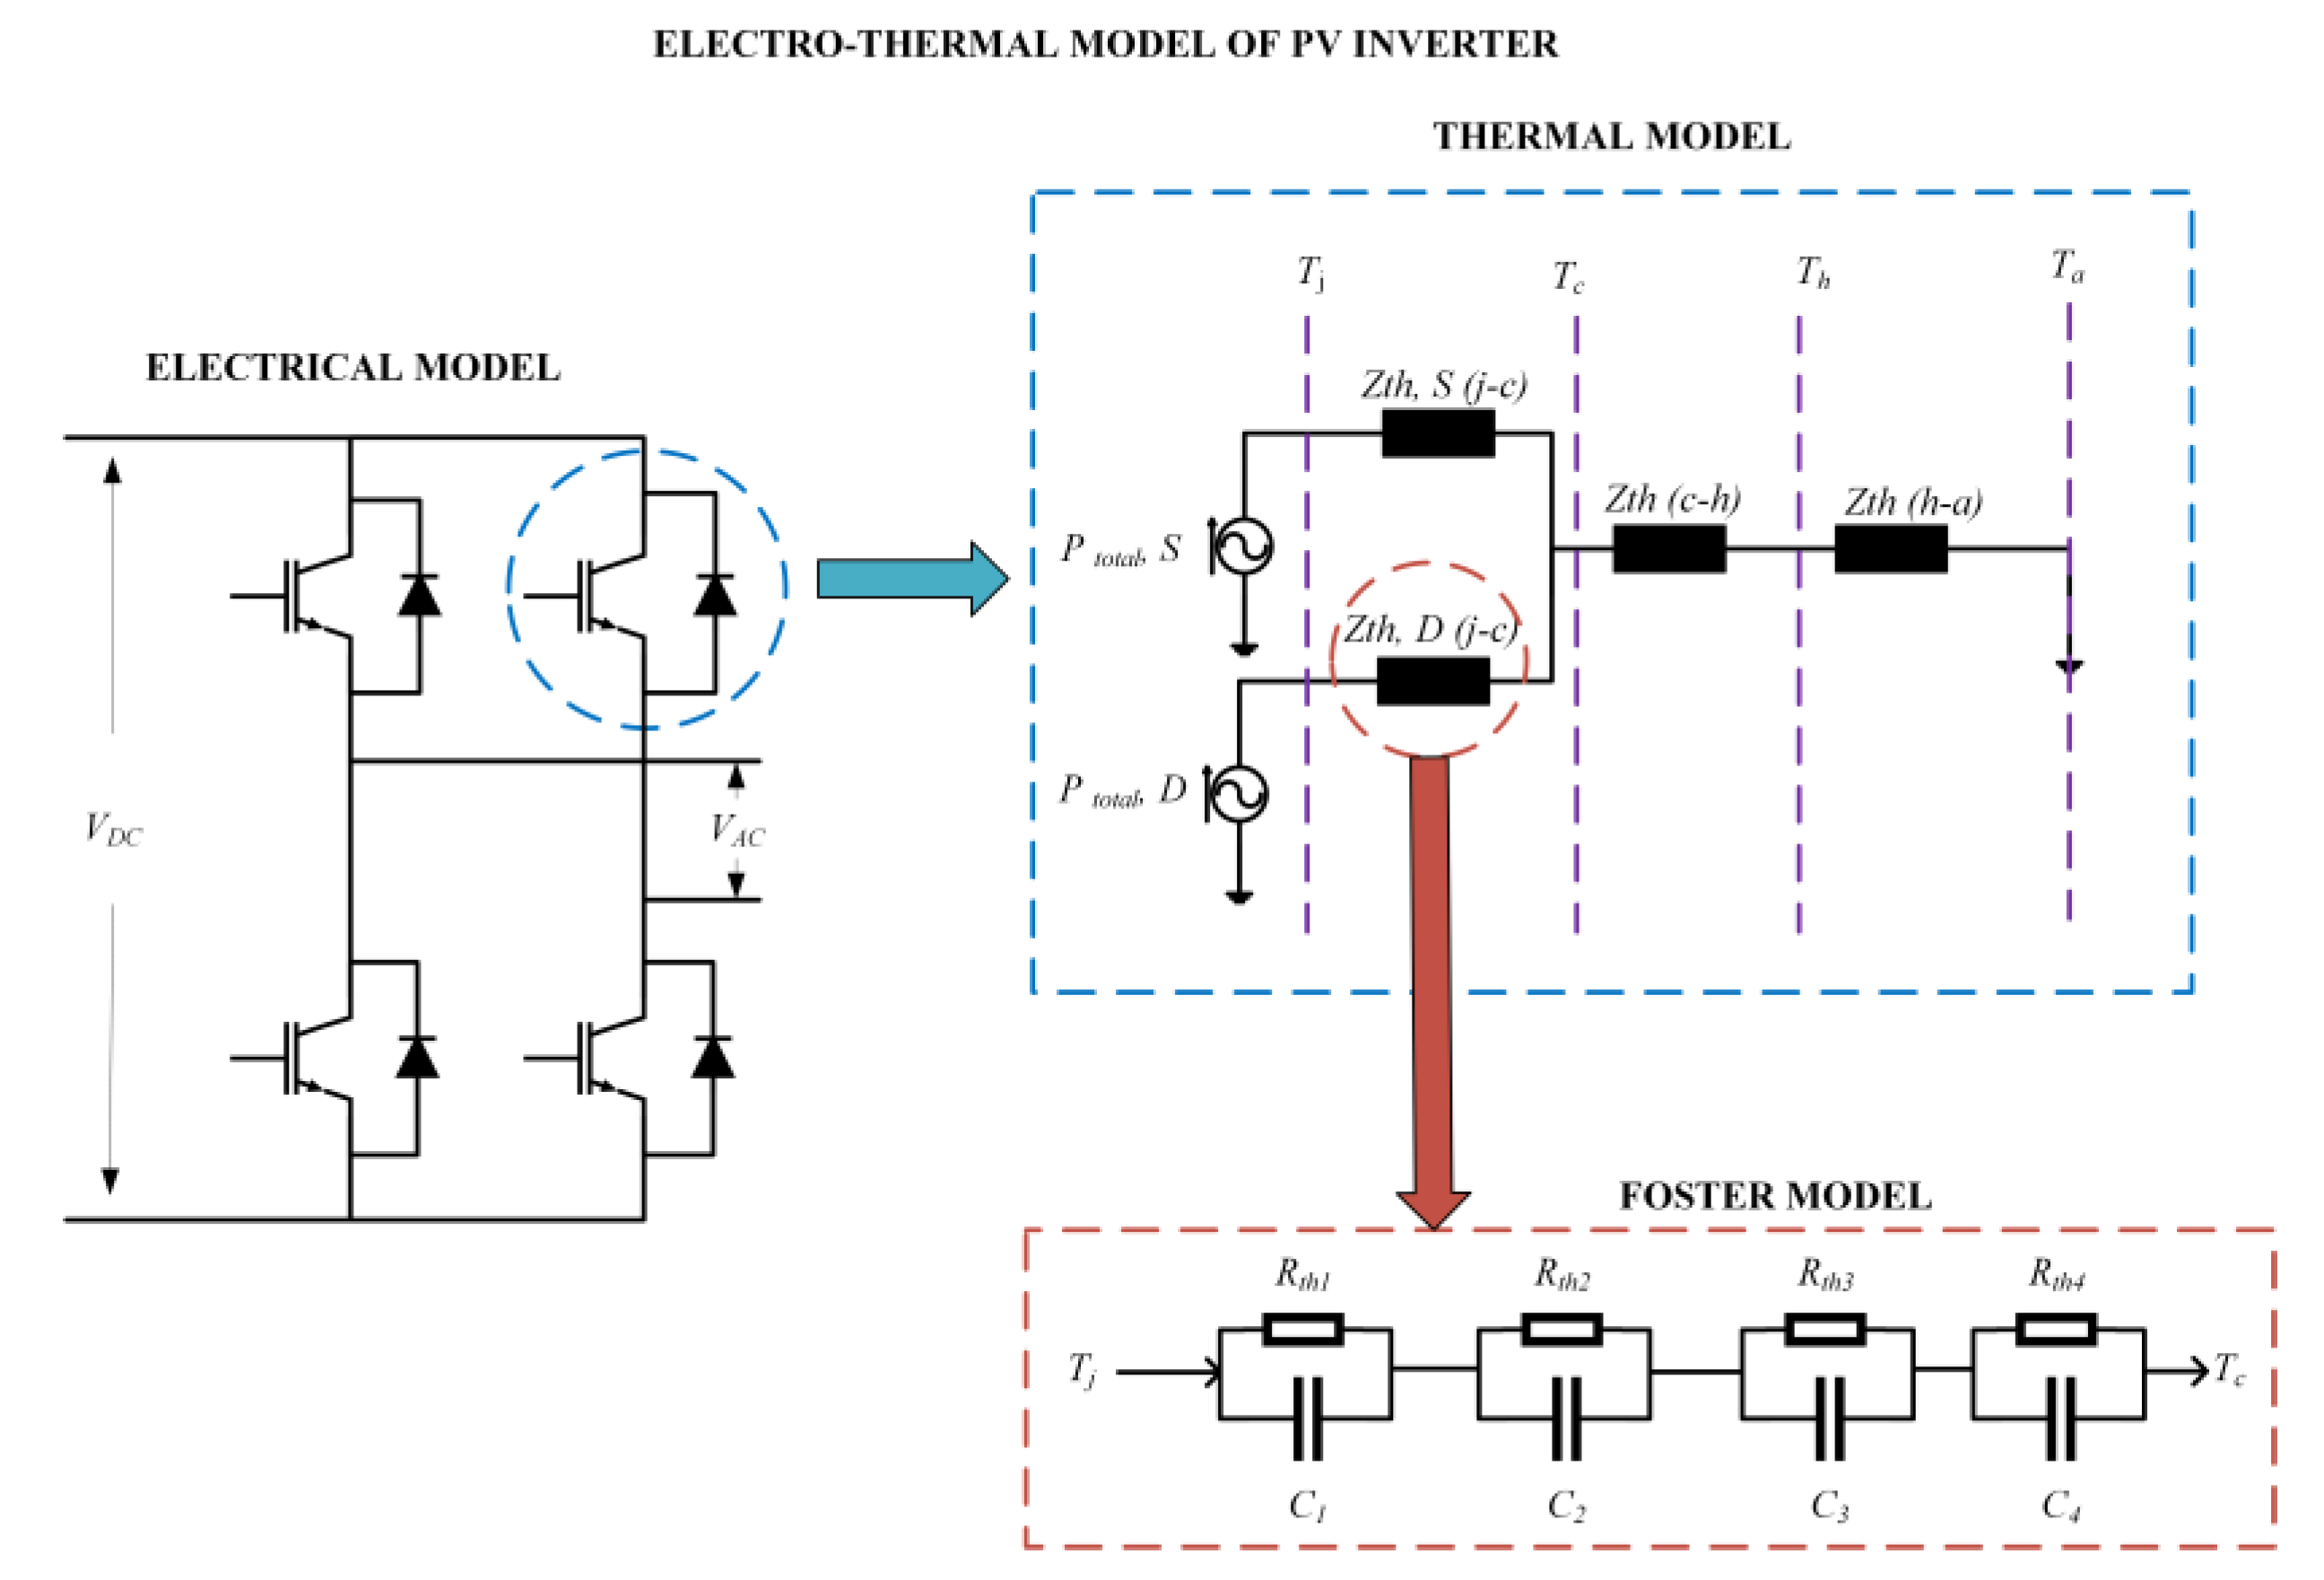
Variations in temperature (thermal cycling) at the junction layer of the IGBT can lead to the failure of the device. Environmental conditions are not constant; hence, the mission profile continuously varies over time. This leads to current variations in the IGBT and eventually temperature variations (thermal cycling). To assess the reliability of the IGBT, the temperature at the junction layers needs to be estimated. As the junction temperature cannot be estimated directly, an electro-thermal model of the IGBT is required for estimation. The popular electro thermal models of IGBTs are the Foster and Cauer models. In this paper, the yearly mission profile was translated into junction temperature using the Foster electro-thermal model, as shown in Figure 5 [6,7,8,9].
Figure 5.
Electro-thermal model of a PV inverter.
The mathematical expression for junction temperature (Tj) at any instant is given as (1)
where Zth(j−c) represents the difference between junction and case temperatures, PT is the total power loss and Tc denotes case temperature. The mathematical expression for case temperature (Tc) is given by
where Ta is the ambient temperature, Zth(c−h) is the difference between case and heat sink temperatures, and Zth(h−a) stands for the difference between heat sink and ambient temperatures. Power loss in the IGBT is due to heat dissipation. There are two primary types of power loss, conduction loss (Pc) and switching loss (Ps). The total loss in the IGBT is given as
PT = Ps + Pc
The mathematical expression of switching loss is given as
where f is the switching frequency, and Eon and Eoff represent the turn-on and turn-off loss of the IGBT, respectively.
Ps = (Eon + Eoff) × f
2.3. Rainflow Counting Analysis
The variations in the estimated junction temperature follow irregular profiles depending on the mission profile. Hence, a cycle counting algorithm is needed to anticipate the variations in the estimated junction temperature. In this paper, the rainflow counting algorithm was used to anticipate junction temperature variations. It yields the number of cycles ni, mean junction temperature Tjm, and cycle amplitude ΔTj of the estimated junction temperature [10,11].
2.4. Lifetime Model
Based on the thermal variations in power semiconductor devices, several lifetime models are available. Bayerer’s model, proposed in [12], is based on the number of cycles to failure. This model is also called a multi-parameter model. In this paper, Bayerer’s lifetime model is used. In Bayerer’s model the number of cycles to failure (Nf) is given as
In general, the lifetime is calculated using life consumption (LC). Lifetime (LF) is given as,
Life consumption (LC) is given as
where:
ni is the number of cycles (calculated using the rainflow counting algorithm [13]).
Nfi is the number of cycles to failure (calculated using Equation (5)).
The parameters of Bayerer’s lifetime model are tabulated in Table 1.
Table 1.
Parameters of Bayerer’s model.
2.5. Reliability Analysis Using Monte Carlo Simulation
In the above lifetime model, all parameters are considered as constant, i.e., all devices fail at the same rate. However, practically, all devices do not fail at the same rate. Hence, to analyze these uncertainties, 10,000 samples were generated via Monte Carlo simulation, and a five percent variation in all the parameters of Bayerer’s model was implemented. All 10,000 samples followed the Weibull distribution (failure distribution). In this paper, two-parameter Weibull distribution was used for the reliability analysis of the IGBT [14]. The reliability function of two-parameter Weibull distribution is given as
where ∝ is the scale parameter and γ stands for the shape parameter.
The IGBT shape parameter γ is 2.5, and the scale parameter ∝ is the characteristic life calculated from the CDF of the lifetime distribution at failure rate R(t) = 0.1. Based on the Weibull distribution, B10 lifetime can be calculated for the component level.
System-level reliability can be calculated by combining all of the individual components’ reliabilities. In this paper, series connection of reliability was considered. Reliability at the system level is given as
where refers to individual component reliability.
3. Results and Discussion
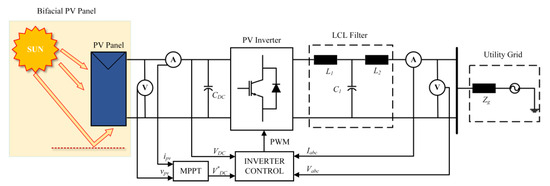
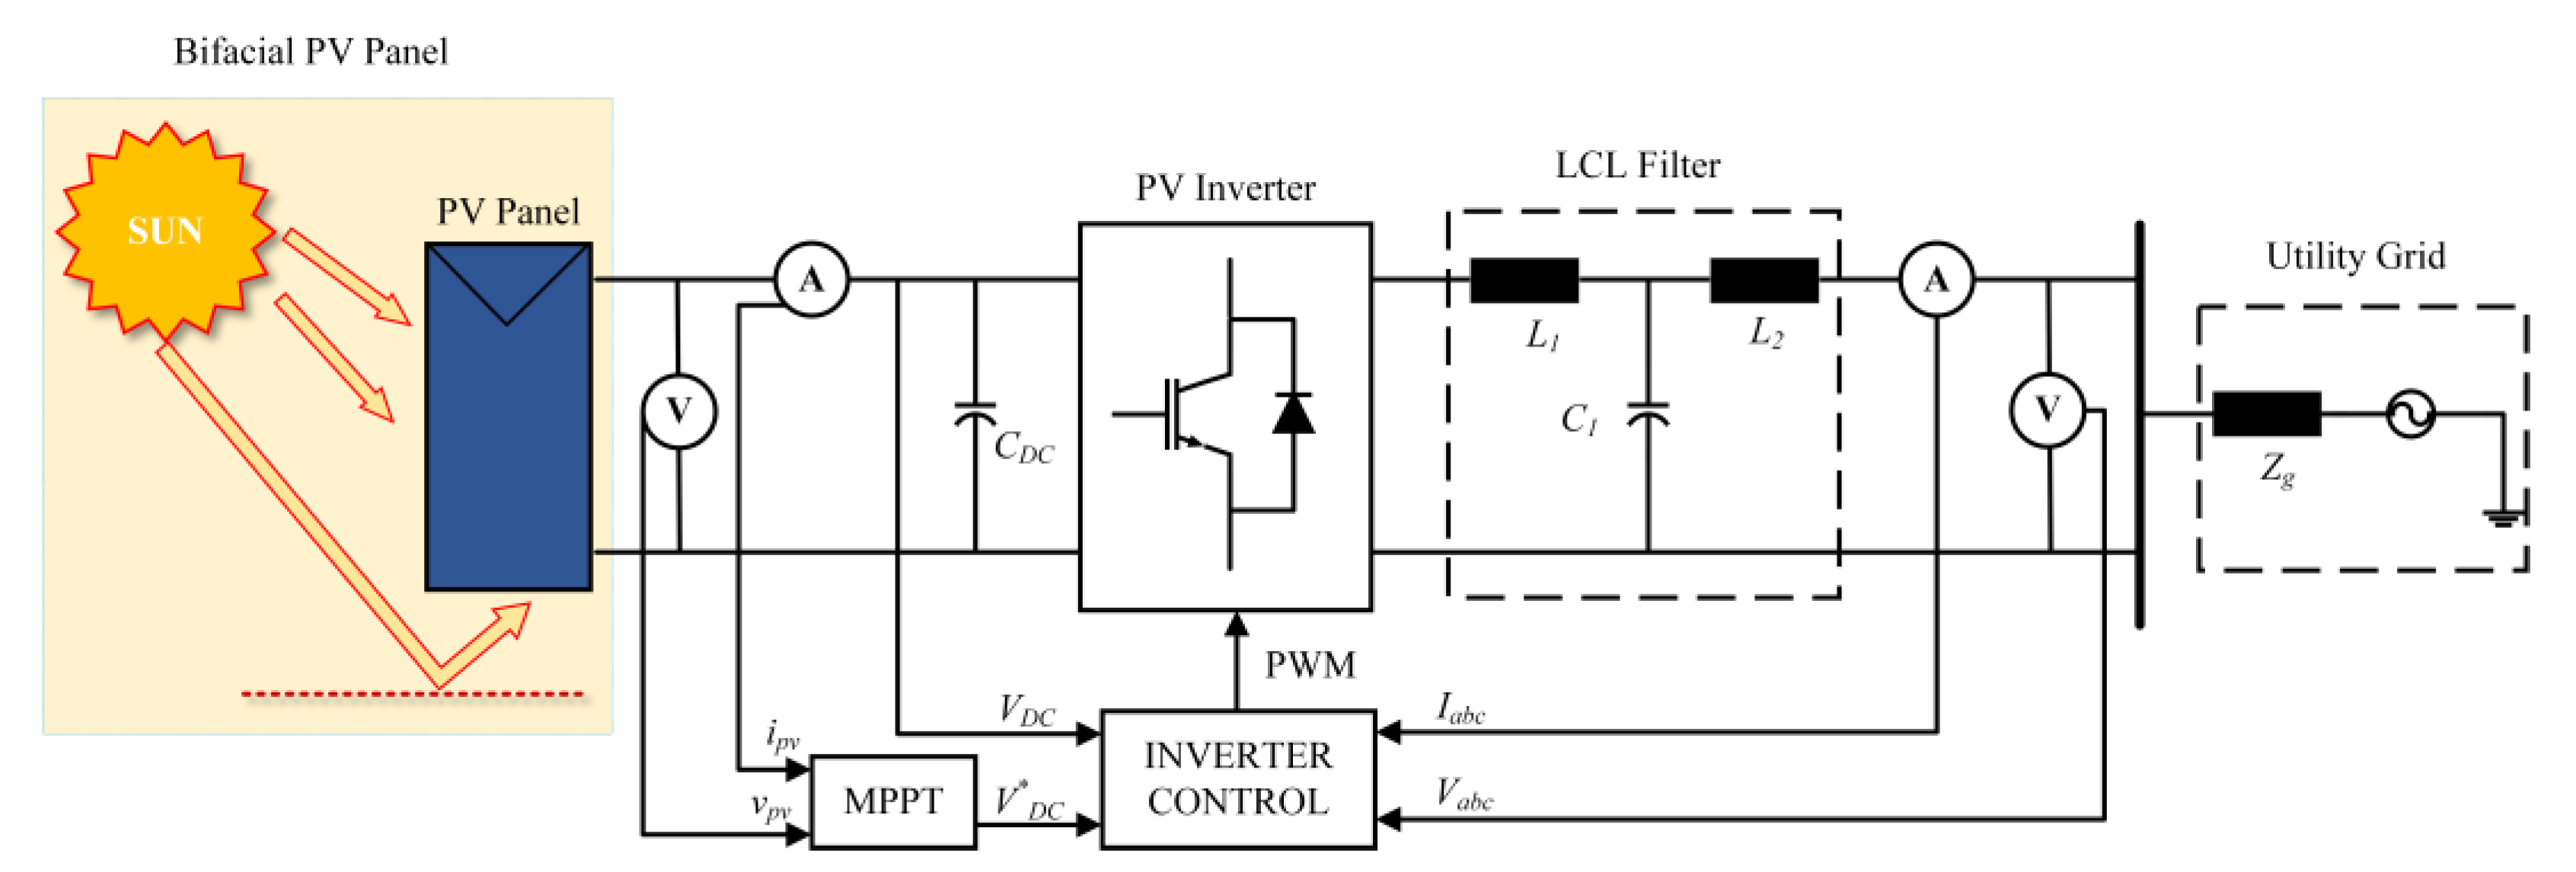
As a case system, a 3-kW single phase grid connected PV system was adopted, as shown in Figure 6. Here, single stage configuration was considered, where a power converter, i.e., a full-bridge PV inverter, is interfaced between the PV modules and the power grid. In this paper, an IGW30N60H3 IGBT manufactured by Infineon was considered as the power switch in the PV inverter. The full-bridge PV inverter consisted of four IGW30N60H3 IGBTs rated at 600 V/30 A each. The case system’s parameters are tabulated in Table 2. The proposed case system was modeled in the Piecewise Linear Electrical Circuit Simulation (PLECS) environment. Reliability analysis of the PV inverter was implemented in two cases: (1) reliability analysis of the PV inverter in the case of a monofacial PV panel; (2) reliability analysis of the PV inverter in the case of a bifacial PV panel.
Figure 6.
Proposed single phase 3 kW grid connected PV system.
Table 2.
Parameters of case system.
3.1. Estimation of Junction Temperature
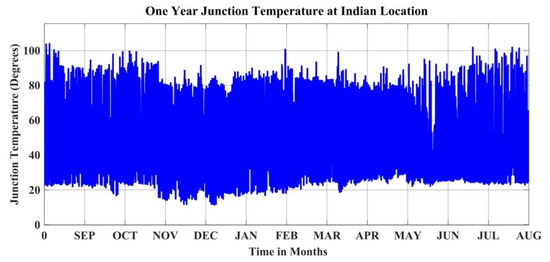
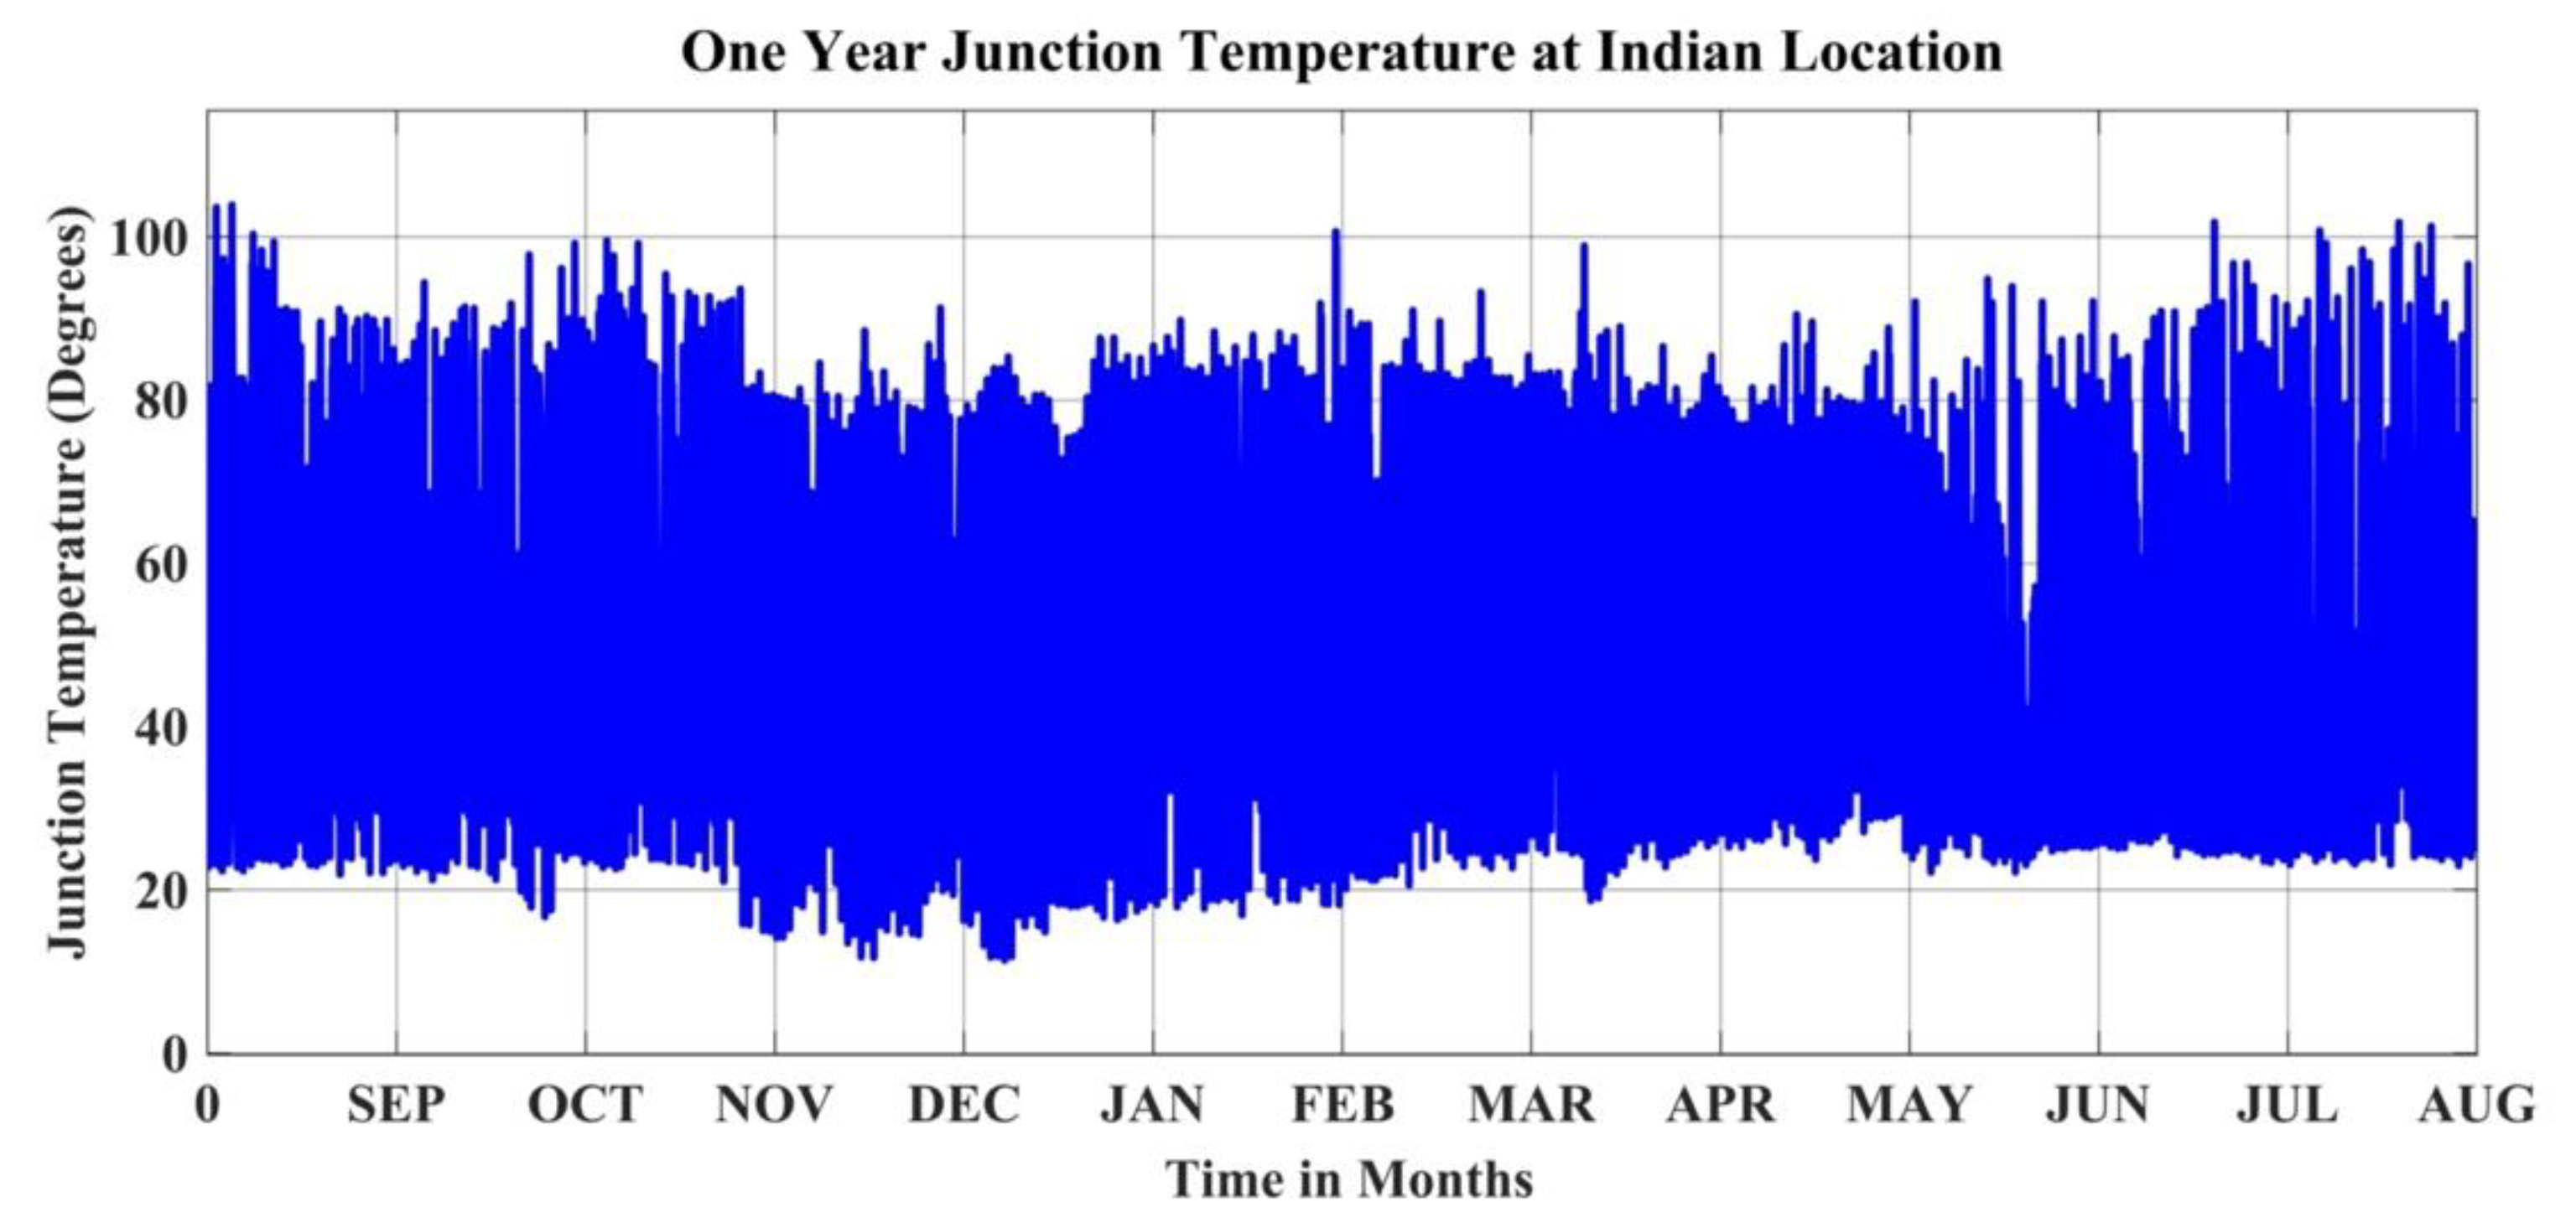
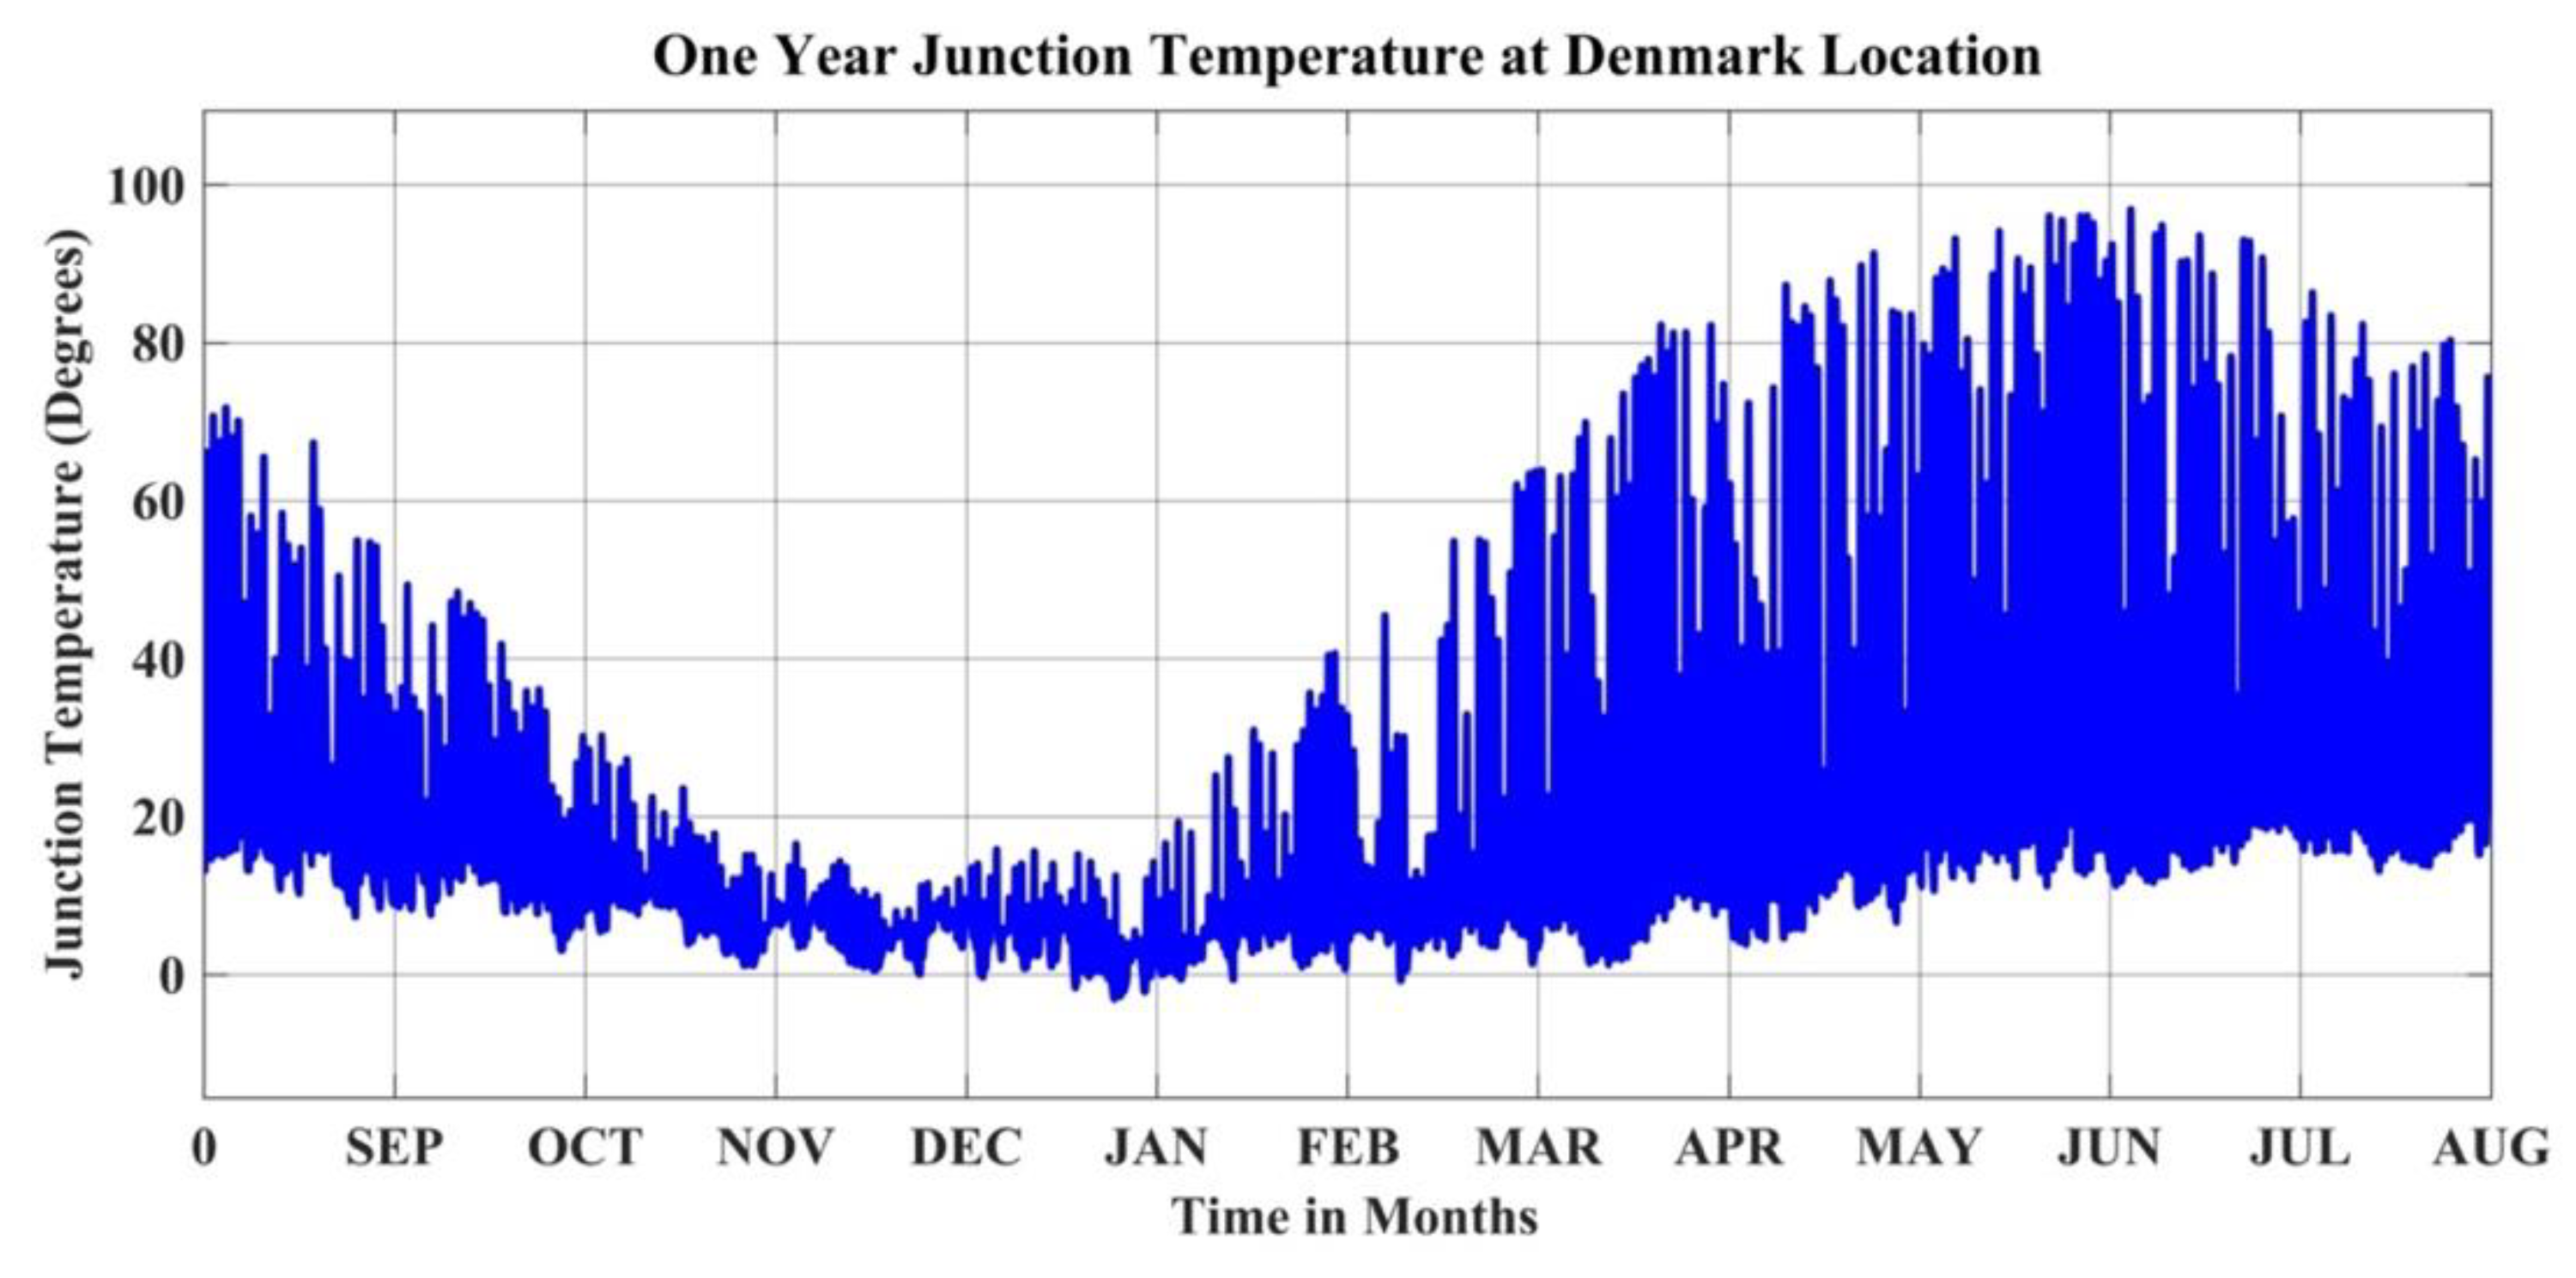
In the following sections, a grid connected PV inverter with a monofacial PV panel is considered. The Foster electro-thermal model of IGBT junction temperature was estimated via Equation (1). The junction temperatures corresponding to the yearly mission profiles at the India and Denmark locations are shown in Figure 7 and Figure 8, respectively.
Figure 7.
One-year estimated junction temperatures at the location in India.
Figure 8.
One-year estimated junction temperatures at the location in Denmark.
Mean junction temperature (°C) at the India location was 55.66 °C and at the Denmark location was 16.15 °C. The junction temperature mean difference (°C) between both locations was 39.51 °C. There was a significant mean difference between the India and Denmark locations. This scenario led to reliability performance deviation between India and Denmark.
3.2. Rainflow Counting Analysis
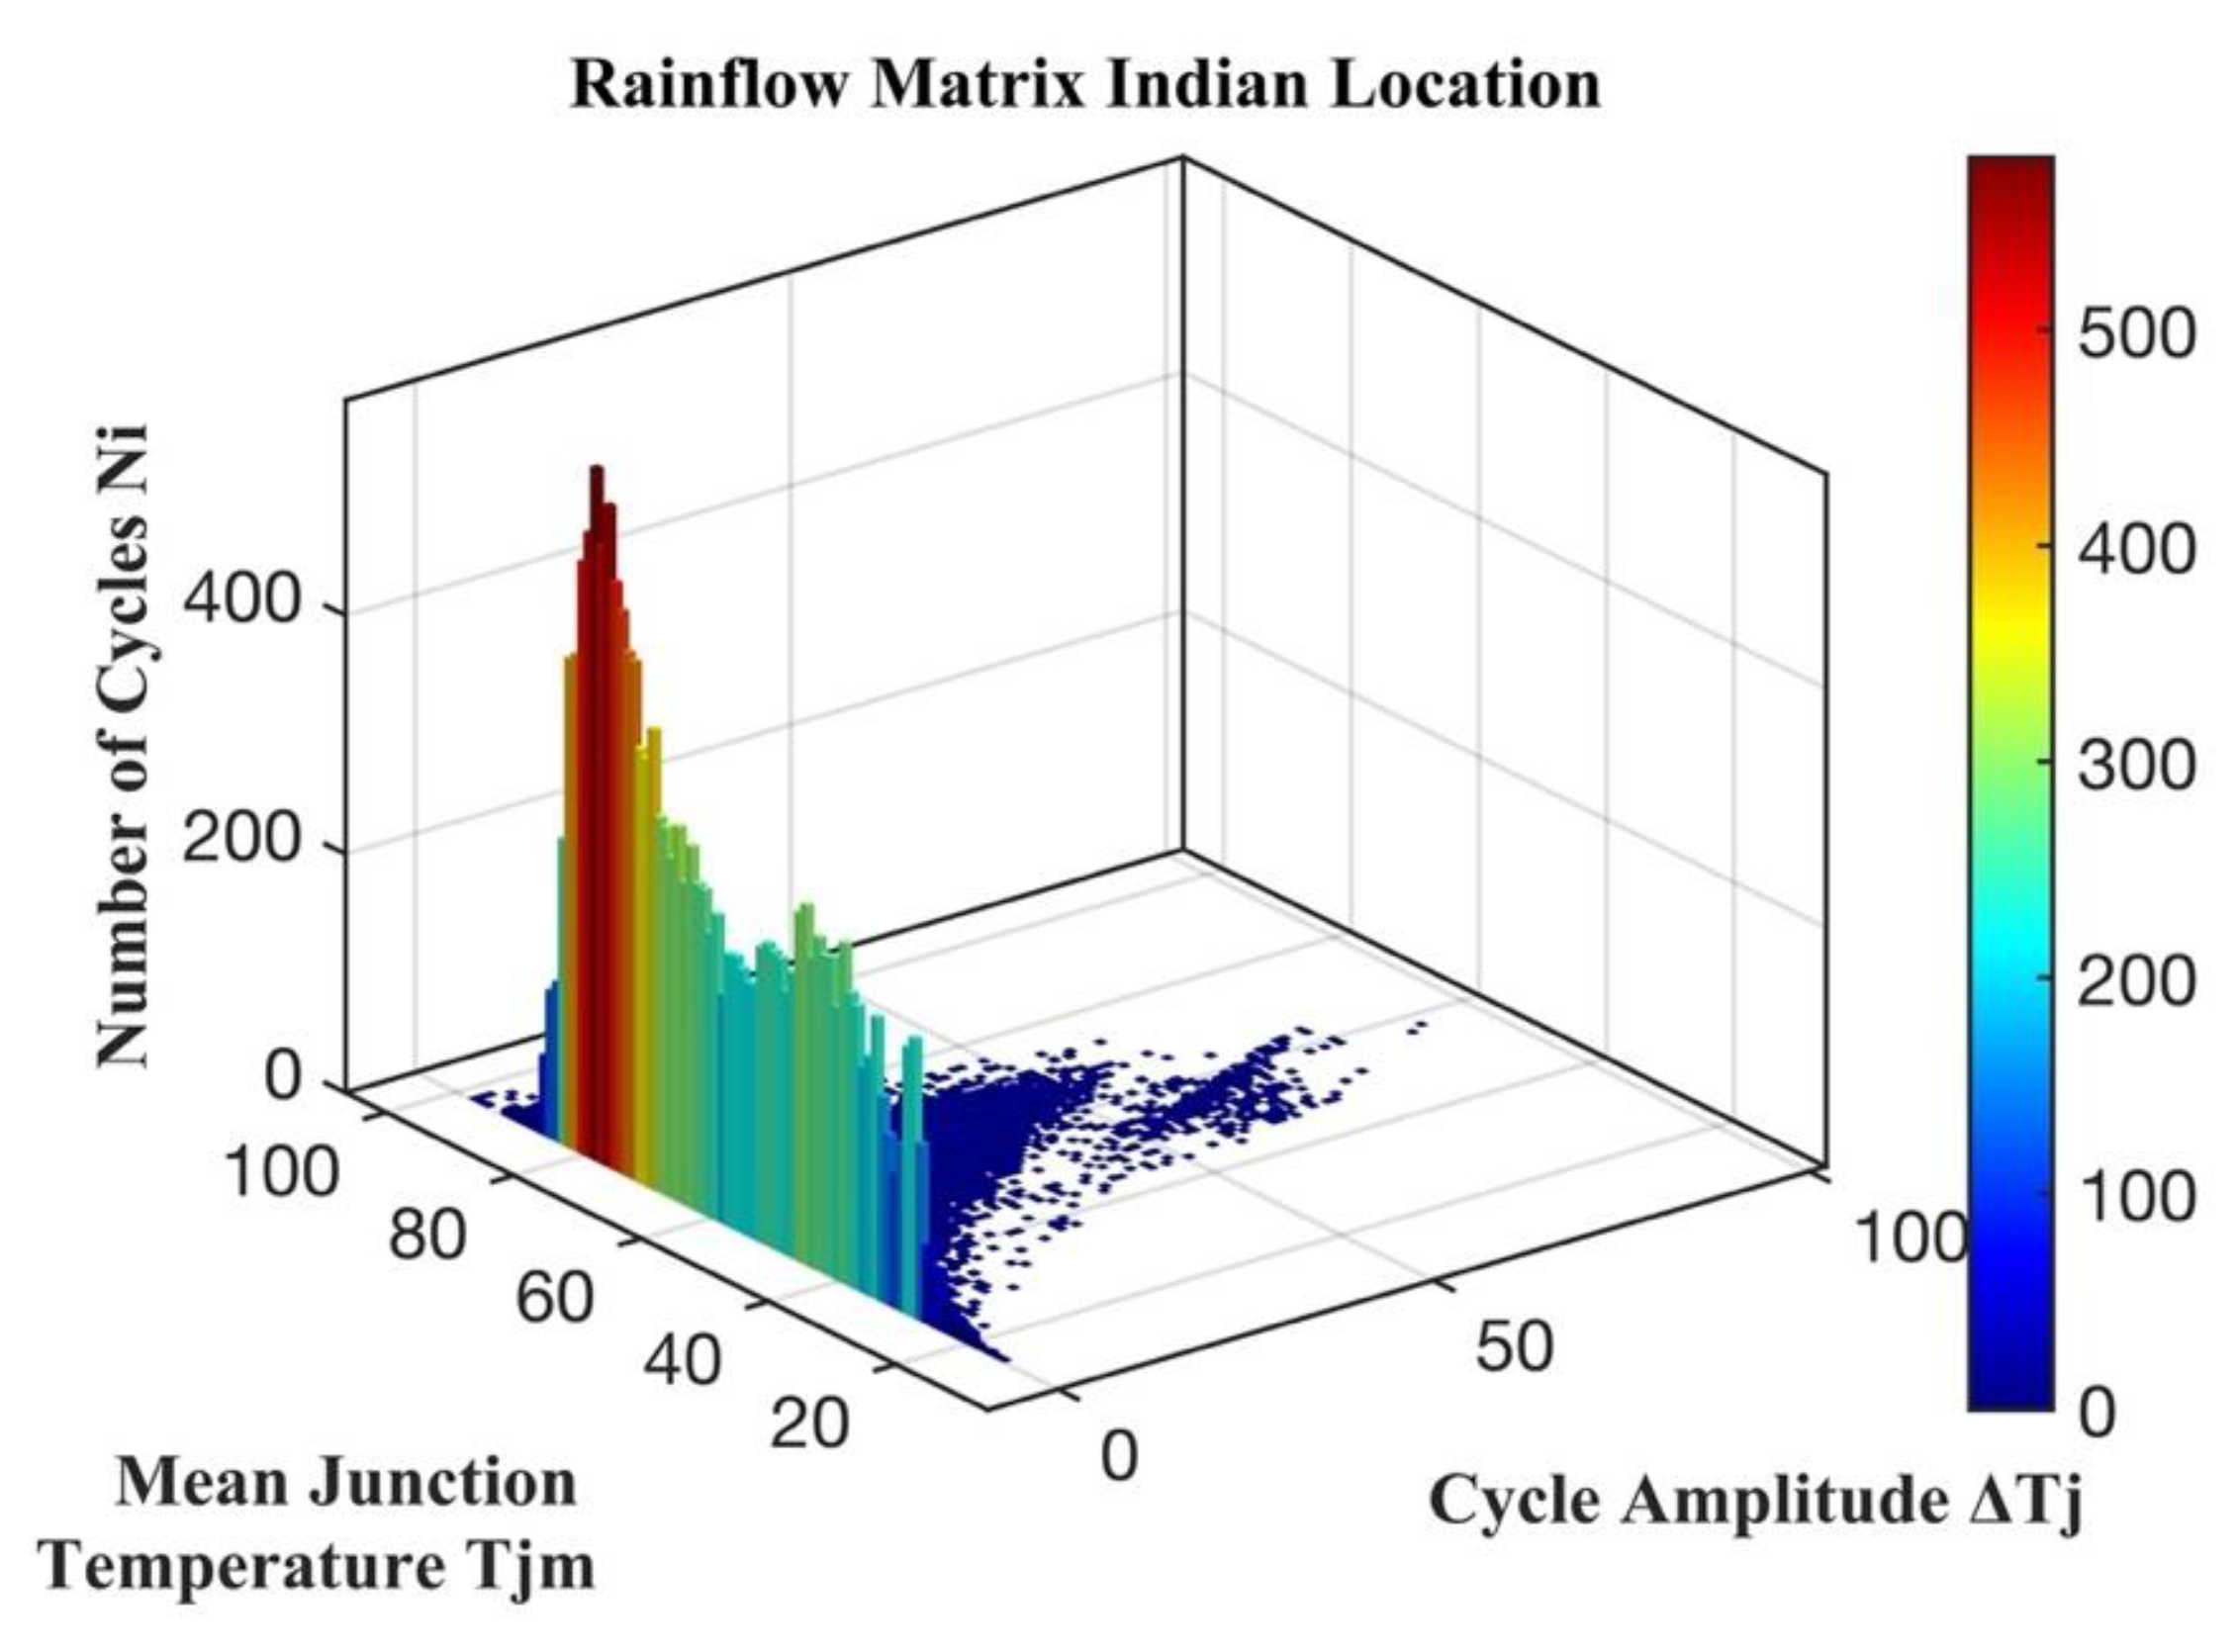
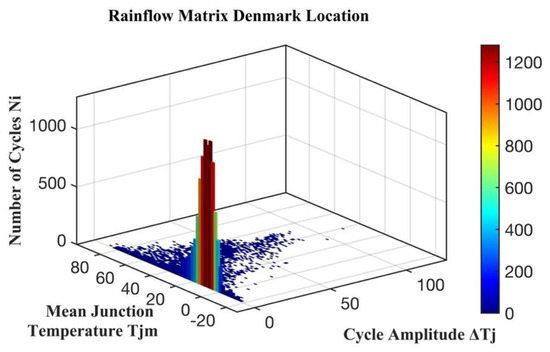
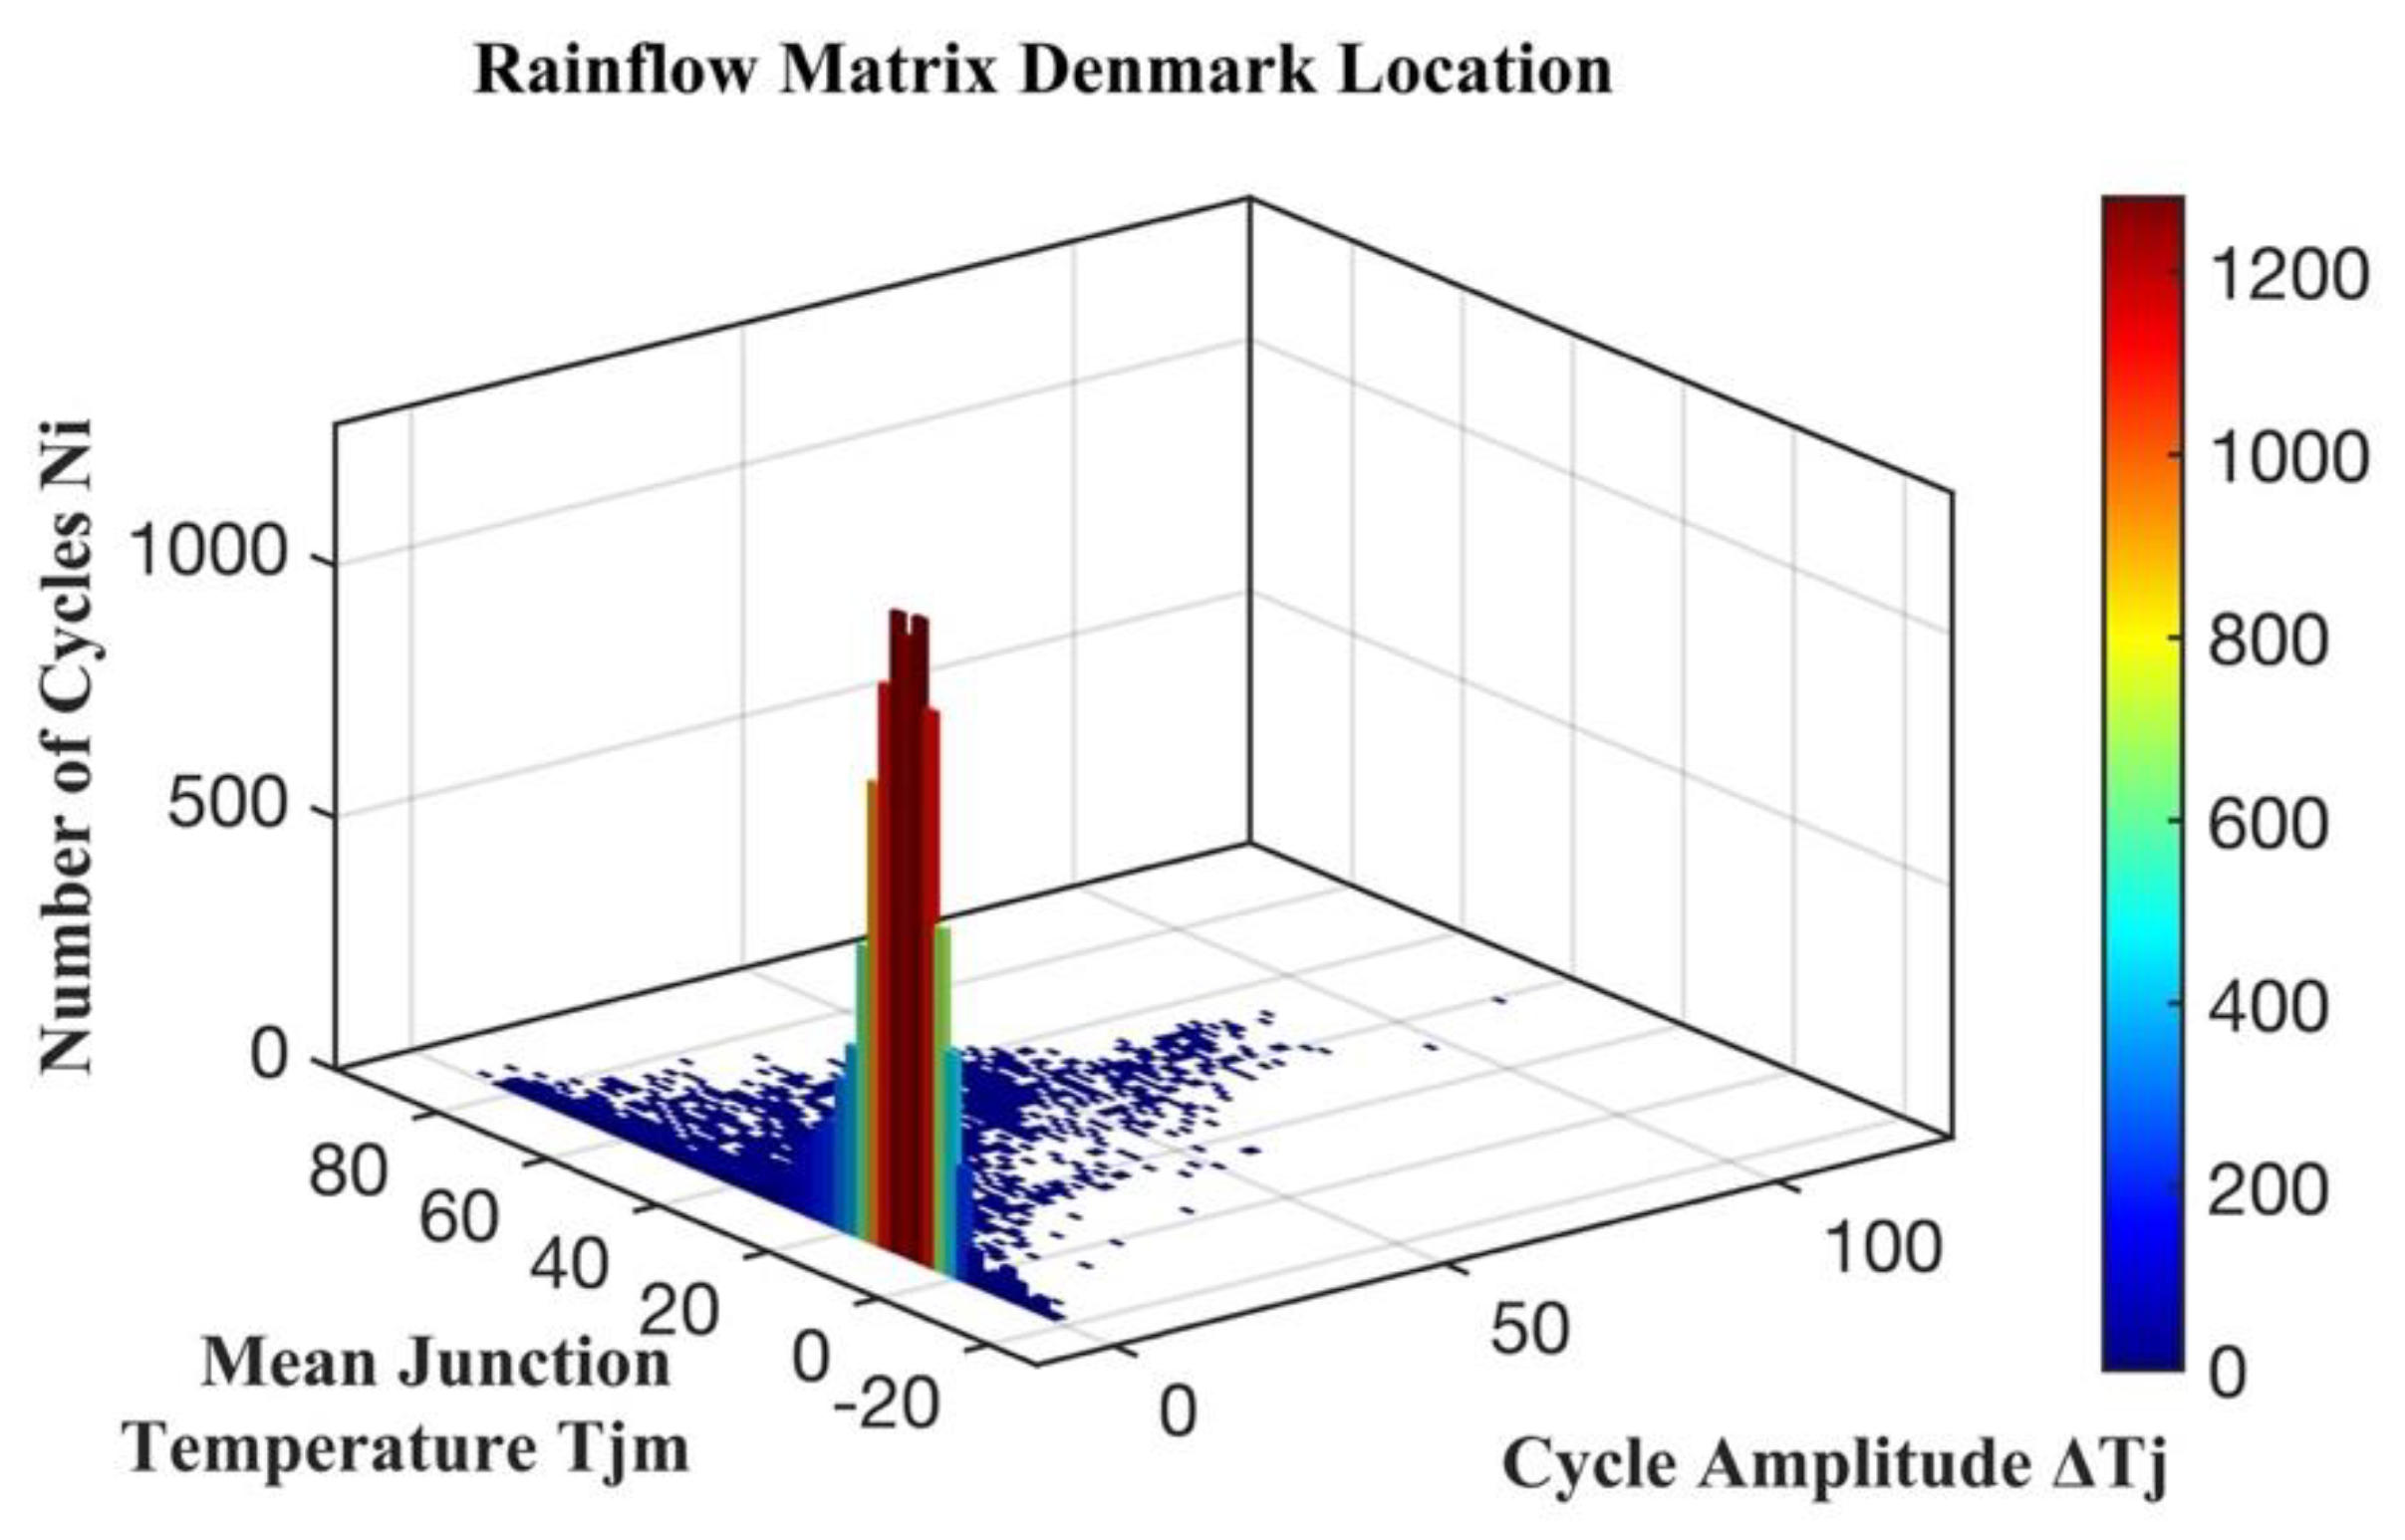
Rainflow counting analysis was implemented for the estimated junction temperatures at the India and Denmark locations as shown in Figure 9 and Figure 10, respectively.
Figure 9.
Rainflow matrix at the location in India.
Figure 10.
Rainflow matrix at the location in Denmark.
3.3. Lifetime Evaluation
Static values (mean values) need to be derived from the rainflow analysis for lifetime evaluation. The lifetime corresponds to the static values calculated with Equation (6), and these are tabulated in the following Table 3.
Table 3.
Lifetime evaluation considering a monofacial PV panel.
As the temperature at the India location was relatively high, the lifetime was 110.06 years, whereas at the Denmark location the temperature was relatively low, and the lifetime was 217.26 years. Hence, this showed that lifetime varies from location to location based on climatic conditions. The lifetime of the PV inverter was higher at the Denmark location than at the India location.
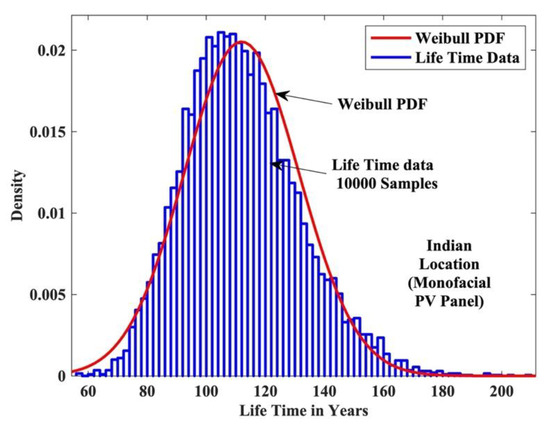
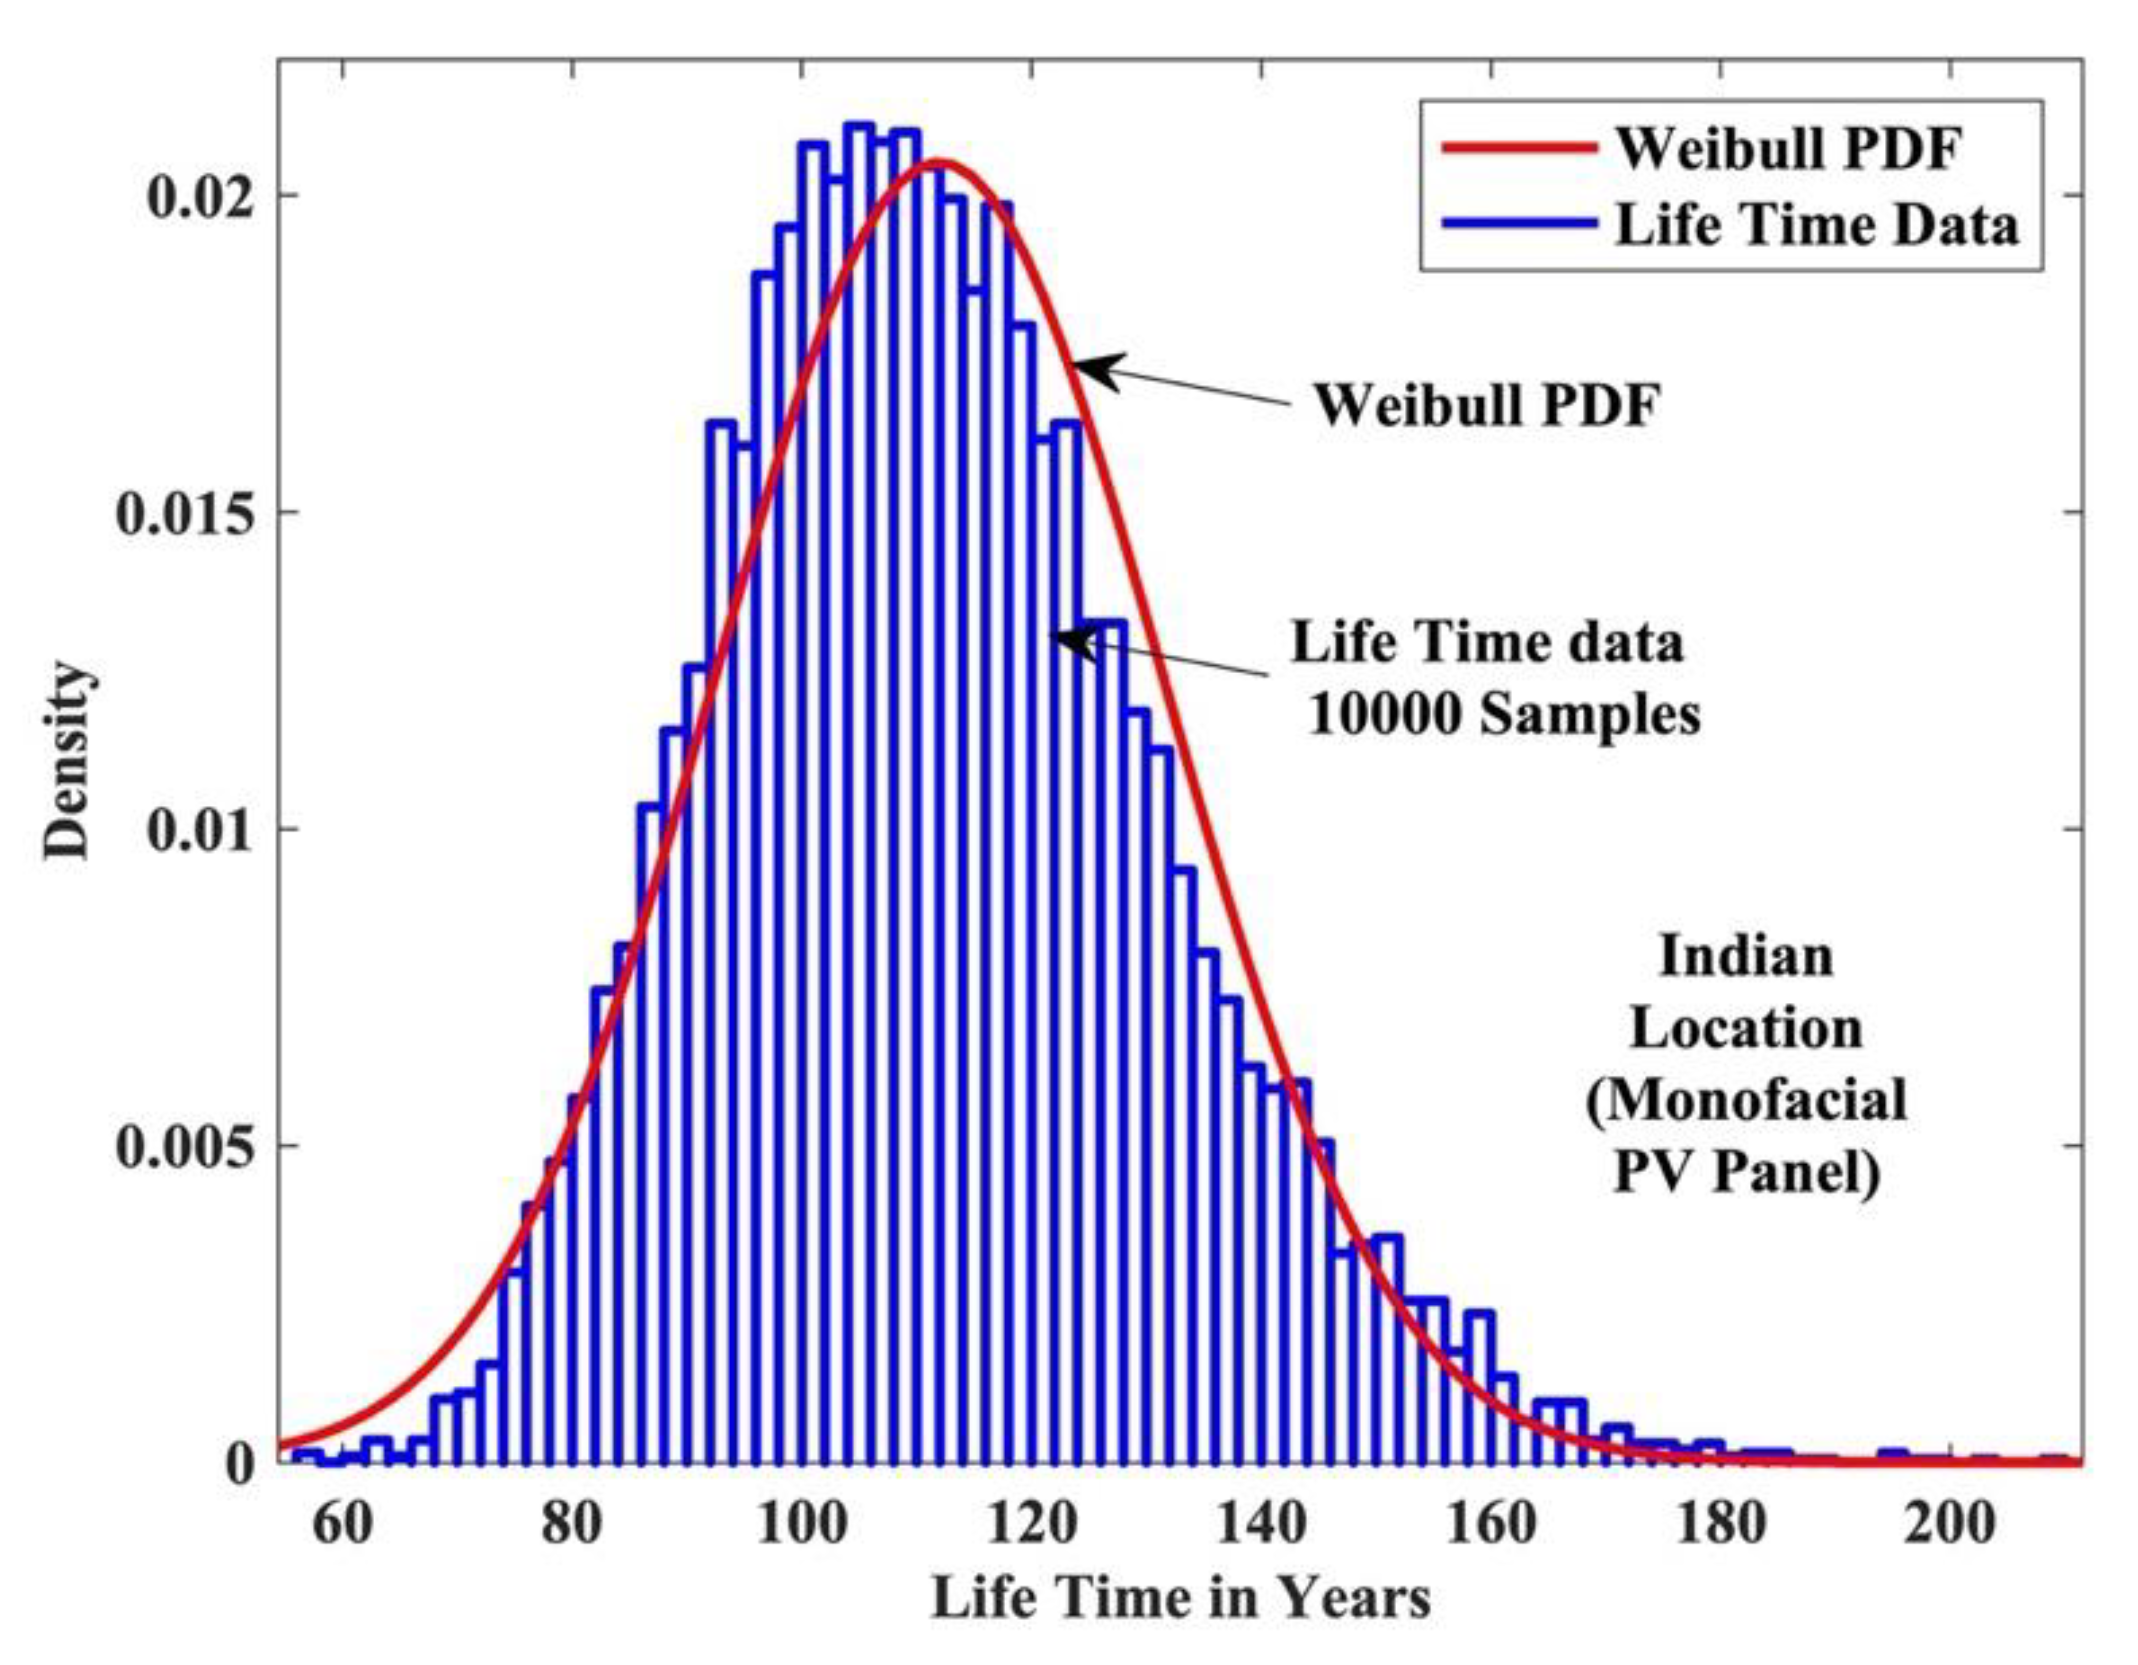
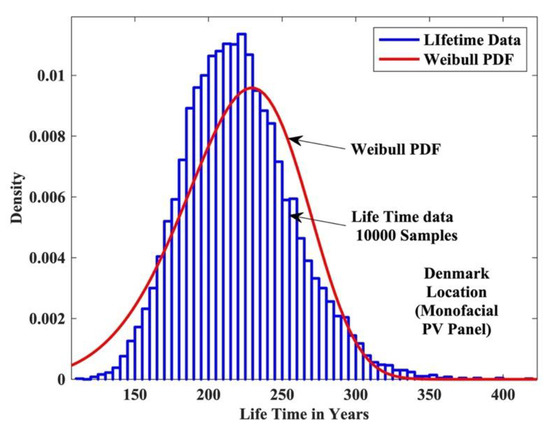
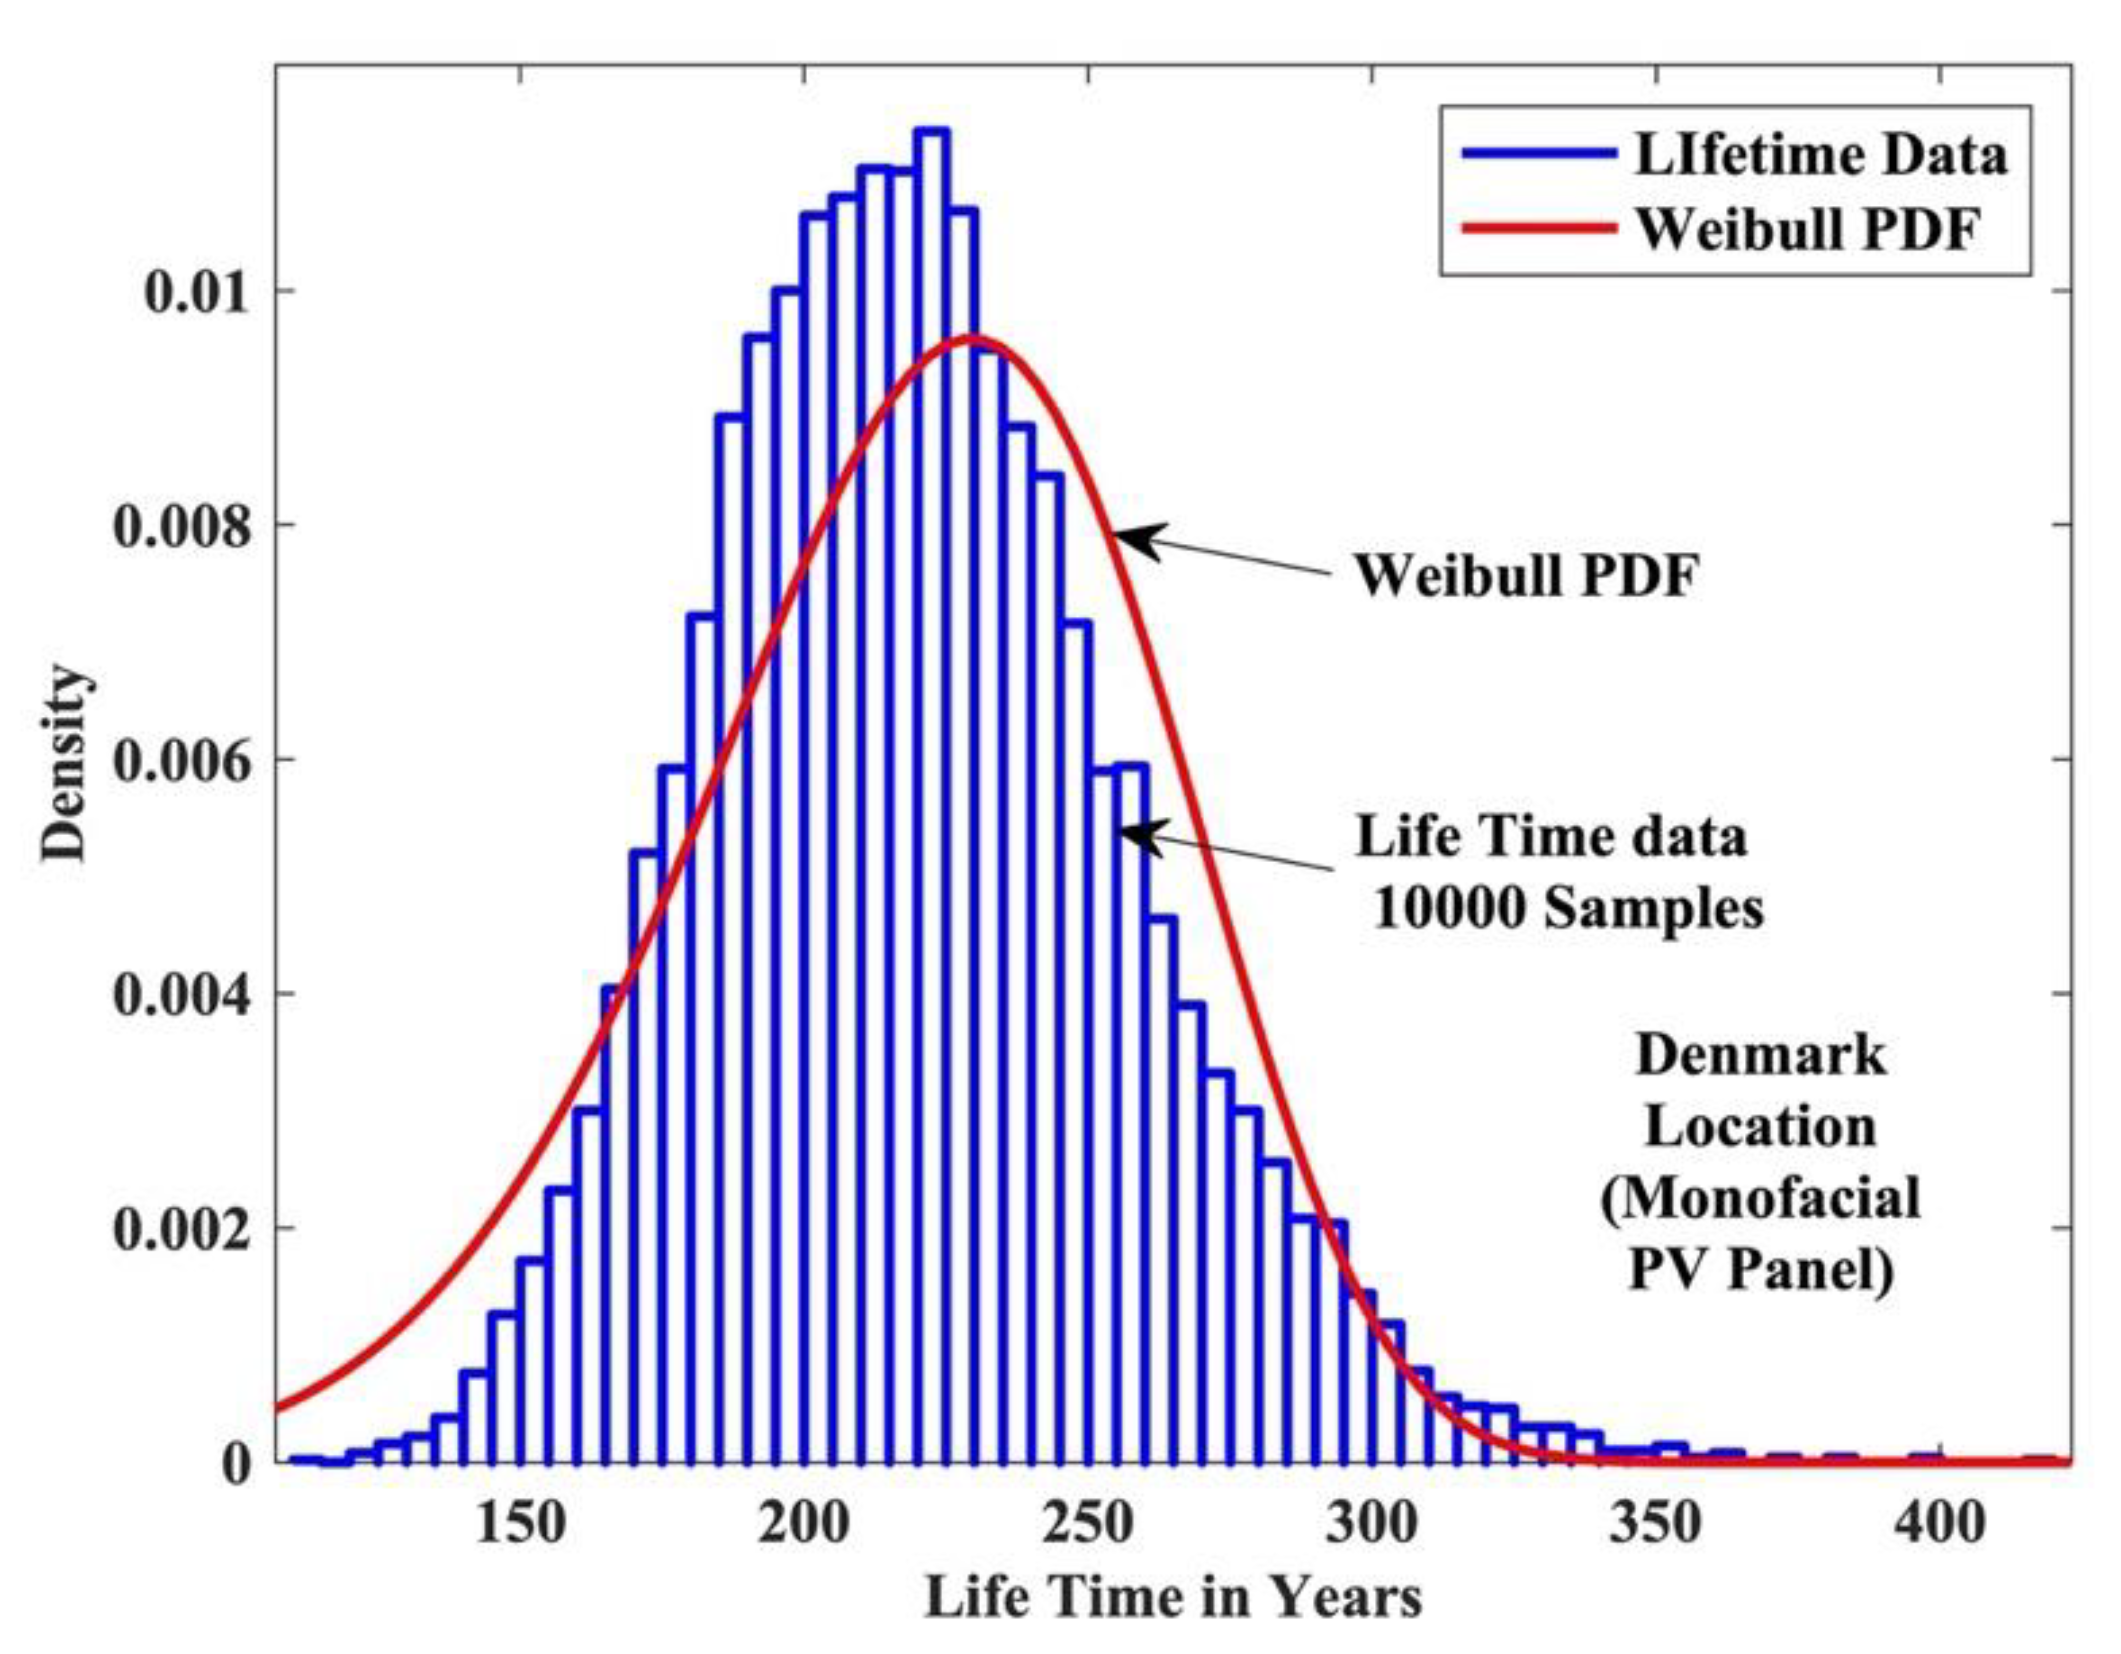
With the Monte Carlo simulation, 10,000 samples were generated with five percent variation in all the parameters in Equation (5). The lifetime distribution of the PV inverter at the India location is shown in Figure 11. Similarly, the lifetime distribution of the PV inverter at the Denmark location is shown in Figure 12.
Figure 11.
Lifetime distribution of PV inverter at location in India.
Figure 12.
Lifetime distribution of the PV inverter at the location in Denmark.
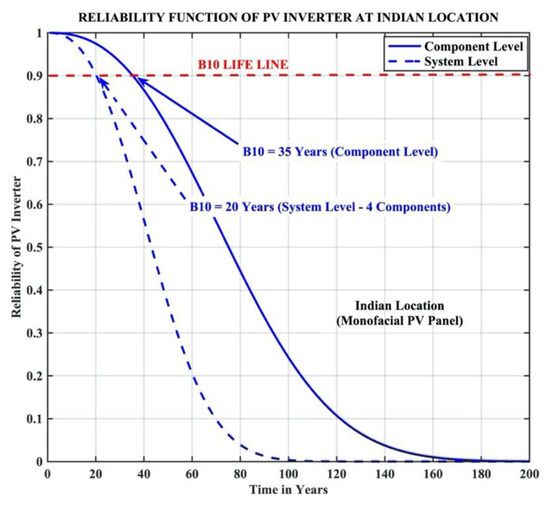
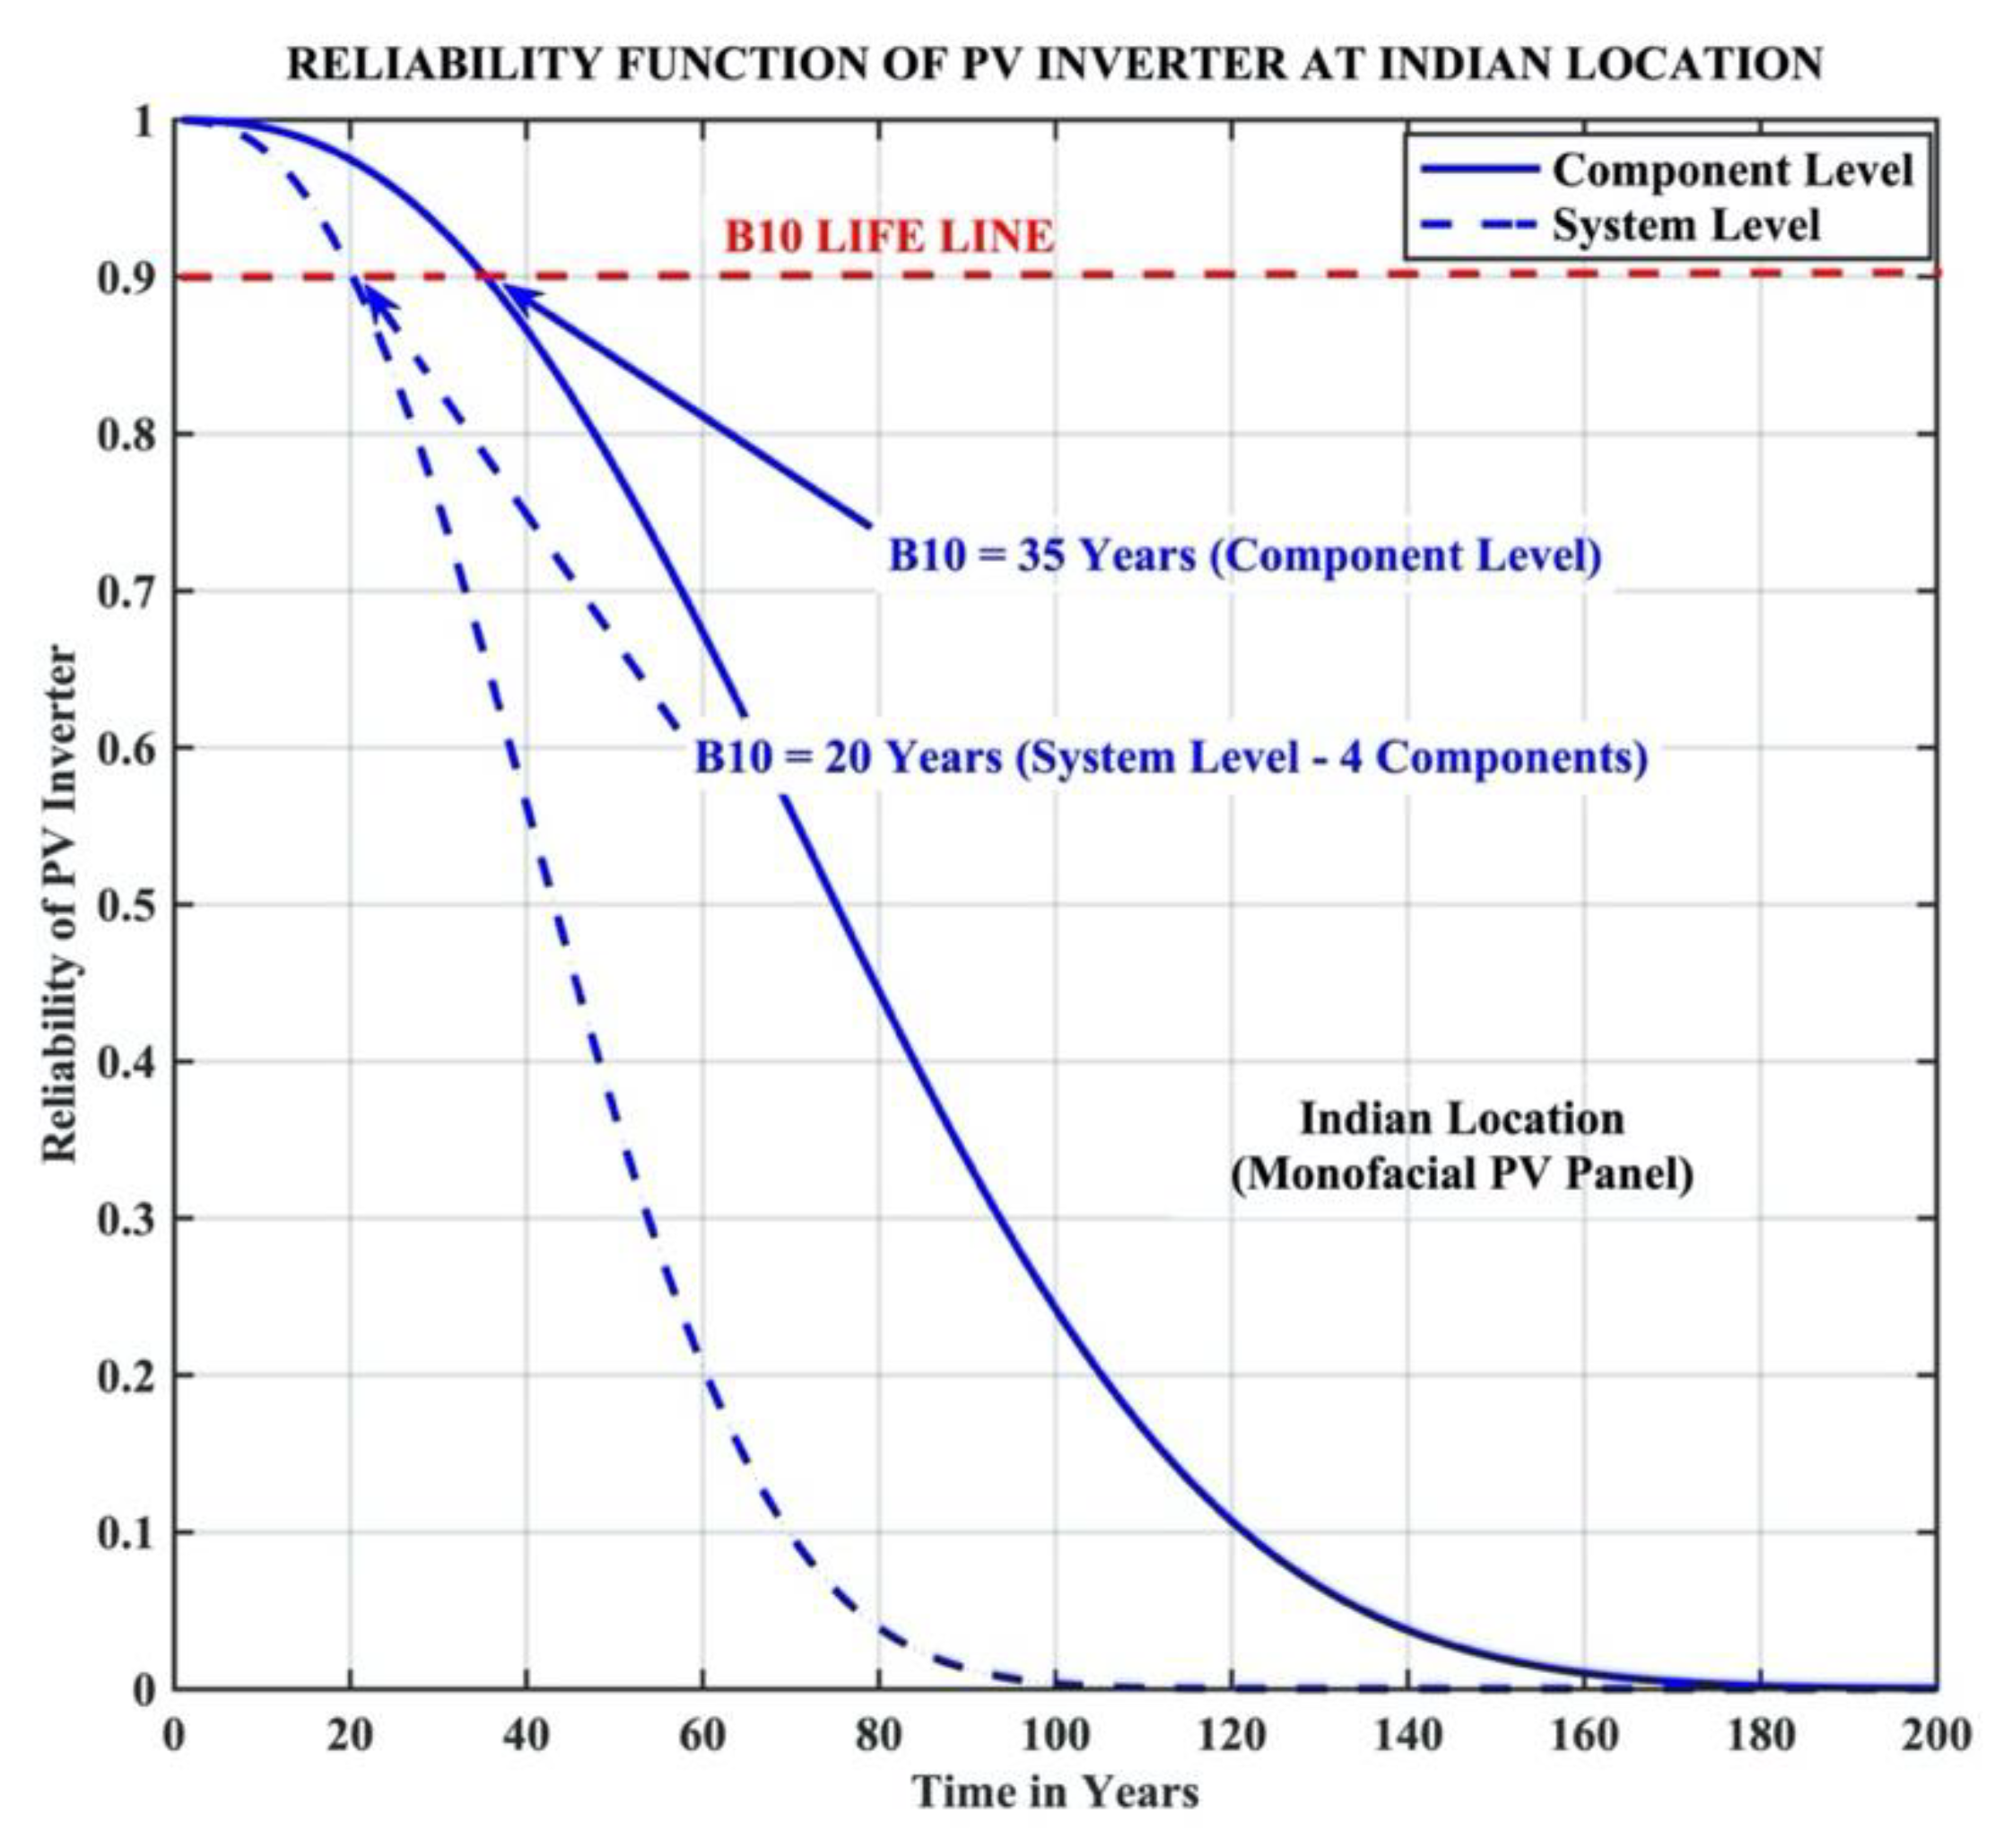
The reliability function R(t) was taken as a two-parameter Weibull distribution. Component- and system-level reliability were calculated using Equations (8) and (9), respectively. Reliability function R(t) at the India location is shown in Figure 13. Similarly, reliability function R(t) at the Denmark location is shown in Figure 14. The reliability function’s density was higher at the location in India in comparison to the Denmark location.
Figure 13.
Reliability function of the PV inverter at the location in India.
Figure 14.
Reliability function of the PV inverter at the location in Denmark.
B10 lifetimes at both the India and Denmark locations are tabulated in the following Table 4.
Table 4.
B10 lifetimes of PV inverters considering a monofacial PV panel.
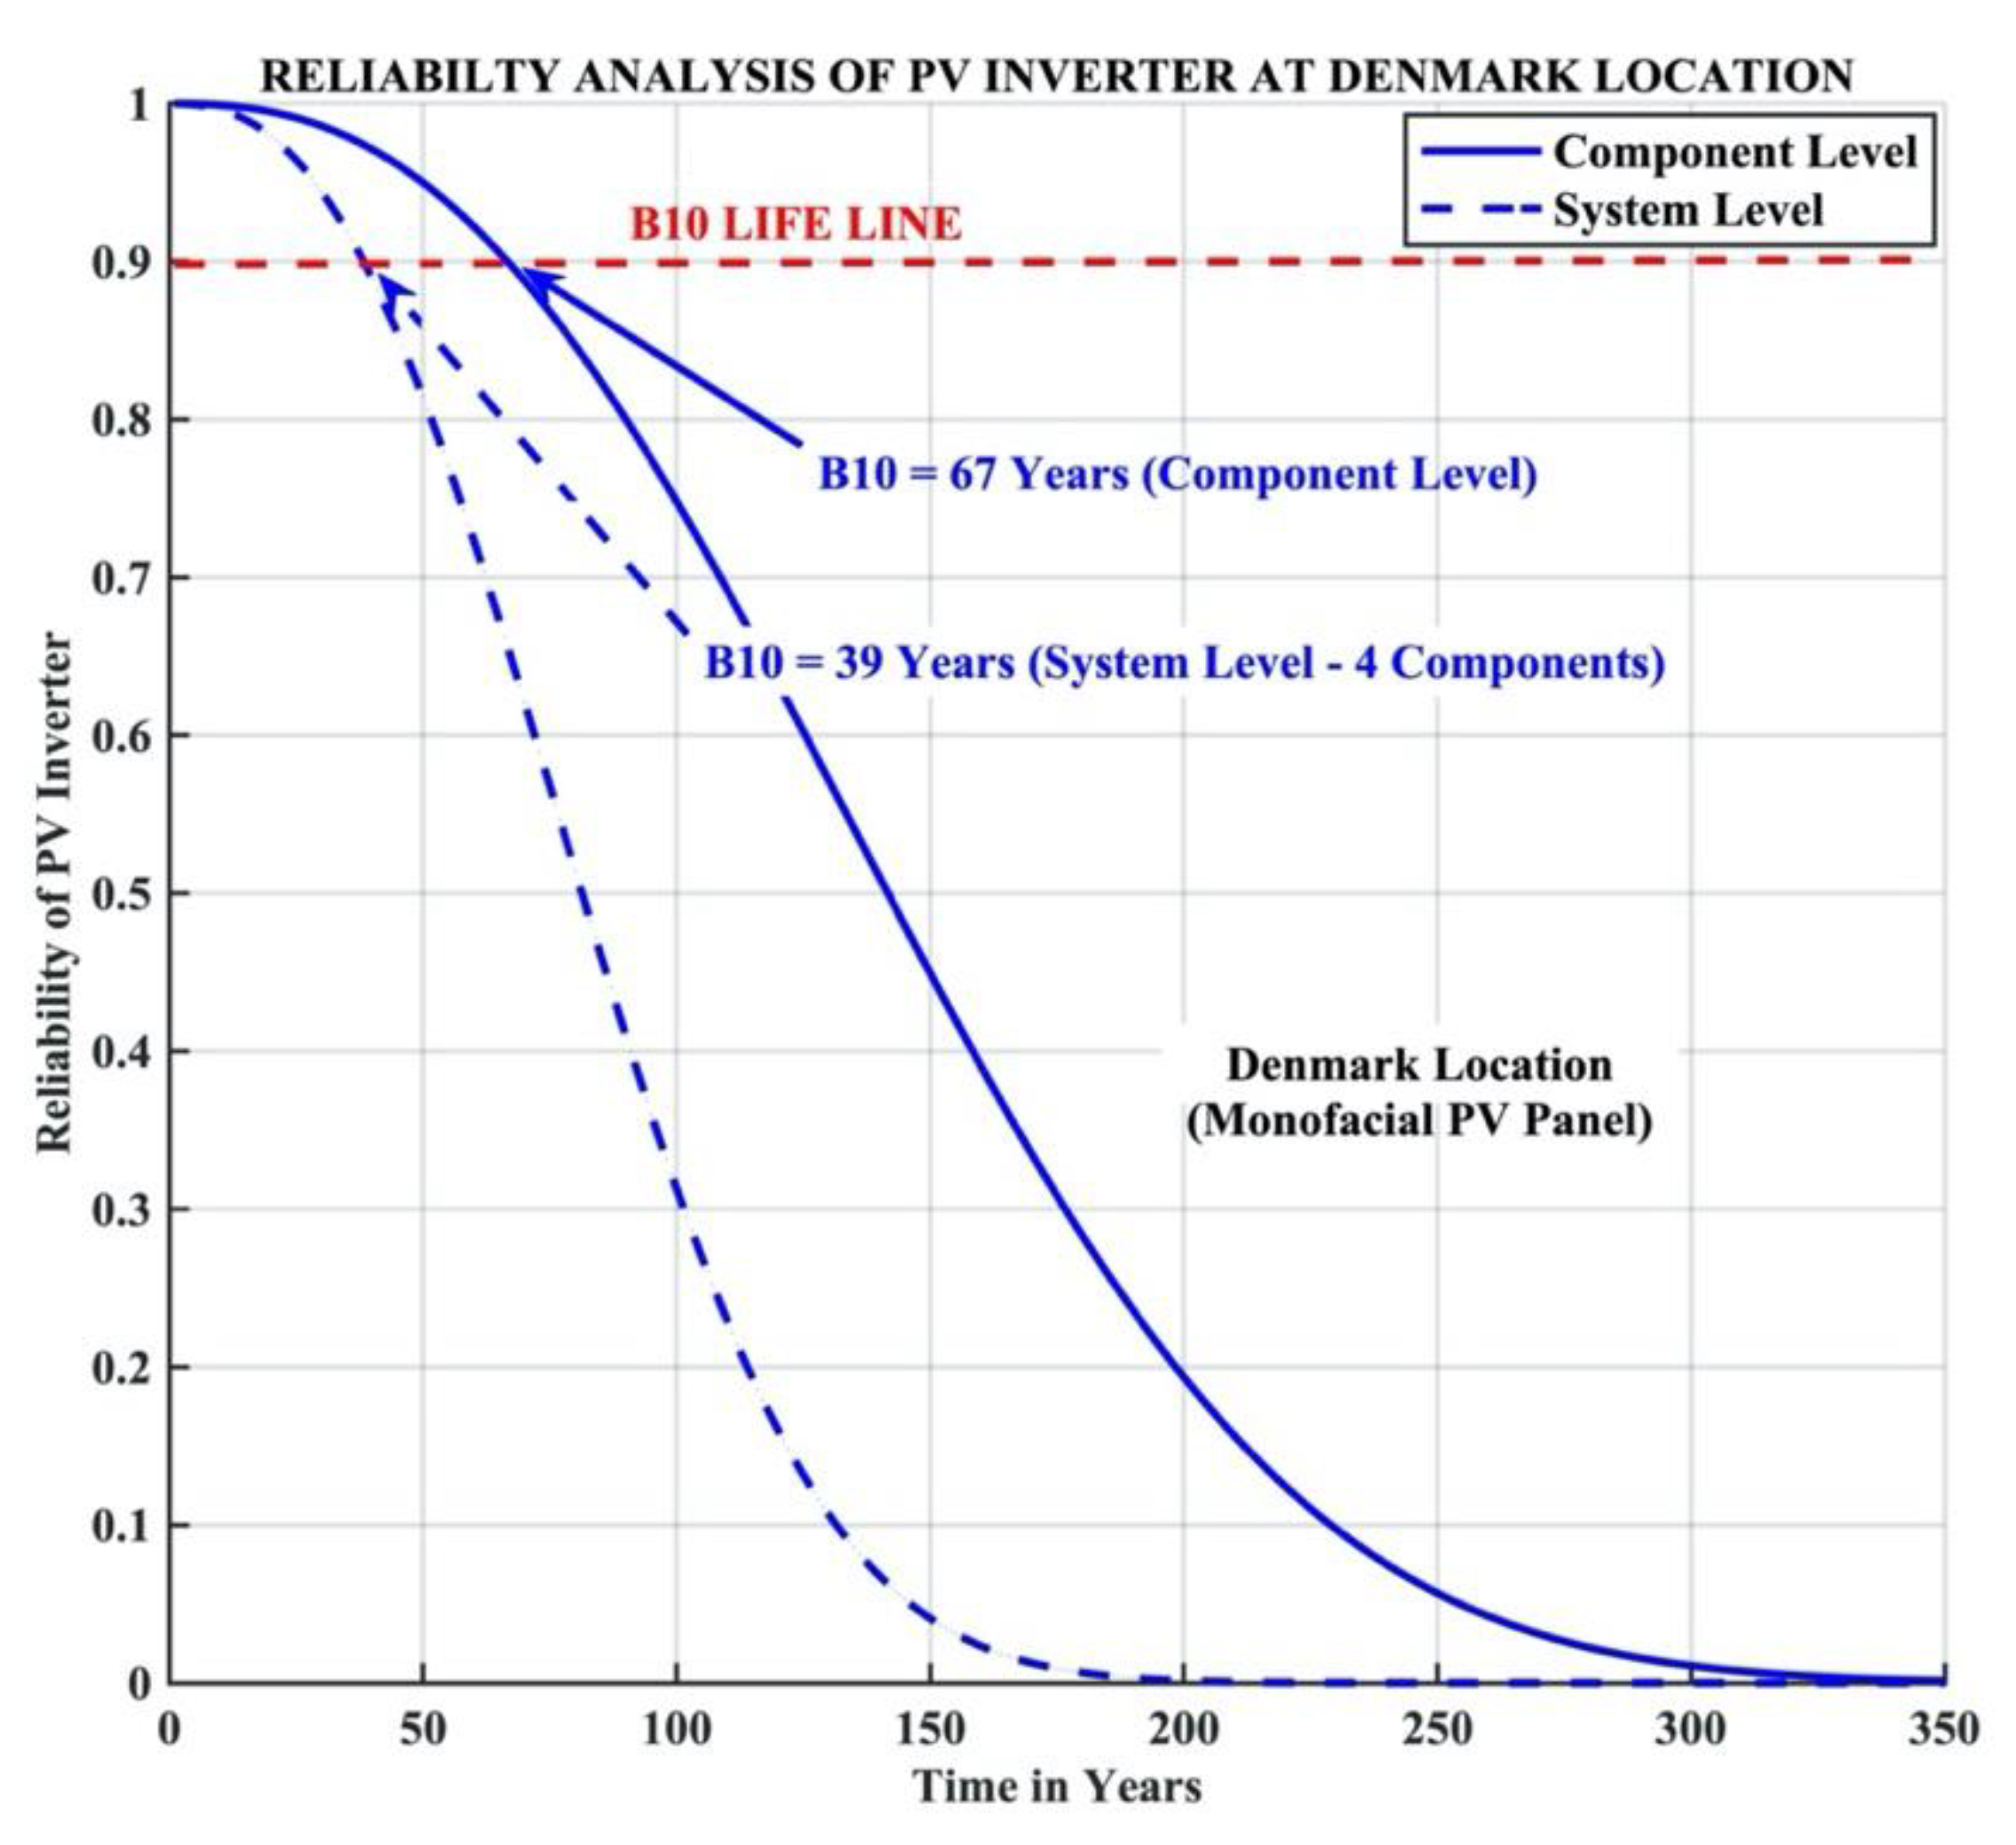
The B10 lifetime considering a monofacial PV panel at the Denmark location was higher compared to that at the India location. Due to the low average temperature recorded at the Denmark location, the thermal loading on the PV inverter decreased, leading to higher reliability, but power generation would be low compared with the India location. Similar work was presented in [15] comparing Denmark and Arizona locations. Component-level B10 lifetimes at the Denmark and Arizona locations were 74 years and eight years, respectively; system-level B10 lifetimes at the Denmark and Arizona locations were 53 years and six years, respectively.
3.4. Reliability Analysis of PV Inverter Considering a Bifacial PV Panel
3.4.1. Estimation of Junction Temperature
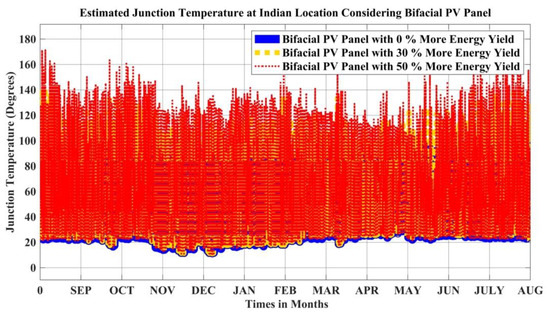
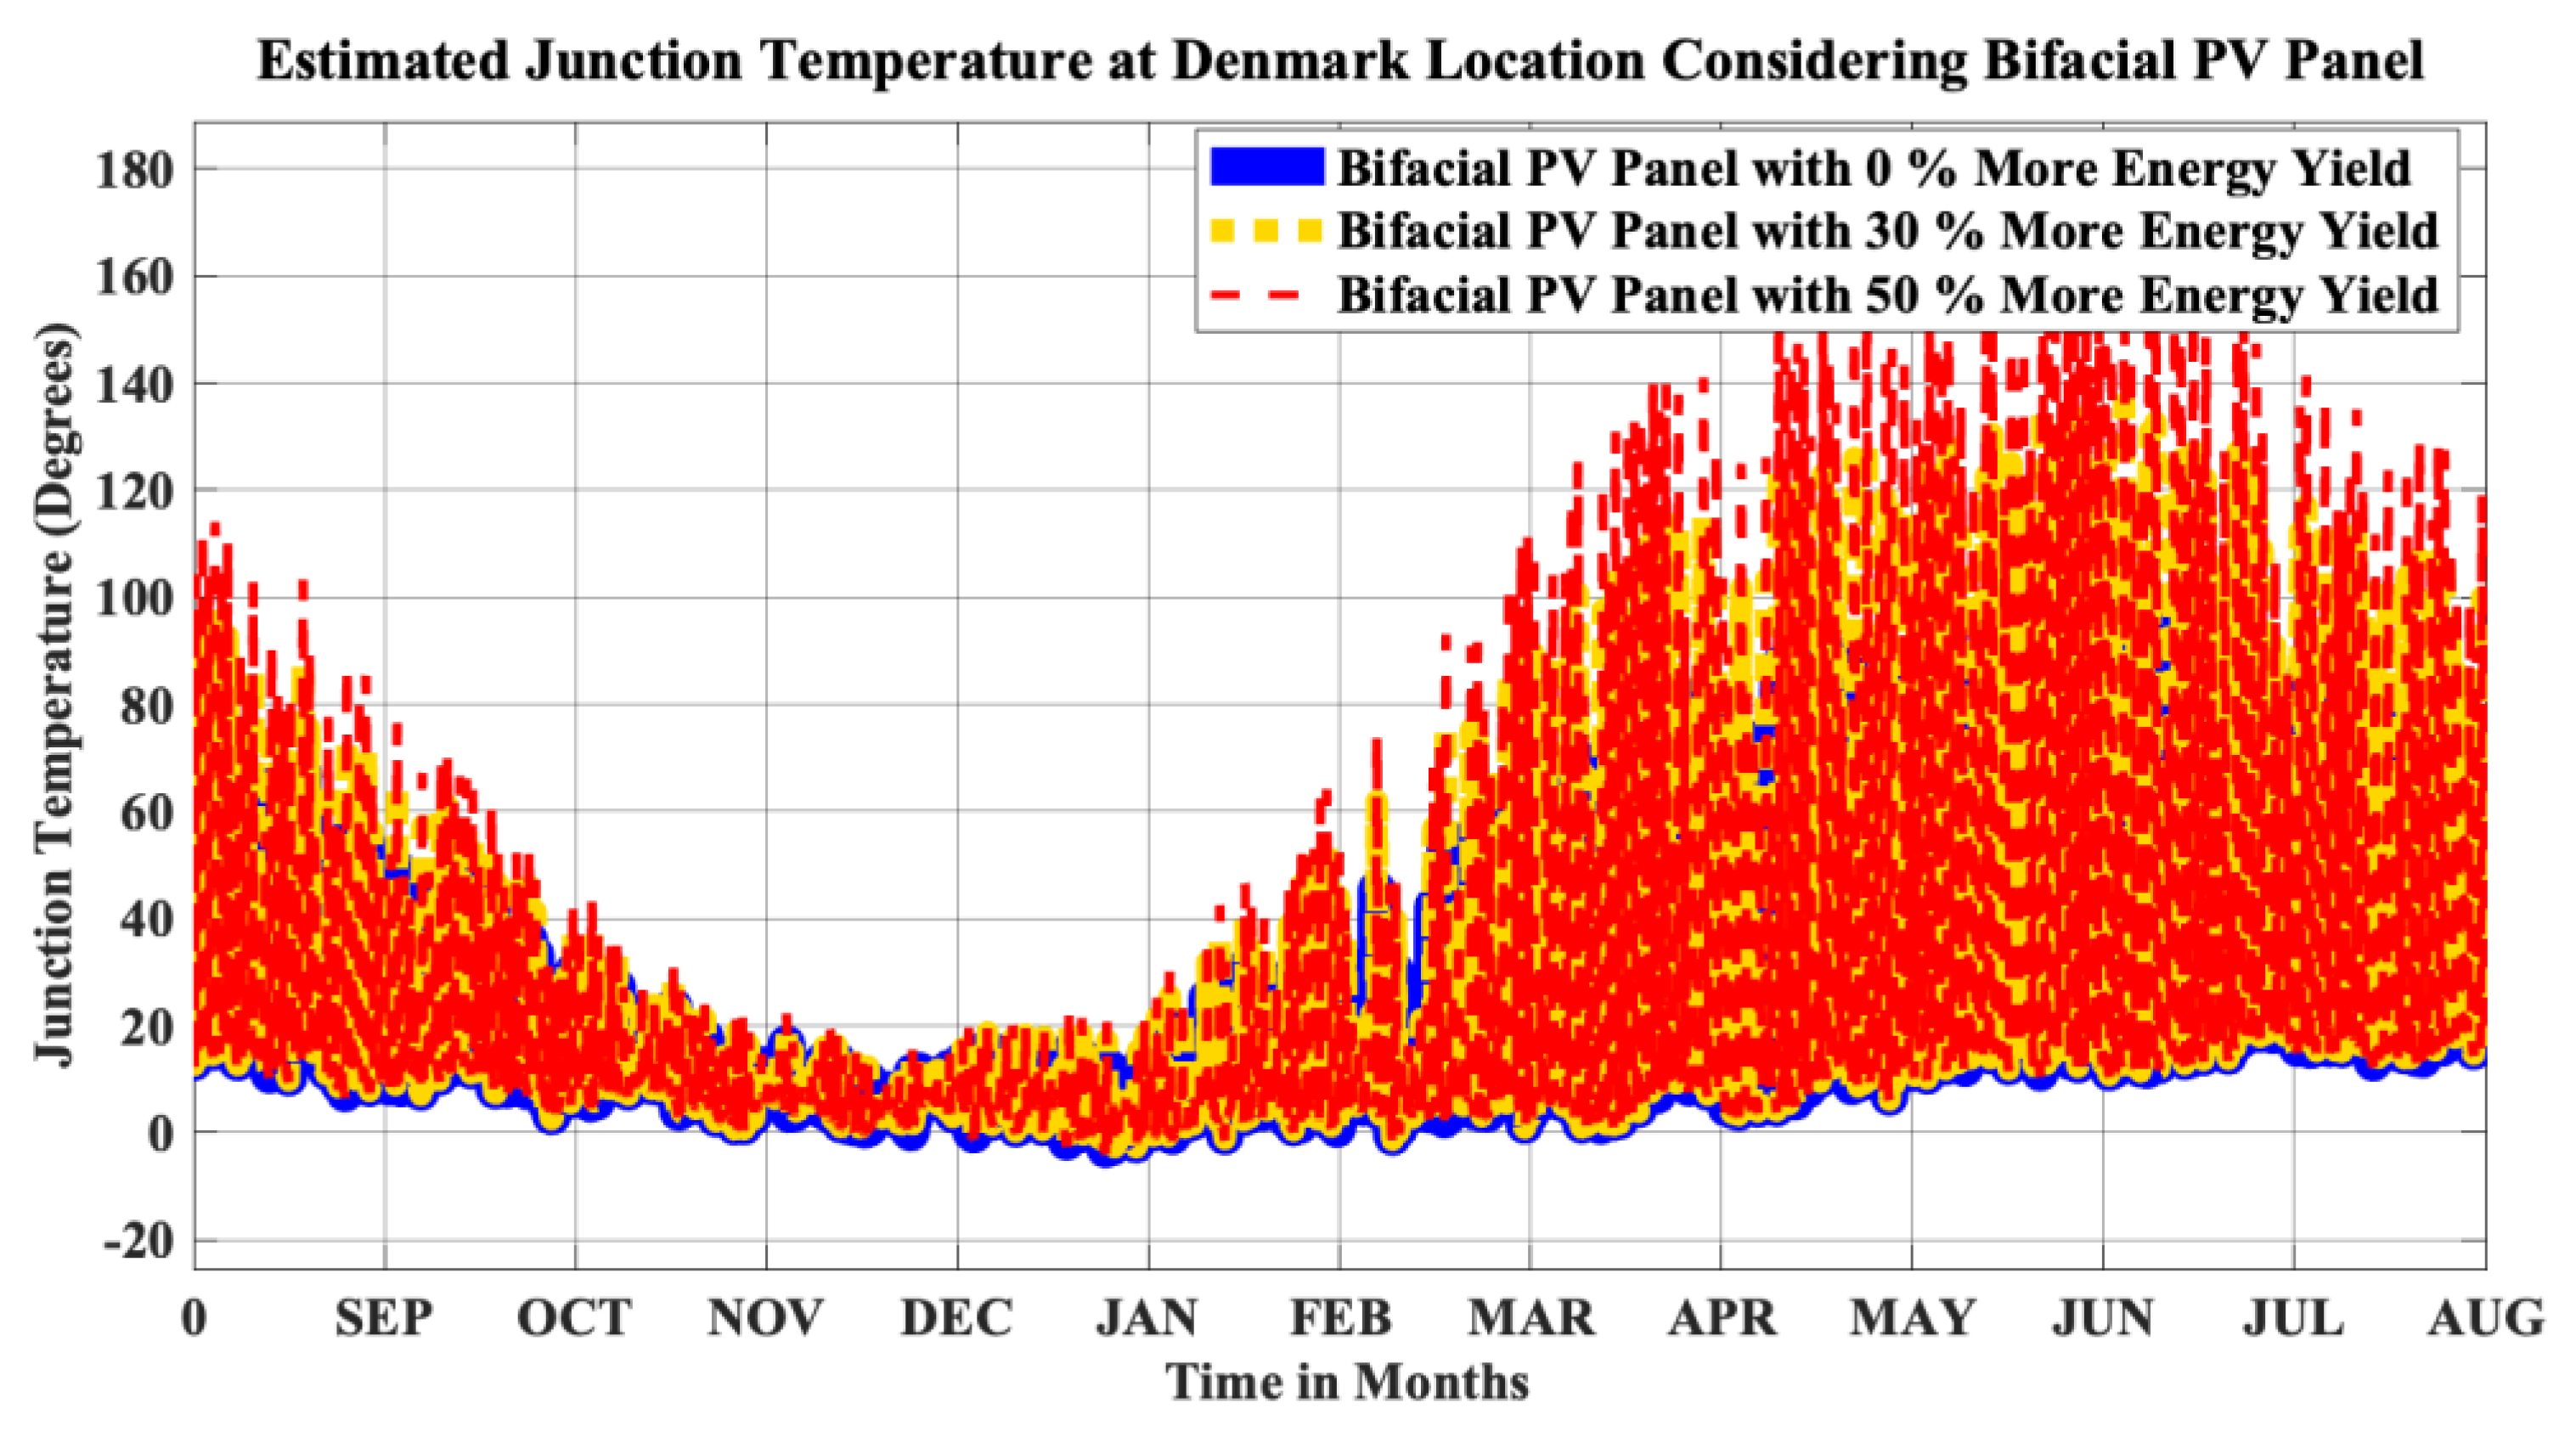
In the following sections, a grid connected PV inverter with a bifacial PV panel is considered. Using the Foster electro-thermal model of IGBT, the junction temperature was estimated as per Equation (1). The junction temperature corresponding to the yearly mission profile at the India location is shown in Figure 15, and that at the Denmark location in Figure 16.
Figure 15.
One-year estimated junction temperature at the location in India.
Figure 16.
One-year estimated junction temperature at the location in Denmark.
The junction temperature of the IGBT was estimated considering bifacial PV panels with baseline energy yield, 30% more energy yield, and 50% more energy yield. In all three cases at both locations, junction temperature increased with increases in bifacial PV panel energy yield.
3.4.2. Rainflow Counting Analysis
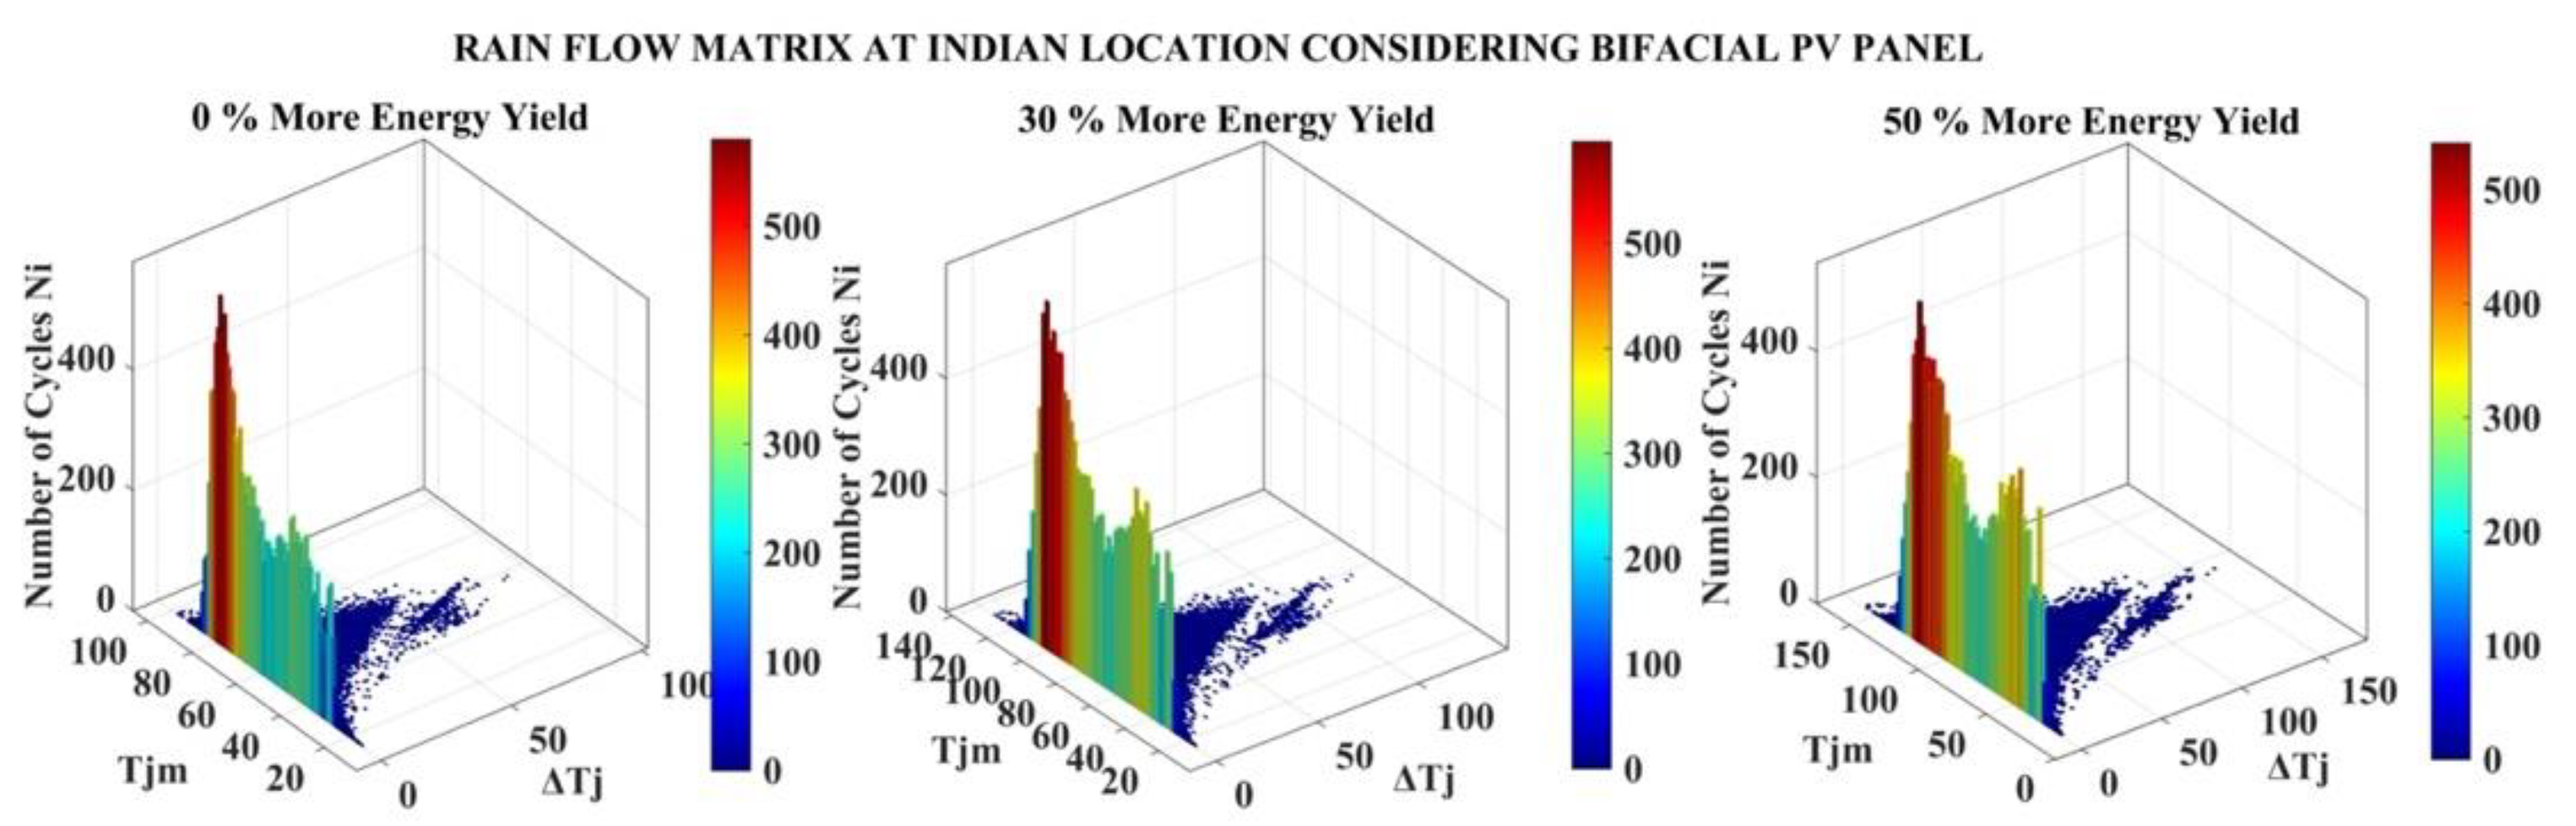
Rainflow counting analysis was implemented for the estimated junction temperatures at the India and Denmark locations as shown in Figure 17 and Figure 18, respectively.
Figure 17.
Rainflow matrix at the location in India.
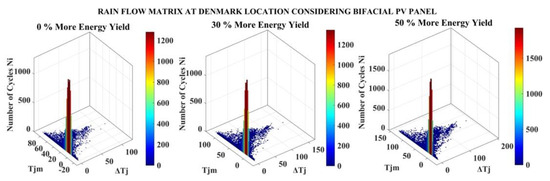
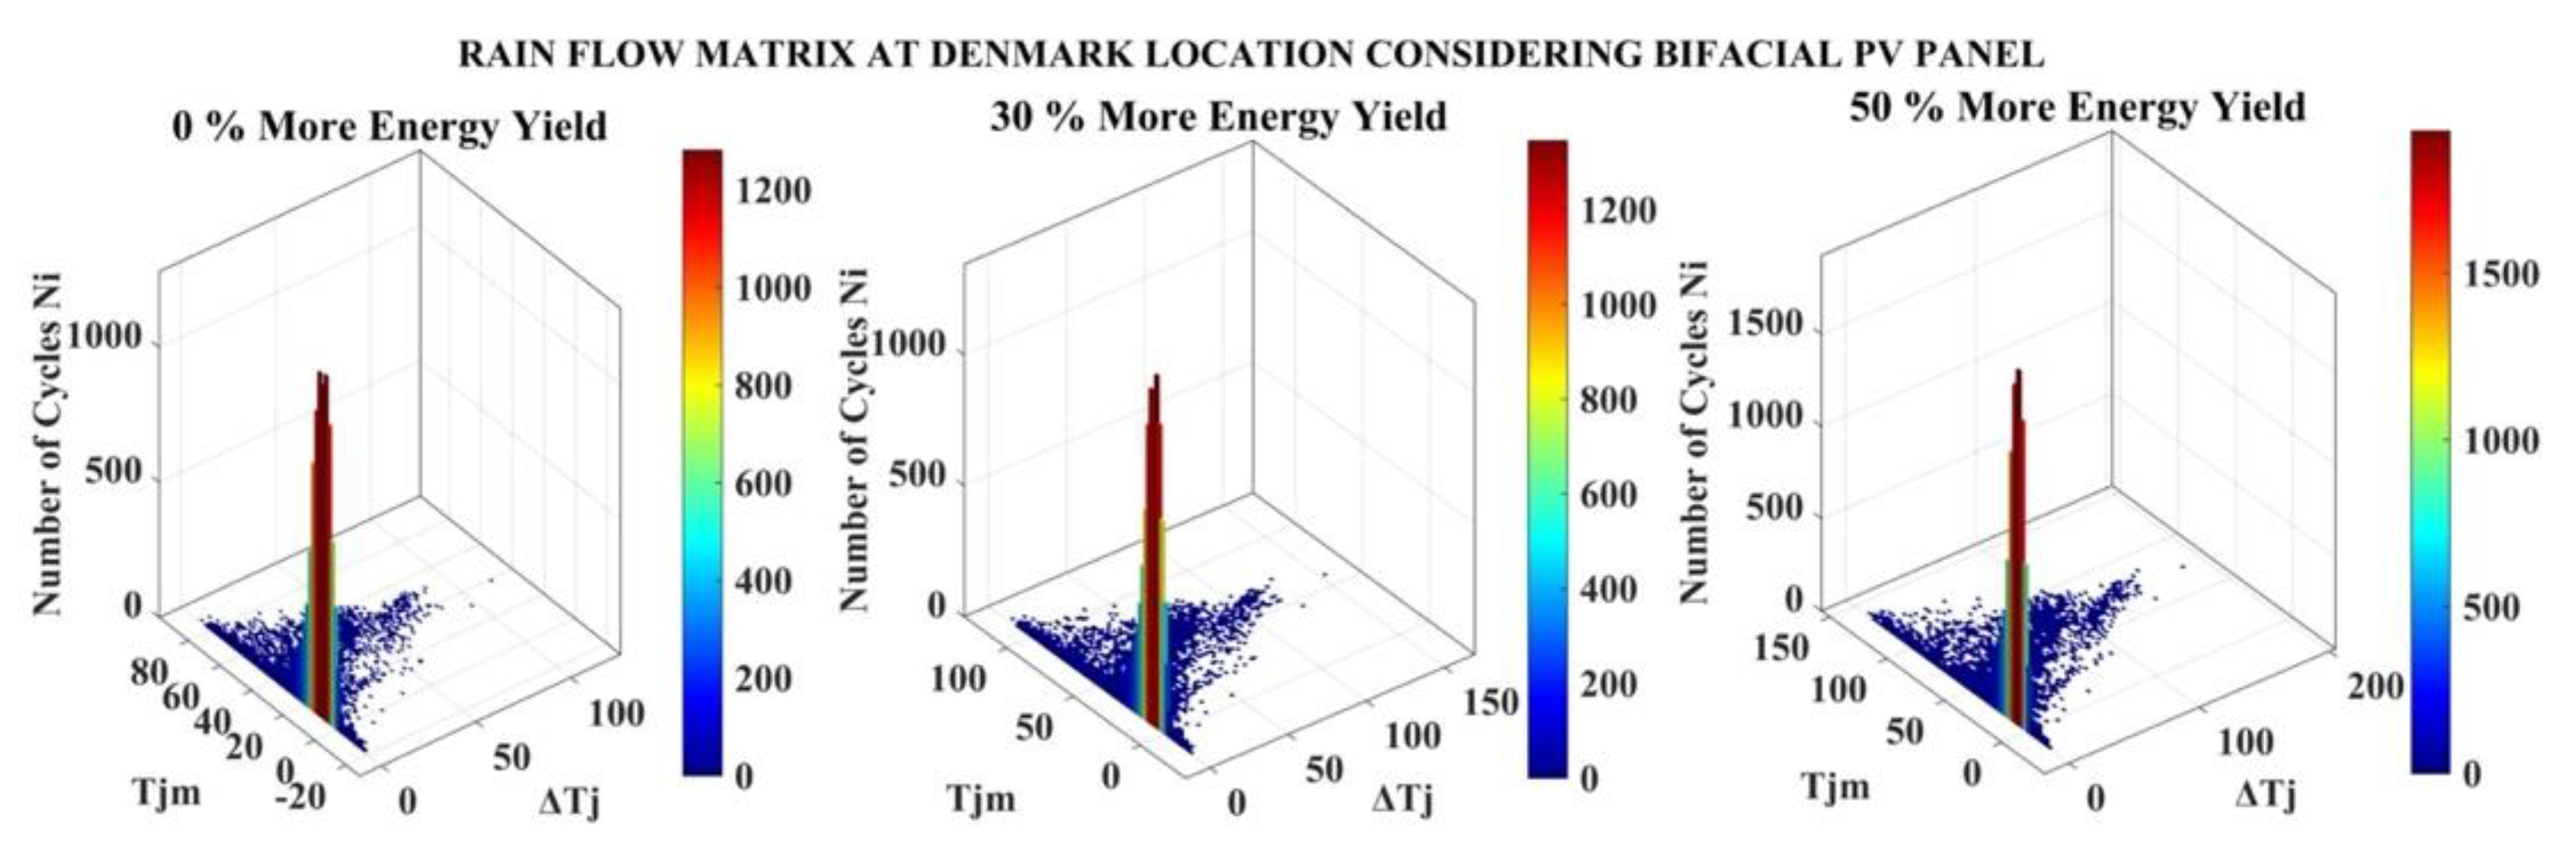
Figure 18.
Rainflow matrix at the location in Denmark.
3.5. Lifetime Evaluation
Static values (mean values) need to be derived from the rainflow analysis for lifetime evaluation. In Table 5, lifetimes are evaluated for bifacial PV panels with 0%, 30% and 50% additional energy yield and correspond to the static values calculated with Equation (6).
Table 5.
Lifetime Evaluation considering Bifacial PV panel.
Increasing bifacial PV panel energy yield led to increases in mean junction temperature Tjm and cycle amplitude ΔTj.
3.6. Reliability Analysis Using Monte Carlo Simulation
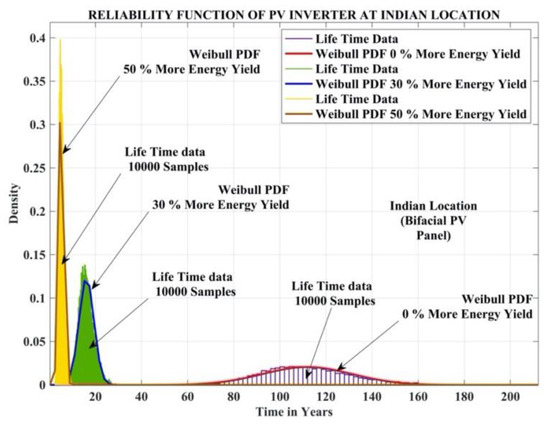
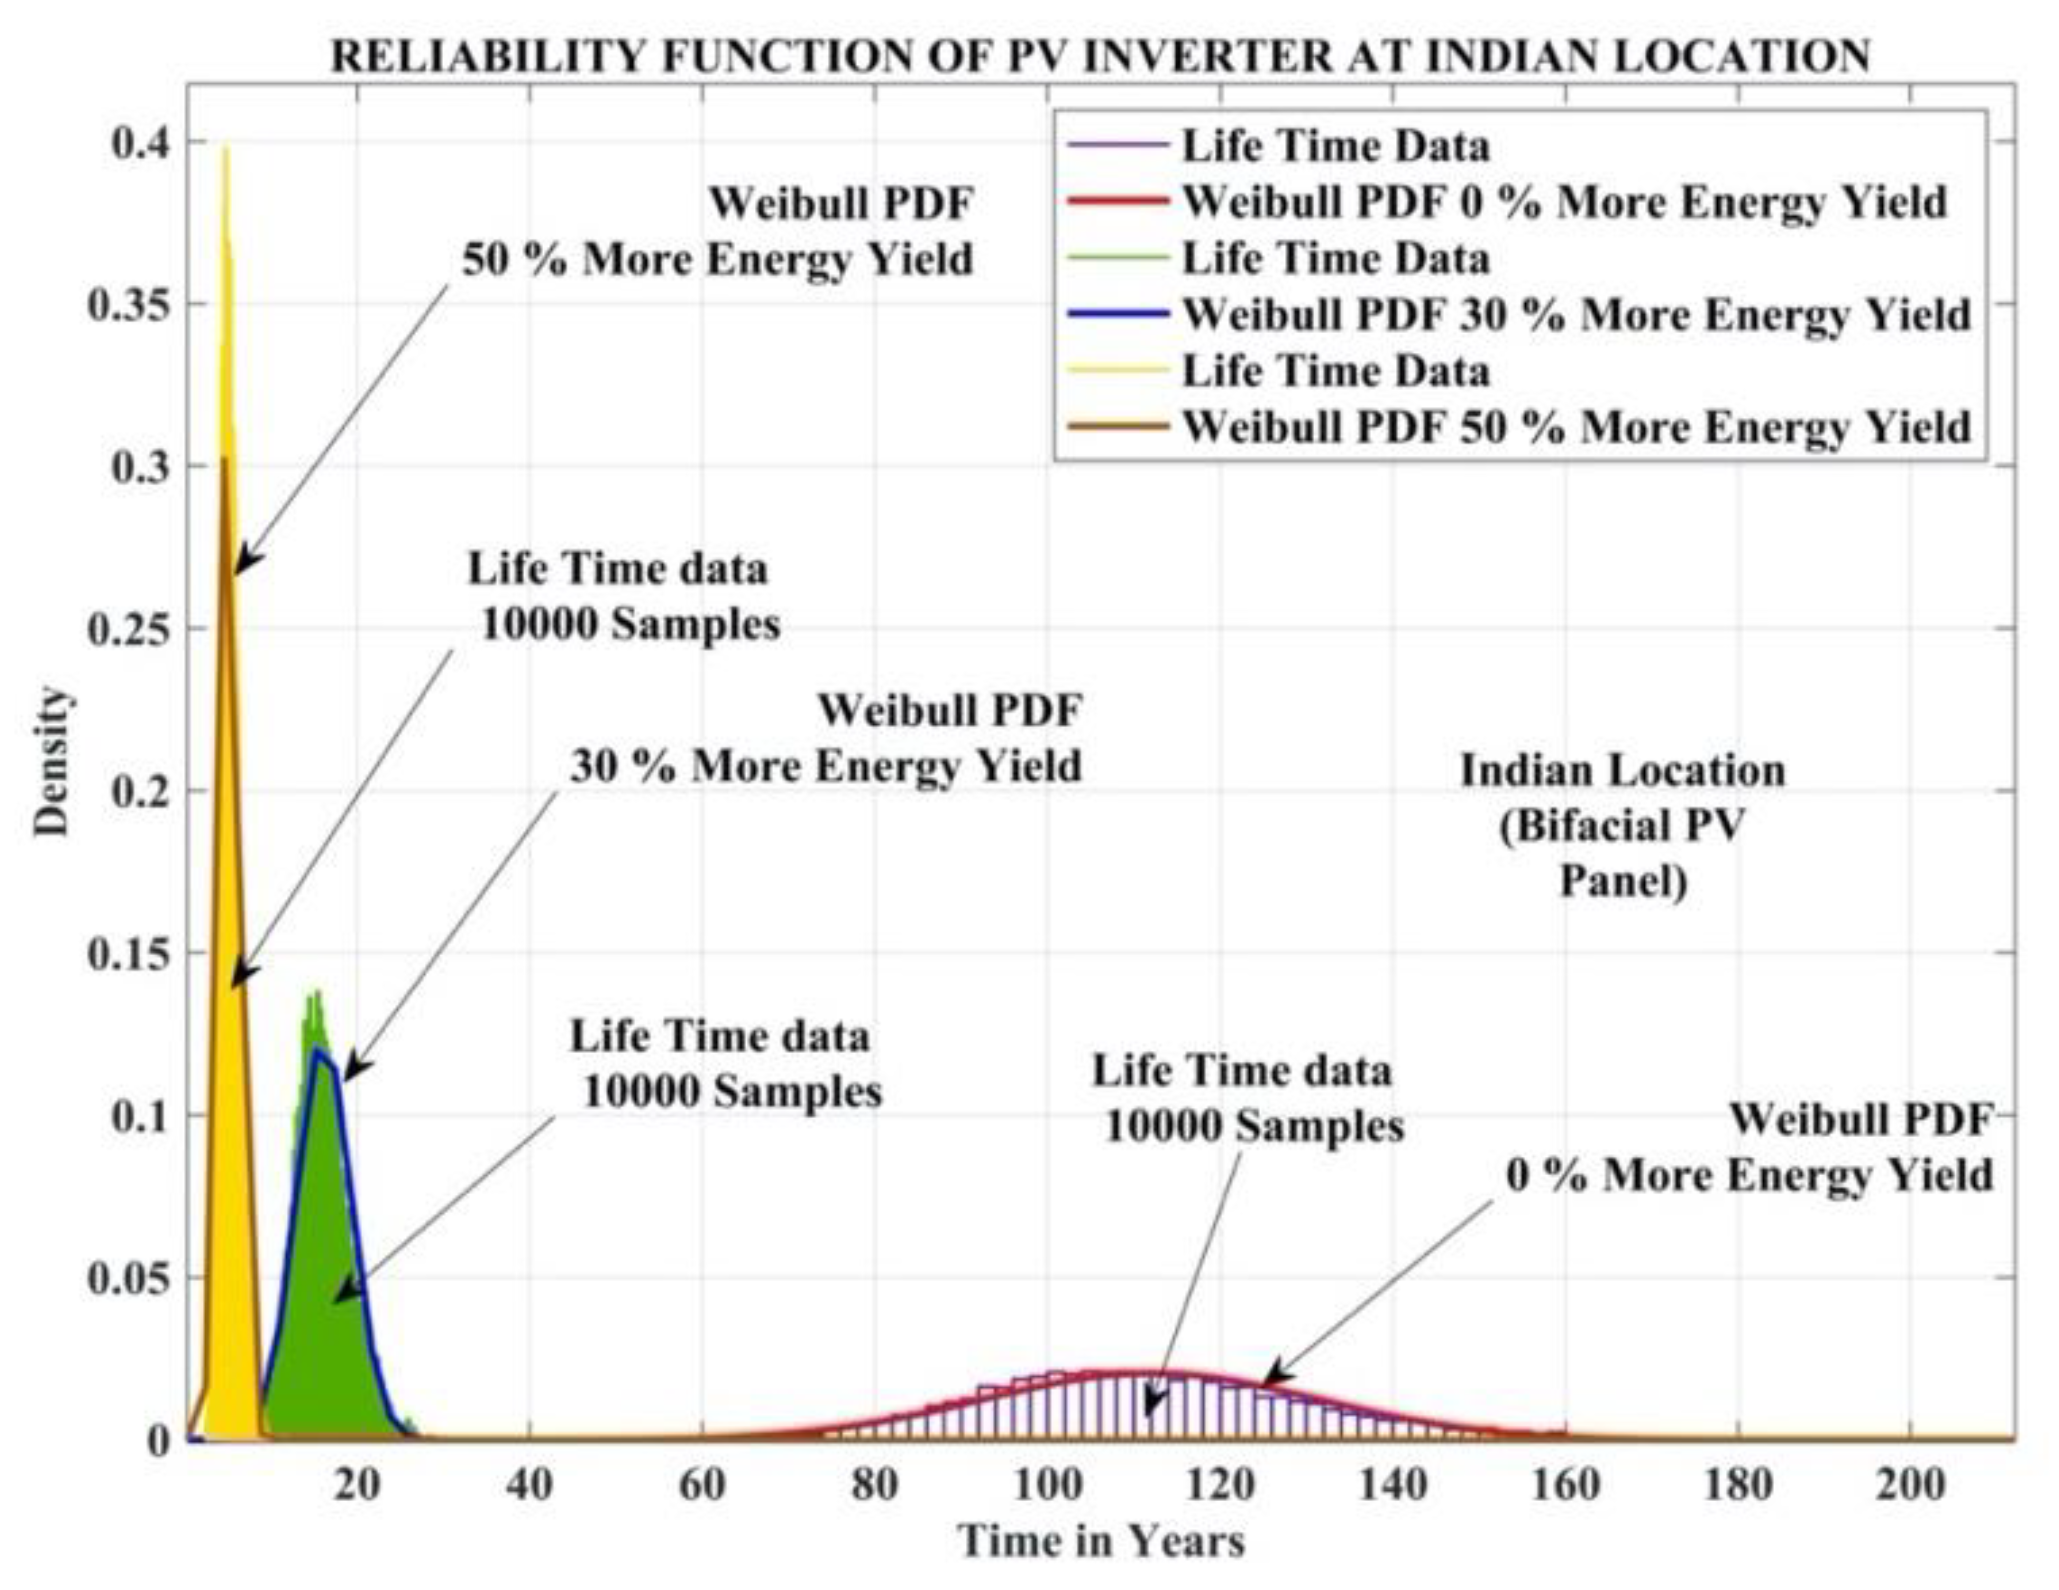
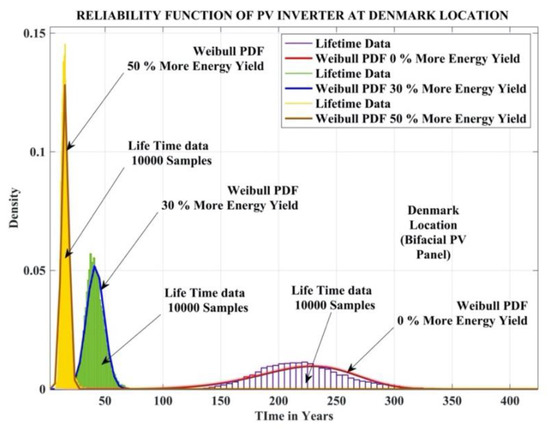
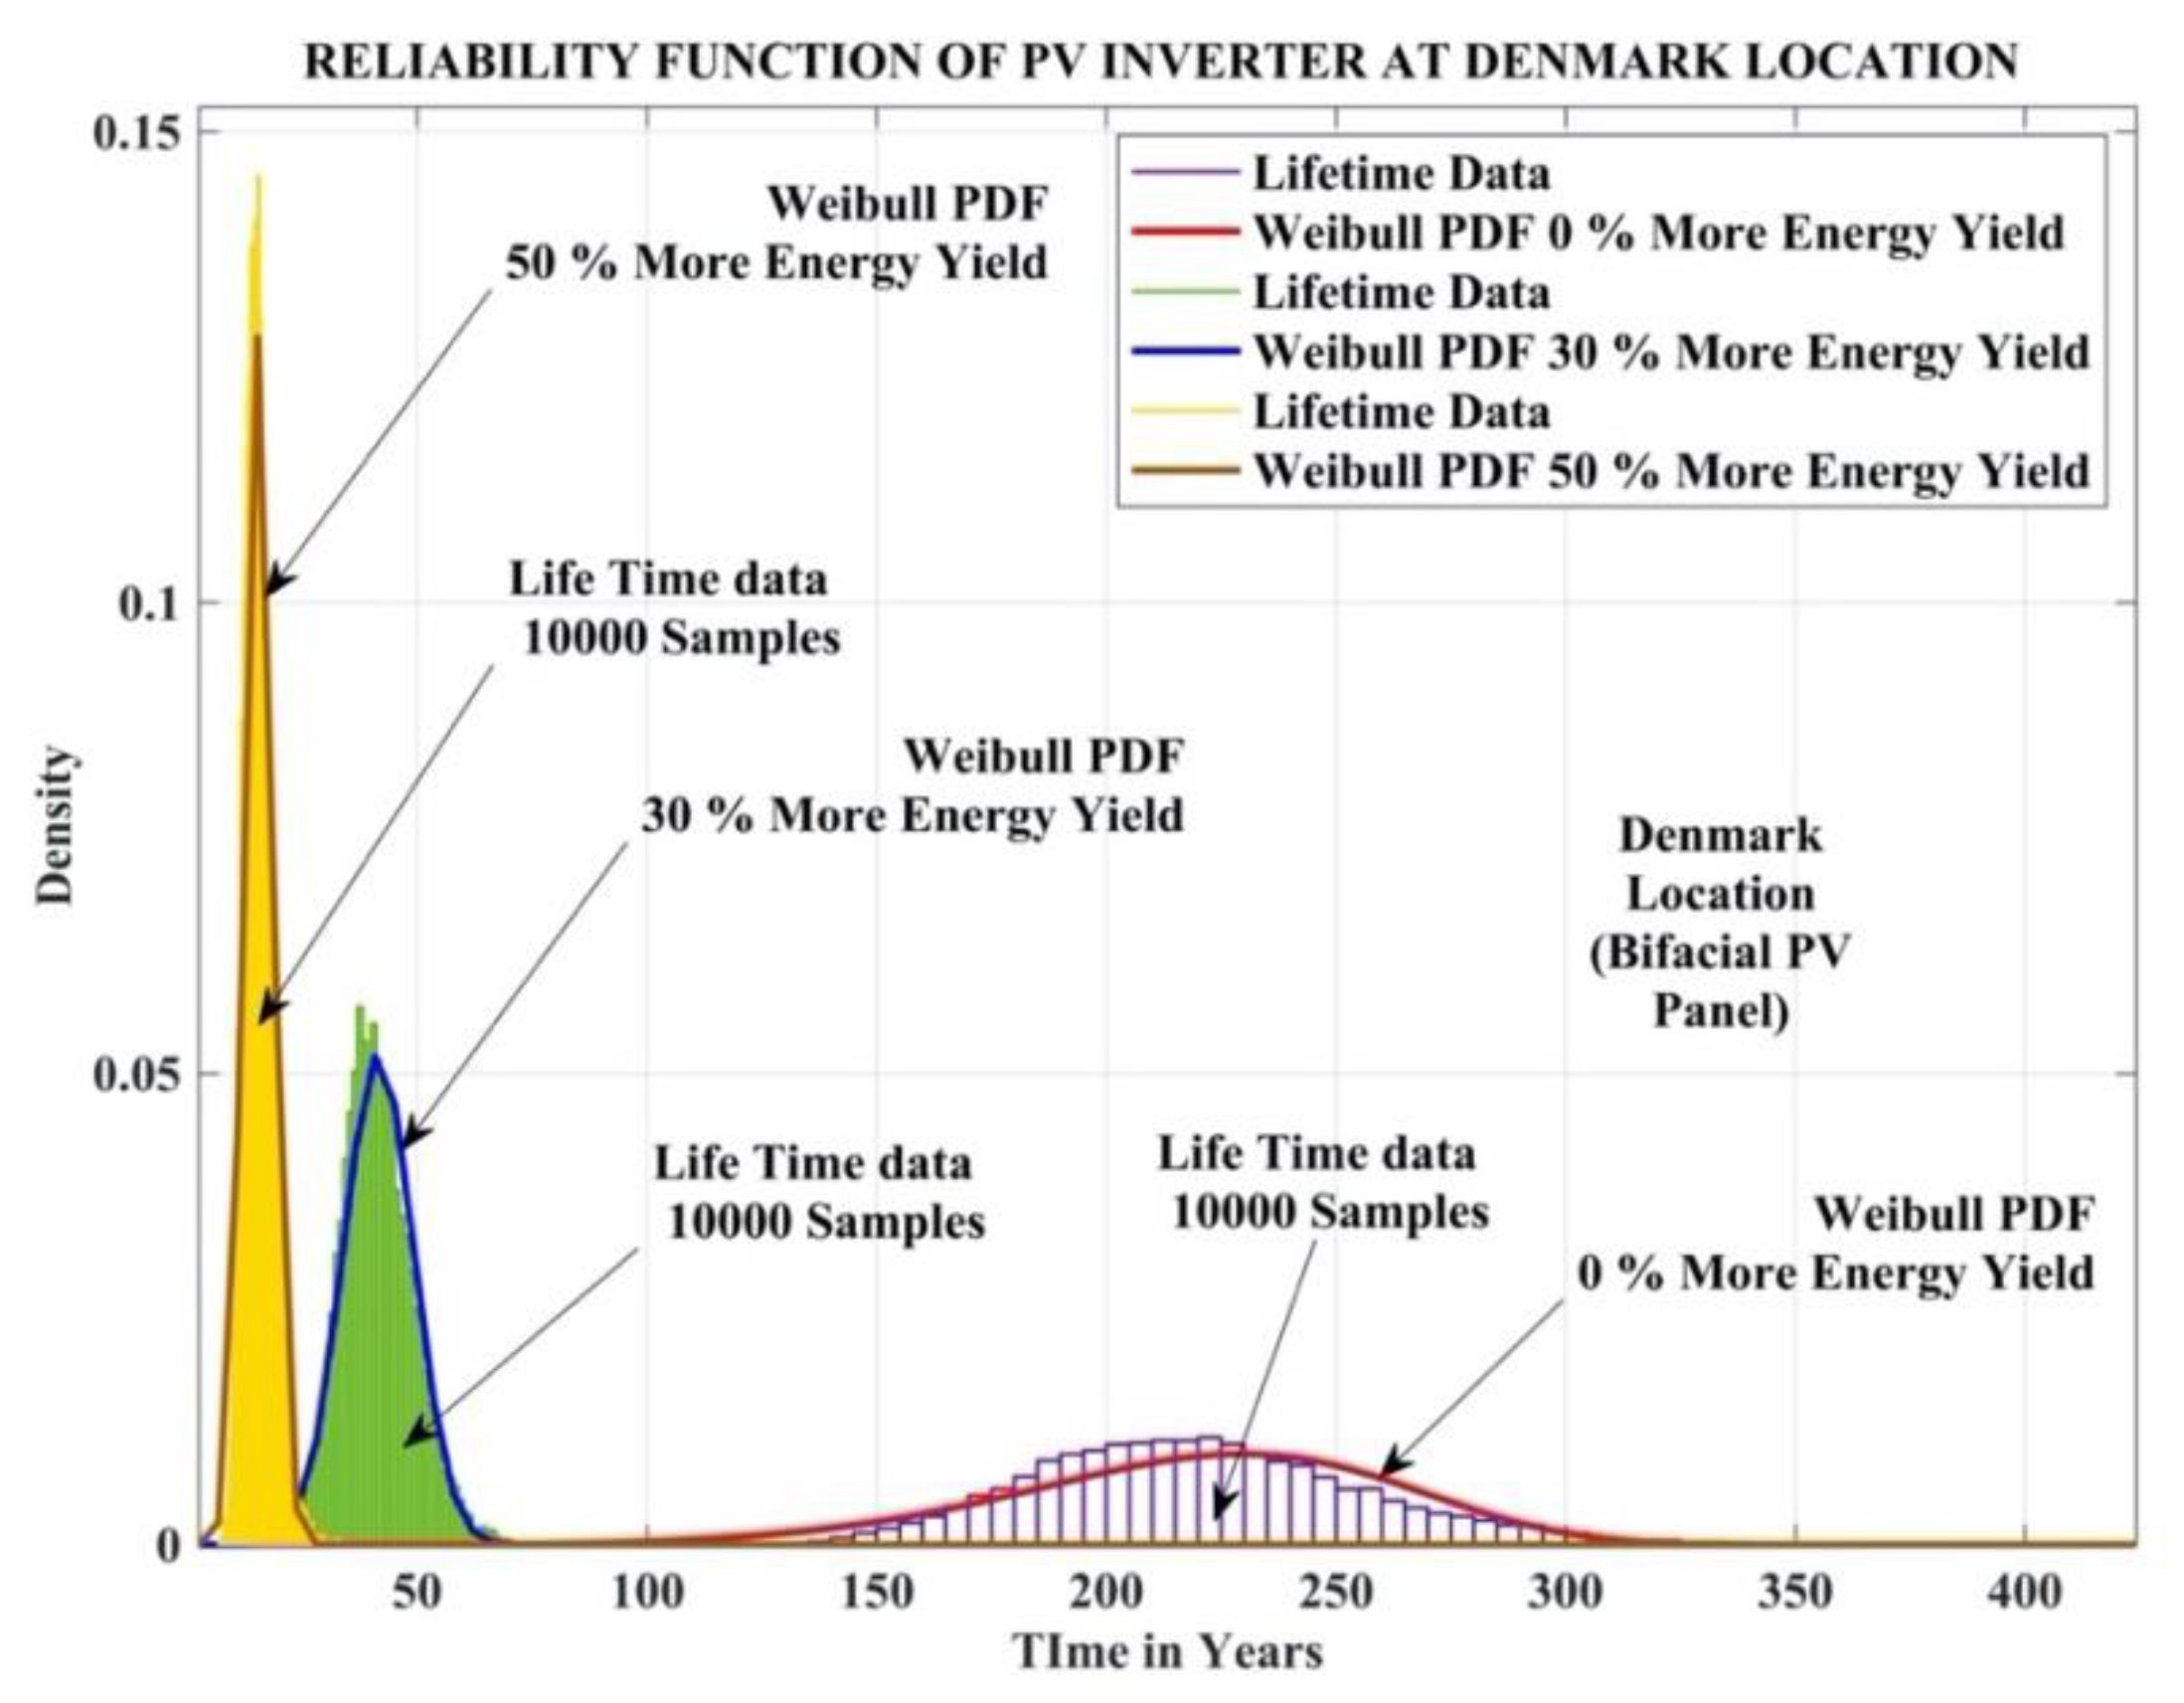
With the Monte Carlo simulation, 10,000 samples were generated with five percent variation in all the parameters in Equation (5). The lifetime distributions of the PV inverter at the India and Denmark locations are shown in Figure 19 and Figure 20, respectively.
Figure 19.
Lifetime distribution of the PV inverter at the location in India.
Figure 20.
Lifetime distribution of the PV inverter at the location in Denmark.
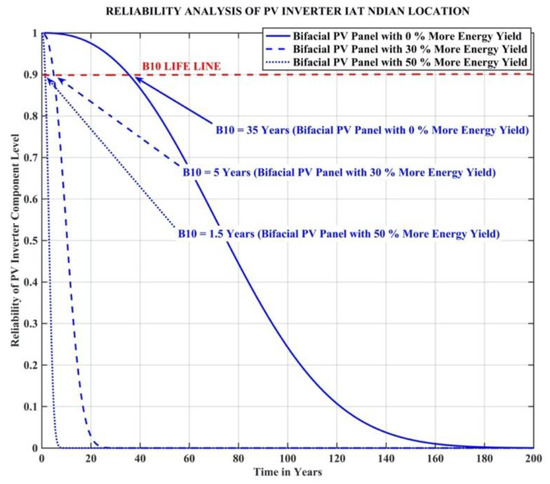
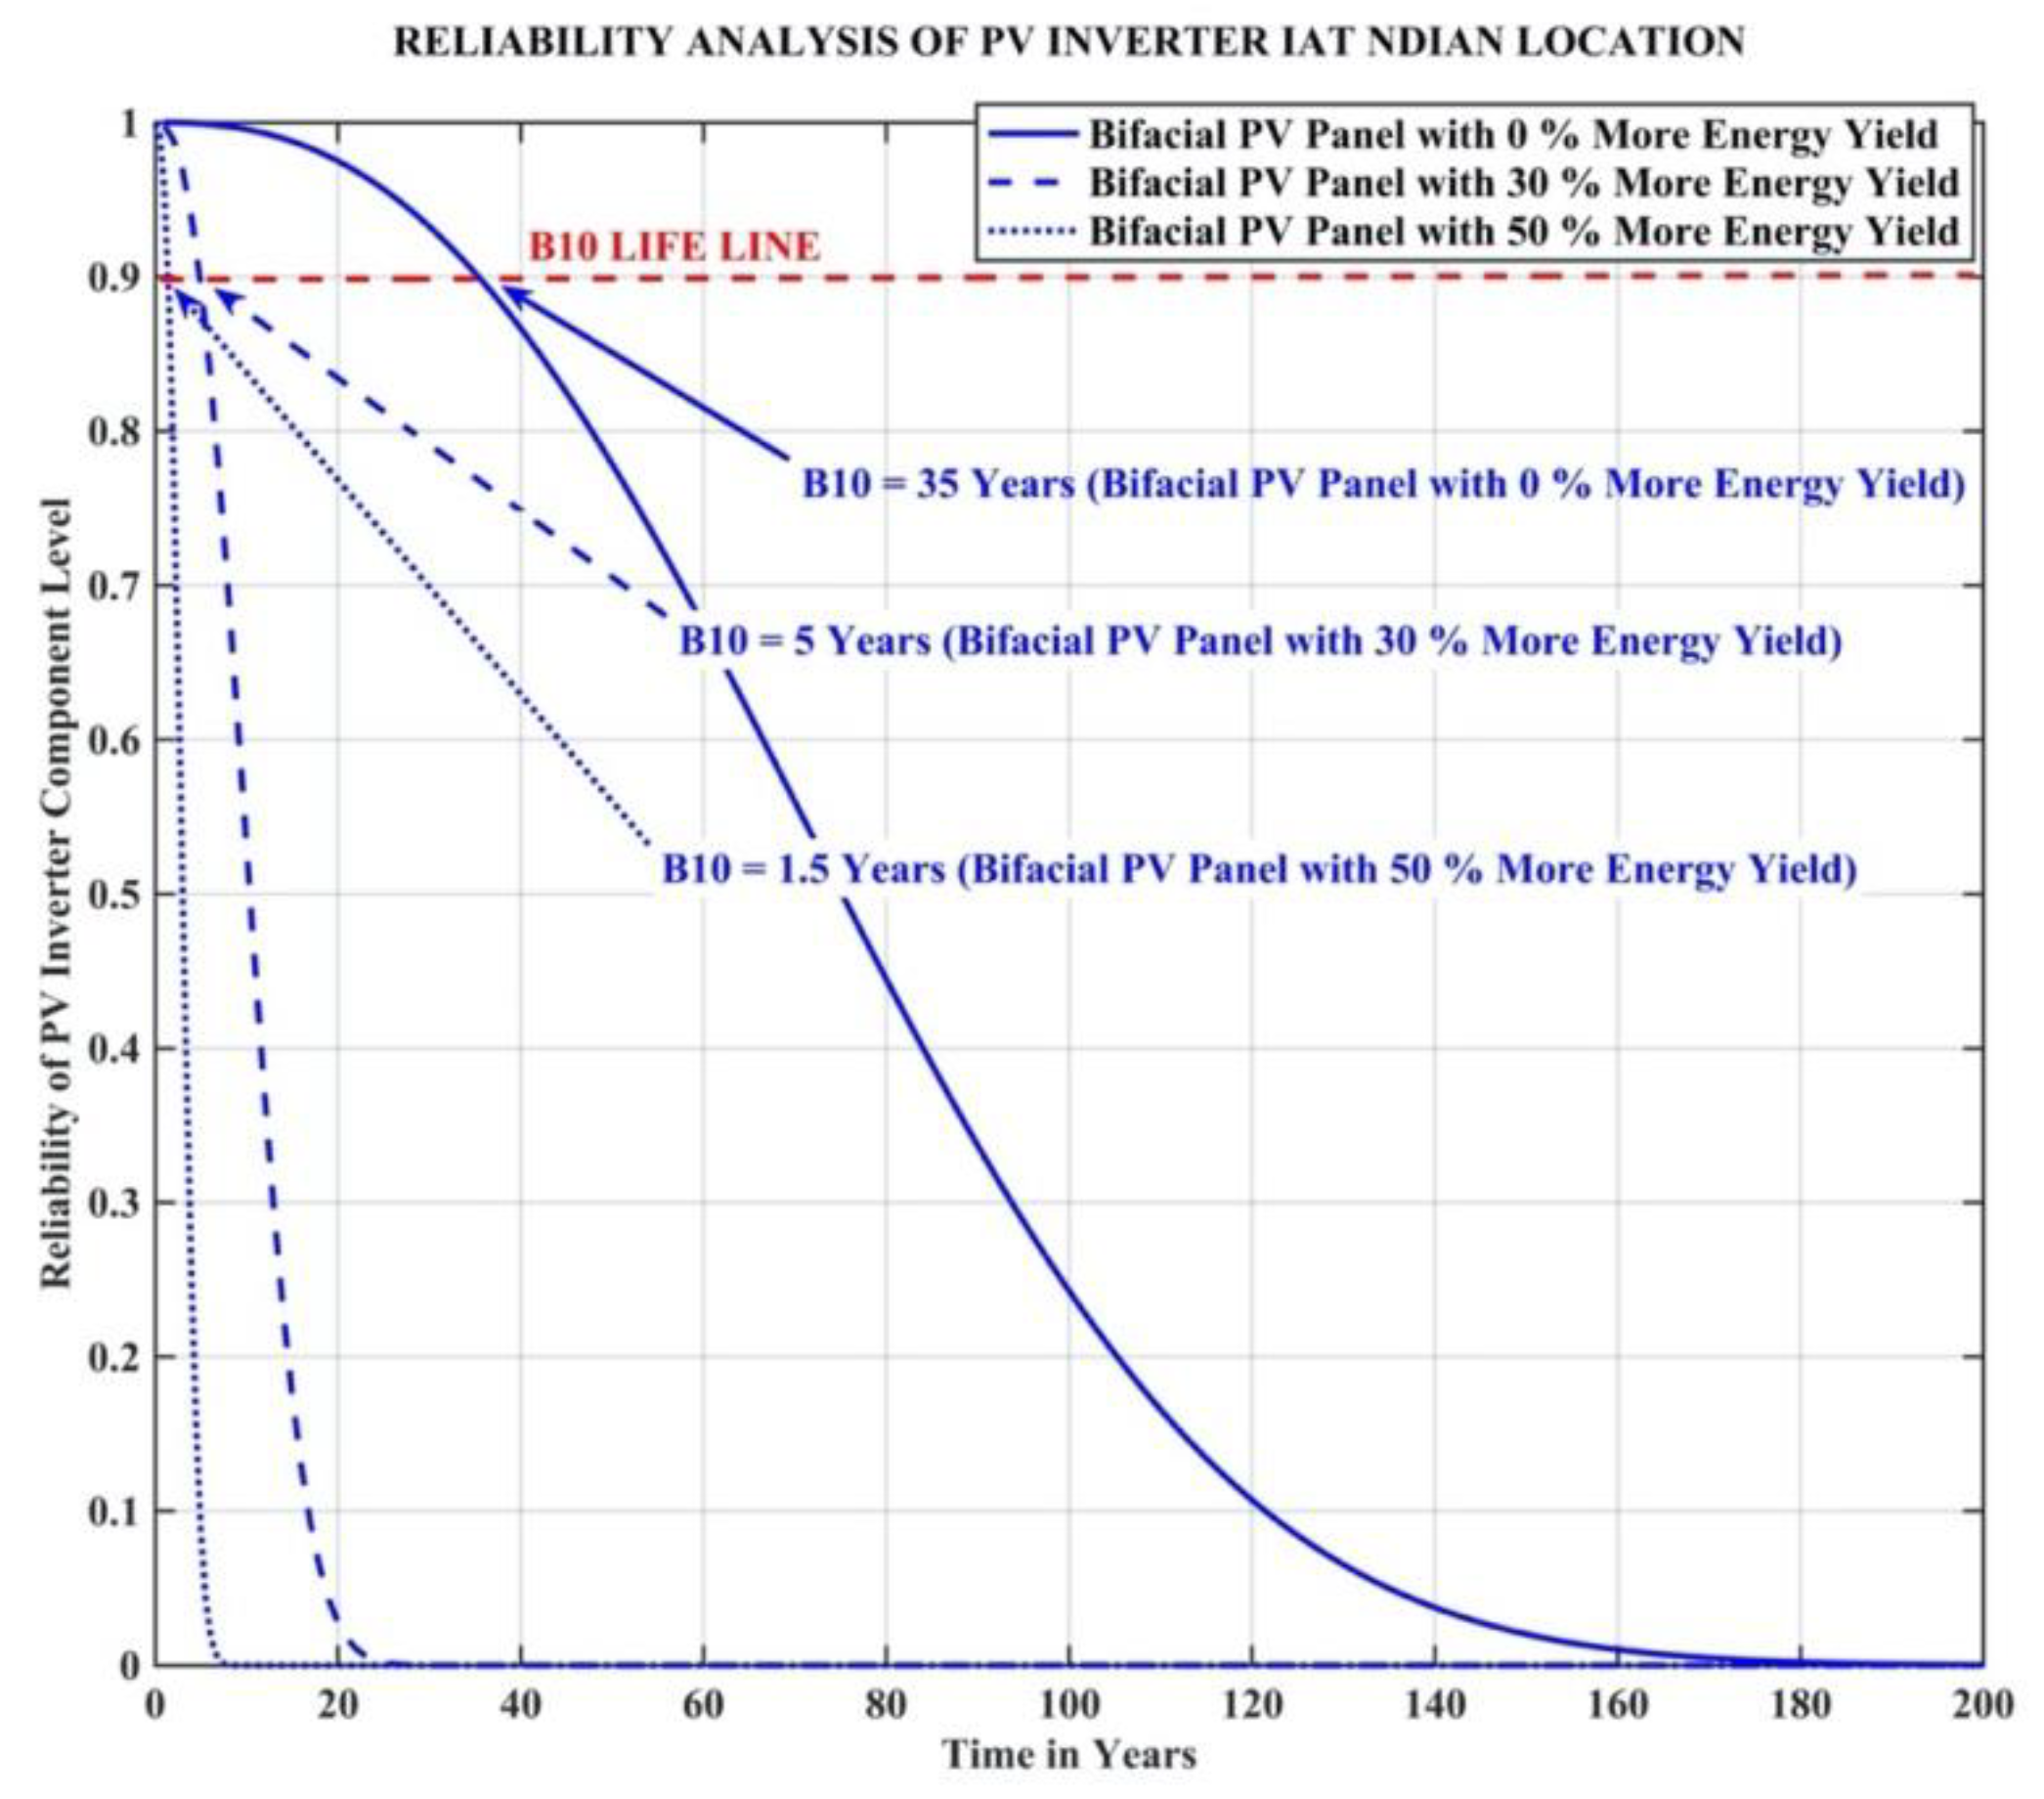
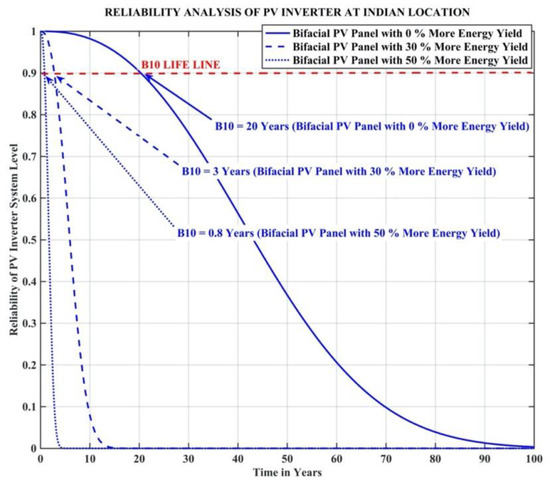
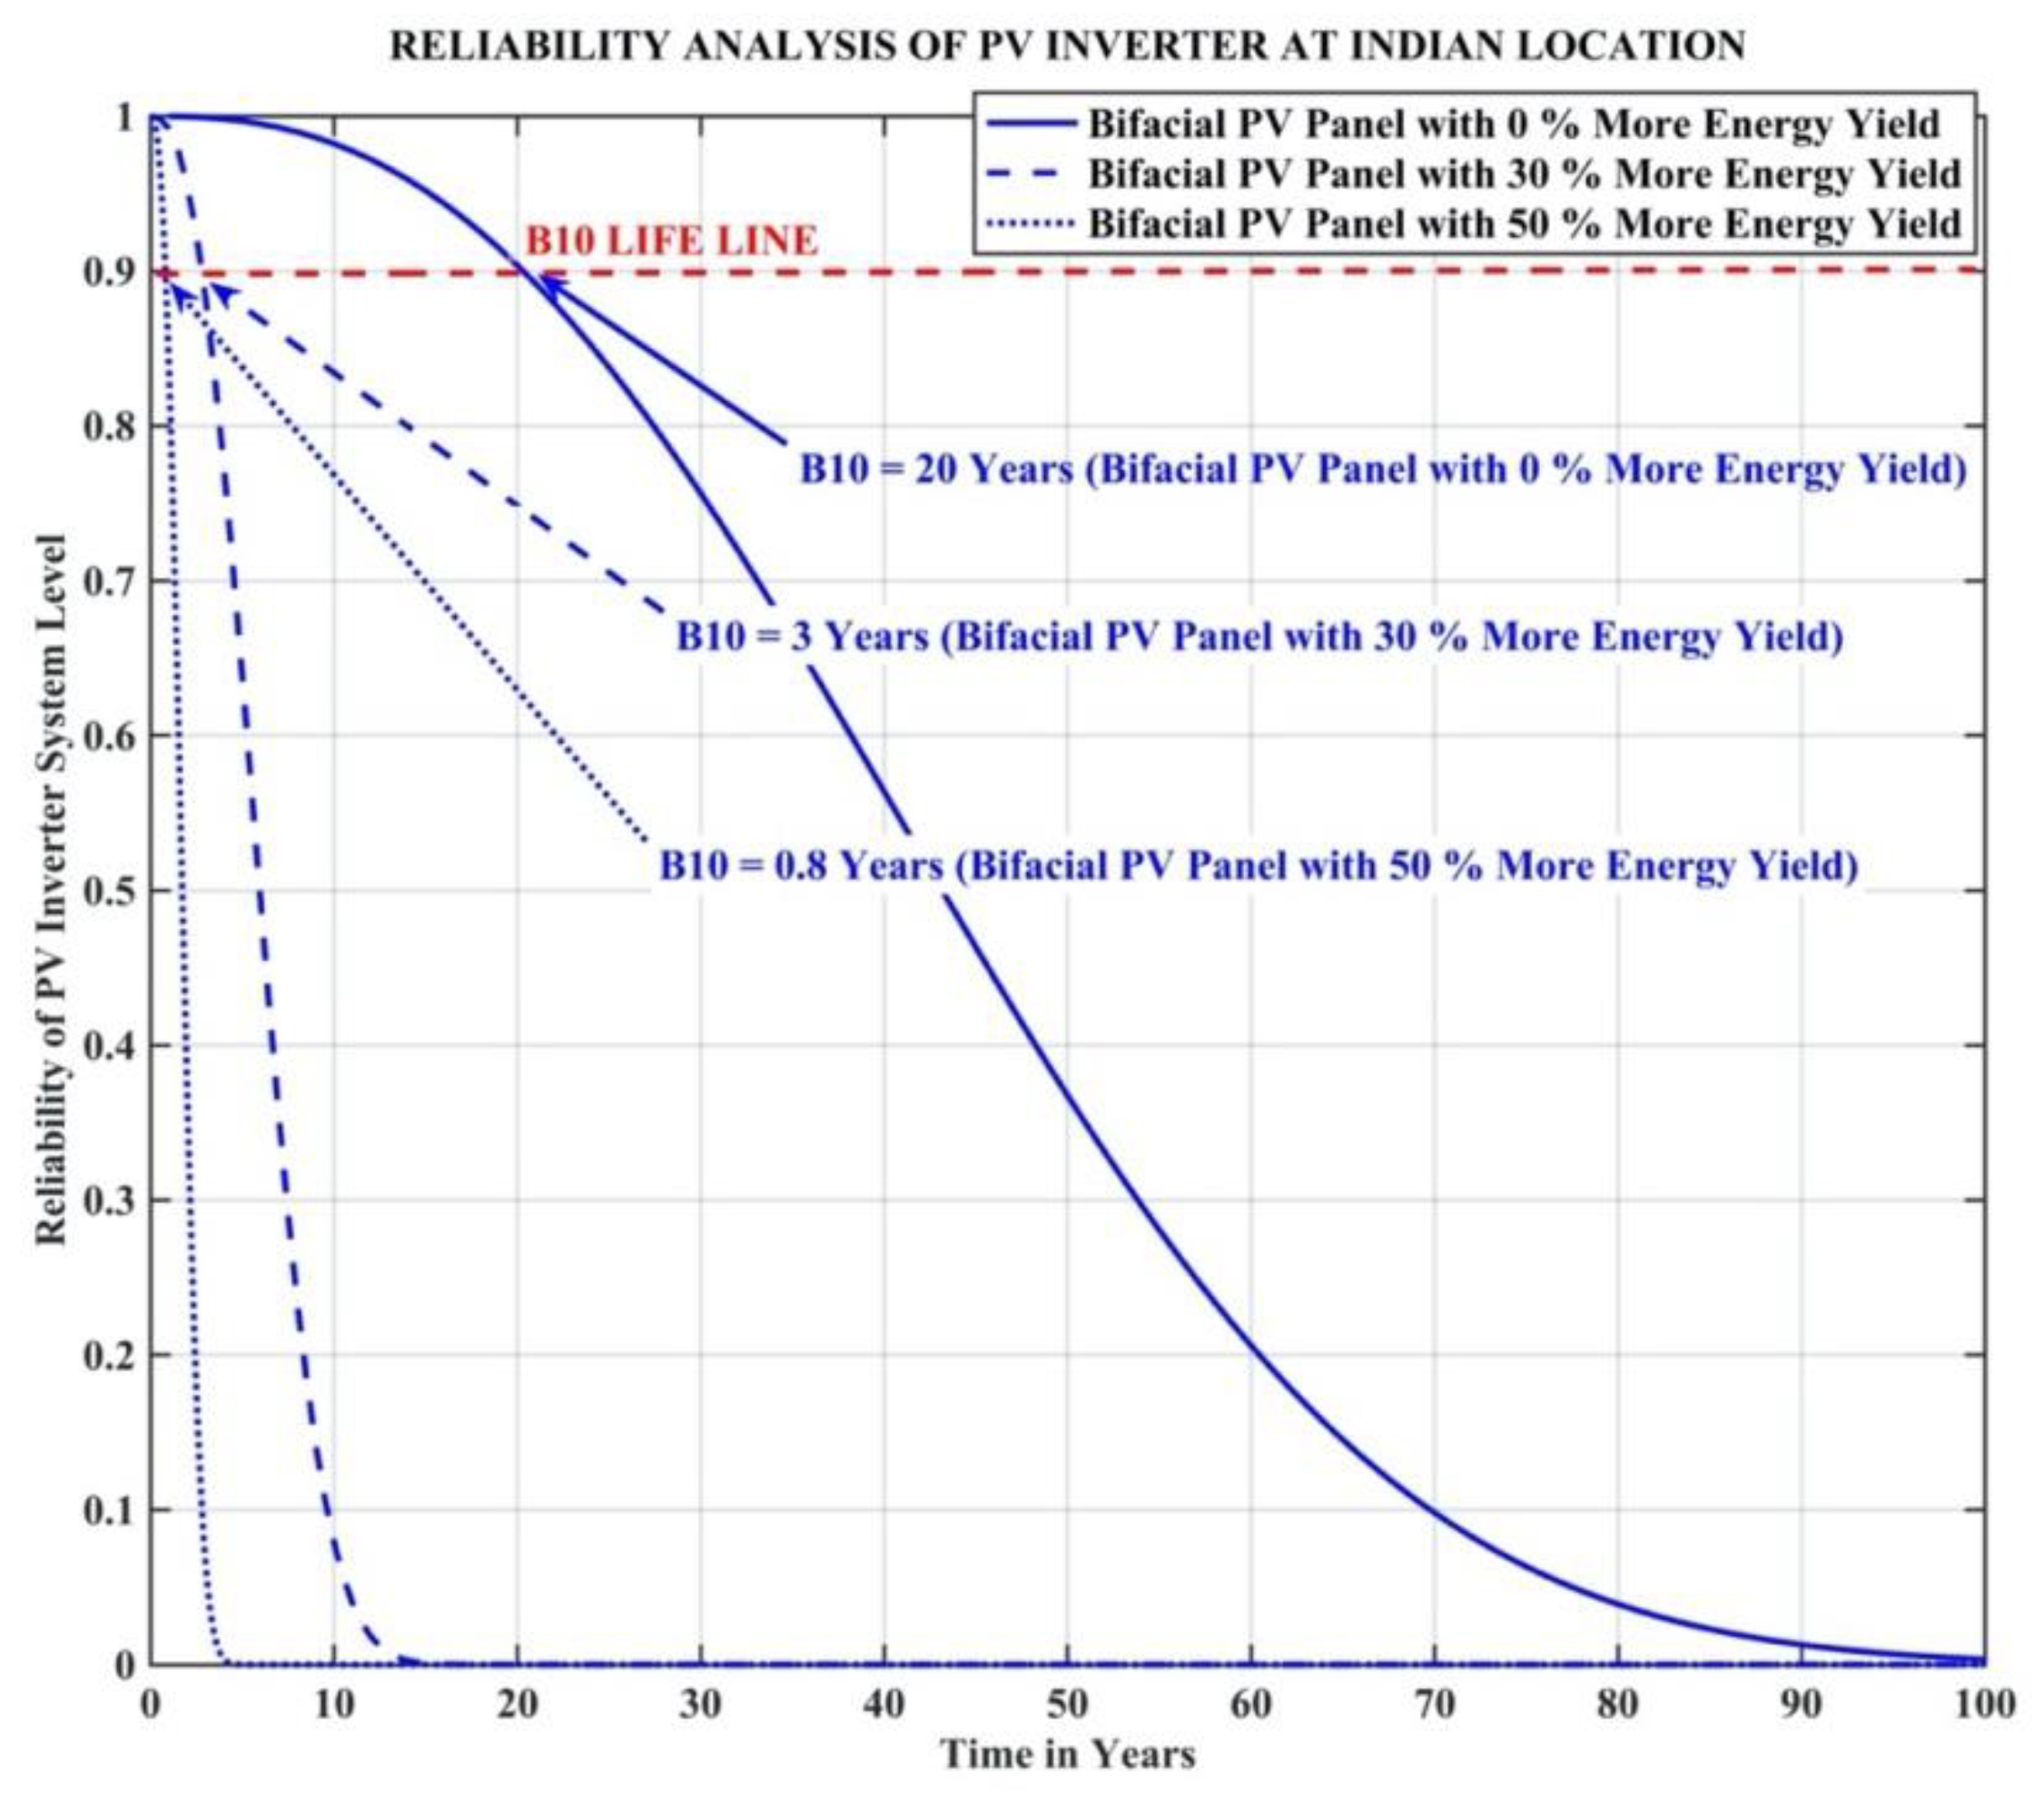
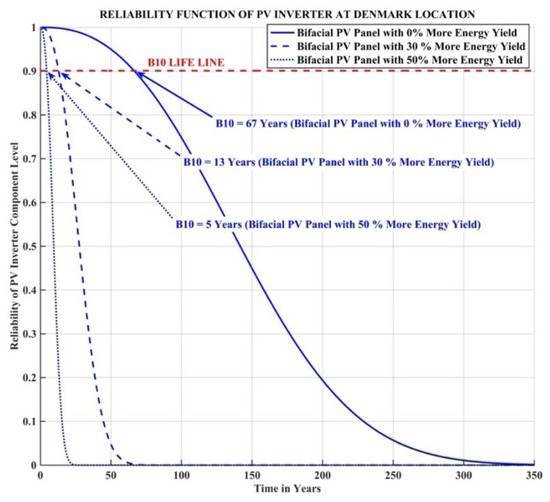
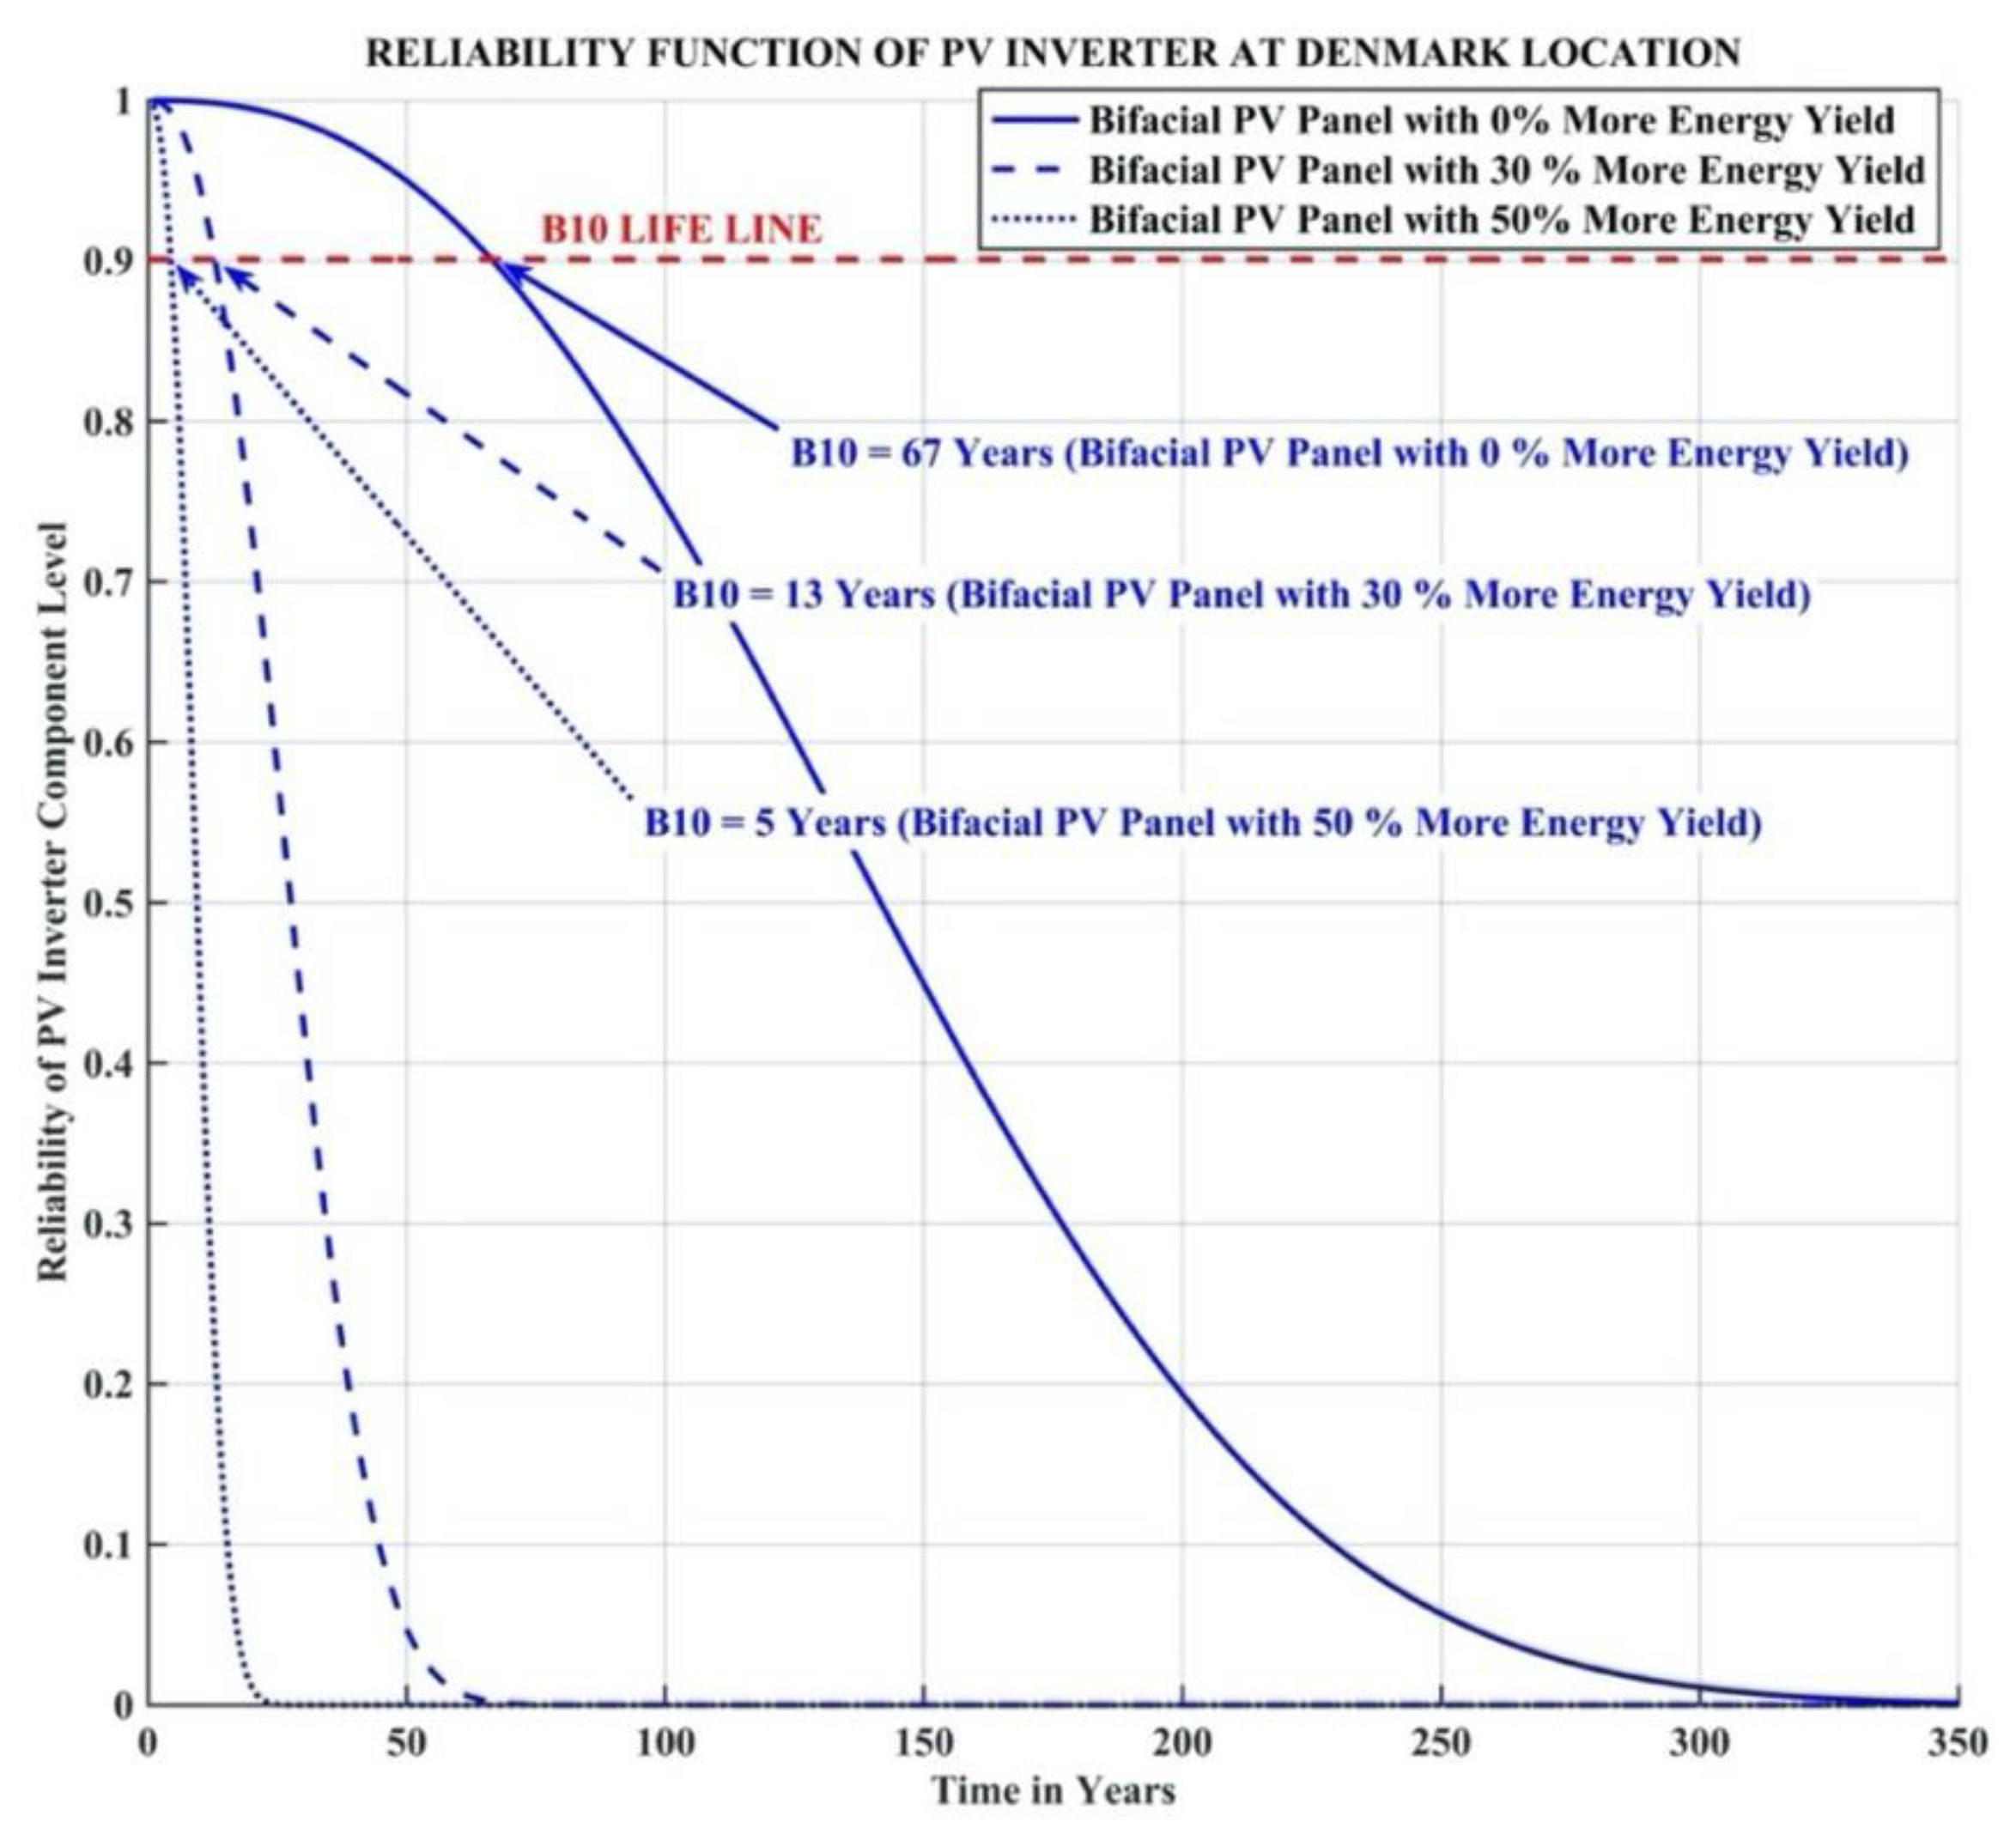
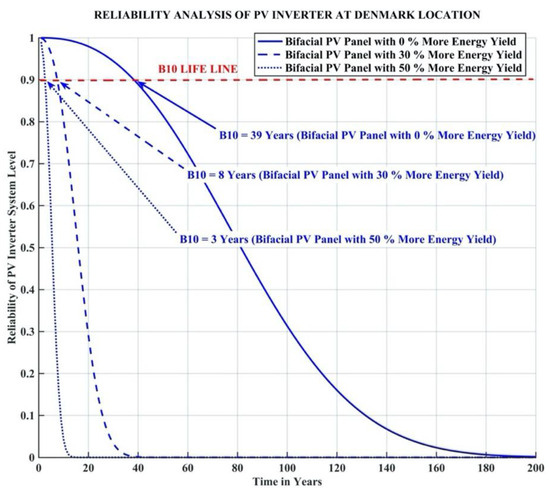
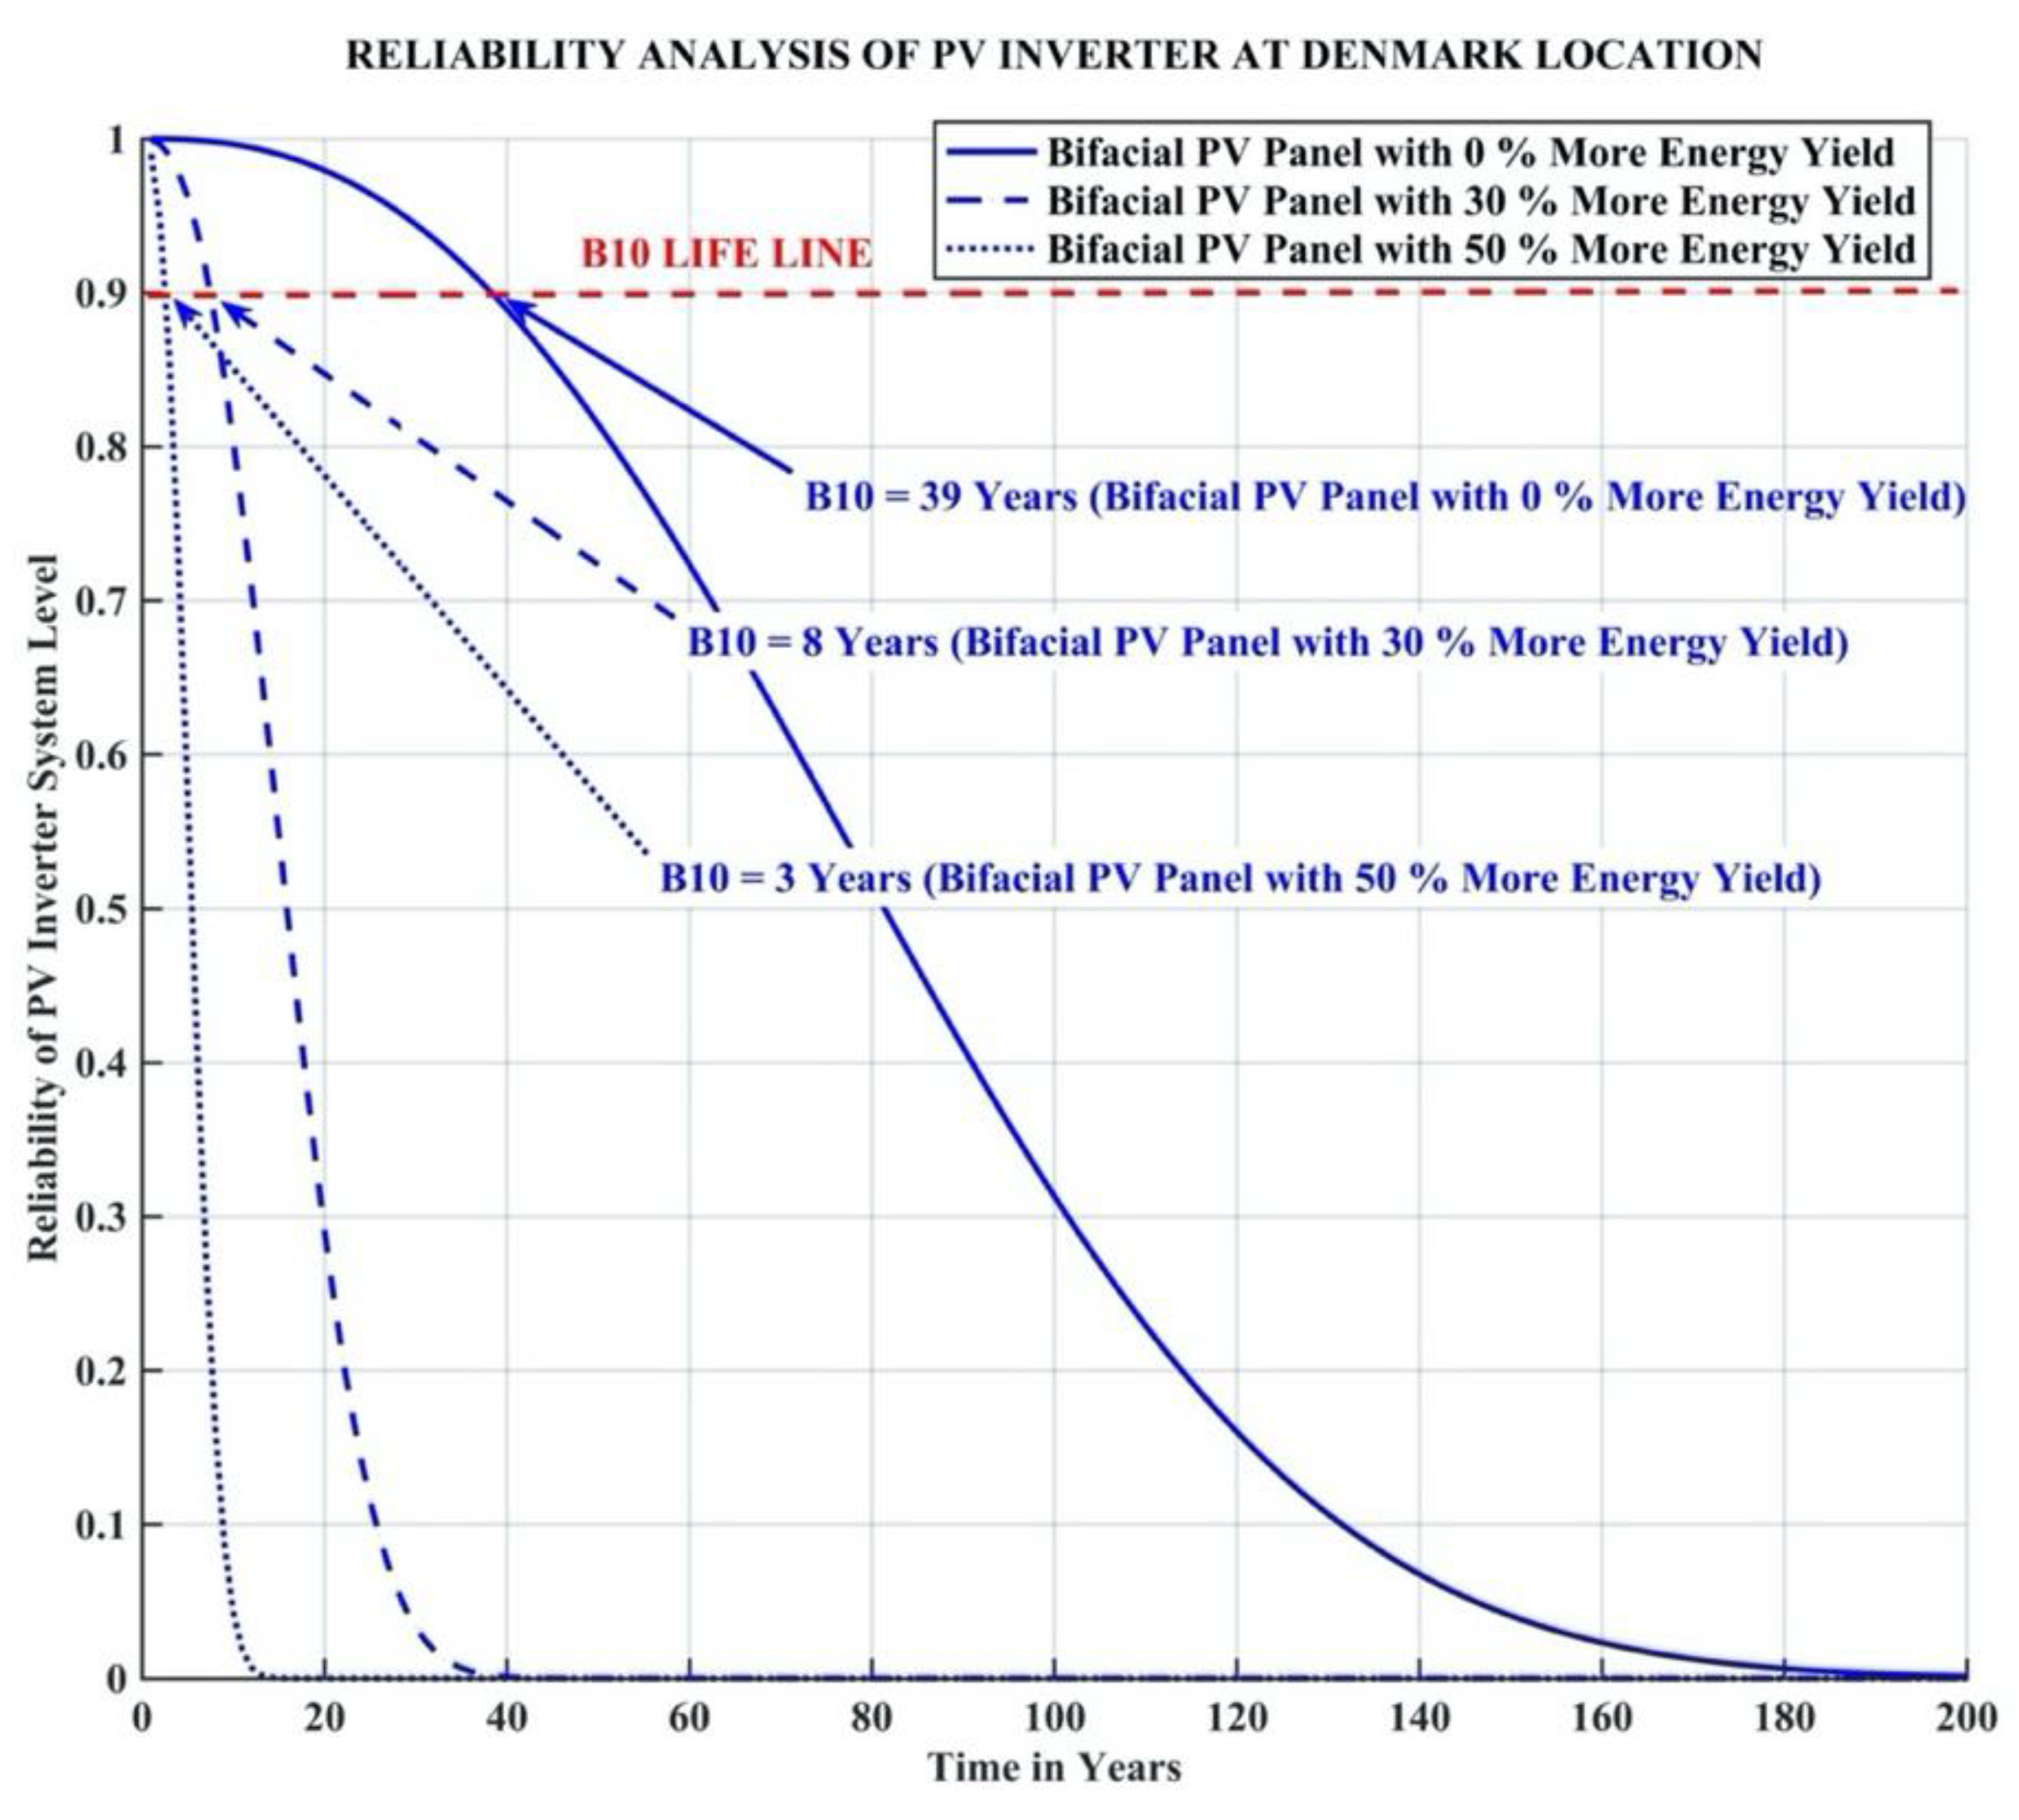
The reliability function R(t) was taken as a two-parameter Weibull distribution. Component- and system-level reliability were calculated using Equations (8) and 9, respectively. Component-level and system-level reliability functions R(t) at the India location are shown in Figure 21 and Figure 22, respectively. Similarly, component-level and system-level reliability functions R(t) at the Denmark location are shown in Figure 23 and Figure 24, respectively. The reliability functions’ densities increased with the increase in bifacial PV panel energy yield at both locations.
Figure 21.
Reliability function of the PV inverter at the location in India (Component Level).
Figure 22.
Reliability function of the PV inverter at the location in India (System Level).
Figure 23.
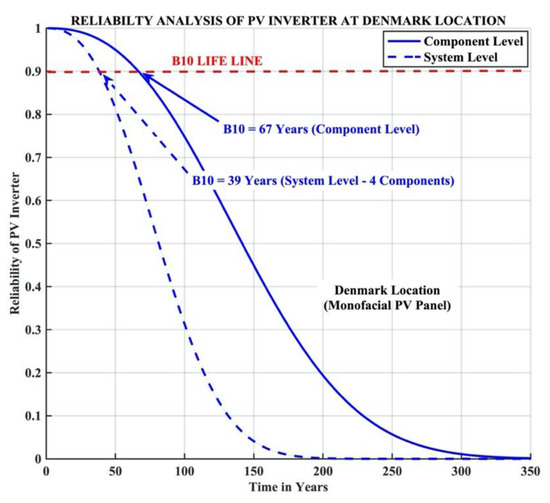
Reliability function of the PV inverter at the location in Denmark (Component Level).
Figure 24.
Reliability function of the PV inverter at the location in Denmark (System Level).
B10 lifetimes considering bifacial PV panels at both the India and Denmark locations are tabulated in Table 6.
Table 6.
B10 lifetimes of PV inverters considering bifacial PV panels.
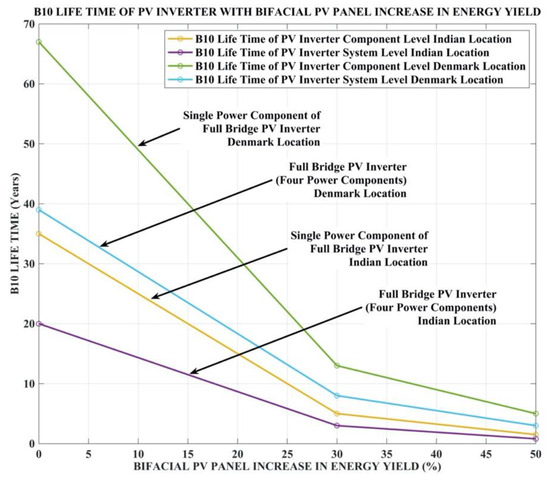
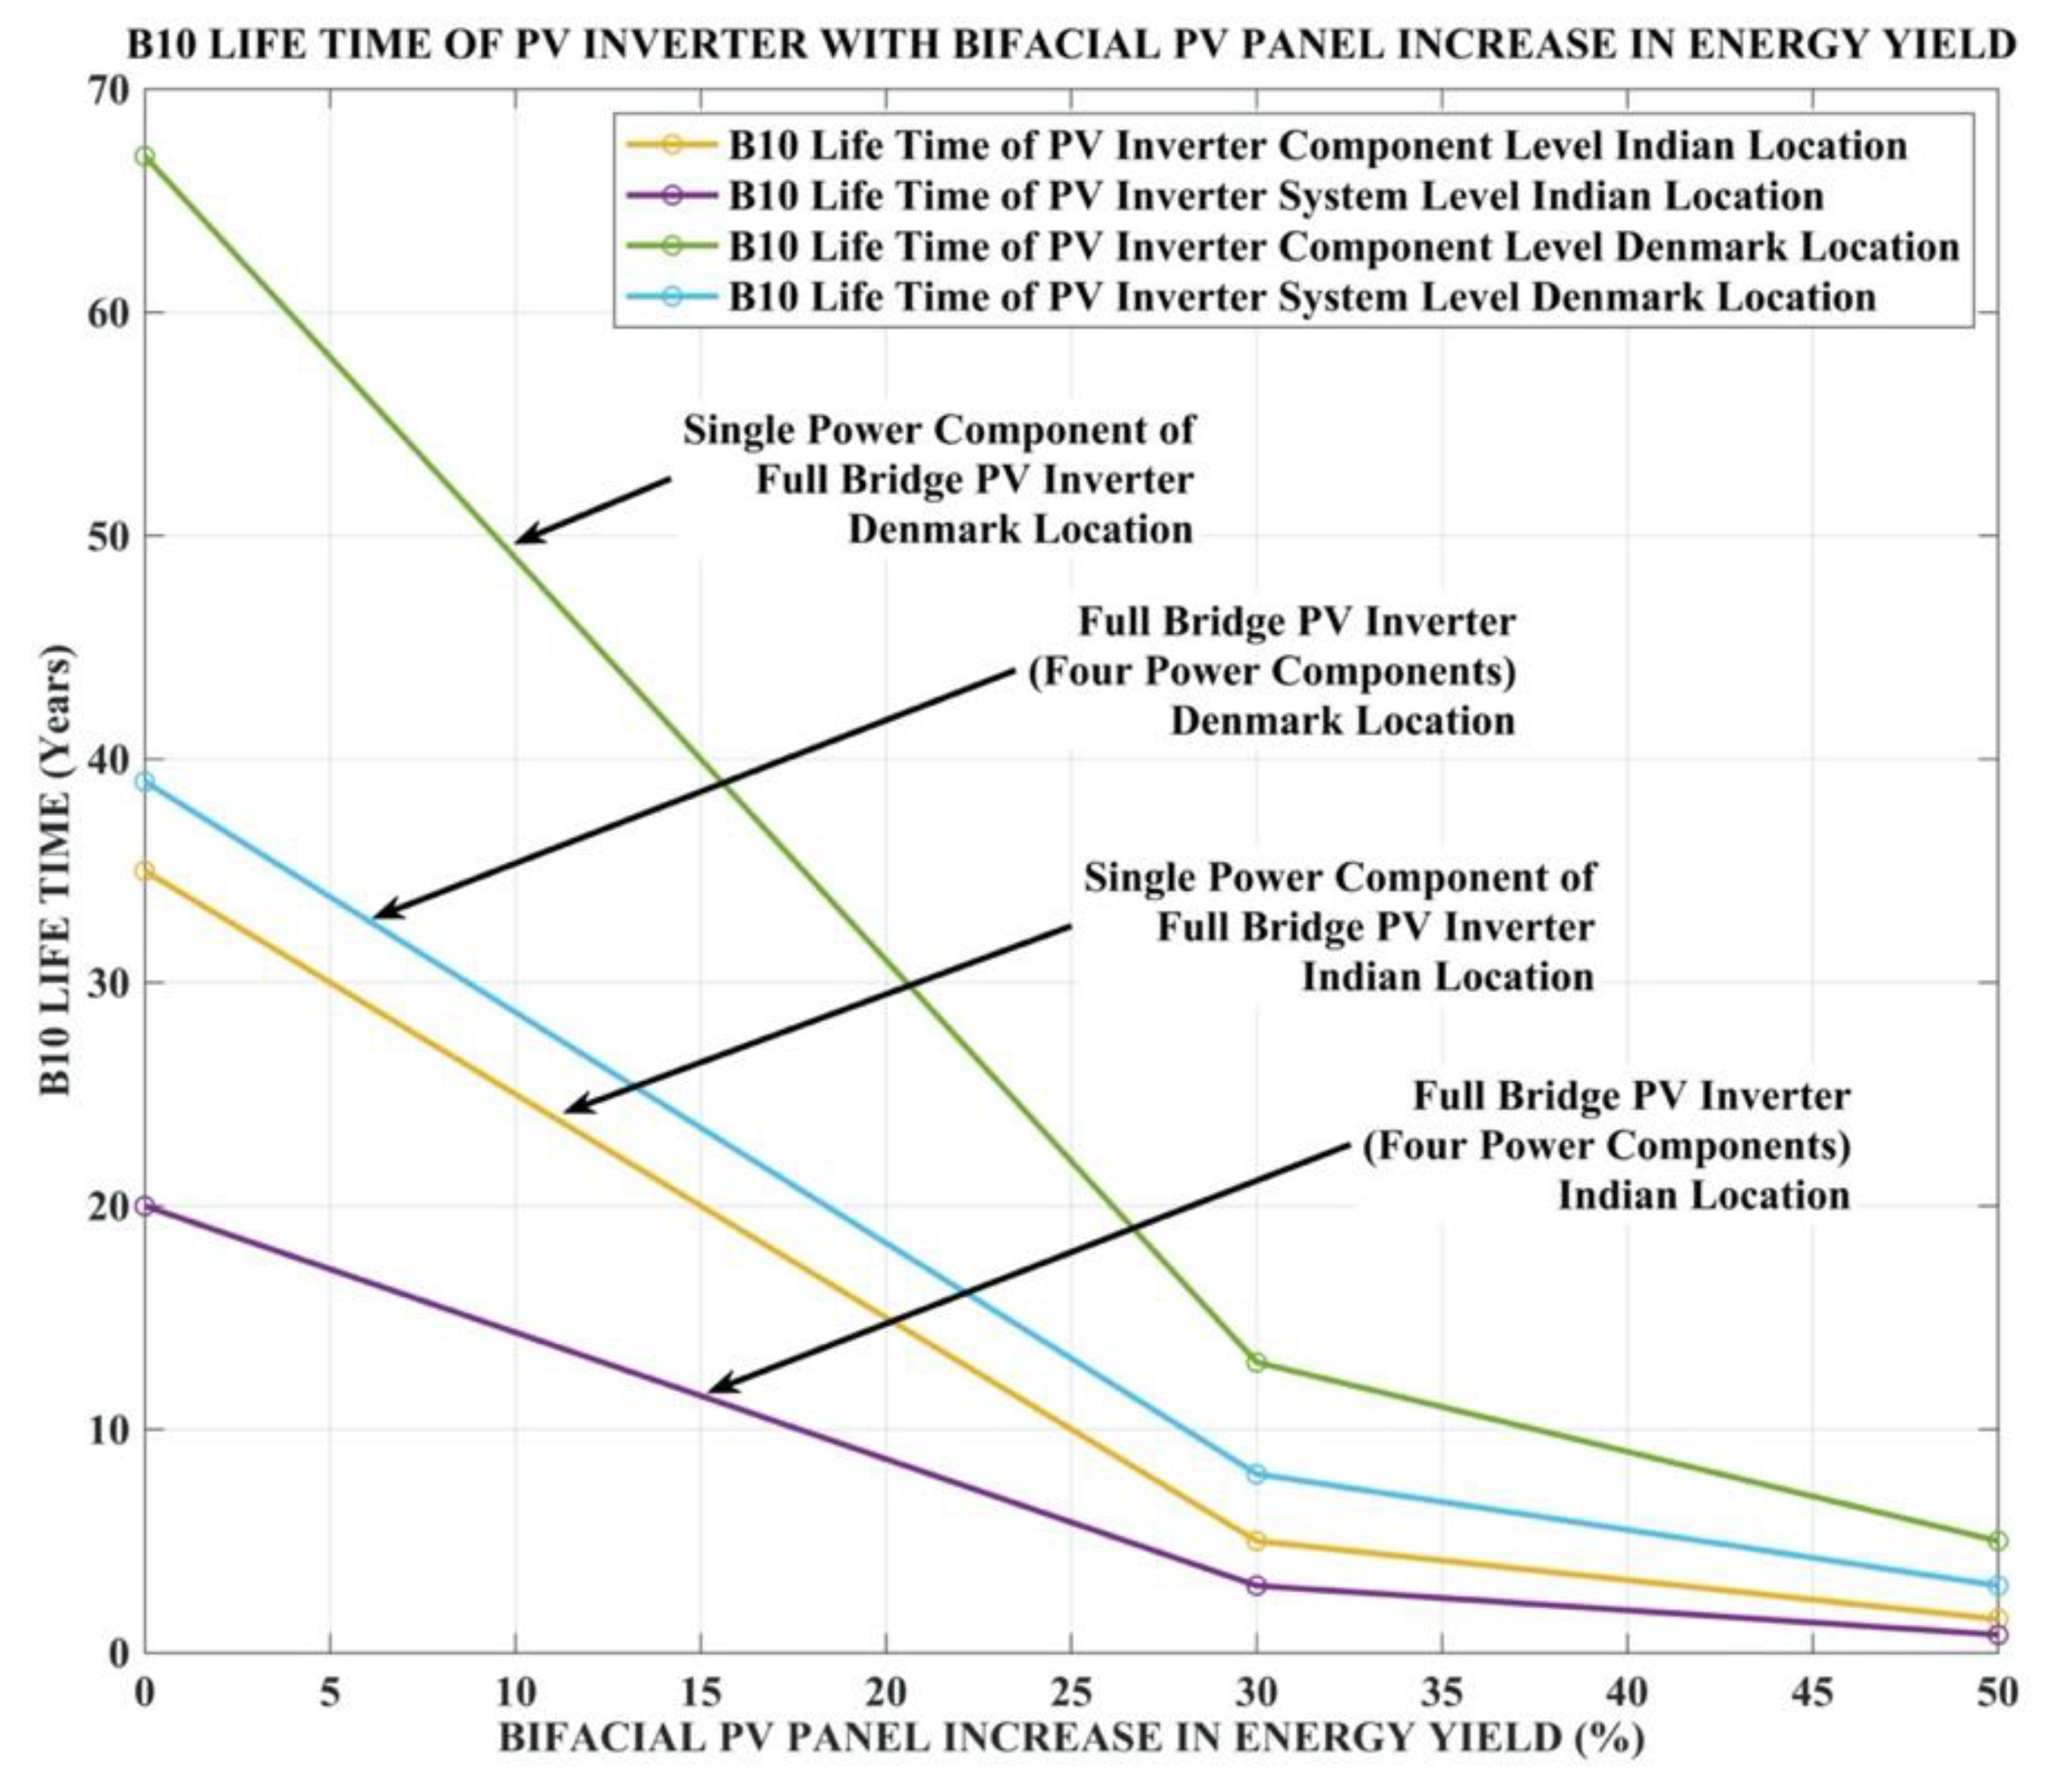
The B10 lifetime decreased significantly at both locations as bifacial PV panel energy yield increased. At the India location, B10 lifetime decreased by 0.8 years (system level). Similarly, at the Denmark location B10 lifetime decreased by 3 years (system level). A detailed comparison of B10 lifetimes and bifacial PV panel percentage increases in energy yield is shown in Figure 25.
Figure 25.
B10 lifetime vs. bifacial PV panel percentage increase in energy yield.
From the above, it is clearly shown that B10 lifetime decreased with increases in bifacial PV panel energy yield. At a 30% increase in energy yield, B10 lifetime decreased significantly at both locations. Hence, it is not preferable to use bifacial PV panels with more than 30% additional energy yield. The reliability of the PV inverter with bifacial PV panels exhibited the best performance in Denmark rather than in India. Hence, such panels are best suited for relatively cold locations and with additional energy yield not exceeding 30%.
4. Conclusions
This paper investigated the impact of bifacial PV panels on PV inverter reliability, considering two different geographical locations. This paper analyzed the reliability performance of critical components in the PV inverter, i.e., IGBT power semiconductor switches, at both the component level and the system level. Mission profile-based reliability analysis was carried out at locations in India (relatively hot) and Denmark (relatively cold). The B10 lifetimes of PV inverters at the Denmark location were higher when compared with those at the India location. Due to the low average temperature recorded at the Denmark location, the thermal loading on the PV inverter decreased, leading to high reliability. However, the power generation would be low compared with that at the India location. Both monofacial and bifacial PV panel impacts were considered for reliability analysis. Reliability analysis showed that B10 lifetime at both locations decreased significantly when bifacial PV panel energy yield increased. This paper concludes that bifacial PV panels are best suited for a relatively cold location with additional energy yield not exceeding 30%.
Author Contributions
Conceptualization, S.S.K., J.D., S.M., R.T. and N.K.S.; methodology, M.B., A.U.R., M.S. and J.-G.C.; software, S.S.K., J.D., S.M., R.T. and N.K.S.; validation, M.B., A.U.R., M.S. and J.-G.C.; formal analysis, S.S.K., J.D., S.M., R.T. and N.K.S.; investigation, M.B., A.U.R., M.S. and J.-G.C.; resources, S.S.K., J.D., S.M., R.T. and N.K.S.; data curation, M.B., A.U.R., M.S. and J.-G.C.; writing—original draft preparation, S.S.K., J.D., S.M. and N.K.S.; writing—review and editing, M.B., A.U.R., M.S. and J.-G.C.; visualization, S.S.K.; supervision, M.B., A.U.R., M.S. and J.-G.C.; project administration, R.T., S.M., A.U.R. and M.S.; funding acquisition, J.-G.C. All authors have read and agreed to the published version of the manuscript.
Funding
This work was supported by the Basic Science Research Program through the National Research Foundation (NRF) of Korea funded by the Ministry of Education under Grant 2018R1D1A1B07048948.
Institutional Review Board Statement
Not applicable.
Informed Consent Statement
Not applicable.
Conflicts of Interest
The authors declare no conflict of interest.
References
- ETEnergyWorld. Solar Power Cost Will Fall to Rs 1.9 Per Unit in India by 2030: TERI Study; India TImes: New Delhi, India, 2019. [Google Scholar]
- Woodhouse, M.; Jones-Albertus, R.; Feldman, D.; Fu, R.; Horowitz, K.; Chung, D.; Jordan, D.; Kurtz, S. On the Path to SunShot: The Role of Advancements in Solar Photovoltaic Efficiency, Reliability, and Costs; National Renewable Energy Laboratory (NREL): Golden, CO, USA, 2016. [Google Scholar]
- Mackenzie, W. Global Bifacial Module Market Report 2019; Wood Mackenzie: Edinburgh, UK, 2019. [Google Scholar]
- Global Modelling and Assimilation Offfice. MERRA-2 Re-Analysis; Global Modelling and Assimilation Offfice: Washington, DC, USA, 2018. [Google Scholar]
- Yang, S.; Bryant, A.; Mawby, P.; Xiang, D.; Ran, L.; Tavner, P. An industry-based survey of reliability in power electronic converters. IEEE Trans. Ind. Appl. 2011, 47, 1441–1451. [Google Scholar] [CrossRef] [Scilit]
- Wang, H.; Liserre, M.; Blaabjerg, F.; de Place Rimmen, P.; Jacobsen, J.B.; Kvisgaard, T.; Landkildehus, J. Transitioning to physics-of-failure as a reliability driver in power electronics. IEEE J. Emerg. Sel. Top. Power Electron. 2014, 2, 97–114. [Google Scholar] [CrossRef] [Scilit]
- Upadhyayula, K.; Dasgupta, A. Guidelines for physics-of-failure based accelerated stress testing. Proc. Annu. Reliab. Maintainab. Symp. 1998, 1, 345–357. [Google Scholar] [CrossRef] [Scilit]
- Reichelt, J.; Gromala, P.; Rzepka, S. Accelerating the temperature cycling tests of FBGA memory components with lead-free solder joints without changing the damage mechanism. In Proceedings of the 2009 European Microelectronics and Packaging Conference, EMPC 2009, Rimini, Italy, 15–18 June 2009. [Google Scholar]
- Norris, K.C.; Landzberg, A.H. Reliability of Controlled Collapse Interconnections. IBM J. Res. Dev. 2010, 13, 266–271. [Google Scholar] [CrossRef] [Scilit]
- Infineon Technologies. Transient Thermal Measurements and Thermal Equivalent Circuit Models; Appllication Note AN 2015-10; Infineon Technologies: Neubiberg, Germany, 2018. [Google Scholar]
- Gatla, R.K.; Chen, W.; Zhu, G.; Wang, J.V.; Kshatri, S.S. Lifetime comparison of IGBT modules in Grid-connected Multilevel PV inverters Considering Mission Profile. In Proceedings of the ICPE 2019—ECCE Asia—10th International Conference on Power Electronics—ECCE Asia, Busan, Korea, 27–30 May 2019. [Google Scholar]
- Bayerer, R.; Herrmann, T.; Licht, T.; Lutz, J.; Feller, M. Model for power cycling lifetime of IGBT Modules? Various factors influencing lifetime. In Proceedings of the 2008 5th International Conference on Integrated Power Systems, CIPS 2008, Nuremberg, Germany, 11–13 March 2008. [Google Scholar]
- Yang, Y.; Sangwongwanich, A.; Blaabjerg, F. Design for reliability of power electronics for grid-connected photovoltaic systems. CPSS Trans. Power Electron. Appl. 2016, 1, 92–103. [Google Scholar] [CrossRef] [Scilit]
- Novak, M.; Sangwongwanich, A.; Blaabjerg, F. Monte Carlo Based Reliability Estimation Methods in Power Electronics. In Proceedings of the 2020 IEEE 21st Workshop on Control and Modeling for Power Electronics (COMPEL), Aalborg, Denmark, 9–12 November 2020; pp. 1–7. [Google Scholar] [CrossRef] [Scilit]
- Sangwongwanich, A.; Yang, Y.; Sera, D.; Blaabjerg, F. Lifetime Evaluation of Grid-Connected PV Inverters Considering Panel Degradation Rates and Installation Sites. IEEE Trans. Power Electron. 2018, 33, 1225–1236. [Google Scholar] [CrossRef] [Scilit]



Publisher’s Note: MDPI stays neutral with regard to jurisdictional claims in published maps and institutional affiliations. |
© 2021 by the authors. Licensee MDPI, Basel, Switzerland. This article is an open access article distributed under the terms and conditions of the Creative Commons Attribution (CC BY) license (https://creativecommons.org/licenses/by/4.0/).