


Abstract
Real Estate Investment Trusts (REITs), as highly leveraged, income-generating vehicles, are among the asset classes most structurally exposed to interest rate risk. This study examines the extent of environmental, social, and governance (ESG) disclosure—rather than underlying ESG performance—as a signal associated with the risk-adjusted performance of REITs listed in Thailand and Singapore and whether interest rate conditions moderate this relationship. Using a new 15-indicator ESG Disclosure Index (ESGDI) applied to a panel of 43 REITs comprising 215 REIT-year disclosure observations (2021–2025), panel regressions selected via Hausman and Breusch–Pagan Lagrange Multiplier tests show that ESG disclosure is significantly associated with lower REIT risk in the baseline specification using cluster-robust standard errors (β = −0.033, p = 0.035) but has no significant association with returns. This baseline association is not robust: it becomes insignificant under a one-year lagged specification (β = −0.020, p = 0.378) and indistinguishable from zero once year fixed effects are added (β = 0.001, p = 0.975). The ESGDI × interest-rate interaction is insignificant in the baseline model, with only a marginal effect under year fixed effects. No statistically significant cross-country heterogeneity is detected, though statistical power is limited. Any risk-reducing signal from ESG disclosure in this setting appears fragile and specification-sensitive rather than a reliable risk driver.
1. Introduction
1.1. Motivation
Real Estate Investment Trusts (REITs) occupy a distinctive position in the risk landscape of modern capital markets. As highly leveraged, income-generating vehicles, REITs are structurally sensitive to changes in the cost of capital, making them one of the asset classes most directly exposed to monetary policy tightening (Wang et al., 2025; Coën & Guardiola, 2025). Since the onset of the post-pandemic tightening cycle, central banks across both advanced and emerging economies have pursued sustained interest rate increases to contain inflation, substantially raising REITs’ financing costs, compressing valuations, and heightening return volatility (Wang et al., 2025). Thailand and Singapore—two Southeast Asian economies whose REIT markets have grown rapidly over the past decade—were not insulated from this cycle. Interest-rate conditions tightened substantially in both markets between 2021 and 2023, with Singapore’s rate peaking in 2023 before stabilizing, while Thailand’s rate continued to rise through 2024 before easing in 2025—reflecting differences in the pace of monetary policy normalization across the two markets.
This exposure raises an important question for investors, asset managers, and regulators alike: are there firm-level characteristics that allow REITs to better withstand interest rate risk, and if so, through what mechanism do they operate? One candidate mechanism that has attracted growing attention is environmental, social, and governance (ESG) disclosure. The past decade has seen sustainable finance move from a niche consideration to a mainstream component of investment decision-making, driven by the United Nations Sustainable Development Goals, tightening regulatory expectations, and shifting investor preferences. A growing body of literature suggests that ESG disclosure is associated with lower firm risk, operating not by directly managing financial risk but through indirect channels: reducing information asymmetry, signalling governance quality, and strengthening stakeholder trust (Fatemi et al., 2018; Freeman, 1984). Through these channels, firms with more extensive ESG disclosure are theorized to face lower costs of capital and greater investor confidence during periods of market stress, which may in turn be associated with lower perceived financial risk (Friede et al., 2015; Singhania & Gupta, 2024). Whether this risk-relevant role extends to REITs—and whether it remains effective specifically during periods of monetary tightening—remains empirically underexplored.
1.2. Research Gap
Despite the expanding literature on ESG and firm performance, at least three gaps limit current understanding of the ESG-risk relationship in the REIT context. First, much of the existing REIT-ESG literature originates from developed markets in North America and Europe, where REIT regimes are mature and ESG reporting infrastructure is well established; comparable empirical evidence from Southeast Asian REIT markets—where disclosure practices, institutional environments, and capital market depth differ substantially from developed-market benchmarks—remains limited, and cross-country comparative evidence within the ASEAN region is scarcer still. A recent exception is Kakinuma (2025), who examines ESG performance among Singapore-listed REITs using commercial Refinitiv scores; however, that study is confined to a single market, focuses on firm valuation and operational performance under climate policy uncertainty rather than interest rate risk, and does not offer the cross-country Thailand-Singapore comparison or the disclosure-based ESG measurement approach this study develops to accommodate REITs outside commercial rating coverage.
Second, studies examining the relationship between interest rates and REIT performance have typically treated interest rate as a direct determinant of returns or valuation, with comparatively little attention paid to whether ESG characteristics moderate this relationship—that is, whether REITs with stronger ESG disclosure are better positioned to preserve returns or contain risk when borrowing costs rise. Given that ESG disclosure is theorized to operate partly through investor confidence and reduced information asymmetry, its risk-relevant role could plausibly be most valuable precisely when macroeconomic conditions are least favourable, yet this interaction remains largely untested in the REIT literature.
Third, much of the ESG-performance literature relies on contemporaneous model specifications, leaving open the question of whether any observed risk-reducing association with ESG disclosure reflects a persistent structural relationship or a short-term, sentiment-driven association that may not survive standard robustness checks such as temporal lagging. This distinction carries practical significance: a risk-reducing association that holds only in the short term implies a different set of policy and investment considerations than one that reflects a durable risk-related association.
1.3. Research Objectives and Contributions
This study addresses these three gaps by examining the relationship between ESG disclosure and the risk-adjusted performance of REITs listed in Thailand and Singapore over the 2021–2025 period, a window spanning a regional interest-rate tightening and partial easing cycle. To measure ESG disclosure, we construct a new ESG Disclosure Index (ESGDI) comprising 15 indicators spanning the environmental, social, and governance dimensions, scored using a binary methodology and applied uniformly across all sample REITs. This disclosure-based measure allows for comparable assessment across REITs that are not covered by commercial ESG rating providers such as MSCI, Refinitiv, or Bloomberg (e.g., Kakinuma, 2025), whose coverage of Southeast Asian REITs remains partial—addressing a practical data limitation that has constrained prior research in this region.
Using a balanced ESG-disclosure panel of 43 REITs comprising 215 REIT-year observations, with minor outcome-variable missingness in the return and risk regressions, we estimate the effects of ESG disclosure and interest rate conditions on REIT return and risk and test whether interest rate moderates the ESGDI–return and risk relationships through an ESGDI × interest rate interaction term. We further assess the temporal robustness of our findings—rather than establishing causal identification—by re-estimating our models using a one-year lagged ESGDI specification, given that reverse causality is a common concern in the ESG-performance literature.
This study does not claim to introduce an entirely new research question; relationships among ESG, corporate risk, financial performance, and macroeconomic conditions have each been studied separately in prior literature. Rather, its contribution lies in extending and combining this existing evidence in three more modest respects. First, it extends the largely developed-market REIT-ESG literature by providing comparative evidence from two relatively underexamined Southeast Asian REIT markets, Thailand and Singapore. Second, it jointly examines ESG disclosure and interest rate conditions within a single moderating framework for REIT return and risk, a combination that prior REIT-interest rate studies have not directly tested in this regional setting. Third, it applies a transparent, disclosure-based ESGDI that extends coverage to REITs not rated by commercial ESG data providers, and it explicitly examines the temporal stability of the ESGDI-risk association through a lagged specification, offering evidence on whether this association is better characterized as a contemporaneous association that does not persist under lagging or as a more durable relationship—evidence that carries tentative, rather than definitive, implications for how investors and regulators might consider ESG disclosure requirements in emerging Southeast Asian markets.
2. Literature Review and Hypothesis Development
2.1. ESG Disclosure, Information Asymmetry, and Perceived Risk
While early research on ESG and firm performance emphasized value creation, a growing strand of the literature reframes ESG disclosure as a risk-relevant information mechanism rather than a direct performance driver. Friede et al. (2015), synthesizing more than 2000 empirical studies, found that the majority report a positive association between ESG performance and financial outcomes. Subsequent work has increasingly reframed this association as operating through risk-related channels rather than direct value creation. Fatemi et al. (2018) distinguish ESG performance from ESG disclosure and show that disclosure moderates the valuation effects of ESG strengths and weaknesses, rather than being uniformly value-enhancing on its own; this distinction is consistent with framing ESG disclosure as fundamentally a signalling mechanism under Signalling Theory: high-quality disclosure allows firms to credibly communicate governance quality and risk-management capacity to investors who cannot directly observe these attributes.
This risk-oriented framing is reinforced by Stakeholder Theory (Freeman, 1984), which holds that firm value depends not only on operational efficiency but also on the trust, cooperation, and legitimacy a firm secures from its stakeholders. Applied to real estate, ESG disclosure signals the quality of asset management, risk governance, and stakeholder relationships—with tenants, creditors, and regulators—that underpin the stability of a REIT’s cash flows. Consistent with this view, Sassen et al. (2016) find that stronger overall corporate social performance, particularly the social dimension, is associated with lower total and idiosyncratic firm risk among European firms, while the governance dimension does not show a statistically significant association. Albuquerque et al. (2020) similarly show that firms with stronger environmental and social performance experienced smaller price declines and lower volatility during the COVID-19 shock, consistent with ESG functioning as a buffer against systemic uncertainty rather than merely a performance driver.
Within the REIT literature specifically, Rajajagadeesan Aroul et al. (2022) find that REITs with stronger ESG scores exhibit higher operational efficiency and better operational performance, with the latter association being stronger among more operationally efficient REITs. Complementary evidence points to a financing-based risk channel: Feng and Wu (2023) show that REITs with higher ESG disclosure obtain lower costs of debt, higher credit ratings, and greater firm value, with pre-pandemic disclosure associated with higher firm value even during the COVID-19 pandemic period. However, the relationship is not uniform across ESG pillars. Disaggregating ESG into its component parts, Rajajagadeesan Aroul et al. (2023) find that environmental and governance factors raise REIT firm value while the social factor lowers it, and Morri et al. (2024b) similarly report that environmental factors are positively associated with financial performance in real estate while governance factors are associated with adverse outcomes—evidence that pillar-level effects can offset one another when ESG is treated as a single composite score. This heterogeneity is echoed in the broader meta-analytic evidence: Zheng and Lee (2026), synthesizing 26 studies on ESG and REIT performance, find that the social and environmental pillars significantly shape REIT outcomes while the governance pillar does not, with the direction and significance of each pillar varying across market contexts and time periods; similarly, Palmieri et al. (2023) show that the magnitude of ESG-related risk mitigation is not stable across time horizons. However, evidence on the ESG-risk relationship in real estate remains mixed: some studies report no significant association, particularly in developing markets, a pattern often attributed to insufficient disclosure levels or the extent to which investors have yet to price ESG information into securities. Much of this literature also relies on commercial ESG ratings (e.g., MSCI, Refinitiv, Sustainalytics), whose coverage of Southeast Asian REITs remains limited, motivating the disclosure-index approach adopted in this study.
It is important to be precise about what this signalling channel does and does not imply. ESG disclosure is not itself a risk-management activity: publishing information about environmental, social, and governance practices does not, on its own, alter a REIT’s underlying leverage, tenant concentration, or exposure to interest rate movements. At most, disclosure can be expected to operate indirectly by reducing information asymmetry between managers and outside investors, increasing transparency around existing risk-management practices, lowering investor uncertainty about the firm’s true risk profile, and signalling managerial and governance quality to creditors and capital markets. Framed this way, ESG disclosure is more accurately described as reducing perceived risk and the uncertainty premium investors attach to a REIT, rather than directly reducing the REIT’s underlying financial risk. This distinction also implies that the ESG Disclosure Index (ESGDI) constructed in this study measures the extent and comprehensiveness of ESG-related information disclosed by a REIT, not its underlying ESG performance or the quality of its environmental, social, and governance outcomes; a REIT may disclose extensively without necessarily achieving superior ESG performance and, conversely, may achieve strong underlying ESG outcomes while disclosing relatively little. This measurement caveat is revisited in Section 3.2 and in the Section 6.
Two further qualifications temper the disclosure-as-signal framing. First, disclosure can be substantively decoupled from practice: firms may issue ESG reports that are largely symbolic, emphasizing favourable narratives while omitting less favourable information, a pattern documented in the greenwashing literature (Delmas & Burbano, 2011). Because disclosure quality and comparability vary across firms and jurisdictions, a purely content-analysis-based index cannot fully distinguish substantive risk-relevant disclosure from symbolic reporting. Second, an equally plausible alternative explanation is that ESG disclosure proxies for broader, unobserved firm quality rather than independently generating a risk-reducing association. REITs with stronger management teams, more sophisticated governance structures, greater financial slack, and more conservative capital structures may simultaneously (i) possess the organizational capacity to produce comprehensive ESG disclosure, (ii) manage leverage and tenant risk more prudently, and (iii) exhibit lower return volatility—so that ESG disclosure and low risk are jointly produced by an underlying firm-quality factor rather than the former causing the latter. Under this “firm-quality” account, the ESGDI would still be empirically associated with lower risk, but the association would reflect selection on unobserved managerial quality rather than a causal risk-mitigating effect of disclosure itself. The empirical analysis that follows cannot fully separate the signalling and firm-quality explanations; both are treated as plausible interpretations of the results, and this ambiguity is returned to explicitly in Section 6 and Section 7.2.
2.2. Interest Rate Risk and REITs
REITs are structurally more sensitive to interest rate changes than typical equities, owing to their high reliance on debt financing, mandatory high dividend payout requirements, and valuations that are directly tied to discounted future cash flows. Under the standard discounted cash flow framework, rising interest-rate conditions can increase discount rates and financing costs, potentially placing downward pressure on valuations and profitability. Wang et al. (2025), using high-frequency five-minute data on U.S. REITs from 2008 to 2021 within a Vector Autoregressive Model with Functional Shocks, find that monetary policy shocks affect not only REIT returns but also higher-order risk measures—realized variance, jump risk, skewness, and kurtosis—with tightening episodes associated with elevated volatility. They identify two principal transmission channels: the discount rate channel and the cash flow channel, through which rate increases jointly depress REIT valuations. Coën and Guardiola (2025) extend this evidence to the UK and European context, finding that REITs function as an important transmission channel for monetary policy shocks into real estate markets, although the strength of this transmission is sensitive to institutional structure and can weaken following major regulatory shifts.
Despite this well-established body of evidence, empirical work on interest rate sensitivity in Southeast Asian REIT markets—where market maturity, disclosure regimes, and monetary policy transmission mechanisms differ substantially from developed markets—remains comparatively limited. Evidence on the broader ESG-financial performance relationship among Thai listed firms, while not REIT-specific, offers some indirect guidance on how the region’s institutional environment shapes this relationship. Abubakr et al. (2025), using system and difference GMM estimations on Thai listed firms over 2014–2023, find that environmental disclosure scores are negatively associated with accounting-based performance (ROA, ROE) while positively associated with market valuation (Tobin’s Q), with social disclosure more consistently associated with improved performance across all three measures. Similarly, Detthamrong et al. (2026), using a panel of 965 Thai firm-year observations from 2020 to 2024, report a significant negative short-term association between ESG performance and return on assets, alongside Granger-causality evidence that ESG performance precedes, or helps predict, subsequent changes in ROA rather than merely following changes in profitability, consistent with a delayed-benefit interpretation of ESG investment in this market. These findings have been interpreted in the context of the still-developing state of ESG disclosure infrastructure and institutional enforcement in Thailand relative to more mature Southeast Asian markets such as Singapore, a contrast directly relevant to the Thailand-Singapore comparison undertaken in this study. More directly relevant to the REIT-interest rate relationship examined in this study, Danila (2025), using a time-varying vector autoregression model on REITs and macroeconomic variables in Malaysia, Singapore, and Thailand from 2010 to 2024, finds that the volatility spillover between interest rates and REIT markets is inconsistent across the region, with a negligible effect in Singapore and Thailand and only a diminishing effect in Malaysia after 2018. This regional evidence of a weak or inconsistent REIT-interest rate relationship in Southeast Asia is broadly consistent with the non-significant baseline association between RATE and REIT returns and risk reported in Section 4.3 of the present study, though Section 5.2 shows this baseline result is itself sensitive to the inclusion of year fixed effects.
2.3. Moderating Role of Interest Rate
A more recent strand of research proposes that ESG characteristics do not merely operate independently of macroeconomic conditions but may moderate how firms are affected by them. Shin et al. (2024), studying U.S. restaurant firms, find that the environmental and social pillars of ESG became more influential in supporting performance specifically when interest rates were elevated, while the governance pillar showed no significant moderating effect. From a credit-market perspective, Chang et al. (2026) find that Taiwanese firms with stronger ESG performance obtained significantly lower bank lending rates, as lenders used ESG information as a signal of reduced credit risk and information asymmetry—suggesting strong ESG performance lowers the cost of capital precisely through the channel most relevant to highly leveraged REITs.
Notably, Morri et al. (2024a) show that the association between ESG and REIT returns varies across time and market conditions: their high-versus-low ESG factor is positively related to returns during favourable periods but loses significance during crises. This temporal instability motivates an open empirical question rather than a predetermined direction: whether interest rate conditions constitute one source of heterogeneity in the ESG-REIT performance relationship and, specifically, whether ESG disclosure strengthens REITs’ resilience during tightening cycles or whether its influence recedes as investors prioritize short-term financial considerations. Kakinuma (2025) offers a partial answer for Singapore REITs, reporting that ESG commitments fail to cushion firm valuation and operational performance during periods of climate policy uncertainty and economic downturns; however, that study examines a macro-uncertainty shock rather than interest rate conditions specifically and does not test whether interest rates moderate the ESG-risk relationship. To the best of our knowledge, no prior study has jointly examined ESG disclosure and interest rate conditions as an integrated moderating framework for REIT return and risk in a Southeast Asian comparative setting—the gap this study addresses.
2.4. Hypotheses
The hypotheses developed below rest on a theoretically predicted, rather than empirically demonstrated, causal chain: greater ESG disclosure is expected to increase transparency, which is expected to reduce information asymmetry between REIT managers and outside investors, which in turn is expected to improve investor confidence and lower the uncertainty premium attached to the firm, and which may therefore be associated with more favourable risk-adjusted performance. Each link in this chain is a theoretical expectation motivated by Signalling Theory and Stakeholder Theory rather than a mechanism this study directly tests or establishes causally; as discussed in Section 2.1, an equally plausible firm-quality explanation could generate the same predicted associations without disclosure itself playing a causal role. The hypotheses are therefore stated and should be read as predictions about statistical association rather than claims of causal effect.
The conceptual framework is illustrated in Figure 1.
Figure 1.
Conceptual framework linking ESG disclosure (ESGDI) to REIT return and risk, with interest rate (RATE) as the hypothesized moderating variable. H1 and H2 denote the direct associations of ESGDI with Return and Risk; H3 and H4 denote the direct associations of RATE with Return and Risk; H5 denotes the moderating effect of RATE on the ESGDI-Return and ESGDI-Risk relationships, tested via the ESGDI × RATE interaction term. Control variables (SIZE, LEV, DIV) are included in all models as specified in Section 3.3 but are omitted from the figure for clarity.
Building on the theoretical and empirical foundations above, this study tests the following hypotheses:
H1.
ESG disclosure is significantly associated with the returns of REITs in Thailand and Singapore.
H2.
ESG disclosure is significantly associated with the risk of REITs in Thailand and Singapore.
H3.
Interest rate conditions are significantly associated with the returns of REITs in Thailand and Singapore.
H4.
Interest rate conditions are significantly associated with the risk of REITs in Thailand and Singapore.
H5.
Interest rate conditions moderate the relationship between ESG disclosure and both the returns and risk of REITs in Thailand and Singapore.
3. Data and Methodology
3.1. Sample
This study uses a balanced ESG-disclosure panel of 43 REITs listed on the Stock Exchange of Thailand and the Singapore Exchange, comprising 22 Thai and 21 Singaporean REITs, observed annually over the 2021–2025 period, yielding 215 REIT-year disclosure observations. While the ESGDI panel is balanced at 215 observations, the estimation samples for the outcome variables are marginally smaller due to missing return and risk data (211 observations for Return and 212 for Risk), as noted in the regression tables. The sample was constructed by first identifying all REITs listed on the Stock Exchange of Thailand and the Singapore Exchange, then applying a purposive sampling procedure with the following inclusion criteria: (i) listed on the Stock Exchange of Thailand or Singapore Exchange; (ii) listed on or before 2021 and continuously operating through 2025; (iii) availability of an Annual Report and/or Sustainability Report sufficient to assess ESG disclosure; (iv) availability of the firm-level data required to construct ESGDI, Return, Risk, SIZE, LEV, and DIV; and (v) data obtainable from official, traceable sources. Table 1 summarizes the resulting sample selection.
Table 1.
Sample Selection.
Of the 43 sample REITs, four (all first listed in 2021, the first year of the study window) lack a prior-year price observation with which to compute Return and Risk for 2021 itself; these REITs retain complete data for 2022–2025 and are kept in the sample rather than dropped entirely, which is standard practice for panel data and avoids introducing additional survivorship bias. This inclusion rule is a plausible source of sample selection bias: REITs that survived the full five-year window with continuously available reporting are likely to be larger, more established, and more consistently governed than the broader population of REITs at any given point in time, and such REITs may also be more likely to produce comprehensive ESG disclosure. If disclosure and survival or reporting completeness are jointly driven by unobserved REIT quality, the estimated ESGDI-risk association could be attenuated toward the relationship observed among relatively higher-quality, surviving REITs, rather than reflecting the broader population of REITs in either market. This possibility is acknowledged as a further limitation in Section 7.2.
This sample period was selected for two reasons. First, it captures a regional interest-rate tightening and partial easing cycle, spanning the onset of monetary tightening through subsequent easing. Second, it corresponds to the period following the widespread adoption of enhanced ESG disclosure requirements in annual reports and sustainability reports across both markets, ensuring that disclosure data are consistently available across the sample.
It is important to be precise about how the interest rate variable (RATE) is identified in this design. RATE is common to all REITs within a given country-year and therefore varies only at the country-year level: with two countries observed over five years, the panel contains at most ten distinct country-year RATE values, rather than firm-level variation. Consequently, the coefficient on RATE—and, more importantly, the ESGDI × RATE interaction term used to test H5—is identified from a comparatively small number of country-year cells, which may substantially limit the statistical power of the interaction test and should be borne in mind when interpreting the non-significant moderating effect reported in Section 4.3. Because RATE varies over calendar time common to both countries, its estimated effect may also be difficult to separate from other contemporaneous, time-varying developments—including post-pandemic recovery dynamics, property-market cycles, and regulatory reforms—that are not explicitly modelled in the main specification. Section 5.2 reports a robustness check using year fixed effects to assess the sensitivity of the main results to this concern directly.
A further clarification is warranted regarding the interest rate proxy used for each market, since Thailand and Singapore operate under materially different monetary policy frameworks. For Thai REITs, RATE is measured as the annual average of the Bank of Thailand’s policy interest rate, defined as the 1-day bilateral repurchase rate (Bank of Thailand, n.d.), which is the direct instrument of Thai monetary policy. The Monetary Authority of Singapore (MAS), by contrast, does not target a policy interest rate; it conducts monetary policy primarily through managing the Singapore Dollar Nominal Effective Exchange Rate (S$NEER) within an undisclosed policy band (MAS, n.d.-a). Because no directly comparable policy interest rate exists for Singapore, RATE for Singaporean REITs is instead measured as the annual average of the 3-month Compounded SORA rate, published by MAS as the compounded average of the daily Singapore Overnight Rate Average (SORA) over a three-month period (MAS, n.d.-b), the standard short-term money-market benchmark, which reflects prevailing SGD money-market conditions and short-term domestic borrowing costs, even though it is not itself a policy-set instrument. This asymmetry means that RATE captures policy-determined borrowing costs for Thailand but a market-determined, policy-influenced money-market rate for Singapore; the two series are conceptually related but not perfectly comparable measures of monetary stance, and this is acknowledged as a limitation of the cross-country comparison in Section 7.2. Government bond yields were considered as an alternative, market-based interest rate measure for both countries, which would have offered greater cross-country comparability; however, they were not adopted as the primary measure. Short-term policy and money-market rates more directly reflect the short-term financing costs (bank borrowing, floating-rate debt) that are the specific channel of theoretical interest in this study’s risk-relevance framing, whereas government bond yields primarily capture long-term borrowing costs and term-premium dynamics that are less directly tied to REITs’ typically shorter-duration liabilities; adopting bond yields instead would also have required introducing an additional interest-rate series into an already parsimonious specification. Future research could test the robustness of the findings using comparable sovereign bond yields or other market-based interest-rate measures.
3.2. ESGDI Construction
Given the limited coverage of Southeast Asian REITs by commercial ESG rating providers such as MSCI, Refinitiv, and Sustainalytics, this study constructs an ESG Disclosure Index (ESGDI) based on content analysis of annual reports, sustainability reports, and (for Thai REITs) Form 56-1 One Reports. The ESGDI is a disclosure-based measure: it captures the extent and comprehensiveness of ESG-related information a REIT discloses in its public reporting, not its underlying ESG performance or the quality of its actual environmental, social, and governance outcomes. A REIT may score highly on the ESGDI without independent verification of strong underlying ESG performance, and, conversely, a REIT with strong underlying ESG outcomes could in principle disclose relatively little; this distinction is maintained throughout the empirical analysis and is revisited as an interpretive caveat in Section 6. The index comprises 15 indicators distributed equally across the three ESG pillars:
Environmental (5 indicators): energy management, water management, greenhouse gas emissions management, waste management, and environmental compliance or green building certification.
Social (5 indicators): employment and employee welfare, training and development, occupational health and safety, diversity and equal opportunity, and community engagement.
Governance (5 indicators): board independence, anti-corruption policy, risk management, whistleblowing mechanisms, and codes of business conduct and ethics.
Each indicator is scored using a binary approach: a score of 1 is assigned where a REIT provides clear disclosure accompanied by supporting policy, quantitative, or performance detail, and 0 where disclosure is absent or superficial. The full coding protocol, including indicator-level scoring criteria and illustrative examples, is provided in Supplementary Material S1. Coding was carried out by two coders: the corresponding author served as the primary coder for all 215 firm-year observations, and a second, blinded coder independently re-coded a random subsample comprising approximately 27% of report-years (58 of the 215 firm-year observations) following the same protocol, without access to the primary coder’s original scores. Inter-rater reliability on this subsample, computed directly from the 870 paired coding decisions (58 report-years × 15 indicators), was excellent: the overall Cohen’s kappa was 0.983, indicating almost perfect agreement according to Landis and Koch (1977), with an overall percentage agreement of 99.3% (864 of 870 decisions), and indicator-level percentage agreement ranging from 96.6% to 100% across the 15 ESGDI indicators. For one indicator (G3, risk management), both coders assigned a score of 1 to all 58 sampled report-years; because Cohen’s kappa is mathematically undefined when one category has zero variance, kappa could not be computed for this indicator specifically, although percentage agreement was 100%. The 6 disagreements identified during this check were resolved by joint re-reading of the underlying disclosure against the Supplementary Material S1 criteria. The ESGDI for REIT i in year t is calculated as an equally weighted average across all 15 indicators:
ESGDI(it) = (∑j=115 Scorej)/15
Equal weighting across all 15 indicators is adopted for two reasons. First, in the absence of an established, REIT-specific theoretical basis for assigning differential weights to individual indicators, an a priori unequal weighting scheme would itself introduce an additional source of researcher-driven subjectivity into the index. Second, equal weighting preserves transparency and replicability, since the resulting score depends only on the observed binary disclosures and the protocol in Supplementary Material S1, rather than on researcher-specified weights that would themselves require justification and validation. This choice treats all 15 indicators as equally informative signals of overall disclosure intensity; it is a simplifying assumption rather than a claim that every disclosure item carries identical economic significance, and it is noted as a further limitation in Section 7.2.
This disclosure-based approach does not aim to replace commercial ESG ratings but to provide a transparent, uniformly applicable measure capable of covering the full sample regardless of commercial rating availability—addressing a coverage gap that has constrained prior research on Southeast Asian REITs.
3.3. Variable Measurement
The firm-level and macroeconomic control variables in Table 2 are included on the following theoretical grounds. SIZE (log of total assets) controls for scale-related differences in access to capital markets, diversification, and operational stability that are well documented to affect both return and risk in the REIT literature, independent of ESG disclosure. LEV (total debt to total assets) controls for capital-structure risk: more highly levered REITs are mechanically more exposed to interest rate changes and default risk, making leverage a necessary control when RATE and ESGDI are the variables of primary interest. DIV (dividend yield) controls for REITs’ mandatory high-payout structure, which directly affects retained cash flow, financial flexibility, and investor perception of risk. Country-year macroeconomic conditions—including GDP growth and inflation—were considered for inclusion as additional controls, since REIT demand, property valuations, and financing conditions are plausibly influenced by the broader economic cycle. However, because GDP growth and inflation, like RATE, vary only at the country-year level and not across REITs within a country-year, including them alongside RATE in the same specification introduces substantial collinearity: with only two countries and five years, RATE, GDP, and INF share most of their identifying variation, making it difficult to separate their individual effects and destabilizing the coefficient estimates on all three. GDP growth and inflation are therefore not included as regressors in the main models reported in Section 4 and Section 5; their descriptive statistics are nonetheless reported in Section 4.1 for context. Together, the controls that are included (SIZE, LEV, DIV) are intended to isolate the ESGDI–return/risk and RATE–return/risk relationships from the most well-established firm-level determinants of REIT return and risk; however, as discussed in Section 7.2, they do not exhaust the set of potentially relevant determinants, and the possibility of omitted-variable bias from unmodelled macroeconomic and market-level factors—including the excluded GDP and INF variables—is acknowledged there as a limitation.
Table 2.
Variable Measurement and Data Sources.
3.4. Model Specification
To test H1–H4, the following panel regression models are estimated for each dependent variable:
Return(it) = β0 + β1ESGDI(it) + β2RATE(ct) + β3SIZE(it) + β4LEV(it) + β5DIV(it) + ε(it)
Risk(it) = β0 + β1ESGDI(it) + β2RATE(ct) + β3SIZE(it) + β4LEV(it) + β5DIV(it) + ε(it)
To test H5, an interaction term between ESGDI and RATE is introduced into both models:
where i indexes REITs, t indexes years, and c indexes countries. A statistically significant coefficient on the interaction term (β3) would support H5, indicating that interest rate conditions moderate the ESGDI–return and risk relationships.
Return(it)/Risk(it) = β0 + β1ESGDI(it) + β2RATE(ct) + β3(ESGDI(it) × RATE(ct)) + β4SIZE(it) +
β5LEV(it) + β6DIV(it) + ε(it)
β5LEV(it) + β6DIV(it) + ε(it)
3.5. Estimation Strategy and Diagnostics
Each model is estimated using three panel estimators—Pooled OLS, Fixed Effects (FE), and Random Effects (RE)—to allow for comparison across specifications with differing assumptions about unobserved heterogeneity. Model selection between FE and RE is conducted using the Hausman specification test, with FE preferred where the test is statistically significant, and the Breusch-Pagan Lagrange Multiplier test is used to confirm the presence of panel effects relative to Pooled OLS.
In plain terms, these three estimators differ in how they treat REIT-specific characteristics that are not directly observed in the data—such as management quality, tenant relationships, or institutional reputation—but that could influence both a REIT’s Return or Risk and its ESGDI. Pooled OLS assumes these unobserved characteristics are uncorrelated with the explanatory variables and simply pools all firm-years together, which is only appropriate when such REIT-specific heterogeneity does not bias the coefficients of interest. Random Effects (RE) allows for REIT-specific unobserved heterogeneity but assumes it is uncorrelated with the explanatory variables (including ESGDI and RATE) and combines within-REIT and between-REIT variation when estimating coefficients. Fixed Effects (FE) is the most conservative of the three: it removes all time-invariant REIT-specific characteristics entirely by estimating relationships using only within-REIT variation over time, which protects against bias from unobserved heterogeneity that is correlated with the explanatory variables, at the cost of discarding the (substantial) between-REIT variation used by Pooled OLS and RE. The Hausman test formally checks whether RE’s assumption—that unobserved heterogeneity is uncorrelated with the regressors—is statistically tenable; where it is rejected, FE is preferred because RE would otherwise be inconsistent, even though FE is less efficient when RE’s assumption does in fact hold.
Prior to interpretation, model diagnostics are conducted to verify the validity of each specification, including tests for normality of residuals (Jarque–Bera), heteroskedasticity (Breusch-Pagan), serial correlation (Wooldridge test), and cross-sectional dependence (Pesaran CD test). Where these diagnostics indicate violations of standard OLS assumptions, robust standard errors clustered at the REIT level are applied to ensure valid inference. All estimations are conducted in R (version 4.2.3) using the plm package for panel estimation and the lmtest package for diagnostic and hypothesis testing.
As a temporal robustness test—rather than a causal identification strategy—models are re-estimated using a one-year lagged ESGDI specification, with results reported in Section 5.1. System GMM and instrumental-variable (IV) approaches, which are alternative strategies for addressing endogeneity in panel settings, are not employed in the main analysis. System GMM was not employed because the present study does not specify a dynamic model with a lagged dependent variable as a central structural component—the setting for which Difference and System GMM estimators were developed (Arellano & Bond, 1991; Blundell & Bond, 1998)—while the relatively small number of cross-sectional units (N = 43) raises concerns about finite-sample reliability and about the instrument count relative to the number of REITs, since the number of available instruments in GMM estimation grows with the number of time periods and lag depths used, independent of the cross-sectional dimension (Roodman, 2009). Introducing GMM solely as a generic remedy for endogeneity, without a dynamic structural motivation, would therefore be difficult to justify in the present design. Similarly, a credible IV approach would require an instrument that affects ESG disclosure but not REIT return or risk except through disclosure, and no such instrument is available in the present dataset. The one-year lagged ESGDI specification is therefore best understood as a test of the temporal stability of the ESGDI-risk association—that is, whether the contemporaneous relationship persists once ESGDI is measured one year prior to the outcome—rather than as a method that establishes causal direction. Lagging an explanatory variable does not remove persistent, unobserved firm-level characteristics that may be correlated with both disclosure and performance; as Wooldridge (2010) notes, temporal ordering alone is insufficient to establish causality when such unobserved factors remain correlated with both the explanatory variable and the outcome. This distinction, and the resulting limits on causal interpretation, are discussed further in Section 7.2.
4. Empirical Results
4.1. Descriptive Statistics
Table 3 reports descriptive statistics for the full sample (215 firm-year observations, 211–212 for return/risk variables due to minor missing values). Mean annual REIT return was 1.6% (SD = 17.0%, range: −66.2% to 62.8%), while mean risk (standard deviation of monthly returns) was 5.1% (SD = 2.6%). Mean ESGDI was 0.756 (SD = 0.271), indicating relatively high overall disclosure levels, though with substantial cross-sectional variation (range: 0.133–1.000). Among the three ESG pillars, governance disclosure was highest on average (mean G_SCORE = 0.924), followed by social (0.714) and environmental (0.631) disclosure—suggesting that sampled REITs disclose governance-related information more consistently than environmental practices. The mean RATE proxy across the panel was 1.79% (SD = 1.11%, range: 0.165–3.588%), reflecting the substantial monetary policy variation captured within the sample period.
Table 3.
Descriptive Statistics.
Table 4 shows that ESG disclosure rose steadily across the sample period, from a mean ESGDI of 0.719 in 2021 to 0.809 in 2025, with the largest gains observed in the environmental pillar (0.553 to 0.707) and social pillar (0.688 to 0.781), while governance disclosure remained comparatively stable and near-saturated throughout (0.916 to 0.940).
Table 4.
Average ESG Disclosure Index by Year (2021–2025).
Table 5 compares descriptive statistics between Thailand and Singapore. Mean ESGDI differs substantially between the two markets (Thailand = 0.546; Singapore = 0.977; t = −19.498, p < 0.001), indicating that Singaporean REITs disclose ESG information far more comprehensively than their Thai counterparts across all three pillars. Thai REITs are, on average, larger by total assets (SIZE: 8.994 vs. 8.166; p < 0.001) but carry substantially lower leverage (LEV: 0.262 vs. 0.414; p < 0.001) and slightly higher dividend yield (DIV: 0.081 vs. 0.064; p < 0.001). Risk levels were modestly but significantly higher for Singaporean REITs (0.054 vs. 0.047; p = 0.031), while the difference in mean returns was not statistically significant (p = 0.557).
Table 5.
Descriptive Statistics by Country: Thailand vs. Singapore.
4.2. Model Selection (Hausman, BP-LM)
Model selection tests are reported in Table 6. For the return equation (Model 1), the Breusch-Pagan LM test does not reject the null of no random effects (p = 0.979), and the poolability test similarly favours pooling (p = 0.466); Pooled OLS is therefore selected. For the risk equation (Model 2), both the poolability test and LM test strongly reject pooling (p < 0.001), and the Hausman test favours Fixed Effects over Random Effects (p < 0.001); Fixed Effects is therefore selected. The same pattern holds for the disaggregated E/S/G specifications: Pooled OLS is selected for the return model (Model 3) and Fixed Effects for the risk model (Model 4). This consistent pattern—pooling for return equations and fixed effects for risk equations—suggests that time-invariant REIT-specific heterogeneity is more important for explaining Risk than Return in the present sample.
Table 6.
Panel Model Selection Tests (Poolability, LM, and Hausman Tests).
4.3. Main Results (H1–H5)
Table 7 reports the estimated coefficients for Model 1 (Return) and Model 2 (Risk), both including the ESGDI × RATE interaction term to jointly test H1–H5.
Table 7.
Panel Regression Results for REIT Return and Risk (Panel A: Return—Model 1; Panel B: Risk—Model 2).
For Return (Model 1, Pooled OLS, N = 211, R2 = 0.049), the coefficient on ESGDI is positive but statistically insignificant (β = 0.008, p = 0.930), providing no support for H1. The coefficient on RATE is likewise insignificant (β = 0.028, p = 0.545), providing no support for H3. Among the controls, DIV is statistically significant under conventional inference (p = 0.011) but weakens to marginal significance under REIT-clustered inference (p = 0.085; Table 9); SIZE and LEV remain statistically insignificant.
For Risk (Model 2, Fixed Effects, N = 212, R2 = 0.282), the coefficient on ESGDI is negative and statistically significant using cluster-robust standard errors (β = −0.033, p = 0.035; conventional SE: p = 0.022; see Table 9), providing support for H2 in the baseline specification, although this support is not robust to the inclusion of year fixed effects (Section 5.2). REITs with higher ESG disclosure exhibit significantly lower risk under this baseline model. In economic terms, a 0.10 increase in ESGDI (on its 0–1 scale) is associated with a 0.0033 decrease in Risk (−0.033 × 0.10), equivalent to approximately 6.5% of mean sample Risk (0.051; Table 3); a one-standard-deviation increase in ESGDI (0.271) is associated with a 0.0089 decrease in Risk, or approximately 17.5% of mean Risk. These magnitudes should be interpreted as baseline associations only: as shown in Section 5.2, this coefficient is not robust to the inclusion of year fixed effects, so the economic magnitude reported here characterizes the contemporaneous baseline specification rather than an effect established to be robust across specifications. The coefficient on RATE is not significant in this specification (β = −0.001, p = 0.906), providing no support for H4 in the pooled risk model; however, in the disaggregated E/S/G risk model (Model 4), RATE is positive and highly significant (β = 0.004, p < 0.001, cluster-robust), indicating that once ESG is decomposed into its three pillars, interest rate does exhibit a significant positive association with risk—offering partial support for H4 that is sensitive to model specification. SIZE (β = −0.041, p < 0.001) and LEV (β = 0.189, p < 0.001) are both significant determinants of risk, with larger REITs exhibiting lower risk and more leveraged REITs exhibiting higher risk, consistent with theoretical expectations.
Table 8 reports the disaggregated environmental, social, and governance regression results for REIT return and risk.
Table 8.
Disaggregated E/S/G Regression Results for REIT Return (Model 3) and Risk (Model 4).
The interaction term ESGDI × RATE is not statistically significant in either the Return equation (β = −0.043, p = 0.401) or the Risk equation (β = 0.005, p = 0.360), providing no support for H5 in the baseline specification: interest rate conditions do not significantly moderate the relationship between ESG disclosure and REIT return or risk over the sample period. The main inferences for ESGDI, RATE, and the interaction term remain unchanged when REIT-clustered standard errors are used (Table 9), although the statistical significance of some control variables weakens. Based on these robust standard errors, 95% confidence intervals for the key coefficients are as follows. Return equation: ESGDI [−0.179, 0.196], RATE [−0.056, 0.112], ESGDI × RATE [−0.133, 0.047]. Risk equation: ESGDI [−0.063, −0.003], RATE [−0.011, 0.010], ESGDI × RATE [−0.007, 0.018]. The Risk-equation confidence interval for ESGDI excludes zero, consistent with its statistical significance in the baseline model, while all other intervals reported here include zero, consistent with the non-significant point estimates discussed above; as with the point estimates themselves, these intervals characterize the baseline specification only and should be read alongside the sensitivity to model specification documented in Section 5.
Table 9.
Robustness Check: Original versus REIT-Clustered Robust Standard Errors.
4.4. Country Heterogeneity (Thailand vs. Singapore)
Before turning to the empirical tests, it is useful to summarize the institutional differences between the two REIT regimes that motivate this comparison. Thai REITs are regulated by the Securities and Exchange Commission (SEC) under a framework established in 2010 and are subject to a leverage limit of less than 35% of total asset value, which may increase to 60% where the relevant investment-grade credit-rating condition is satisfied (Securities and Exchange Commission Thailand [SEC], n.d.). Singapore REITs (S-REITs), by contrast, are regulated by the Monetary Authority of Singapore (MAS) under the Code on Collective Investment Schemes, most recently updated on 28 November 2024 to set a single aggregate leverage limit of 50% of total assets alongside a minimum interest coverage ratio of 1.5 times, applicable to all S-REITs (MAS, 2024). This difference in maximum permitted leverage—less than 35%, extendable to 60%, of total asset value for Thai REITs versus a single 50% ceiling for S-REITs—provides a plausible institutional basis for expecting the ESGDI–return and ESGDI–risk relationships to differ across the two markets, particularly given leverage’s role as a control variable in this study’s models; the tests below examine whether such differences are detectable given the sample available. The two markets also differ in the maturity and stringency of ESG disclosure requirements. Singapore’s mandatory sustainability reporting regime for SGX-listed issuers, including REITs, has been in place since 2016 on a comply-or-explain basis and has progressively tightened, with TCFD-aligned climate reporting made mandatory for issuers in select sectors from 2022 and with phased climate-related reporting requirements applying IFRS S2 and the climate-relevant provisions of IFRS S1 beginning from financial years commencing in 2025 for specified issuers (Singapore Exchange, n.d.). Thailand’s SEC introduced its comparable mandatory disclosure vehicle later, consolidating ESG-related disclosure into the Form 56-1 One Report, which applies to Thai listed issuers on a comply-or-explain basis; alignment with the ISSB Standards remains in progress, with the SEC having issued a public consultation on a Thailand Sustainability Disclosure Roadmap in 2024 (Securities and Exchange Commission Thailand [SEC], 2024). This suggests Singapore’s disclosure regime is both longer established and further advanced toward mandatory, standardized reporting than Thailand’s. The two REIT markets also differ in maturity and investor composition: the S-REIT sector was established in 2002 and has grown into a regionally dominant, internationally oriented market, with more than 90% of S-REITs by number and market capitalization holding properties outside Singapore across Asia-Pacific, Europe, and the United States, aided by tax-transparency treatment designed to attract international listings and institutional investors (REIT Association of Singapore [REITAS], n.d.). Thai REITs, by contrast, operate in a smaller and more domestically oriented market. Foreign-ownership rules, sponsor ownership structures, and related-party transaction dynamics may also differ between the two markets but are not characterized further here, as doing so with appropriate citation to primary regulatory or academic sources is left to future research with a more targeted institutional focus.
Given the substantial cross-country differences in ESG disclosure levels documented in Section 4.1, Table 10 examines whether model selection and estimated relationships differ between Thailand and Singapore when models are estimated separately by country. Notably, the preferred estimator differs across countries and dependent variables: Random Effects is preferred for Thailand’s return equation (Hausman p = 0.993) and Singapore’s risk equation (Hausman p = 0.541). Pooled OLS is retained for Thailand’s risk equation on the basis discussed below and for the Singapore Return equation because neither the poolability test (p = 0.232) nor the LM test (p = 0.831) supports the presence of panel effects; the significant Hausman statistic for this equation (p = 0.006) is therefore noted but is not used to select between Fixed and Random Effects when a panel estimator is not warranted by the preceding tests. These mixed specification-test results reinforce the need for caution in interpreting separately estimated country models.
Table 10.
Country-Level Model Selection and Heterogeneity Tests.
One result in Table 10 warrants explicit comment: for the Thailand-Risk equation, the poolability F-test rejects the null of no panel effects (p = 0.007), which on its own would favour Fixed Effects over Pooled OLS, yet the LM test does not reject the null of no random effects (p = 0.214), and the Hausman test is non-significant (p = 0.173). This is a genuine tension rather than a fully resolved one: the poolability F-test and the LM test address related but distinct null hypotheses regarding the error-variance structure, and they can disagree in finite samples such as this one (n = 22 Thai REITs); the fact that the LM test does not favour Random Effects over Pooled OLS does not, by itself, override the F-test’s evidence against pooling. Given this ambiguity in the country-specific model-selection sequence, this study relies primarily on the pooled country-interaction model reported in Section 4.4 (Table 10b)—rather than on separately estimated country-specific models—as the main test of cross-country heterogeneity, since the interaction-term approach avoids conditioning conclusions on a single, potentially ambiguous country-level estimator choice. The country-specific results in Table 10 are reported for transparency and as a robustness cross-check but should be interpreted with the above caveat in mind.
To test formally whether the ESGDI–return/risk and RATE–return/risk relationships differ by country, country interaction terms (ESGDI × COUNTRY and RATE × COUNTRY) were estimated for both the return and risk equations, with full coefficients reported in Table 10b above. Neither interaction term was statistically significant for return (ESGDI × COUNTRY: p = 0.627; RATE × COUNTRY: p = 0.253) or for risk (ESGDI × COUNTRY: p = 0.840; RATE × COUNTRY: p = 0.268). These results indicate that, despite substantial differences in disclosure levels, leverage, and firm size between the two markets, this study does not find statistically significant evidence that the effect of ESG disclosure and interest rate conditions on REIT return and risk differs between Thailand and Singapore once firm-level controls are accounted for. This is a more limited claim than generalizability: given the sample split by country substantially reduces the number of observations available for each interaction test, the absence of a significant country interaction may reflect limited statistical power rather than a true absence of cross-country difference, a caveat discussed further in Section 6.
5. Robustness Checks
5.1. Lagged ESGDI Specification
As a test of temporal robustness—motivated by, but not resolving, concerns regarding reverse causality that affect the ESG-performance literature broadly (Malik & Kashiramka, 2025)—Models 1 and 2 are re-estimated using a one-year lagged ESGDI (ESGDI(t−1)) in place of the contemporaneous measure, following the same specification reported in Table 7 (excluding GDP and INF for the reasons discussed in Section 3.3). This reduces the sample to a balanced panel of 172 firm-year observations (43 REITs × 4 years, 2022–2025), as the earliest year of data is consumed in constructing the lag.
Rather than re-selecting an estimator for this smaller lagged subsample, Models 1 and 2 retain the same estimators used for the corresponding baseline models in Table 7—Pooled OLS for Return and Fixed Effects for Risk—so that any difference between the baseline and lagged results reflects the change in the timing of ESGDI rather than a confounding change in the estimator. For reference, the Hausman tests on the lagged subsample favour Random Effects over Fixed Effects for Return (χ2 = 2.11, df = 6, p = 0.909) and Fixed Effects over Random Effects for Risk (χ2 = 13.18, df = 6, p = 0.040), broadly matching the FE-versus-RE pattern in the full sample. However, the baseline Return equation retains Pooled OLS because the full-sample LM and poolability tests do not support panel effects. Table 11 reports coefficient estimates with REIT-clustered t-statistics, using the baseline-consistent estimators.
Table 11.
Robustness Check: Lagged ESGDI Specification (One-Year Lag).
For Return, the coefficient on ESGDI(t−1) is positive but not statistically significant (β = 0.010, p = 0.931), consistent with the insignificant contemporaneous result reported in Section 4.3 (H1 remains unsupported).
For Risk, the lagged specification produces a materially different result from the contemporaneous model. Whereas contemporaneous ESGDI was negative and significant (β = −0.033, p = 0.035, cluster-robust; Section 4.3), the one-year lagged ESGDI is not statistically significant (β = −0.020, p = 0.378). The interaction term ESGDI(t−1) × RATE also remains insignificant for both outcomes (Return: p = 0.653; Risk: p = 0.806), so the null result for H5 is unaffected by the temporal specification.
The attenuation of the ESGDI-risk relationship under lagging warrants careful interpretation. Two explanations are plausible. First, it may indicate that the risk-reducing association identified in the contemporaneous model operates through a relatively short-lived channel—such as market sentiment or investor perception—that dissipates within a year rather than reflecting a persistent structural reduction in risk. This interpretation is consistent with evidence from Morri et al. (2024a), who find that the market pricing of ESG in real estate varies substantially across time and macroeconomic conditions rather than remaining stable, and with broader evidence that the ESG-performance relationship is not stable across different sample periods and specifications (Palmieri et al., 2023). Second, given that the lagged specification reduces the effective time dimension to four years per REIT, the loss of statistical power cannot be ruled out as a contributing factor. We therefore treat the lagged-ESGDI finding as an important qualification to the main result rather than as evidence overturning it: the risk-reducing association between ESG disclosure and REIT risk identified in this study should be interpreted as a contemporaneous association that does not persist under the one-year lagged specification, rather than a demonstrated long-run causal effect.
5.2. Year Fixed Effects
As discussed in Section 3.1, RATE varies only at the country-year level, so its estimated effect—and that of the ESGDI × RATE interaction—may be confounded with other contemporaneous, time-varying developments common to both markets, such as post-pandemic recovery dynamics or regional property-market cycles. To assess this concern directly, Models 1 and 2 are re-estimated with year fixed effects added to the baseline specification, using the same estimator (Pooled OLS for Return, Fixed Effects for Risk) selected in Section 4.2, with standard errors clustered at the REIT level throughout, consistent with the inference standard used elsewhere in this study (Table 9). Full results are reported in Table 12.
Table 12.
Robustness Check: Year Fixed Effects (Cluster-Robust Standard Errors).
For Return, adding year fixed effects leaves ESGDI statistically insignificant (β = −0.046, p = 0.622, cluster-robust), so H1 remains unsupported. RATE also remains statistically insignificant under year fixed effects (β = 0.011, p = 0.869), providing no evidence that the null RATE-Return result in the baseline specification (Section 4.3) was concealing a genuine effect once common time-varying shocks are absorbed; H3 therefore remains unsupported under this robustness check as well. The ESGDI × RATE interaction remains statistically insignificant (β = −0.018, p = 0.718), so the conclusion regarding H5 for the Return equation is unchanged. DIV is marginally significant (β = −0.941, p = 0.091), broadly consistent with its weakened but still directionally negative association with Return under robust inference in the baseline model (Table 9).
For Risk, the results are materially different from the baseline model in two respects, and both must be reported plainly. First, and consistent with the pattern already noted for lagged ESGDI in Section 5.1, the baseline association between ESGDI and Risk (β = −0.033, p = 0.035, cluster-robust; Table 9) becomes essentially zero and entirely non-significant once year fixed effects are added (β = 0.001, p = 0.975). Second, and unexpectedly, RATE—which is not statistically significant in the baseline Risk model (Section 4.3)—becomes significant and positive once year fixed effects are added (β = 0.032, p < 0.001), indicating that higher interest rates are associated with significantly higher REIT risk once common year-specific shocks are separated out; this offers support for H4 in this specification, in contrast to the null baseline result. The ESGDI × RATE interaction is marginally significant (β = −0.013, p = 0.057). SIZE remains a significant risk determinant (β = −0.043, p = 0.003), and DIV remains significant (β = 0.282, p = 0.009), while LEV is only marginally significant under this specification (β = 0.202, p = 0.072). Taken together, these results suggest that, within the Risk equation, year fixed effects and ESGDI’s within-panel variation are substantially entangled: once year-specific conditions are modelled explicitly, the interest-rate channel—rather than the ESG-disclosure channel—emerges as the more robust correlate of REIT risk.
This finding substantially qualifies the central result of this study. Rather than reflecting a distinct, disclosure-driven reduction in financial risk, the baseline ESGDI-risk association may in part reflect broad, year-specific market conditions that happen to be correlated with the panel’s ESGDI trend—which, as shown in Section 4.1, rose steadily across the sample period for both markets—and that are more directly captured by RATE once year fixed effects allow its within-Risk-equation role to be separated from ESGDI’s. Because ESGDI’s within-panel variation is driven partly by a common time trend, year fixed effects and the ESGDI level are not fully separable in a panel of this length (T = 5), and the loss of significance under year fixed effects could reflect either the removal of a genuine confound or a reduction in the identifying variation available to estimate the ESGDI coefficient, or both. The present data cannot definitively distinguish between these explanations. Taken together with the attenuation of the ESGDI-risk association under the one-year lag reported in Section 5.1, this result reinforces the conclusion that the ESG disclosure-risk relationship identified in this study should be interpreted cautiously, as a conditional association that is sensitive to model specification, rather than as robust evidence of a structural, disclosure-driven risk-reduction mechanism. This sensitivity is discussed further in Section 6 and is reflected in the more cautious statement of findings in Section 7.
5.3. Limitations of Panel Granger Causality Testing
As a further check on the direction of causality between ESGDI and REIT performance, we attempted to implement panel Granger causality tests (Dumitrescu & Hurlin, 2012) in both directions (ESGDI → Return/Risk and Return/Risk → ESGDI). This test could not be validly executed with the present data: the standard asymptotic test statistic requires a minimum time dimension of T > 5 + 3 × (lag order) (Lopez & Weber, 2017), which for a first-order test requires T > 8. The present panel spans only five years (T = 5), and the lagged specification described above further reduces the effective time dimension to four years—both well below this threshold.
We report this limitation directly rather than presenting results from a test applied outside its valid range. This constraint reflects a structural feature of the ESGDI dataset—a self-constructed disclosure index requiring manual content analysis, which limits the feasible sample period relative to studies using longer-established commercial ESG ratings—rather than a methodological oversight. Consequently, while the lagged-ESGDI specification in Section 5.1 provides suggestive evidence on the temporal structure of the ESGDI-risk relationship, formal causal directionality cannot be established with the current sample, and this should be regarded as a limitation of the present study rather than a definitive resolution of the endogeneity concern. We discuss this limitation further, together with its implications for future research using longer panels, in Section 7.
5.4. Common-Estimator Robustness (Firm Fixed Effects)
Because Model 1 (Return) and Model 2 (Risk) use different estimators in the baseline specification—Pooled OLS for Return and Fixed Effects for Risk, selected via the model-selection tests reported in Table 6—it is useful to verify that the main conclusions do not depend on this difference in estimators across outcomes. Table 13 re-estimates both models using Firm Fixed Effects throughout, with standard errors clustered at the REIT level.
Table 13.
Common-Estimator Robustness Using Firm Fixed Effects.
The results confirm that the study’s main conclusions do not depend on the choice of estimator. Under Firm Fixed Effects, ESGDI remains statistically insignificant for Return (β = 0.017, p = 0.901), consistent with the baseline Pooled OLS result (β = 0.008, p = 0.930) and with H1 remaining unsupported. For Risk, imposing Firm Fixed Effects reproduces the baseline result exactly, since Fixed Effects was already the selected estimator for Risk (β = −0.033, p = 0.035 with robust SE), continuing to support H2. The interaction term ESGDI × RATE remains statistically insignificant for both outcomes under the common Firm Fixed Effects specification (Return: p = 0.207; Risk: p = 0.416), so the null result for H5 is likewise unaffected by estimator choice. Taken together with the year-fixed-effects and lagged-specification results reported above, this common-estimator check indicates that the pattern of statistical significance across H1, H2, and H5 is not an artefact of using different estimators for the two outcome variables, even though the magnitude of the ESGDI-risk association remains sensitive to the inclusion of year fixed effects (Section 5.2).
6. Discussion
The results of this study, taken together, support a more nuanced picture of ESG disclosure’s role in REITs than a simple “ESG improves performance” narrative would suggest. Framed against the risk-relevance and information-signalling perspective established in Section 2.1, the central finding is not that ESG disclosure drives REIT returns—H1 finds no support, consistent with prior evidence that investors place greater weight on Funds From Operations (FFO) relative to reported earnings specifically when earnings contain larger transitory components (Stunda & Typpo, 2004) and with evidence that narrative risk disclosure in REIT filings is associated with investment decisions without significantly moving investors’ pricing of return volatility (Kim et al., 2023)—but that ESG disclosure is significantly associated with lower REIT risk in the baseline specification, providing baseline support for H2; however, this support does not survive the year-fixed-effects specification (Section 5.2). This asymmetry is itself informative: in the baseline specification, ESG disclosure is associated with risk rather than return, a pattern consistent with a possible risk-relevant information signal, consistent with meta-analytic evidence that ESG disclosure is inversely related to firm risk through stakeholder and legitimacy channels (Singhania & Gupta, 2024), with evidence that voluntary ESG disclosure lowers idiosyncratic volatility and downside tail risk (Reber et al., 2022), and with the view that ESG’s effect on expected returns operates mainly through a lower risk premium rather than a direct return premium (Cornell, 2021). This is consistent with the Signalling Theory and Stakeholder Theory foundations outlined in Section 2.1, whereby disclosure reduces information asymmetry and strengthens stakeholder confidence (Romito & Vurro, 2021) without necessarily altering the REIT’s underlying cash-generating capacity. At the same time, the substantial weakening of this risk-reducing association under a one-year lag indicates that it does not persist in the form that a durable risk-related association would imply, echoing evidence that ESG performance is generally associated with lower future stock-price crash risk but that this protective association did not hold during the COVID-19 period specifically (Thompson, 2025) and that the magnitude of ESG risk mitigation is not guaranteed to hold across longer time horizons (Palmieri et al., 2023).
This risk-channel interpretation is substantially qualified by the robustness results in Section 5. The ESGDI-risk association weakens under a one-year lag and becomes statistically indistinguishable from zero once year fixed effects are added to the same specification (Section 5.2)—a materially stronger qualification than temporal attenuation alone, since it indicates the baseline association may be confounded with common, year-specific conditions (such as the steadily rising disclosure trend documented in Section 4.1) rather than reflecting a REIT-specific disclosure-related risk association per se. Rather than refining the risk-relevance framing, this pattern requires that it be advanced considerably more cautiously than the baseline results in Section 4.3 alone would suggest: the evidence is consistent with a fragile contemporaneous association under some specifications, but it is equally consistent with the baseline association being substantially, or even entirely, an artefact of shared time trends that the main specification does not separate from ESGDI. This reading is consistent with evidence that the market pricing of ESG in real estate varies over time rather than remaining stable (Morri et al., 2024a), with evidence that ESG disclosure benefits such as lower cost of debt and higher firm value are tied to REITs’ ongoing, rather than one-off, disclosure practices (Feng & Wu, 2023), and with evidence that the frequency of ESG disclosure is associated with market performance in Taiwan, suggesting that repeated disclosure may contain information beyond a single reporting event (Liao, 2025). This signalling-based reading is not, however, the only interpretation consistent with the data, and it should not be treated as established over the alternatives. The weaker lagged-model and year-fixed-effects estimates could equally reflect lower statistical power from the reduced effective sample (172 firm-years and fewer degrees of freedom once year effects are absorbed), limited within-firm variation in ESGDI over a five-year window during which disclosure rose fairly steadily for most REITs, or residual measurement error in the disclosure index despite its high inter-rater reliability (Section 3.2), any of which could attenuate estimated coefficients independently of whether ESG disclosure has a genuine contemporaneous association. The present design cannot establish whether the contemporaneous association reflects a signalling mechanism or the alternative statistical explanations discussed above, a distinction with direct relevance for how investors and regulators should interpret annual ESG disclosure requirements, discussed further in Section 7.
The association between interest-rate conditions and REIT risk is sensitive to model specification. RATE is statistically insignificant in the baseline composite-ESGDI model (H3 is unsupported for Return in all specifications; H4 is unsupported in the baseline composite-ESGDI Risk model) but becomes positive and significant in both the disaggregated E/S/G specification and the year-fixed-effects Risk specification (Section 5.2). Accordingly, H4 receives specification-dependent rather than uniform support. The emergence of a significant RATE coefficient only in the disaggregated E/S/G and year-fixed-effects specifications indicates that the estimated RATE–Risk association is sensitive to model specification. The present analysis does not identify the underlying economic mechanism responsible for this sensitivity. The pillar-level evidence nevertheless remains consistent with prior research showing that estimates can differ when ESG is decomposed into its environmental, social, and governance components, including evidence that individual ESG pillars can carry distinct, and even opposing, implications for REIT outcomes once disaggregated (Rajajagadeesan Aroul et al., 2023), with evidence from the broader real estate sector that environmental factors are positively associated with financial performance while governance factors are associated with adverse outcomes (Morri et al., 2024b), and with meta-analytic evidence that the environmental and social pillars significantly shape REIT performance while the governance pillar does not, with the direction and significance of each pillar varying across market contexts and time periods (Zheng & Lee, 2026).
H5 is not robustly supported. The ESGDI × RATE interaction is statistically insignificant in the baseline, lagged, and common-estimator specifications. A marginal negative interaction appears only in the year-fixed-effects Risk specification (p = 0.057), indicating weak and specification-sensitive rather than consistent evidence of moderation. This pattern deserves particular attention, since it runs counter to the moderating-effect narrative advanced by several recent studies in non-REIT settings, such as evidence that ESG strategies are associated with bank stability during financial turmoil (Chiaramonte et al., 2022) and evidence of a moderating role for ESG factors in other non-REIT contexts (e.g., Shin et al., 2024). We interpret this lack of robust support not as evidence that ESG disclosure is irrelevant under monetary tightening, but as an indication that the analysis does not detect a consistent interaction with the interest-rate measure. Two complementary explanations are consistent with this pattern.
First, REIT investors in Thailand and Singapore may evaluate ESG disclosure and interest rate risk through largely separate decision channels—ESG disclosure informing assessments of governance quality and idiosyncratic risk, and interest rate conditions informing assessments of systematic, market-wide cost-of-capital risk—such that the two factors do not interact multiplicatively in investors’ risk assessments even though both matter independently. This separation is consistent with evidence that ESG disclosure benefits REITs primarily through firm-specific debt-financing and valuation channels rather than through macro-risk pricing (Feng & Wu, 2023); with evidence that stronger ESG performance is associated with lower bank loan interest rates at the individual-loan level rather than through the broader policy rate environment (Chang et al., 2026); with meta-analytic evidence that the financial relevance of ESG pillars for REITs varies by market context rather than operating as a single, uniform macro-conditioning channel (Zheng & Lee, 2026); and with evidence from Singapore-listed REITs that ESG commitments fail to cushion firm performance specifically during periods of climate policy uncertainty and economic downturns, suggesting ESG’s effect does not travel through the same channel as macro-financial shocks (Kakinuma, 2025).
Second, one speculative possibility, motivated by Morri et al.’s (2024a) broader finding that ESG-return associations are unstable across time and market conditions, is that investor attention to ESG factors could itself shift across the interest rate cycle; if investors deprioritize ESG considerations precisely when rates are elevated, any moderating effect that ESG might otherwise exert could be masked by this attentional shift rather than reflecting the absence of an underlying disclosure-related risk association. This attentional-shift explanation is not directly tested by Morri et al. (2024a) or by the present study and is offered as a plausible hypothesis for future research rather than an established finding. Distinguishing between these explanations is not possible with the present data, but both interpretations suggest caution against assuming that ESG disclosure automatically becomes a more powerful risk buffer during periods of monetary tightening—a caution reinforced by evidence that heterogeneity in firms’ equity-price sensitivity to monetary policy tightening is more clearly identified when greenness is measured using carbon emissions or carbon intensity than when broader ESG measures are used (Bauer et al., 2025)—even though disclosure remains independently associated with lower risk in the baseline model.
Finally, the absence of significant country-level heterogeneity (Section 4.4), despite substantial differences in disclosure levels, leverage, and firm size between Thailand and Singapore, should be interpreted cautiously rather than as evidence that the two markets are economically equivalent. As discussed in Section 4.4, the country-interaction tests draw on a relatively small sample split by country and may simply lack the statistical power to detect true cross-country differences; a non-significant interaction term is not, on its own, evidence of an absent effect. The most defensible reading is that this study did not find statistically significant evidence of country-level heterogeneity in the ESGDI-risk or RATE-risk relationships, which is a different and weaker claim than asserting that the relationship “holds across both markets” or is “generalizable.” This finding is therefore reported as a null result on heterogeneity, alongside the broader caution that the central ESGDI-risk association itself is highly sensitive to model specification (Section 5.2) and should not be treated as an established, structural feature of ESG disclosure in REITs.
A final interpretive caveat, flagged theoretically in Section 2.1, deserves restating here. The observed ESGDI-risk association is consistent with the signalling and stakeholder-based mechanisms emphasized above, but it is equally consistent with a firm-quality explanation under which better-managed REITs—with stronger governance, more conservative leverage, and greater financial slack—both disclose more extensively and independently exhibit lower risk, with ESG disclosure acting as an observable proxy for this underlying quality rather than an independent cause of lower risk. The present analysis, based on observational panel data and a one-year lag rather than an instrumental-variable or quasi-experimental design, cannot cleanly separate these two accounts. Both should therefore be regarded as plausible interpretations of the ESGDI-risk association reported here, and this ambiguity is carried forward into the limitations discussed in Section 7.2.
7. Conclusions, Limitations, and Future Research
This study examined the relationship between ESG disclosure and the risk-adjusted performance of REITs listed in Thailand and Singapore between 2021 and 2025, framing ESG disclosure as a potential signal relevant to REIT risk assessment rather than as a direct performance driver. Using a self-constructed ESG Disclosure Index applied to a panel of 43 REITs comprising 215 REIT-year disclosure observations, we find that ESG disclosure is significantly associated with lower REIT risk in the baseline specification but shows no significant association with returns and that interest rate conditions do not significantly moderate this relationship in the baseline, lagged, or common-estimator specifications. A marginal negative interaction appears only in the year-fixed-effects Risk specification; therefore, H5 is not robustly supported. Critically, robustness checks in Section 5 indicate that both the ESGDI-risk and RATE-risk relationships are sensitive to model specification, though in different directions. The baseline risk association is not robust: it weakens under a one-year lag and becomes statistically indistinguishable from zero once year fixed effects are added (Section 5.2), indicating that the association is highly sensitive to model specification and may reflect common, year-specific conditions—including the rising disclosure trend documented in Section 4.1—rather than a stable, REIT-specific effect of ESG disclosure on risk. In parallel, and unexpectedly, RATE—which is not statistically significant in the baseline Risk model—becomes significant and positive once year fixed effects are added to the Risk equation (Section 5.2), indicating that higher interest rates are associated with significantly higher REIT risk once common year-specific shocks are separated from ESGDI’s within-panel trend. RATE remains statistically insignificant for Return under year fixed effects, so this shift is specific to the Risk equation rather than a general strengthening of the interest-rate channel. Taken together, these robustness results indicate that within the Risk equation specifically, year fixed effects reveal a more consequential role for interest rate conditions than the baseline model suggests, while simultaneously revealing the baseline ESGDI-risk association to be less robust than it first appears—both findings underscoring that conclusions drawn from a single baseline specification in a panel of this size should be treated with caution. These findings extend the ESG-REIT literature, which has been concentrated in developed markets, to a Southeast Asian comparative setting and contribute methodologically by explicitly testing the temporal and specification robustness of the ESG-risk association rather than relying solely on a contemporaneous specification—robustness testing that, in this instance, substantially qualifies rather than confirms the baseline finding.
7.1. Key Policy Insights
These findings carry several implications for investors, REIT managers, and regulators, though they should be read cautiously given the sensitivity of the central risk finding documented in Section 5.2. First, for institutional and retail investors, the baseline results suggest that ESG disclosure may carry some value as a risk-screening signal rather than as a return-predicting one; however, because this risk association is not robust to year fixed effects, investors should not treat ESG disclosure as a reliably priced risk indicator on the basis of this study alone and should weigh it alongside more established, firm-specific risk metrics. Second, for REIT managers, the attenuation of the association under a one-year lag raises the possibility that the informational relevance of disclosure may be time-sensitive. This interpretation remains speculative because the study does not directly compare reporting frequencies or disclosure events. Third, for regulators in Thailand and Singapore, who continue to develop and tighten ESG disclosure requirements for listed REITs, these results are consistent with the potential informational value of regular and comparable disclosure but do not establish that more frequent or mandatory reporting reduces REIT risk, given that the observed risk association does not appear to be automatically self-sustaining across time; given the study’s observational design, short sample period, and two-market scope, this is best read as a modest, context-specific consideration for policymakers rather than a general prescription for mandatory disclosure regulation. Fourth, and importantly, the absence of a robust moderating effect across specifications between ESG disclosure and interest rate conditions means that the analysis does not detect a robust interaction between ESG disclosure and the interest-rate measure. Accordingly, ESG disclosure should not be interpreted or marketed as a demonstrated hedge against monetary tightening on the basis of the present evidence.
7.2. Limitations and Future Research
This study has several limitations that suggest avenues for future research. First, the sample comprises 43 REITs observed over five years (215 firm-year observations, reduced to 172 under the lagged specification), which, while appropriate for the scope of a comparative two-country study, limits statistical power and precludes the use of panel Granger causality testing, which requires a longer time dimension than the present data provide. Future studies extending the panel to ten years or more, as ESG reporting histories in Southeast Asia lengthen, would be better positioned to test temporal precedence using panel Granger-causality methods, while recognizing that such tests do not by themselves establish structural causality.
Second, the ESG Disclosure Index developed in this study, while enabling uniform coverage of REITs not rated by commercial ESG data providers, has not been formally validated against established commercial ESG scores (e.g., MSCI, Refinitiv, Sustainalytics). A preliminary check identified publicly visible commercial ESG coverage for only a small subset of the sample, consisting of larger-capitalization Singaporean REITs. However, the information was limited to selected recent observations and did not provide a consistent historical panel for 2021–2025; consequently, a formal correlation-based validation could not be conducted. A proper correlation-based validation exercise would additionally require institutional (subscription-based) access to these providers’ full historical databases, which was not available for this study. This coverage pattern is consistent with the motivation for constructing a disclosure-based ESGDI in the first place: commercial ESG rating coverage of Southeast Asian REITs, and of Thai REITs in particular, remains sparse. This absence of external validation is addressed here through transparent disclosure of the limitation rather than through an empirical validation exercise. Future research with institutional access to broader or longer-run commercial ESG data would be well positioned to conduct a full correlation-based validation and clarify how the ESGDI relates to market-based ESG assessments.
Third, this study did not employ instrumental variable or system GMM approaches to address endogeneity, given the sample size constraints discussed in Section 3.5; while the lagged-ESGDI robustness check in Section 5.1 partially addresses reverse causality concerns, it does not fully resolve them. Future research with larger, longer-panel datasets could apply these more demanding identification strategies, where a dynamic specification and theoretically credible instruments are available, to further strengthen causal inference in this setting.
Fourth, the ESGDI measures the extent of ESG-related information a REIT discloses, not its underlying ESG performance or the quality of its environmental, social, and governance outcomes; these two constructs are conceptually distinct, and the present design cannot establish which one is performing the analytical work in the observed ESGDI-risk association. Relatedly, this study cannot fully distinguish a disclosure-based signalling mechanism from a firm-quality explanation, under which better-managed REITs both disclose more and independently carry lower risk. Future research combining disclosure-based indices with independent measures of ESG or governance performance, or with quasi-experimental variation in disclosure requirements, would help to adjudicate between these explanations.
Fifth, the control variables in Table 2 do not exhaust the set of factors that plausibly affect REIT return and risk. Broader capital-market conditions—including equity-market returns, aggregate market volatility, exchange rate movements, market liquidity, and credit spreads—are not modelled here, and the resulting associations may in principle absorb some of this omitted-variable influence, particularly given the substantial differences in market structure and international investor exposure between Thailand and Singapore. Data limitations, particularly for consistent, comparable liquidity and credit-spread series across both markets over 2021–2025, precluded their inclusion in the present study. Future research incorporating these market-level controls, where comparable data become available, would help to establish whether the ESGDI-risk and RATE-risk associations reported here are robust to a fuller set of capital-market determinants.
Sixth, this study focused on two ASEAN REIT markets; extending the comparative framework to other Southeast Asian markets with emerging REIT regimes, such as Malaysia, the Philippines, or Vietnam, would help establish whether the ESGDI-risk association identified here generalizes more broadly across the region’s diverse regulatory and institutional environments. Seventh, and finally, broader country-year macroeconomic conditions—GDP growth and inflation—were considered but ultimately excluded from the main models, since both vary only at the country-year level, like RATE, and their inclusion alongside RATE in a panel with only two countries and five years would introduce severe collinearity among the three variables, destabilizing all of their coefficient estimates rather than cleanly isolating each one’s effect. Descriptive statistics for GDP and INF are reported in Section 4.1 for context, but their potential independent associations with REIT return and risk are not estimated in this study. Future research with a longer panel, spanning more distinct country-year macroeconomic observations, would have sufficient identifying variation to include GDP, inflation, and RATE simultaneously and thereby separate their effects.
Supplementary Materials
The following supporting information can be downloaded: https://www.mdpi.com/article/10.3390/jrfm19080590/s1, Supplementary Material S1: ESG Disclosure Index (ESGDI): Coding Protocol and Scoring Rubric, detailing the data sources, binary scoring rule, and full list of the 15 disclosure indicators used to construct the ESGDI reported in Section 3.2.
Author Contributions
Conceptualization, C.P. and A.A.; methodology, C.P.; software, C.P.; validation, C.P. and A.A.; formal analysis, C.P.; investigation, C.P.; resources, C.P. and A.A.; data curation, C.P.; writing—original draft preparation, C.P.; writing—review and editing, A.A.; visualization, C.P.; supervision, A.A.; project administration, A.A. All authors have read and agreed to the published version of the manuscript.
Funding
This research received no external funding.
Institutional Review Board Statement
Not applicable.
Informed Consent Statement
Not applicable.
Data Availability Statement
The ESG Disclosure Index (ESGDI) scores underlying this study were manually constructed by the authors through content analysis of publicly available annual reports, sustainability reports, and, for Thai REITs, Form 56-1 One Reports of the sample REITs. Financial and macroeconomic data were obtained from company filings, stock exchange databases, and central bank publications. The full ESGDI coding protocol and scoring rubric are provided as Supplementary Material S1. The compiled numerical dataset is available from the corresponding author upon reasonable request.
Acknowledgments
During the preparation of this manuscript, the authors used ChatGPT (OpenAI, GPT-5.5 Instant) and Claude (Anthropic, Claude Sonnet 5 Medium) to assist with language editing, grammar refinement, and improving the clarity and readability of the manuscript. The authors reviewed and edited all AI-assisted outputs and take full responsibility for the content of this publication.
Conflicts of Interest
The authors declare no conflicts of interest.
References
- Abubakr, A. A. M., Mohammed, A. A. A., Sahal, M. S. G., Ali, M. A., & Hussin, H. A. A. A. (2025). Do ESG disclosure scores drive financial success? A dynamic panel analysis of Thai firms. Asian Economic and Financial Review, 15(3), 367–382. [Google Scholar] [CrossRef] [Scilit]
- Albuquerque, R., Koskinen, Y., Yang, S., & Zhang, C. (2020). Resiliency of environmental and social stocks: An analysis of the exogenous COVID-19 market crash. Review of Corporate Finance Studies, 9(3), 593–621. [Google Scholar] [CrossRef] [Scilit] [PubMed]
- Arellano, M., & Bond, S. (1991). Some tests of specification for panel data: Monte Carlo evidence and an application to employment equations. Review of Economic Studies, 58(2), 277–297. [Google Scholar] [CrossRef] [Scilit]
- Bank of Thailand. (n.d.). Policy interest rate. Available online: https://www.bot.or.th/en/our-roles/monetary-policy/mpc-publication/policy-interest-rate.html (accessed on 29 July 2026).
- Bauer, M. D., Offner, E. A., & Rudebusch, G. D. (2025). Green stocks and monetary policy shocks: Evidence from Europe. European Economic Review, 177, 105044. [Google Scholar] [CrossRef] [Scilit]
- Blundell, R., & Bond, S. (1998). Initial conditions and moment restrictions in dynamic panel data models. Journal of Econometrics, 87(1), 115–143. [Google Scholar] [CrossRef] [Scilit]
- Chang, C.-J., Yen, P.-F., Wang, H.-W., & Chang, Y. (2026). ESG performance and bank loan interest rates. Journal of Applied Finance & Banking, 16(1), 67–120. [Google Scholar] [CrossRef] [Scilit] [PubMed]
- Chiaramonte, L., Dreassi, A., Girardone, C., & Piserà, S. (2022). Do ESG strategies enhance bank stability during financial turmoil? Evidence from Europe. European Journal of Finance, 28(12), 1173–1211. [Google Scholar] [CrossRef] [Scilit]
- Coën, A., & Guardiola, P. (2025). How Brexit changed the dynamics of UK commercial real estate: Evidence from the roles of domestic and foreign monetary policies. Journal of Property Investment & Finance, 43(4), 389–418. [Google Scholar] [CrossRef] [Scilit]
- Cornell, B. (2021). ESG preferences, risk and return. European Financial Management, 27(1), 12–19. [Google Scholar] [CrossRef] [Scilit]
- Danila, N. (2025). Interconnected dynamics of REITs and other financial instruments in ASEAN: A comprehensive analysis. Cogent Economics & Finance, 13(1), 2468388. [Google Scholar] [CrossRef] [Scilit]
- Delmas, M. A., & Burbano, V. C. (2011). The drivers of greenwashing. California Management Review, 54(1), 64–87. [Google Scholar] [CrossRef] [Scilit]
- Detthamrong, U., Klangbunrueang, R., Chansanam, W., & Dasri, R. (2026). The impact of ESG performance on financial performance: Evidence from listed companies in Thailand. Forecasting, 8(1), 14. [Google Scholar] [CrossRef] [Scilit]
- Dumitrescu, E.-I., & Hurlin, C. (2012). Testing for Granger non-causality in heterogeneous panels. Economic Modelling, 29(4), 1450–1460. [Google Scholar] [CrossRef] [Scilit]
- Fatemi, A., Glaum, M., & Kaiser, S. (2018). ESG performance and firm value: The moderating role of disclosure. Global Finance Journal, 38, 45–64. [Google Scholar] [CrossRef] [Scilit]
- Feng, Z., & Wu, Z. (2023). ESG disclosure, REIT debt financing and firm value. Journal of Real Estate Finance and Economics, 67(3), 388–422. [Google Scholar] [CrossRef] [Scilit] [PubMed]
- Freeman, R. E. (1984). Strategic management: A stakeholder approach. Pitman. [Google Scholar]
- Friede, G., Busch, T., & Bassen, A. (2015). ESG and financial performance: Aggregated evidence from more than 2000 empirical studies. Journal of Sustainable Finance & Investment, 5(4), 210–233. [Google Scholar] [CrossRef] [Scilit]
- Kakinuma, Y. (2025). ESG in real estate: Sustainability for financial gains or overinvestment by REITs? Journal of Property Investment & Finance, 43(6), 631–648. [Google Scholar] [CrossRef] [Scilit]
- Kim, D., Lim, D., & Wiley, J. A. (2023). Narrative investment-risk disclosure & REIT investment. Journal of Real Estate Finance and Economics, 66(2), 542–567. [Google Scholar] [CrossRef] [Scilit]
- Landis, J. R., & Koch, G. G. (1977). The measurement of observer agreement for categorical data. Biometrics, 33(1), 159–174. [Google Scholar] [CrossRef] [Scilit]
- Liao, C. (2025). ESG disclosure frequency and its association with market performance: Evidence from Taiwan. Sustainability, 17(17), 7812. [Google Scholar] [CrossRef] [Scilit]
- Lopez, L., & Weber, S. (2017). Testing for Granger causality in panel data. The Stata Journal, 17(4), 972–984. [Google Scholar] [CrossRef] [Scilit]
- Malik, N., & Kashiramka, S. (2025). ESG disclosure and its impact on firm leverage: Moderating role of quality of financial reporting and financial constraints. Global Finance Journal, 65, 101099. [Google Scholar] [CrossRef] [Scilit]
- Monetary Authority of Singapore (MAS). (n.d.-a). Singapore’s monetary policy framework. Available online: https://www.mas.gov.sg/monetary-policy/singapores-monetary-policy-framework (accessed on 29 July 2026).
- Monetary Authority of Singapore (MAS). (n.d.-b). SORA and SORA-related benchmarks. Available online: https://www.mas.gov.sg/-/media/MAS/SORA/Methodology-document (accessed on 29 July 2026).
- Monetary Authority of Singapore (MAS). (2024). MAS rationalises leverage requirements and introduces additional disclosures for REITs [Press release]. Available online: https://www.mas.gov.sg/news/media-releases/2024/mas-rationalises-leverage-requirements-and-introduces-additional-disclosures-for-reits (accessed on 29 June 2026).
- Morri, G., Dipierri, A., & Colantoni, F. (2024a). ESG dynamics in real estate: Temporal patterns and financial implications for REITs returns. Journal of European Real Estate Research, 17(2), 263–285. [Google Scholar] [CrossRef] [Scilit]
- Morri, G., Yang, F., & Colantoni, F. (2024b). Green investments, green returns: Exploring the link between ESG factors and financial performance in real estate. Journal of Property Investment & Finance, 42(5), 435–452. [Google Scholar] [CrossRef] [Scilit]
- Palmieri, E., Geretto, E. F., & Polato, M. (2023). ESG default risk mitigation effect: A time-sectorial analysis. In S. Carbó-Valverde, & P. J. Cuadros-Solas (Eds.), New challenges for the banking industry (pp. 79–98). Palgrave Macmillan. [Google Scholar] [CrossRef] [Scilit]
- Rajajagadeesan Aroul, R., Carstens, R., & Freybote, J. (2023). It’s all in the detail: Individual ESG factors and firm value [Working paper]. SSRN. [Google Scholar] [CrossRef] [Scilit]
- Rajajagadeesan Aroul, R., Sabherwal, S., & Villupuram, S. V. (2022). ESG, operational efficiency and operational performance: Evidence from real estate investment trusts. Managerial Finance, 48(8), 1206–1220. [Google Scholar] [CrossRef] [Scilit]
- Reber, B., Gold, A., & Gold, S. (2022). ESG disclosure and idiosyncratic risk in initial public offerings. Journal of Business Ethics, 179(3), 867–886. [Google Scholar] [CrossRef] [Scilit]
- REIT Association of Singapore (REITAS). (n.d.). Overview of the S-REIT industry. Available online: https://www.reitas.sg/singapore-reits/overview-of-the-s-reit-industry/ (accessed on 29 July 2026).
- Romito, S., & Vurro, C. (2021). Non-financial disclosure and information asymmetry: A stakeholder view on US listed firms. Corporate Social Responsibility and Environmental Management, 28(2), 595–605. [Google Scholar] [CrossRef] [Scilit]
- Roodman, D. (2009). A note on the theme of too many instruments. Oxford Bulletin of Economics and Statistics, 71(1), 135–158. [Google Scholar] [CrossRef] [Scilit]
- Sassen, R., Hinze, A.-K., & Hardeck, I. (2016). Impact of ESG factors on firm risk in Europe. Journal of Business Economics, 86(8), 867–904. [Google Scholar] [CrossRef] [Scilit]
- Securities and Exchange Commission Thailand (SEC). (n.d.). Real estate investment trust. Available online: https://www.sec.or.th/EN/pages/lawandregulations/realestateinvestmenttrust.aspx (accessed on 29 July 2026).
- Securities and Exchange Commission Thailand (SEC). (2024). Public consultation Aor Sor Yor. 50/2567 on the principle of Thailand sustainability disclosure roadmap regarding international sustainability standards (ISSB roadmap). Available online: https://www.sec.or.th/Documents/PHS/Main/1030/hearing502567en.pdf (accessed on 29 June 2026).
- Shin, H., Song, H. J., & Kang, K. H. (2024). The moderating effect of interest rates on the relationship between ESG and firm performance in the US restaurant industry. Journal of Sustainable Tourism, 33(8), 1553–1570. [Google Scholar] [CrossRef] [Scilit]
- Singapore Exchange (SGX). (n.d.). Sustainability reporting. Available online: https://www.sgx.com/sustainable-finance/sustainability-reporting (accessed on 29 July 2026).
- Singhania, M., & Gupta, D. (2024). Impact of Environmental, Social and Governance (ESG) disclosure on firm risk: A meta-analytical review. Corporate Social Responsibility and Environmental Management, 31(4), 3573–3613. [Google Scholar] [CrossRef] [Scilit]
- Stunda, R. A., & Typpo, E. (2004). The relevance of earnings and funds flow from operations in the presence of transitory earnings. Journal of Real Estate Portfolio Management, 10(1), 37–45. [Google Scholar] [CrossRef] [Scilit]
- Thompson, E. K. (2025). ESG and stock price crash risk mitigation: Evidence from Korea. Humanities and Social Sciences Communications, 12, 278. [Google Scholar] [CrossRef] [Scilit]
- Wang, S., Gupta, R., Bonato, M., & Çepni, O. (2025). The effects of conventional and unconventional monetary policy shocks on US REITs moments: Evidence from VARs with functional shocks. The Journal of Real Estate Finance and Economics, 71(4), 642–702. [Google Scholar] [CrossRef] [Scilit]
- Wooldridge, J. M. (2010). Econometric analysis of cross section and panel data (2nd ed.). MIT Press. [Google Scholar]
- Zheng, Z., & Lee, C. L. (2026). A meta-analysis of ESG factors in the real estate investment trusts sector: Exploring their impacts on REITs performance. Engineering, Construction and Architectural Management, 33(3), 2314–2334. [Google Scholar] [CrossRef] [Scilit]
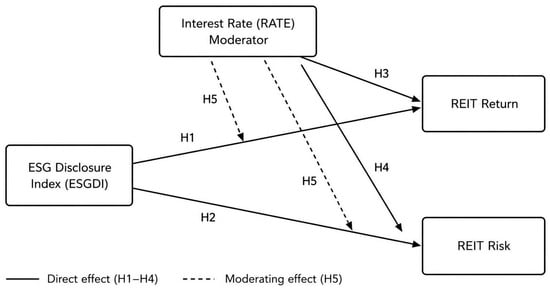
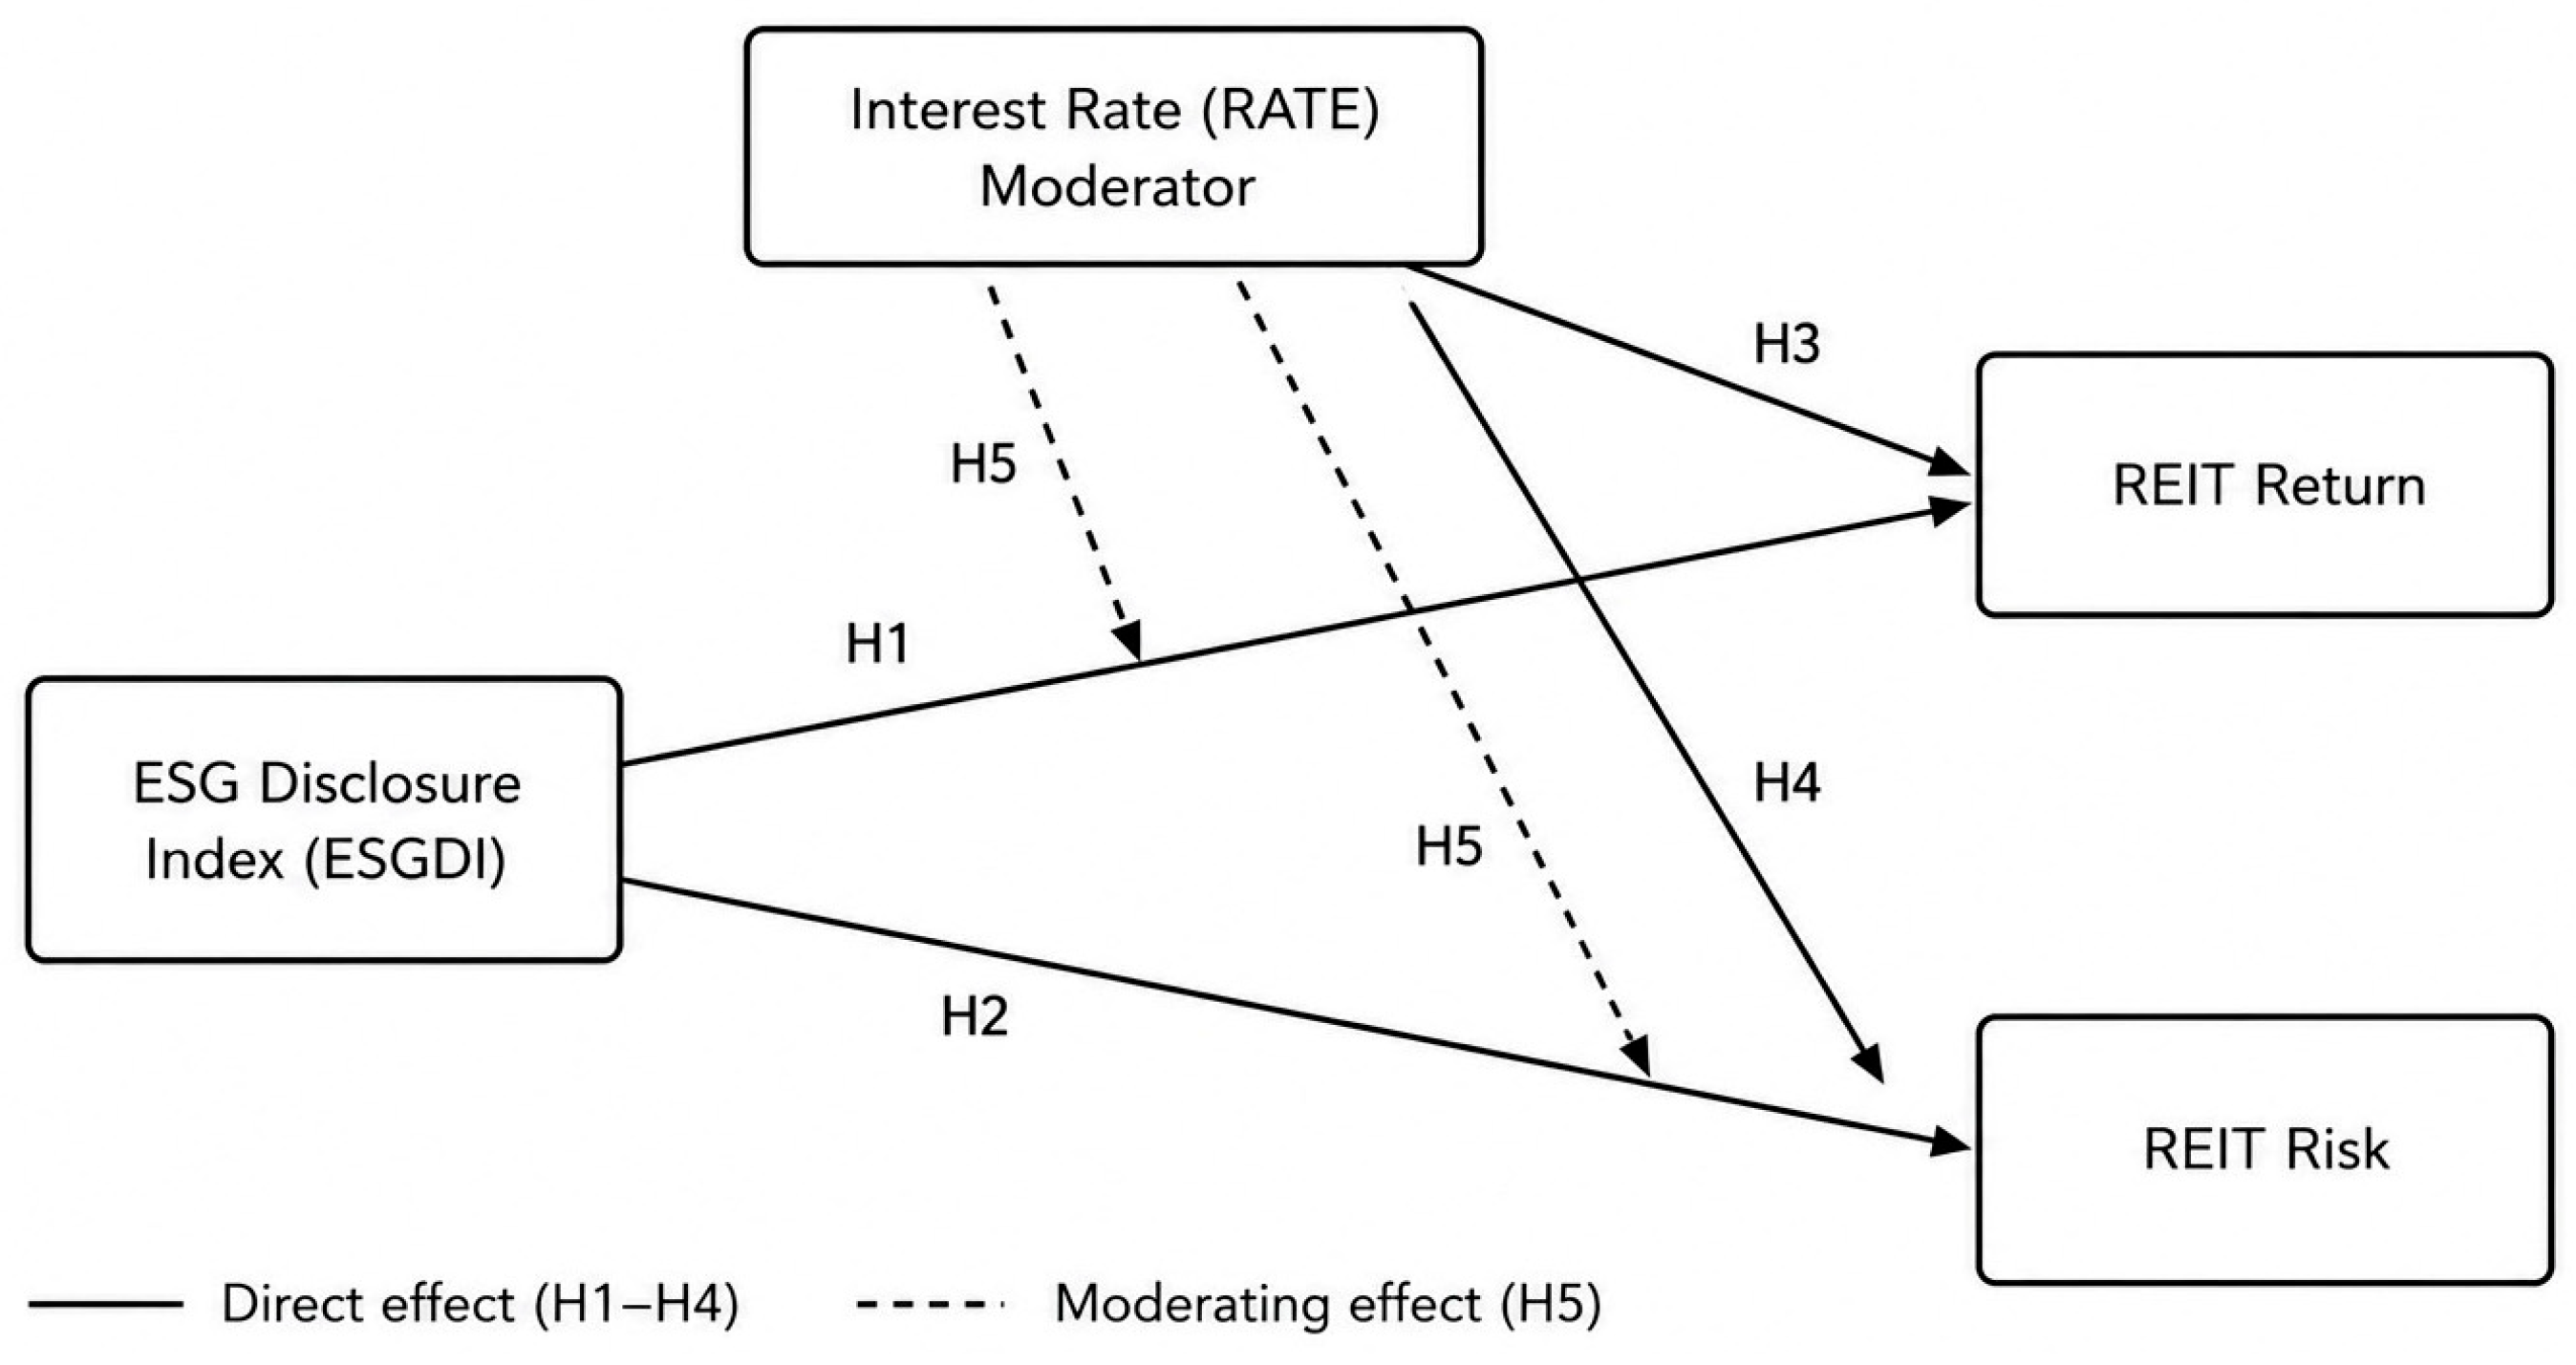

Disclaimer/Publisher’s Note: The statements, opinions and data contained in all publications are solely those of the individual author(s) and contributor(s) and not of MDPI and/or the editor(s). MDPI and/or the editor(s) disclaim responsibility for any injury to people or property resulting from any ideas, methods, instructions or products referred to in the content. |
© 2026 by the authors. Licensee MDPI, Basel, Switzerland. This article is an open access article distributed under the terms and conditions of the Creative Commons Attribution (CC BY) license.