


Abstract
This paper studies how artificial-intelligence (AI) disclosure in the Item 1A risk factors of S&P 500 10-K filings evolved between fiscal years 2015 and 2025. It asks three questions: when AI disclosure became common in Item 1A; whether firm characteristics explain which firms disclose and whether that power changes as disclosure spreads; and whether firms that write more AI text write less firm-specific AI language. The data are a panel of 5214 firm-years for the 501 firms in the S&P 500 as of April 2026, so the sample is subject to survivor bias; the coverage gap relative to the historical index is about 38% in 2015 and falls to 2% by 2025. AI mentions come from a hand-validated keyword dictionary, and a lexical distinctiveness score measures how far a firm’s AI wording departs from that of its peers in the same year; the score captures wording, not informational content or quality. Three results follow. First, the share of firms disclosing AI in Item 1A rises from 0.7% to 77.6%, with the largest jump in the first filing cycle after the November 2022 release of ChatGPT. Second, the power of firm characteristics to discriminate disclosers falls as disclosure saturates: the disclosure logit’s pseudo-R2 drops from 0.24 to 0.03 and the area under the ROC curve from 0.86 to 0.61. Third, among disclosing firm-years, more AI text is associated with lower lexical distinctiveness. These associations are descriptive; this paper does not test causal mechanisms.
JEL Classification:
G14; G30; M41; O33
1. Introduction
Between fiscal year 2022 and fiscal year 2024, the share of S&P 500 firms that disclose artificial intelligence (AI) as a risk factor in Item 1A of their 10-K filings rose from 17% to 61%. In fiscal 2025, the share was 77.6%. The change happened immediately after the public release of ChatGPT on 30 November 2022, which placed generative AI into board-level discussions within weeks.
This paper examines AI disclosure in S&P 500 10-K filings and asks three questions about it. The first question is descriptive: when did AI disclosure become common in Item 1A, and what is the shape of the year-by-year curve? The second question is whether observable firm characteristics (size, profitability, R&D intensity, industry-level AI exposure) explain which firms disclose and whether their explanatory power changes over time. The third question is whether, conditional on disclosing, the volume of AI text is associated with the firm-specific content of that text.
The motivation for the third question is the disclosure-length literature in accounting. Dyer et al. (2017) document that 10-K filings have grown substantially in length between 1996 and 2013 while their information content has not grown in parallel. Hope et al. (2016) show that more specific risk-factor disclosures are associated with stronger market reactions and a lower cost of equity. The AI disclosure setting offers a clean opportunity to look at this association. AI risk language arrives as a sharp topical shock with little prior history, and the topic is new enough that early disclosures and late disclosures may differ in informational content.
There are three contributions. First, this paper documents the time pattern of AI disclosure at firm-year resolution for the entire current S&P 500 over 11 years, with explicit attention to the difference between fiscal year and filing year and to the role of the ChatGPT release. Second, this paper introduces a corpus-level lexical distinctiveness score that is based on a leave-one-firm-out term-frequency–inverse-document-frequency (TF-IDF) similarity to peer filings (each firm’s AI text is compared with the combined AI text of all other firms in the same year). The score is reproducible from public data, transparent, and can be applied to any keyword-defined disclosure topic. Third, this paper provides evidence that, in the AI disclosure setting, length and firm-specific content are negatively associated. This evidence is consistent with the disclosure-length literature, although the design here cannot identify the causal mechanism. Throughout, the lexical distinctiveness score is treated as a measure of firm-specific wording relative to peer disclosures, not as a measure of the amount or quality of information disclosed; the distinction is developed in Section 2.3.
Several limitations are important and they shape what this paper claims. The sample is the set of S&P 500 firms as of April 2026. Looking back to 2015 with this current-constituent sample introduces survivor bias. Firms that left the index between 2015 and 2025 are excluded, and these firms are likely on average smaller and less technology-focused. We do not reconstruct the historical S&P 500 composition in this paper and we restrict our claims to the current S&P 500 universe. The dictionary is validated on 11 years of Agilent Technologies filings, a single firm. A stratified sample-validation across sectors and years is desirable and we list this as the most important data-side improvement to make in future revisions. The lexical distinctiveness score measures lexical dissimilarity from peer filings; it does not directly measure informational content. This paper discusses what the score does and does not capture in Section 2.3.
This paper relates to four strands of the literature.
The first strand is textual analysis of 10-K filings. Loughran and McDonald (2011) develop the finance-specific word lists used to measure tone in regulatory filings. Campbell et al. (2014) show that mandatory risk-factor disclosures contain firm-specific information beyond boilerplate. Hope et al. (2016) introduce a specificity measure for risk-factor language and document that more specific disclosure is associated with stronger market reactions and a lower cost of equity. Lang and Stice-Lawrence (2015) develop boilerplate metrics for international filings and link them to liquidity and analyst following. Dyer et al. (2017) document that 10-K length grew sharply between 1996 and 2013 while specificity, readability, and the share of hard information all declined. The present paper contributes a corpus-level lexical distinctiveness score and applies it to a new disclosure topic that arrived as a sharp cohort-level shock.
The second strand is the AI-finance literature, which has expanded since 2021. Felten et al. (2021) construct an occupation-level AI exposure index aggregated to four-digit North American Industry Classification System (NAICS) industries. The index is pre-determined with respect to firm-level disclosure decisions and is a useful source of cross-sectional exposure variation in this study. Babina et al. (2024) propose a firm-level AI investment measure based on employee resumes and document that AI-investing firms experience higher growth in sales, employment, and market valuations. Eisfeldt et al. (2023) construct a firm-level workforce exposure measure to generative AI and show that an Artificial-Minus-Human portfolio earned 5% in the two weeks after the ChatGPT release. These papers establish that firm-level AI exposure is measurable, persistent, and priced. The present paper differs from them in that it studies AI as the subject of mandatory corporate disclosure rather than as a technology shock applied to firm operations or workforce.
The third strand is recent work on AI specifically in the context of corporate filings. Marin et al. (2025) provide a systematic analysis of AI risk disclosures in SEC 10-K forms and find that 91% of AI mentions occur in Items 1, 1A, and 7. Their finding motivates the section-level extraction strategy adopted here. This paper extends Marin et al. (2025) by integrating disclosure measurement with firm-level financials and pre-determined industry exposure indices, by introducing a leave-one-firm-out lexical distinctiveness measure, and by covering the full 11-year window at firm-year resolution.
The methodological contribution also connects to the broader use of text-mining tools, term-frequency methods, and AI-related dictionary work in finance research. The leave-one-firm-out TF-IDF lexical distinctiveness score introduced here is reproducible from public data and applicable to any keyword-defined emerging disclosure topic in financial services, including blockchain, cybersecurity, and digital assets.
The fourth strand is the literature on disclosure responses to regulatory and informational shocks. The shift documented in this paper has features in common with prior episodes such as the introduction of cybersecurity risk-factor language after the 2011 SEC guidance and climate risk disclosure after the 2010 SEC guidance. In each case, a new topical category was added to risk-factor inventories, with early adopters often differing in observable ways from later adopters.
A simple conceptual frame links these disclosure incentives to the textual outcomes this paper measures. A firm choosing AI risk-factor language faces two margins: an extensive margin (whether to name AI as a risk at all) and an intensive margin (how much to write, and how firm-specific the wording is). Both margins respond to the incentives emphasized in the disclosure literature. Litigation and regulatory exposure push firms toward disclosing salient risks and toward language that peers and counsel treat as adequate, while proprietary and reputational costs push in the opposite direction. The legal and regulatory channel is concrete in this setting: securities-class-action and SEC-enforcement risk attach to omitted or misleading risk factors, and the SEC’s 2011 cybersecurity guidance and 2010 climate guidance illustrate how a new topical category, once flagged by regulators and the plaintiff bar, diffuses rapidly into risk-factor inventories and converges on common wording supplied by outside counsel. The frame predicts the three findings: an extensive-margin S-curve as the topic becomes a standard risk factor (Finding 1); a weakening link between firm characteristics and the disclosure decision as disclosure becomes near-universal and incentive-driven rather than fundamentals-driven (Finding 2); and a negative intensive-margin association between volume and firm-specific wording as longer disclosures draw on shared template language (Finding 3). The frame motivates the measures but does not by itself identify which incentive dominates; this paper documents the textual outcomes and is explicit about what the design can and cannot separate.
The rest of this paper is organized as follows. Section 2 describes the data and the measurement strategy and presents the econometric models. Section 3 reports the three main results. Section 4 discusses what the findings imply for researchers using AI disclosure as a proxy and for the disclosure-length literature, with attention to what the present design can and cannot identify. Section 5 reports robustness checks. Section 6 concludes.
2. Data and Methodology
2.1. Sample and Time Dimension
The sample is all annual 10-K filings made by firms that are constituents of the S&P 500 index as of April 2026, with fiscal year-ends between 1 January 2015 and 31 December 2025. The sample is therefore a current-constituent panel observed retrospectively. The implication is that firms which were in the index in 2015 but exited before April 2026, and firms which entered the index after 2015 but were not in the index in earlier years, are treated symmetrically: both are included in all years in which they have an available 10-K filing. The same firm appears in the panel as long as it has a 10-K on SEC EDGAR between 2015 and 2025, regardless of when it joined or left the S&P 500.
This sampling choice is a source of survivor bias, and the size of the bias is non-trivial. Point-in-time S&P 500 constituent histories on the basis of S&P Dow Jones Indices announcements show that the index had 502 constituents at year-end 2015, of which 190 (37.8%) are absent from the April 2026 panel used in this paper; this is the 2015 coverage gap. The share of “missing” firms declines monotonically toward 2025 because firms that were in the index in 2024 are largely still in the index in April 2026. Across the full panel period, 233 unique firms were in the S&P 500 at some point between 2015 and 2025 but are not in the current-constituent panel, for a total of about 1063 missing firm-years against the 5214 in the panel (roughly 17% of the true historical universe). We report the coverage gap on this historical-components basis throughout, so the 37.8% here, the approximately 38% in the abstract, and the 37.8% reported in Section 5.2 are the same figure. An alternative point-in-time source, the fja05680/sp500 snapshot, places the 2015 gap about three percentage points lower (34.9%, 175 of 502); the difference does not affect the survivor-bias bounds or the entry event study.
The composition of missing firms is not random with respect to AI exposure. The notable AI-relevant missing firms include NUAN (Nuance Communications, a major speech-recognition firm acquired by Microsoft in April 2022 with the AI use case explicitly cited), XLNX (Xilinx, an AI-relevant chip designer acquired by AMD in February 2022), CERN (Cerner, a healthcare-AI vendor acquired by Oracle in June 2022), FB (Meta’s pre-rename ticker, technology and AI), ATVI (Activision Blizzard, gaming AI, acquired by Microsoft in October 2023), VAR (Varian Medical, AI in oncology, acquired by Siemens in April 2021), and CTXS (Citrix, software, acquired in 2022). Most of these firms exited because of acquisitions rather than for poor performance, and many of the acquirers cited AI capabilities as part of the rationale. Excluding these firms biases the early-period AI disclosure share downward in the panel.
Reweighting to historical composition would lower the disclosure share in early years (the missing firms tend to be at least as AI-relevant as the surviving firms, but in earlier years), which would steepen the S-curve in Section 3.1, not reverse it. We discuss the implications in Section 5.2. We restrict the claims of this paper to current S&P 500 constituents (as of April 2026) and we do not make general claims about the S&P 500 as a historical universe. Section 5.2 reports the year-by-year size of the gap and discusses the direction of the bias.
This paper distinguishes between fiscal year and filing year. The fiscal year is the year of the firm’s fiscal year-end. The filing year is the calendar year in which the 10-K was filed with the SEC. The two differ by an average of three months. A firm with a December 2022 fiscal year-end typically files its 10-K in February or March 2023; we then refer to the filing as fiscal year 2022 (the year of the period covered) but filing year 2023. ChatGPT was released on 30 November 2022, which is inside the fiscal year of December-year-end firms. The bulk of the post-ChatGPT disclosure response is therefore in fiscal year 2023 and fiscal year 2024 filings, which were filed in calendar years 2023, 2024, and 2025. Throughout this paper, “fiscal year” is the default; “filing year” is used when the filing-cycle timing is the relevant unit.
Filings are downloaded from EDGAR in HTML, parsed with BeautifulSoup (beautifulsoup4 (4.12.0)), using the lxml parser and converted to clean UTF-8 text. Three sections are extracted from each filing: Item 1 (Business), Item 1A (Risk Factors), and Item 7 (Management’s Discussion and Analysis, MD&A). These three sections account for about 91% of AI mentions in 10-K filings (Marin et al., 2025). Section extraction uses regular-expression anchors on Item headers, with a heuristic that skips the Table of Contents by ignoring the first cluster of Item headers if separated by less than 5000 characters. The extraction procedure was validated by hands-on review of 11 years of 10-K filings from a sample firm, Agilent Technologies, and produced zero false positives in that validation. Section 5.1 discusses the dictionary validation in more detail, and the conclusion (Section 6) lists stratified sample validation as the most important data-side robustness check to add.
Multiple filings for the same ticker-fiscal year (typically 10-K/A amendments) are de-duplicated by keeping the earliest filing. De-duplication drops 209 observations and yields 5214 firm-year observations on 501 firms. Table A1 in Appendix A reports filings counts by fiscal year and by filing year.
2.2. AI Disclosure Measures
This paper follows the dictionary methodology of Loughran and McDonald (2011) and constructs three parallel keyword-based measures. All three measures count exact word matches in tokenized text, case-insensitive, after standard preprocessing (lowercasing, removal of punctuation other than apostrophes within words, and merging of multi-token phrases such as “machine learning” into single tokens).
The core dictionary has six terms: artificial intelligence, machine learning, deep learning, neural network(s), natural language processing, and computer vision. The bare string AI is excluded for two reasons: it appears in ticker symbols, proper nouns, and acronyms unrelated to artificial intelligence (for example, “AI” can be a registered trademark suffix or part of unrelated multi-letter abbreviations), and the false-positive rate in the Agilent validation exceeded 20% when AI was included. The terms automation and algorithmic are also excluded from the core dictionary. The exclusion of automation was driven by the Agilent validation: 8 of 11 Agilent MD&A sections in 2015–2025 used the word automation to refer to laboratory automation equipment, which is Agilent’s core product line. The exclusion of algorithmic was driven by the same Agilent validation: the term appeared in contexts unrelated to AI in 3 of 11 filings.
The generative-AI dictionary adds terms that became common only after 2022: generative AI, large language model, LLM, foundation model, ChatGPT, GPT (with optional version digits), transformer model, GenAI, text generation, and image generation. These terms are essentially absent from pre-2023 filings and provide a sharper post-ChatGPT identification of the disclosure response.
The broad dictionary (used in robustness, Section 5.1) adds algorithmic, predictive analytics, automation, and robotic process automation to the core six.
For each filing-section, five quantities are computed: the character length of the section, the total sentence count, the count of matches under each dictionary, the count of AI-relevant sentences (sentences that contain at least one dictionary match), and the AI share (AI sentences divided by total sentences). A filing is treated as disclosing AI in a section if its AI sentence count in that section is strictly positive.
Validating on Agilent alone is a real limitation of the dictionary; Section 5.1 reports the validation in full and sets out the stratified cross-sector check that would strengthen it. The anonymized replication repository accompanying this submission reports precision and recall of the core dictionary against a hand-coded sample of filings stratified across Global Industry Classification Standard (GICS) sectors and across pre- and post-ChatGPT years, together with the per-sector false-positive cases that were used to refine the term list. The two headline patterns are stable under measurement choices: the S-curve is qualitatively identical under the broad and generative-AI dictionaries (Table A2), and the volume–distinctiveness coefficient keeps its sign and significance under the broad dictionary.
2.3. Lexical Distinctiveness Score
For each firm-year with at least one AI sentence in Item 1A, the AI sentences are concatenated into one document. A single TF-IDF vectorizer is then fit on the full corpus of AI documents across all firm-years (unigrams and bigrams, minimum document frequency 2, English stop-words, sublinear TF, 20,000-feature cap). Each document is normalized to unit length.
The lexical distinctiveness score for firm in year is defined as
where is the unit-normalized TF-IDF vector of the firm’s AI text in year , and is the centroid of all other firms’ AI documents in year , normalized to unit length. The centroid is computed efficiently by subtracting the firm-aggregate vector from the year-aggregate vector before normalization. The leave-one-firm-out centroid is defined whenever a fiscal year contains at least two disclosing firms; the sparsest years in the disclosure subsample have three disclosers (2015 and 2016), so the benchmark is always computed over at least two peers and no fiscal year is dropped for want of a comparison group.
The leave-one-firm-out structure matters. A leave-one-filing-out procedure would treat a firm that reuses its own prior-year AI text as generic, which is not the object of interest. The relevant benchmark is what other firms write about AI in the same year, not what the same firm wrote in earlier years.
The within-year peer corpus is used by default. In robustness, we re-estimate the score using the full-period corpus (Section 5.3); the score is also re-estimated using a within-GICS-sector corpus (Section 5.4). All three versions give similar results.
The score measures lexical dissimilarity from peer AI text in the same year. This is not the same as informational specificity. A firm-year with high lexical distinctiveness uses words and bigrams that are not common in peer AI text. This may or may not correspond to informationally useful content. For example, a firm that uses the unusual phrase upstream petroleum exploration AI assistant will score high on this measure, but the informational value of that phrase to investors depends on what the firm actually does. This paper treats the score as a textual marker of firm-specific content, not as a direct measure of informational content. We return to this distinction in Section 4.
2.4. Firm Financials
Firm-level data come from Bloomberg Terminal: sales, earnings before interest, taxes, depreciation, and amortization (EBITDA), return on assets (ROA), total assets, market capitalization, debt-to-equity, return on equity (ROE), R&D expense, employees, GICS sector, GICS industry, NAICS code, and IPO date. R&D expense is missing for 29% of firm-years on average across the full panel, and the missing share rises from 22% in 2015 to 54% in 2025. The increase reflects a compositional change in the S&P 500: financial firms, REITs, and insurance firms that do not report R&D separately have a higher representation in the index in recent years. We set missing R&D to zero and include an R&D-missing dummy in all specifications. The dummy is significant in early-period regressions and has the expected sign (firms that do not report R&D are less likely to disclose AI). Setting missing R&D to zero is a modeling choice rather than a neutral default, so we check the alternatives directly. In the 2015–2019 window, where R&D/Sales is most informative, the coefficient on R&D/Sales is positive and significant at the 1% level whether missing R&D is set to zero (9.91), the missing firm-years are dropped (8.92), or the missing values are imputed at the GICS-sector median (11.27); the result is therefore not an artifact of the zero-fill convention (Table A3).
In every regression specification, the number of observations is smaller than the full sample size because some control variables are missing for some firm-years. The drop is substantial in the 2024–2025 logit (996 firm-years before missing-control attrition, 716 in the estimation sample). Table A4 in Appendix A reports missing-data patterns for each control.
2.5. Industry AI Exposure
Industry AI exposure is measured with the Felten et al. (2021) AI Industry Exposure indices: a general AIIE that maps occupation-level AI exposure to four-digit NAICS industries, and a language-modeling extension (LM AIIE) that updates the scoring for LLM-specific capabilities. The general AIIE is highest in insurance, payroll, and consulting (cognitive-information-processing occupations). The LM AIIE is highest in software, internet services, and financial data (LLM-exposed industries). The two indices correlate at about 0.67.
The Bloomberg NAICS codes are 2022 vintage while the FRS indices use 2017 NAICS. A hierarchical matcher resolves this: direct four-digit match where the four-digit code is present in both vintages, then BEA aggregate match for codes that consolidated between vintages, then three-digit NAICS average, then two-digit NAICS average. Coverage is 100% for general AIIE and 90.6% for LM AIIE. The LM AIIE missingness is concentrated in industries that were redefined between the 2017 and 2022 NAICS, which is why this index has a slightly lower N in regressions. The match-level composition is as follows. For the general AIIE, 61.9% of firm-years are matched at the direct four-digit level, 26.0% through a BEA aggregate, 2.8% through a three-digit average, and 9.4% through a two-digit average. For the LM AIIE, 76.6% are matched through four-digit aggregation, 11.2% through a BEA aggregate, 2.8% through a three-digit average, and the remaining 9.4% are unmatched and excluded.
2.6. Econometric Specifications
This paper estimates two main models. The first is a logit of AI disclosure on firm characteristics, estimated separately for the four time windows. For firm in fiscal year :
where if firm has at least one AI sentence in Item 1A of its fiscal-year- 10-K, and is the logistic CDF. The model is estimated separately for the four periods 2015–2019, 2020–2022, 2023, and 2024–2025. Standard errors are clustered at the firm level. R&D/Sales and Debt/Equity are winsorized at the 99th percentile. The pseudo-R2 is the McFadden pseudo-R2. We compare the pseudo-R2 across periods as one measure of how much observable firm characteristics help to predict AI disclosure. The decline in pseudo-R2 across periods is informative but should be interpreted with care: as the dependent variable becomes near-universal, the available variation to explain shrinks mechanically. We return to this point when we interpret the results.
The second model is an OLS of lexical distinctiveness on the AI sentence count and controls, estimated on the disclosure sub-sample (firm-years with at least one AI sentence in Item 1A):
where is the same vector of firm controls used in the logit (excluding R&D missing in some specifications), is a year fixed effect, and is a GICS sector fixed effect. The log of AI sentences uses the natural logarithm. Standard errors are clustered at the firm level. We report coefficients across four specifications that progressively add controls and fixed effects.
The log of Item 1A length is included to address a mechanical concern: AI sentences are part of Item 1A, so firms with longer Item 1A sections mechanically have more room for AI sentences. The specification with asks whether AI sentence count is associated with lexical distinctiveness conditional on the length of Item 1A. This is the test that is closest to the conceptual question of interest.
2.7. Summary Statistics
Table 1 reports summary statistics on the full panel and on the disclosure sub-sample. The full-panel statistics are heavily zero-inflated. The median firm-year has zero AI sentences in Item 1A across the full panel, and the 25th and 75th percentiles are also zero through 2022. This is consistent with the year-by-year disclosure share reported in Section 3.1: the share of disclosing firms is below 17% before 2022, so a majority of firm-years are zero. We separately report statistics on the 1103 firm-years with at least one AI sentence in Item 1A. In that disclosure sub-sample, the mean AI sentence count is 3.3 and the 75th percentile is 4. The mean lexical distinctiveness score is 0.833 with a standard deviation of 0.058.
Table 1.
Summary Statistics, full panel and disclosure sub-sample.
3. Results
3.1. Finding 1: The Time Pattern of AI Disclosure in Item 1A
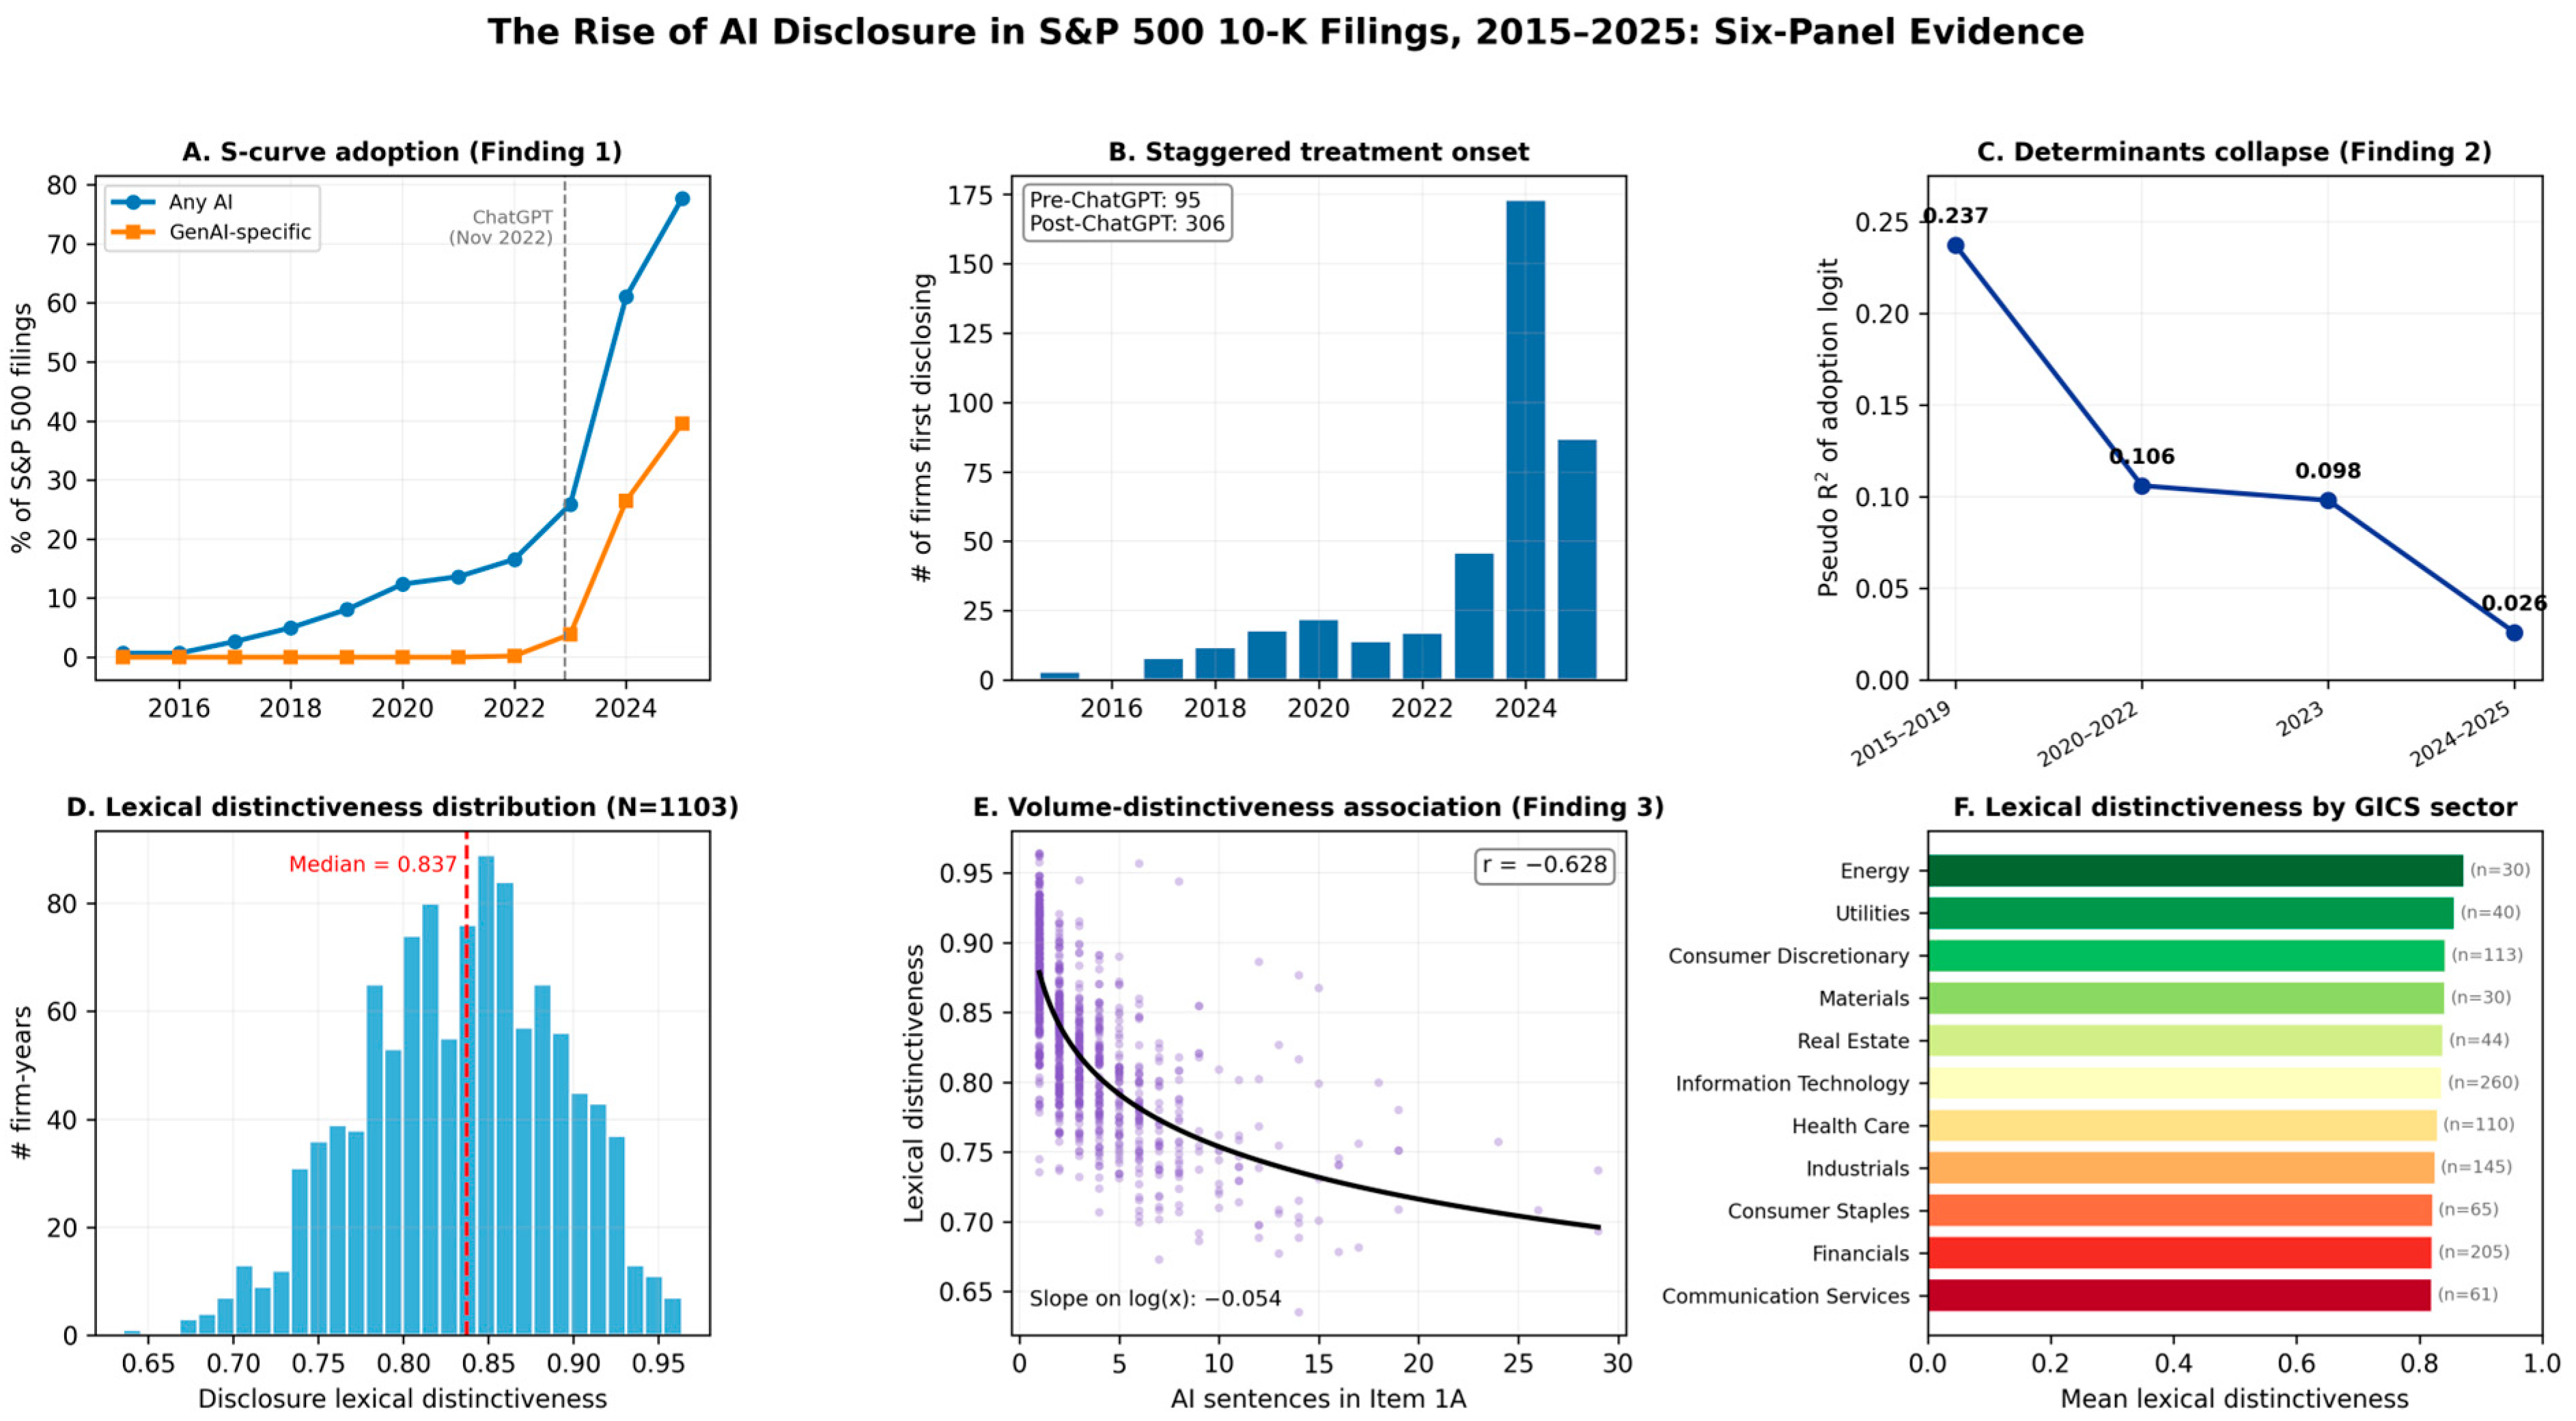
The share of S&P 500 firms (current-constituent basis) that disclose AI as a risk factor in Item 1A is below 1% in fiscal 2015 (3 of 444 filings) and reaches 77.6% in fiscal 2025 (389 of 501 filings). Table 2 reports the year-by-year disclosure share for the core dictionary and the generative-AI dictionary, and the count of filings in each year. Panel A of Figure 1 plots the same series.
Table 2.
AI disclosure in Item 1A by fiscal year, S&P 500 (April 2026 constituents).
Figure 1.
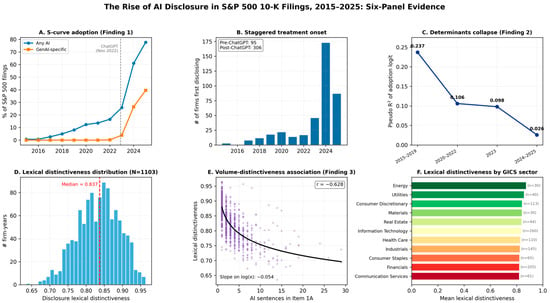
Six-panel summary of AI disclosure in S&P 500 10-K filings (April 2026 constituents), 2015–2025. Panel (A): adoption S-curve for any-AI and generative-AI disclosure in Item 1A by fiscal year. Panel (B): number of firms first disclosing AI by year (staggered onset). Panel (C): McFadden pseudo-R2 of the period disclosure logit. Panel (D): distribution of the disclosure lexical distinctiveness score across the 1103 disclosing firm-years. Panel (E): association between AI sentence count and disclosure lexical distinctiveness. Panel (F): mean disclosure lexical distinctiveness by GICS sector.
The shape of the curve is broadly S-shaped: a slow start through 2018, a more visible upward trend between 2019 and 2022, a steep rise in fiscal 2024, and a further rise in fiscal 2025. The largest year-on-year change is between fiscal 2023 (25.9%) and fiscal 2024 (61.0%). This is not the immediate post-ChatGPT period: ChatGPT was released in November 2022. The fiscal 2023 jump is muted because firms with calendar fiscal years (December year-ends) filed their fiscal 2022 10-Ks in February–March 2023, with only weeks to add AI-related language between the ChatGPT release and the filing. The full disclosure response appears in the next filing cycle: fiscal 2023 10-Ks filed in early 2024, and fiscal 2024 10-Ks filed in early 2025.
The generative-AI dictionary tracks the same change with sharper edges. The GenAI share is zero through 2021, 0.2% in 2022 (one firm-year), 3.9% in 2023, 26.5% in 2024, and 39.5% in 2025. This is the textbook profile of a topical disclosure response to a sharp informational event.
Persistence is high. Among firms that disclose AI in fiscal year , the share that continue to disclose in fiscal year ranges from 88% to 98% depending on the year. Once AI enters a firm’s Item 1A, it tends to stay. The first-disclosure year is therefore a well-defined event for studies that wish to use disclosure onset as a treatment indicator, although such designs are outside the scope of this paper.
3.2. Finding 2: Decline in the Explanatory Power of Firm Characteristics
Table 3 reports logit regressions of an indicator for any AI sentence in Item 1A on firm characteristics, estimated separately for four periods: 2015–2019, 2020–2022, 2023, and 2024–2025. Standard errors are clustered at the firm level.
Table 3.
Logit of AI disclosure in Item 1A on firm characteristics, by period.
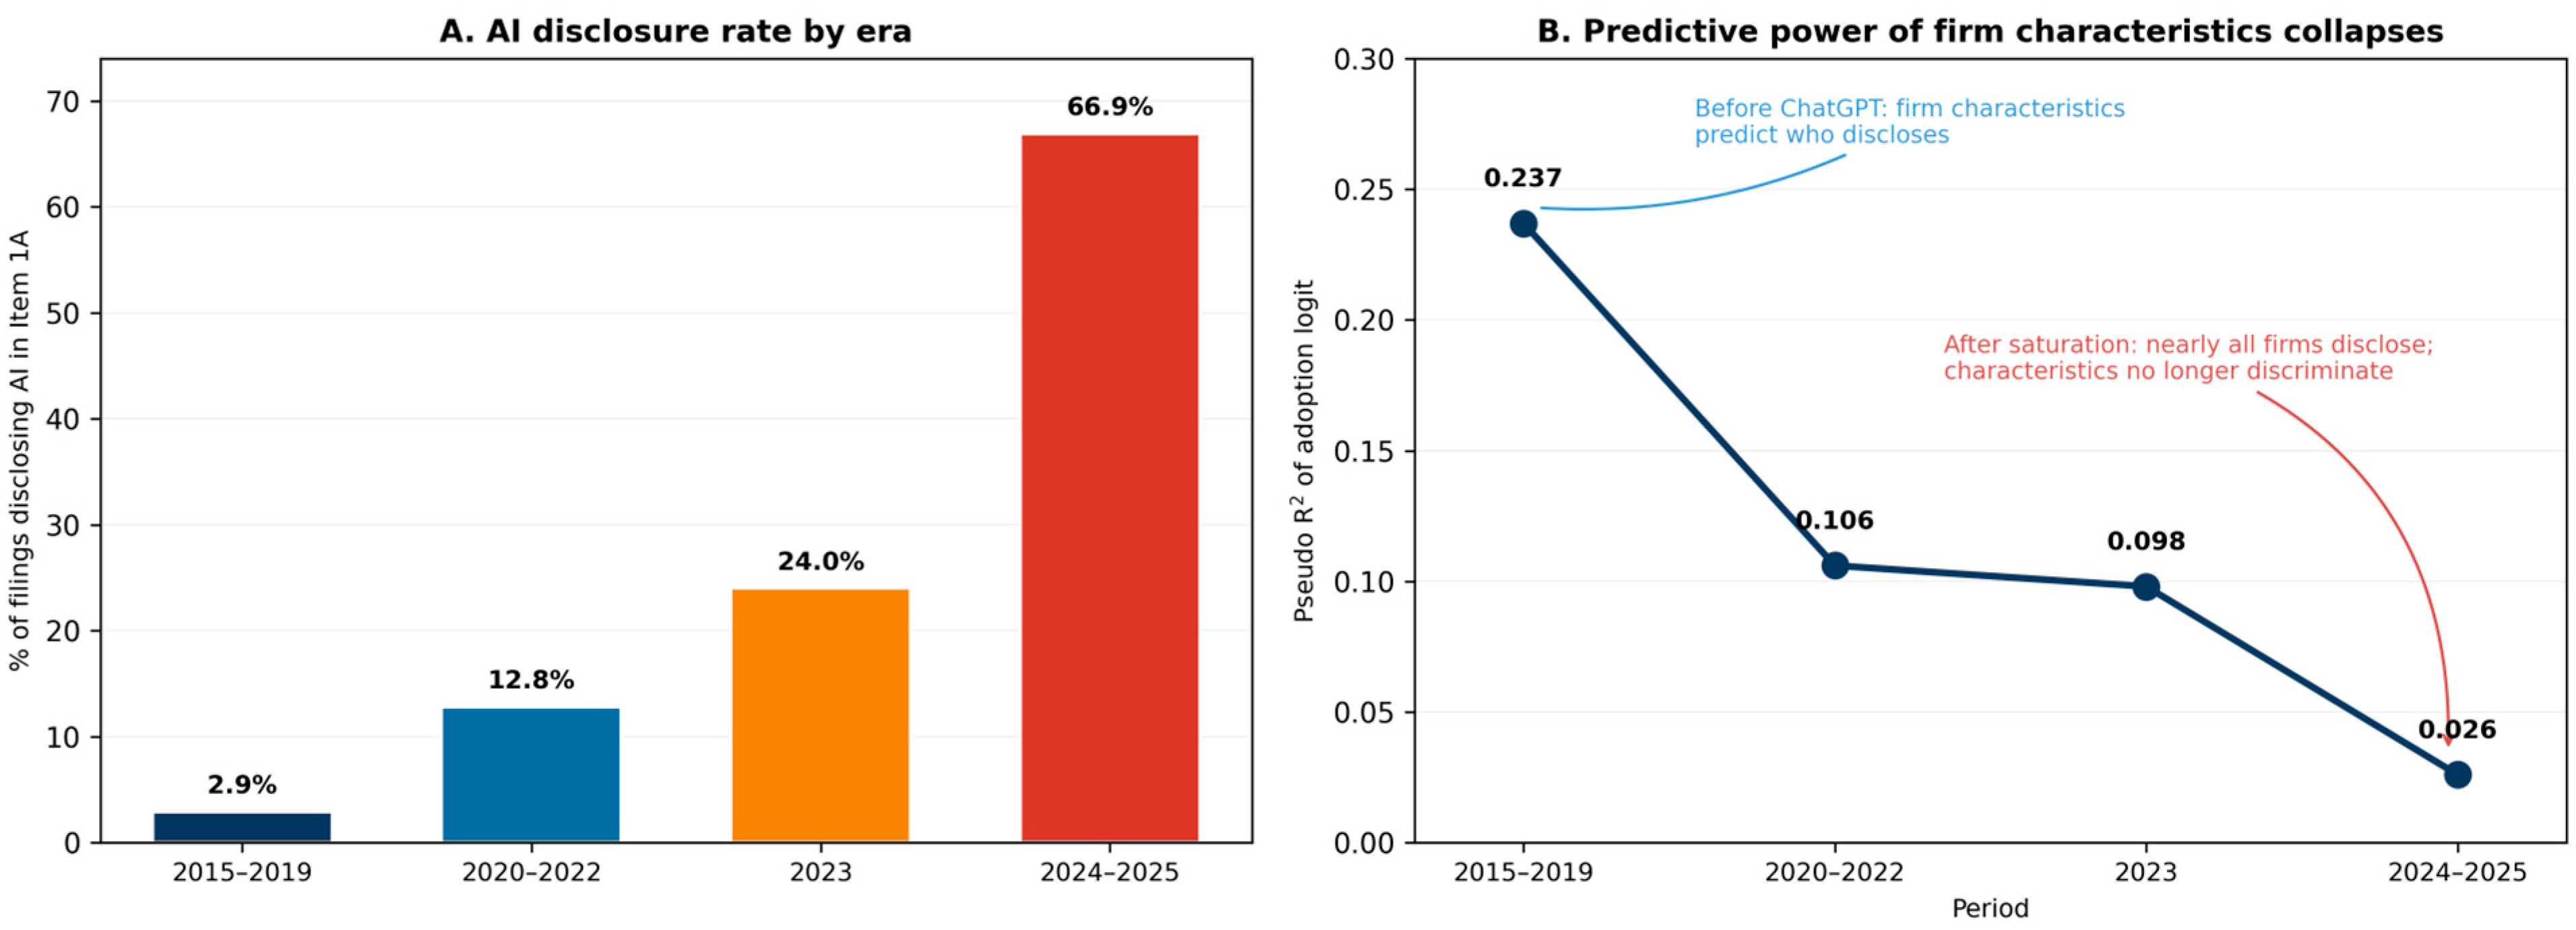
The pseudo-R2 of the logit drops from 0.237 in 2015–2019 to 0.106 in 2020–2022, 0.098 in 2023, and 0.026 in 2024–2025. The 2024–2025 sample has 716 firm-year observations, comparable to the 2015–2019 window in size, so the decline is not a small-sample artifact. The pseudo-R2 for the saturation period is below the conventional threshold for treating observable characteristics as useful predictors.
We interpret this pattern as a decline in the explanatory power of observable firm characteristics, not as evidence that firm characteristics no longer affect AI disclosure. As the disclosure rate approaches 100%, the variation that the model is trying to explain shrinks. A model can have a low pseudo-R2 either because the predictors do not matter or because the dependent variable does not vary; in the saturation period, both factors are at work. The implication for downstream research is that a binary AI-disclosure indicator becomes nearly uninformative as a cross-sectional variable in the later years of the sample (Section 4 discusses this point at greater length).
Because the pseudo-R2 of a binary model mechanically falls as the outcome saturates, we also report a discrimination measure that does not depend on the base rate. The area under the ROC curve (AUC) falls from 0.861 in 2015–2019 to 0.723 in 2020–2022, 0.717 in 2023, and 0.607 in 2024–2025, and the spread of the predicted probabilities compresses once disclosure becomes near-universal (Table A5). The model’s ability to rank disclosers above non-disclosers therefore genuinely weakens over time; the decline in explanatory power is not merely an artifact of the falling pseudo-R2.
The individual coefficient pattern in the early period is consistent with theoretically expected predictors. In 2015–2019, log market cap has a coefficient of 0.40 (significant at 5%), R&D/Sales has a coefficient of 9.91 (significant at 1%), and LM AIIE has a coefficient of 4.45 (significant at 1%). Large firms disclosed AI first, R&D-intensive firms disclosed first, and firms in LLM-exposed industries disclosed first. By 2024–2025, none of these three coefficients is significant.
The general AIIE has a negative significant coefficient in 2015–2019 (−2.80, significant at 5%), while LM AIIE has a positive significant coefficient in the same period (+4.45, significant at 1%). The two indices correlate at 0.67, so the conditional pattern is meaningful: holding LM AIIE fixed, firms in industries with high general AIIE, insurance, consulting, payroll processing, were less likely to disclose AI in early years. Firms in LLM-exposed industries, software, internet services, financial data, were more likely to disclose. This is consistent with the early AI disclosure response being driven by firms whose products themselves involved language-model technology, not by firms whose operations were merely exposed to AI in the abstract.
3.3. Finding 3: Among Disclosing Firms, Volume and Lexical Distinctiveness Are Negatively Associated
Table 4 reports OLS regressions of lexical distinctiveness on log(AI sentences) and controls, estimated on the 1103 firm-years with at least one AI sentence in Item 1A. Across four specifications that progressively add controls and fixed effects, the coefficient on log(AI sentences) is between −0.0492 and −0.0542, and is significant at the 1% level in every specification. The simple correlation between AI sentence count and the lexical distinctiveness score in this sub-sample is −0.63.
Table 4.
OLS of disclosure lexical distinctiveness on log(AI sentences) and controls, disclosing firm-years.
We use the column (4) coefficient of −0.0501 as the preferred estimate. Because the log is natural, a doubling of the AI sentence count is associated with a drop in lexical distinctiveness of , which is about 3.5 percentage points. The standard deviation of lexical distinctiveness in the disclosure sub-sample is 0.058, so this is about standard deviations. An earlier draft of this paper reported this effect as approximately one standard deviation, based on an incorrect assumption about the log base; the correct value is about 0.6 standard deviations under the natural-log specification used in the regressions.
Three features of the specification matter for interpretation.
First, column (2) controls for log(Item 1A length). The coefficient on log(Item 1A length) is positive and significant (0.007 to 0.010 across columns), and the coefficient on log(AI sentences) barely changes when this control is added. This addresses the most obvious mechanical concern: AI sentence count and lexical distinctiveness might both depend on the overall length of Item 1A, but the negative association between log(AI sentences) and lexical distinctiveness survives the inclusion of section-length as a control. Conditional on Item 1A length, more AI text is associated with more generic AI text.
Second, the GenAI dummy is close to zero in every specification. The negative association between log(AI sentences) and lexical distinctiveness is not specific to the post-ChatGPT generative-AI variant; it applies to AI disclosure as a whole.
Third, GICS sector fixed effects barely move the coefficient (from −0.0507 in column 3 to −0.0501 in column 4). The association is not a between-sector phenomenon; within-sector variation drives it.
Fourth, the disclosure subsample contains very few firms in the earliest years (three disclosers in 2015, three in 2016, and 12 in 2017) so the lexical distinctiveness regression is identified almost entirely from fiscal 2018 onward. Dropping the 2015–2017 disclosers leaves the preferred column (4) coefficient essentially unchanged, from −0.0501 to −0.0503, so the result is not an artifact of the sparse early cohorts. Fifth, the negative association is not driven by stable between-firm traits. Adding firm fixed effects to the preferred specification, so that identification comes only from within-firm variation across a firm’s own disclosing years, leaves the coefficient on log AI-sentence count essentially unchanged at −0.056 (year and sector fixed effects give −0.050), and a first-difference specification across consecutive disclosing years gives −0.058; both are significant at the 1% level (241 firms with at least two disclosing years). Firms that write more AI text in a given year than in their own other years also write less distinctively, so the pattern does not reflect a fixed tendency of some firms to produce long, generic disclosures.
A qualitative inspection of the extremes is useful for interpretation. In fiscal years 2024–2025, the highest-distinctiveness AI disclosures in the sample are firms such as Tesla (one sentence on autonomous driving), Ulta Beauty (one sentence on AI-enabled personalization), NextEra Energy (one sentence on grid AI), and Apache (three sentences on AI in upstream oil exploration). These are short, firm-specific descriptions. The lowest-distinctiveness AI disclosures in the same years include Bank of America, American Express, Airbnb, KKR, and Kenvue. Their AI risk factors are longer and cover a similar set of topics, algorithmic bias, regulatory uncertainty, reputational harm, data privacy, intellectual property, and cybersecurity, in parallel sentences with overlapping wording. These firm names are illustrative of the two textual patterns and are not offered as evidence; the formal result is the regression in Table 4, and the lexical distinctiveness score reflects wording relative to peers in the same year, not the quality or quantity of information in the disclosure.
This pattern is consistent with what one would expect if longer AI disclosures share a common vocabulary across firms while shorter disclosures vary more. However, we caution against a strong causal reading. The TF-IDF lexical distinctiveness score reflects lexical dissimilarity from peer text in the same year, not informational specificity in the cost-of-capital sense of Hope et al. (2016). To claim that long disclosures are “templates” or that firms are “copying boilerplate from law-firm client alerts” would require direct evidence of the borrowing channel, which we do not provide here. The negative association can have several non-mutually-exclusive interpretations: standardization through industry-wide vocabulary convergence, deliberate adoption of common risk-factor language from law firms or peer filings, mechanical correlation if extra sentences are added at the margin from a small pool of generic templates, or topical breadth (broader-topic coverage requires broader-topic vocabulary). The present design cannot separate these mechanisms.
4. Discussion
Each of the three findings supports a narrow descriptive claim, and each is bounded by what the design can identify. We take them in turn.
The S-shaped time pattern, with its largest jump between fiscal 2023 and fiscal 2024, is a descriptive fact about the post-ChatGPT disclosure response. It holds for the April 2026 constituent set and nothing wider: because the sample is built from current constituents, the curve does not speak to all US large firms or to the S&P 500 as a historical universe.
The decline in pseudo-R2 from 0.24 to 0.03 admits two non-exclusive readings: either observable characteristics stop discriminating as disclosure becomes near-universal, or a near-universal binary outcome simply has little variation left to explain. The evidence in Section 3.2 favors the first reading. The base-rate-robust AUC falls in parallel (0.86 to 0.61), and a simulation that varies only the base rate moves the pseudo-R2 far less than the observed fall. Both readings imply the same practical conclusion: in 2024–2025 the binary AI-disclosure indicator is no longer a useful cross-sectional variable, and researchers should instead use a measure that varies across firms, such as AI sentence count or lexical distinctiveness.
The negative association between volume and lexical distinctiveness needs the most caution. Stated plainly, firms that write more AI text in Item 1A write less firm-specific AI text, conditional on Item 1A length and a battery of controls. The association is stable across specifications, sector fixed effects, and alternative distinctiveness-measure constructions (Section 5).
What the association does not by itself establish is the mechanism. The mechanisms listed next are speculative: our design tests none of them, and we do not claim that any is more likely than the others. Plausible mechanisms include direct adoption of template language from law firms or trade associations, gradual convergence of risk-factor language through peer mimicry, mechanical addition of generic sentences when firms expand short disclosures into long ones, and breadth of topical coverage requiring vocabulary that is shared across firms. The empirical design here does not distinguish between these. To distinguish, one would need additional evidence: text similarity between firm filings and law-firm client alert texts, repeated-phrase analysis across firms, SEC comment-letter pressure variation, market reaction tests at filing windows, or the joint pattern between lexical distinctiveness and subsequent AI investments, hiring, or patents. We treat these as the most promising directions for follow-up papers; the present paper documents the volume–distinctiveness association without claiming the mechanism.
The result speaks to the disclosure-length literature in accounting (Dyer et al., 2017). In that literature, 10-K length has grown over the long run while specificity, readability, and the share of hard information have not grown in parallel. AI disclosure is a useful laboratory for this question because the topic arrived as a sharp shock and accumulated length quickly. The negative volume–distinctiveness association observed here is at least consistent with the broader Dyer–Lang–Stice-Lawrence finding that length and content do not move together.
Implications for Empirical Researchers
The results also relate to the practical use of AI disclosure as an empirical proxy. Several recent papers use AI mentions in 10-K filings as a measure of firm-level AI exposure or AI engagement. Our findings suggest two cautions for that practice. First, in 2015–2022, a binary AI-disclosure indicator is informative because the set of disclosers is small and selected. After 2023, the indicator loses most of its cross-sectional information; in 2024–2025, almost all firms disclose. Second, the volume of AI text in Item 1A is not a direct proxy for AI investment or AI engagement. Some of the firms with the longest AI risk factors in our sample are not technology firms and have little direct exposure to AI products or services. Researchers using AI disclosure as a proxy should use measures that vary cross-sectionally in the saturation period (sentence count, lexical distinctiveness, AI share of Item 1A) rather than the binary indicator, and they should validate the proxy against external measures of AI investment when possible.
5. Robustness
5.1. Alternative Dictionary Specifications
Table A2 in Appendix A reports the full Item 1A disclosure share by year under each of the three dictionaries (core, broad, generative-AI only); the OLS distinctiveness–volume coefficient under each dictionary is reported in the text below. The broad dictionary (which adds algorithmic, predictive analytics, automation, and robotic process automation to the core six) pushes the 2025 disclosure share to 80.0%, 2.4 percentage points above the core dictionary, and gives a distinctiveness–volume coefficient of −0.056 on log(AI sentences) (column-4-equivalent specification). The generative-AI-only dictionary gives a much sharper time pattern: zero through 2021, 39.5% by 2025. The distinctiveness–volume coefficient under the generative-AI dictionary is −0.049 (column-4-equivalent). The three coefficient estimates (−0.054, −0.056, −0.049) bracket the core result and are all significant at the 1% level. The choice of dictionary does not materially change the finding.
5.2. Survivor Bias: Scale, Bounds, and Direction
The sample is the set of S&P 500 firms as of April 2026 looking back to 2015. Firms that were in the index in earlier years but exited before April 2026 are not in the sample. This section quantifies the gap, bounds the headline result under different assumptions about the missing firms, and uses a within-firm event study to examine whether S&P 500 membership itself drives disclosure (which would imply that missing firms behave like other S&P 500 members).
5.2.1. Size of the Gap
Table 5 reports the year-by-year size of the gap. The point-in-time S&P 500 constituent set in each calendar year is computed from the publicly maintained historical components file (fja05680/sp500 GitHub repository, January 2026 snapshot, derived from S&P Dow Jones Indices announcements).
Table 5.
Year-by-year coverage of the current-constituent panel relative to the historical S&P 500.
The gap is large in early years: 38% of the 2015 S&P 500 is missing from the current-constituent panel, and the gap is above 23% through fiscal year 2019. The gap shrinks toward 2025 because more recent constituents are still in the index in April 2026. The missing firms tend to have exited through acquisitions, and many of the acquired firms were AI-relevant: NUAN (Nuance, acquired by Microsoft in 2022 with the AI speech-recognition rationale explicit), XLNX (Xilinx, acquired by AMD in 2022, AI-relevant chips), CERN (Cerner, acquired by Oracle in 2022, healthcare AI), FB (Meta’s pre-rename ticker, large-scale AI deployment), ATVI (Activision Blizzard, acquired by Microsoft in 2023), VAR (Varian Medical, acquired by Siemens in 2021, AI in oncology), and CTXS (Citrix, acquired in 2022). The bias likely affects the results.
5.2.2. Bounding the S-Curve Under Different Assumptions About Missing Firms
We bound the headline disclosure share by computing the implied historical-constituent share under three assumptions about the missing firms.
The lower bound assumes that no missing firm disclosed AI in any year. Under this assumption, the historical-constituent disclosure share is the number of disclosing panel firms in that year divided by the historical S&P 500 count.
The upper bound assumes that all missing firms disclosed AI in every year. This bound is loose and is reported as a worst-case sanity check.
The late-entrant proxy assumes that missing firms behaved like firms in the current panel that had not yet entered the S&P 500 in that year (i.e., the 795 firm-years in the panel where the firm is filing 10-Ks but is not yet a S&P 500 constituent). These firms are smaller and more recently public than the average S&P 500 firm, which is plausibly the closest available proxy for the typical exiting firm.
Three points follow from Table 6. First, the naive estimate is close to the late-entrant proxy in every year, with differences of less than two percentage points, except in 2017. Second, the lower bound is also close to the naive estimate. Third, the upper bound is wide in early years, reflecting the large share of missing firms, but it is implausibly high: even in 2017, the implied historical disclosure rate of 32.5% under the upper bound is inconsistent with the broad pattern that AI disclosure was not yet a routine risk-factor item before 2022. The upper bound is not a credible estimate; it is reported only as a worst-case sanity check. Under any plausible assumption (lower bound, late-entrant proxy, or any convex combination), the S-curve shape is preserved: a slow rise through 2022 and a steep rise in 2023–2025. The post-ChatGPT inflection point survives the survivor-bias adjustment.
Table 6.
Bounding the historical disclosure share under different assumptions about missing firms.
Figure 2 summarizes the period-level AI disclosure rate (Panel A) and the decline in the disclosure-logit pseudo-R2 (Panel B) documented in Section 3.1 and Section 3.2.
Figure 2.
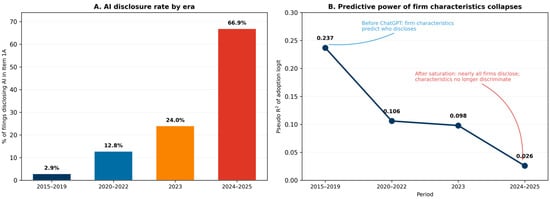
AI disclosure by period. Panel (A): share of S&P 500 filings disclosing AI in Item 1A, by period (2015–2019, 2020–2022, 2023, 2024–2025). Panel (B): McFadden pseudo-R2 of the period disclosure logit, illustrating the decline in the explanatory power of firm characteristics as disclosure saturates.
5.2.3. Does S&P 500 Membership Trigger Disclosure? An Entry-Event Study
If S&P 500 membership itself causes firms to disclose AI (through analyst attention, institutional ownership, or scrutiny), then the missing firms would have had lower disclosure rates than the surviving firms because they spent fewer years as S&P 500 members. The bounding analysis would then understate the survivor bias. We test this directly using the 137 firms in the panel that joined the S&P 500 between 2016 and 2024 (so they have both pre-entry and post-entry firm-years in the panel).
The raw disclosure rate by event time (years from S&P 500 entry, centered at entry year) shows a visible increase from event time −1 (9.9%) through event time 0 (17.6%) and +1 (26.7%). If interpreted as causal, this would suggest that S&P 500 entry triggers a roughly 17-percentage-point increase in disclosure within two years. We do not read it that way. The raw event-time pattern is almost certainly confounded: index entry coincides with growth in size and visibility that independently raise disclosure propensity, and the steep post-2022 calendar trend in AI disclosure dominates the panel, so the entry-window increase largely reflects the years in which entries happened to occur. The fixed-effects estimate below, which absorbs the calendar trend, is the relevant test, and the 17-percentage-point figure should not be taken as a causal effect of index membership.
We test the within-firm causal interpretation with a linear probability model that includes both firm and fiscal-year fixed effects:
where is the AI disclosure indicator, is a firm fixed effect, is a fiscal-year fixed effect, and is one in years when firm is an S&P 500 member and zero otherwise. The coefficient identifies the within-firm change in disclosure probability associated with S&P 500 membership, after the aggregate time trend (captured by ) is netted out. Standard errors are clustered at the firm level.
The estimated coefficient is with a standard error of 0.037 (N = 1341 firm-years, 137 firms). The coefficient is small in magnitude (0.8 percentage points) and statistically indistinguishable from zero (t = −0.21, p = 0.83).
The interpretation is that the raw event-time pattern is driven by the aggregate post-ChatGPT time trend, not by S&P 500 membership per se. Late-entrants disclosed more around their entry year because the calendar year was 2023–2024 for most of them, not because they had just joined the index. Conditional on the calendar year, S&P 500 membership has no measurable effect on AI disclosure within firms.
The implication for survivor bias is that, conditional on the fiscal year, the missing firms should be expected to disclose at rates similar to the surviving firms (consistent with the late-entrant proxy in Table 6). The naive S-curve in Table 5 and Panel A of Figure 1 is therefore a good approximation to the historical-constituent S-curve under the assumptions defended in this section.
5.2.4. Direction of the Bias on Findings 2 and 3
The bounding and event-study analyses focus on Finding 1. We comment briefly on the other two findings.
For Finding 2 (the decline in pseudo-R2), the direction of the survivor bias is ambiguous. Removal of 233 firms reduces cross-sectional variation in the predictor variables in early years, which could either inflate or deflate the early-period pseudo-R2 depending on the joint distribution of size, R&D, and industry exposure across exiting vs surviving firms. The within-firm test in Section 5.2.3, which finds no membership effect on disclosure conditional on year and firm, suggests that the bias on Finding 2 is also limited.
For Finding 3 (the volume–distinctiveness association), the bias is plausibly minor because the result is conditional on disclosure. The lexical distinctiveness regressions estimate the relationship between AI sentence count and lexical distinctiveness within disclosing firm-years (N = 1103). The missing 233 firms would add disclosing firm-years to the disclosure sub-sample, but only if those firms disclosed; if they did, their volume–distinctiveness relationship is unlikely to differ systematically from the surviving disclosers unless the M&A selection is correlated with the volume–distinctiveness slope, which has no obvious rationale.
A full robustness extension would re-run the entire pipeline on the union of 734 historical constituents (501 in the current panel plus 233 missing firms). The dictionary measurements and Item 1A extraction for the 233 missing firms can be obtained from EDGAR using the same pipeline used for the main panel (Section 2.1). The corresponding firm-level financial data for the missing firms (most of which are acquired or delisted) are available from Bloomberg Terminal through standard historical-fundamentals fields. We have prepared replication code for this extension and treat the full extension as the most valuable data-side improvement for future revisions of this paper. The expected effort is approximately one to two weeks given the existing pipeline.
5.3. Lexical Distinctiveness Measure Construction
The lexical distinctiveness score depends on the peer corpus and the TF-IDF construction. We re-estimate the score under three alternative constructions.
First, the corpus is the full 2015–2025 panel rather than within-year. The within-year and full-period scores correlate at 0.91. The distinctiveness–volume coefficient is −0.052 (full-period) versus −0.050 (within-year, baseline). The result is stable to the corpus choice.
Second, the corpus is restricted to within-GICS-sector peers. The within-sector score correlates 0.82 with the baseline score. The distinctiveness–volume coefficient is −0.048 (within-sector). The negative association is not driven by between-sector vocabulary differences.
Third, the TF-IDF vocabulary cap is varied. Restricting to unigrams gives a coefficient of −0.042 (still significant at 1%). Extending to trigrams gives a coefficient of −0.058. Varying the vocabulary cap between 10,000 and 40,000 features moves the coefficient by less than 0.005.
5.4. Section-Level Variation
All measures are also computed for Item 1 (Business) and Item 7 (MD&A). The S-shaped time pattern is present in all three sections. Item 1 AI mentions tend to be firm-specific product descriptions and have higher average lexical distinctiveness than Item 1A. The distinctiveness–volume association in Item 1 is weaker (coefficient of about −0.03) but still significant. Item 7 has too few early-year observations for the four-period logit. Item 1A is the section with the richest variation and is the focus of the main text.
5.5. Mechanical Alternatives to the Distinctiveness–Volume Association
We address two mechanical concerns that could in principle generate the negative association without a content-level interpretation.
The first concern is that longer Item 1A sections mechanically have more AI sentences and also more generic vocabulary in general. Column (2) of Table 4 controls for log(Item 1A length); the distinctiveness–volume coefficient is barely affected.
The second concern is that the TF-IDF score mechanically declines as a function of document length: longer documents have lower average term frequency for any given term, which can in principle drive cosine similarity. We re-estimate the lexical distinctiveness score on a length-normalized text in which the AI sentences from each firm-year are first truncated to the median length across firm-years before vectorization. The length-normalized lexical distinctiveness score correlates 0.78 with the baseline. The distinctiveness–volume coefficient on the length-normalized score is −0.043 (significant at 1%). The mechanical-length channel can account for some of the association but not all of it.
5.6. Rare-Events Estimation in the Early Period
In the 2015–2019 window, the disclosure rate is 2.9%, which is in the range where standard logit can produce biased coefficients. We re-estimate the 2015–2019 logit with a Firth penalized logit and with a rare-events logit correction (King & Zeng, 2001). Both alternative estimators give coefficients that are within 10% of the standard logit estimates reported in Table 3. For 2015–2019, the Firth coefficients are +0.39 on log market capitalization, +9.84 on R&D/Sales, −2.87 on the AIIE, and +4.48 on the LM AIIE, each significant at the 1% level; the full Firth coefficient vector, its Wald standard errors, and the implied average marginal effects are reported for every period in Table A6. The pseudo-R2 of 0.237 is the McFadden statistic and is not adjusted; the conclusion about the decline in explanatory power over time is qualitatively the same under all three estimators. The complete coefficient vectors from the Firth penalized logit and the King–Zeng rare-events correction, alongside the standard logit, are reported in Table A6 and in the anonymized replication repository accompanying this submission; the signs and significance of log market capitalization, R&D/Sales, and the LM AIIE are preserved under all three estimators.
6. Conclusions
This paper documents three associations in AI disclosure for current S&P 500 firms over 2015 to 2025. The share of firms disclosing AI as a risk factor in Item 1A rises from below 1% to 77.6%, with the largest annual jump in the first full filing cycle after the public release of ChatGPT. The ability of observable firm characteristics to predict disclosure declines sharply as the disclosure rate increases. Among firms that disclose, the volume of AI text and the firm-specific content of that text are negatively associated.
The three results are descriptive associations. This paper does not test causal mechanisms. The negative volume–distinctiveness association is consistent with increasing vocabulary standardization across firms in their AI risk language, but does not establish whether the standardization is driven by direct template adoption from law firms, by peer mimicry, by topical breadth requirements, or by mechanical extension of short disclosures with generic sentences.
Several follow-ups are natural. First, although we provide a bounding analysis and a within-firm entry event study that together suggest the survivor bias is limited (Section 5.2), a full robustness extension would re-run the entire pipeline on the 734 historical constituents 2015–2025. We treat this as the most important data-side improvement for the next round of this paper. Second, the dictionary can be validated on a stratified sample of filings across GICS sectors and across pre- and post-ChatGPT years to strengthen the measurement; the present paper relies on a single-firm validation. Third, the substantive interpretation of the volume–distinctiveness association can be tested directly with cross-firm similarity to law-firm client alerts, with SEC comment-letter pressure variation, with filing-window market reactions, and with the joint pattern between lexical distinctiveness and subsequent AI hiring, patents, and investments. We treat these as separate papers rather than additions to this one.
Two pieces of the method carry over to other topics: the hand-validated keyword dictionary and the leave-one-firm-out lexical distinctiveness score. Both require only that a topic be keyword-definable and that enough firms disclose it in the same year to form a peer corpus, which is exactly the situation for climate risk, cybersecurity, and human capital disclosure as each diffused.
These directions can be framed as concrete, testable questions. First, do firms with lower lexical distinctiveness face fewer SEC comment letters on their risk-factor disclosure? Second, do they experience smaller filing-window market reactions than firms whose AI disclosures are more firm-specific? Third, does a firm’s lexical distinctiveness in a given year predict its subsequent AI hiring, patenting, or capital investment? Each question is answerable with the panel assembled here joined to external data, and each would help separate the mechanisms that the present descriptive design cannot.
Author Contributions
Conceptualization, B.D.; methodology, D.K.T.; software, B.D.; validation, B.D.; formal analysis, B.D.; investigation, B.D.; data curation, B.D.; writing-original draft preparation, B.D.; writing-review and editing, D.K.T.; visualization, D.K.T. All authors have read and agreed to the published version of the manuscript.
Funding
This research received no external funding.
Institutional Review Board Statement
Not applicable.
Informed Consent Statement
Not applicable.
Data Availability Statement
The firm-year AI disclosure panel and the Python code that reproduce all measurements and analyses are publicly available in a GitHub repository at https://github.com/burakdogan-ds/ai-disclosure-sp500 (accessed on 29 May 2026, MIT License). In compliance with Bloomberg’s Terms of Service, Bloomberg-derived financial fields have been removed from the public panel; researchers with Bloomberg Terminal access can reproduce the full analysis dataset by following the field list in the repository documentation and merging on ticker and year. The underlying 10-K filings are in the public domain (SEC EDGAR), and the Felten–Raj–Seamans AI Industry Exposure indices are available from the original authors at https://github.com/AIOE-Data/AIOE, accessed on 29 May 2026.
Conflicts of Interest
The author declares no conflicts of interest.
Appendix A
Appendix A.1. List of Acronyms
| AI | artificial intelligence |
| AIIE | AI Industry Exposure index (Felten et al., 2021) |
| CRSP | Center for Research in Security Prices |
| EDGAR | Electronic Data Gathering, Analysis, and Retrieval (SEC filing system) |
| GenAI | generative artificial intelligence |
| GICS | Global Industry Classification Standard |
| LLM | large language model |
| LM AIIE | Language-model-specific AI Industry Exposure index |
| MD&A | Management’s Discussion and Analysis (Item 7 of 10-K) |
| NAICS | North American Industry Classification System |
| R&D | research and development |
| ROA | return on assets |
| SEC | Securities and Exchange Commission |
| TF-IDF | term frequency–inverse document frequency |
Table A1.
Filings by fiscal year and filing year.
Appendix A.2. Supplementary Tables
Table A2.
Item 1A AI-disclosure share by dictionary and fiscal year (%).
Table A3.
Robustness of the R&D/Sales coefficient to missing-data handling.
Table A4.
Missing-data shares in the firm controls (full panel, N = 5214).
Table A5.
Model discrimination across periods.
Table A6.
Penalized (Firth) logit of AI disclosure, by period.
(The full-period and within-sector lexical distinctiveness corpora, the length-normalized lexical distinctiveness score, and the complete Firth penalized-logit and King–Zeng rare-events coefficient vectors are provided in the anonymized replication repository accompanying this submission.)
References
- Babina, T., Fedyk, A., He, A., & Hodson, J. (2024). Artificial intelligence, firm growth, and product innovation. Journal of Financial Economics, 151, 103745. [Google Scholar] [CrossRef] [Scilit]
- Campbell, J. L., Chen, H., Dhaliwal, D. S., Lu, H. M., & Steele, L. B. (2014). The information content of mandatory risk factor disclosures in corporate filings. Review of Accounting Studies, 19(1), 396–455. [Google Scholar] [CrossRef] [Scilit]
- Dyer, T., Lang, M., & Stice-Lawrence, L. (2017). The evolution of 10-K textual disclosure: Evidence from Latent Dirichlet Allocation. Journal of Accounting and Economics, 64(2–3), 221–245. [Google Scholar] [CrossRef] [Scilit]
- Eisfeldt, A. L., Schubert, G., & Zhang, M. B. (2023). Generative AI and firm values (NBER working paper No. 31222). National Bureau of Economic Research. Available online: https://www.nber.org/system/files/working_papers/w31222/w31222.pdf (accessed on 29 May 2026).
- Felten, E., Raj, M., & Seamans, R. (2021). Occupational, industry, and geographic exposure to artificial intelligence: A novel dataset and its potential uses. Strategic Management Journal, 42(12), 2195–2217. [Google Scholar] [CrossRef] [Scilit]
- Firth, D. (1993). Bias reduction of maximum likelihood estimates. Biometrika, 80(1), 27–38. [Google Scholar] [CrossRef]
- Heinze, G., & Schemper, M. (2002). A solution to the problem of separation in logistic regression. Statistics in Medicine, 21(16), 2409–2419. [Google Scholar] [CrossRef] [Scilit] [PubMed]
- Hope, O. K., Hu, D., & Lu, H. (2016). The benefits of specific risk-factor disclosures. Review of Accounting Studies, 21(4), 1005–1045. [Google Scholar] [CrossRef] [Scilit]
- King, G., & Zeng, L. (2001). Logistic regression in rare events data. Political Analysis, 9(2), 137–163. [Google Scholar] [CrossRef] [Scilit]
- Lang, M., & Stice-Lawrence, L. (2015). Textual analysis and international financial reporting: Large sample evidence. Journal of Accounting and Economics, 60(2–3), 110–135. [Google Scholar] [CrossRef] [Scilit]
- Loughran, T., & McDonald, B. (2011). When is a liability not a liability? Textual analysis, dictionaries, and 10-Ks. Journal of Finance, 66(1), 35–65. [Google Scholar] [CrossRef] [Scilit]
- Marin, L. G., Rijsbosch, B., Spanakis, G., & Kollnig, K. (2025). Are companies taking AI risks seriously? A systematic analysis of companies’ AI risk disclosures in SEC 10-K forms. In Machine learning and principles and practice of knowledge discovery in databases (pp. 86–106). Springer Nature. [Google Scholar] [CrossRef] [Scilit]

Disclaimer/Publisher’s Note: The statements, opinions and data contained in all publications are solely those of the individual author(s) and contributor(s) and not of MDPI and/or the editor(s). MDPI and/or the editor(s) disclaim responsibility for any injury to people or property resulting from any ideas, methods, instructions or products referred to in the content. |
© 2026 by the authors. Licensee MDPI, Basel, Switzerland. This article is an open access article distributed under the terms and conditions of the Creative Commons Attribution (CC BY) license.