Are Peripartum Changes in CCL2 Associated with Maternal Metabolic Status?

 ,
,  ,
,
Abstract
1. Introduction
2. Materials and Methods
- ΔBMI_gestational (ΔBMI_g): Difference between BMI on the day of delivery and pre-pregnancy BMI;
- ΔBMI_puerperal (ΔBMI_p): Difference between BMI on the day of delivery and BMI 48 h postpartum;
- ΔBMI (total BMI change): Difference between BMI 48 h postpartum and pre-pregnancy BMI.
3. Results
4. Discussion
Limitations
5. Conclusions
Author Contributions
Funding
Institutional Review Board Statement
Informed Consent Statement
Data Availability Statement
Conflicts of Interest
References
- Liu, H.; Liu, A.; Kaminga, A.C.; McDonald, J.; Wen, S.W.; Pan, X. Chemokines in Gestational Diabetes Mellitus. Front. Immunol. 2022, 13, 705852. [Google Scholar] [CrossRef] [Scilit]
- Płoński, A.; Krupa, A.; Płoński, A.F.; Pawlak, D.; Gabriel, M.; Sieklucka, B.; Głowiński, J.; Pawlak, K. Obesity-Related Serum Monocyte Chemoattractant Protein-1 (MCP-1) as a Biomarker of Plaque Instability in Patients Undergoing Carotid Endarterectomy. Int. J. Mol. Sci. 2025, 26, 4731. [Google Scholar] [CrossRef] [Scilit]
- Qi, X.; Xing, Y.; Wang, X. Blockade of CCL2/CCR2 Signaling Pathway Exerts Anti-Inflammatory Effects and Attenuates Gestational Diabetes Mellitus in a Genetic Mice Model. Horm. Metab. Res. 2021, 53, 56–62. [Google Scholar] [CrossRef] [Scilit] [PubMed]
- Lin, Z.; Shi, J.L.; Chen, M.; Zheng, Z.M.; Li, M.Q.; Shao, J. CCL2: An important cytokine in normal and pathological pregnancies: A review. Front. Immunol. 2023, 13, 1053457. [Google Scholar] [CrossRef] [Scilit]
- Shevchenko, J.A.; Gizbrekht, A.A.; Sennikov, S.V. Chemokines in Pregnancy. Biomolecules 2025, 15, 1645. [Google Scholar] [CrossRef] [Scilit] [PubMed]
- Tabatabaei, M.S.; Islam, R.; Ahmed, M. Applications of gold nanoparticles in ELISA, PCR, and immuno-PCR assays: A review. Anal. Chim. Acta 2021, 1143, 250–266. [Google Scholar] [CrossRef] [Scilit]
- Juge-Aubry, C.E.; Henrichot, E.; Meier, C.A. Adipose tissue: A regulator of inflammation. Best Pract. Res. Clin. Endocrinol. Metab. 2005, 19, 547–566. [Google Scholar] [CrossRef] [Scilit] [PubMed]
- Savulescu-Fiedler, I.; Mihalcea, R.; Dragosloveanu, S.; Scheau, C.; Baz, R.O.; Caruntu, A.; Scheau, A.-E.; Caruntu, C.; Benea, S.N. The Interplay Between Obesity and Inflammation. Life 2024, 14, 856. [Google Scholar] [CrossRef] [Scilit]
- Friis, C.M.; Paasche Roland, M.C.; Godang, K.; Ueland, T.; Tanbo, T.; Bollerslev, J.; Henriksen, T. Adiposity-related inflammation: Effects of pregnancy. Obesity 2013, 21, E124–E130. [Google Scholar] [CrossRef] [Scilit]
- Siddiqui, K.; Joy, S.S.; George, T.P.; Mujammami, M.; Alfadda, A.A. Potential Role and Excretion Level of Urinary Transferrin, KIM-1, RBP, MCP-1 and NGAL Markers in Diabetic Nephropathy. Diabetes Metab. Syndr. Obes. 2020, 13, 5103–5111. [Google Scholar] [CrossRef] [Scilit]
- Martínez-Hortelano, J.A.; Cavero-Redondo, I.; Álvarez-Bueno, C.; Sanabria-Martínez, G.; Poyatos-León, R.; Martínez-Vizcaíno, V. Interpregnancy Weight Change and Hypertension During Pregnancy: A Systematic Review and Meta-analysis. Obstet. Gynecol. 2020, 135, 68–79. [Google Scholar] [CrossRef] [Scilit] [PubMed]
- Yamamoto, M.; Aoki, S.; Shinoda, S.; Ishikawa, H.; Miyagi, E. Impact of interpregnancy weight changes and perinatal outcomes: A retrospective study in Japan. PLoS ONE 2024, 19, e0299794. [Google Scholar] [CrossRef] [Scilit] [PubMed]
- Ku, C.W.; Cheng, T.S.; Ku, C.O.; Zhou, K.X.; Cheung, Y.B.; Godfrey, K.M.; Han, W.M.; Yap, F.; Chan, J.K.Y.; Loy, S.L. Distribution and association of interpregnancy weight change with subsequent pregnancy outcomes in Asian women. Sci. Rep. 2023, 13, 4834. [Google Scholar] [CrossRef] [Scilit]
- Yang, A.; Wang, Y.; Liu, Y.; Yang, J.; Xu, C.; Zhong, S. Impact of interpregnancy weight change on the risk of gestational diabetes mellitus during a second pregnancy in Chinese population: A retrospective cohort study. BMJ Open 2025, 15, e084282. [Google Scholar] [CrossRef] [Scilit]
- Timmermans, Y.E.G.; van de Kant, K.D.G.; Oosterman, E.O.; Spaanderman, M.E.A.; Villamor-Martinez, E.; Kleijnen, J.; Vreugdenhil, A.C.E. The impact of interpregnancy weight change on perinatal outcomes in women and their children: A systematic review and meta-analysis. Obes. Rev. 2020, 21, e12974. [Google Scholar] [CrossRef] [Scilit]
- Teulings, N.E.W.D.; Masconi, K.L.; Ozanne, S.E.; Aiken, C.E.; Wood, A.M. Effect of interpregnancy weight change on perinatal outcomes: Systematic review and meta-analysis. BMC Pregnancy Childbirth 2019, 19, 386. [Google Scholar] [CrossRef] [Scilit]
- Nagpal, T.S.; Souza, S.C.S.; Moffat, M.; Hayes, L.; Nuyts, T.; Liu, R.H.; Bogaerts, A.; Dervis, S.; Piccinini-Vallis, H.; Adamo, K.B.; et al. Does prepregnancy weight change have an effect on subsequent pregnancy health outcomes? A systematic review and meta-analysis. Obes. Rev. 2022, 23, e13324, Erratum in Obes. Rev. 2022, 23, e13499. [Google Scholar]
- Pidd, K.; Breeze, P.; Ahern, A.; Griffin, S.J.; Brennan, A. Effects of weight loss and weight gain on HbA1c, systolic blood pressure and total cholesterol in three subgroups defined by blood glucose: A pooled analysis of two behavioural weight management trials in England. BMJ Open 2025, 15, e095046. [Google Scholar] [CrossRef] [Scilit]
- Andersen, H.H.; Andersen, M.K.; Bossow, K.A.; Vestergaard, A.L.; Bor, P.; Larsen, A. High-dose vitamin D supplementation in pregnancy ameliorates obesity-induced increase in maternal IL-1β level without affecting obesity-induced increase in IL-6 and MCP. J. Steroid Biochem. Mol. Biol. 2025, 250, 106742. [Google Scholar] [CrossRef] [Scilit]
- Rees, A.; Richards, O.; Allen-Kormylo, A.; Jones, N.; Thornton, C.A. Maternal body mass index is associated with an altered immunological profile at 28 weeks of gestation. Clin. Exp. Immunol. 2022, 208, 114–128. [Google Scholar] [CrossRef] [Scilit] [PubMed]
- Roberts, J.M.; Bodnar, L.M.; Patrick, T.E.; Powers, R.W. The Role of Obesity in Preeclampsia. Pregnancy Hypertens. 2011, 1, 6–16. [Google Scholar] [CrossRef] [Scilit] [PubMed]
- Kalagiri, R.R.; Carder, T.; Choudhury, S.; Vora, N.; Ballard, A.R.; Govande, V.; Drever, N.; Beeram, M.R.; Uddin, M.N. Inflammation in Complicated Pregnancy and Its Outcome. Am. J. Perinatol. 2016, 33, 1337–1356. [Google Scholar] [CrossRef] [Scilit] [PubMed]
- Rong, C.; Cui, X.; Chen, J.; Qian, Y.; Jia, R.; Hu, Y. DNA Methylation Profiles in Placenta and Its Association with Gestational Diabetes Mellitus. Exp. Clin. Endocrinol. Diabetes 2015, 123, 282–288. [Google Scholar] [CrossRef] [Scilit] [PubMed]

| Variable | ΔBMI > 1 kg/m2 (n = 22) | ΔBMI ≤ 1 kg/m2 (n = 22) | p |
|---|---|---|---|
| Pre-pregnancy BMI (kg/m2) | 27.05 ± 7.21 | 30.04 ± 8.08 | 0.204 |
| Pre-pregnancy BMI categories (n) | |||
| Underweight + normal weight (<25) | 10 | 6 | 0.658 |
| Overweight (25–29.9) | 8 | 6 | 0.477 |
| Obese (≥30) | 4 | 10 | 0.776 |
| BMI on day of delivery (kg/m2) | 32.12 ± 7.62 | 32.54 ± 7.51 | 0.854 |
| BMI 48 h postpartum (kg/m2) | 30.07 ± 7.56 | 28.86 ± 8.01 | 0.610 |
| Gestational BMI change ΔBMI_g (kg/m2) | 5.06 ± 2.15 | 2.50 ± 1.01 | <0.001 * |
| Puerperal BMI change ΔBMI_p (kg/m2) | 2.05 ± 0.98 | 3.68 ± 1.51 | <0.001 * |
| Total BMI change ΔBMI (kg/m2) | 3.01 ± 2.16 | −1.18 ± 1.42 | <0.001 * |
| Total body water (%) | 35.79 ± 6.69 | 34.87 ± 6.71 | 0.503 |
| Extracellular water to intracellular water index | 0.93 ± 0.13 | 0.92 ± 0.18 | 0.353 |
| Lean tissue index (kg/m2) | 12.63 ± 1.83 | 13.34 ± 3.36 | 0.597 |
| Fat tissue index (kg/m2) | 17.05 ± 7.64 | 15.29 ± 8.41 | 0.313 |
| Body cell mass (kg) | 19.13 ± 4.53 | 19.76 ± 6.93 | 0.925 |
| Glucose (mg/dL) | 79.77 ± 8.19 | 81.36 ± 8.03 | 0.510 |
| Insulin (mIU/L) | 11.28 ± 4.28 | 11.66 ± 5.11 | 0.869 |
| HOMA-IR | 2.27 ± 1.01 | 2.38 ± 1.21 | 0.681 |
| HbA1c (%) | 5.35 ± 0.33 | 5.29 ± 0.39 | 0.860 |
| High-density lipoprotein (mg/dL) | 77.64 ± 20.67 | 72.14 ± 16.82 | 0.467 |
| Low-density lipoprotein (mg/dL) | 133.45 ± 29.49 | 142.86 ± 27.54 | 0.318 |
| Triglycerides (mg/dL) | 173.82 ± 30.57 | 182.27 ± 26.96 | 0.391 |
| Uric acid (mg/dL) | 5.12 ± 0.78 | 5.05 ± 0.88 | 0.897 |
| Ferritin (µg/L) | 13.36 ± 7.16 | 16.18 ± 10.78 | 0.510 |
| Homocysteine (µmol/L) | 10.75 ± 3.05 | 10.71 ± 2.56 | 0.981 |
| Parameter | ΔBMI ≤ 1 kg/m2 (Mean ± SD, Median) | ΔBMI > 1 kg/m2 (Mean ± SD, Median) | p |
|---|---|---|---|
| CCL2 in serum before delivery | 150.98 ± 71.68, 145.74 | 189.96 ± 96.10, 159.93 | 0.162 |
| CCL2 in serum at 48 h postpartum | 148.46 ± 73.60, 128.80 | 131.51 ± 64.14, 111.08 | 0.496 |
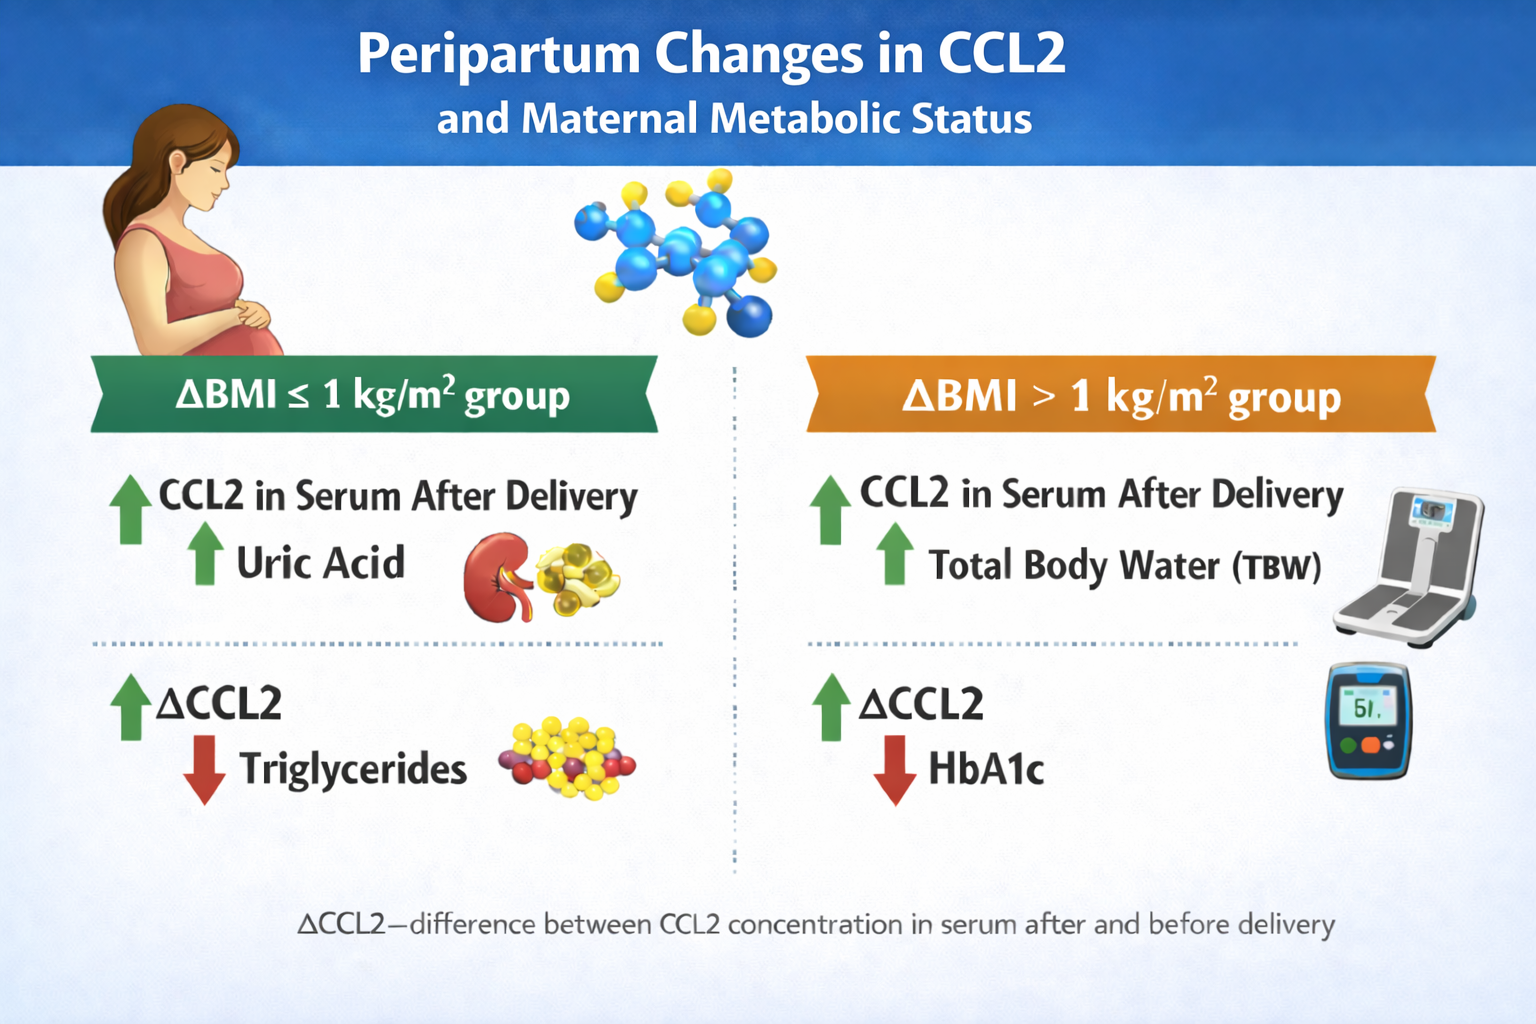
| ΔCCL2 (48 h postpartum − pre-delivery) | −2.52 ± 48.41, −0.64 | −58.45 ± 78.70, −47.79 | 0.01 * |
| CCL2 in urine at 48 h postpartum | 606.11 ± 735.34, 275.52 | 681.31 ± 776.54, 399.60 | 0.526 |
| Group/CCL2 | Pre-Pregnancy BMI | BMI on Delivery Day | BMI 48 h Postpartum | ΔBMI_g (Gestational) | ΔBMI_p (Puerperal) | ΔBMI (Total) |
|---|---|---|---|---|---|---|
| Total population | ||||||
| serum before delivery | r = 0.212 p = 0.168 | r = 0.278 p = 0.068 | r = 0.292 p = 0.055 | r = 0.198 p = 0.198 | r = −0.069 p = 0.655 | r = 0.219 p = 0.154 |
| serum after delivery | r = 0.143 p = 0.353 | r = 0.127 p = 0.412 | r = 0.064 p = 0.682 | r = −0.014 p = 0.926 | r = 0.145 p = 0.348 | r = −0.105 p = 0.497 |
| ΔCCL2 | r = −0.096 p = 0.535 | r = −0.185 p = 0.229 | r = −0.258 p = 0.091 | r = −0.262 p = 0.086 | r = 0.150 p = 0.331 | r = −0.340 p = 0.024 * |
| urine after delivery | r = −0.017 p = 0.910 | r = 0.018 p = 0.909 | r = −0.001 p = 0.996 | r = −0.042 p = 0.784 | r = 0.178 p = 0.249 | r = −0.068 p = 0.660 |
| ΔBMI ≤ 1 kg/m2 group | ||||||
| serum before delivery | r = 0.152 p = 0.500 | r = 0.111 p = 0.622 | r = 0.150 p = 0.505 | r = −0.179 p = 0.425 | r = −0.071 p = 0.755 | r = −0.016 p = 0.942 |
| serum after delivery | r = −0.084 p = 0.710 | r = −0.108 p = 0.631 | r = −0.083 p = 0.713 | r = 0.016 p = 0.942 | r = −0.093 p = 0.681 | r = 0.051 p = 0.820 |
| ΔCCL2 | r = −0.263 p = 0.238 | r = −0.256 p = 0.251 | r = −0.260 p = 0.242 | r = 0.141 p = 0.533 | r = −0.121 p = 0.590 | r = 0.091 p = 0.687 |
| urine after delivery | r = 0.061 p = 0.787 | r = 0.071 p = 0.755 | r = 0.023 p = 0.919 | r = −0.266 p = 0.231 | r = 0.069 p = 0.760 | r = −0.206 p = 0.359 |
| ΔBMI > 1 kg/m2 group | ||||||
| serum before delivery | r = 0.367 p = 0.093 | r = 0.436 p = 0.042 * | r = 0.441 p = 0.040 * | r = 0.315 p = 0.153 | r = −0.268 p = 0.228 | r = 0.150 p = 0.504 |
| serum after delivery | r = 0.265 p = 0.232 | r = 0.300 p = 0.175 | r = 0.224 p = 0.317 | r = 0.181 p = 0.420 | r = 0.373 p = 0.088 | r = −0.099 p = 0.660 |
| ΔCCL2 | r = −0.239 p = 0.284 | r = −0.299 p = 0.176 | r = −0.325 p = 0.139 | r = −0.272 p = 0.221 | r = −0.143 p = 0.526 | r = −0.173 p = 0.440 |
| urine after delivery | r = −0.009 p = 0.968 | r = 0.050 p = 0.826 | r = −0.015 p = 0.946 | r = −0.059 p = 0.795 | r = 0.460 p = 0.031 * | r = −0.371 p = 0.090 |
| Parameter | Total Study Population (n = 44) | |||
|---|---|---|---|---|
| CCL2 in Serum Before Delivery (pg/mL) | CCL2 in Serum After Delivery (pg/mL) | ΔCCL2 (pg/mL) | CCL2 in Urine After Delivery (pg/mL) | |
| HbA1c (%) | r = 0.336, p = 0.026 * | r = 0.086, p = 0.578 | r = −0.306, p = 0.043 * | r = 0.112, p = 0.469 |
| Glucose (mg/dL) | r = 0.059, p = 0.705 | r = −0.079, p = 0.609 | r = −0.023, p = 0.880 | r = −0.143, p = 0.353 |
| Insulin (mIU/L) | r = 0.038, p = 0.808 | r = 0.075, p = 0.630 | r = 0.050, p = 0.748 | r = −0.184, p = 0.233 |
| HOMA-IR | r = 0.025, p = 0.871 | r = 0.033, p = 0.830 | r = 0.070, p = 0.652 | r = −0.216, p = 0.158 |
| HDL (mg/dL) | r = −0.014, p = 0.926 | r = −0.076, p = 0.626 | r = −0.035, p = 0.821 | r = 0.041, p = 0.793 |
| LDL (mg/dL) | r = −0.13, p = 0.402 | r = 0.024, p = 0.878 | r = 0.109, p = 0.483 | r = −0.009, p = 0.955 |
| Triglycerides (mg/dL) | r = 0.094, p = 0.545 | r = −0.141, p = 0.361 | r = −0.270, p = 0.076 | r = −0.039, p = 0.800 |
| Uric acid (mg/dL) | r = 0.217, p = 0.158 | r = 0.108, p = 0.483 | r = −0.072, p = 0.644 | r = 0.034, p = 0.828 |
| Creatinine (mg/dL) | r = −0.165, p = 0.283 | r = −0.113, p = 0.463 | r = 0.155, p = 0.314 | r = −0.080, p = 0.604 |
| Ferritin (µg/L) | r = −0.023, p = 0.881 | r = 0.006, p = 0.967 | r = 0.075, p = 0.628 | r = −0.248, p = 0.104 |
| Homocysteine (µmol/L) | r = 0.249, p = 0.103 | r = 0.256, p = 0.093 | r = −0.050, p = 0.749 | r = 0.134, p = 0.387 |
| TBW (%) | r = 0.216, p = 0.159 | r = 0.223, p = 0.145 | r = −0.080, p = 0.605 | r = 0.263, p = 0.084 |
| ECW/ICW | r = 0.142, p = 0.357 | r = 0.166, p = 0.283 | r = −0.020, p = 0.896 | r = −0.173, p = 0.261 |
| LTI (kg/m2) | r = −0.021, p = 0.893 | r = 0.021, p = 0.892 | r = −0.015, p = 0.922 | r = 0.360, p = 0.016 * |
| FTI (kg/m2) | r = 0.317, p = 0.036 * | r = 0.005, p = 0.975 | r = −0.285, p = 0.060 | r = −0.205, p = 0.182 |
| BCM (kg) | r = 0.019, p = 0.904 | r = 0.082, p = 0.599 | r = 0.008, p = 0.960 | r = 0.315, p = 0.037 * |
| Parameter | Δ BMI ≤ 1 kg/m2 Group | |||
|---|---|---|---|---|
| CCL2 in Serum Before Delivery (pg/mL) | CCL2 in Serum After Delivery (pg/mL) | ΔCCL2 (pg/mL) | CCL2 in Urine After Delivery (pg/mL) | |
| HbA1c (%) | r = 0.297, p = 0.180 | r = 0.290, p = 0.191 | r = −0.187, p = 0.404 | r = 0.221, p = 0.324 |
| Glucose (mg/dL) | r = 0.209, p = 0.351 | r = 0.080, p = 0.724 | r = −0.113, p = 0.616 | r = 0.091, p = 0.686 |
| Insulin (mIU/L) | r = 0.252, p = 0.257 | r = 0.152, p = 0.500 | r = −0.075, p = 0.740 | r = −0.253, p = 0.256 |
| HOMA-IR | r = 0.205, p = 0.360 | r = 0.127, p = 0.573 | r = −0.034, p = 0.879 | r = −0.210, p = 0.349 |
| HDL (mg/dL) | r = −0.127, p = 0.575 | r = 0.042, p = 0.851 | r = 0.221, p = 0.322 | r = −0.064, p = 0.776 |
| LDL (mg/dL) | r = −0.380, p = 0.081 | r = −0.129, p = 0.568 | r = 0.146, p = 0.517 | r = −0.137, p = 0.542 |
| Triglycerides (mg/dL) | r = 0.058, p = 0.799 | r = −0.143, p = 0.526 | r = −0.469, p = 0.028 * | r = 0.184, p = 0.411 |
| Uric acid (mg/dL) | r = 0.348, p = 0.113 | r = 0.435, p = 0.043 * | r = 0.199, p = 0.374 | r = −0.044, p = 0.844 |
| Creatinine (mg/dL) | r = 0.106, p = 0.639 | r = 0.164, p = 0.464 | r = 0.184, p = 0.412 | r = 0.005, p = 0.983 |
| Ferritin (µg/L) | r = 0.230, p = 0.304 | r = 0.067, p = 0.767 | r = −0.099, p = 0.661 | r = −0.043, p = 0.850 |
| Homocysteine (µmol/L) | r = 0.208, p = 0.354 | r = 0.235, p = 0.293 | r = −0.075, p = 0.436 | r = 0.103, p = 0.648 |
| TBW (%) | r = 0.067, p = 0.766 | r = 0.026, p = 0.909 | r = −0.075, p = 0.740 | r = 0.229, p = 0.306 |
| ECW/ICW | r = 0.218, p = 0.330 | r = 0.137, p = 0.543 | r = 0.059, p = 0.793 | r = −0.133, p = 0.555 |
| LTI (kg/m2) | r = −0.208, p = 0.353 | r = −0.108, p = 0.633 | r = −0.026, p = 0.909 | r = 0.358, p = 0.102 |
| FTI (kg/m2) | r = 0.286, p = 0.197 | r = −0.008, p = 0.970 | r = −0.280, p = 0.207 | r = −0.181, p = 0.421 |
| BCM (kg) | r = −0.132, p = 0.559 | r = −0.094, p = 0.678 | r = −0.084, p = 0.711 | r = 0.407, p = 0.060 |
| Parameter | ΔBMI > 1 kg/m2 Group | |||
|---|---|---|---|---|
| CCL2 in Serum Before Delivery (pg/mL) | CCL2 in Serum After Delivery (pg/mL) | ΔCCL2 (pg/mL) | CCL2 in Urine After Delivery (pg/mL) | |
| HbA1c (%) | r = 0.370, p = 0.090 | r = −0.141, p = 0.530 | r = −0.561, p = 0.007 * | r = −0.081, p = 0.721 |
| Glucose (mg/dL) | r = −0.103, p = 0.648 | r = −0.286, p = 0.197 | r = 0.003, p = 0.990 | r = −0.301, p = 0.174 |
| Insulin (mIU/L) | r = −0.115, p = 0.611 | r = −0.022, p = 0.922 | r = 0.082, p = 0.717 | r = −0.020, p = 0.931 |
| HOMA-IR | r = −0.153, p = 0.498 | r = −0.132, p = 0.559 | r = 0.091, p = 0.685 | r = −0.198, p = 0.378 |
| HDL (mg/dL) | r = 0.020, p = 0.930 | r = −0.123, p = 0.585 | r = −0.163, p = 0.469 | r = 0.105, p = 0.643 |
| LDL (mg/dL) | r = 0.149, p = 0.507 | r = 0.155, p = 0.490 | r = −0.112, p = 0.618 | r = 0.171, p = 0.448 |
| Triglycerides (mg/dL) | r = 0.178, p = 0.428 | r = −0.160, p = 0.476 | r = −0.212, p = 0.344 | r = −0.227, p = 0.310 |
| Uric acid (mg/dL) | r = 0.121, p = 0.591 | r = −0.238, p = 0.286 | r = −0.360, p = 0.100 | r = 0.080, p = 0.722 |
| Creatinine (mg/dL) | r = −0.474, p = 0.026 * | r = −0.363, p = 0.097 | r = 0.291, p = 0.189 | r = −0.200, p = 0.372 |
| Ferritin (µg/L) | r = −0.287, p = 0.195 | r = −0.105, p = 0.641 | r = 0.189, p = 0.400 | r = −0.515, p = 0.014 * |
| Homocysteine (µmol/L) | r = 0.270, p = 0.224 | r = 0.274, p = 0.217 | r = −0.159, p = 0.479 | r = 0.097, p = 0.669 |
| TBW (%) | r = 0.267, p = 0.229 | r = 0.473, p = 0.026 * | r = −0.025, p = 0.911 | r = 0.213, p = 0.341 |
| ECW/ICW | r = 0.034, p = 0.881 | r = 0.235, p = 0.292 | r = 0.076, p = 0.736 | r = −0.219, p = 0.329 |
| LTI (kg/m2) | r = 0.179, p = 0.425 | r = 0.235, p = 0.292 | r = −0.022, p = 0.922 | r = 0.334, p = 0.128 |
| FTI (kg/m2) | r = 0.321, p = 0.145 | r = 0.002, p = 0.994 | r = −0.317, p = 0.151 | r = −0.296, p = 0.181 |
| BCM (kg) | r = 0.085, p = 0.706 | r = 0.229, p = 0.306 | r = 0.034, p = 0.881 | r = 0.280, p = 0.207 |
Disclaimer/Publisher’s Note: The statements, opinions and data contained in all publications are solely those of the individual author(s) and contributor(s) and not of MDPI and/or the editor(s). MDPI and/or the editor(s) disclaim responsibility for any injury to people or property resulting from any ideas, methods, instructions or products referred to in the content. |
© 2026 by the authors. Licensee MDPI, Basel, Switzerland. This article is an open access article distributed under the terms and conditions of the Creative Commons Attribution (CC BY) license.
Share and Cite
Obuchowska-Standyło, A.; Kimber-Trojnar, Ż.; Trojnar, K.; Czuba, M.; Leszczyńska-Gorzelak, B. Are Peripartum Changes in CCL2 Associated with Maternal Metabolic Status? Curr. Issues Mol. Biol. 2026, 48, 143. https://doi.org/10.3390/cimb48020143
Obuchowska-Standyło A, Kimber-Trojnar Ż, Trojnar K, Czuba M, Leszczyńska-Gorzelak B. Are Peripartum Changes in CCL2 Associated with Maternal Metabolic Status? Current Issues in Molecular Biology. 2026; 48(2):143. https://doi.org/10.3390/cimb48020143
Chicago/Turabian StyleObuchowska-Standyło, Aleksandra, Żaneta Kimber-Trojnar, Katarzyna Trojnar, Monika Czuba, and Bożena Leszczyńska-Gorzelak. 2026. "Are Peripartum Changes in CCL2 Associated with Maternal Metabolic Status?" Current Issues in Molecular Biology 48, no. 2: 143. https://doi.org/10.3390/cimb48020143
APA StyleObuchowska-Standyło, A., Kimber-Trojnar, Ż., Trojnar, K., Czuba, M., & Leszczyńska-Gorzelak, B. (2026). Are Peripartum Changes in CCL2 Associated with Maternal Metabolic Status? Current Issues in Molecular Biology, 48(2), 143. https://doi.org/10.3390/cimb48020143