


Abstract
A central debate in metacommunity theory concerns how the relative importance of ecological processes varies with spatial scale. We addressed this by integrating global soil fauna metacommunity datasets to analyze the effects of spatial extent (the specific dimension of scale examined) and environmental factors on metacommunity patterns using Bayesian models. Results suggested that increasing spatial extent was strongly associated with a higher prevalence of Clementsian patterns. Notably, this relationship was not explained by the concomitant environmental variables, which may be consistent with the influence of latent spatial properties (e.g., dispersal limitation) or unobserved environmental heterogeneity at broader scales. Conversely, environmental factors independently were associated with other patterns. Notably, the effect of soil nitrogen on checkerboard patterns was context-dependent: it suppressed species segregation under low spatial turnover (βSIM) but potentially weakened or shifted to facilitation under high turnover. This suggests that resource enrichment alters the balance between niche-based and neutral processes. Although further verification in under-sampled climatic zones is required, our synthesis supports a hierarchical driver framework: spatial extent emerges as a key correlation of broad distributional order, whereas resource availability is suggested to regulate the prevalence of competitive exclusion at finer resolutions.
1. Introduction
Unraveling community patterns and their underlying assembly mechanisms is a central issue in community ecology [1]. However, traditional research methods face significant limitations in analyzing community assembly processes across different spatial scales [2]. In this context, metacommunity theory provides an effective and unified framework for integrating multi-scale ecological processes. This theory treats a group of local communities—connected by the dispersal of multiple potentially interacting species—as an integrated whole [3,4], and explores the mechanisms of community assembly by simultaneously considering ecological processes at various scales [5].
Metacommunity theory posits that community structure is driven by the relative importance of four processes: environmental filtering, dispersal limitation, interspecific interactions, and ecological drift [6]. Based on the Elements of Metacommunity Structure (EMS) framework, six idealized metacommunity patterns can be identified: (1) Random, a pattern consistent with neutral theory predictions of ecological drift [7]; (2) Clementsian, characterized by coherent units with discrete boundaries shaped by environmental factors; (3) Gleasonian, reflecting individualistic species responses to environmental gradients; (4) Evenly spaced gradients, indicating a uniform distribution of species along environmental gradients driven by strong interspecific competition; (5) Checkerboard, where highly overlapping niches and mutually exclusive ranges suggest intense interspecific competition; and (6) Nested, where species-poor communities constitute ordered subsets of species-rich communities [8]. Additionally, when ecological processes are weak, quasi-structures emerge as intermediates between these idealized patterns [9].
Although metacommunity theory provides a powerful tool for understanding multi-scale community assembly, controversy remains regarding the impact of spatial scale on these assembly processes. Some studies suggest that as the spatial extent expands, environmental heterogeneity typically increases, leading to the dominance of deterministic processes driven by broad environmental gradients, thereby promoting the formation of Clementsian patterns [10,11,12,13]. Conversely, other studies suggest that even at larger scales, the influence of stochastic processes cannot be ignored and may even play a dominant role [14,15,16].
These controversies highlight significant limitations in our current understanding of the mechanisms underlying scale effects. First, the relationship between spatial scale and ecological processes is complex and regulated by factors such as species dispersal capacity, ecosystem type, and environmental gradients [17,18]. This obscures the pathways through which scale effects operate, making it difficult to determine whether the influence of expanding spatial extent on ecological processes is primarily indirect (mediated through environmental heterogeneity) or direct (arising from the spatial attributes of scale itself, such as dispersal constraints). Second, traditional metacommunity studies rely on variance partitioning to quantify the explanatory power of ‘pure environmental’ and ‘pure spatial’ factors [19,20,21]. Although these studies provide a wealth of case evidence, the derived effect sizes are highly dependent on specific research designs. This hinders direct comparison and integration of results across different studies [22], thereby complicating the reconciliation of conflicting case studies [23]. Therefore, there is an urgent need for a method that can quantify scale contributions and enable cross-study comparisons within a unified framework.
To address the aforementioned issues, this study focuses on soil fauna. Soil fauna are diverse, highly sensitive to environmental factors, and possess highly differentiated ecological niches [24,25], making them an ideal model system for exploring multi-scale community assembly mechanisms. Departing from the traditional approach of integrating effect sizes, this study integrates raw data to construct a standardized dataset and employs Bayesian models to directly quantify the influence of spatial extent (the specific dimension of scale examined) and environmental heterogeneity on the probability of occurrence of various community patterns. To deepen the mechanistic understanding of these patterns, we explicitly hypothesize that the effect of environmental factors is modulated by community assembly processes. The premise of this hypothesis is that under conditions of high environmental heterogeneity and an assembly context dominated by environmental selection, species distributions exhibit more pronounced niche differentiation [26]. Conversely, under conditions of strong environmental homogeneity and significant dispersal limitation, community assembly is more likely to be dominated by local ecological processes such as neutral processes or interspecific competition.
Specifically, this study aims to answer three scientific questions: (1) On a global level, does an increase in spatial extent directly and significantly increase the probability of Clementsian patterns, thereby providing evidence for the theoretical expectation that the species sorting paradigm dominates at broader spatial extents? (2) If effects of spatial extent exist, is their influence on Clementsian patterns mediated through measured environmental gradients or driven by the spatial attributes inherent to spatial extent? Additionally, do environmental factors have a direct effect on other specific patterns? (3) At the landscape level, does the effect of environmental factors depend on community assembly processes represented by spatial turnover?
By employing this ‘scale–environment–process’ conceptual framework, this study aims to transcend the limitations of traditional qualitative descriptions and incomparable effect sizes. In doing so, we seek to provide quantitative and generalizable evidence addressing the long-standing scale debate in metacommunity theory, thereby offering more reliable theoretical tools for predicting multi-scale community patterns of soil fauna in the context of global change.
2. Materials and Methods
2.1. Data Acquisition and Inclusion Criteria
Methods integrating multiple data sources are widely applied in ecological meta-analyses [27,28,29] to enhance statistical power [30], reduce publication bias [31], and improve the ecological representativeness of datasets [32]. Our dataset construction followed a two-step process to maximize data coverage. The dataset was anchored by 20 datasets derived from the study by Sun et al. [33], selected for the availability of raw site-by-species incidence matrices and precise spatial coordinates. This baseline ensured that all subsequent studies identified via systematic search possessed the necessary data granularity for EMS analysis. Second, a systematic search was conducted across three databases: Web of Science, PubMed, and China National Knowledge Infrastructure (CNKI), covering the period from each database’s inception to 20 July 2024. The search strategy focused on keywords related to “metacommunity” (or “metapopulation”) and “soil fauna” (including related taxonomic groups). To minimize the risk of missing relevant studies, composite search strings incorporating broad synonyms and related terms were constructed for each database (Table A1) [34].
Inclusion was assessed based on three criteria: (1) soil fauna (including epigeic arthropods) was the primary study subject; (2) the study applied the EMS framework to analyze metacommunity patterns, or provided a site-by-species incidence matrix suitable for such analysis; and (3) the study explicitly reported the study site, taxa, and spatial extent.
Two independent reviewers screened article titles and abstracts; disagreements were resolved through consultation or adjudication by a third reviewer. This process identified 80 studies focusing on soil fauna metacommunities. Following full-text screening against the inclusion criteria, 23 additional studies yielding 139 independent metacommunities (or matrices) were retained (Figure A1). Combining these with the foundational data mentioned above, the final dataset comprised 24 studies and 159 soil fauna metacommunities. These metacommunities covered a broad spatial gradient, with the sampling effort underlying individual matrices ranging from intensive surveys within a single locality to broad-scale investigations covering up to 79 distinct sampling sites.
In terms of biotic composition, data were categorized into broad taxonomic groups. Specifically, Coleoptera (beetles) constituted the largest proportion of the dataset (n = 61, 38.4%), followed by Acari (mites; n = 27, 17.0%), Collembola (springtails; n = 25, 15.7%), and Nematoda (n = 15, 9.4%). Broadly classified mixed epigeic arthropods (n = 20, 12.6%) and other minor groups (e.g., Araneae, Hymenoptera; n = 11, 6.9%) accounted for the remainder. Geographically, taxonomic distribution was uneven. For instance, while Coleoptera datasets were widely distributed across Europe, East Asia, North America, and the Southern Hemisphere, Acari and mixed epigeic arthropod datasets were predominantly derived from Europe, East Asia, and North America. Notably, Collembola data were exclusively sourced from East Asia and North America, whereas Nematoda datasets were restricted to East Asia.
2.2. Data Extraction and Preprocessing
The following data were extracted from eligible studies: bibliographic details (title, study/data ID); basic information (study period, spatial extent, target taxa, habitat, sample size, geographic coordinates, land use type); climatic factors (mean annual temperature [MAT], mean annual precipitation [MAP], monthly mean maximum temperature [Tmax], monthly mean minimum temperature [Tmin], monthly mean maximum precipitation [Pmax], monthly minimum precipitation [Pmin], precipitation concentration index [PCI]); soil parameters (soil organic carbon [SOC], total nitrogen [TN], pH, bulk density [BD], cation exchange capacity [cec], clay content, silt content, sand content); and metacommunity characteristics (Beta diversity index βSOR and its components βSIM and βNES, and metacommunity pattern types determined via EMS analysis).
To address missing data in the literature, the following methods were employed:
(1) Missing climate and soil data were extracted from the WorldClim 2.1 database [35] (resolution 1 km) and the SoilGrids database [36] (resolution 250 m), based on the geographic coordinates of the study sites.
(2) Missing metacommunity pattern types were identified using the EMS framework based on site-by-species incidence matrices provided in the literature. Specifically, EMS analysis was performed using the Metacommunity function in the metacom package [37] in R 4.3.3, employing the ‘r00’ null model. This framework sequentially evaluates coherence, species turnover, and boundary clumping to classify pattern types.
The classification process is as follows: First, coherence is evaluated; if non-significant, the pattern is classified as Random. Significantly negative coherence indicates a Checkerboard pattern. If coherence is significantly positive, species turnover is assessed: significantly negative turnover corresponds to a Nested pattern; significantly positive turnover with significant boundary clumping (Index > 1) indicates a Clementsian pattern; random boundary distribution indicates a Gleasonian pattern; and hyperdispersed boundaries (Index < 1) define an Evenly spaced gradient. Additionally, quasi-structures are identified when coherence is significantly positive but turnover is non-significant, with boundary distributions consistent with specific idealized patterns [9].
(3) Missing Beta diversity indices were calculated using site-by-species incidence matrices in R with the betapart package [38]. Specifically, total Beta diversity (Sørensen index, βSOR) was partitioned into two components: spatial turnover (βSIM) and nestedness-resultant dissimilarity (βNES). Subsequently, z-values were calculated to assess significance based on the ‘r1’ null model constraint (10,000 simulations) [39].
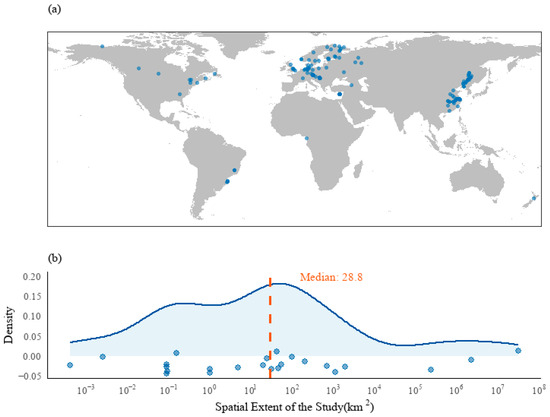
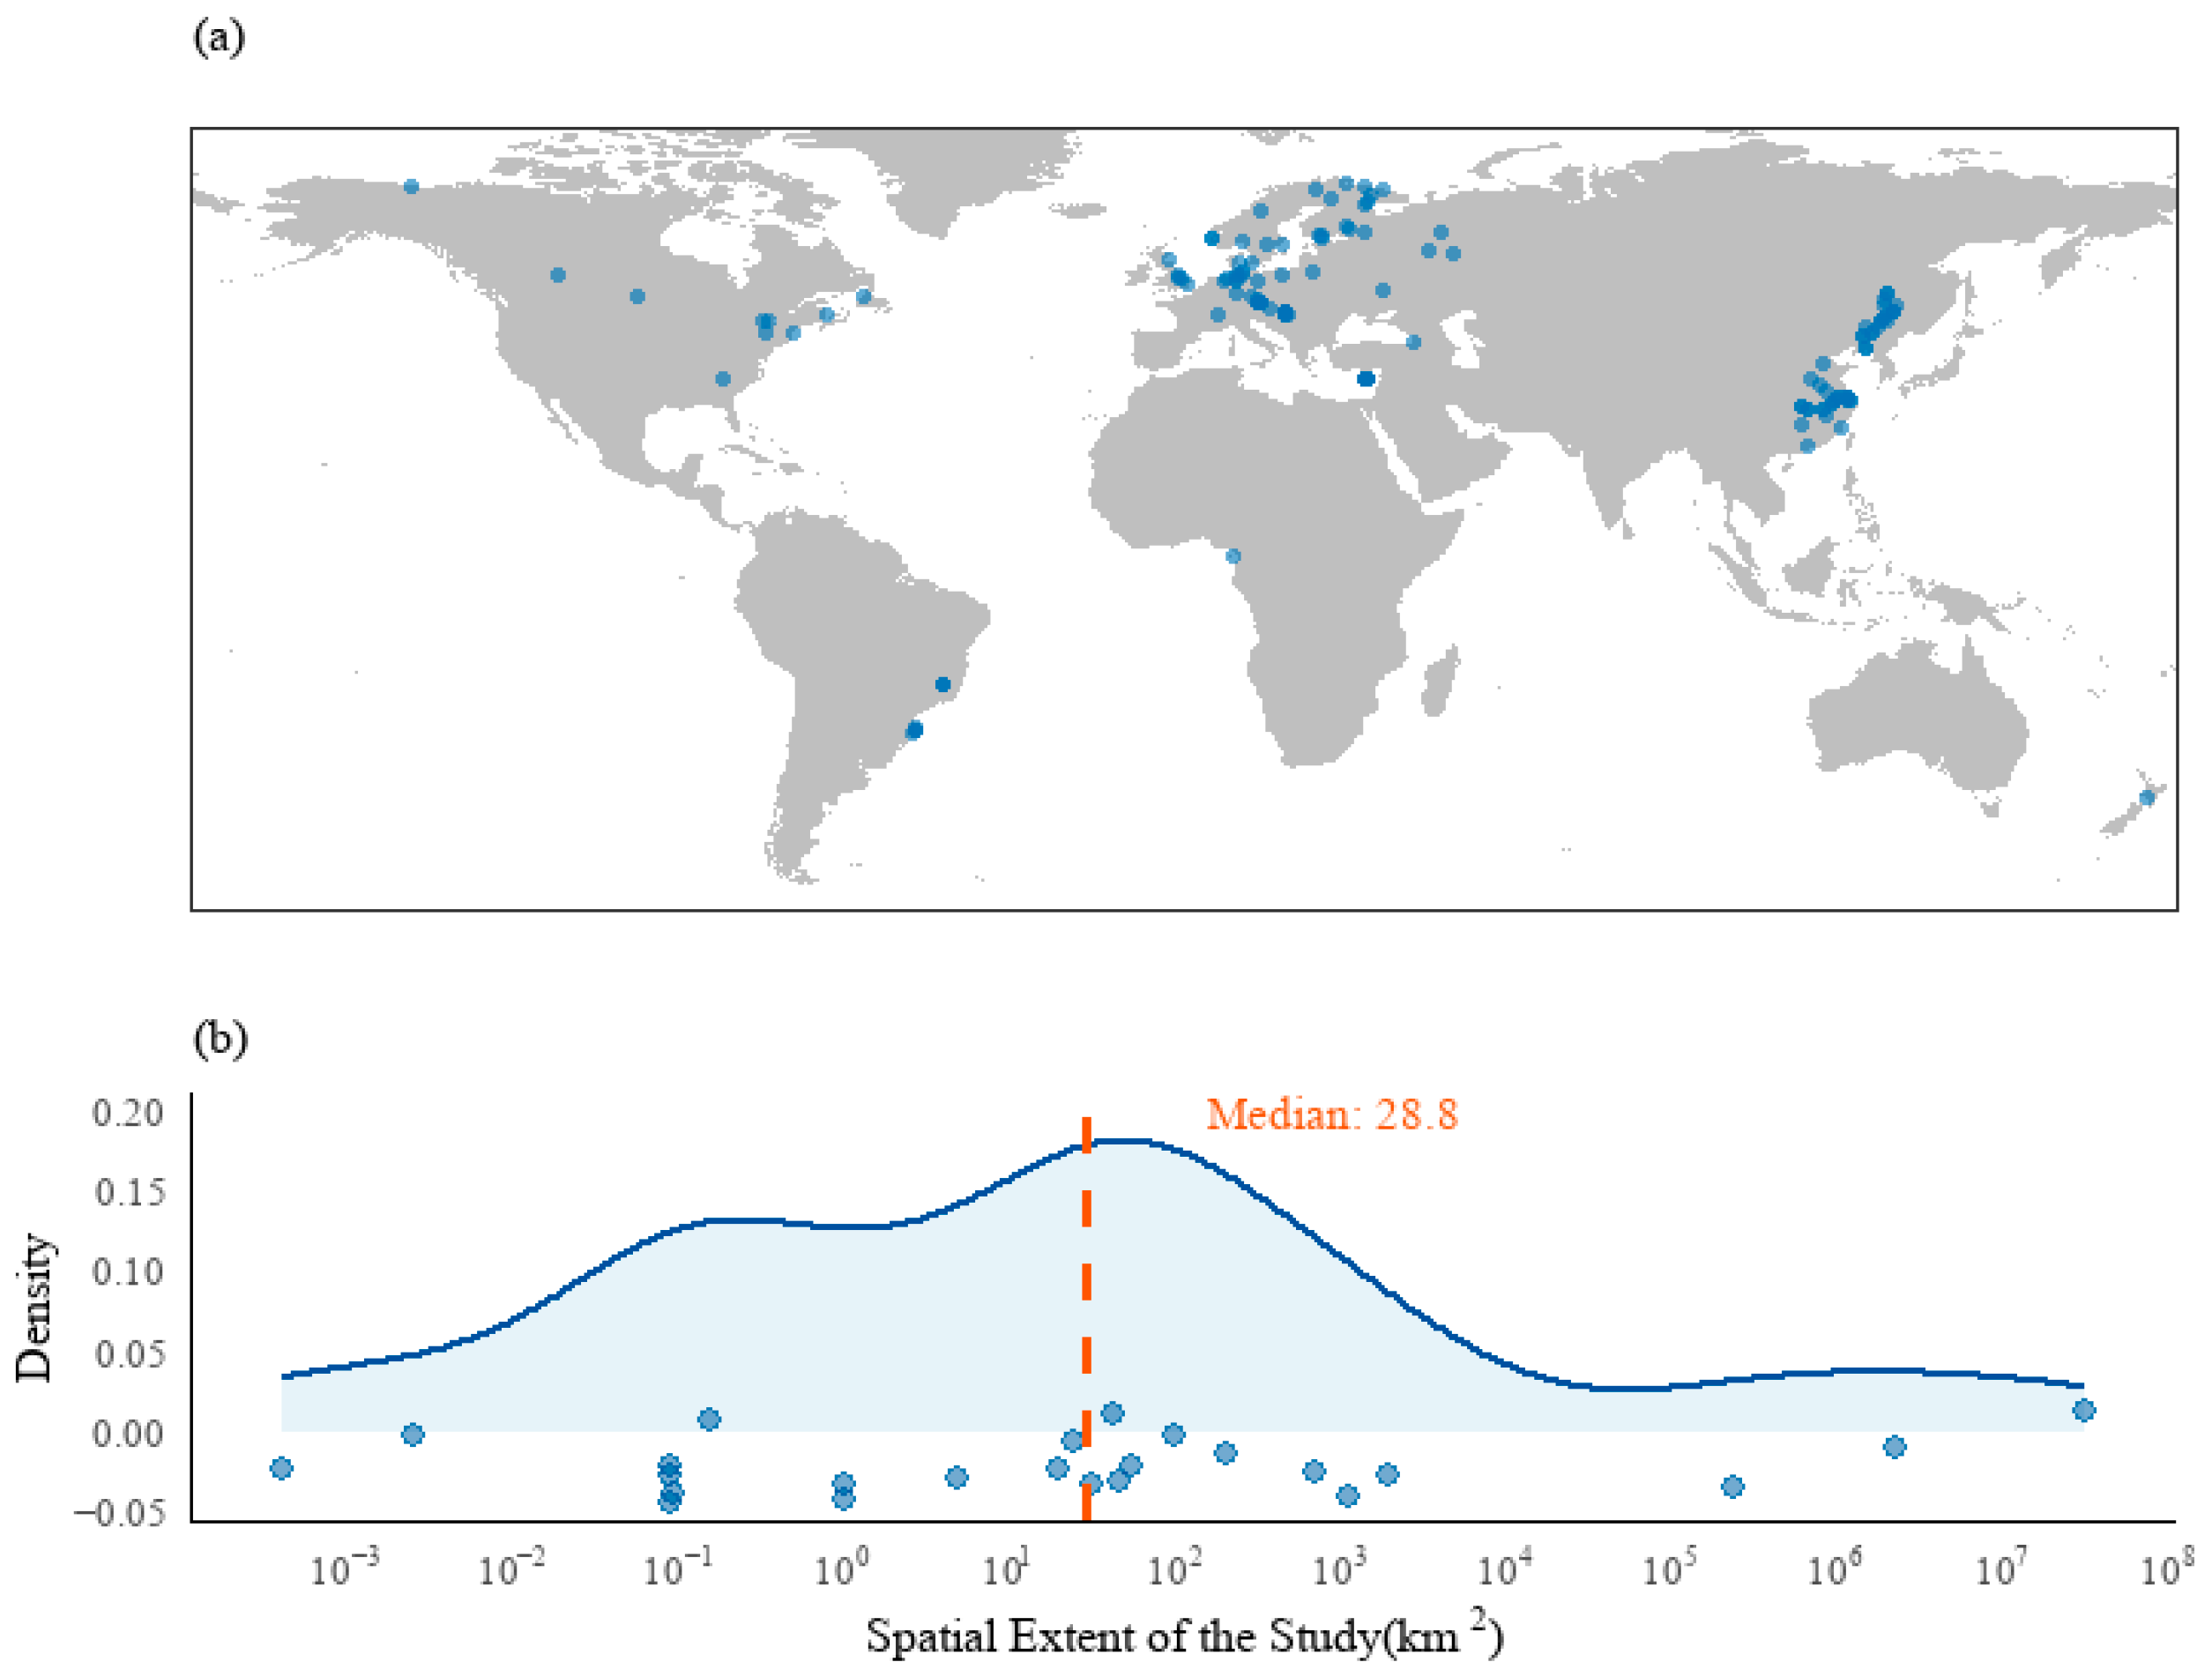
The compiled dataset (Data S1) shows that global soil fauna metacommunity study sites are mainly distributed in Europe, East Asia, and North America (Figure 1a). The median spatial extent is 28.8 km2, with most studies concentrated around 32.3 km2 (Figure 1b).
Figure 1.
Global distribution of sampling sites and spatial extent characteristics in soil fauna metacommunity research: (a) The global locations of the sampling sites, with blue dots representing individual sites; (b) the distribution of study spatial extent. The density plot shows the log distribution of the study spatial extent (km2). The vertical dashed line indicates the median value across all studies. The blue dots are jittered points along the x-axis.
2.3. Bayesian Multinomial Logistic Mixed-Effects Model
To evaluate the effects of spatial extent and environmental factors on metacommunity patterns and to fully utilize the available data for stepwise validation, this study employed a hierarchical Bayesian modeling strategy. All models were fitted in R using the brms package [40].
To account for data non-independence and macro-climatic heterogeneity, we modeled ‘Study ID’ and ‘Climatic Zone’ as crossed random intercepts—(1|Study_ID) + (1|Climatic Zone)—in all models. This structure accommodates global studies spanning multiple climatic regions. Climatic zones were assigned based on study area geometric centroids using the Köppen–Geiger system. Complementing this global approach, the landscape-level analysis was employed to serve a dual purpose: beyond elucidating the interaction between environmental factors and assembly processes, it functions as a robust sensitivity check for the global-level analysis.
The response variable was the categorical variable “metacommunity pattern type.” Model estimation was performed using the Markov chain Monte Carlo (MCMC) method: four independent chains were run, each with 8000 iterations. The first 4000 iterations were discarded as warm-up, yielding 4000 post-warmup samples per chain (a total of 16,000 posterior samples). Weakly informative priors, Normal(0, 1), were used for fixed-effect coefficients, and the standard deviation of random intercepts was assigned an Exponential(1) prior [41]. Model convergence was assessed using the R-hat statistic (≈1.0) and effective sample size (ESS > 1000).
2.3.1. Variable Preprocessing and Collinearity Control
Prior to modeling, all continuous predictor variables underwent preprocessing. The study spatial extent variable, which was highly right-skewed, was log10-transformed to improve normality [42]. Subsequently, the transformed spatial extent variable and all other continuous independent variables were standardized (Z-score normalization) to eliminate dimensional differences [43].
A Pearson correlation matrix for all numerical variables was calculated using R (variables with |ρ| > 0.7 were considered highly correlated). To address multicollinearity, variance inflation factors (VIFs) were calculated using the car package [44]. A stepwise selection procedure was employed: covariates with the highest VIF were removed sequentially, and VIFs were recalculated after each removal. This process was repeated until all remaining predictors had a VIF below the preset threshold of 2 [42].
2.3.2. Spatial Extent-Dependent Model
To directly verify the effect of spatial extent on metacommunity patterns, a Bayesian multinomial mixed-effects model was constructed. This model included spatial extent as the sole fixed effect, aiming to exclude the confounding influence of environmental heterogeneity and rigorously test whether spatial extent itself is a strong driving factor. Due to insufficient sample size, the EMS method could not be applied to four of the collected metacommunities. Consequently, the final model was fitted to 155 observational samples from 24 independent studies.
2.3.3. Spatial Extent-Driven Mechanism Model
Building on the identified core role of spatial extent, a second Bayesian model was constructed to explore the environmental pathways mediating these effects and to identify key environmental drivers. This model incorporated all environmental and spatial variables that passed the collinearity check, as well as categorical variables (body size class, habitat type). The response variable was the metacommunity pattern type. Given that sample sizes for Gleasonian (n = 7) and Evenly spaced gradient (n = 0) patterns were insufficient for stable parameter estimation, these categories were excluded from this stage of analysis, consistent with similar ecological studies [45]. The final analysis included Random (n = 42), Checkerboard (n = 31), Nested (n = 31), Quasi-structures (n = 18), and Clementsian (n = 20) patterns. The model was fitted to 142 metacommunities (from 21 independent studies).
Model comparison was based on the Leave-One-Out Information Criterion (LOO-IC) rather than p-values [46]. The 95% posterior credible interval (CI) for each variable was checked sequentially. If the CI for a variable overlapped zero, the variable was tentatively removed from the model. According to the principle of parsimony [47], if the LOO-IC of the simplified model did not increase significantly (i.e., the absolute difference in LOO-IC was less than twice its standard error), the variable was excluded from the final model [39].
Finally, to test whether the effects of spatial extent are mediated by environmental gradients, Bayesian mediation analysis was employed to quantify direct and indirect effects. Specifically, Principal Component Analysis (PCA) was performed to reduce the dimensionality of environmental variables and extract major environmental gradients. Two models were fitted: the Pathway A model (Spatial Extent → Environmental Gradient) and the Pathway B model (Environmental Gradient → Clementsian pattern, controlling for Spatial Extent). The indirect effect was calculated as the product of the posterior distributions of path coefficients A and B (A × B), yielding the posterior distribution of the indirect effect. The direct effect was extracted directly from the posterior distribution of the spatial extent coefficient in the Pathway B model [48].
2.3.4. Mechanistic Model of Environmental Factor Influence
To quantitatively examine the interaction between environmental drivers and community assembly processes, the spatial turnover component (βSIM) was employed as a proxy. According to Baselga’s framework [49], this indicator represents spatial turnover (species replacement) driven by environmental selection or dispersal limitation, and also indicates environmental heterogeneity [50,51]. The analysis focused on the landscape level (study area < 100 km2). This level represents a typical context at which local processes and environmental gradients jointly shape the spatial patterns of metacommunities [52]. At this level, the interaction between environmental heterogeneity and local ecological processes is fully manifested, allowing this analysis to function as both a precise mechanistic evaluation and a robust sensitivity check for the global-level analysis.
A statistical model incorporating interaction terms between environmental factors and spatial turnover (βSIM) was constructed. In this landscape-level analysis, pattern types with insufficient sample sizes, such as Clementsian (n = 2) and Gleasonian (n = 7), were excluded. Consequently, the final analysis included four types of patterns: Random (n = 31), Checkerboard (n = 14), Nested (n = 20), and Quasi-structures (n = 16).
Model comparison results based on LOO-IC indicated that the model including the interaction term between soil total nitrogen and spatial turnover (TN × βSIM) exhibited the best predictive performance, and this interaction term was statistically significant. Furthermore, the posterior estimates of other fixed effects remained stable across different models with consistent significance levels, indicating that the inclusion of the interaction term did not confound the interpretation of other variables. Other interaction terms were removed following the model comparison criteria described above.
3. Results
3.1. Effects of Spatial Extent on Metacommunity Patterns
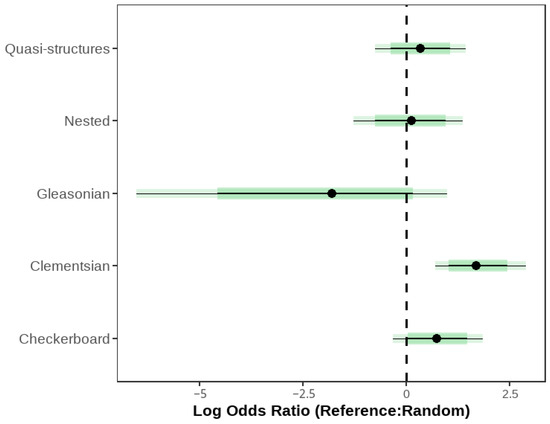
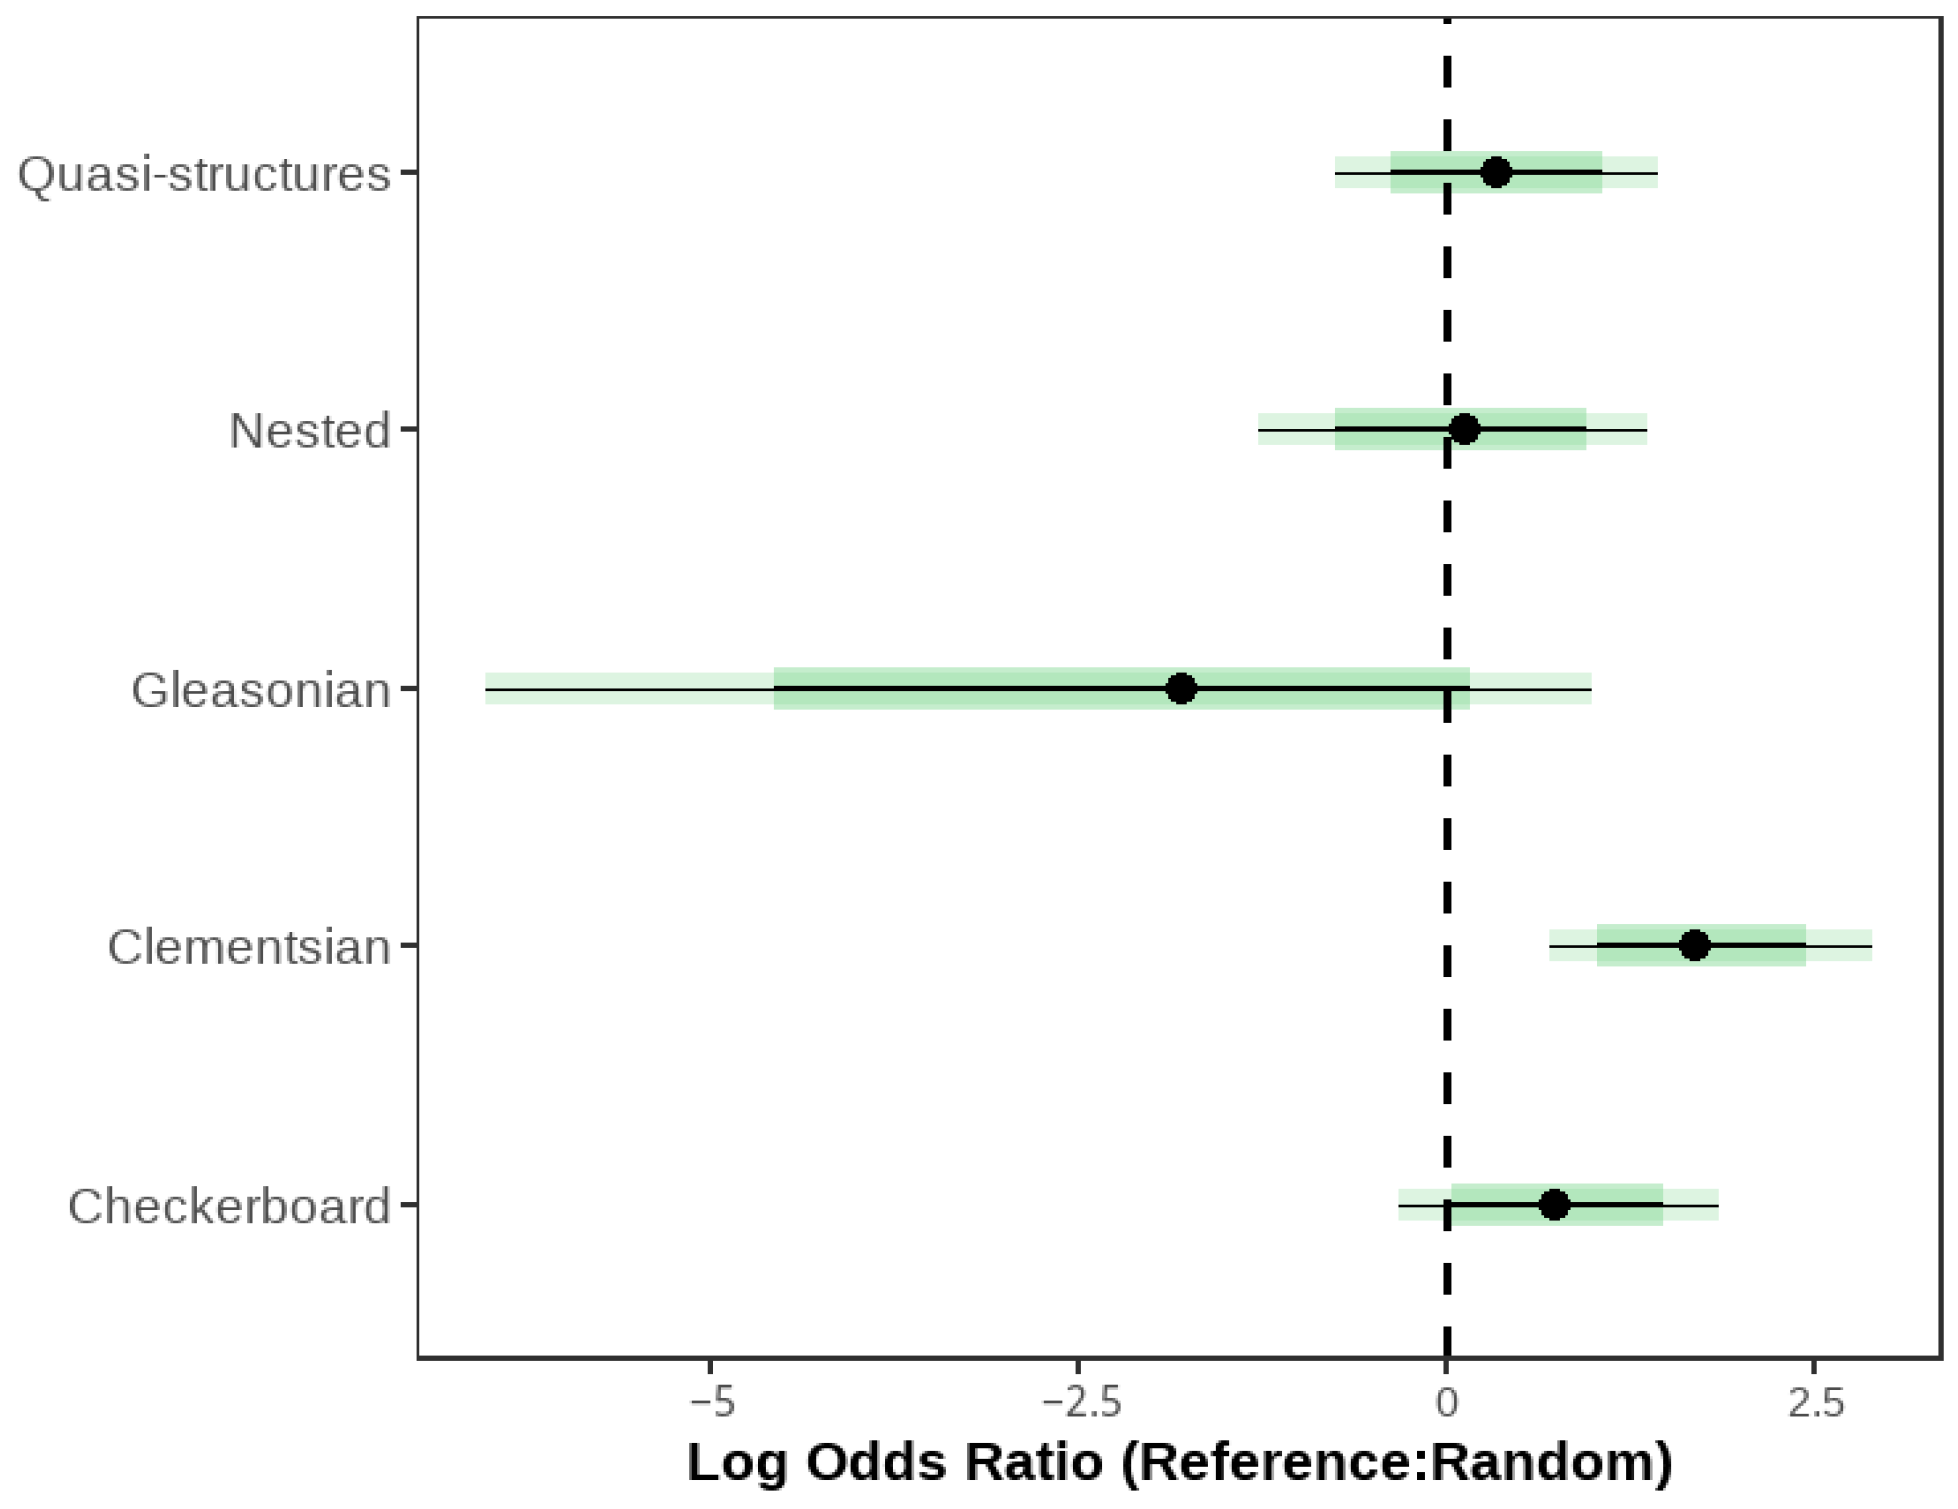
The analysis revealed a significant dependence of metacommunity patterns on spatial extent: spatial extent exhibited a strong and significant positive effect on the probability of observing Clementsian patterns (β = 1.71, 95% CrI: 0.70 to 2.89). This coefficient represents the log-odds, indicating that for each standard deviation increase in spatial extent (corresponding to a 269-fold increase in the original spatial extent), the odds of a Clementsian pattern occurring relative to a Random pattern increase by a factor of approximately exp(1.71) (Odds Ratio ≈ 5.5) (Figure 2). This result suggests that an increase in spatial extent significantly enhances the relative importance of deterministic processes such as environmental filtering, while reducing the dominance of random patterns representing neutral processes.
Figure 2.
Posterior distributions of the direct effects of spatial extent expansion on the occurrence probabilities of metacommunity patterns, derived from a Bayesian model. Points represent posterior median estimates. Thick and thin horizontal bars denote the 80% and 95% credible intervals (CrI), respectively. The vertical dashed line indicates an effect size of zero; positive values signify a higher probability of the pattern occurring compared to a random pattern, whereas negative values signify a lower probability. Effects are considered statistically significant if the 95% CrI excludes zero. The y-axis labels (e.g., Clementsian, Checkerboard) refer to the respective metacommunity patterns.
3.2. Driving Mechanisms of Spatial Extent
Following the confirmation of the central role of spatial extent, the analysis was extended to models incorporating environmental variables to explore potential macro-environmental mediation pathways. Results revealed that the positive effect of spatial extent on Clementsian patterns remained robust in this model (β = 1.70, 95% CrI: 0.56 to 3.06); the effect was neither substantially attenuated nor rendered non-significant after the inclusion of environmental variables. Moreover, the environmental gradients within the model were not significant predictors of Clementsian patterns. Mediation analysis further confirmed that while the direct effect of spatial extent on Clementsian patterns was significant, the indirect effect via environmental gradients was not (β = −0.0004, 95% CrI: −0.105 to 0.081). This suggests that the effect of spatial extent was not mediated by the environmental gradient measured in this study.
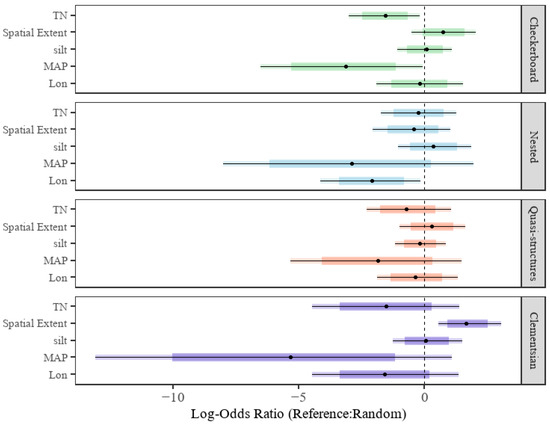
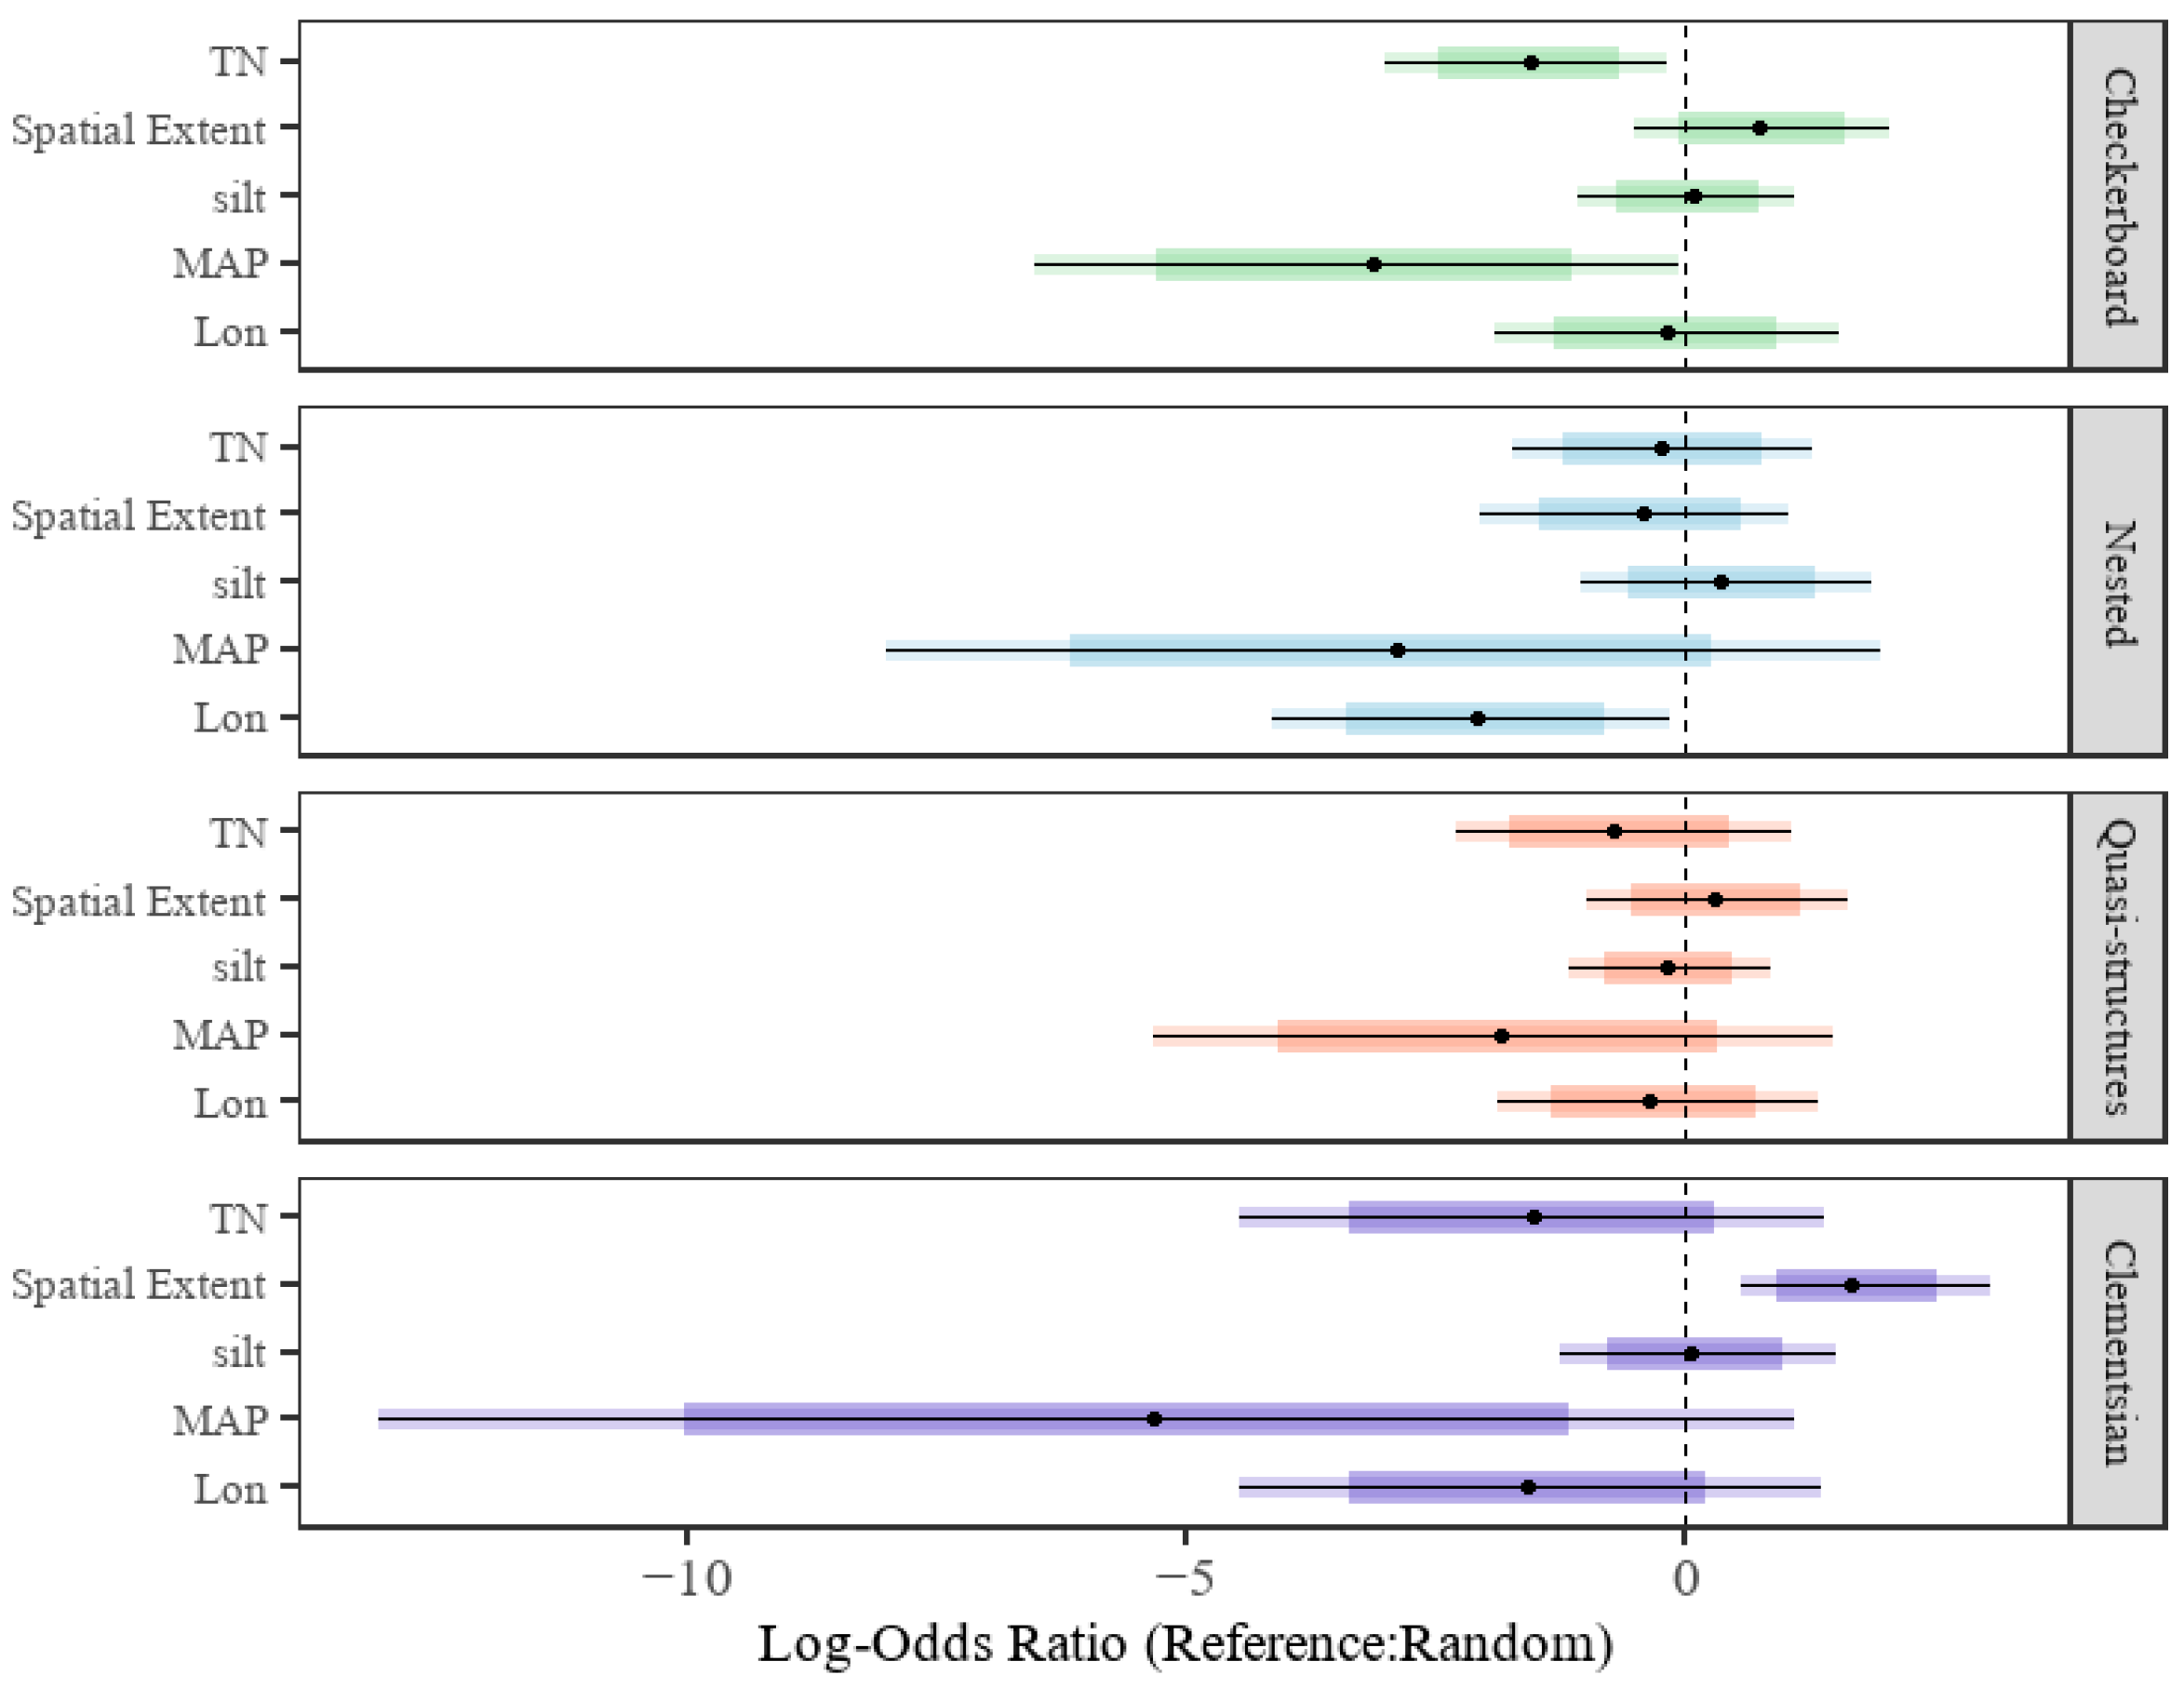
However, environmental filtering played a significant role in shaping other pattern types. Specifically, Checkerboard patterns were significantly and negatively associated with soil total nitrogen (β = −1.56, 95% CrI: −3.00 to −0.17) and annual precipitation (β = −3.17, 95% CrI: −6.50 to −0.07), while Nested patterns were significantly negatively associated with longitude (β = −2.09, 95% CrI: −4.14 to −0.15) (Figure 3).
Figure 3.
Fixed effects of environmental factors on the occurrence probability of metacommunity patterns, derived from Bayesian multinomial logistic regression. Points represent posterior median estimates. Thick and thin horizontal lines indicate the 80% and 95% credible intervals (CrI), respectively. The vertical dashed line marks zero effect size; positive values indicate a higher probability of the pattern occurring relative to the Random pattern, while negative values indicate a lower probability. Abbreviations: TN, total soil nitrogen; silt, soil silt content; MAP, mean annual precipitation; Lon, longitude.
3.3. Mechanisms of Environmental Factors at the Landscape Level
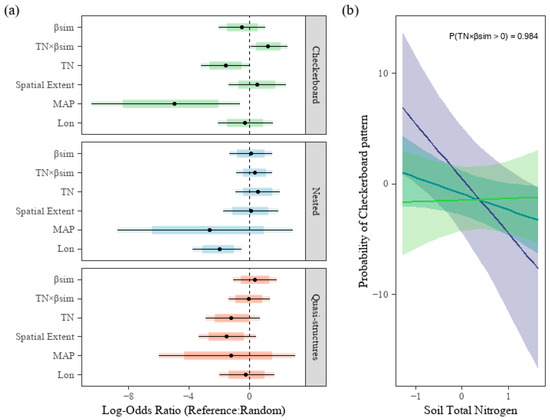
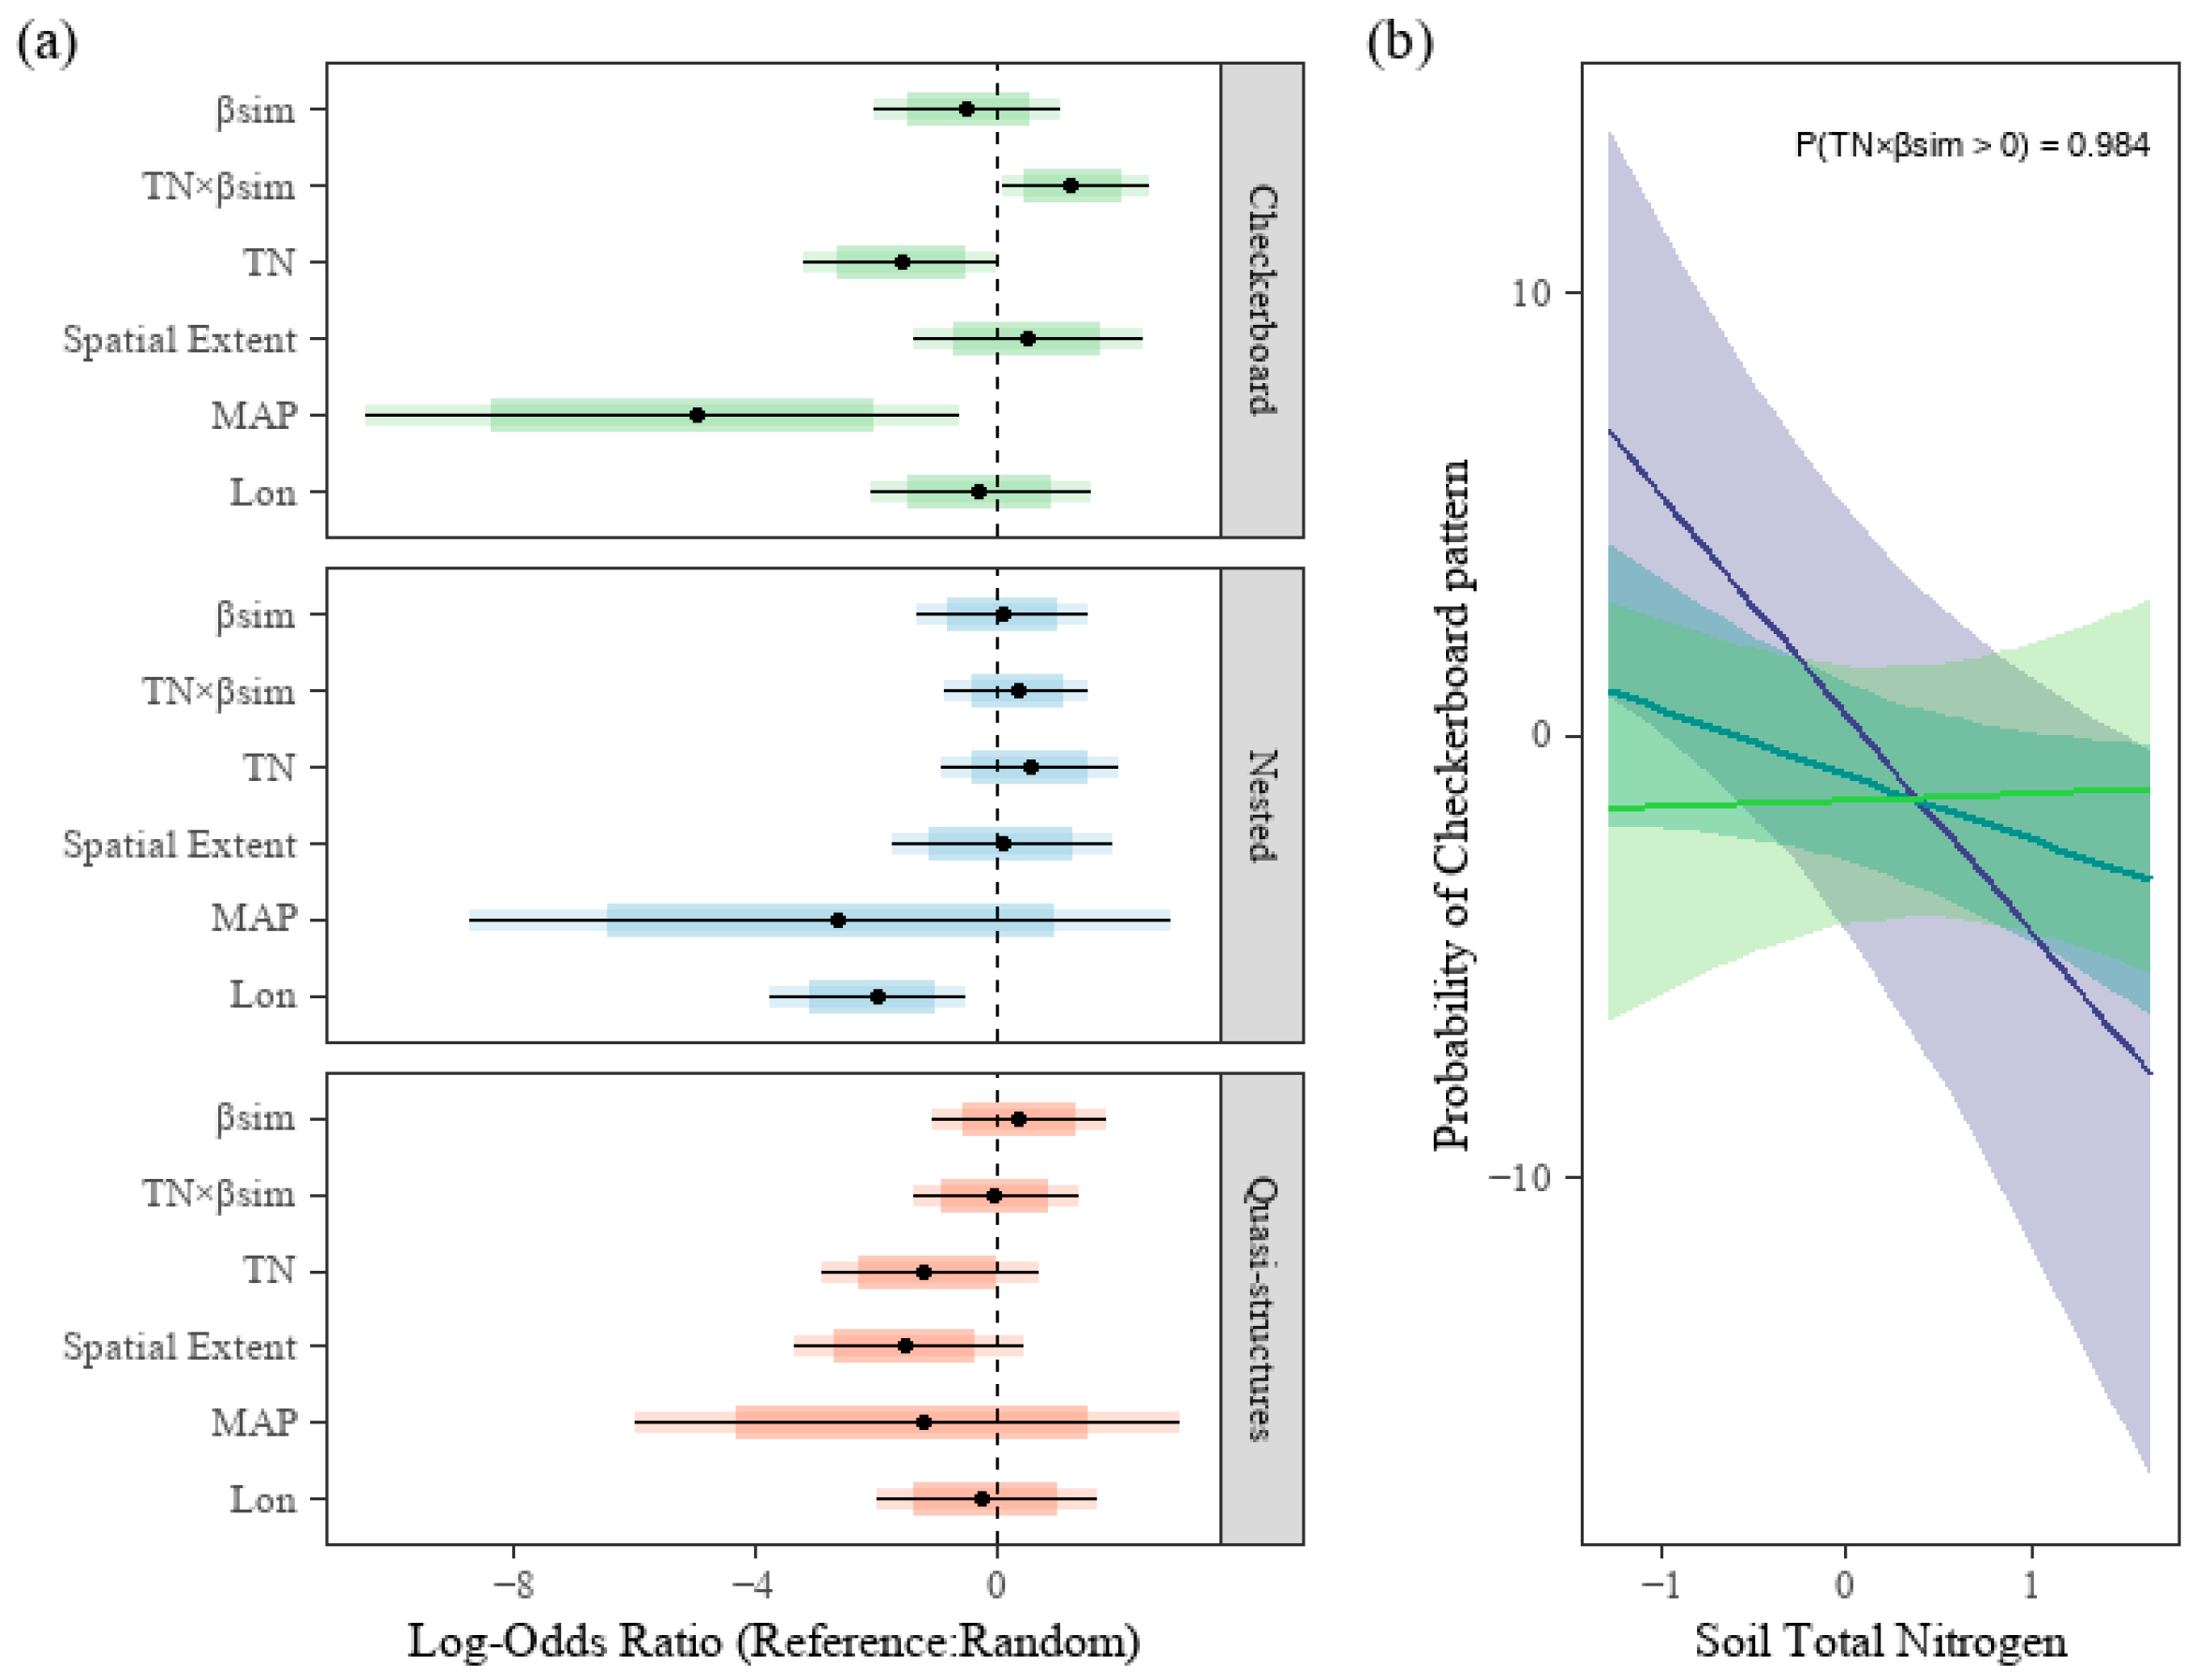
The analysis of interaction effects revealed a significant positive interaction between soil total nitrogen (TN) and the spatial turnover component (βSIM) (posterior probability P(TN × βSIM > 0) = 0.984). This result indicates that as the level of spatial turnover increases, the negative effect of TN on Checkerboard patterns is gradually attenuated, transitioning into a slight positive effect at higher levels of spatial turnover (Figure 4b).
Figure 4.
Mechanisms underlying the effects of environmental factors on metacommunity pattern probabilities at the landscape level. (a) Fixed effects predicting the occurrence probabilities of metacommunity patterns, derived from Bayesian multinomial logistic regression. Points represent posterior median estimates. Thick and thin horizontal lines indicate the 80% and 95% credible intervals (CrI), respectively. The vertical dashed line marks zero effect size; positive values indicate a higher probability of the pattern occurring relative to the Random pattern, while negative values indicate a lower probability. (b) Interaction between total soil nitrogen (TN) and βSIM (spatial turnover). The plot shows the predicted probability of the Checkerboard pattern in response to TN gradients across three levels of βSIM (purple: 5th percentile; blue: median; green: 95th percentile). Shaded areas represent the 95% credible intervals, and solid lines represent the median predictions.
Regarding the main effects of environmental variables, the direct main effect of TN on Checkerboard patterns became non-significant (β = −1.55, 95% CrI: −3.20 to 0.04). In contrast, the negative effect of annual precipitation was more pronounced (β = −5.09, 95% CrI: −10.42 to −0.58). For Nested patterns, longitude exhibited a significant independent negative correlation (β = −2.00, 95% CrI: −3.73 to −0.49). For Quasi-structures, the effects of all predictor variables and interaction terms did not reach statistical significance (Figure 4a). With the exception of TN, these results align with the significance levels observed in the spatial extent-driving mechanism model, demonstrating robustness. Furthermore, models incorporating categorical variables—such as habitat type and body size class—along with other environmental variables indicated that these factors had no significant impact on metacommunity patterns and did not improve model predictive accuracy (Table A2).
4. Discussion
4.1. Influence of Spatial Extent on Metacommunity Assembly Mechanisms
This study found that as spatial extent expands, the probability of occurrence for Clementsian patterns—characterized by ordered species distributions along environmental gradients—increases significantly. In contrast, the effect of spatial extent on Checkerboard, Nested, and Quasi-structures was not significant (Figure 2). Unexpectedly, mediation analysis indicated that the measured environmental variables did not mediate the association between spatial extent and Clementsian patterns. In models including these variables, the effect of spatial extent remained robust, while the impact of any single environmental factor was not significant. Collectively, these findings suggest that the influence of spatial extent on Clementsian patterns was not fully captured by the specific environmental gradients considered in this study.
Two plausible explanations are proposed for the lack of detected mediation. First, the effect may operate through uncaptured environmental heterogeneity, stemming from limitations in data resolution and variable selection. Coarse-resolution global databases may overlook fine-scale habitat variation, and key environmental drivers of the observed scale effects may have been omitted. Ecological “unified theory” posits that macroecological patterns arise from fundamental rules of species distribution [53]; such unmeasured heterogeneity could embody these rules and act as the true mediator. Second, spatial extent may correlate with scale-dependent spatial attributes of ecological processes, such as habitat connectivity and dispersal limitation intensity, which inherently change with expanding scale [54]. These attributes may constrain pattern formation independently of the specific environmental variables measured.
Theoretically, this reflects a shift from mass effects to species sorting [3]. At smaller extents, high dispersal often generates mass effects that homogenize communities, obscuring environmental signatures. As extent expands, reduced dispersal diminishes these mass effects, allowing species sorting to dominate. This enables species to track local environmental conditions, thereby revealing clearer Clementsian patterns. Our results are consistent with this paradigm but highlight that the relevant heterogeneity may not be fully captured by common coarse-scale variables. This interpretation aligns with global meta-analyses indicating that at large scales, the direct effects of environmental heterogeneity are often modulated by scale-dependent processes [55].
Although spatial extent showed the strongest association with Clementsian patterns, environmental filtering significantly affected other pattern types. Regarding the negative association between longitude and Nested patterns, this relationship should be interpreted as biogeographical and correlative rather than mechanistic. Aligning with the synthesis by Leibold et al. [3], which emphasizes that regional species pools are constrained by large-scale evolutionary and biogeographical processes, longitude likely serves as a macro-ecological proxy for unmeasured historical contingencies—such as post-glacial colonization history or regional species pool distinctiveness across continents (e.g., from North America to Eurasia). This supports the concept of multiple coexisting paradigms in metacommunities, where different processes dominate pattern formation under different contexts.
4.2. Mechanisms of Environmental Heterogeneity on Metacommunity Patterns
This study suggests that the regulatory effect of total soil nitrogen (TN) on checkerboard patterns is significantly contingent upon community assembly processes, as represented by the spatial turnover component (βSIM). Notably, in contrast to the consistent negative effect of mean annual precipitation (MAP) across scales—which generally suggests that water availability fosters species coexistence—the main effect of TN is not significant at the landscape level. This discrepancy suggests that analyses relying solely on broad-scale averages may obscure complex ecological dynamics. Indeed, a significant positive interaction exists between TN and the spatial turnover component, indicating that the ecological impact of TN on checkerboard patterns is not static but potentially shifts fundamentally depending on the context of environmental heterogeneity.
Specifically, under conditions of low spatial turnover (indicative of high connectivity or homogeneity), total soil nitrogen (TN) strongly suppresses checkerboard patterns. Since TN enrichment is often accompanied by the concomitant increase in other resources (e.g., SOC) [56], this resource abundance could potentially alleviate interspecific competition [57], thereby potentially inhibiting the formation of exclusion-based patterns. Concurrently, as biotic interactions weaken, community assembly becomes increasingly dominated by neutral processes—such as stochastic dispersal and ecological drift—further eroding deterministic signatures. A more central mechanism, however, is that low environmental heterogeneity facilitates high connectivity, promoting community homogenization through mass effects. Specifically, the frequent migration of individuals between patches with minimal niche differentiation homogenizes species composition. This continuous rescue effect sustains populations of competitively subordinate species, thereby preventing local exclusion and the formation of checkerboard patterns. Consistent with Pelinson et al. [58], this suggests that stochastic assembly processes may gain relative importance in benign, resource-rich environments.
Conversely, as spatial turnover increases (high βSIM), the inhibitory effect of TN weakens significantly and may shift toward facilitating competitive exclusion. High spatial turnover indicates a landscape dominated by strong environmental filtering, a scenario that aligns with the predictions of the ‘niche dimension hypothesis’ [59]. This hypothesis posits that an increased supply of limiting resources reduces the dimensionality of niche space, thereby constraining opportunities for species coexistence. In the present study, elevated TN is hypothesized to reduce niche dimensionality and restricts opportunities for resource partitioning. This enables a few competitively superior species to achieve dominance, while species adapted to resource-poor conditions are progressively excluded. Ultimately, at the metacommunity level, this manifests indirectly as intensified species segregation (i.e., checkerboard patterns). Echoing Chase [60], our findings underscore that resource effects are highly context-dependent. Specifically, the ecological impact of TN acts not in isolation but must be interpreted in conjunction with community assembly processes and environmental heterogeneity; relying solely on main-effect analyses is insufficient to unravel these complex mechanisms.
Nevertheless, the interpretation of our findings requires a critical assessment of data limitations. First, geographic bias and sample size constraints limit the generalizability of our conclusions. Existing data are skewed towards northern temperate regions, while tropical, arid, and polar climatic zones are underrepresented. Taxonomic unevenness also warrants caution; specifically, beyond the numerical dominance of Coleoptera, the geographic clustering of certain taxa—such as Nematoda datasets being restricted to East Asia—suggests that the patterns observed for such groups should be interpreted within their specific regional contexts rather than extrapolated globally. Furthermore, Gleasonian and Evenly spaced gradient patterns, as well as Clementsian patterns at the landscape level, were inadequately represented or omitted from certain segments of the analysis due to insufficient sample sizes. Consequently, this data scarcity not only leads to potential uncertainties in model projections for specific regions but also suggests that caution is warranted when generalizing conclusions to the full spectrum of metacommunity patterns. Second, variations in taxonomic resolution present a potential confounder. While we prioritized morphospecies-level data, the challenges of nematode taxonomy necessitated the inclusion of a minimal amount of genus-level data (i.e., a single study), which likely results in a conservative estimate of spatial turnover (βSIM). Finally, the coarse resolution of global environmental datasets precludes a detailed analysis of micro-scale drivers. Global raster data may fail to represent the specific microhabitats perceived by organisms. Thus, the observed effects of spatial extent—independent of measured environmental variables—may point to a fundamental ‘scale mismatch’ between macro-scale environmental data and micro-scale ecological processes.
To advance the predictive capacity of metacommunity theory, future initiatives should aim to overcome these limitations. Immediate priority must be given to filling data gaps in key underrepresented climatic zones. Concurrently, coupling high-resolution near-surface remote sensing with in situ microsensors offers a pathway to construct high-precision datasets, enabling the quantification of fine-scale environmental heterogeneity. Finally, integrating Individual-based Models (IBMs) serves as a robust approach to mechanically validate our hypotheses regarding nitrogen–spatial turnover interactions, ultimately unraveling the cryptic drivers of biodiversity patterns across scales.
5. Conclusions
This study directly quantifies the effects of spatial extent and environmental factors on the occurrence probability of metacommunity patterns by analyzing global soil fauna metacommunity data. The research reveals a multi-pathway driving mechanism of “scale–environment–process”: the expansion of spatial extent is strongly associated with the formation of ordered (Clementsian) patterns, suggesting that latent spatial attributes or unobserved heterogeneity may play a dominant role at macro scales; meanwhile, the effects of environmental filtering exhibit significant context-dependency. Particularly at the landscape level, the regulatory direction of total soil nitrogen (TN) on species segregation (checkerboard patterns) is dynamically modulated by community assembly processes (represented by βSIM)—specifically, it acts as an inhibitory factor under low spatial turnover and shifts to a facilitative factor under high spatial turnover. These findings clarify that neutral theory and niche theory are not mutually exclusive; rather, their relative importance transforms dynamically with changes in environmental heterogeneity and habitat connectivity, thereby providing a unified dynamic framework for understanding biodiversity patterns.
However, this study is limited by insufficient sample sizes for certain metacommunity patterns, the limited resolution of environmental variables, and the heterogeneity of data sources. Future research requires integrating higher-resolution environmental data, conducting comparative validations across multiple taxa, and employing process-based models to further uncover micro-mechanisms and enhance the generalizability of the conclusions.
Supplementary Materials
The following supporting information can be downloaded at https://www.mdpi.com/article/10.3390/d18030135/s1; Data S1: Metadata.
Author Contributions
Conceptualization, M.G.; methodology, X.L. and X.Y.; software, X.L.; validation, X.Y. and P.G.; formal analysis, X.L.; investigation, X.L., Y.L. and M.G.; resources, M.G.; data curation, X.L.; writing—original draft preparation, X.L.; writing—review and editing, X.L., M.G., X.Y., P.G., and Y.L.; project administration, M.G.; funding acquisition, M.G. and Y.L. All authors have read and agreed to the published version of the manuscript.
Funding
This research was funded by the National Natural Science Foundation of China (42471054, 42271051).
Institutional Review Board Statement
Not applicable.
Data Availability Statement
The original contributions presented in this study are included in the article. Further inquiries can be directed to the corresponding authors.
Conflicts of Interest
The authors declare no conflicts of interest.
Appendix A
Table A1.
Search Strategy (Symbols: * for wildcard; # for referencing/combining in PubMed).
Figure A1.
Literature Screening Flowchart.
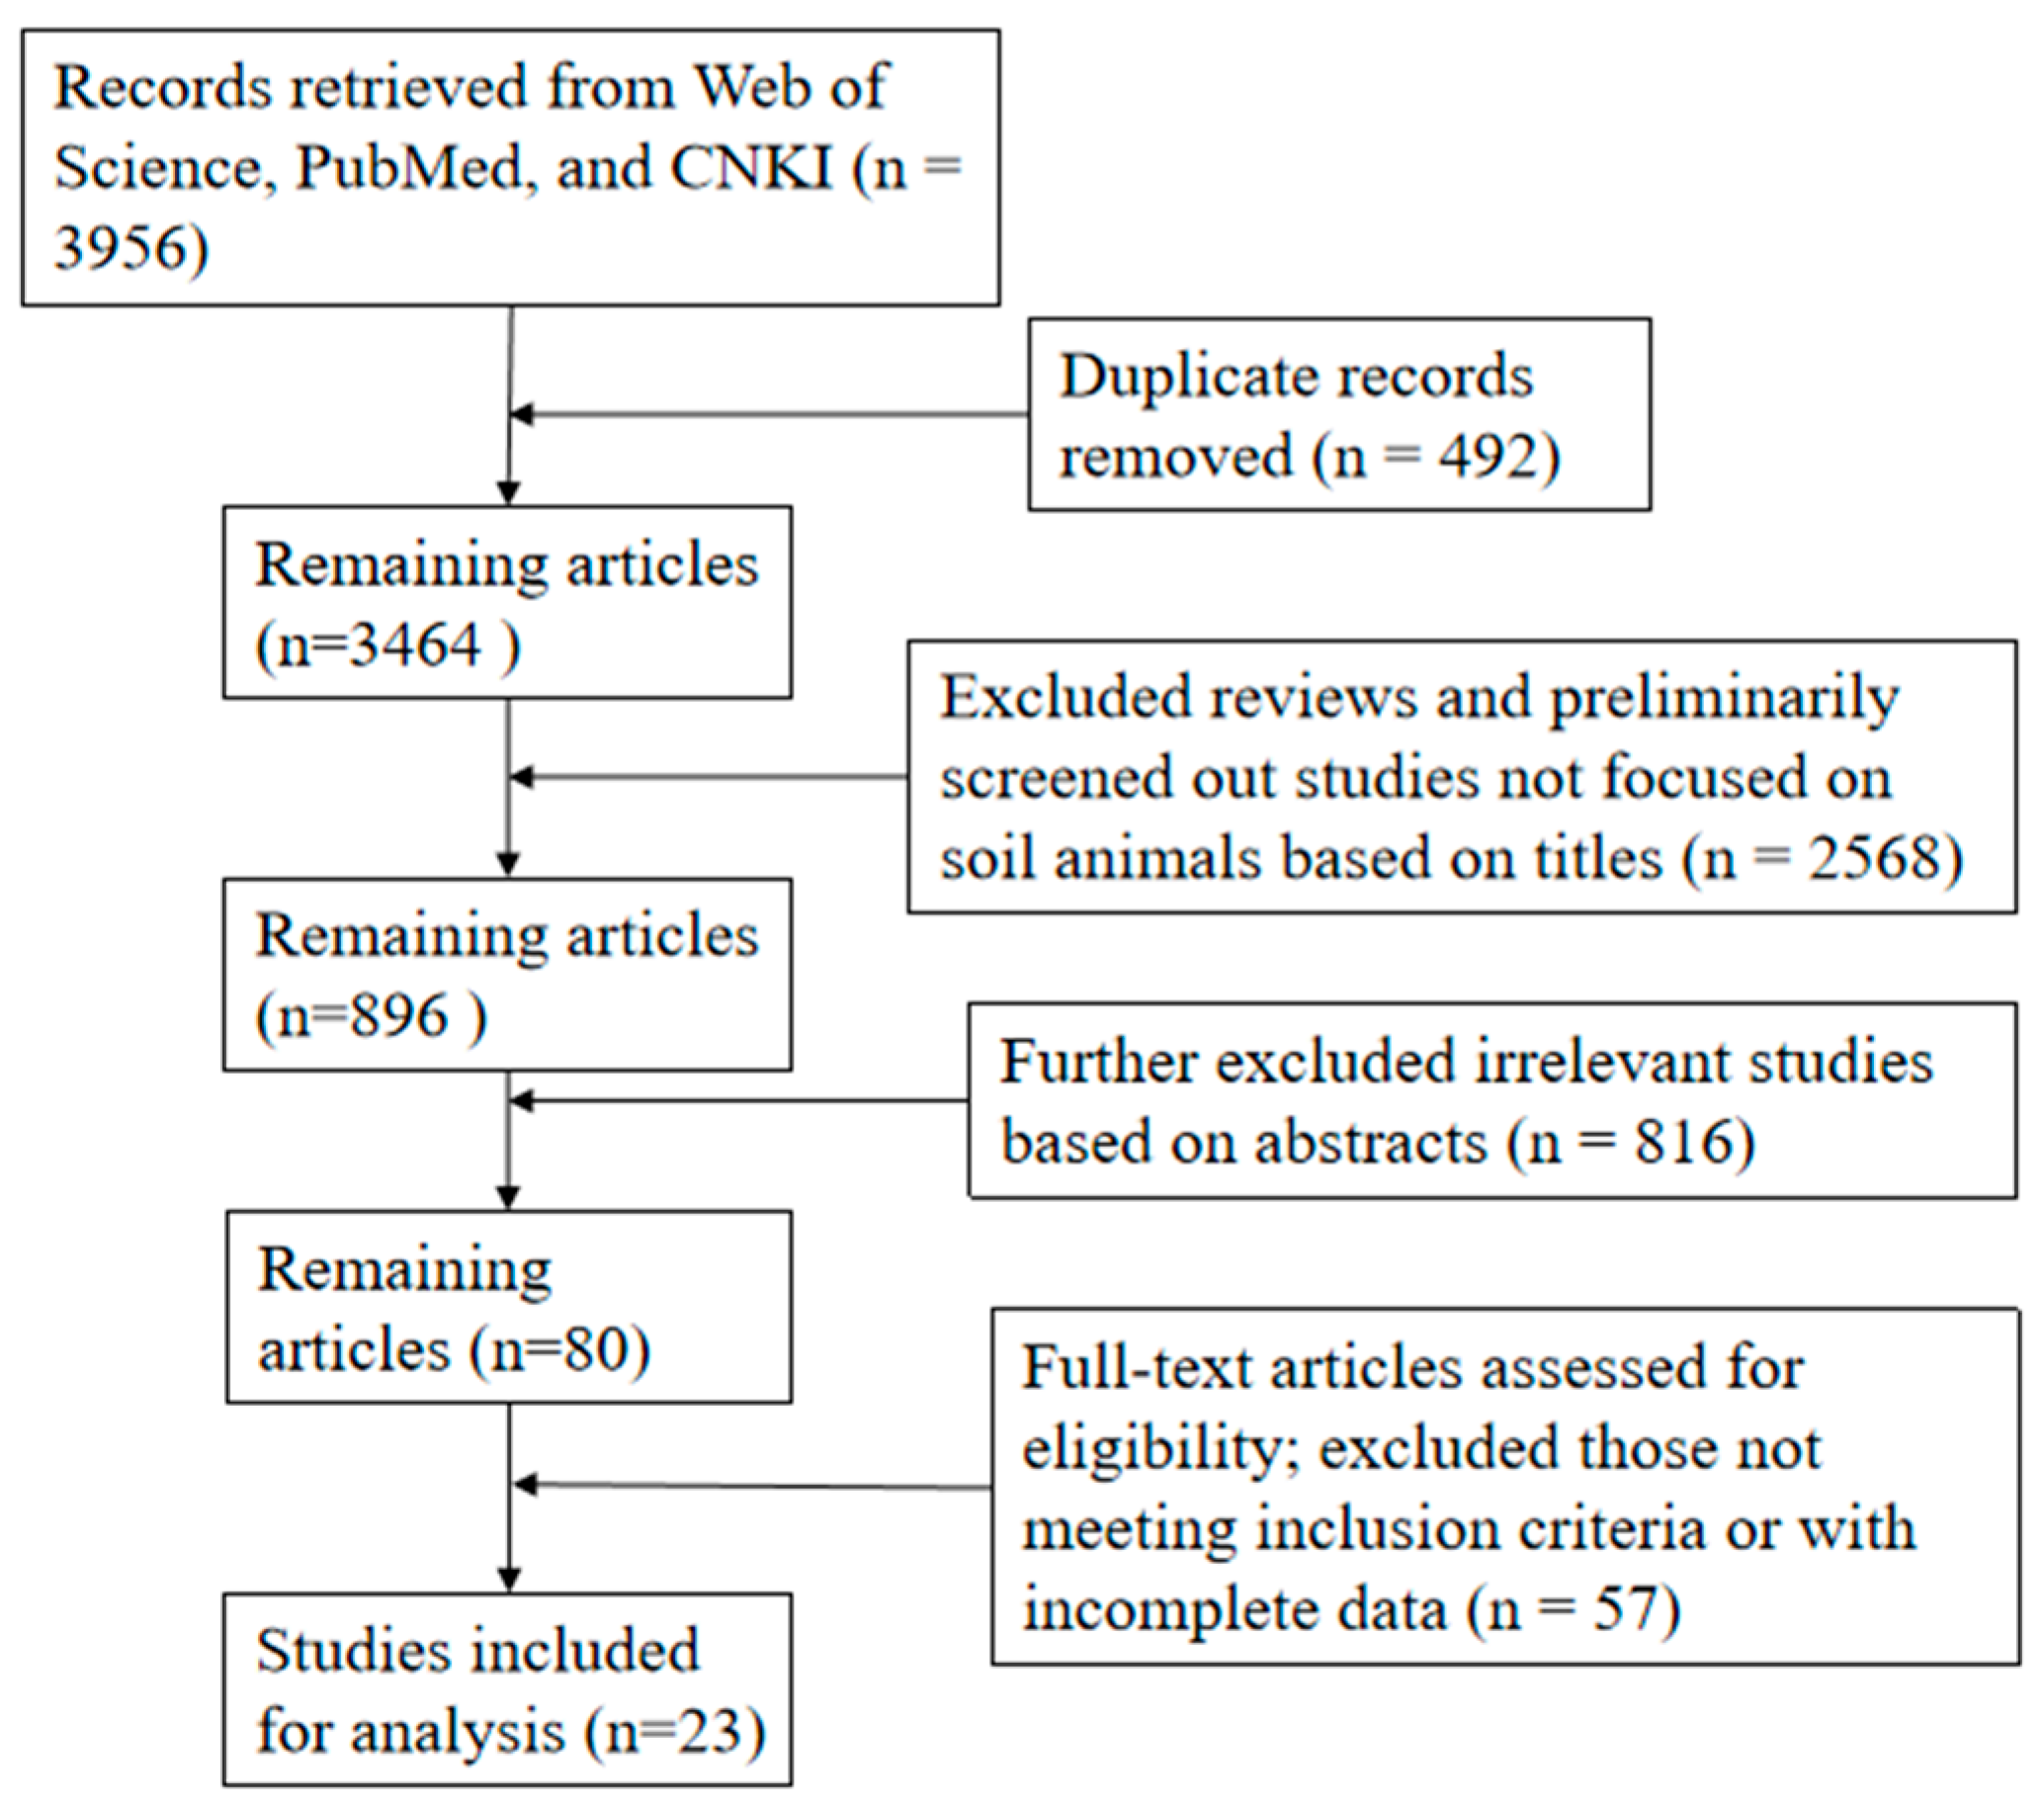
Table A2.
Results of Bayesian model comparison based on LOOIC. This table presents the Bayesian model comparison using the loo_compare method. The elpd_diff and se_diff values represent the comparison between each model and the optimal model (elpd_diff = 0). If |elpd_diff| < 2 * se_diff, the model is considered to have no significant difference from the optimal model.
References
- Liu, Y.; Li, Z.; García-Girón, J.; Luo, X.; Zhang, D.; Yang, J.; Bai, X.; Zhang, J.; Xie, Z. When floods meet dispersal: Unravelling macroinvertebrate community dynamics in a large subtropical monsoonal river basin. Sci. Total Environ. 2024, 957, 177445. [Google Scholar] [CrossRef] [Scilit]
- Rooney, N.; McCann, K.; Gellner, G.; Moore, J.C. Structural asymmetry and the stability of diverse food webs. Nature 2006, 442, 265–269. [Google Scholar] [CrossRef] [Scilit]
- Leibold, M.A.; Holyoak, M.; Mouquet, N.; Amarasekare, P.; Chase, J.M.; Hoopes, M.F.; Holt, R.D.; Shurin, J.B.; Law, R.; Tilman, D.; et al. The metacommunity concept: A framework for multi-scale community ecology. Ecol. Lett. 2004, 7, 601–613. [Google Scholar] [CrossRef] [Scilit]
- Meynard, C.N.; Lavergne, S.; Boulangeat, I.; Garraud, L.; Van Es, J.; Mouquet, N.; Thuiller, W. Disentangling the drivers of metacommunity structure across spatial scales. J. Biogeogr. 2013, 40, 1560–1571. [Google Scholar] [CrossRef] [Scilit] [PubMed]
- Li, H.D.; Holyoak, M.; Xiao, Z.S. Disentangling spatiotemporal dynamics in metacommunities through a species-patch network approach. Ecol. Lett. 2023, 26, 1261–1276. [Google Scholar] [CrossRef] [Scilit] [PubMed]
- Vellend, M. Conceptual synthesis in community ecology. Q. Rev. Biol. 2010, 85, 183–206. [Google Scholar] [CrossRef] [Scilit]
- Maurer, B.A.; McGill, B.J. Neutral and non-neutral macroecology. Basic Appl. Ecol. 2004, 5, 413–422. [Google Scholar] [CrossRef] [Scilit]
- Leibold, M.A.; Mikkelson, G.M. Coherence, species turnover, and boundary clumping: Elements of meta-community structure. Oikos 2002, 97, 237–250. [Google Scholar] [CrossRef] [Scilit]
- Presley, S.J.; Higgins, C.L.; Willig, M.R. A comprehensive framework for the evaluation of metacommunity structure. Oikos 2010, 119, 908–917. [Google Scholar] [CrossRef] [Scilit]
- Alves-Martins, F.; Brasil, L.S.; Juen, L.; De Marco, P.; Stropp, J., Jr.; Hortal, J. Metacommunity patterns of Amazonian Odonata: The role of environmental gradients and major rivers. PeerJ 2019, 7, e6472. [Google Scholar] [CrossRef] [Scilit]
- Guo, Y.X.; Gao, M.X.; Liu, J.; Zaitsev, A.S.; Wu, D.H. Disentangling the drivers of ground-dwelling macro-arthropod metacommunity structure at two different spatial scales. Soil Biol. Biochem. 2019, 130, 55–62. [Google Scholar] [CrossRef] [Scilit]
- Cerini, F.; Bombi, P.; Cannings, R.; Vignoli, L. Odonata metacommunity structure in northern ecosystems is driven by temperature and latitude. Insect Conserv. Divers. 2021, 14, 675–685. [Google Scholar] [CrossRef] [Scilit]
- Eros, T.; Takács, P.; Specziár, A.; Schmera, D.; Sály, P. Effect of landscape context on fish metacommunity structuring in stream networks. Freshw. Biol. 2017, 62, 215–228. [Google Scholar] [CrossRef] [Scilit]
- Hubbell, S.P.; Borda-De-Agua, L. The unified neutral theory of biodiversity and biogeography: Reply. Ecology 2004, 85, 3175–3178. [Google Scholar] [CrossRef] [Scilit]
- Nieto-Rabiela, F.; Suzán, G.; Wiratsudakul, A.; Rico-Chávez, O. Viral metacommunities associated to bats and rodents at different spatial scales. Community Ecol. 2018, 19, 168–175. [Google Scholar] [CrossRef] [Scilit]
- Cottenie, K. Integrating environmental and spatial processes in ecological community dynamics. Ecol. Lett. 2005, 8, 1175–1182. [Google Scholar] [CrossRef] [Scilit]
- De Bie, T.; De Meester, L.; Brendonck, L.; Martens, K.; Goddeeris, B.; Ercken, D.; Hampel, H.; Denys, L.; Vanhecke, L.; Van der Gucht, K.; et al. Body size and dispersal mode as key traits determining metacommunity structure of aquatic organisms. Ecol. Lett. 2012, 15, 740–747. [Google Scholar] [CrossRef] [Scilit]
- Soininen, J.; Lennon, J.J.; Hillebrand, H. A multivariate analysis of beta diversity across organisms and environments. Ecology 2007, 88, 2830–2838. [Google Scholar] [CrossRef] [Scilit]
- Feijo-Lima, R.; Thomas, S.A.; Tromboni, F.; Zandona, E.; Silva-Junior, E.F.; Moulton, T.P. Invertebrate metrics based on few abundant taxa outperform functional and taxonomic composition as indicators of agricultural impacts in Atlantic rainforest streams. Hydrobiologia 2024, 851, 409–429. [Google Scholar] [CrossRef] [Scilit]
- Saly, P.; Eros, T. Effect of field sampling design on variation partitioning in a dendritic stream network. Ecol. Complex. 2016, 28, 187–199. [Google Scholar] [CrossRef] [Scilit]
- Stevens, R.D.; Lopez-Gonzalez, C.; Presley, S.J. Geographical ecology of Paraguayan bats: Spatial integration and metacommunity structure of interacting assemblages. J. Anim. Ecol. 2007, 76, 1086–1093. [Google Scholar] [CrossRef] [Scilit] [PubMed]
- Peres-Neto, P.R.; Legendre, P.; Dray, S.; Borcard, D. Variation partitioning of species data matrices: Estimation and comparison of fractions. Ecology 2006, 87, 2614–2625. [Google Scholar] [CrossRef] [Scilit] [PubMed]
- Heino, J.; Melo, A.S.; Siqueira, T.; Soininen, J.; Valanko, S.; Bini, L.M. Metacommunity organisation, spatial extent and dispersal in aquatic systems: Patterns, processes and prospects. Freshw. Biol. 2015, 60, 845–869. [Google Scholar] [CrossRef] [Scilit]
- Bardgett, R.D.; van der Putten, W.H. Belowground biodiversity and ecosystem functioning. Nature 2014, 515, 505–511. [Google Scholar] [CrossRef] [Scilit]
- Decaëns, T. Macroecological patterns in soil communities. Glob. Ecol. Biogeogr. 2010, 19, 287–302. [Google Scholar] [CrossRef] [Scilit]
- John, R.; Dalling, J.W.; Harms, K.E.; Yavitt, J.B.; Stallard, R.F.; Mirabello, M.; Hubbell, S.P.; Valencia, R.; Navarrete, H.; Vallejo, M.; et al. Soil nutrients influence spatial distributions of tropical tree species. Proc. Natl. Acad. Sci. USA 2007, 104, 864–869. [Google Scholar] [CrossRef] [Scilit]
- Soininen, J.; Heino, J.; Wang, J. A meta-analysis of nestedness and turnover components of beta diversity across organisms and ecosystems. Glob. Ecol. Biogeogr. 2018, 27, 96–109. [Google Scholar] [CrossRef] [Scilit]
- Lichtenberg, E.M.; Kennedy, C.M.; Kremen, C.; Batary, P.; Berendse, F.; Bommarco, R.; Bosque-Perez, N.A.; Carvalheiro, L.G.; Snyder, W.E.; Williams, N.M.; et al. A global synthesis of the effects of diversified farming systems on arthropod diversity within fields and across agricultural landscapes. Glob. Change Biol. 2017, 23, 4946–4957. [Google Scholar] [CrossRef] [Scilit]
- Xiao, Z.; Wang, X.; Koricheva, J.; Kergunteuil, A.; Le Bayon, R.-C.; Liu, M.; Hu, F.; Rasmann, S. Earthworms affect plant growth and resistance against herbivores: A meta-analysis. Funct. Ecol. 2018, 32, 150–160. [Google Scholar] [CrossRef] [Scilit]
- Gurevitch, J.; Hedges, L.V. Statistical issues in ecological meta-analyses. Ecology 1999, 80, 1142–1149. [Google Scholar] [CrossRef]
- Nakagawa, S.; Santos, E.S.A. Methodological issues and advances in biological meta-analysis. Evol. Ecol. 2012, 26, 1253–1274. [Google Scholar] [CrossRef] [Scilit]
- McGill, B.J. The what, how and why of doing macroecology. Glob. Ecol. Biogeogr. 2019, 28, 6–17. [Google Scholar] [CrossRef] [Scilit]
- Sun, J.; Liu, Y.; Ye, Y.; Lai, J.; Zheng, Y.; Liu, D.; Gao, M. Preliminary Study on the Diversity of Soil Oribatid Mite (Acari: Oribatida) Community Reveals Both Longitudinal and Latitudinal Patterns in Paddy Fields along the Middle and Lower Reaches of Yangtze River, China. Agronomy 2023, 13, 2718. [Google Scholar] [CrossRef] [Scilit]
- Bramer, W.M.; de Jonge, G.B.; Rethlefsen, M.L.; Mast, F.; Kleijnen, J. A systematic approach to searching: An efficient and complete method to develop literature searches. J. Med. Libr. Assoc. 2018, 106, 531–541. [Google Scholar] [CrossRef] [Scilit]
- Fick, S.E.; Hijmans, R.J. WorldClim 2: New 1-km spatial resolution climate surfaces for global land areas. Int. J. Climatol. 2017, 37, 4302–4315. [Google Scholar] [CrossRef] [Scilit]
- Poggio, L.; de Sousa, L.M.; Batjes, N.H.; Heuvelink, G.B.M.; Kempen, B.; Ribeiro, E.; Rossiter, D. SoilGrids 2.0: Producing soil information for the globe with quantified spatial uncertainty. Soil 2021, 7, 217–240. [Google Scholar] [CrossRef] [Scilit]
- Dallas, T. metacom: An R package for the analysis of metacommunity structure. Ecography 2014, 37, 402–405. [Google Scholar] [CrossRef] [Scilit]
- Baselga, A.; Orme, C.D.L. betapart: An R package for the study of beta diversity. Methods Ecol. Evol. 2012, 3, 808–812. [Google Scholar] [CrossRef] [Scilit]
- Ulrich, W.; Gotelli, N.J. Pattern detection in null model analysis. Oikos 2013, 122, 2–18. [Google Scholar] [CrossRef] [Scilit]
- Buerkner, P.-C. brms: An R Package for Bayesian Multilevel Models Using Stan. J. Stat. Softw. 2017, 80, 1–28. [Google Scholar] [CrossRef] [Scilit]
- Doherty, T.S.; Hays, G.C.; Driscoll, D.A. Human disturbance causes widespread disruption of animal movement. Nat. Ecol. Evol. 2021, 5, 513–519. [Google Scholar] [CrossRef] [Scilit] [PubMed]
- Zuur, A.F.; Ieno, E.N.; Elphick, C.S. A protocol for data exploration to avoid common statistical problems. Methods Ecol. Evol. 2010, 1, 3–14. [Google Scholar] [CrossRef] [Scilit]
- Schielzeth, H. Simple means to improve the interpretability of regression coefficients. Methods Ecol. Evol. 2010, 1, 103–113. [Google Scholar] [CrossRef] [Scilit]
- Weisberg, S.; Fox, J.A. An R Companion to Applied Regression; Sage: Thousand Oaks, CA, USA, 2011. [Google Scholar]
- Henriques-Silva, R.; Lindo, Z.; Peres-Neto, P.R. A community of metacommunities: Exploring patterns in species distributions across large geographical areas. Ecology 2013, 94, 627–639. [Google Scholar] [CrossRef] [Scilit]
- Vehtari, A.; Gelman, A.; Gabry, J. Practical Bayesian model evaluation using leave-one-out cross-validation and WAIC. Stat. Comput. 2017, 27, 1413–1432. [Google Scholar] [CrossRef] [Scilit]
- Sweet, T.M. Statistical Rethinking: A Bayesian Course With Examples in R and Stan. J. Educ. Behav. Stat. 2017, 42, 107–110. [Google Scholar] [CrossRef] [Scilit]
- Miocevic, M.; Gonzalez, O.; Valente, M.J.; MacKinnon, D.P. A Tutorial in Bayesian Potential Outcomes Mediation Analysis. Struct. Equ. Model.-A Multidiscip. J. 2018, 25, 121–136. [Google Scholar] [CrossRef] [Scilit]
- Baselga, A. Partitioning the turnover and nestedness components of beta diversity. Glob. Ecol. Biogeogr. 2010, 19, 134–143. [Google Scholar] [CrossRef] [Scilit]
- Maloufi, S.; Catherine, A.; Mouillot, D.; Louvard, C.; Couté, A.; Bernard, C.; Troussellier, M. Environmental heterogeneity among lakes promotes hyper -diversity across phytoplankton communities. Freshw. Biol. 2016, 61, 633–645. [Google Scholar] [CrossRef] [Scilit]
- Legendre, P.; De Caceres, M. Beta diversity as the variance of community data: Dissimilarity coefficients and partitioning. Ecol. Lett. 2013, 16, 951–963. [Google Scholar] [CrossRef] [Scilit]
- Logue, J.B.; Mouquet, N.; Peter, H.; Hillebrand, H.; Metacommunity Working, G. Empirical approaches to metacommunities: A review and comparison with theory. Trends Ecol. Evol. 2011, 26, 482–491. [Google Scholar] [CrossRef] [Scilit] [PubMed]
- McGill, B.J. Towards a unification of unified theories of biodiversity. Ecol. Lett. 2010, 13, 627–642. [Google Scholar] [CrossRef] [Scilit] [PubMed]
- Soininen, J. Spatial structure in ecological communities—A quantitative analysis. Oikos 2016, 125, 160–166. [Google Scholar] [CrossRef] [Scilit]
- Stein, A.; Gerstner, K.; Kreft, H. Environmental heterogeneity as a universal driver of species richness across taxa, biomes and spatial scales. Ecol. Lett. 2014, 17, 866–880. [Google Scholar] [CrossRef] [Scilit]
- Zhu, T.; Xia, G.W.; Yuan, Y.S.; Lu, Q.; Jiang, X.H.; Huang, C.L.; Zhou, W. Nitrogen Addition Promotes Soil Carbon Sequestration and Alters Carbon Pool Stability by Affecting Particulate Organic Carbon in a Karst Plantation. Forests 2025, 16, 730. [Google Scholar] [CrossRef] [Scilit]
- Deerman, H.; Yee, D.A. Competitive interactions with Aedes albopictus alter the nutrient content of Aedes aegypti. Med. Vet. Entomol. 2023, 37, 715–722. [Google Scholar] [CrossRef] [Scilit]
- Pelinson, R.M.; Rossa-Feres, D.D.; Garey, M.V. Disentangling the multiple drivers of tadpole metacommunity structure in different ecoregions and multiple spatial scales. Hydrobiologia 2022, 849, 4185–4202. [Google Scholar] [CrossRef] [Scilit]
- Harpole, W.S.; Tilman, D. Grassland species loss resulting from reduced niche dimension. Nature 2007, 446, 791–793. [Google Scholar] [CrossRef] [Scilit]
- Chase, J.M. Stochastic Community Assembly Causes Higher Biodiversity in More Productive Environments. Science 2010, 328, 1388–1391. [Google Scholar] [CrossRef] [Scilit]
Disclaimer/Publisher’s Note: The statements, opinions and data contained in all publications are solely those of the individual author(s) and contributor(s) and not of MDPI and/or the editor(s). MDPI and/or the editor(s) disclaim responsibility for any injury to people or property resulting from any ideas, methods, instructions or products referred to in the content. |
© 2026 by the authors. Licensee MDPI, Basel, Switzerland. This article is an open access article distributed under the terms and conditions of the Creative Commons Attribution (CC BY) license.