


Abstract
Lung adenocarcinoma (LUAD) is highly heterogeneous, and the mechanisms linking gut microbiota-derived metabolites to tumor-associated transcriptional regulation remain unclear. We integrated two paired LUAD transcriptomic datasets, GSE40419 and GSE32863, to perform differential expression, functional enrichment, protein–protein interaction, and transcription factor activity analyses. Candidate microbial metabolites and targets were obtained from gutMGene, Similarity Ensemble Approach, and SwissTargetPrediction, while Mendelian randomization (MR) was used to evaluate associations between genetically predicted gut microbial abundance and LUAD risk. Molecular docking and a 100 ns molecular dynamics simulation were conducted to assess interactions between candidate metabolites and Jun Proto-Oncogene (JUN)-containing DNA-bound complexes. We identified 1271 and 2519 differentially expressed genes in GSE40419 and GSE32863, respectively, including 912 overlapping genes. These genes were enriched mainly in cell cycle, immune and inflammatory, angiogenic, and tumor microenvironment-related pathways. Fifteen robust transcription factors were identified, with consistent suppression of the JUN-regulated transcriptional program. MR analysis revealed 10 microbial taxa associated with LUAD after false discovery rate correction. A genetically predicted higher abundance of Roseburia inulinivorans was associated with a lower LUAD risk (OR = 0.843, 95% CI: 0.756–0.940). Database integration linked R. inulinivorans to butyrate and JUN. Butyrate showed the most favorable docking score with the c-Jun–DNA complex (−4.5 kcal/mol), and molecular dynamics simulation indicated a relatively stable interaction. Collectively, these findings support a putative R. inulinivorans–butyrate–JUN regulatory axis that links gut microbial metabolism to transcriptional dysregulation in LUAD.
1. Introduction
Lung adenocarcinoma (LUAD) is the most common histological subtype of non-small cell lung cancer (NSCLC) and represents a substantial global health burden [1]. LUAD is highly heterogeneous across geographical populations, with marked regional variation in the prevalence of common oncogenic driver mutations. According to GLOBOCAN 2020, approximately 2.3 million new cases of lung cancer and nearly 1.8 million lung cancer-related deaths occurred worldwide in 2020, with China accounting for 24% of incident cases and 30% of lung cancer deaths globally [2]. In contrast to the declining incidence of lung cancer in the United States, the incidence and mortality rates of lung cancer have continued to increase in China, resulting in a considerable disease burden [1,3]. LUAD accounts for approximately 47% of NSCLC cases in Western countries and 55–60% of cases in China [1]. Epidermal growth factor receptor (EGFR) mutations are more prevalent in East Asian populations, whereas Kirsten rat sarcoma viral oncogene homolog (KRAS) and Serine/Threonine Kinase 11 (STK11) mutations are more frequently observed in populations of European and African ancestry [4]. These geographical differences underscore the considerable molecular and clinical heterogeneity of LUAD. Individual patients may exhibit distinct genomic alterations, transcriptional programs, tumor microenvironmental features, and metabolic states throughout disease progression [5].
Although immunotherapies and molecularly targeted therapies have substantially improved the clinical management of lung cancer, acquired and intrinsic treatment resistance remain major therapeutic challenges. Tumor cells may evade targeted therapies through alterations in therapeutic targets and activation of compensatory signaling pathways [6]. Resistance to immunotherapy may arise through impaired immune recognition, remodeling of the tumor microenvironment, and activation of alternative immune checkpoint pathways [7,8]. Identifying the key molecular nodes connecting the tumor microenvironment with dysregulated intratumoral transcriptional programs may improve our understanding of LUAD initiation and progression and facilitate the development of novel therapeutic strategies.
Recent studies have demonstrated that the gut microbiota can influence tumor immunity both directly and indirectly through the production of bioactive metabolites, with potential consequences for tumor progression and therapeutic responses [9]. Alterations in the gut microbial composition have been observed in patients with NSCLC receiving chemotherapy or immunotherapy [10,11,12]. Microbiota-derived metabolites, including short-chain fatty acids, can modulate innate and adaptive immune responses and may consequently contribute to systemic immune dysregulation. Conversely, certain probiotic strains may exert antitumor effects by modulating the gut–lung axis. Yusuke et al. reported that probiotic supplementation with Clostridium butyricum MIYAIRI 588 was associated with prolonged progression-free survival in patients with advanced NSCLC receiving immune checkpoint inhibitor therapy, although the underlying mechanisms remain incompletely understood [13]. Zhu et al. demonstrated that gut microbiota-derived metabolites, particularly butyrate, enhanced the therapeutic efficacy of anti-programmed cell death 1 (PD-1) treatment by modulating T-cell receptor signaling in cytotoxic CD8+ T cells [14]. Preet et al. reported that extracellular vesicles derived from the commensal bacterium Bifidobacterium could be internalized by lung cancer cells through dynamin-dependent endocytosis and modulated responses to immunotherapy by upregulating programmed cell death ligand 1 (PD-L1) expression via the TLR4-NF-κB signaling pathway [15]. These findings indicate that the gut microbiota plays important and multifaceted roles in NSCLC progression and therapeutic responses. Further investigation of the interactions among gut microbial communities, metabolites, and lung cancer may reveal novel regulatory mechanisms and potential therapeutic targets.
Jun Proto-Oncogene (JUN) encodes the transcription factor (TF) c-Jun, which commonly forms the activator protein 1 (AP-1) transcriptional complex with members of the Fos protein family and regulates genes involved in cell proliferation, differentiation, survival, and cellular stress responses. Sustained or aberrant AP-1 activation may contribute to tumor initiation and progression [16,17]. Interleukin (IL-7)/IL-7 receptor signaling has been reported to promote lung cancer cell proliferation by inducing cyclin D1 expression through the c-Fos/c-Jun pathway [18]. c-Jun has been implicated in the regulation of hypoxia-inducible factor 2α (HIF-2α), although the precise regulatory mechanism and its relationship with specific genetic variants should be further clarified [19]. In vitro studies have also shown that acacetin (5,7-dihydroxy-4′-methoxyflavone), a flavonoid with antioxidant and anti-inflammatory properties, inhibits NSCLC cell invasion and migration by suppressing p38α mitogen-activated protein kinase (MAPK) signaling and reducing the nuclear abundance of c-Jun and c-Fos [20]. These findings support c-Jun as an important transcriptional regulatory node and a potential therapeutic target in NSCLC. Nevertheless, direct evidence that gut microbiota-derived metabolites regulate c-Jun activity remains limited, and whether such regulation contributes to LUAD progression has yet to be established.
Previous studies have implicated the gut microbiota, butyrate, and JUN/AP-1 signaling in lung cancer, but evidence connecting these observations remains limited [13,14,15,18,19,20]. It is unclear whether microbial taxa associated with LUAD susceptibility can be linked to candidate metabolites and to transcriptional programs that are consistently altered across independent LUAD datasets.
We hypothesized that the gut microbiota may modulate JUN-associated transcriptional programs through butyrate-related signaling and consequently influence LUAD progression. To evaluate this potential regulatory pathway, we integrated two independent LUAD transcriptomic datasets for differential expression gene (DEG) analysis, protein–protein interaction (PPI) network analysis, and TF activity inference. We further combined microbiome and LUAD genome-wide association study (GWAS) data for Mendelian randomization (MR) analysis. In addition, disease-associated microbiota databases and MR results were used to prioritize potential upstream microbial taxa. Finally, we integrated evidence from microbiota-metabolite and ligand-target relationships to construct a multilayered microbiota-LUAD network and assessed the feasibility of metabolite binding to selected proteins using molecular docking and molecular dynamics simulations.
2. Result
2.1. The Workflow of the Overall Research
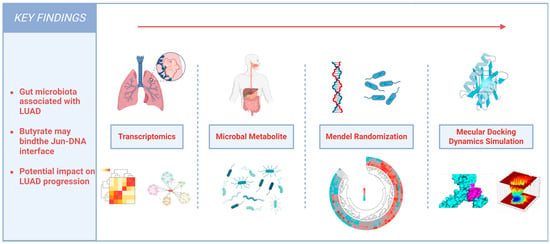
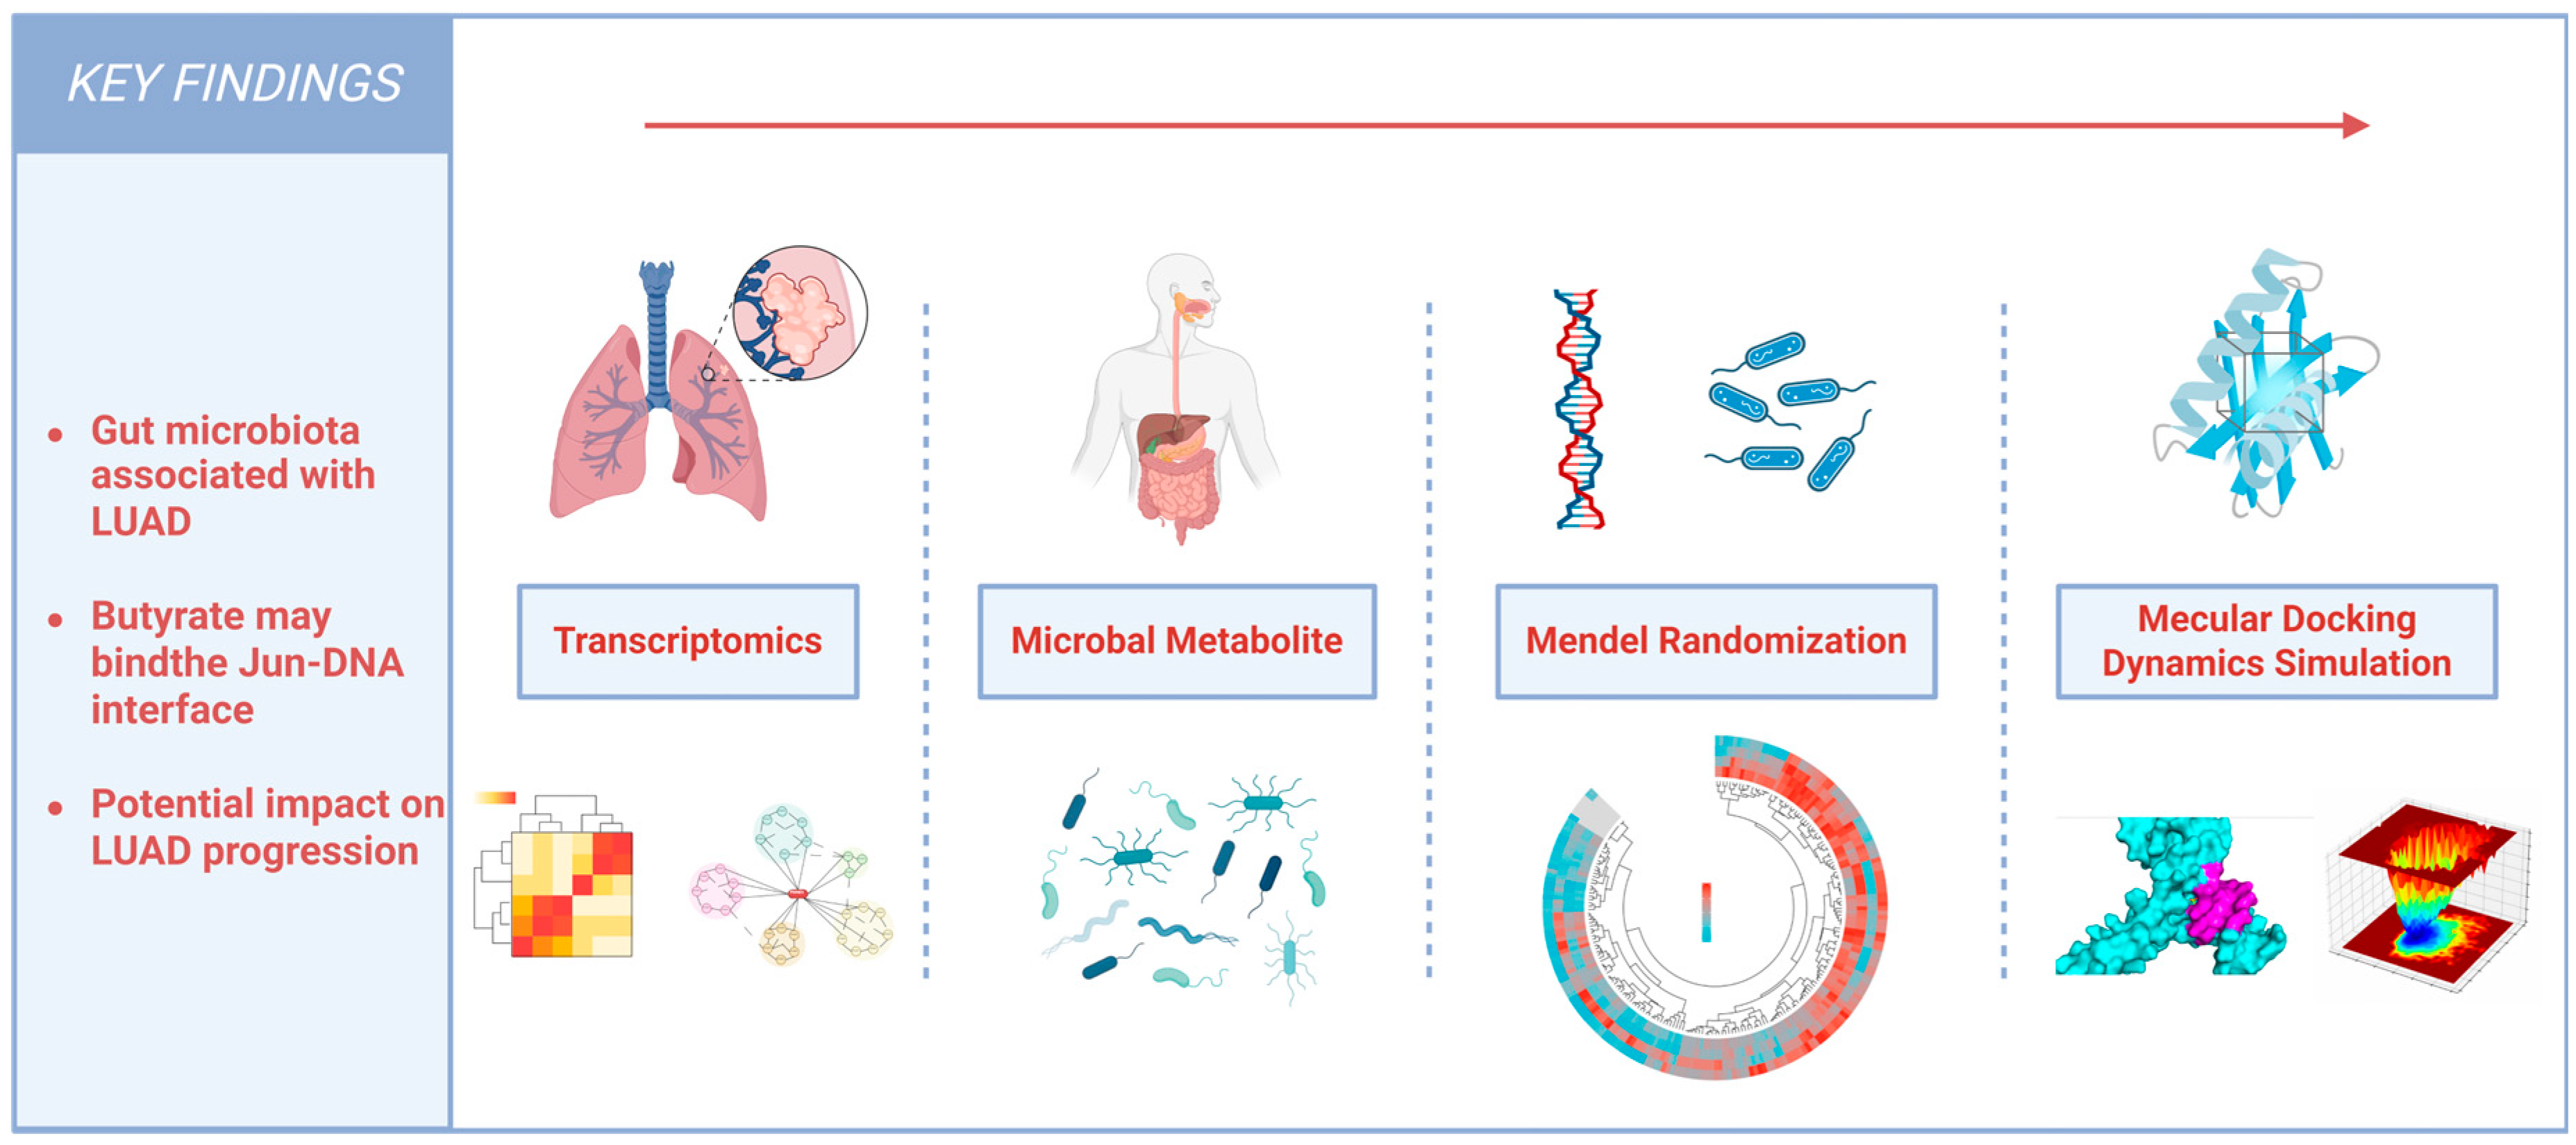
An integrative framework was developed to investigate a potential microbiota–metabolite–JUN axis in LUAD by combining transcriptomic analysis, microbiota–metabolite–target databases, MR, and molecular simulations. The study workflow is shown in Figure 1.
Figure 1.
Workflow of the integrative multi-omics analysis in this study.
2.2. Identification and Functional Enrichment of LUAD-Associated Genes
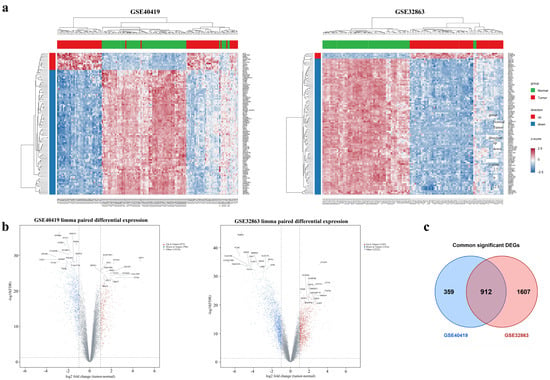
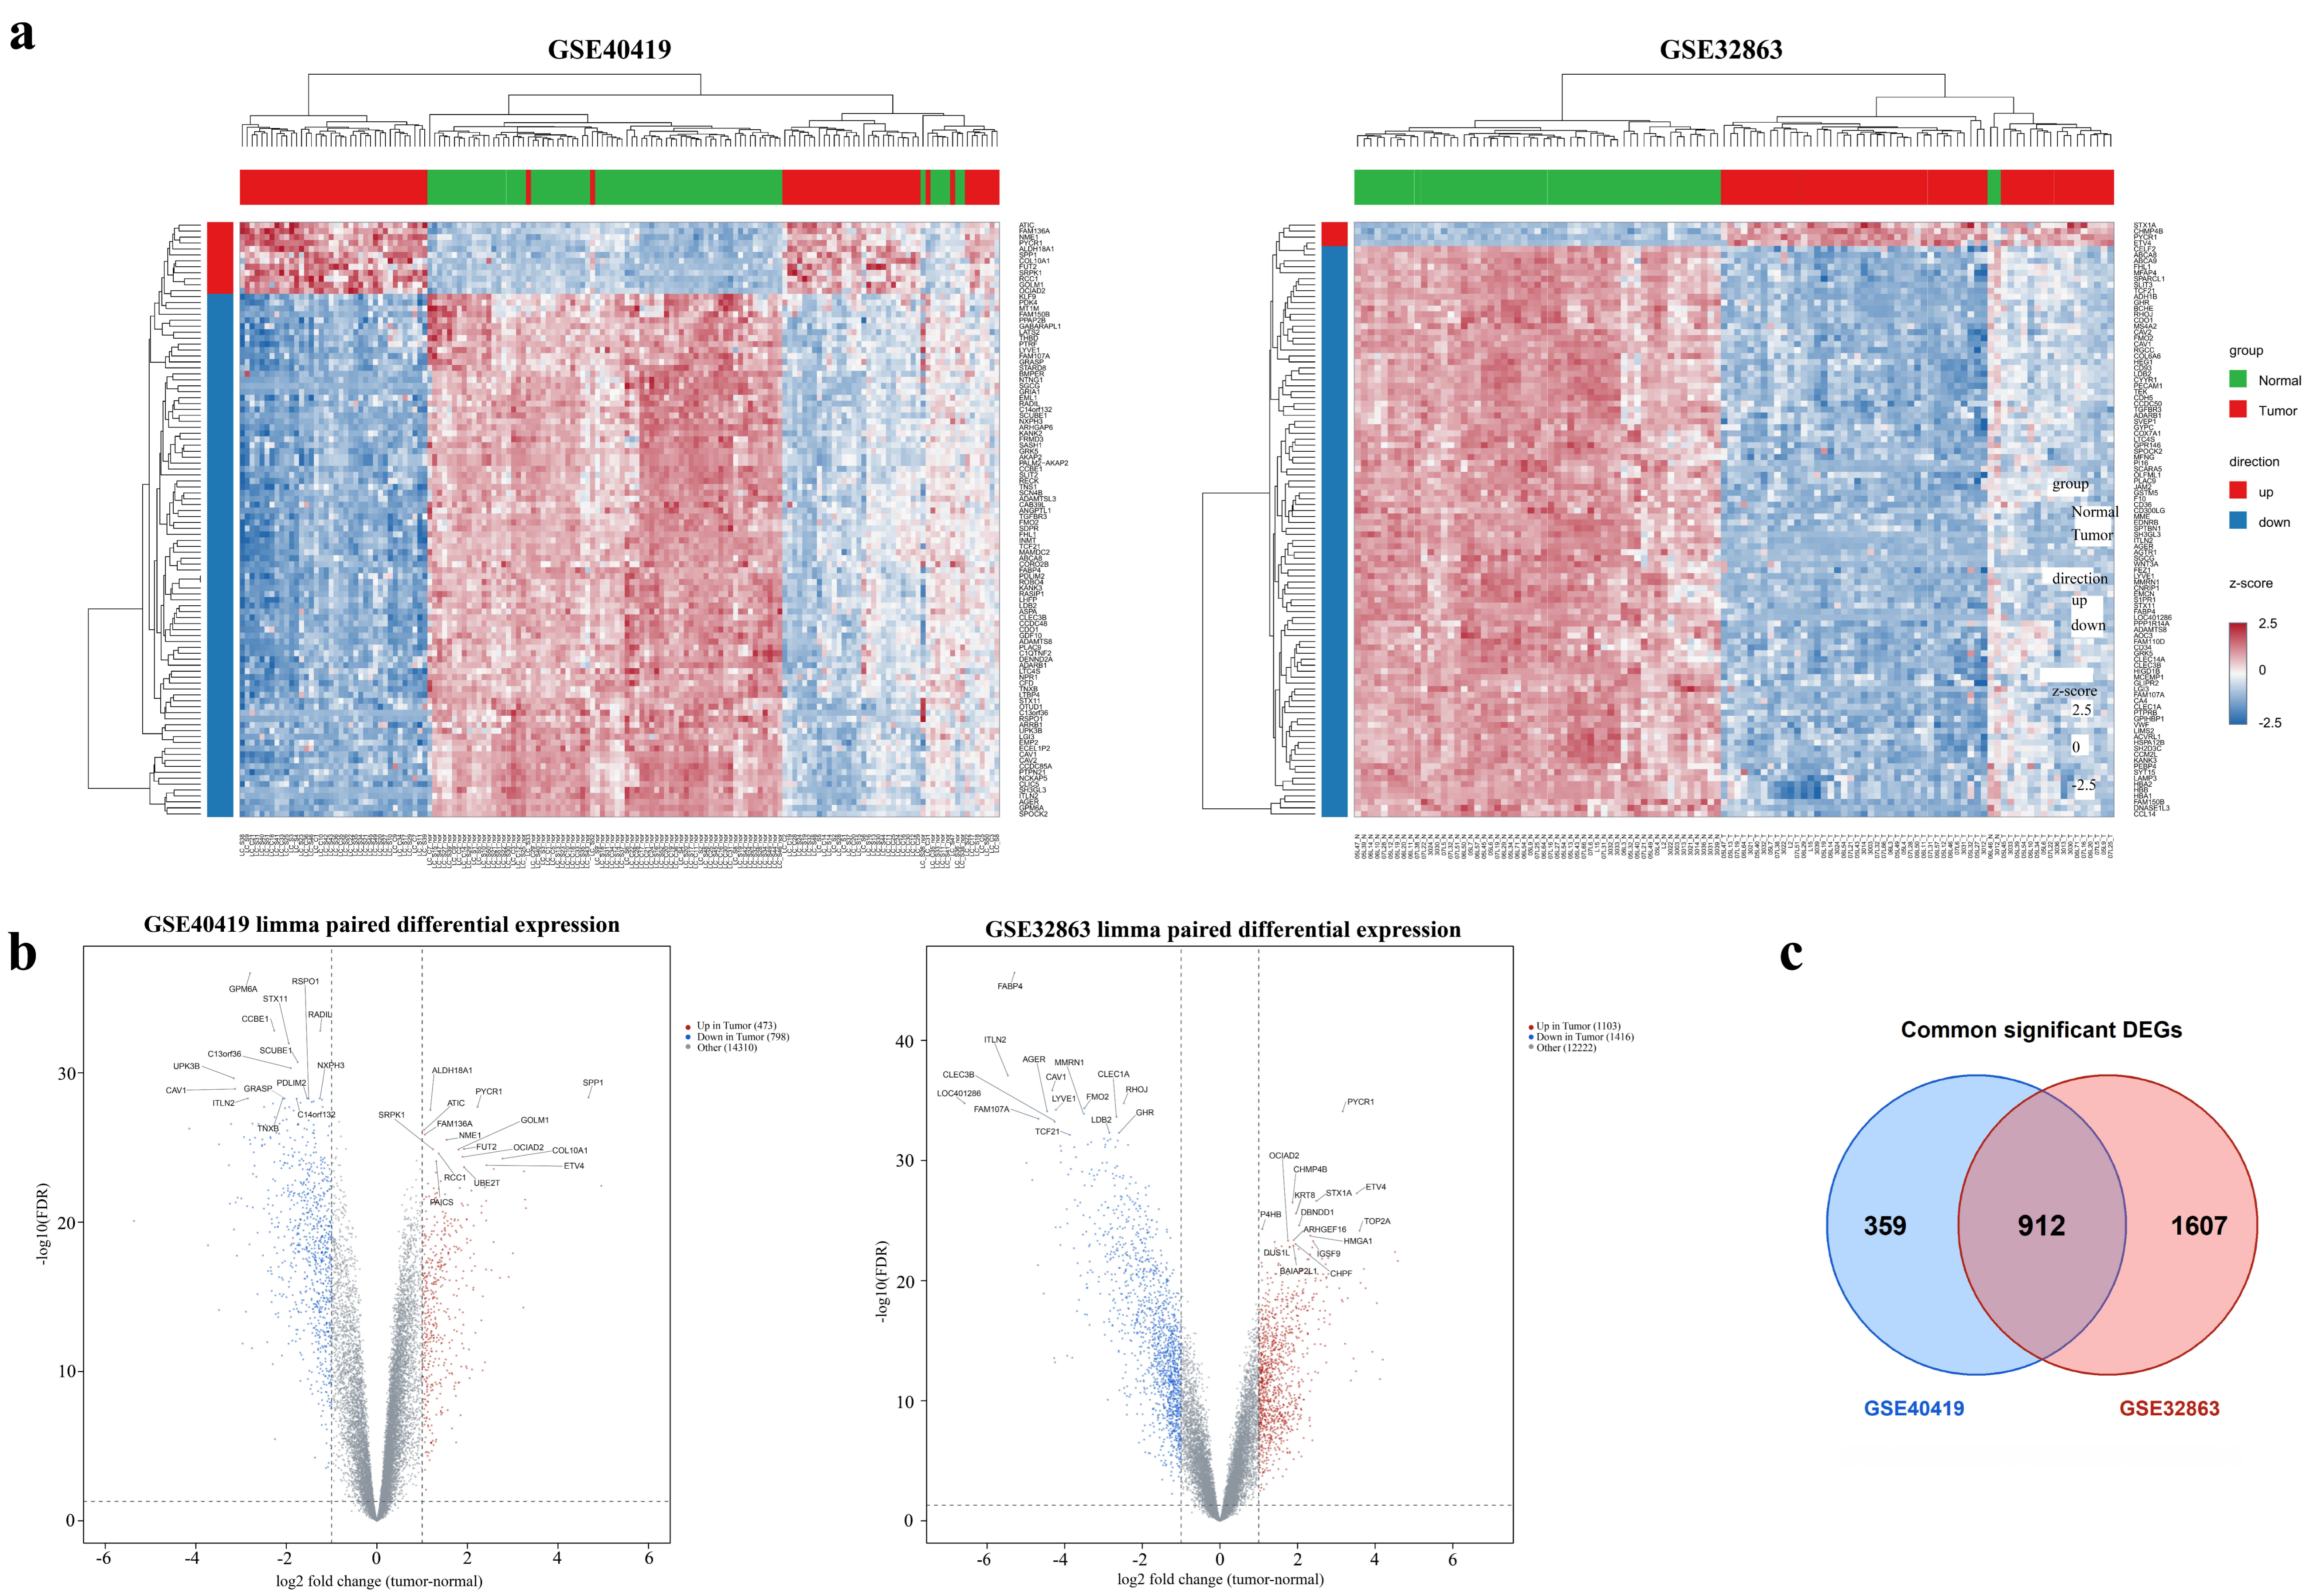
To characterize LUAD-associated alterations in gene expression, we analyzed gene expression profiles from the GSE32863 and GSE40419 datasets. Comparisons between tumor and adjacent non-tumor tissues revealed 2519 and 1271 DEGs in GSE32863 and GSE40419, respectively. DEGs were defined by BH-adjusted p < 0.05 and |log2FC| > 1; enrichment terms were considered significant at BH-adjusted p < 0.05. Specifically, 1103 genes were upregulated and 1416 were downregulated in GSE32863, whereas 473 genes were upregulated and 798 were downregulated in GSE40419 (Supplementary Table S1). The DEG profiles of the two datasets were visualized using clustered heatmaps and volcano plots (Figure 2a,b). The DEGs common across the two datasets included genes involved in extracellular matrix remodeling and cell adhesion or migration, such as COL1A1, MMP1, SPP1, and EPCAM, as well as inflammatory mediators such as IL6 and IL1B, suggesting that functionally diverse genes may contribute to LUAD development. The Venn diagram revealed 912 common DEGs (Figure 2c), comprising 319 upregulated genes and 593 downregulated genes.
Figure 2.
Common DEGs identified by LUAD expression profiling. (a) Heatmaps of the top 100 DEGs in GSE40419 and GSE32863. (b) Volcano plots of the DEGs in GSE40419 and GSE32863. (c) Venn diagram showing the 912 overlapping DEGs among the two datasets. Abbreviations: Differentially expressed genes (DEGs); Lung adenocarcinoma (LUAD).
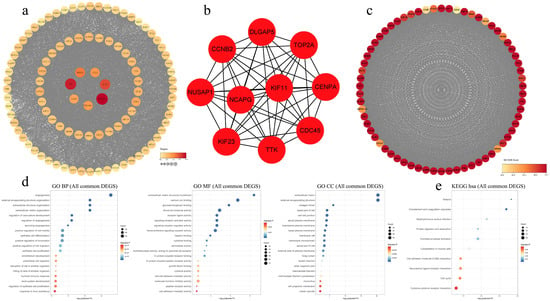
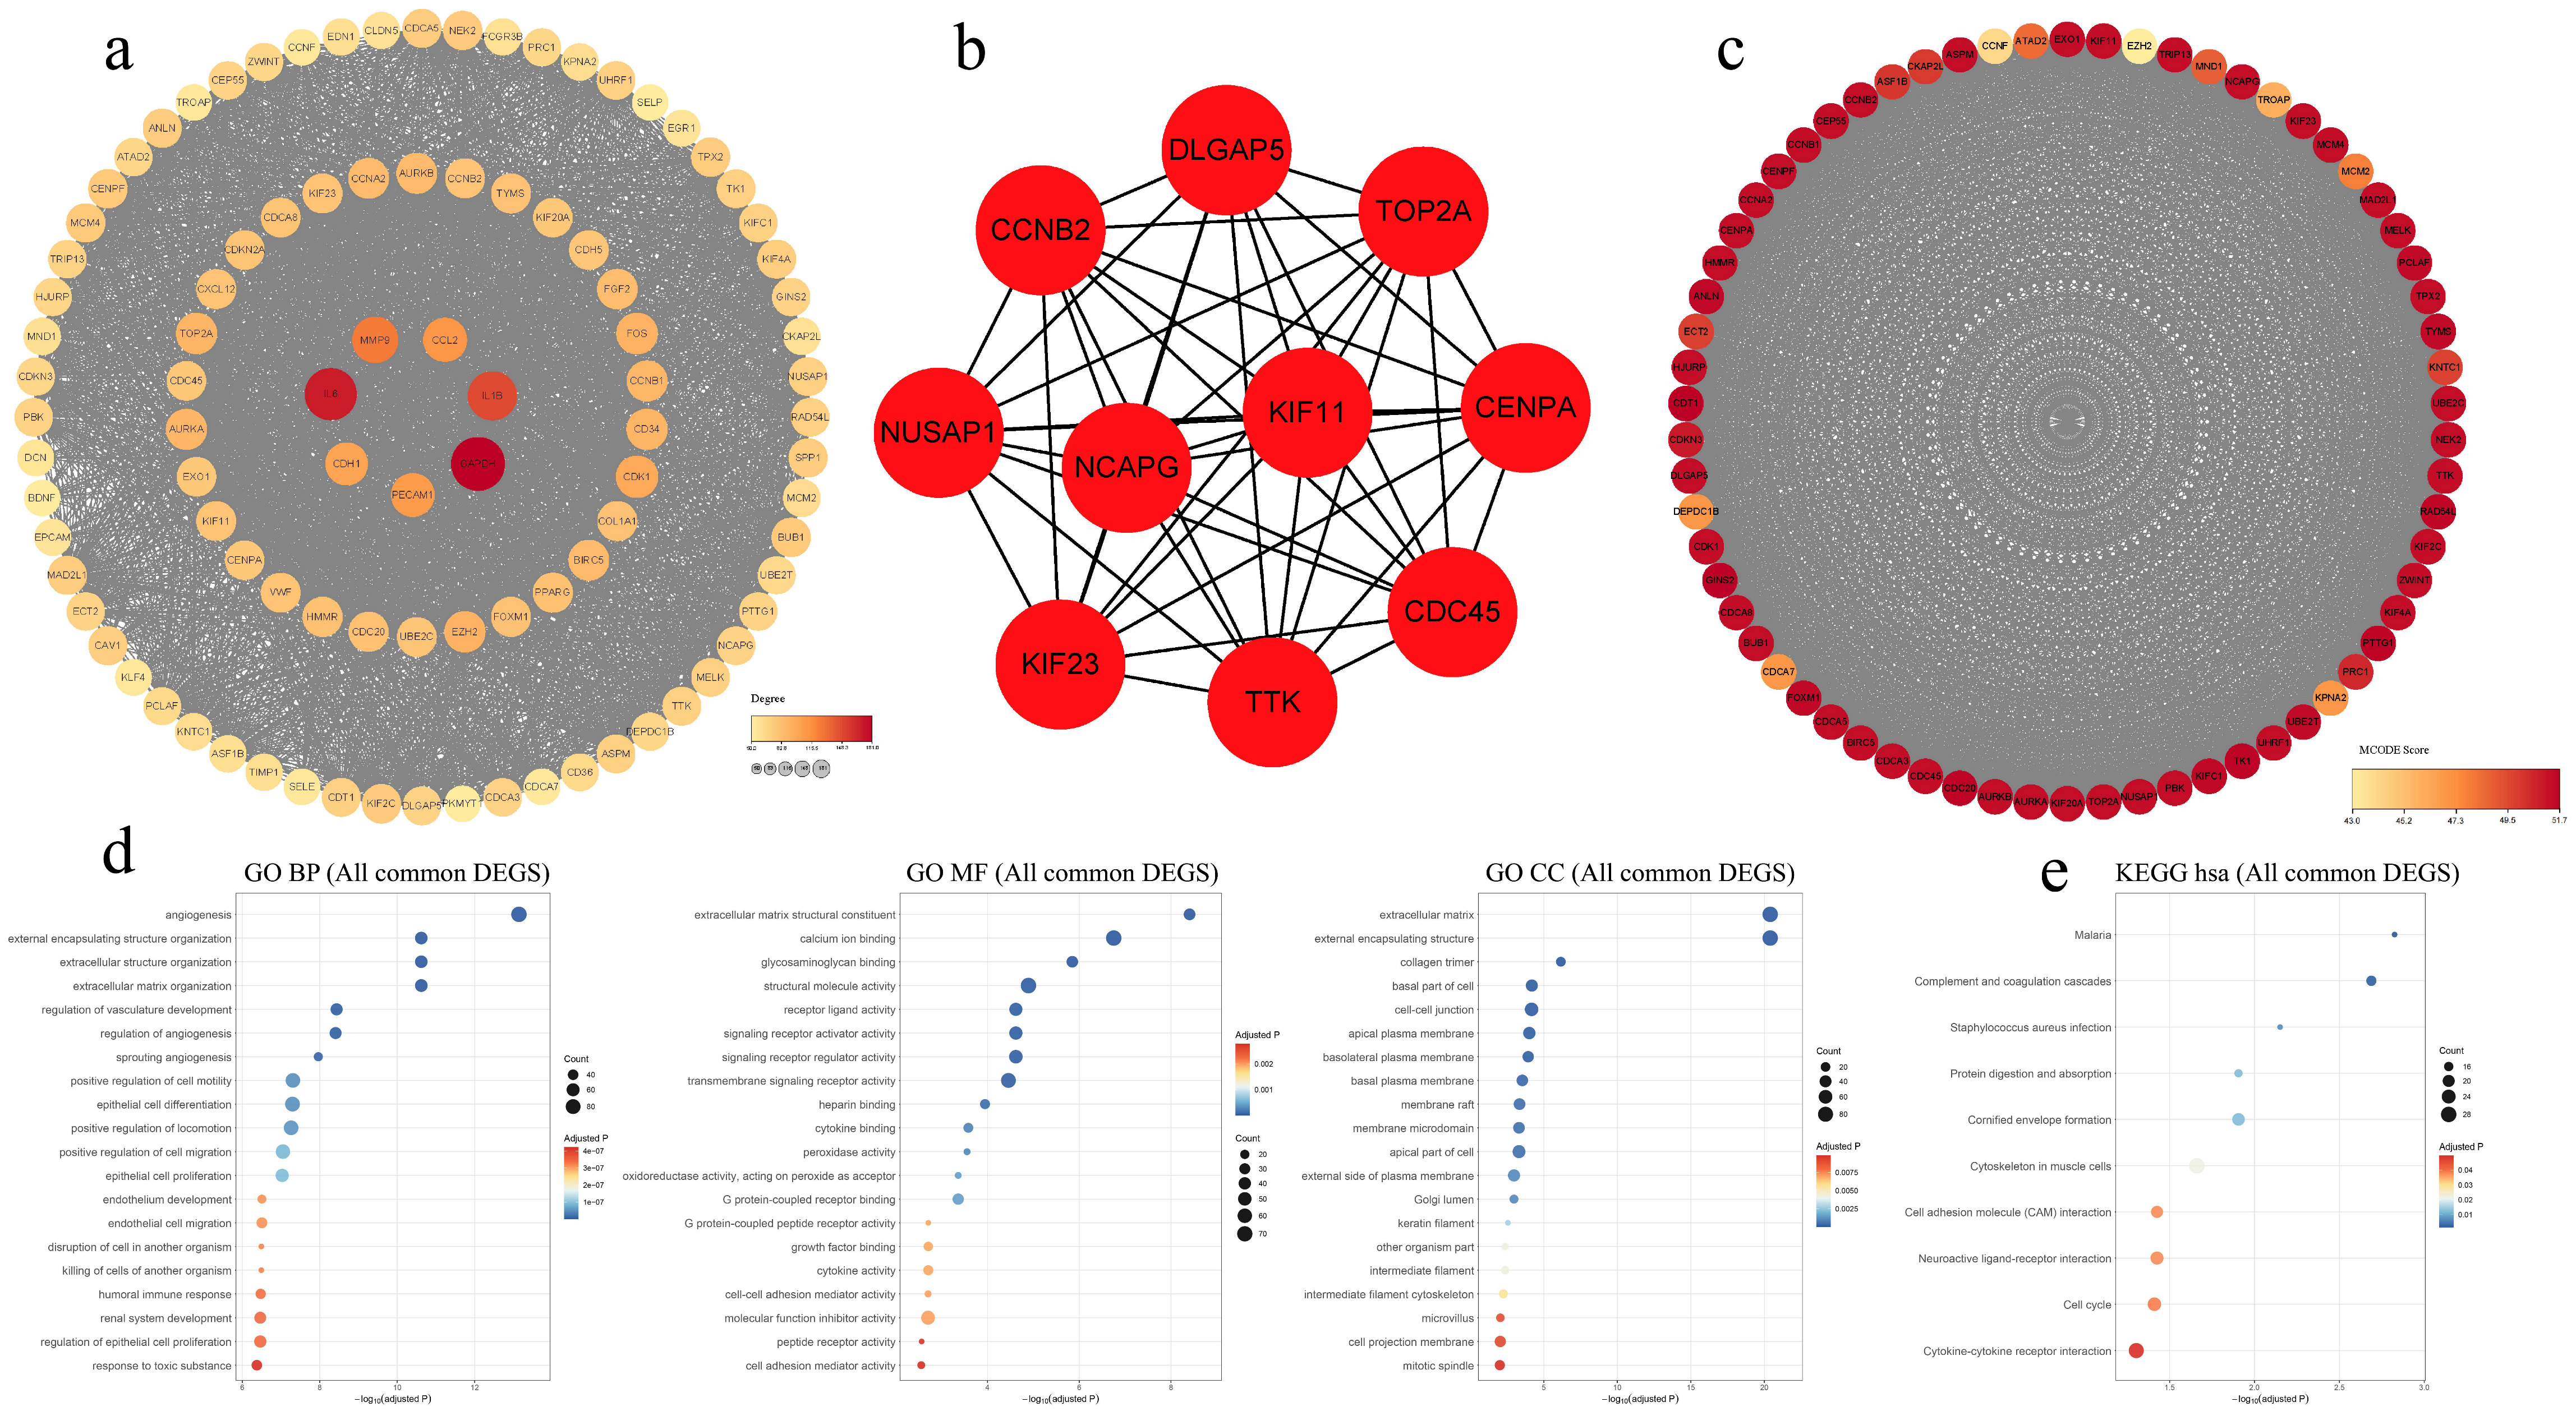
A PPI network of the common DEGs was constructed using STRING, and genes with a degree ≥ 50 in the network were visualized via Cytoscape (v3.10.4) (Figure 3a). The top 10 genes identified by MCC included DLGAP5, NCAPG, KIF23, KIF11, CDC45, TOP2A, CCNB2, CENPA, TTK, and NUSAP1 (Figure 3b), which were predominantly involved in the regulation of DNA replication, the cell cycle, and cell division processes. MCODE was subsequently used to identify highly interconnected components within the PPI network and extract the major subnetwork (Figure 3c).
Figure 3.
Protein–protein interaction (PPI) analysis and functional enrichment in Lung adenocarcinoma. (a) PPI network demonstrating the dense interplay structure of key genes whose Degree > 50. (b) The top 10 core genes identified by MCC based on the network constructed from overlapping DEGs. (c) Highly interconnected core modules extracted from the PPI network using MCODE. (d) GO enrichment analysis of the intersecting DEGs. Dot color represents the adjusted p value, with blue indicating lower values and red indicating higher values. Dot size represents the number of genes assigned to each pathway. (e) KEGG enrichment analysis of the intersecting DEGs. Dot color represents the adjusted p value, with blue indicating lower values and red indicating higher values. Dot size represents the number of genes assigned to each pathway. Abbreviations: Differentially expressed genes (DEGs); Maximal Clique Centrality (MCC); Molecular Complex Detection (MCODE); Gene Ontology (GO); Biological Process (BP); Molecular Function (MF); Cell Component (CC); Kyoto Encyclopedia of Genes and Genomes (KEGG); Homo sapiens (hsa).
GO and KEGG enrichment analyses were performed to characterize LUAD-associated biological functions and pathways (Supplementary Table S2). GO analysis revealed the principal LUAD-associated terms in the BP, CC, and MF categories (Figure 3d), collectively indicating the involvement of angiogenesis, cell adhesion and migration, extracellular matrix remodeling, immunity, and inflammation. KEGG analysis revealed enrichment in infection-related pathways, complement and coagulation cascades, cell adhesion molecule (CAM) interaction, the cell cycle and cytokine–cytokine receptor interactions (Figure 3e).
2.3. Identification of LUAD-Associated TFs
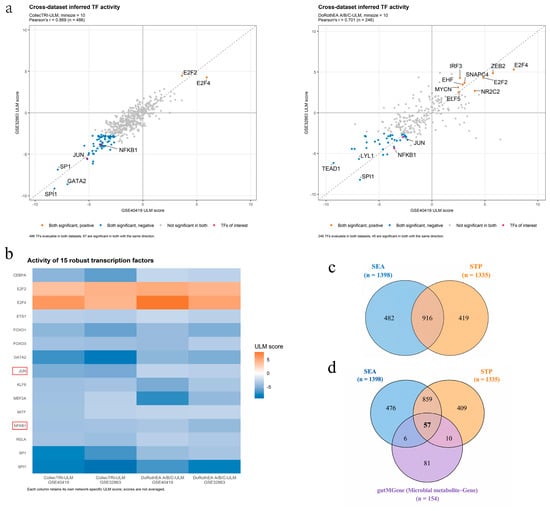
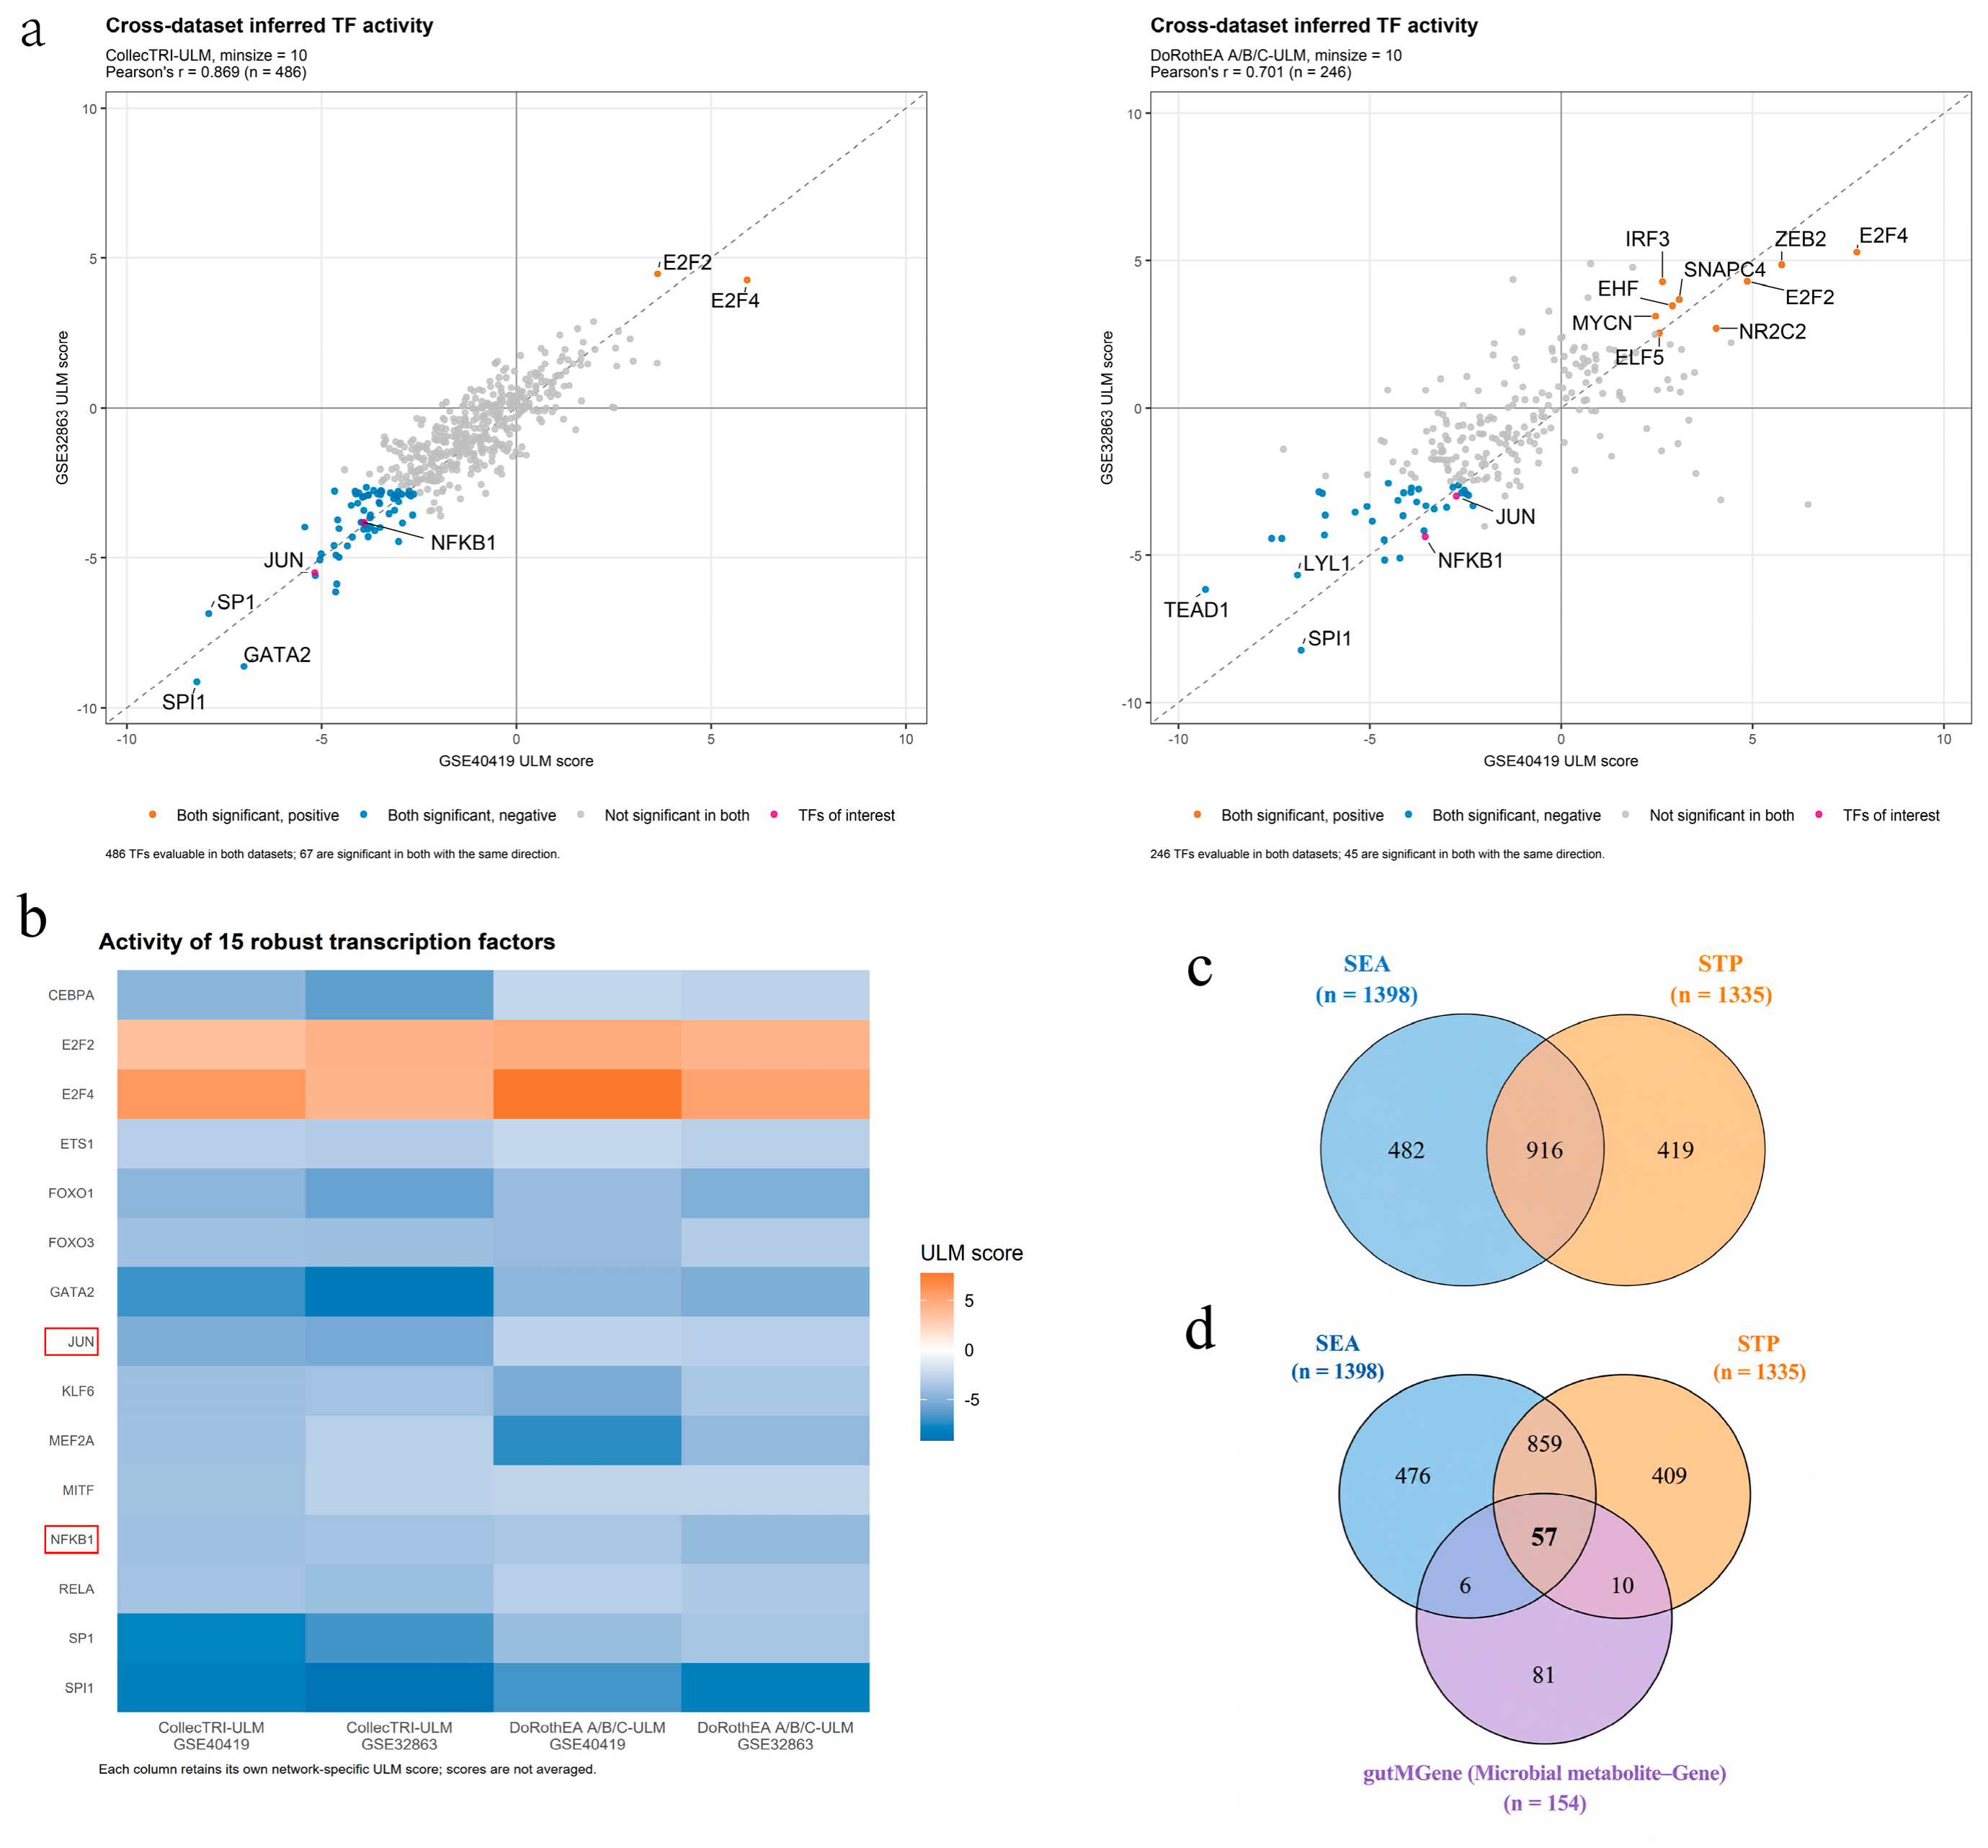
TF activity inference further elucidated the upstream transcriptional regulators that play essential roles in LUAD development. In the primary analysis using the CollecTRI regulatory network, 486 TFs were shared between the two datasets, of which 67 exhibited significantly altered activity in both datasets in concordant directions (Figure 4a, Supplementary Table S3). In the sensitivity analysis using the DoRothEA A/B/C confidence-level network, 246 TFs were shared between the datasets, of which 45 showed significant and directionally concordant changes in activity (Figure 4a). The inferred TF activity profiles showed strong cross-dataset concordance (Pearson’s r = 0.869 in CollecTRI analysis). Furthermore, the results of the primary and sensitivity analyses revealed 15 robust TFs (Figure 4b), namely, CEBPA, E2F2, E2F4, ETS1, FOXO1, FOXO3, GATA2, JUN, KLF6, MEF2A, MITF, NFKB1, RELA, SP1, and SPI1, which were retained for subsequent analyses.
Figure 4.
(a) Correlations of ULM-inferred TF activity scores between GSE40419 and GSE32863 under two analytical settings, with the two TFs of interest highlighted. (b) Heatmap showing the ULM activity scores of 15 robust TFs in the two datasets, with the two TFs of interest indicated by red boxes. (c) Venn diagram showing the overlap between target genes predicted by SEA and STP. (d) Venn diagram showing the overlap among SEA-predicted genes, STP-predicted genes, and microbial metabolite–gene associations obtained from gutMGene. Abbreviations: transcription factor (TF); similarity ensemble approach (SEA); SwissTargetPrediction (STP).
2.4. Identification of Gut Microbes, Gut Microbial Metabolites and Target Genes
We initially extracted the gut microbe-microbial metabolite-gene information from the gutMGene v2.0 database and further summarized 277 microbial metabolites and 154 corresponding target genes (Supplementary Table S4). Next, the SEA and STP databases identified 1398 and 1335 predicted target genes, respectively, on the basis of the metabolites (Supplementary Table S4), among which the two databases shared 916 genes (Figure 4c, Supplementary Table S4). We further intersected the gutMGene, SEA and STP databases and identified 57 overlapping genes as core candidate targets of gut microbial metabolites (Figure 4d, Supplementary Table S4).
2.5. MR Analysis of the Gut Microbiota and LUAD
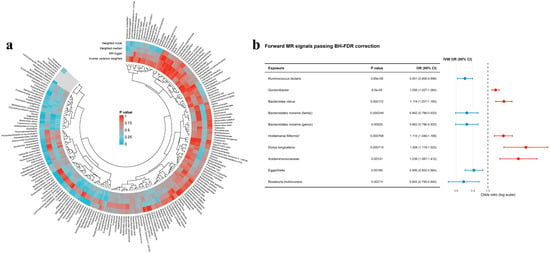
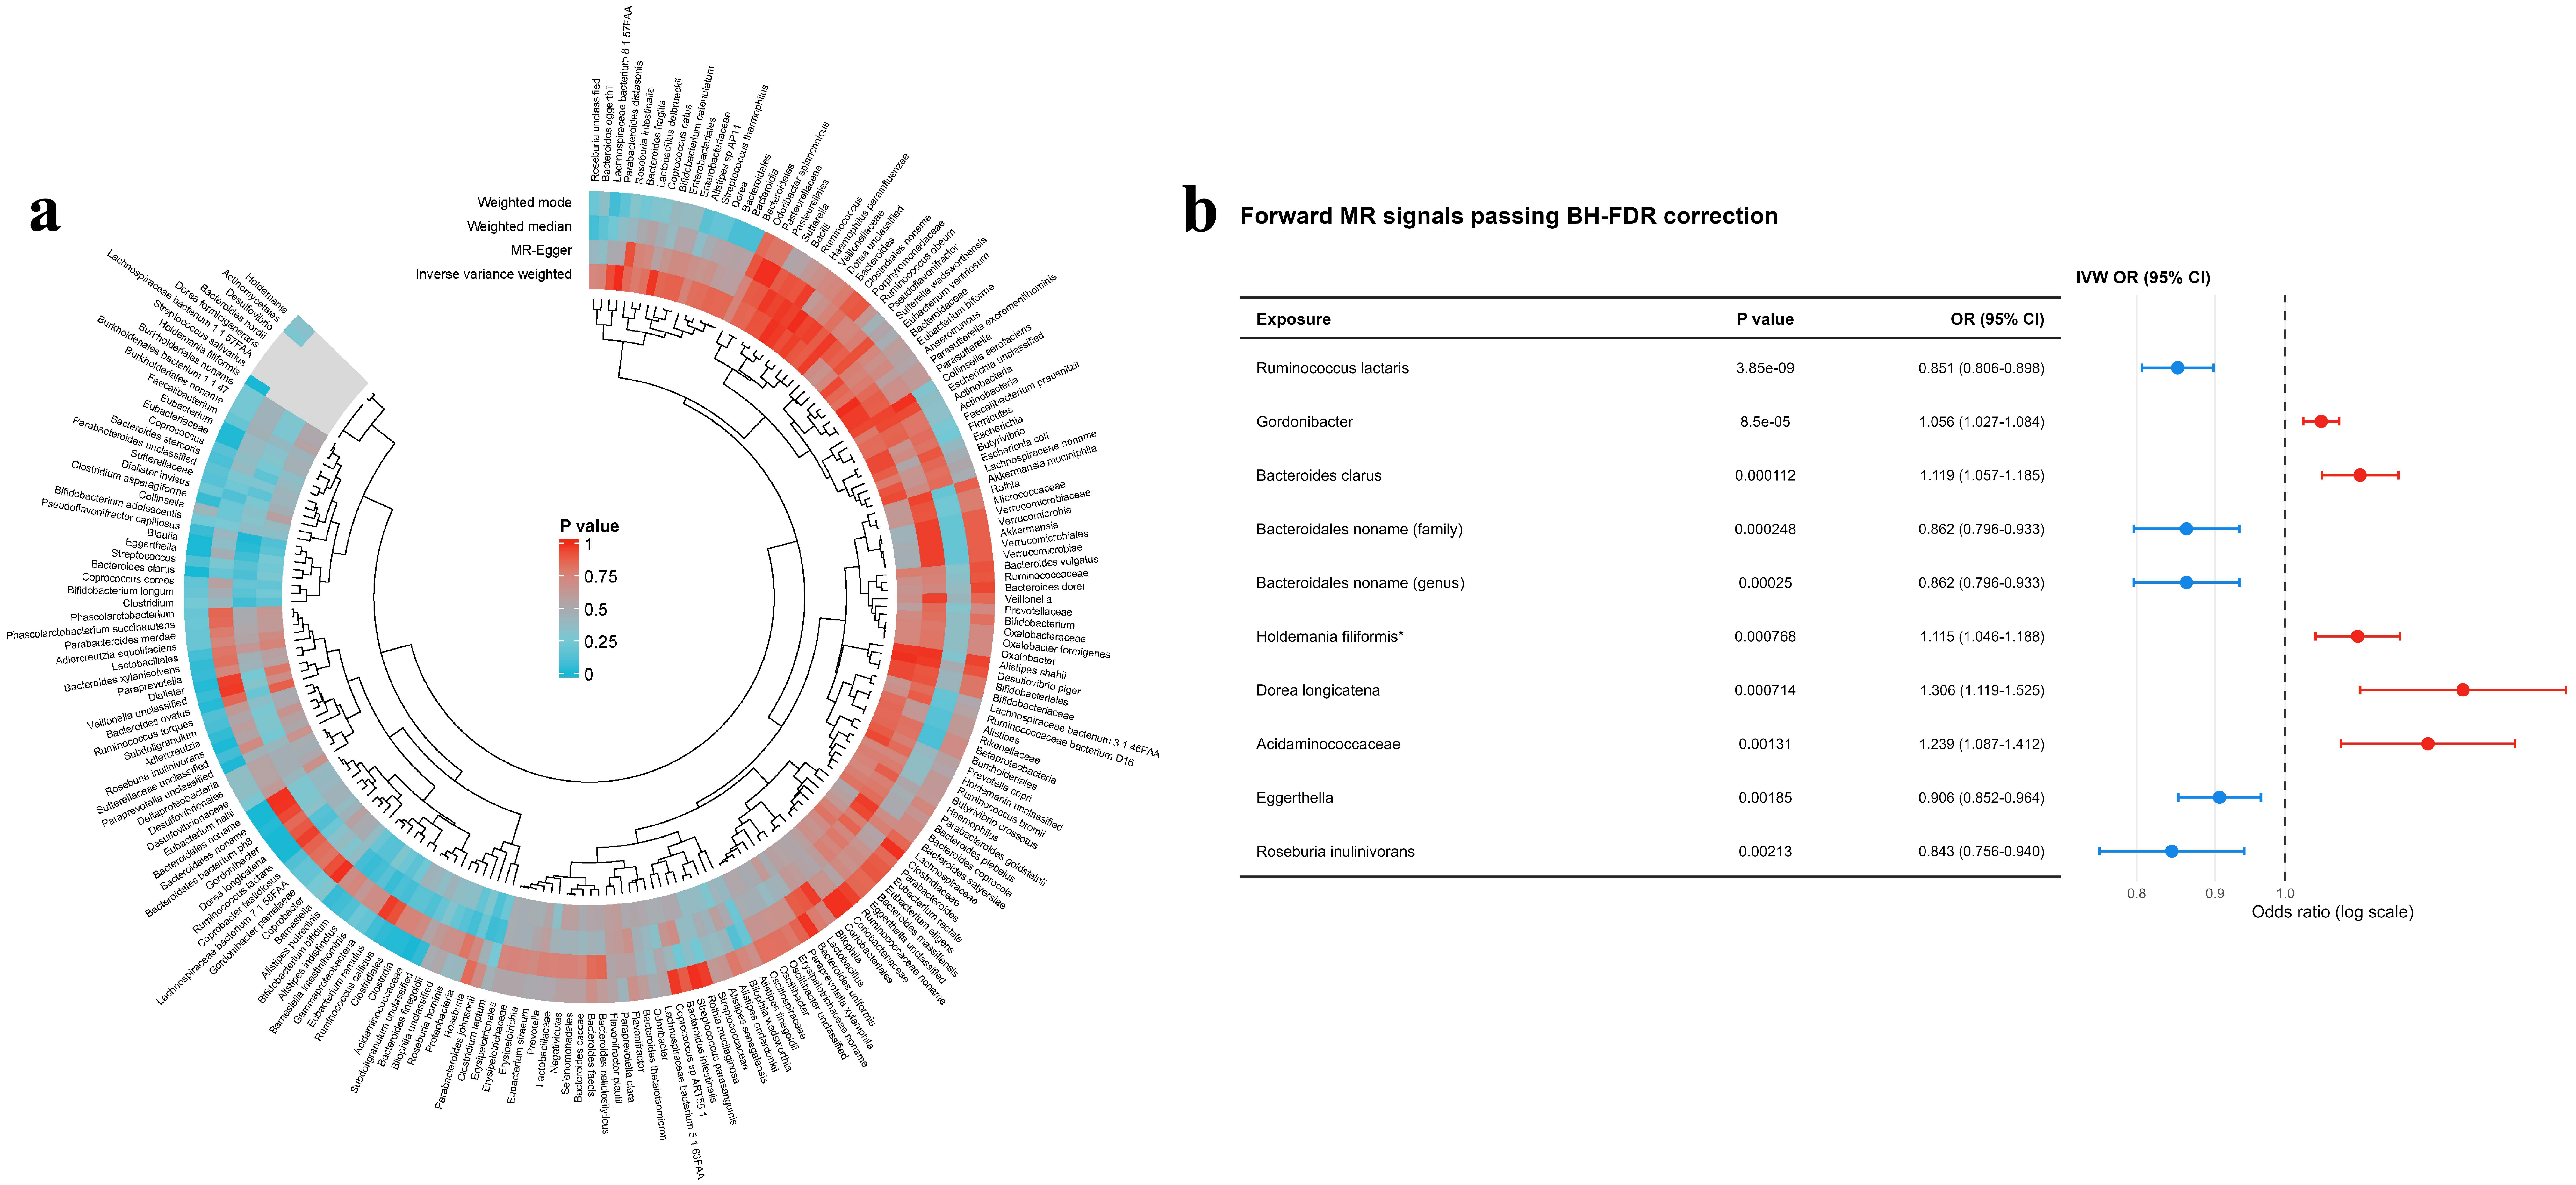
To evaluate the potential causal relationships between gut microbial exposure and susceptibility to LUAD, MR analyses were conducted using multiple complementary methods. A heatmap summarized the p values obtained for 207 microbial taxa using IVW, MR-Egger, weighted median, and weighted mode analyses (Figure 5a). The IVW method was used for the primary analysis. Among all the microbial taxa examined, 10 species, genera, or families were significantly associated with LUAD susceptibility and remained significant after BH-FDR correction. Genetically predicted higher abundances of Ruminococcus lactaris (p = 3.85 × 10⁻⁹; OR = 0.851; 95% CI: 0.806–0.898), Bacteroidales noname (family) (p = 2.48 × 10⁻⁴; OR = 0.862; 95% CI: 0.796–0.933), Bacteroidales noname (genus) (p = 2.50 × 10⁻⁴; OR = 0.862; 95% CI: 0.796–0.933), Eggerthella (p = 0.00185; OR = 0.906; 95% CI: 0.852–0.964), and Roseburia inulinivorans (p = 0.00213; OR = 0.843; 95% CI: 0.756–0.940) were inversely associated with LUAD risk. In contrast, higher abundances of Gordonibacter (p = 8.50 × 10⁻⁵; OR = 1.056; 95% CI: 1.027–1.084), Bacteroides clarus (p = 1.12 × 10⁻⁴; OR = 1.119; 95% CI: 1.057–1.185), Holdemania filiformis (p = 7.68 × 10⁻⁴; OR = 1.115; 95% CI: 1.046–1.188), Dorea longicatena (p = 7.14 × 10⁻⁴; OR = 1.306; 95% CI: 1.119–1.525), and Acidaminococcaceae (p = 0.00131; OR = 1.239; 95% CI: 1.087–1.412) were positively associated with LUAD risk (Figure 5b). Among the 10 traits, 6 adopted p < 5 × 10⁻⁶, and 4 adopted p < 1 × 10⁻⁵ as the instrumental variable selection threshold. The number of instrumental variables ranged from 2 to 7, the mean F-statistics across traits ranged from 20.93 to 23.27, and the F-statistics of all included SNPs ranged from 19.52 to 25.51 (Table 1).
Figure 5.
(a) Circular heatmap demonstrating statistical significance between the gut microbiota and LUAD under four MR methods (IVW, MR-Egger, weighted median and weighted modal). (b) Forest plot of 10 genera with significant causal associations with LUAD identified by IVW analysis. Abbreviations: Mendelian randomization (MR); lung adenocarcinoma (LUAD); inverse variance weighted (IVW); odds ratios (ORs); confidence intervals (CIs). * indicates the trait has fewer than 3 SNPs.
Table 1.
Instrument selection thresholds and strength for the ten significant microbial traits after BH-FDR correction.
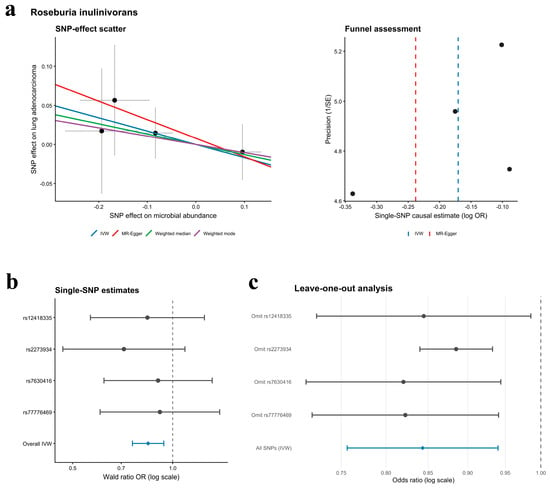
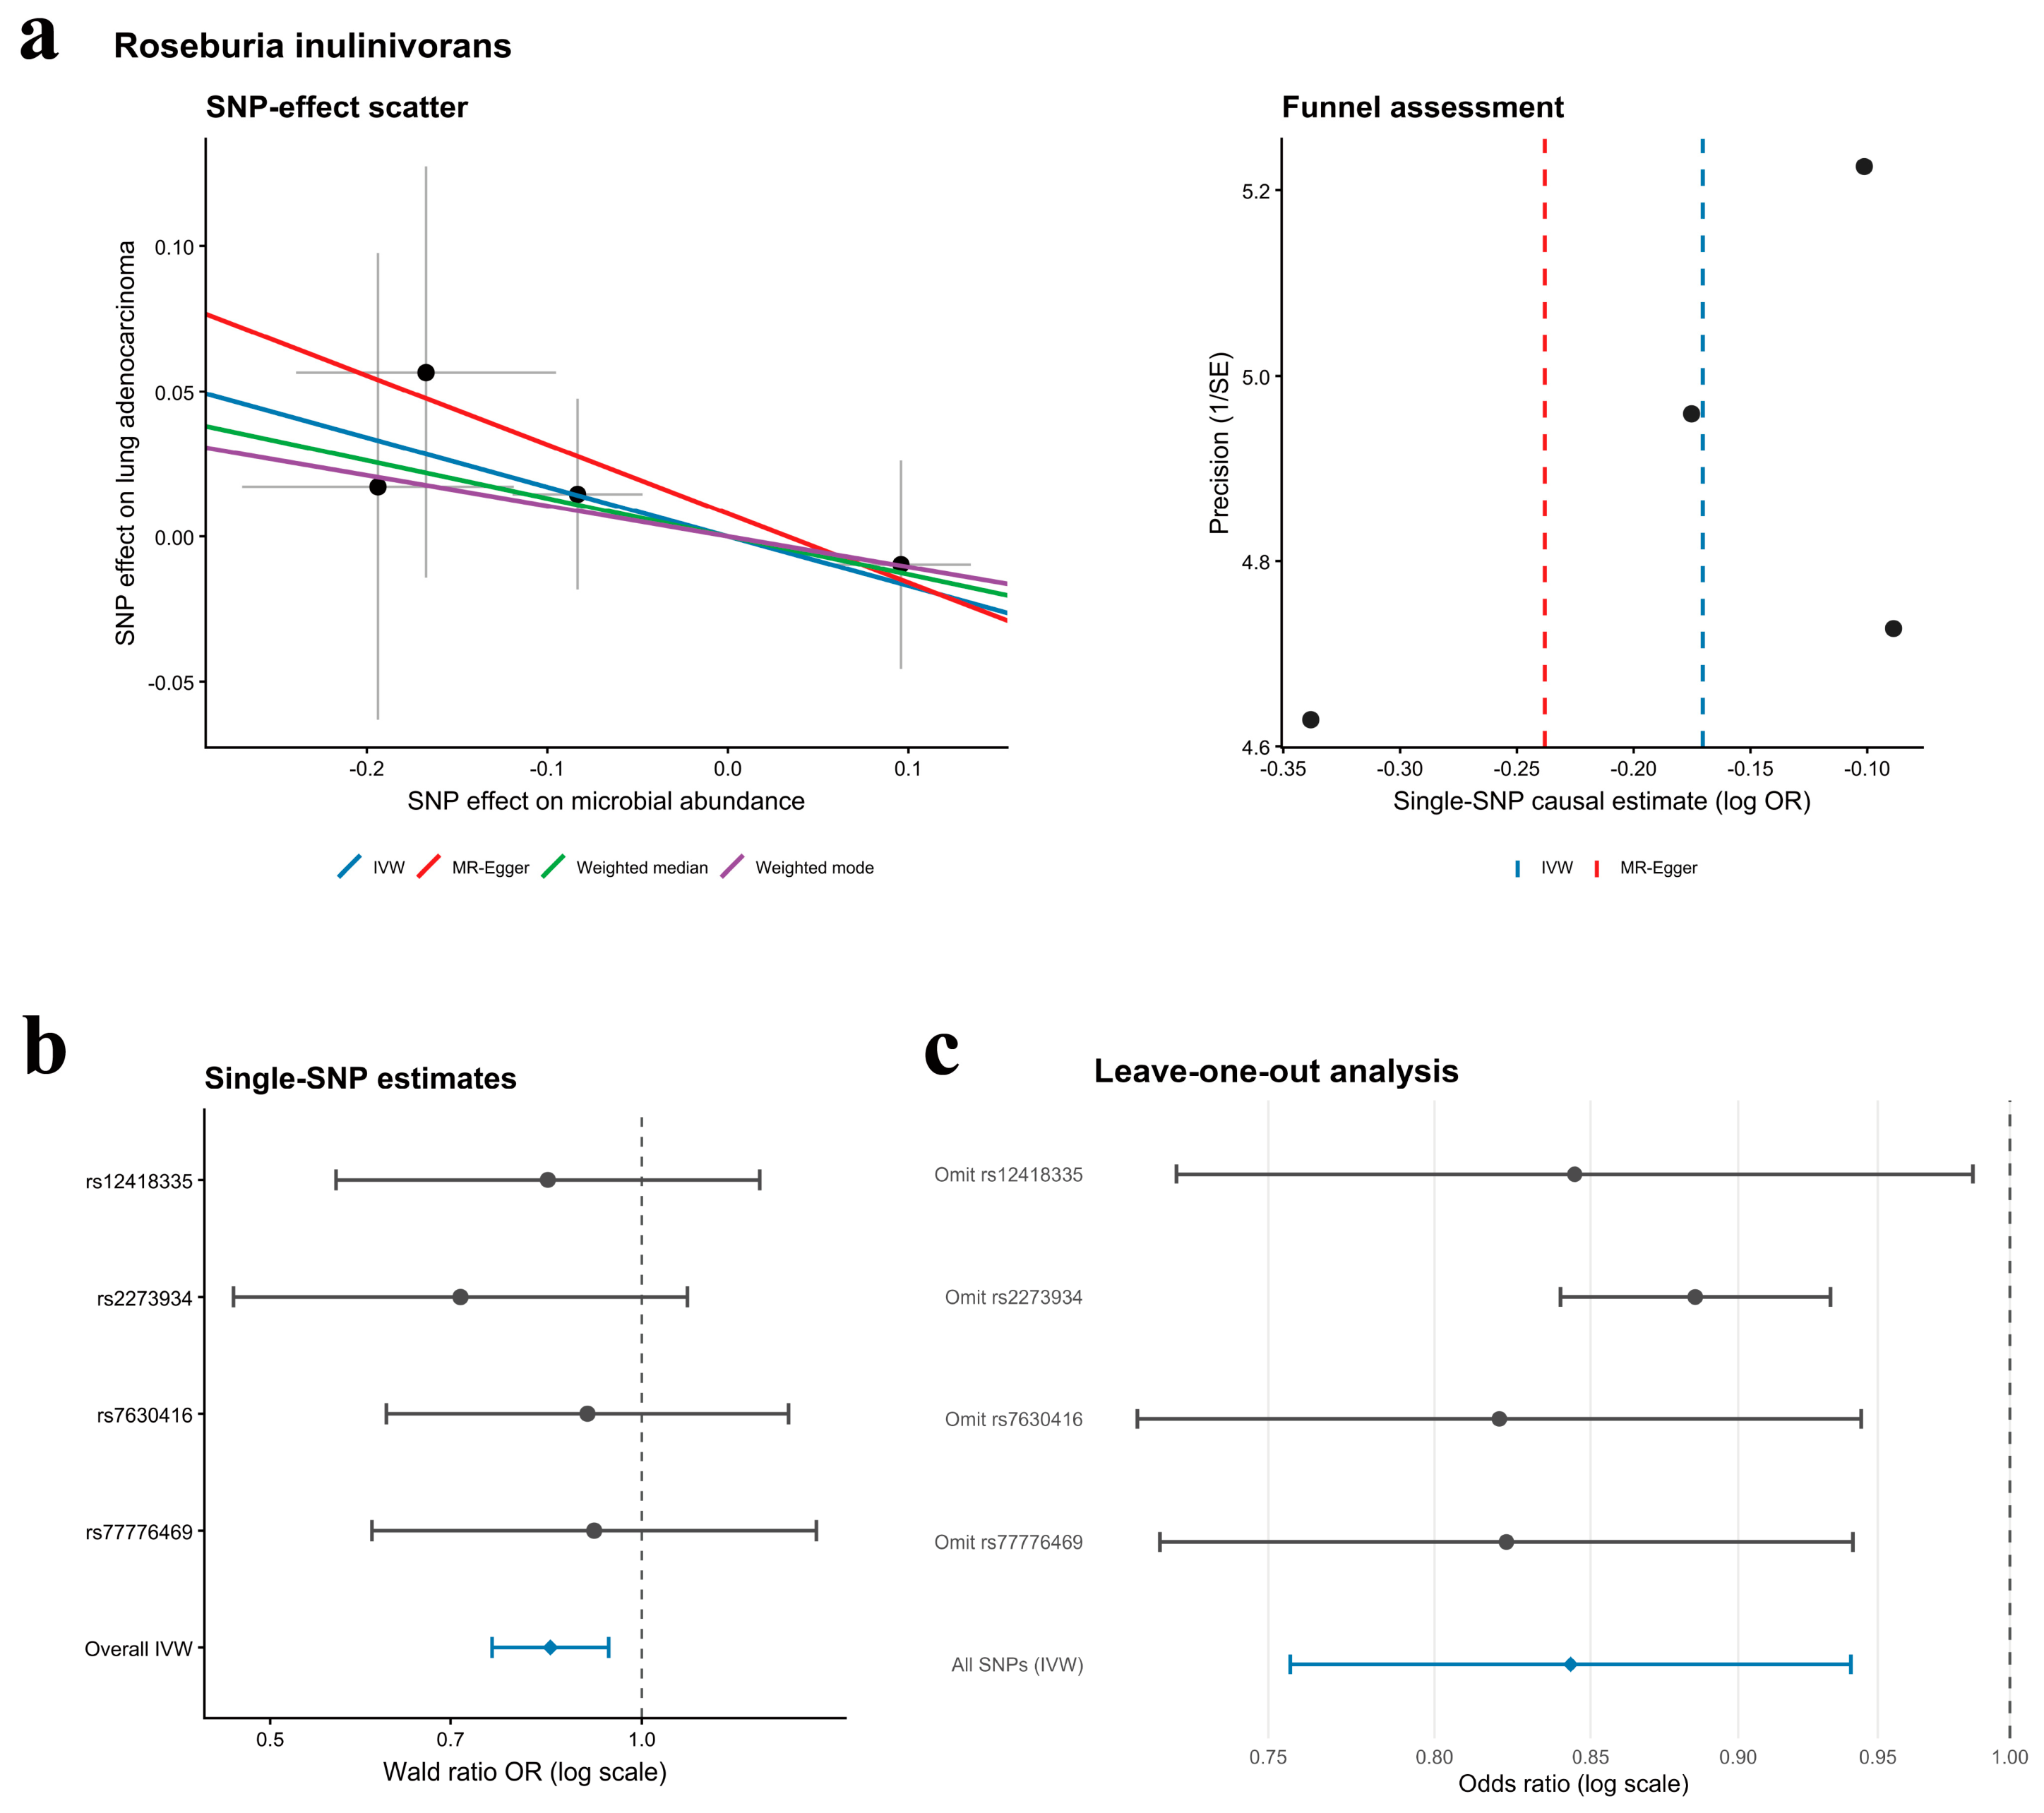
Multiple MR methods consistently suggested a potential inverse association between Roseburia inulinivorans and LUAD risk, while single-SNP and leave-one-out analyses supported the robustness of the result (Figure 6). Moreover, the MR-Egger intercept test (p = 0.8459) and Cochran’s Q test (p = 0.829) provided no evidence of directional horizontal pleiotropy or heterogeneity, respectively (Supplementary Table S5). Reverse MR analysis likewise suggested no evidence of reverse causality between LUAD and any of the aforementioned microbial taxa (Supplementary Figure S1; Supplementary Table S6).
Figure 6.
(a) Circular heatmap demonstrating statistical significance between the gut microbiota and LUAD under four MR methods (IVW, MR-Egger, weighted median and weighted modal). (b) Forest plot of 10 genera with significant causal associations with LUAD identified by IVW analysis. (c) MR analysis of Roseburia inulinivorans. Scatter plots show the SNP effect estimates on exposure and outcome. Funnel plots assess potential horizontal pleiotropy. Forest plots show individual SNP causal effect estimates and leave-one-out analysis with confidence intervals. The horizontal lines indicate 95% CIs. Abbreviations: Mendelian randomization (MR); lung adenocarcinoma (LUAD); Inverse variance weighted (IVW); Odds ratios (ORs); Confidence intervals (CIs); Single-nucleotide polymorphism (SNP).
2.6. Construction of the G-M-T-R-D Network
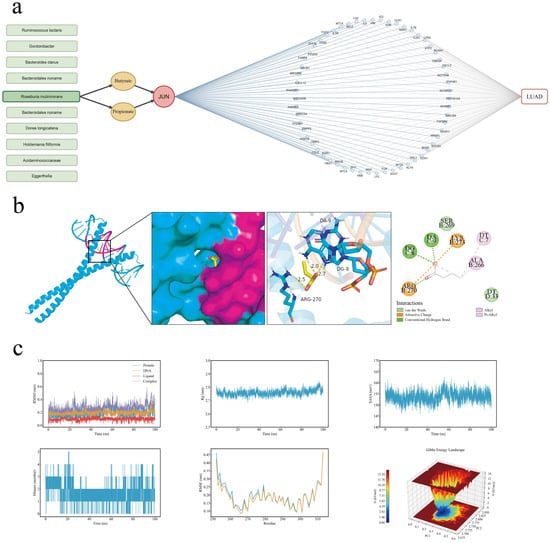
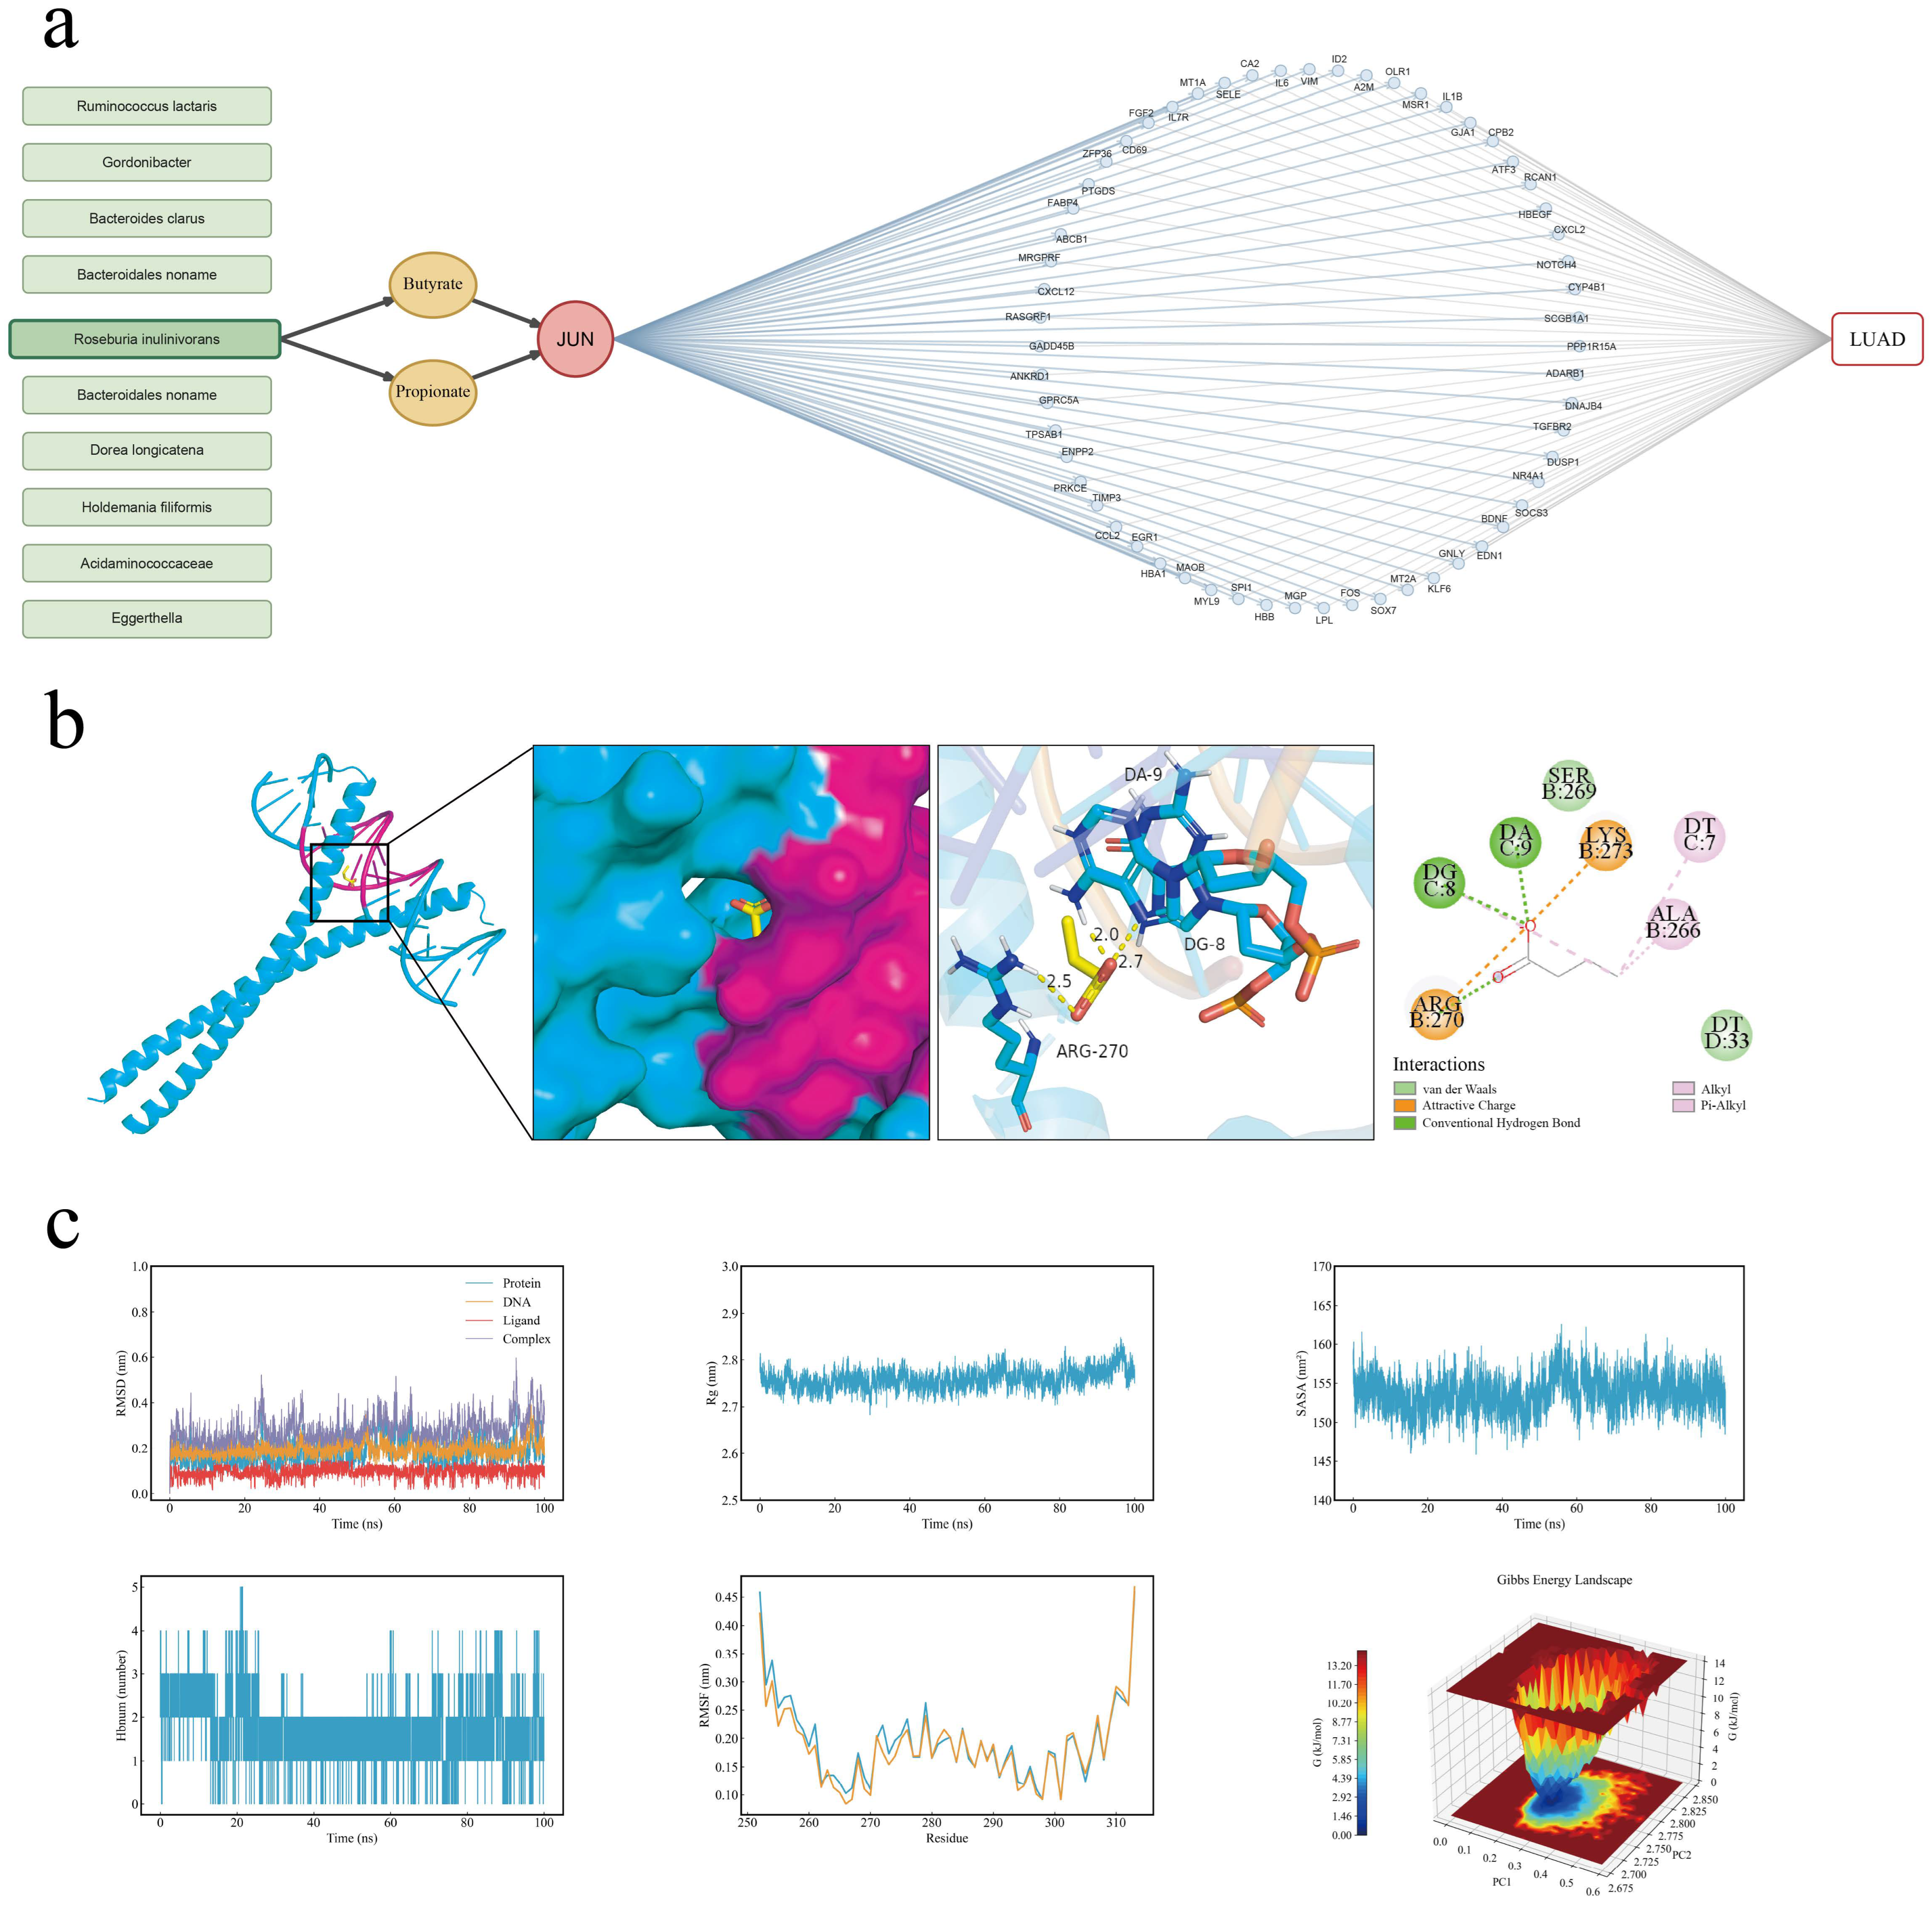
To elucidate the potential regulatory network between the gut microbiota and LUAD, we integrated the preceding results of gut-associated target, TF inference and MR analyses. JUN and NFKB1 were recognized as shared genes after the 15 robust LUAD TF genes were intersected with the 57 candidate gut-derived target genes (highlighted in Figure 4b). After reviewing MR analysis and the gutMGene database, Roseburia inulinivorans, which was suggested to have a negative association with LUAD by MR, was the only gut microbial taxon that matched the gutMGene evidence at the species level. In terms of gutMGene, the metabolites related to Roseburia inulinivorans included 1-propanol, butyrate and propionate, whereas butyrate and propionate were associated with the target gene JUN. From the CollecTRI-defined JUN regulon, 59 target genes that contribute consistently to the inferred reduction in JUN activity and are simultaneously concordant shared differentially expressed genes in both GEO cohorts were included in the network. These findings suggest that JUN may play a key role in linking the gut microbiota with LUAD. A G-M-T-R-D network was constructed to integrate database-derived microbiota–metabolite–gene relationships with LUAD-associated TF activity and regulon information, generating hypotheses about potential links among R. inulinivorans, butyrate or propionate, and JUN-associated transcriptional regulation in LUAD (Figure 7a).
Figure 7.
(a) A hypothesis-generating gut microbiota–metabolite–TF–regulon–disease (G-M-T-R-D) network centered on JUN. (b) Molecular docking model of the JUN protein with butyrate. (c) Molecular dynamics simulation results of butyrate with the JUN protein. The color represents the relative Gibbs free energy (kJ/mol). Abbreviations: root mean square deviation (RMSD); root mean square fluctuation (RMSF); radius of gyration (Rg); solvent-accessible surface area (SASA); hydrogen bond number (Hbnum); free energy landscape (FEL).
2.7. Molecular Docking and Molecular Dynamics Simulations
To evaluate the potential interactive effects of JUN combined with butyrate and propionate, they were separately docked against two JUN-containing DNA-bound structures (PDB IDs: 5T01 and 1FOS). Both butyrate and propionate were docked in their deprotonated anionic forms, with a net charge of −1. The predicted binding energies and grid-center coordinates for each ligand–receptor combination are summarized in Table 2, among which the most favorable docking score (−4.5 kcal/mol) was obtained when butyrate was docked with the c-Jun homodimer–DNA complex (PDB ID: 5T01). Acetic acid was docked with the candidate complexes as a blank control and showed a relatively weaker binding energy against the c-JUN:DNA complex (−2.5 kcal/mol), which suggested the specificity of the proposed butyrate/propionate–JUN binding interactions. Butyrate formed hydrogen bonds with the DNA nucleotides DA9 and DG8 and the amino acid residue Arg270. Hydrophobic contacts were observed with DT7, Ala266, and DG8, whereas Ser269 and DT33 contributed to van der Waals interactions. Lys273 and Arg270 formed attractive charges with butyrate (Figure 7b).
Table 2.
Molecular docking information of the metabolites butyrate, propionate and acetic acid with JUN proteins.
During the 100 ns molecular dynamics simulation of the butyrate-JUN-DNA complex, the overall average RMSD was 0.282 nm. Although the complex underwent conformational adjustments during the simulation, no persistent structural divergence was observed. Butyrate maintained a relatively stable binding pose within the binding region. Fluctuations in the overall RMSD trajectory may have resulted from changes in the relative orientations of the c-Jun homodimer, DNA, and butyrate. RMSF analysis revealed that the c-Jun chains exhibited low overall flexibility, supporting the structural stability of the binding homodimer. The mean SASA and Rg values increased slightly during the later stage of the simulation but remained comparable to the overall means. These results indicated that the solvent exposure of the complex remained generally stable and that the complex underwent neither persistent expansion nor structural collapse. The number of hydrogen bonds averaged 1.66 throughout the simulation (0–5), with at least two hydrogen bonds present in 55.63% of the simulation frames. FEL revealed a dominant low-free-energy basin, indicating that the system preferentially occupied a relatively stable conformational ensemble. Collectively, these findings suggest that the interactions of butyrate within the JUN-DNA complex were dynamic but maintained a relatively stable overall binding configuration (Figure 7c).
3. Discussion
In this study, two independent LUAD transcriptomic datasets were integrated with MR, disease-associated microbiome and metabolite databases, and molecular simulations were performed to investigate the potential relationships among transcriptional dysregulation, the gut microbiota, and microbial metabolites in LUAD. The overlapping differentially expressed genes were predominantly enriched in pathways related to cell cycle dysregulation, inflammatory and immune responses, angiogenesis, and tumor microenvironment remodeling. TF activity inference consistently indicated suppression of the JUN-regulated transcriptional program in both datasets. MR analysis revealed 10 microbial taxa with potential associations with LUAD. Integration of these findings with the gutMGene database prioritized Roseburia inulinivorans, for which a genetically predicted higher abundance was associated with a lower risk of LUAD. Butyrate was subsequently identified in gutMGene as a metabolite associated with R. inulinivorans. The intersection between candidate TFs and putative metabolite targets further suggested JUN as a potential connecting node, supporting the construction of a multilayer gut microbiota-metabolite-target/regulator-disease network. Molecular docking and molecular dynamics simulations suggested that butyrate could form an energetically plausible and relatively stable interaction at the interface of the JUN-DNA complex. Taken together, these findings support a putative R. inulinivorans-butyrate-JUN regulatory axis in LUAD, although its biological and causal relevance requires experimental validation.
A major finding of this study was the identification of JUN as a central connecting node in our proposed framework. The common JUN gene product c-Jun frequently forms an AP-1 heterodimer with c-Fos and influences the initiation and progression of solid tumors by regulating intracellular signaling pathways [21]. Through TF activity analysis, we observed downregulation of the c-Jun transcriptional program in two independent transcriptomic datasets. Previous studies have reported a similar phenomenon, showing that c-jun and c-fos expression is reduced in tumor tissues compared with adjacent non-tumorous tissues, although the upstream mechanism responsible for this transcriptional suppression remains unclear [22]. Notably, the suppression of JUN expression does not necessarily indicate a reduced tumor burden. One study showed that when the canonical JUN gene product c-Jun decreased, JunD expression and phosphorylation would increase, thereby promoting lung tumor formation through the JNKK2-JNK1 pathway [23]. These findings suggest that different JUN family products may exert opposing effects in distinct biological contexts [24]. As a key component in LUAD initiation and progression, JUN expression may be either upregulated or suppressed depending on the context, and its functional role appears to vary substantially according to molecular subtype and signaling background. The precise mechanisms underlying these context-dependent effects require further investigation.
Another important finding was the identification of butyrate as a candidate microbial metabolite. As an important short-chain fatty acid, butyrate has been shown to link the gut microbiota to multiple disease phenotypes [25]. In colorectal cancer cells, butyrate can inhibit histone deacetylases (HDACs), thereby increasing the expression of genes involved in apoptosis induction and cell cycle deceleration and ultimately suppressing tumor cell metabolism [26]. In vitro studies have also shown that butyrate can increase the susceptibility of pancreatic ductal adenocarcinoma cells to ferroptosis through mechanisms such as oxidative stress and intracellular lipid accumulation [27]. In lung cancer cells, butyrate has been reported to increase the expression of P-glycoprotein (P-gp), a protein implicated in tumor drug resistance, by promoting transcriptional activation and improving the stability of ABCB1 mRNA [28]. The broad biological effects of butyrate suggest that the signaling pathway identified in this study may represent part of a microbiota-derived metabolic regulatory network, in which butyrate may act as a potential mediator influencing JUN transcriptional regulation.
Despite the insights provided by this integrative analysis, several considerations should be taken into account when the findings are interpreted. First, although transcriptomic datasets were carefully selected following inclusion/exclusion criteria (based on factors including sample species, histological type, pairwise grouping and sample size) and appropriately processed for normalization, differences in assay technology, population characteristics, sample handling, and tumor heterogeneity may limit the comparability and generalizability of the findings. Further validation based on larger-scale cohort data is anticipated. Second, MR inference depends on the relevance, independence, and exclusion–restriction assumptions for the selected genetic instruments. Although inverse-variance weighted, MR-Egger, weighted-median, and weighted-mode methods were applied, together with assessments of heterogeneity and horizontal pleiotropy, bias arising from undetected horizontal pleiotropy, linkage disequilibrium, weak instruments, population stratification, or genetic confounding cannot be fully excluded. Moreover, MR estimates based on microbial traits reflect genetically predicted variation in microbial abundance and should not be interpreted as the direct effect of probiotic administration or microbial supplementation. Third, the relatively limited coverage of the gutMGene database may have resulted in the omission of potentially relevant microbial taxa, metabolites, and microbiota-metabolite associations. Fourth, molecular docking and molecular dynamics simulations assess only the structural plausibility and predicted stability of a molecular interaction. They cannot fully represent direct binding under physiological conditions, binding specificity or affinity, intracellular butyrate availability, changes in JUN/AP-1 function, or downstream LUAD phenotypes. Finally, the present study did not include a set of experiments that validate the butyrate exposure to JUN/AP-1 activity and downstream LUAD phenotypes. The database-curated evidence cannot be interpreted directly as relationships experimentally established in LUAD. Future experimental studies are expected to investigate and validate this proposed regulatory mechanism. The effects of microbiota, metabolites and targets that were not prioritized in this specific study are still worthy of further investigation.
In summary, this integrative study identifies a putative Roseburia inulinivorans-butyrate-JUN regulatory axis in LUAD and provides a potential mechanistic link between gut microbial metabolism and tumor-associated transcriptional dysregulation.
4. Materials and Methods
4.1. Identification of LUAD-Related Genes and Bioinformatics Analysis
The transcriptomic datasets of LUAD were retrieved from the Gene Expression Omnibus (GEO) database (https://www.ncbi.nlm.nih.gov/geo/ accessed on 30 August 2026). GSE40419 is a paired transcriptomic RNA-seq dataset of LUAD [29]. It contains samples from 87 lung adenocarcinomas and 77 adjacent normal tissues. To implement the strict patient-level matching paired analysis, 10 tumor samples without matched adjacent normal tissues were excluded, and 77 pairs comprising 154 samples were retained. GSE32863 is a paired LUAD gene expression dataset generated by microarray [30]. It contains LUAD tumor tissues and matched adjacent non-tumor lung tissues, which originally included 58 tumor and 58 adjacent normal samples. Unpaired samples 3023_T and 3035_N were excluded, and 57 complete tumor-normal pairs were retained. The platform is GPL6884, the Illumina HumanWG-6 v3.0 expression BeadChip. For the high-throughput sequencing data, the RPKM data provided by the original authors were used. For multiple expression records corresponding to the same gene symbol, arithmetic means were calculated. For expression profiling by array, the unnormalized raw probe intensity data were analyzed, and the neqc() function from the R package limma (v3.68.4) was applied for background correction and quantile normalization to obtain expression values on the log2 scale. In both datasets, genes with a mean RPKM > 1 or a p value < 0.05 in at least 10% of the samples were retained. The expression features were mapped to gene symbols. Differential expression analysis was performed separately for each dataset using limma with a paired design. Genes meeting |log2FC| > 1 and adjusted p < 0.05 were defined as DEGs.
Kyoto Encyclopedia of Genes and Genomes (KEGG) and Gene Ontology (GO) enrichment analyses were performed for the overlapping DEGs using the R package clusterProfiler (v4.18.4). GO enrichment analysis covered the three major ontology categories: biological process (BP), molecular function (MF), and cellular component (CC).
To explore potential protein-level interactions among LUAD-associated genes, a PPI network concerning the overlapping DEGs was constructed using the STRING database (https://cn.string-db.org/ accessed on 30 August 2026) and visualized in Cytoscape (v3.10.4). Highly interconnected modules were identified using the Molecular Complex Detection (MCODE) plugin (v2.0.3), and the top 10 hub genes were ranked using the Maximal Clique Centrality (MCC) algorithm implemented in the cytoHubba plugin. (v0.1).
4.2. TF Activity Inference
To infer TF activity, two human TF-gene regulatory networks (GRNs), CollecTRI (Collection of Transcriptional Regulation Interactions) and DoRothEA (Discriminant Regulon Expression Analysis), were chosen as prior knowledge resources [31]. The R package decoupleR (v2.17.0) was applied to conduct the analysis process [32]. Input genes from GSE32863 and GSE40419 were independently matched to targets in selected GRNs, and those whose regulons contained at least 10 matched target genes (minsize = 10) were retained. A univariate linear model (ULM) was then constructed, with moderated t statistics from limma as input and the resulting ULM t values as the activity scores for each TF. A Benjamini–Hochberg adjusted p value (padj) < 0.05 was considered to indicate statistical significance. Primary analysis was conducted with CollecTRI, while network sensitivity was assessed with DoRothEA A/B/C. TFs showing statistically significant and directionally concordant activity changes across both datasets and analysis settings were defined as robust TFs.
4.3. Identification of Gut Microbiota-Related Metabolites and Targets
The gut microbiota, microbial metabolites and associated human target genes were extracted from the gutMGene v2.0 database (https://bio-computing.hrbmu.edu.cn/gutmgene/#/Home accessed on 30 August 2026) [33]. Simplified Molecular Input Line Entry System (SMILES) formats for each metabolite were retrieved from the PubChem database (https://pubchem.ncbi.nlm.nih.gov/) and utilized to predict potential human targets in the Similarity Ensemble Approach (SEA) (https://sea.bkslab.org/ accessed on 30 August 2026) and SwissTargetPrediction (STP) (https://www.swisstargetprediction.ch/ accessed on 30 August 2026) databases [34,35,36]. The intersection of target genes obtained from the gutMGene Microbial Metabolite-Gene dataset, SEA, and STP was subsequently defined as the gut microbiota-related gene set for downstream analyses.
4.4. Mendelian Randomization Analysis of Gut Microbial Traits and LUAD Susceptibility
To investigate the potential causal associations between gut microbial traits and LUAD susceptibility, a two-sample bidirectional MR analysis was performed. GWAS summary statistics for 207 gut microbial taxonomic traits were obtained from the Dutch Microbiome Project (DMP), which included 7738 European participants (GWAS Catalog accession numbers: GCST90027651–GCST90027857) [37]. GWAS data for LUAD susceptibility were obtained from the IEU OpenGWAS database (https://opengwas.io/ accessed on 30 August 2026), comprising 11,273 cases and 55,483 controls of European ancestry (ebi-a-GCST004744) [38]. Single-nucleotide polymorphisms (SNPs) reaching the conventional threshold of p < 5 × 10⁻⁸ were preferentially selected as instrumental variables (IVs). When the number of eligible IVs was insufficient (less than 3 IVs), relaxed thresholds (p < 5 × 10⁻⁶ or p < 1 × 10⁻⁵) were adopted. The linkage disequilibrium clumping criterion for SNPs was r2 < 0.001. IVs with F > 10 were retained to reduce potential weak instrument bias. The R package TwoSampleMR (v0.7.9) was used to perform MR analysis. The inverse-variance weighted (IVW, when at least two valid instrumental SNPs were available) and Wald ratio (when only one instrumental SNP was available) methods were applied as the primary analytical approaches, supplemented by MR-Egger, weighted-median and weighted-mode methods. For traits for which no estimates could be obtained, a p value of 1 was assigned. The Benjamini–Hochberg procedure was then uniformly applied to all 207 tests for multiple-testing correction. Microbial taxa meeting the BH-FDR threshold of q < 0.05 were selected for subsequent analyses. Cochran’s Q test, MR-Egger intercept test, single-SNP analysis, leave-one-out analysis and reverse MR analysis were performed to examine the sensitivity, horizontal pleiotropy and heterogeneity of the results.
4.5. Construction of the Gut Microbiota-Metabolite-TF-Regulon-Disease (G-M-T-R-D) Network
A G-M-T-R-D network was constructed to integrate the associations among the microbiota, metabolites, TFs and corresponding regulons, as well as disease patterns. LUAD-related transcriptomic analysis and TF activity inference were conducted to identify robust regulatory genes and pathways. Overlapping targets shared between microbial metabolites and LUAD were further linked to key microbial metabolites and upstream microbial taxa.
4.6. Verification Through Molecular Docking and Molecular Dynamics Simulation
To evaluate the interactions between key microbial metabolites and target compounds, molecular docking simulations were performed. The structures of the metabolites were obtained from PubChem and optimized in Chem3D (v23.1.1). As a dimeric TF, AP-1 complexes can form homodimers (JUN/JUN) and heterodimers (JUN/FOS) [39]. From the RCSB Protein Data Bank (https://www.rcsb.org/ accessed on 30 August 2026), we retrieved crystal structures of the JUN:JUN:DNA (PDB ID: 5T01; resolution: 1.89 Å) and JUN:FOS:DNA (PDB ID: 1FOS; resolution: 3.05 Å) complexes [40,,41]. PyMOL (v2.6) was further used to remove water molecules and non-essential groups from the complexes. The 1FOS structure contains two copies of the c-Fos/c-Jun–DNA complex. Chains C, D, G, and H were retained to form an intact receptor complex for docking. AutoDock (v1.2.5) Tools were used to prepare the target proteins and ligands before docking, while the molecular docking, grid construction and binding affinity (kcal/mol) calculation processes were performed by AutoDock Vina (v1.2.5) [42,43].
Molecular dynamics simulation was conducted to investigate the stability and interaction dynamics of protein complexes binding with metabolites. A cubic simulative box was first constructed by establishing a neutralized NaCl environment, minimizing system energy and stabilizing systematic temperature, pressure, and density. A 100 ns unrestrained production simulation was then performed at 300 K and 1 bar. Overall structural stability, residue-level flexibility and protein-ligand interactions were evaluated by root mean square deviation (RMSD), root mean square fluctuation (RMSF), radius of gyration (Rg), solvent-accessible surface area (SASA) and number of hydrogen bonds. The free-energy landscape (FEL) characterized the predominant conformational states during the simulation.
4.7. Statistical Analysis and Visualization
Statistical analyses were performed using R (v 4.5.2). Visualizations and network constructions were performed using R (v 4.5.2), Cytoscape (version 3.10.4) and PyMOL (v2.6).
5. Conclusions
This integrative analysis identified a candidate Roseburia inulinivorans–butyrate–JUN link in lung adenocarcinoma. JUN-associated transcriptional activity was consistently reduced across two independent transcriptomic datasets, while Mendelian randomization analysis revealed an inverse association between R. inulinivorans abundance and LUAD risk. Integration of microbiota–metabolite associations and molecular simulations further prioritized butyrate and JUN within this framework. These findings provide a focused basis for investigating how gut microbial metabolism is related to transcriptional regulation in LUAD and propose a biological hypothesis for subsequent mechanistic investigation.
Supplementary Materials
The following supporting information can be downloaded at https://www.mdpi.com/article/10.3390/ijms272210312/s1.
Author Contributions
Z.W., H.W. and Z.C.: conceptualization, writing—review and editing, supervision. Y.C. (Yupeng Cai) and B.Q.: methodology, data curation, writing—original draft. Y.C. (Yikuan Cai), J.Z., H.L. and X.H.: investigation, validation and visualization. All authors have read and agreed to the published version of the manuscript.
Funding
This work was supported by the Scientific and Technological Planning Project of Guangzhou City (2024A04J5106), the Scientific and Technological Planning Project of Guangzhou City (2024A04J5190), and the Basic and Applied Basic Research Foundation of Guangdong Province (2023A1515110168).
Institutional Review Board Statement
Not applicable.
Informed Consent Statement
Not applicable.
Data Availability Statement
The original contributions presented in this study are included in the article/Supplementary Material and are openly available in FigShare at https://doi.org/10.6084/m9.figshare.34024095. Further inquiries can be directed to the corresponding authors.
Acknowledgments
The authors thank participants in the gutMGene, SEA, STP, GEO, Dutch Microbiome Project, and OpenGWAS for their contributions. The authors gratefully acknowledge all the reviewers and editors for insightful discussions.
Conflicts of Interest
The authors declare no conflicts of interest.
References
- Chen, P.; Liu, Y.; Wen, Y.; Zhou, C. Non-small cell lung cancer in China. Cancer Commun. 2022, 42, 937–970. [Google Scholar] [CrossRef] [Scilit] [PubMed]
- Cao, W.; Chen, H.-D.; Yu, Y.-W.; Li, N.; Chen, W.-Q. Changing profiles of cancer burden worldwide and in China: A secondary analysis of the global cancer statistics 2020. Chin. Med. J. 2021, 134, 783–791. [Google Scholar] [CrossRef] [Scilit] [PubMed]
- Sakoda, L.C.; Alabaster, A.; Sumner, E.T.; Gordon, N.P.; Quesenberry, C.P.; Velotta, J.B. Trends in Smoking-Specific Lung Cancer Incidence Rates Within a US Integrated Health System, 2007-2018. Chest 2023, 164, 785–795. [Google Scholar] [CrossRef] [Scilit] [PubMed]
- Weiner, G.J.; Winn, R.A. Disparate groups share cancer disparities. Trends Cancer 2022, 8, 283–285. [Google Scholar] [CrossRef] [Scilit] [PubMed]
- Meng, F.; Li, J.; Xia, Z.; Wang, Q.; Sun, Q.; Wang, S.; Xu, L.; Yin, R. Persistent lineage plasticity driving lung cancer development and progression. Clin. Transl. Med. 2025, 15, e70458. [Google Scholar] [CrossRef] [Scilit] [PubMed]
- Facchinetti, F.; Proto, C.; Minari, R.; Garassino, M.; Tiseo, M. Mechanisms of Resistance to Target Therapies in Non-small Cell Lung Cancer. In Mechanisms of Drug Resistance in Cancer Therapy; Handbook of Experimental Pharmacology Series; Springer: Cham, Switzerland, 2017; Volume 249, pp. 63–89. [Google Scholar] [CrossRef] [Scilit] [PubMed]
- Anichini, A.; Perotti, V.E.; Sgambelluri, F.; Mortarini, R. Immune Escape Mechanisms in Non Small Cell Lung Cancer. Cancers 2020, 12, 3605. [Google Scholar] [CrossRef] [Scilit] [PubMed]
- Said, S.S.; Ibrahim, W.N. Cancer Resistance to Immunotherapy: Comprehensive Insights with Future Perspectives. Pharmaceutics 2023, 15, 1143. [Google Scholar] [CrossRef] [Scilit] [PubMed]
- Jiao, J.-M.; Liu, C.-G.; Zang, D.; Chen, J. Gut microbiota and metabolites: Emerging prospects in the treatment of non-small cell lung cancer. Front. Immunol. 2025, 16, 1638942. [Google Scholar] [CrossRef] [Scilit] [PubMed]
- Chulkina, M.; Beswick, E.J.; Pinchuk, I.V. Role of PD-L1 in Gut Mucosa Tolerance and Chronic Inflammation. Int. J. Mol. Sci. 2020, 21, 9165. [Google Scholar] [CrossRef] [Scilit] [PubMed]
- Dora, D.; Ligeti, B.; Kovacs, T.; Revisnyei, P.; Galffy, G.; Dulka, E.; Krizsán, D.; Kalcsevszki, R.; Megyesfalvi, Z.; Dome, B.; et al. Non-small cell lung cancer patients treated with Anti-PD1 immunotherapy show distinct microbial signatures and metabolic pathways according to progression-free survival and PD-L1 status. OncoImmunology 2023, 12, 2204746. [Google Scholar] [CrossRef] [Scilit] [PubMed]
- Lee, S.-H.; Cho, S.-Y.; Yoon, Y.; Park, C.; Sohn, J.; Jeong, J.-J.; Jeon, B.-N.; Jang, M.; An, C.; Lee, S.; et al. Bifidobacterium bifidum strains synergize with immune checkpoint inhibitors to reduce tumour burden in mice. Nat. Microbiol. 2021, 6, 277–288. [Google Scholar] [CrossRef] [Scilit] [PubMed]
- Tomita, Y.; Ikeda, T.; Sakata, S.; Saruwatari, K.; Sato, R.; Iyama, S.; Jodai, T.; Akaike, K.; Ishizuka, S.; Saeki, S.; et al. Association of Probiotic Clostridium butyricum Therapy with Survival and Response to Immune Checkpoint Blockade in Patients with Lung Cancer. Cancer Immunol. Res. 2020, 8, 1236–1242. [Google Scholar] [CrossRef] [Scilit] [PubMed]
- Zhu, X.; Li, K.; Liu, G.; Wu, R.; Zhang, Y.; Wang, S.; Xu, M.; Lu, L.; Li, P. Microbial metabolite butyrate promotes anti-PD-1 antitumor efficacy by modulating T cell receptor signaling of cytotoxic CD8 T cell. Gut Microbes 2023, 15, 2249143. [Google Scholar] [CrossRef] [Scilit] [PubMed]
- Preet, R.; Islam, A.; Shim, J.; Rajendran, G.; Mitra, A.; Vishwakarma, V.; Kutz, C.; Choudhury, S.; Pathak, H.; Dai, Q.; et al. Gut commensal Bifidobacterium-derived extracellular vesicles modulate the therapeutic effects of anti-PD-1 in lung cancer. Nat. Commun. 2025, 16, 3500. [Google Scholar] [CrossRef] [Scilit] [PubMed]
- Angel, P.; Allegretto, E.A.; Okino, S.T.; Hattori, K.; Boyle, W.J.; Hunter, T.; Karin, M. Oncogene jun encodes a sequence-specific trans- activator similar to AP-1. Nature 1988, 332, 166–171. [Google Scholar] [CrossRef] [Scilit] [PubMed]
- Mechta-Grigoriou, F.; Gerald, D.; Yaniv, M. The mammalian Jun proteins: Redundancy and specificity. Oncogene 2001, 20, 2378–2389. [Google Scholar] [CrossRef] [Scilit] [PubMed]
- Ming, J.; Jiang, G.; Zhang, Q.; Qiu, X.; Wang, E. Interleukin-7 up-regulates cyclin D1 via activator protein-1 to promote proliferation of cell in lung cancer. Cancer Immunol. Immunother. 2011, 61, 79–88. [Google Scholar] [CrossRef] [Scilit] [PubMed]
- Putra, A.C.; Eguchi, H.; Lee, K.L.; Yamane, Y.; Gustine, E.; Isobe, T.; Nishiyama, M.; Hiyama, K.; Poellinger, L.; Tanimoto, K. The A Allele at rs13419896 of EPAS1 Is Associated with Enhanced Expression and Poor Prognosis for Non-Small Cell Lung Cancer. PLoS ONE 2015, 10, e0134496. [Google Scholar] [CrossRef] [Scilit] [PubMed]
- Chien, S.-T.; Lin, S.-S.; Wang, C.-K.; Lee, Y.-B.; Chen, K.-S.; Fong, Y.; Shih, Y.-W. Acacetin inhibits the invasion and migration of human non-small cell lung cancer A549 cells by suppressing the p38α MAPK signaling pathway. Mol. Cell. Biochem. 2011, 350, 135–148. [Google Scholar] [CrossRef] [Scilit] [PubMed]
- Manios, K.; Tsiambas, E.; Stavrakis, I.; Stamatelopoulos, A.; Kavantzas, N.; Agrogiannis, G.; Lazaris, A.C. c-Fos/ c-Jun transcription factors in non-small cell lung carcinoma. J. BUON Off. J. Balk. Union Oncol. 2020, 25, 2141–2143. [Google Scholar]
- Levin, W.J.; Press, M.F.; Gaynor, R.B.; Sukhatme, V.P.; Boone, T.C.; Reissmann, P.T.; Figlin, R.A.; Holmes, E.C.; Souza, L.M.; Slamon, D.J. Expression patterns of immediate early transcription factors in human non-small cell lung cancer. The Lung Cancer Study Group. Oncogene 1995, 11, 1261–1269. [Google Scholar] [PubMed]
- Ruiz, E.J.; Lan, L.; Diefenbacher, M.E.; Riising, E.M.; Da Costa, C.; Chakraborty, A.; Hoeck, J.D.; Spencer-Dene, B.; Kelly, G.; David, J.-P.; et al. JunD, not c-Jun, is the AP-1 transcription factor required for Ras-induced lung cancer. JCI Insight 2021, 6, e124985. [Google Scholar] [CrossRef] [Scilit] [PubMed]
- Pfarr, C.M.; Mechta, F.; Spyrou, G.; Lallemand, D.; Carillo, S.; Yaniv, M. Mouse JunD negatively regulates fibroblast growth and antagonizes transformation by ras. Cell 1994, 76, 747–760. [Google Scholar] [CrossRef] [Scilit] [PubMed]
- Dicks, L.M.T. Butyrate Produced by Gut Microbiota Regulates Atherosclerosis: A Narrative Review of the Latest Findings. Int. J. Mol. Sci. 2025, 26, 6744. [Google Scholar] [CrossRef] [Scilit] [PubMed]
- Han, A.; Bennett, N.; Ahmed, B.; Whelan, J.; Donohoe, D.R. Butyrate decreases its own oxidation in colorectal cancer cells through inhibition of histone deacetylases. Oncotarget 2018, 9, 27280–27292. [Google Scholar] [CrossRef] [Scilit] [PubMed]
- Yang, X.; Zhang, Z.; Shen, X.; Xu, J.; Weng, Y.; Wang, W.; Xue, J. Clostridium butyricum and its metabolite butyrate promote ferroptosis susceptibility in pancreatic ductal adenocarcinoma. Cell. Oncol. 2023, 46, 1645–1658. [Google Scholar] [CrossRef] [Scilit] [PubMed]
- Zhao, L.; Bin, S.; He, H.-L.; Yang, J.-M.; Pu, Y.-C.; Gao, C.-H.; Wang, H.; Wang, B.-L. Sodium butyrate increases P-gp expression in lung cancer by upregulation of STAT3 and mRNA stabilization of ABCB1. Anti-Cancer Drugs 2018, 29, 227–233. [Google Scholar] [CrossRef] [Scilit] [PubMed]
- Seo, J.-S.; Ju, Y.S.; Lee, W.-C.; Shin, J.-Y.; Lee, J.K.; Bleazard, T.; Lee, J.; Jung, Y.J.; Kim, J.-O.; Shin, J.-Y.; et al. The transcriptional landscape and mutational profile of lung adenocarcinoma. Genome Res. 2012, 22, 2109–2119. [Google Scholar] [CrossRef] [Scilit] [PubMed]
- Zhang, W.; Gong, W.; Ai, H.; Tang, J.; Shen, C. Gene expression analysis of lung adenocarcinoma and matched adjacent non-tumor lung tissue. Tumori 2014, 100, 338–345. [Google Scholar] [CrossRef] [Scilit] [PubMed]
- Garcia-Alonso, L.; Holland, C.H.; Ibrahim, M.M.; Turei, D.; Saez-Rodriguez, J. Benchmark and integration of resources for the estimation of human transcription factor activities. Genome Res. 2019, 29, 1363–1375. [Google Scholar] [CrossRef] [Scilit] [PubMed]
- Badia-I-Mompel, P.; Santiago, J.V.; Braunger, J.; Geiss, C.; Dimitrov, D.; Müller-Dott, S.; Taus, P.; Dugourd, A.; Holland, C.H.; Flores, R.O.R.; et al. decoupleR: Ensemble of computational methods to infer biological activities from omics data. Bioinform. Adv. 2022, 2, vbac016. [Google Scholar] [CrossRef] [Scilit] [PubMed]
- Qi, C.; He, G.; Qian, K.; Guan, S.; Li, Z.; Liang, S.; Liu, J.; Ke, X.; Zhang, S.; Lu, M.; et al. gutMGene v2.0: An updated comprehensive database for target genes of gut microbes and microbial metabolites. Nucleic Acids Res. 2024, 53, D783–D788. [Google Scholar] [CrossRef] [Scilit] [PubMed]
- Kim, S.; Chen, J.; Cheng, T.; Gindulyte, A.; He, J.; He, S.; Li, Q.; Shoemaker, B.A.; Thiessen, P.A.; Yu, B.; et al. PubChem 2025 update. Nucleic Acids Res. 2024, 53, D1516–D1525. [Google Scholar] [CrossRef] [Scilit] [PubMed]
- Keiser, M.J.; Roth, B.L.; Armbruster, B.N.; Ernsberger, P.; Irwin, J.J.; Shoichet, B.K. Relating protein pharmacology by ligand chemistry. Nat. Biotechnol. 2007, 25, 197–206. [Google Scholar] [CrossRef] [Scilit] [PubMed]
- Daina, A.; Michielin, O.; Zoete, V. SwissTargetPrediction: Updated data and new features for efficient prediction of protein targets of small molecules. Nucleic Acids Res. 2019, 47, W357–W364. [Google Scholar] [CrossRef] [Scilit] [PubMed]
- Lopera-Maya, E.A.; Kurilshikov, A.; van der Graaf, A.; Hu, S.; Andreu-Sánchez, S.; Chen, L.; Vila, A.V.; Gacesa, R.; Sinha, T.; Collij, V.; et al. Effect of host genetics on the gut microbiome in 7,738 participants of the Dutch Microbiome Project. Nat. Genet. 2022, 54, 143–151, Correction in Nat. Genet. 2022, 54, 1448. https://doi.org/10.1038/s41588-022-01164-2. [Google Scholar] [CrossRef] [Scilit] [PubMed]
- SpiroMeta Consortium; McKay, J.D.; Hung, R.J.; Han, Y.; Zong, X.; Carreras-Torres, R.; Christiani, D.C.; Caporaso, N.E.; Johansson, M.; Xiao, X.; et al. Large-scale association analysis identifies new lung cancer susceptibility loci and heterogeneity in genetic susceptibility across histological subtypes. Nat. Genet. 2017, 49, 1126–1132. [Google Scholar] [CrossRef] [Scilit] [PubMed]
- Hong, S.; Wang, D.; Horton, J.R.; Zhang, X.; Speck, S.H.; Blumenthal, R.M.; Cheng, X. Methyl-dependent and spatial-specific DNA recognition by the orthologous transcription factors human AP-1 and Epstein-Barr virus Zta. Nucleic Acids Res. 2017, 45, 2503–2515. [Google Scholar] [CrossRef] [Scilit] [PubMed]
- Berman, H.M.; Westbrook, J.; Feng, Z.; Gilliland, G.; Bhat, T.N.; Weissig, H.; Shindyalov, I.N.; Bourne, P.E. The Protein Data Bank. Nucleic Acids Res. 2000, 28, 235–242. [Google Scholar] [CrossRef] [Scilit] [PubMed]
- Glover, J.N.M.; Harrison, S.C. Crystal structure of the heterodimeric bZIP transcription factor c-Fos–c-Jun bound to DNA. Nature 1995, 373, 257–261. [Google Scholar] [CrossRef] [Scilit] [PubMed]
- Morris, G.M.; Huey, R.; Lindstrom, W.; Sanner, M.F.; Belew, R.K.; Goodsell, D.S.; Olson, A.J. AutoDock4 and AutoDockTools4: Automated docking with selective receptor flexibility. J. Comput. Chem. 2009, 30, 2785–2791. [Google Scholar] [CrossRef] [Scilit] [PubMed]
- Trott, O.; Olson, A.J. AutoDock Vina: Improving the speed and accuracy of docking with a new scoring function, efficient optimization, and multithreading. J. Comput. Chem. 2010, 31, 455–461. [Google Scholar] [CrossRef] [Scilit] [PubMed]

Disclaimer/Publisher’s Note: The statements, opinions and data contained in all publications are solely those of the individual author(s) and contributor(s) and not of MDPI and/or the editor(s). MDPI and/or the editor(s) disclaim responsibility for any injury to people or property resulting from any ideas, methods, instructions or products referred to in the content. |
© 2026 by the authors. Licensee MDPI, Basel, Switzerland. This article is an open access article distributed under the terms and conditions of the Creative Commons Attribution (CC BY) license.