


Abstract
Unraveling the interrelation between the domain organization of eukaryotic genomes and global transcriptional output remains a challenging problem in genomics and is actively under study. Assessing whether genes within specific domain structures are transcriptionally co-expressed necessitates the development of robust analytical tools that retain the inherent clustering of genomic features. Therefore, we developed the ConGEE (Concordance of Gene Expression Evaluation) method, which preserves local expression patterns by shifting expression values along the ordered gene list while randomizing their domain association. The derived statistical criteria quantify the homogeneity and mean expression level for the given genome domain structure. Extensive simulations confirmed that the proposed method reliably reveals true domain-specific expression concordance: it accurately estimates expression concordance and intra-domain dispersion using calibration appropriate to the particular domain architecture. Applying the developed method to transcriptomic datasets revealed significant changes in transcriptional organization, including a distinct shift toward domain-concordant gene expression in MDA-MB-231 cells transferred to a 3D collagen matrix (which induced a vasculogenic mimicry phenotype), and differential TAD-associated transcriptional patterns in HEK293T cells under different treatment conditions. In conclusion, the developed method provides a reliable approach for assessing domain expression concordance relative to a specified domain annotation, and the relevant tools are freely available at Github.
1. Introduction
The rapid development of next-generation sequencing (NGS) technology over the last decade (for a review and further references, see [1,2]) has caused a continuous stream of experimental data for genomes of various organisms, cellular lines, and tissues. These data are amassed in various specialized databases, such as EncodeProject [3], NCBI GEO [4], EMBL Expression Atlas [5], Genotype-Tissue Expression (GTEx) Project (https://www.gtexportal.org/, accessed on 1 September 2020), FANTOM5 Project [6], and Sequence Read Archive (SRA) [7]. A detailed study of the architecture and functioning of the genome in the context of different genetic and epigenetic features and their interrelations with gene expression requires specific bioinformatic methods and tools (reviewed in [8]).
Studying gene expression is fundamental for understanding biological processes in diverse conditions. Analyzing gene expression patterns can provide understanding about cellular functions, disease mechanisms, and developmental pathways [9,10].
Eukaryotic chromatin is folded hierarchically to organize complex hierarchical structures that are directly related to its genetic functioning [11,12]. The organization of mammal interphase chromosomes can be described as follows [13,14,15,16,17]: Genomic DNA of 146 bp in length is wrapped around octamer histones. The resulting nucleosomes are connected by 20 to 75 bp of linker DNA and form a 10 nm fiber. The nucleosome and linker produce quasi-repetitive units of 160–200 bp. The actual distribution of nucleosomes along genomic DNA is heterogeneous, and the regions of dense packing (clutches) are interspersed with regions depleted of nucleosomes. Each nucleosome clutch contains ~1–2 kbp of DNA, while the resulting unit may comprise ~1–10 kbp of DNA. The clutches replace the 30 nm fiber observed formerly in vitro. Loops of length ~10–100 kbp are the next units in the chromatin architecture, and they combine into topologically associating domains (TADs) about ~1 Mbp in length. TADs are characterized by stronger intramolecular interactions and weaker intermolecular interactions [18,19]. Then, the alternating regions (~1–10 Mbp) of active and inactive chromatin segregate spatially into compartments commonly termed A and B, respectively. The individual chromosomes occupy specific chromosome territories within the nucleus. Their positioning is determined by chromatin connections with the lamina and nucleolus. The domains formed by the respective contacts are called lamina- and nucleolus-associated domains (LADs and NADs). Their lengths are distributed within the range ~50 kbp–5 Mbp [20,21,22,23,24,25].
There are various other genome domains: Polycomb (PC) domains are regions of the genome, occupied by the Polycomb repressive system, that is involved in gene repression [26,27]; and Rapid Amplification of Forum Termini (RAFT) domains, with lengths ~100 kbp, are generated by hot spots of endogenous double-sided DNA breaks produced in vivo [28,29], etc. The detailed review of varied genome domain types can be found in [30,31].
Despite an abundance of experimental evidence linking TADs, LADs, and Polycomb and RAFT domains to specific transcriptional profiles, there remains a clear gap regarding their analysis. Analyzing the interrelation between various domain structures and transcriptional profiles involves assessing the concordance of gene expression, meaning the extent to which genes have similar expression profiles within a specific genome domain structure. Such concordance often suggests co-regulation or involvement in shared biological processes [32,33]. Nonetheless, expression concordance is distinct from covariation across multiple samples and, as such, cannot be used in isolation as evidence of shared regulatory control [32,33,34].
Historically, the statistical validation of expression profile concordance has been an essential component in the procedure of confirming the clinical relevance of biomarkers and translating findings across tissues. Early computational approaches were based on evaluating the direct overlap of predefined, statistically significant gene sets. For example, assessing the concordance of different microarray-based gene expression predictors was critical for the development of robust prognostic signatures in breast cancer [35]. Subsequently, concordance measures were used to quantify covariation in gene expression between different normal and malignant tissues. This analysis revealed that genes with concordant expression across tissue states are frequently regulated by underlying germline genetic variants [36]. Although these foundational studies were highly useful, they indicated that simple gene list intersections required more sophisticated statistical weighting to capture true biological covariation.
As transcriptomic datasets grew both in size and complexity, researchers became aware of the limitations of threshold-dependent overlap measures. This recognition led to the development of new statistical methods that could associate information more comprehensively. As researchers attempted to combine data from several independent studies, they began moving towards pathway-level analysis. One such example is the concordant integrative gene set enrichment analysis, where coordinated changes in gene expression levels can be detected without the intersection of individual genes [37]. The statistical consolidation applied in complex comparative biology, such as the systematic mapping of concordant and discordant immune expression profiles, has allowed for the translational validity of different animal models of human tuberculosis to be assessed [38]. In an attempt to minimize the effects of arbitrary differential expression thresholds, statistical methods have been developed that do not rely on these thresholds. One such method is the rank–rank hypergeometric overlap approach, implemented as a robust statistical tool to identify concordant expression patterns across independent studies using the complete range of gene expression changes [39].
Rigorous statistical tests for concordance are useful in modern genomics for multi-omics integration and cross-disease profiling. The approaches of concordance research are now widely used to evaluate the physical mapping of transcriptional regulation. One of these methods involves assessing the correlation between chromatin accessibility and RNA sequencing on a genome-wide scale. It has been revealed that changes in local chromatin state are not always concordant with transcriptional activity during short-term single-factor perturbations within the cell [40]. Specialized statistical concordance models have been applied to identify common gene networks and putative regulatory elements in related yet distinct malignancies, such as chronic lymphocytic leukemia and multiple myeloma [41].
However, most existing methods implicitly assume that genes are spatially independent along the linear genome. Thus, these methods are not intended to evaluate the concordance of gene expression strictly confined to the structures of genome domains. Therefore, a robust method is still needed to assess the statistical significance of expression homogeneity for a given genomic domain structure. A complementary simulation-based calibration can additionally evaluate within-domain dispersion and estimate a relevant concordance parameter. In this manuscript, we propose a method that addresses these requirements by evaluating within-domain expression homogeneity in a single genome- or chromosome-wide expression profile using cyclic permutations that preserve local gene-order dependence.
2. Results
To evaluate the coordination between the level of gene expression and location of domains, we must assess the relevant autocorrelations. Expression levels have been found to exhibit spatial clustering along chromosomes, with neighboring genes demonstrating correlated expression patterns [34,42]. Unrestricted permutations of gene-associated expression values disrupt this spatial dependence by randomizing their genomic ordering. In contrast, cyclic shifts maintain the sequential arrangement of expression values and their autocorrelation as a function of gene-order lag. Consequently, we adapted the circular genomic permutation approach of Cabrera et al. [43], which has also been applied to spatially dependent gene-set analyses [44]. This approach preserves local expression ordering while randomizing its alignment with genomic-domain boundaries. The suitability of this approach as a statistical null model depends on the assumptions of the cyclic-shift procedure and requires empirical validation.
Our algorithm cyclically permutates (rotates) expression values along the ordered gene list to preserve the natural local expression patterns. Genes are sorted by chromosome identifier and genomic start coordinate. Expression values are cyclically shifted by an integer number of gene positions, with offsets sampled uniformly from (0, …, n − 1). Gene coordinates, gene-to-domain assignments, and overlap weights remain fixed. In genome-wide mode, the concatenated gene list is treated as a single ring, allowing expression values to move between chromosomes. In chromosome-specific mode, each chromosome is analyzed separately using its own gene list. Genes from both strands are included together unless a strand filter is applied.
This approach allows us to generate a robust, statistically valid null distribution that evaluates the association between the observed expression profile and the specified domain annotation under the cyclic-shift null model.
2.1. Cyclic Permutation Test Algorithm
The primary objective of the statistical test is to assess the statistical significance of the expression concordance in a particular domain structure. To accomplish this, we propose a permutation method based on cyclic shifting of values of expression instead of the usual permutation of gene and/or domain coordinates. The employed approach preserves both local expression patterns and the intrinsic genome structure associated with genes and domains.
A cyclic permutation can be performed on a chromosome (chromosome-level analysis) or a genome (genome-wide analysis) that has been closed into a ring. Under the cyclic shifts, the entire genome-wide expression profile is shifted by a random integer offset. This preserves the rank order of expression values along the genome but eliminates the relationship between expression levels and domain boundaries. The mean expression in the original data should be compared to the mean across the cyclic permutations.
For a set of genomic domains containing a set of genes with expression values e1, e2, …, en, the test statistic summarizes how much the within-domain expression variance is reduced relative to a null model in which expression values are cyclically reassigned along the ordered gene list, while gene and domain coordinates remain fixed. In Equations (1) to (4), domain averages are calculated using the same set of domains, each of them containing at least two genes. Gene-to-domain assignments, domain gene counts, and the eligible domain set remain fixed across cyclic shifts. The mean expressions within the native genome domains and within the domains after cyclic permutations are defined as follows:
where Nint,r is the number of genes in a specified domain, Nr is the total number of domains, Nc is the total number of cyclic permutations and I values indicate the respective expression levels. That is, in Equation (1), the mean expression is calculated within a domain, and then the average is taken across all domains. In Equation (2), an additional averaging is performed across all permutations.
The mean variance averaged over different domains and characterizing the homogeneity of expression within the native genome domains is defined as follows:
whereas the counterpart variance characterizing the homogeneity of expression within the genome domains after cyclic permutations is additionally averaged over cyclic permutations and is given by:
Next, the variance in with respect to cyclic permutations is calculated as follows:
where and are defined in Equations (3) and (4) correspondingly. The statistical significance of variations in the homogeneity of expression can be assessed using the Gaussian criterion:
Negative values of zc indicate that expression heterogeneity is increased after cyclic permutations, whereas positive values indicate a decrease. Significantly increased heterogeneity in the permuted datasets implies that the original data exhibit a higher degree of concordance in expression levels than expected by chance. Consequently, zc serves as a statistical test for concordant expression of the specified domains or genes across the analyzed expression profiles.
Similarly to Equations (5) and (6), a criterion for assessing the statistical significance of differences in mean expression levels can be formulated as follows:
where the mean expression values are defined in Equations (1) and (2).
Statistics zc and ze are the differences between the observed statistics and their permutation means in units of the corresponding permutation standard deviations. The number of cyclic shifts determines the Monte Carlo precision of the reference distributions and is not an additional standard-error normalization. Standardization alone does not imply a standard normal distribution; so, the adequacy of the normal approximation has to be tested under the appropriate null hypotheses.
The simulations revealed that the magnitude of the negative zc monotonically increases with concordance C and decreases with intra-domain expression dispersion H, a relationship that can be quantified using the precomputed spline calibration described in Methods, Section 4.4. ze (Equation (7)) is reported in the output but is not used for the concordance estimate.
The formulated z-criterion is attractive as the threshold values can be interpreted directly in terms of the standard normal distribution. In particular, the widely used thresholds |z| ≥ 1.96 and |z| ≥ 2.58 correspond to significance levels of p ≤ 0.05 and p ≤ 0.01, respectively, providing an intuitive framework for statistical inference. However, biological genomic tracks are known to be strongly inhomogeneous [45,46]. Therefore, we cannot assume without verification that the zc statistic follows a standard normal distribution. In order to justify the applicability of the Gaussian z criterion, it is necessary to characterize the empirical distribution of zc and ze values obtained from realistic random datasets preserving the major structural properties of genomic data while lacking the specific concordance under investigation. The resulting distribution should then be evaluated for normality using established statistical criteria. Such analyses provide a rigorous basis for assessing the validity of the proposed statistical criterion and associated p-values.
2.2. Relationships Between Gene Expression and Domains
There is no biological consensus on how to relate gene expression values and domains. There are at least four scenarios reflecting distinct biological hypotheses about how domain organization may influence gene expression:
- Gene expression is distributed proportionally across all domains intersecting the gene. A gene spanning multiple domains contributes to each of them according to the fraction of its length contained within the respective domain, thereby representing a fully distributed model of regulatory influence.
- Gene expression is determined exclusively by the domain containing the transcription start site (TSS), reflecting a promoter-centric view of regulatory control.
- Gene expression relates to the domain covering the largest fraction of the gene, thereby emphasizing the spatial dominance of a single regulatory environment along the gene length.
- Gene expression is midpoint-assigned, meaning that each gene is associated with the domain containing its genomic midpoint. This convention is often implicitly adopted in large-scale genomic analyses.
We implemented all four scenarios in the software. This approach enables the application of various biological interpretations and remains applicable in the context of future research that may establish a preferred model.
2.3. Statistical Simulations for Random Domain-like Datasets
For statistical simulations, hg38/GRCh38.p12 gene coordinates were randomized genome-wide by shuffling genes on each DNA strand, while preserving their non-overlapping arrangement, to generate random domain-like datasets. This approach preserved the heterogeneity of actual gene lengths and maintained the experimentally observed distribution of gene sizes while removing the original spatial relationships between genes and domains. Expression values were assigned by sampling from a uniform distribution between the minimum and maximum expression values observed at each chromosome. Therefore, the simulated datasets retained the empirical characteristics of gene-size variability and the magnitude of expression values per chromosome but removed biologically relevant associations between the domain location and expression patterns.
Genome domain datasets were generated as follows: According to [47], the mean size of TADs varies substantially across model organisms. For well-studied model species, the average TAD size is ≈1 Mbp for H. sapiens [48] and ≈880 kbp for M. musculus. In contrast, D. melanogaster is distinguished by considerably smaller TADs, with a mean size of ≈140 kbp. The size of inter-TAD intervals appears to be conserved across species and is ≈40 kbp. The other well-established domain type is RAFT, which is known to vary in size from 90 kbp to 115 kbp and appears to be conserved in H. sapiens and D. melanogaster with no or relatively small inter-domain intervals.
In order to evaluate the robustness of the proposed criteria to variations in genome architecture and domain types, several simulated datasets were generated. Each dataset was composed of 10,000 replicates, with randomly positioned domains across chromosomes whose lengths were taken from the reference genome. The datasets differed in the simulated domain architecture, i.e., domain lengths and inter-domain gaps:
- H. sapiens TAD-like domains: Domain lengths were sampled from a Gaussian distribution with a mean size of 1 Mbp and standard deviation of 5%. Inter-domain gaps were independently generated from a Gaussian distribution with a mean of 40 kbp and standard deviation of 10%.
- D. melanogaster TAD-like domains: the simulation procedure for this species was the same as that applied for the H. sapiens TAD-like dataset, but the mean domain length was set to 140 kbp.
- RAFT-like domains: The lengths of the domains were sampled from a Gaussian distribution with a mean of 110 kbp and standard deviation equal to 10%. Inter-domain gaps were sampled independently from a uniform distribution between 1 and 100 bp, reflecting densely packed domains with minimal spacing.
For each simulated dataset, the normality for the distributions of the zc and ze criteria (Equations (6) and (7), respectively), which determines the applicability of the Gaussian z-test, was evaluated. Skewness and kurtosis tests were applied to assess deviations from normality in terms of asymmetry and tail heaviness, while the Anderson–Darling test was used to specifically control the deviations from normality in the tails of the distributions. Particular focus was placed on tail behavior because its significance level in the z-test, including the concordance criterion zc (Equation (6)), is defined as zc ≤ −1.96 (p ≤ 0.025), which corresponds to the lower tail of the standard normal distribution. Hence, a proper assessment of the tail regions is required to validate the proposed criteria. In addition, the false discovery rate (FDR) was estimated for each combination of domain type and gene–domain relationship type, as described in Section 2.2. The results of these analyses are summarized in Table 1, and the related distribution histograms are presented in Figure 1. This figure also includes envelope curves alongside MLE-fitted normal distribution curves.
Table 1.
Results of statistical simulations of proposed criterion for various domain types for 10,000 replicates.
Figure 1.
Histograms of simulation results for TAD-like (typical span: 1 MBp and 140 kbp) and RAFT-like domains for proportional-assignment and start-assignment modes. The histograms are complemented by envelope curves (blue curves) alongside the MLE-fitted normal distribution curves (red curves).
The histograms for all 12 variants and both criteria (Equations (6) and (7)) can be found in Supplementary Figure S1.
The parameter variations observed are consistent with expected tolerances across 10,000 replicates. The shape of the distribution in the central region around the mean value deviates from normal because of the presence of domains with a small number of genes. This inconsistency does not affect the results of the statistical tests, as statistical significance is determined by the lower distribution tail (z ≤ −1.96, p ≤ 0.025).
2.4. Generation of Datasets with Controlled Levels of Expression Concordance and Dispersion Inside Domains
To test the formulated criteria in a controlled environment, synthetic datasets were generated using real gene coordinates from an hg38/GRCh38p12 genomic annotation BED file. The gene positions were unchanged, thereby preserving the native strongly inhomogeneous gene sizes and gene-density patterns over the genome.
The TAD-like domains were then simulated independently of gene positions. Domain lengths and inter-domain gaps were both sampled from normal distributions, the former with a mean size of 1 Mbp and standard deviation of 5%, and the latter with a mean size of 40 kbp and standard deviation of 10%. This approach yielded non-overlapping domain architectures of sizes similar to typical mammalian TADs [47] and allowed for variability between replicates.
To simulate within-domain expression similarity, a fixed fraction of domains was defined to be concordant. Baseline expression levels were sampled from a broad distribution, which was designed to reproduce the large variability typically seen in transcriptomic measurements. The main parameter of the simulation was the concordance of expression levels within domains. A fixed fraction of domains was selected as concordant, meaning that genes within the same domain shared an underlying expression level with controlled stochastic variation. Reciprocally, independent expression values sampled from the background distribution were assigned to genes belonging to non-concordant domains. By varying the proportion of concordant domains, we generated datasets that spanned the full spectrum from random expression patterns to strong within-domain expression similarity under the imposed model. Another parameter defined the magnitude of the residual variation between genes within concordant regions. This enabled us to generate datasets exhibiting either tight or more diffuse expression concordance. As such, we were able to assess the effects of concordance prevalence and strength in isolation.
Datasets were obtained by varying the fraction of concordant domains from 0.1 to 1.0 with a step of 0.1 and the magnitude of within-domain expression dispersion from 0.05 to 0.5 with a step of 0.05. Such ranges of parameters cover the transition from random expression patterns to strong within-domain expression similarity. For each parameter combination, 10,000 independent replicates were generated to evaluate the applicability of the concordance measure in various simulated genomic scenarios.
2.5. Validation of the Advantages of Cyclic Permutations over Random Permutations
The principal advantage of cyclic genomic permutations over unrestricted random gene-label permutations is the preservation of the spatial ordering and local expression patterns of neighboring genes. Random gene-label permutations disrupt these relationships, potentially generating reference distributions that do not reflect the spatial dependence of real genomic data. To evaluate the relevance of this distinction, we analyzed local expression clustering and autocorrelation in experimental RNA-seq datasets and compared the observed spatial clustering with that obtained after random gene-label permutations across all eleven experimental RNA-seq datasets employed in this study. Additionally, we assessed the statistical behavior of the proposed method using experimentally measured gene expression and independently randomized domain structures.
Analysis of experimental RNA-seq profiles revealed significant spatial clustering of gene expression across all employed datasets. The observed neighboring-gene expression roughness was consistently lower than that obtained using unrestricted random gene-label permutations, with an average observed-to-randomized roughness ratio of 0.848 ± 0.010, corresponding to a mean reduction of 15.2% (range, 6.0–19.0%; empirical p < 10−5 for each dataset) (Supplementary Table S1). Gene-order autocorrelation analysis further revealed positive correlations across all examined lags (1, 2, 5, and 10 genes), with nearest-neighbor Pearson’s correlation coefficients ranging from 0.061 to 0.190. Positive correlations persisted at a separation of about ten genes (r = 0.035–0.083), generally decreasing with increasing gene-order distance. Analysis based on physical genomic distances confirmed positive correlations extending up to 1 Mbp, generally decreasing with increasing separation (Supplementary Figure S2). These results demonstrate that experimental expression profiles exhibit nonrandom spatial organization across different cell types and experimental conditions. These nonrandom patterns are disrupted by unrestricted gene-label permutations but preserved in gene-order space by cyclic shifts.
Additional validation was performed using unchanged experimental expression profiles from untreated HEK293T cells, reference K562 cells from EncodeProject [3], healthy human breast tissue, and human whole-blood RNA-Seq from GTEx. Independently randomized TAD-like and RAFT-like domain structures were analyzed against the original expression profiles using cyclic permutations, retaining the observed expression distributions and genomic ordering. For each configuration, 10,000 independently randomized TAD-like (1 Mbp and 140 kbp) or RAFT-like domain maps were analyzed using 10,000 cyclic permutations per map. Across all 36 completed combinations of domain architecture and gene-assignment mode, no false-positive results were observed at the concordance threshold of zc ≤ −1.96 (one-sided p ≤ 0.025). At the less stringent threshold of zc ≤ −1.645 (one-sided p ≤ 0.05), empirical false-positive rates ranged from 0 to 0.0005 (Supplementary Table S2). These results confirm conservative false-positive behavior under the examined empirical-expression null model and complement the original simulations based on independently generated expression values.
Together, performed analyses support the use of cyclic permutations to retain spatial expression structure while testing its association with genomic domain boundaries.
2.6. Evaluation of Expression Dispersion Inside Concordant Domains
The simulated datasets (Section 2.4) with controlled levels of intra-domain expression dispersion and concordance allowed us to address the problem of estimating the dispersion parameter directly from the observed data. Estimating the intra-domain expression dispersion is required because the concordance criterion is dispersion-dependent: the relationship between the permutation-derived zc score (Equation (6)) and the corresponding concordance level depends on the expected variability in expression values among genes within a concordant domain. Consequently, inaccurate estimation of expression dispersion may directly lead to biased estimates of concordance.
Analyzing the generated datasets revealed that the distribution of within-domain relative expression ranges exhibits a typically bimodal structure, reflecting the coexistence of concordant domains with low expression variability and discordant domains characterized by substantially broader expression ranges. To separate these populations, Gaussian kernel density estimation was performed in logarithmic space using Silverman’s bandwidth estimator [49]. The concordant component was identified from the leftmost mode of the resulting density distribution, and the corresponding relative ranges were used to estimate the intra-domain expression dispersion. The complete description of the estimation procedure, including the criteria for population separation and correction for the number of genes per domain, is provided in Section 4.3 of the Methods.
2.7. The Assessment of Expression Dispersion Detection Algorithm
Because expression dispersion was evaluated using gene-to-domain assignment based on gene midpoints (Section 4.3, Methods), its performance was independent of the domain assignment mode described in Section 2.2 of the Results. Therefore, the accuracy of dispersion detection was evaluated across all synthetic datasets with controlled combinations of expression concordance and intra-domain dispersion independently from the possible assignment variants between genes and domains.
To assess the accuracy of the expression dispersion estimation, the recovered dispersion values were compared with true simulated expression dispersions. Both the mean and median estimates were evaluated. The recovered dispersion median was chosen as the main performance measure because the mean value is sensitive to outliers. The estimated dispersion median was in good agreement with the true simulated values in most of the parameter space, indicating robust recovery of intra-domain expression dispersion.
The largest deviations were found in a narrow region of low-concordance/high-dispersion in parameter space, approximately defined by C ≤ 0.2 and H ≥ 0.30. In this regime, the maximal deviation occurred at C = 0.1 and H = 0.30, where the recovered dispersion median was 0.50 instead of the true 0.30, corresponding to a 66.7% deviation. Deviations of 25.0 to 42.9% were obtained with other combinations of parameters in this region. Outside this region, the dispersion estimation remained highly accurate. Reliable estimates were obtained for almost all of the parameter space tested. The maximum estimated dispersion of 0.50 is the upper limit of the calibrated dispersion range that was utilized in the model (Section 4.3, Methods). This upper limit accounts for the saturation that was observed in several challenging cases.
The developed method not only yields biologically meaningful estimates of the mean and median dispersion of expression levels within domains with concordant expression but also provides a robust framework for subsequent expression concordance-level estimation. The complete set of results obtained from the assessment is presented in Supplementary Table S3.
2.8. Evaluation of Expression Concordance Level
Upon completing our simulations, which covered the entire spectrum of available concordance levels C and dispersion H, we were able to develop the inverse approach. This reverted approach can estimate the expression concordance level from the zc criterion and the intra-domain expression dispersion H of concordantly expressed domains. The H value was calculated in the previous step (Section 2.6 and Section 4.3). The same synthetic datasets as before (Section 2.4) were employed, featuring 10 × 10 calibration grid concordance values between 0.1 and 1.0 and expression dispersions between 0.05 and 0.50. These datasets were analyzed using the complete permutation pipeline. For each grid point, 10,000 independent replicates were processed, and the 5th percentile of the resulting zc distribution was recorded. These thresholds defined the minimum zc values expected under each combination of concordance and dispersion and formed the basis for subsequent concordance estimation.
The relationship between concordance and zc was modeled separately for each expression dispersion level using smoothing cubic splines fitted to the calibration thresholds. Only calibration points corresponding to statistically significant results (zc ≤ −1.96) contributed to the fit. The optimal degree of smoothing was selected by leave-one-out cross-validation. As soon as the observed dispersion in real datasets could only occasionally coincide with the calibration grid value, concordance estimates obtained from the two neighboring expression dispersions were combined by linear interpolation.
Validation on simulated datasets with controlled levels of C and H revealed a systematic bias in the raw spline-based estimates. At low concordance levels, the procedure tended to overestimate the true concordance, whereas underestimation occurred at high concordance levels. The magnitude and direction of this effect depended on the expression dispersion. To compensate for this bias, a second calibration step was introduced. Median raw estimates obtained from the same 10 × 10 simulation grid were related to the corresponding true concordance values using monotone PCHIP interpolation [50]. The resulting correction functions were applied separately to the two neighboring expression dispersions before the final interpolation step, yielding concordance estimates that varied smoothly across the entire dispersion range while preserving monotonicity.
A detailed description of the calibration procedure, spline inversion, dispersion interpolation, and bias correction is provided in Section 4.4 of the Methods. The results of the simulations and the correction tables for the zc statistic and concordance C are presented in Supplementary Table S4.
2.9. Results of Application of the Complete Method to the Datasets with Controlled Levels of Expression Concordance and Intra-Domain Dispersion
The complete method was implemented as a multiplatform, OS-independent Python script with the minimum number of dependencies from libraries and Python-specific data formats. Concordance estimation accuracy was evaluated on simulated datasets with predefined combinations of expression concordance and intra-domain expression dispersion (Section 4.3 and Section 4.4), using 10,000 cyclic permutations per analysis. The recovered concordance values were compared with the true, simulated values using both mean and median estimates across replicates. Because the mean value is sensitive to occasional extreme outliers, particularly under low-concordance and high-dispersion conditions, the median concordance estimate was selected as the primary measure of accuracy.
In the proportional gene-domain mode (Results, Section 2.2, clause 1), concordance estimation demonstrated high stability across nearly the entire parameter space. For 96% of the tested dispersion/concordance combinations, the deviation between the recovered median concordance and the true simulated value did not exceed 5%. The most significant deviation was identified in the most challenging region of the parameter space, defined by low concordance and high expression dispersion. In the case of C = 0.1 and H = 0.40, the recovered median value was 0.133, representing a 33.4% deviation from the true value. The assessment was demonstrated to be highly accurate beyond this region: the retrieved concordance medians were close to the source values for all combinations with C ≥ 0.2, or C = 0.1 and H ≤ 0.25.
The start-assigned gene-domain mode (Results, Section 2.2, clause 2) was slightly more sensitive to dispersion, particularly at low concordance levels. The maximal deviation was once more observed at C = 0.1 and H = 0.40. In this case, the recovered concordance median reached 0.138, which corresponds to a deviation of 37.8%. In addition to the proportional mode, substantial deviations were detected at C = 0.2 and intermediate-to-high expression dispersion at H ≥ 0.2. Nevertheless, outside of this island of low concordance and high expression dispersion, concordance estimation remained reliable, as demonstrated for 90% of the cases with deviation below 10%, and for 72% of the cases with deviation below 5%. This provides a robust estimate of the concordance level.
A detailed description of the simulation setup and the expression concordance estimation procedure are provided in Section 2.4 of the Results and Section 4.4 of the Methods, respectively. The complete set of results obtained from the concordance estimation is presented in Supplementary Table S3.
2.10. Changes in TAD Expression Patterns Associated with Cancer and the Vasculogenic Mimicry Phenotype
Concordance analysis was performed on RNA-seq data derived from normal human breast epithelium and MDA-MB-231 triple-negative breast cancer cells cultured on conventional plastic or 3D collagen matrices. Normal breast epithelium and MDA-MB-231 cells grown on plastic substrates came from different studies and were used as external references. The 2.5 and 6.0 mg/mL 3D collagen matrix RNA-seq data were from the same study and contained three biological replicates for each condition [51]. That study demonstrated that 3D collagen matrices trigger a transcriptional response in cancer cells, resulting in the formation of multicellular network structures mediated by matrix architecture-induced β1-integrin upregulation. This response is conserved among cancer types in vitro and is predictive of patient survival in multiple clinical datasets across nine various tumor types [51]. After 7 days of culture in 6.0 mg/mL 3D collagen matrix, MDA-MB-231 cells formed VM phenotype. However, cells cultured in 2.5 mg/mL 3D collagen matrix mostly existed in an isolated state. The RNA-seq was conducted after 24 h of culture, before the formation of VM phenotype became prominent; so, the analyzed transcriptomes reflect early responses to the matrix environment rather than the VM phenotype itself.
Two reference TAD maps were used: the species-level consensus human TADMap database [52] and a breast-specific ConsensusTAD annotation generated using TADShop [53] (see Section 4.1). These two annotations represent different approaches to defining reference genomic domains. The results are presented in Table 2.
Table 2.
Results of expression concordance analysis applied to normal human mammary epithelial cells and MDA-MB-231 cells grown on conventional plastic or on a 3D collagen matrix. MDA-MB-231 cells grown on the 3D 6.0 mg/mL collagen matrix exhibited a vasculogenic mimicry phenotype.
No detectable TAD-associated expression concordance was identified in normal breast epithelium or the MDA-MB-231 cells grown on plastic substrate, irrespective of the TAD mapping method employed. All ze and zc values under these two conditions remained non-significant (both ze and zc > –1.96) across every TAD map tested. The co-expression domains observed in the normal breast cells do not correspond to TADs, and intra-TAD gene co-expression is essentially random genome-wide. This result is consistent with the non-significant zc values observed.
The absence of expression concordance for the MDA-MB-231 cells grown on plastic can be interpreted in the same way: these cells retain the disorganized transcriptional patterns characteristic of triple-negative breast cancer, for which significant changes in the organization of chromatin compartments and sub-compartments correlate with alterations in the expression of oncogenic genes [34]. These disorganized transcription patterns do not produce the structured domain-wide co-regulation that the concordance statistic can detect.
The replacement of a common plastic substrate with a 3D collagen matrix produced a substantial change in the concordance pattern of expression. For the average expression profiles of MDA-MB-231 cells cultured in 3D collagen matrices, TADMap yielded non-significant zc values at both 2.5 and 6.0 mg/mL concentrations. In contrast, ConsensusTAD revealed significant expression concordance in both collagen conditions: zc = −1.995 at 2.5 mg/mL, padj = 0.0230 and zc = −2.331 at 6.0 mg/mL, padj = 0.01976. Significant negative values of ze were found for both collagen conditions using both TAD maps, thus suggesting that there was lower domain-averaged expression compared to the cyclic permutation reference. It can be concluded that detectable expression concordance is genome domain annotation-dependent.
The influence of silent and weakly expressed genes was investigated by repeating the analysis after filtering out genes with TPM = 0 and, separately, TPM < 0.5 (Supplementary Table S5). The exclusion of silent genes resulted in an attenuated value of zc of −1.707 and −2.142 at 2.5 and 6.0 mg/mL, respectively, with padj of 0.04386 and 0.03222. For filtered-out low-expression genes with TPM < 0.5, the respective numbers became −1.182 and −1.567 (padj = 0.11850 and 0.11724). None of the results obtained from these filtered datasets meet the concordance significance criterion of 0.025, although the result at 6.0 mg/mL remains nominally significant after filtering out zero-expression genes (p = 0.01611). Expression concordance with TADMap is not significant in any of these cases, while the negative ze values of 3D collagen matrix cultures remain significant.
The sensitivity of expression concordance to filtering may itself be an indication of biological activity. Spatially coordinated transcriptional repression can cluster lowly expressed genes, thereby reducing within-domain variability. Removing these genes may therefore attenuate an inherent component of the observed expression concordance. Prior studies have identified regional epigenetic silencing and broad repressive chromatin domains in breast cancer, including the MDA-MB-231 cell line [54,55]. Copy-number variation may also drive regional expression organization in this cell line [56]. Gene filtering also alters formal parameters like the gene population, gene-to-domain assignments, and domain counts. Because of these shifts, the present analyses cannot definitively determine whether the filtering dependence reflects collagen-associated transcriptional repression or pre-existing spatial clusters of lowly expressed genes. Nevertheless, the results indicate that weakly expressed genes have a significant impact on the overall expression landscape.
Replicate-level analysis validated the consistency of these findings (Supplementary Table S6). For the ConsensusTAD results, the mean ± SD of the replicate-level values was zc = −1.873 ± 0.384 at 2.5 mg/mL and zc = −2.223 ± 0.281 at 6.0 mg/mL. All three biological replicates from the 6.0 mg/mL group yielded significantly negative zc values, retaining significance after BH correction across intra-condition replicates (padj ≤ 0.02341). By contrast, only one replicate from the 2.5 mg/mL group was nominally significant, and none survived correction (minimum padj = 0.03333). After excluding silent or weakly expressed genes, neither collagen condition retained significant expression concordance at the replicate level. These findings indicate that concordance is more consistently detected among unfiltered biological replicates from the 6.0 mg/mL condition.
To evaluate differences between culture conditions directly, we compared replicate-level zc values using two-sided Welch’s t-tests (Table 3, Supplementary Table S7).
Table 3.
Direct comparisons of replicate-level expression concordance zc between MDA-MB-231 cells grown under different culture conditions for ConsensusTAD map.
Direct comparisons revealed no statistical significance of cell conditions for TADMap (Supplementary Table S7). In contrast, direct comparisons of cells grown in a 3D collagen matrix versus those grown on plastic demonstrated pronounced differences when using the ConsensusTAD map. For unfiltered profiles, the 2.5 mg/mL collagen condition yielded Δzc = –1.503 (Welch p = 0.0210, padj = 0.03155), whereas the 6.0 mg/mL condition yielded Δzc = –1.854 (Welch p = 0.00756, padj = 0.02269). These padj values were calculated across the three specified culture-condition contrasts within each map and expression-filtering analysis. The 6.0 mg/mL comparison remained significant at a two-sided adjusted threshold of 0.05 after applying both expression filters, though the magnitude of the difference decreased. The small number of biological replicates limits the precision of our between-condition inferences; therefore, while these comparisons reveal clear differences between the expression datasets, they cannot establish that the 3D collagen culture alone caused them.
Our findings suggest that expression profile changes associated with 3D collagen matrices exhibit a spatial component, appearing as increased expression concordance relative to breast-specific reference domains. This organization may reflect coordinated transcriptional repression, activation, or a combination of regulatory processes, and it is not necessarily restricted to upregulated genes. These observed associations are compatible with a broader relationship between transcriptional architecture and the cellular response to the extracellular matrix. Although some hypotheses have linked alterations in chromatin structure to metastatic competence in triple-negative breast cancer [57], further investigation is required to establish whether spatially coordinated expression changes, including the regional repression of gene groups, contribute directly to the development of the VM-like phenotype.
2.11. Dynamic Expression Concordance in HEK293T Cells Under Heat-Shock Stress and Chromatin Perturbation
As another example, the expression concordance analysis was applied to HEK293T cells under seven (1 untreated + 6 treated) treatment conditions and compared against three independent TAD reference databases: the TADMap consensus boundaries [52], the insulation-score-derived TAD dataset (TAD_Maxima) from the IntegratedTAD database [58], and the high-resolution onTAD domains at 10 kb resolution [59]. The results are presented in Table 4.
Table 4.
The results of expression concordance analysis applied to transcriptomic datasets of HEK293T cells under heat shock and treatment for 10 min with 5% 1,6-hexanediol.
Direct comparisons of replicate-level zc scores (two replicates per condition) were performed using two-sided Welch’s t-tests (Table 5, Supplementary Table S8). The heat-shock family of comparisons comprised seven distinct contrasts: four recovery time points versus the untreated control, and the 2.5, 4, and 24 h profiles versus the 6 h reference. BH correction was applied across these contrasts separately for each TAD map and gene filter. The 1,6-hexanediol (1,6-HD) versus untreated and Matrigel versus untreated comparisons present separate single-contrast families; so, padj = p. The threshold for statistical significance in these direct comparisons was set at a two-sided padj < 0.05.
Table 5.
Direct comparisons of replicate-level concordance scores zc among HEK293T conditions, grouped by biological question.
2.11.1. Expression of Untreated and Matrigel-Grown HEK293T Cells
For HEK293T cells, both untreated and grown on a 3D Matrigel matrix, we found no significant intra-TAD expression concordance for any of the three TAD maps tested. This baseline absence of concordance under standard conditions suggests that the steady state of HEK293T cells does not exhibit detectable domain-level co-regulation (as measured by the zc statistic). This is consistent with the point of view that TADs are structural units that facilitate enhancer–promoter interactions rather than directly controlling transcriptional output [60]. The non-significant result for Matrigel-grown cells distinguishes HEK293T from the MDA-MB-231 results presented in the previous section, supporting the evidence that the shift to TAD-concordant transcription in 3D matrices can be related to the phenotypic transition of specific cancer cells, not being a universal cellular response to the physical substrate [61].
Although neither the untreated nor the Matrigel-grown profiles exhibited significant within-profile concordance (Table 4), the mean replicate-level zc score was consistently more negative for the Matrigel condition across all three maps (all genes: Δzc = [−1.193, −0.443], pwelch = [0.00023, 0.00094]; Table 5). This trend persisted following the application of either expression filter (Δzc = [−1.495, −0.417], p = [0.00066, 0.03475]).
2.11.2. Temporal Dynamics of Expression Concordance During the Heat-Shock Response
Exposure to heat shock (HS) resulted in a highly significant and temporally dynamic concordance pattern. At 2.5, 4, and 24 h of recovery, significantly negative zc values were obtained with all three TAD maps in the replicate-averaged profiles (Table 4), both before and after excluding silent (TPM = 0) or weakly expressed (TPM < 0.5) genes (Supplementary Table S9). Statistical significance was also retained in all 54 replicate-level analyses (3 time points × 3 maps × 3 gene-filtering conditions × 2 replicates; zc = [–2.81, –1.97]; Table 4 and Table 5, and Table S10). The replicate estimates exhibited limited variability (SD ≤ 0.13).
Following BH correction for multiple testing between recovery time points within each TAD map, replicate-averaged TAD_Maxima and onTAD analyses were still significant (padj ≤ 0.011 for unfiltered profiles and padj ≤ 0.020 for filtered ones). Replicate-specific results were also significant (padj ≤ 0.018), with the exception of the 4 h TAD_Maxima analysis following removal of genes with TPM < 0.5 (padj = 0.026). The adjusted p-values [0.026, 0.032] in this case exceeded the predefined cutoff of 0.025. Applying BH correction across the 3 TAD maps within each time point, all 2.5, 4, and 24 h results were still significant under all three gene-filtering criteria. C-values in the unfiltered replicate-averaged data sets varied from 0.08 to 0.16 for TADMap and from 0.32 to 0.52 for TAD_Maxima and onTAD.
In contrast, 6 h concordance was non-significant for all tested TAD maps under all filtering conditions zc = [–1.88, –1.33]. Direct comparisons (Table 5) revealed more negative scores at 2.5, 4, and 24 h than in the untreated profiles across all three maps (Δzc = [–2.032, –0.931], two-sided Welch’s padj ≤ 0.0109). Following expression filtering, all of these contrasts retained a padj < 0.05, with the sole exception of the 4 h versus untreated comparison for the TAD_Maxima map after excluding silent genes (padj = 0.0506).
Compared with the 6 h reference, the unfiltered 2.5, 4, and 24 h profiles exhibited more negative zc scores (Δzc = [–1.112, –0.564]). After BH correction across the seven heat-shock contrasts, these differences were statistically significant for TAD_Maxima (padj = 0.0452) and onTAD (padj = [0.0250, 0.0394]), but not for TADMap (padj = 0.0628); however, significance became less consistent following expression filtering. At 6 h, scores remained more negative than those of the untreated control (Δzc = [–1.048, –0.368], yielding significant direct comparisons for TAD_Maxima (padj = 0.0452) and onTAD (padj = 0.0447), but not for TADMap (padj = 0.0832). Therefore, the 6 h data suggest an attenuated concordance rather than a full restoration of the baseline level. Interestingly, at 24 h, zc values were even more negative than at 4 h (Δzc = [–0.28, –0.13]), suggesting a possible late-stage enhancement in expression concordance.
The boundary-displacement analysis (Section 2.12) provided additional information about the spatial sensitivity of the obtained results. In the case of TADMap and TAD Maxima, the negative zc minima were observed at the coordinates of the original domain in 4 and 24 h time course. In onTAD, minima occurred at zero offset across the entire time course. This demonstrates that the sensitivity of expression concordance to domain positioning depends on the specific annotation. The zero-offset minima observed suggest that expression homogeneity aligns preferentially with their original coordinates.
This pattern is consistent with the known transcriptional pattern of the mammalian heat-shock response. The early phase (2–4 h) is characterized by massive, HSF1-driven transcriptional induction of molecular chaperones and the simultaneous repression of thousands of background genes [62]. The 6 h intermediate time point can correspond to the attenuation window, when HSF1 activity is actively suppressed by negative feedback from accumulating HSP70, leading to a highly heterogeneous transcriptional resetting across the genome [63,64,65]. Finally, the 24 h time point can reflect the adaptive recovery phase, in which the cells attain a new stable transcriptional equilibrium. However, the performed analysis cannot directly establish the molecular events responsible for these time-dependent differences.
It is also important to note that changes in expression concordance do not necessarily imply TAD reorganization. Some processes have been shown to alter the distribution of RNA levels throughout the genome in the already established chromatin organization. Those processes can be defined as widespread suppression of RNA polymerase II release from promoter-proximal pausing sites [62,66], the heat-shock-induced premature transcript termination through intronic polyadenylation [67], and the stress-induced transcriptional readthrough beyond gene boundaries [68,69,70]. Readthrough may extend into neighboring genes, affecting their level of expression during the RNA-seq analysis [70,71] and leading to the expression concordance without activation of their own promoters. The last mechanism should be considered as an alternative explanation for part of the observed concordance.
2.11.3. Expression Concordance Following 1,6-Hexanediol Treatment
The strongest expression concordance among the analyzed replicate-averaged profiles was observed for HEK293T cells, treated for 10 min with 5% 1,6-hexanediol (1,6-HD), a short-chain aliphatic alcohol known to disrupt weak hydrophobic interactions and dissolve liquid–liquid phase-separated (LLPS) macromolecular condensates [72,73]. Across all employed TAD maps, the 1,6-HD treatment for unfiltered profiles yielded zc values ranging from −3.12 to −2.61 and estimated concordance levels C ranging from 0.46 to 0.63. The results remained significant after excluding silent genes (TPM = 0) or weakly expressed genes (TPM < 0.5), with zc values ranging from −3.45 to −2.43. Furthermore, all 18 individual-replicate analyses (2 replicates × 3 TAD maps × 3 expression-filtering conditions) yielded significantly negative zc values [−3.03, −2.07], remaining significant after BH correction across the three TAD maps within each replicate and filtering condition (padj ≤ 0.0193). Direct comparisons with the untreated profiles (Table 5) revealed significantly more negative mean replicate-level zc scores following 1,6-HD treatment across all three TAD maps (all genes: Δzc = [−2.061, −1.069], pwelch = [0.0164, 0.0191]). This effect was also observed after the application of either expression filter (Δzc = [−2.488, −1.081], pwelch = [0.00399, 0.03575]). Because each map-and-filter comparison formed an independent single-contrast family, padj = pwelch.
Previous studies have demonstrated that treating cells with low-concentration 1,6-HD can alter higher-order chromatin organization, including weakening enhancer–promoter interactions, modifying TAD insulation, and perturbing A/B compartmentalization, while leaving CTCF-anchored structural loops relatively intact [74,75]. The highly statistically significant concordance observed under 1,6-HD treatment indicates greater within-domain expression homogeneity than expected under cyclic permutations. One possible explanation is that perturbation of phase-separated regulatory condensates, including coactivator-rich assemblies associated with super-enhancers [73] and repressive assemblies involving heterochromatin protein 1 (HP1) and Polycomb group proteins [76,77], weakens localized regulatory constraints and promotes more homogeneous expression across broader genomic regions. The significantly negative ze values additionally indicate lower domain-averaged expression relative to the cyclic permutation reference, although they do not independently establish global transcriptional repression. Thus, the observed concordance is consistent with altered regional transcriptional organization following 1,6-HD treatment. In addition to disrupting phase-separated regulatory condensates, 1,6-HD can directly affect chromatin compaction, as demonstrated at a concentration of 5% [78]. These mechanisms are not mutually exclusive and may jointly contribute to the observed expression patterns. Their relative contributions and the precise underlying regulatory mechanisms remain to be established.
2.12. Sensitivity to Displacement of the TAD Reference Maps
We additionally assessed the positional sensitivity of the results obtained, using the proportional gene-assignment mode employed in the primary analyses. We shifted domain coordinates from –500 to +500 kb in 50 kb increments while keeping gene coordinates and expression profiles constant. Four breast/MDA-MB-231 expression, the profiles were evaluated against the human consensus TADMap and breast-derived ConsensusTAD annotations (168 evaluations). For HEK293T expression profiles, assessment was performed for seven HEK293T profiles against TADMap, TAD_Maxima, and onTAD (441 evaluations).
In the breast/MDA-MB-231 family, the displacement profiles (Supplementary Figure S3) differed substantially between annotations. With the breast-derived ConsensusTAD map, the 6.0 mg/mL collagen profile remained nominally concordant at 20 of 21 offsets (zero-offset zc = −2.241; left-tailed p = 0.0125), whereas the 2.5 mg/mL profile met the same threshold at 12 of 21 offsets (zero-offset zc = −1.919; p = 0.0275). Neither healthy breast nor plastic-grown MDA-MB-231 cells yielded significant concordance at any offset in either map. The TADMap profiles were non-significant throughout, except for one isolated offset in the 6.0 mg/mL dataset. For both 3D collagen conditions, the most negative ConsensusTAD values occurred at the largest positive offset tested (+500 kb), rather than at the original coordinates.
The displacement profiles varied among the tested TAD maps and expression datasets. For TADMap and TAD_Maxima, the most negative zc scores for the 4 h and 24 h heat-shock profiles occurred at zero displacement; for TAD_Maxima, these values were −2.49 and −2.72, respectively. The onTAD profiles attained their minima at zero offset across all time points.
The displacement curves (Supplementary Figure S3) exhibited sensitivity to the original domain coordinates in certain circumstances and persistent concordance across substantial displacements in others. These descriptive comparisons characterize the sensitivity of results obtained with the selected maps in the analyzed datasets and do not constitute formal tests of differences between offsets. Nevertheless, they highlight the importance of correct domain annotation for biological interpretation. In conjunction with the acknowledged absence of a definitive gold standard for the evaluation of TAD coordinates [53,79], these results emphasize the necessity for robust methods and widely accepted reference standards for TAD identification and validation.
A notable result was obtained for the expression profile of HEK293T cells treated with 1,6-HD. This profile retained significantly negative zc values throughout the complete displacement range across all three TAD maps (−3.13 to −2.22; nominal left-tailed p < 0.025 at every offset), indicating that the detected expression concordance persisted despite substantial changes in reference-domain placement. This persistence is consistent with broader regional expression homogeneity not restricted to the precise boundaries of the selected reference domains, supporting the biological interpretation proposed in Section 2.11. However, the extent to which overlapping domain memberships contribute to this persistence remains to be determined.
3. Discussion
3.1. Interpretation of ConGEE Statistics
The zc statistic (Equation (6)) evaluates whether genes within the same genome domain exhibit more homogeneous expression than expected from the genome-wide expression distribution. The statistic is robust regardless of the model of the gene–domain relationship (see Section 2.2 and Section 2.3 of the Results). The method applies zc values as a metric for estimating concordance. A statistically significant negative zc value indicates that the expression coherence within domains from the genome-wide expression distribution is stronger than expected. One possible explanation is coordinated regulation of gene expression within these domains, although ConGEE alone cannot establish the underlying regulatory mechanism. In contrast, a statistically significant positive zc value indicates high intra-domain heterogeneity, which implies that neighboring genes differ more strongly in expression than is expected by chance. Such patterns may arise in bivalent or poised chromatin, partially derepressed Polycomb domains, or regions containing competing regulatory influences. Since zc quantifies expression coherence within domain boundaries, it also provides a model-independent metric for evaluating domain boundary predictions and comparing boundary-calling approaches.
Another aspect of domain organization is described by the ze statistic (Equation (7)). This test evaluates whether genes of a particular domain structure tend to be expressed above or below the genome-wide average. Statistically significant negative ze values indicate domains enriched in under-expressed genes and are consistent with transcriptionally repressed chromatin states such as lamina-associated domains, Polycomb-repressed regions, or facultative heterochromatin. Statistically significant positive ze values indicate enrichment in highly expressed genes and may reflect active chromatin compartments or regions under strong enhancer-defined regulation. Because the cyclic-shift null model preserves individual gene expression values while randomizing their relationship to domain boundaries, significant ze values reflect significant association with the supplied domain annotation, beyond that expected from the preserved expression clustering alone.
The combined interpretation of zc (Equation (6)) and ze (Equation (7)) yields a more complete representation of domain-level transcriptional organization: ze identifies domains enriched in transcriptionally active or repressed genes, whereas zc quantifies the degree of expression coherence within those domains. A domain structure associated with statistically significant ze but insignificant zc may indicate compartmental organization without strong local expression coherence and/or co-regulation. In contrast, the significance of both statistics provides additional evidence of domain-associated transcriptional organization and is consistent with possible coordinated regulatory control, although, as already mentioned, ConGEE alone cannot verify the underlying regulatory mechanism. In the proposed method, zc serves as the primary evidence for intra-domain expression homogeneity and possible co-regulation. The concordance estimation C is a quantitative characterization of the magnitude of this homogeneity or possible co-regulation. The calibration of C is specific for the particular genomic domain architecture.
From the simulation experiments (Supplementary Table S3) we can conclude that the estimated concordance level, C, provides a quantitative measure of expression concordance. The median value was accurately recovered in most cases within the applicable range of parameters. For datasets analyzed using the same domain annotation and close dispersion parameters, larger C values indicate a stronger estimated expression concordance. However, the statistical significance of the differences between conditions must be evaluated through direct comparisons of replicate-level results.
3.2. Statistical Validation of ConGEE
The robustness of the proposed method was assessed using several methods of validation that complemented each other. Simulations conducted under different genomic architecture models showed that both the zc and ze statistics followed a normal distribution, while the empirical false-positive rate fell within the 95% sampling range of the theoretical model at the significance level of 0.025. The analysis we performed also demonstrated the conservative behavior of the false-positive rate when the original expression patterns were compared with randomly generated domain structures. The results provide substantial support for the claim that cyclic permutations are indeed more effective in preserving expression structures than randomly generated permutations. Moreover, statistical simulations with predefined levels of expression concordance and intra-domain dispersion have demonstrated the high accuracy of the corresponding quantitative estimates for a wide range of parameter values, identifying specific cases where the precision of estimation is reduced. Together, the performed validations support the statistical reliability and practical applicability of ConGEE.
3.3. Approaches to Enhance Biological Interpretation of ConGEE Results
Biological interpretation of the ConGEE results could be reinforced by additional analysis (i) at the level of individual biological replicates, (ii) sensitive to the exclusion of silent or low-expression genes and (iii) displacing reference domain boundaries. Such strategies will help estimate the reproducibility of the gene expression concordance across diverse gene datasets and domain annotations. For example, the gene expression concordance found in 1,6-hexanediol-treated HEK293T cells was reproducible both between biological replicates and under various expression filtering, and the profile averaged on replicates had significant concordance despite displacement of all three reference TAD maps up to 500 kbp. In contrast, the gene expression concordance revealed in 3D collagen-grown MDA-MB-231 cells based on breast-specific ConsensusTAD annotation was sensitive to expression filtering, suggesting contribution from spatially clustered, weakly expressed genes. Altogether, complementary analysis strategies increase biological meaning of ConGEE results and help to identify particular associations for further study.
3.4. ConGEE Limitations
There are two limitations of the proposed approach. First, the method is inherently statistical; so, it is designed for genome- or chromosome-wide analyses rather than interpreting individual loci or small local regions. Local-specific expression concordance should be quantified using single-group statistics, and specifically pairwise gene expression correlation, PCA variance, etc.
Second, both zc and ze are independent of genome architecture, domain type and size, as demonstrated by the performed simulations. Their interpretation does not rely on assumptions about specific domain or inter-domain lengths. However, their absolute values depend on the specific domain annotation selected. The calibration procedures used for quantitative expression dispersion and concordance estimation depend on the structural properties of the simulated domains. In the present study, calibration was performed using mammalian TAD-like domains with characteristic sizes of ≈1 Mbp and inter-domain gaps of ≈40 kbp. Accordingly, while zc and ze criteria can be applied across species and domain types, accurately estimating expression dispersion and concordance requires recalibration using the domain architecture. This recalibration accounts for the specific sizes and distributions of domain length and inter-domain intervals under investigation.
Limitations may also arise from the underlying datasets. In this study, for instance, the distributions of intra-domain relative expression ranges did not allow for the reliable identification of a separate concordant-domain population. Consequently, the estimation procedure fell back to its predefined median-based default, assigning H = 0.5. Because of this, the corresponding expression concordance estimates C were derived using the upper boundary of the calibration range and should be interpreted with that constraint in mind. This outcome reflects the specific characteristics of the analyzed datasets rather than an inherent limitation of the ConGEE method itself.
The required scripts and manual are freely available on Github (https://github.com/lokapal/ConGEE, accessed on 1 September 2026).
4. Materials and Methods
4.1. Software and Datasets
The proposed method was developed with Python 3.8+ with the following required libraries: numpy v.1.21.5 (compatible up to v.2.0.0) [80], scipy v.1.8.0 (compatible up to v.1.14.0) [81], pandas v.1.5.3 (compatible up to v.2.2.2) [82], and h5py v.3.16.0 [83]. The program is freely available at https://ancorr.eimb.ru and on Github (https://github.com/lokapal/ConGEE, accessed on 1 September 2026).
The following datasets were used in Section 2. Four topologically assisted domains (TADs) datasets from the following databases:
- •
- TADMap [52] is a database providing a species-level consensus map linking genes to TADs. The descriptive statistics for TADMap are as follows: 3036 domains, a domain size range of 100 kbp to 5.1 Mbp, and a median domain size of 700 kbp.
- •
- The Encode accession ENCSR326YHP corresponds to H. sapiens breast epithelium tissue. The ConsensusTAD dataset was generated in TADShop [53] from the mapping quality thresholded contact matrix ENCFF924WYB for the genome GRCh38 with 50 kbp resolution and ICE normalization. The descriptive statistics for ConsensusTAD are as follows: 4346 domains, a domain size range of 50 kbp to 16.65 Mbp, and a median domain size of 500 kbp.
- •
- IntegratedTAD [58] https://github.com/shilab/Hi-C-integrative-catalog/tree/main/data (accessed on 10 October 2026) is a database that integrates TAD annotations from 26 lymphoblastoid cell lines pooled from 44 individuals to provide a comprehensive representation of TAD organization. noNA_IS_TAD_containsMaxima (called TAD_maxima in this manuscript) is the dataset with TAD regions for the merged call set derived from the insulation score algorithm, contained no NA insulation score and at least one maxima insulation score within each region was used. The descriptive statistics for TAD_maxima are as follows: 14,067 domains, a domain size range of 20 kbp to 7.265 Mbp, and a median domain size of 110 kbp.
- •
- The onTAD database was created from both normal and tumor cell lines and involves the deployment of the OnTAD algorithm [84] and processing Hi-C contact matrices at a high precision of 10 kb resolution to derive nested TAD structures [59]. The descriptive statistics for onTADs.10 kb TAD map are as follows: 31,751 domain, a domain size range of 10 kbp to 21.18 Mbp, and a median domain size of 50 kbp.
The transcriptomic RNA-seq datasets comprised the following list:
- •
- Human healthy mammary breast epithelium tissue aliquot (Encode ENCSR438YPF and ENCSR434TEU) used as control;
- •
- MDA-MB-231 triple-negative human breast cancer cells cultured on plastic (GEO GSM1944521, GSM1944522, and GSM1944523);
- •
- MDA-MB-231 triple-negative human breast cancer cells cultured on a 3D collagen matrix with concentration 2.5 mg/mL (GEO GSM2700358, GSM2700359, and GSM2700360);
- •
- MDA-MB-231 triple-negative human breast cancer cells cultured on a 3D collagen matrix with concentration 6.0 mg/mL (GEO GSM2700361, GSM2700362, GSM2700363), exhibiting vasculogenic mimicry phenotype after 1 week of culture;
- •
- Untreated HEK293 cells (GEO GSM8556186, GSM8556187) used as control;
- •
- HEK293T cells grown on the Matrigel (GEO GSE353386);
- •
- HEK293T cells after heat shock (GEO GSE130493);
- •
- HEK293T cells treated for 10 min with 5% 1,6-hexanediol (GEO GSE350243).
Details of cell cultivation and subsequent RNA-seq procedures are provided in the corresponding GEO and Encode accessions.
All RNA-seq datasets were processed using a uniform analysis pipeline. To ensure consistency between the reference genome sequence and gene annotations, the same genome assembly and annotation release were applied for both read alignment and quantification. Specifically, the H. sapiens hg38/GRCh38 genome assembly of Ensembl release 112 annotation was used (https://ftp.ensembl.org/pub/release-112, accessed on 20 September 2026).
Raw sequencing reads were preprocessed using Trimmomatic v0.39 [85], with reads shorter than 20 bp discarded, and low-quality bases (Q < 18) removed from both ends of the reads. The parameters LEADING:18, TRAILING:18, SLIDINGWINDOW:4:22, and MINLEN:20 were employed for quality filtering. For single-end libraries, Illumina adapter sequences were removed using ILLUMINACLIP:TruSeq3-SE.fa:2:30:10. For paired-end libraries, adapter trimming was performed using option ILLUMINACLIP:TruSeq3-PE-2.fa:2:30:10:2.
The trimmed reads from each replicate were quantified against the H. sapiens Ensembl release 112 reference genome and annotation using RSEM v1.3.1 [86]. The following parameters were applied: --star -p 16 --calc-ci --ci-memory 60720. Gene- and transcript-level expression estimates obtained for the biological replicates were subsequently averaged using an in-house script implemented in R 4.2.2. The mapping of gene transcripts to the hg38/GRCh38.p12 genome annotation was performed using an in-house R script that employed the dplyr [87] and plyranges [88] libraries.
All concordance analyses for the results presented in Section 2.10 and Section 2.11 were performed using ConGEE in genome-wide proportional mode, applying 100,000 cyclic permutations per analysis. Expression values were employed as TPM without logarithmic transformation.
4.2. Assessment of Genomic Expression Autocorrelation, Validation of the Cyclic Permutation Null Model and Evaluation of Sensitivity to the Reference Maps
To evaluate the preservation of spatial expression structure by cyclic genomic permutations, we analyzed RNA-seq profiles employed in our work: untreated HEK293T cells, HEK293T cells treated with 1,6-hexanediol, and healthy human breast epithelial cells.
4.2.1. Assessment of Local Expression Clustering
Gene clustering was evaluated using an expression roughness statistic defined as the sum of squared differences between expression values of neighboring genes along each chromosome:
where exp denotes the log(1 + exp) transformed TPM expression value, chr indexes chromosomes, and i indexes genes ordered by genomic position. The evaluations were performed within each chromosome excluding interchromosomal adjacency pairs. This avoids artificial effects from chromosome boundaries and preserves chromosome-specific expression distributions in the shuffled controls.
For each expression profile, 100,000 unrestricted gene-label random permutations were performed for each chromosome separately. Gene coordinates were preserved, while the expression levels were shuffled randomly amongst the genes. The roughness value obtained was compared with the mean roughness of the randomized profiles and the ratio of the observed roughness to the mean random roughness was used as a measure of the degree of local expression clustering. An empirical lower-tail p-value was calculated as (1 + Nlower)/(100001), where Nlower denotes the number of randomized profiles with roughness not exceeding the observed value. Smaller observed roughness indicates greater similarity between neighboring genes than expected under unrestricted gene-label permutation.
4.2.2. Gene-Order Autocorrelation
To further characterize local expression dependence, Pearson’s correlation coefficients were calculated between the expression values of genes separated by k positions within the chromosome-specific ordered gene lists, where k ∈ {1, 2, 5, 10}. Only gene pairs residing on the same chromosome were included in this analysis. Correlations were computed across all eligible pairs for each lag, providing a quantitative assessment of expression similarity as a function of genomic distance.
4.2.3. Physical-Distance Autocorrelation
To evaluate expression dependence relative to genomic coordinates, Pearson’s correlations were also calculated for intrachromosomal gene pairs separated by varying physical distances. Genomic separation was defined using gene midpoint positions, and the pairs were grouped into seven distance intervals: 0–10, 10–25, 25–50, 50–100, 100–250, 250–500, and 500–1000 kbp. For each interval, Pearson’s correlation coefficient, the number of contributing gene pairs, and the median genomic separation were recorded. Crucially, these analyses characterized the observed spatial dependence without assuming statistical independence among individual gene pairs.
4.2.4. Validation Using Experimentally Measured Expression
To evaluate the performance of the cyclic permutation test under realistic genomic expression patterns, we performed additional null simulations using authentic, unmanipulated expression profiles. These profiles were obtained from untreated HEK293T cells, reference K562 cells from the ENCODE Project, healthy human breast tissue, and human whole-blood RNA-seq data from GTEx. Unlike the initial simulations that relied on independently sampled values, this analysis preserved the observed expression distributions, gene coordinates, and genomic ordering, thereby maintaining the spatial expression dependencies quantified above. For each tested configuration, we generated 10,000 independent, randomized domain maps modeled after the TAD-like (1 Mbp and 140 kbp) and RAFT-like domain architectures described in Section 2.3. Each random map was subsequently evaluated using 10,000 cyclic permutations of the expression values according to the ConGEE procedure (Section 2.1). This step incorporated proportional, transcription start site, and midpoint gene-to-domain assignment modes where applicable, applying cyclic shifts across a genome-wide permutation scope. Finally, empirical false-positive rates were calculated as the proportion of randomized domain maps yielding zc ≤ −1.96 or zc ≤ −1.645, which correspond approximately to one-sided significance levels of 0.025 and 0.05, respectively.
While cyclic shifts preserve the circular ordering of expression values and the associated autocorrelation as a function of gene-order lag, unrestricted gene-label permutations disrupt this structural ordering. This preservation provides the core methodological rationale for utilizing a cyclic-shift approach [43,44]. However, retaining gene-order dependence does not automatically guarantee that correlations at fixed physical genomic distances are preserved, nor does it ensure the exact calibration of permutation-based significance levels. Consequently, these empirical expression simulations were necessary to rigorously evaluate the false-positive behavior of the proposed criterion under the tested randomized-domain null conditions.
4.2.5. Assessing the Sensitivity to Displacement of Reference Domain Coordinates
Displacement analysis was performed for two TAD annotations in the breast/MDA-MB-231 family (human consensus TADMap and breast-derived ConsensusTAD) and three annotations in the HEK293T family (TADMap, TAD_Maxima, and onTAD). For each dataset–map pair, genomic intervals were translated by −500 to +500 kb in 50 kb increments. At each offset, both endpoints of every genomic interval were translated by the same number of base pairs, while transcriptomic datasets were unchanged. Each translation was applied chromosome-wide, and intervals outside real chromosome bounds were excluded from all offsets. The zero-offset run used this same retained set.
At each displacement, ConGEE was rerun completely matching the mode employed in Section 2.10 and Section 2.11: proportional gene assignment, 100,000 cyclic permutations of expression values. The ze and zc statistics were recorded for each run, with two-sided p-values for ze and left-tailed p-values for zc. The displacement curves were interpreted descriptively; offsets were not treated as independent biological replicates, and plotted significance thresholds were nominal and unadjusted (zc = –1.96; left-tailed p = 0.025).
4.3. A Semi-Empirical Method to Evaluate the Expression Dispersion Inside Concordant Domains
A prerequisite for concordance analysis is related to the estimation of the intra-domain expression dispersion, H, defined as the half-width of the multiplicative uniform distribution from which individual gene expression values are sampled within a concordant domain. Under this dispersion model, the observed expression of gene i in a concordant domain with baseline expression b is given by b × U(1 − H, 1 + H), where U denotes a uniform distribution over the specified interval. The parameter H ranges from 0, corresponding to identical expression values for all genes within the domain, to 0.5, corresponding to expression values that may deviate by up to 50% above or below the domain baseline. Estimating H from the observed data is required because the subsequent concordance spline calibration is dispersion-dependent: the relationship between the permutation zc score (Equation (6)) and the concordance level C depends explicitly on H, and uncertainties in the estimated expression dispersion directly affect the concordance estimates.
To estimate intra-domain expression dispersion, the distribution of within-domain relative expression ranges was analyzed. For each domain containing at least two assigned genes, the relative expression range was calculated as Erel = (Emax − Emin)/Emean, where Emax, Emin, and Emean denote the maximum, minimum, and mean expression values of genes assigned to the domain, respectively. Gene-to-domain assignment for this analysis was performed using the midpoint mapping strategy regardless of the mapping approach applied in the concordance test itself. This choice was made because proportional gene-to-domain assignment allocates boundary genes to multiple domains, artificially inflating within-domain variability and distorting the distribution of relative expression ranges.
The concordance model assumes that concordant domains will exhibit relatively small expression ranges defined by the intra-domain dispersion parameter H, while discordant domains should produce significantly larger relative ranges. Hence, the empirical distribution of relative expression ranges is often bimodal, with concordant domains producing a narrow left-hand peak and discordant domains producing a broader right-hand peak. In order to separate these two populations, we fitted a Gaussian kernel density estimate (KDE) to the natural logarithm of the relative ranges, rather than to the original values. This transformation is especially important at the TAD scale, where the distribution expected under the discordant null model for domains with about 17 genes covers more than two orders of magnitude. In the original scale, the bandwidth selected according to Silverman’s rule [49] is dominated by the heavy right tail of the distribution, leading to a large oversmoothing or smearing of the concordant peak at Erel < 0.5. The application of the logarithmic transformation puts the concordant and discordant populations on more comparable scales and the Silverman bandwidth is able to better resolve the two modes.
To eliminate an artifact due to domains with very low within-domain variability, we excluded the lowest 1% of relative range values before KDE analysis. Such values can arise from concordant domains with only two or three genes where the expression values are nearly identical by chance, or they are due to domains consisting of transcriptionally silent genes with zero expression. These cases result in a discrete accumulation of Erel values close to zero that appears as an artificial spike at the lower boundary of the log-transformed distribution. In turn, this spike may be misidentified as the leftmost mode of the KDE, obscuring the true concordant peak. This artifact can be eliminated by removing the lowest first percentile without changing the shape of the distribution overall.
The KDE was evaluated on a grid of 2000 equally spaced points spanning the range of the log-transformed, trimmed data. Gaussian KDE was only applied when there were enough observations to guarantee reliable identification of the bimodal structure. In particular, KDE analysis was performed only if the number of domains with valid Erel values was at least 20. The lowest 1% of observations were excluded and the remaining data were re-evaluated. When there were fewer than 10 observations remaining after this trimming step, KDE-based valley detection was considered to be unreliable and was not performed, with a fallback estimator used instead.
The local maxima and minima of the KDE were determined by changes in the sign of its numerical first derivative. The concordant peak was identified as the first local maximum from the left side of the distribution. All other local minima to the right of this peak were considered candidate valleys to separate the concordant and discordant populations. Then, these candidate valleys were examined from left to right. In preliminary analyses, the simple selection of the first minimum to the right of the concordant peak often gave unstable or biologically implausible results. So, five empirically adjusted criteria were developed and validated by simulations to identify the border between the concordant and discordant populations:
- The relative depth of the candidate valley (i.e., the fractional decrease in KDE density from the concordant peak to the valley) should be greater than 0.15. This criterion allows for the removal of small fluctuations arising from the sampling dispersion in an otherwise unimodal distribution but keeps real depressions separating two distinct populations.
- The position of the candidate valley in the original (non-logarithmic) scale was required to be at least 0.10. Valleys occurring below this threshold are typically located immediately above the trimmed lower boundary or within the narrow concordant distribution generated by domains containing only a few genes. Such valleys do not correspond to the separation between concordant and discordant domains and were therefore rejected.
- The valley position was required to be no higher than 2.0 on the original scale. According to the theoretical model, the maximum empirical relative range is Erel ≈ 1.89 and the threshold was conservatively rounded up to 2.0. If any valley exists beyond this value, it must be within the discordant null distribution, and cannot be a true population boundary. This criterion addresses a particular mode of failure that has been observed in datasets with large numbers of domains with more than 50 genes. In these cases, sparse observations in the extreme right tail occasionally caused spurious oscillations of the KDE at relative ranges of 30–100 that satisfied the other criteria, causing systematic overestimation of H and clipping of the final estimate at its upper bound of 0.99.
- The minimum candidate valley position to the median relative range of the observations below the valley should be at least 1.8. Simulation experiments over the entire grid of concordance levels C, expression dispersions H, and domain sizes n revealed that a real boundary between concordant and discordant populations is found at no less than ~2.1 times the median of the concordant population. On the contrary, false valleys can be found within the concordant population itself due to the heterogeneous domain size. Concordant domains containing only 2 genes always have smaller relative ranges than concordant domains with 10 or more genes, resulting in an apparent bimodal structure even in the case of C = 1.0. Such intra-concordant valleys usually produce ratios lower than 1.5. The empirical threshold of 1.8 provides a safety margin between these two regimes.
Candidate valleys with less than five domains below the valley threshold were considered insufficiently reliable and discarded. If no valley fulfilled all of the criteria mentioned above, the separation based on KDE was regarded as unsuccessful and the fallback estimator was employed.
If a candidate valley met all selection criteria, the intra-domain expression dispersion was calculated from the median relative range of all domains with Erel values below the accepted valley threshold. However, the empirical analysis detected that an additional correction for the number of genes per domain was required. The median relative range of the concordant population is not just equal to 2H, as the expected value of the relative range is defined by the extrema of a finite sample of uniformly distributed observations normalized by their mean. It depends nonlinearly on the number of genes in the domain. The expected relative range is far below 2H, especially for domains with only few genes. For example, for n = 2, the median(Erel) is much lower than the asymptotic expectation. The discrepancy decreases steadily with the number of genes per domain and the relation approaches its limiting value, becoming effectively saturated for n > 30. The median relative range for the concordant population can be approximated as concordant_median ≈ H × f(n), where f(n) is an empirical correction factor to account for the relative range dependence on the domain size.
This correction factor f(n) was derived from the simulation based on the concordance dispersion model. Specifically, we simulated Uniform(1 − H,1 + H) dispersion across H in [0.05,0.50] and Poisson-distributed gene counts per domain. The correction factor exhibited less than 3% variation over the range of expression dispersions examined, indicating that the dependence of the correction factor on H was negligible. Hence, a single H-independent lookup table was considered to be sufficient for practical application.
The correction values used in analysis are given in Table 6. For intermediate values of n, the correction factor was calculated by linear interpolation between adjacent tabulated values. For domain sizes outside the tabulated range, f(n) was assigned to the nearest bounding value. The final estimate of the intra-domain expression dispersion was computed as the observed concordant-population median relative range divided by f(n).
Table 6.
Empirical correction factors f(n) mapping the concordant-population median relative range Erel to the dispersion half-width H.
The correction factor is always calculated from the median gene count of the specific subset used for estimation: the median of ngenes-per-domain for the domains below the accepted valley in the KDE path, or the median over all multi-gene domains in the fallback path. We employed the median because the n distribution at the TAD scale has a heavy right tail (95th percentile reached 52 in the test data) and a few very-large-n domains would bias the mean and lead to overcorrected H estimates.
If no valley is found, we assume the distribution is unimodal and apply the fallback estimator. There are two different scenarios that yield this result. In the first, the level of concordance C is close to 1.0: almost all domains are concordant, the distribution is unimodal by definition, and its median is a good approximation of the concordant-population median. The fallback estimator is correct in this case. In the second case, C is low and H is large: the concordant and discordant populations overlap so much that no valley can be detected, and the overall median is dominated by discordant null values.
The fallback is calculated as Hraw = median(Erel)/f(n) and capped: if Hraw > 0.55, the estimate is set to 0.50 and designated as unreliable. The 10% margin between the cap trigger of 0.55 and the cap output of 0.50 absorbs the small overestimation from the correction factor. If Hraw ≤ 0.55, it is clipped to the [0.01, 0.99] range and returned as the estimate. The choice of the overall median is deliberate: at C = 1.0, the distribution is the concordant population and the median is the concordant median, accurately recovering H to within 3%.
4.4. A Method to Evaluate the Expression Concordance
The results of the simulations indicate that the magnitude of the zc criterion (Equation (6)) is contingent upon the expression concordance C and the expression intra-domain dispersion H. An analysis of the pools of generated datasets with controlled parameters C and H (Results, Section 2.4) enabled the development of a solution to the inverse problem, i.e., the determination of the expression concordance level from criterion zc and the expression dispersion H (Methods, Section 4.3).
4.4.1. Calibration Grid and Spline Fitting
Expression concordance estimation requires mapping from (zc, H) to C. This mapping can be established empirically by running the full permutation analysis on synthetic datasets with known C and H across a 10 × 10 grid covering C ∈ {0.1, 0.2, …, 1.0} and H ∈ {0.05, 0.10, …, 0.50}. For each cell of this grid, 10,000 of independent synthetic replicates were generated (Results, Section 2.4). For calibration in proportional gene-to-domain assignment mode, each dataset was analyzed using 100,000 cyclic permutations. This produces a 10 × 10 calibration matrix. The entries are the empirical 5th percentiles of the simulated zc distributions at the specified C and H values and are used for inverse calibration.
For each row of this calibration matrix, corresponding to a fixed expression dispersion H, a smoothing cubic spline is fitted to the ten (C, zc (C, H)) data points. Only data points with zc (C, H) ≤ −1.96 are included in the fit since grid points above this threshold lie outside the region where the permutation test returns a significant result and do not contribute a proper signal for inversion. The minimum concordance level for which a significant threshold exists is recorded per H row as Cmin(H). A leave-one-out cross-validation procedure over the retained data points selects the smoothing parameter that minimizes the mean squared prediction error, scanning 200 candidate values on a logarithmic grid from 10−4 to 102. The fitted spline for row i is a monotonically decreasing function spli(C) mapping concordance values to zc thresholds, defined on the range of [Cmin(Hi), 1.0] and characterized by its cubic B-spline knots t, coefficients c, and degree k = 3. These arrays are stored in the calibration file of universal format HDF5 and reconstructed at analysis time via python’s scipy.interpolate.BSpline(t, c, k) function, making the calibration independent of the scipy version used to fit the original spline.
4.4.2. Dispersion-Aware Expression Concordance Estimation by H Interpolation
The calibration file contains one spline for each H grid point, over a fixed set of expression dispersions. The procedure described in Section 4.3 of the Methods yields an estimated dispersion half-width Hest, calculated from the particular dataset. Since Hest does not coincide exactly with a grid point, the concordance estimate is calculated by linear interpolation between the two bracketing H rows. The bracketing index i such that Hi ≤ Hest < Hi+1 is obtained by binary search and the interpolation weight is:
w = (Hest − Hi)/(Hi+1 − Hi)
Hest is clamped to the calibration range [H0, H9]; so, datasets with very low or very high estimated expression dispersion are handled by the nearest calibration row rather than extrapolating beyond the grid. The two splines spli and spli+1 are then inverted independently at the observed zc to obtain bracketing concordance estimates Clo and Chi, and the final estimate is:
Craw = (1 − w)Clo + wChi
This interpolation structure reflects the way the splines themselves are used, ensuring that the concordance estimate varies smoothly as a function of Hest. If zc > −1.96, the result is reported as not significant and C* is not reported. When the loaded calibration file contains the PCHIP correction functions described in Section 4.4.4, the actual result is:
where gi includes clipping the PCHIP output to [0, 1].
Cfinal = (1 − w)gi(Clo) + wgi+1(Chi)
4.4.3. Spline Inversion Procedure
The inversion of spli(C) = zc proceeds in the following steps:
- If zc > −1.96, the function immediately returns the non-significant flag.
- If zc is more negative than or equal to the spline value at C = 1.0, C* is returned as 1.0 (the observation is more concordant than any level of the calibration grid).
- If zc lies within the fitted range, meaning zc ≤ spli(Cmin(Hi)), Brent’s method [89] is applied on the interval [Cmin, 1.0], where the spline is guaranteed monotone, to find C* with a tolerance of 10−6.
- If zc > spli(Cmin), the observation is less extreme than the spline threshold at the lowest calibration level for that H row. This occurs at moderate expression concordance and high dispersion, where the signal is weaker than the 5th percentile threshold at Cmin. In this situation, the spline is extrapolated below Cmin toward C = 0 using the same cubic polynomial.
4.4.4. Bias Correction via the 2D Correction Mesh
The spline inversion procedure described above returns a concordance estimate calculated from the calibration percentile, but during simulations, it was revealed that a systematic bias remains between the raw spline output and the true concordance level. This bias arises because the calibration records the threshold of zc at specific C values, and inverting at an arbitrary observed zc does not recover exactly the C value that generated the observation. Validation experiments on synthetic datasets with known concordance levels (Results, Section 2.4) confirmed that the raw spline output is systematically above the true concordance at low C and below it at high C, with the direction and magnitude of the bias also depending on H.
This bias can be captured by running the full analysis pipeline on the same set of synthetic datasets covering the same 10 × 10 (C, H) calibration grid. For each cell, the median of the raw Cest values returned by the spline inversion is recorded. This produces a second 10 × 10 matrix in which each entry gives the typical raw spline output for a dataset with known C and H.
For each row H, a monotone PCHIP (Piecewise Cubic Hermite Interpolating Polynomial) interpolator [50] is fitted to the ten (median(Cest), Ctrue) pairs, with a (0, 0) anchor prepended to ensure correct extrapolation toward zero. The result is a collection of ten correction callables, one per H grid point, each mapping a raw Cest value to a corrected Ctrue value. PCHIP was preferred over an unconstrained cubic spline because it guarantees monotonicity between knots, which is required for the correction to be a valid mapping. The ten callables and their underlying (Cest.knot, Ctrue) arrays are stored in the standard HDF5 file as a 10 × 11 matrix correction_x, alongside a 11-element correction_y array holding the Ctrue values.
The correction process is performed in three consecutive steps. First, spline inversion is applied separately for the two neighboring values of the dispersion parameter H, resulting in separate inverted concordance estimates at each of these reference points. Then, each of the resulting estimates is corrected by the PCHIP-based bias correction function for the corresponding H value. Finally, the two bias-corrected concordance estimates are combined by linear interpolation, the interpolation weight being determined by the position of the target H value relative to the neighboring reference values. The same index i and weight w from Section 4.4.2 are reapplied for the correction. The callable for row i is applied to Clo and the callable for row i + 1 is applied to Chi to obtain the corrected estimate using Equation (12).
This structure reflects the H-interpolation applied to the splines themselves, ensuring that the correction varies smoothly with H. Datasets for which the raw Cest falls below the first knot of the correction PCHIP at that H row (meaning the signal is weaker than the weakest identified concordance level at that expression dispersion) are not corrected further, i.e., the outputs are clipped to the left boundary value of the array.
The results of the simulations and the correction tables for the zc statistic (Section 4.4.1) and concordance C (Section 4.4.4) are presented in Supplementary Table S4.
5. Conclusions
The organization of the genome into functional domains plays an essential role in transcriptional regulation. However, quantitatively linking these physical structures to gene expression profiles remains analytically challenging. In this work, we introduce ConGEE, a robust statistical approach based on cyclic genomic permutations that preserve spatial expression patterns while assessing their association with specified genomic domain structures. Extensive simulations validated our statistical criteria across diverse domain architectures, whereas analyses of empirical expression profiles demonstrated the clear advantages of cyclic permutations over unrestricted random permutations. Furthermore, our modeling confirms that expression dispersion and concordance can be reliably estimated across the vast majority of the applicable range of parameter space.
The practical application of ConGEE to experimental transcriptomes revealed condition-associated differences in domain-level expression organization. Analyses of MDA-MB-231 cells cultivated in 3D collagen matrices and HEK293T cells subjected to heat shock or 1,6-hexanediol treatment demonstrated the capacity of the method to detect distinct expression concordance patterns. Complementary analyses of individual biological replicates, expression-level filtering, and reference-domain displacement were performed to evaluate the robustness and biological interpretation of these findings. Nevertheless, expression concordance alone cannot verify the existence of coordinated regulatory mechanisms or structural chromatin reorganization.
The primary statistical criteria, zc and ze, can be applied to different genomic domain architectures without recalibration. However, the quantitative estimation of expression concordance requires calibration tailored to the corresponding domain structure. The developed software and calibration scripts are freely available on GitHub.
Looking forward, the algorithm and software that we developed could facilitate the study of domain-associated transcription during cellular differentiation, embryonic development, and disease progression. This method can also be applied to other types of genomic domains to compare the strength of association between alternative domain annotations and gene expression. ConGEE, when applied in conjunction with replicate-level and sensitivity analyses, has the potential to enhance comprehension of the associations between genome organization and transcriptional regulation under varied biological conditions and across different species.
Supplementary Materials
The following supporting information can be downloaded at: https://www.mdpi.com/article/10.3390/ijms272210315/s1.
Author Contributions
Conceptualization, Y.V.K. and V.R.C.; Methodology, Y.V.K., V.R.C. and G.I.K.; software, Y.V.K. and K.S.S.; validation, G.I.K. and V.R.C.; statistical assessments, Y.V.K. and K.S.S.; molecular biology experiments with HEK293T cells, E.S.K., A.N.D. and N.A.T.; writing—original draft preparation, Y.V.K., G.I.K. and V.R.C.; writing—review and editing, Y.V.K., G.I.K., K.S.S., E.S.K. and V.R.C.; visualization, Y.V.K. All authors have read and agreed to the published version of the manuscript.
Funding
This work was supported by a grant from the Russian Science Foundation (No. 25-24-01202).
Institutional Review Board Statement
Not applicable.
Informed Consent Statement
Not applicable.
Data Availability Statement
The source code for all scripts used in this work and the detailed descriptions of how to run analysis are freely available at https://ancorr.eimb.ru and Github: https://github.com/lokapal/ConGEE (accessed on 1 September 2026).
Conflicts of Interest
The authors declare no conflicts of interest.
Abbreviations
The following abbreviations are used in this manuscript:
| TADs | Topologically Associated Domains |
| LADs | Lamina-Associated Domains |
| RAFT | Rapid Amplification of Forum Termini |
| VM | Vasculogenic Mimicry |
| BH | Benjamini–Hochberg correction |
| KDE | Kernel Density Estimator |
| HS | Heat Shock |
| 1,6-HD | 1,6-hexanediol |
| PCHIP | Piecewise Cubic Hermite Interpolating Polynomial |
References
- Satam, H.; Joshi, K.; Mangrolia, U.; Waghoo, S.; Zaidi, G.; Rawool, S.; Thakare, R.P.; Banday, S.; Mishra, A.K.; Das, G.; et al. Next-Generation Sequencing Technology: Current Trends and Advancements. Biology 2023, 12, 997, Correction in Biology 2024, 13, 286. https://doi.org/10.3390/biology13050286. [Google Scholar] [CrossRef] [Scilit] [PubMed]
- Hu, T.; Chitnis, N.; Monos, D.; Dinh, A. Next-generation sequencing technologies: An overview. Hum. Immunol. 2021, 82, 801–811. [Google Scholar] [CrossRef] [Scilit] [PubMed]
- Kagda, M.S.; Lam, B.; Litton, C.; Small, C.; Sloan, C.A.; Spragins, E.; Tanaka, F.; Whaling, I.; Gabdank, I.; Youngworth, I.; et al. Data navigation on the ENCODE portal. Nat. Commun. 2025, 16, 9592. [Google Scholar] [CrossRef] [Scilit] [PubMed]
- Clough, E.; Barrett, T.; Wilhite, S.E.; Ledoux, P.; Evangelista, C.; Kim, I.F.; Tomashevsky, M.; Marshall, K.A.; Phillippy, K.H.; Sherman, P.M.; et al. NCBI GEO: Archive for gene expression and epigenomics data sets: 23-year update. Nucleic Acids Res. 2024, 52, D138–D144. [Google Scholar] [CrossRef] [Scilit] [PubMed]
- George, N.; Fexova, S.; Fuentes, A.M.; Madrigal, P.; Bi, Y.; Iqbal, H.; Kumbham, U.; Nolte, N.F.; Zhao, L.; Thanki, A.S.; et al. Expression Atlas update: Insights from sequencing data at both bulk and single cell level. Nucleic Acids Res. 2024, 52, D107–D114. [Google Scholar] [CrossRef] [Scilit] [PubMed]
- Nobusada, T.; Yip, C.W.; Agrawal, S.; Severin, J.; Abugessaisa, I.; Hasegawa, A.; Hon, C.C.; Ide, S.; Koido, M.; Kondo, A.; et al. Update of the FANTOM web resource: Enhancement for studying noncoding genomes. Nucleic Acids Res. 2025, 53, D419–D424. [Google Scholar] [CrossRef] [Scilit] [PubMed]
- Katz, K.; Shutov, O.; Lapoint, R.; Kimelman, M.; Brister, J.R.; O’Sullivan, C. The Sequence Read Archive: A decade more of explosive growth. Nucleic Acids Res. 2022, 50, D387–D390. [Google Scholar] [CrossRef] [Scilit] [PubMed]
- Shoba Ranganathan, M.C.a.A.M.K. (Ed.) Encyclopedia of Bioinformatics and Computational Biology; Elsevier: Amsterdam, The Netherlands, 2025; p. 3700. [Google Scholar]
- Eisen, M.B.; Spellman, P.T.; Brown, P.O.; Botstein, D. Cluster analysis and display of genome-wide expression patterns. Proc. Natl. Acad. Sci. USA 1998, 95, 14863–14868. [Google Scholar] [CrossRef] [Scilit] [PubMed]
- Golub, T.R.; Slonim, D.K.; Tamayo, P.; Huard, C.; Gaasenbeek, M.; Mesirov, J.P.; Coller, H.; Loh, M.L.; Downing, J.R.; Caligiuri, M.A.; et al. Molecular classification of cancer: Class discovery and class prediction by gene expression monitoring. Science 1999, 286, 531–537. [Google Scholar] [CrossRef] [Scilit] [PubMed]
- Bonev, B.; Cavalli, G. Organization and function of the 3D genome. Nat. Rev. Genet. 2016, 17, 661–678, Correction in Nat. Rev. Genet. 2016, 17, 772. https://doi.org/10.1038/nrg.2016.147. [Google Scholar] [CrossRef] [Scilit] [PubMed]
- Zheng, H.; Xie, W. The role of 3D genome organization in development and cell differentiation. Nat. Rev. Mol. Cell Biol. 2019, 20, 535–550. [Google Scholar] [CrossRef] [Scilit] [PubMed]
- Nuebler, J.; Fudenberg, G.; Imakaev, M.; Abdennur, N.; Mirny, L.A. Chromatin organization by an interplay of loop extrusion and compartmental segregation. Proc. Natl. Acad. Sci. USA 2018, 115, E6697–E6706. [Google Scholar] [CrossRef] [Scilit] [PubMed]
- Prieto, E.I.; Maeshima, K. Dynamic chromatin organization in the cell. Essays Biochem. 2019, 63, 133–145. [Google Scholar] [CrossRef] [Scilit] [PubMed]
- Misteli, T. The Self-Organizing Genome: Principles of Genome Architecture and Function. Cell 2020, 183, 28–45. [Google Scholar] [CrossRef] [Scilit] [PubMed]
- Jerkovic, I.; Cavalli, G. Understanding 3D genome organization by multidisciplinary methods. Nat. Rev. Mol. Cell Biol. 2021, 22, 511–528. [Google Scholar] [CrossRef] [Scilit] [PubMed]
- Garcia Fernandez, F.; Huet, S.; Mine-Hattab, J. Multi-Scale Imaging of the Dynamic Organization of Chromatin. Int. J. Mol. Sci. 2023, 24, 15975. [Google Scholar] [CrossRef] [Scilit] [PubMed]
- Dixon, J.R.; Selvaraj, S.; Yue, F.; Kim, A.; Li, Y.; Shen, Y.; Hu, M.; Liu, J.S.; Ren, B. Topological domains in mammalian genomes identified by analysis of chromatin interactions. Nature 2012, 485, 376–380. [Google Scholar] [CrossRef] [Scilit] [PubMed]
- Liao, Y.; Zhang, X.; Chakraborty, M.; Emerson, J.J. Topologically associating domains and their role in the evolution of genome structure and function in Drosophila. Genome Res. 2021, 31, 397–410. [Google Scholar] [CrossRef] [Scilit] [PubMed]
- Matheson, T.D.; Kaufman, P.D. Grabbing the genome by the NADs. Chromosoma 2016, 125, 361–371. [Google Scholar] [CrossRef] [Scilit] [PubMed]
- Forsberg, F.; Brunet, A.; Ali, T.M.L.; Collas, P. Interplay of lamin A and lamin B LADs on the radial positioning of chromatin. Nucleus 2019, 10, 7–20. [Google Scholar] [CrossRef] [Scilit] [PubMed]
- Briand, N.; Collas, P. Lamina-associated domains: Peripheral matters and internal affairs. Genome Biol. 2020, 21, 85. [Google Scholar] [CrossRef] [Scilit] [PubMed]
- Bizhanova, A.; Kaufman, P.D. Close to the edge: Heterochromatin at the nucleolar and nuclear peripheries. Biochim. Biophys. Acta Gene Regul. Mech. 2021, 1864, 194666. [Google Scholar] [CrossRef] [Scilit] [PubMed]
- Bersaglieri, C.; Santoro, R. Genome Organization in and around the Nucleolus. Cells 2019, 8, 579. [Google Scholar] [CrossRef] [Scilit] [PubMed]
- Bersaglieri, C.; Kresoja-Rakic, J.; Gupta, S.; Bar, D.; Kuzyakiv, R.; Panatta, M.; Santoro, R. Genome-wide maps of nucleolus interactions reveal distinct layers of repressive chromatin domains. Nat. Commun. 2022, 13, 1483. [Google Scholar] [CrossRef] [Scilit] [PubMed]
- Bantignies, F.; Cavalli, G. Polycomb group proteins: Repression in 3D. Trends Genet. 2011, 27, 454–464. [Google Scholar] [CrossRef] [Scilit] [PubMed]
- Pachano, T.; Crispatzu, G.; Rada-Iglesias, A. Polycomb proteins as organizers of 3D genome architecture in embryonic stem cells. Brief. Funct. Genom. 2019, 18, 358–366. [Google Scholar] [CrossRef] [Scilit] [PubMed]
- Tchurikov, N.A.; Yudkin, D.V.; Gorbacheva, M.A.; Kulemzina, A.I.; Grischenko, I.V.; Fedoseeva, D.M.; Sosin, D.V.; Kravatsky, Y.V.; Kretova, O.V. Hot spots of DNA double-strand breaks in human rDNA units are produced in vivo. Sci. Rep. 2016, 6, 25866. [Google Scholar] [CrossRef] [Scilit] [PubMed]
- Tchurikov, N.A.; Kravatsky, Y.V.; Kretova, O.V. Link Between Double-Strand DNA Break Hotspots and Transcription Regulation: Forum Domains—50-250 kb Chromosome Regions Containing Coordinately Expressed Genes. Biochemistry 2018, 83, 437–449. [Google Scholar] [CrossRef] [Scilit] [PubMed]
- Ibrahim, D.M.; Mundlos, S. The role of 3D chromatin domains in gene regulation: A multi-facetted view on genome organization. Curr. Opin. Genet. Dev. 2020, 61, 1–8. [Google Scholar] [CrossRef] [Scilit] [PubMed]
- Yadav, V.K.; Jalmi, S.K. A multifaceted journey into higher-order chromatin organization: Insights from experimental and computational approaches. Int. J. Biol. Macromol. 2025, 322, 146721. [Google Scholar] [CrossRef] [Scilit] [PubMed]
- Rahnenfuhrer, J.; Domingues, F.S.; Maydt, J.; Lengauer, T. Calculating the statistical significance of changes in pathway activity from gene expression data. Stat. Appl. Genet. Mol. Biol. 2004, 3, Article16. [Google Scholar] [CrossRef] [Scilit] [PubMed]
- Savino, A.; Provero, P.; Poli, V. Differential Co-Expression Analyses Allow the Identification of Critical Signalling Pathways Altered during Tumour Transformation and Progression. Int. J. Mol. Sci. 2020, 21, 9461. [Google Scholar] [CrossRef] [Scilit] [PubMed]
- Soler-Oliva, M.E.; Guerrero-Martinez, J.A.; Bachetti, V.; Reyes, J.C. Analysis of the relationship between coexpression domains and chromatin 3D organization. PLoS Comput. Biol. 2017, 13, e1005708. [Google Scholar] [CrossRef] [Scilit] [PubMed]
- Fan, C.; Oh, D.S.; Wessels, L.; Weigelt, B.; Nuyten, D.S.; Nobel, A.B.; van’t Veer, L.J.; Perou, C.M. Concordance among gene-expression-based predictors for breast cancer. N. Engl. J. Med. 2006, 355, 560–569. [Google Scholar] [CrossRef] [Scilit] [PubMed]
- French, D.; Yang, W.; Hamilton, L.H.; Neale, G.; Fan, Y.; Downing, J.R.; Cox, N.J.; Pui, C.H.; Evans, W.E.; Relling, M.V. Concordant gene expression in leukemia cells and normal leukocytes is associated with germline cis-SNPs. PLoS ONE 2008, 3, e2144. [Google Scholar] [CrossRef] [Scilit] [PubMed]
- Lai, Y.; Zhang, F.; Nayak, T.K.; Modarres, R.; Lee, N.H.; McCaffrey, T.A. Concordant integrative gene set enrichment analysis of multiple large-scale two-sample expression data sets. BMC Genom. 2014, 15, S6. [Google Scholar] [CrossRef] [Scilit] [PubMed]
- Domaszewska, T.; Scheuermann, L.; Hahnke, K.; Mollenkopf, H.; Dorhoi, A.; Kaufmann, S.H.E.; Weiner, J., 3rd. Concordant and discordant gene expression patterns in mouse strains identify best-fit animal model for human tuberculosis. Sci. Rep. 2017, 7, 12094. [Google Scholar] [CrossRef] [Scilit] [PubMed]
- Cahill, K.M.; Huo, Z.; Tseng, G.C.; Logan, R.W.; Seney, M.L. Improved identification of concordant and discordant gene expression signatures using an updated rank-rank hypergeometric overlap approach. Sci. Rep. 2018, 8, 9588. [Google Scholar] [CrossRef] [Scilit] [PubMed]
- Kiani, K.; Sanford, E.M.; Goyal, Y.; Raj, A. Changes in chromatin accessibility are not concordant with transcriptional changes for single-factor perturbations. Mol. Syst. Biol. 2022, 18, e10979. [Google Scholar] [CrossRef] [Scilit] [PubMed]
- Tondar, A.; Marin, D.H.; Linan, L.C.; Bepari, A.K. Concordant Shared Transcriptomic Signatures and Candidate Regulatory Features in Chronic Lymphocytic Leukemia and Multiple Myeloma. Oncol. Res. 2026, 34, 21. [Google Scholar] [CrossRef] [Scilit] [PubMed]
- Caron, H.; van Schaik, B.; van der Mee, M.; Baas, F.; Riggins, G.; van Sluis, P.; Hermus, M.C.; van Asperen, R.; Boon, K.; Voute, P.A.; et al. The human transcriptome map: Clustering of highly expressed genes in chromosomal domains. Science 2001, 291, 1289–1292. [Google Scholar] [CrossRef] [Scilit] [PubMed]
- Cabrera, C.P.; Navarro, P.; Huffman, J.E.; Wright, A.F.; Hayward, C.; Campbell, H.; Wilson, J.F.; Rudan, I.; Hastie, N.D.; Vitart, V.; et al. Uncovering networks from genome-wide association studies via circular genomic permutation. G3 (Bethesda) 2012, 2, 1067–1075. [Google Scholar] [CrossRef] [Scilit] [PubMed]
- Rapoport, R.; Greenberg, A.; Yakhini, Z.; Simon, I. A Cyclic Permutation Approach to Removing Spatial Dependency between Clustered Gene Ontology Terms. Biology 2024, 13, 175. [Google Scholar] [CrossRef] [Scilit] [PubMed]
- Kravatsky, Y.V.; Chechetkin, V.R.; Tchurikov, N.A.; Kravatskaya, G.I. Genome-wide study of correlations between genomic features and their relationship with the regulation of gene expression. DNA Res. 2015, 22, 109–119. [Google Scholar] [CrossRef] [Scilit] [PubMed]
- Kravatsky, Y.V.; Chechetkin, V.R.; Tchurikov, N.A.; Kravatskaya, G.I. Genome-Wide Study of Colocalization between Genomic Stretches: A Method and Applications to the Regulation of Gene Expression. Biology 2022, 11, 1422. [Google Scholar] [CrossRef] [Scilit] [PubMed]
- Smirnov, D.N.; Kononkova, A.D.; Toiber, D.; Gelfand, M.S.; Khrameeva, E.E. optimalTAD: Annotation of topologically associating domains based on chromatin marks enrichment. bioRxiv 2023. [Google Scholar] [CrossRef] [Scilit]
- Le Dily, F.; Bau, D.; Pohl, A.; Vicent, G.P.; Serra, F.; Soronellas, D.; Castellano, G.; Wright, R.H.; Ballare, C.; Filion, G.; et al. Distinct structural transitions of chromatin topological domains correlate with coordinated hormone-induced gene regulation. Genes. Dev. 2014, 28, 2151–2162. [Google Scholar] [CrossRef] [Scilit] [PubMed]
- Silverman, B.W. Density Estimation for Statistics and Data Analysis; Routledge: Abingdon, UK, 2018. [Google Scholar]
- Fritsch, F.N.; Butland, J. A method for constructing local monotone piecewise cubic interpolants. SIAM J. Sci. Stat. Comput. 1984, 5, 300–304. [Google Scholar] [CrossRef] [Scilit]
- Velez, D.O.; Tsui, B.; Goshia, T.; Chute, C.L.; Han, A.; Carter, H.; Fraley, S.I. 3D collagen architecture induces a conserved migratory and transcriptional response linked to vasculogenic mimicry. Nat. Commun. 2017, 8, 1651. [Google Scholar] [CrossRef] [Scilit] [PubMed]
- Liang, H.; Berger, B.; Singh, R. Foundation model reveals the shared organization of transcription and topologically associating domains. Cell Syst. 2026, 17, 101675. [Google Scholar] [CrossRef] [Scilit] [PubMed]
- Li, P.; Hatos, A.; Petrovic, M.; Franceschini, G.M.; Nanni, L.; Tavernari, D.; Ciriello, G. TADShop: Systematic benchmarking and identification of topologically associating domains. Nat. Methods 2026, 23, 1227–1235. [Google Scholar] [CrossRef] [Scilit] [PubMed]
- Novak, P.; Jensen, T.; Oshiro, M.M.; Wozniak, R.J.; Nouzova, M.; Watts, G.S.; Klimecki, W.T.; Kim, C.; Futscher, B.W. Epigenetic inactivation of the HOXA gene cluster in breast cancer. Cancer Res. 2006, 66, 10664–10670. [Google Scholar] [CrossRef] [Scilit] [PubMed]
- Fracassi, C.; Ugge, M.; Abdelhalim, M.; Zapparoli, E.; Simoni, M.; Magliulo, D.; Mazza, D.; Lazarevic, D.; Morelli, M.J.; Collas, P.; et al. PML modulates epigenetic composition of chromatin to regulate expression of pro-metastatic genes in triple-negative breast cancer. Nucleic Acids Res. 2023, 51, 11024–11039. [Google Scholar] [CrossRef] [Scilit] [PubMed]
- Minussi, D.C.; Nicholson, M.D.; Ye, H.; Davis, A.; Wang, K.; Baker, T.; Tarabichi, M.; Sei, E.; Du, H.; Rabbani, M.; et al. Breast tumours maintain a reservoir of subclonal diversity during expansion. Nature 2021, 592, 302–308. [Google Scholar] [CrossRef] [Scilit] [PubMed]
- Wang, Z.; Liu, Z.; Thakur, C.; Qiu, Y.; Wang, J.; Damaghi, M.; Haley, J.D.; Chen, F. Mdig shapes 3D chromatin architecture of immune checkpoint genes and limits metastasis of triple negative breast cancer cells. bioRxiv 2025. [Google Scholar] [CrossRef] [Scilit]
- Li, C.; Bonder, M.J.; Syed, S.; Jensen, M.; Human Genome Structural Variation, C.; Group, H.F.A.W.; Gerstein, M.B.; Zody, M.C.; Chaisson, M.J.P.; Talkowski, M.E.; et al. An integrative TAD catalog in lymphoblastoid cell lines discloses the functional impact of deletions and insertions in human genomes. Genome Res. 2024, 34, 2304–2318. [Google Scholar] [CrossRef] [Scilit] [PubMed]
- Chen, B.; Ren, C.; Ouyang, Z.; Xu, J.; Xu, K.; Li, Y.; Guo, H.; Bai, X.; Tian, M.; Xu, X.; et al. Stratifying TAD boundaries pinpoints focal genomic regions of regulation, damage, and repair. Brief. Bioinform. 2024, 25, bbae306. [Google Scholar] [CrossRef] [Scilit] [PubMed]
- Ghavi-Helm, Y. Functional Consequences of Chromosomal Rearrangements on Gene Expression: Not So Deleterious After All? J. Mol. Biol. 2020, 432, 665–675. [Google Scholar] [CrossRef] [Scilit] [PubMed]
- Rossini, R.; Oshaghi, S.; Nekrasov, M.; Bellanger, A.; Domaschenz, R.; Dijkwel, Y.; Abdelhalim, M.; Agrawal, R.; Ledsaak, M.; Collas, P.; et al. Loss of multilevel 3D genome organization during breast cancer progression. Genome Res. 2026, 36, 20–37. [Google Scholar] [CrossRef] [Scilit] [PubMed]
- Mahat, D.B.; Salamanca, H.H.; Duarte, F.M.; Danko, C.G.; Lis, J.T. Mammalian Heat Shock Response and Mechanisms Underlying Its Genome-wide Transcriptional Regulation. Mol. Cell 2016, 62, 63–78. [Google Scholar] [CrossRef] [Scilit] [PubMed]
- Abravaya, K.; Myers, M.P.; Murphy, S.P.; Morimoto, R.I. The human heat shock protein hsp70 interacts with HSF, the transcription factor that regulates heat shock gene expression. Genes. Dev. 1992, 6, 1153–1164. [Google Scholar] [CrossRef] [Scilit] [PubMed]
- Satyal, S.H.; Chen, D.; Fox, S.G.; Kramer, J.M.; Morimoto, R.I. Negative regulation of the heat shock transcriptional response by HSBP1. Genes. Dev. 1998, 12, 1962–1974. [Google Scholar] [CrossRef] [Scilit] [PubMed]
- Ji, Q.; Zong, X.; Mao, Y.; Qian, S.B. A heat shock-responsive lncRNA Heat acts as a HSF1-directed transcriptional brake via m(6)A modification. Proc. Natl. Acad. Sci. USA 2021, 118, e2102175118. [Google Scholar] [CrossRef] [Scilit] [PubMed]
- Vihervaara, A.; Mahat, D.B.; Guertin, M.J.; Chu, T.; Danko, C.G.; Lis, J.T.; Sistonen, L. Transcriptional response to stress is pre-wired by promoter and enhancer architecture. Nat. Commun. 2017, 8, 255. [Google Scholar] [CrossRef] [Scilit] [PubMed]
- Cugusi, S.; Mitter, R.; Kelly, G.P.; Walker, J.; Han, Z.; Pisano, P.; Wierer, M.; Stewart, A.; Svejstrup, J.Q. Heat shock induces premature transcript termination and reconfigures the human transcriptome. Mol. Cell 2022, 82, 1573–1588.E10. [Google Scholar] [CrossRef] [Scilit] [PubMed]
- Vilborg, A.; Passarelli, M.C.; Yario, T.A.; Tycowski, K.T.; Steitz, J.A. Widespread Inducible Transcription Downstream of Human Genes. Mol. Cell 2015, 59, 449–461. [Google Scholar] [CrossRef] [Scilit] [PubMed]
- Vilborg, A.; Sabath, N.; Wiesel, Y.; Nathans, J.; Levy-Adam, F.; Yario, T.A.; Steitz, J.A.; Shalgi, R. Comparative analysis reveals genomic features of stress-induced transcriptional readthrough. Proc. Natl. Acad. Sci. USA 2017, 114, E8362–E8371. [Google Scholar] [CrossRef] [Scilit] [PubMed]
- Cardiello, J.F.; Goodrich, J.A.; Kugel, J.F. Heat Shock Causes a Reversible Increase in RNA Polymerase II Occupancy Downstream of mRNA Genes, Consistent with a Global Loss in Transcriptional Termination. Mol. Cell Biol. 2018, 38, e00181-18. [Google Scholar] [CrossRef] [Scilit] [PubMed]
- Hadar, S.; Meller, A.; Saida, N.; Shalgi, R. Stress-induced transcriptional readthrough into neighboring genes is linked to intron retention. iScience 2022, 25, 105543. [Google Scholar] [CrossRef] [Scilit] [PubMed]
- Kroschwald, S.; Maharana, S.; Simon, A. Hexanediol: A chemical probe to investigate the material properties of membrane-less compartments. Matters 2017, 3, e201702000010. [Google Scholar] [CrossRef] [Scilit]
- Sabari, B.R.; Dall’Agnese, A.; Boija, A.; Klein, I.A.; Coffey, E.L.; Shrinivas, K.; Abraham, B.J.; Hannett, N.M.; Zamudio, A.V.; Manteiga, J.C.; et al. Coactivator condensation at super-enhancers links phase separation and gene control. Science 2018, 361, eaar3958. [Google Scholar] [CrossRef] [Scilit] [PubMed]
- Ulianov, S.V.; Velichko, A.K.; Magnitov, M.D.; Luzhin, A.V.; Golov, A.K.; Ovsyannikova, N.; Kireev, I.I.; Gavrikov, A.S.; Mishin, A.S.; Garaev, A.K.; et al. Suppression of liquid-liquid phase separation by 1,6-hexanediol partially compromises the 3D genome organization in living cells. Nucleic Acids Res. 2021, 49, 10524–10541. [Google Scholar] [CrossRef] [Scilit] [PubMed]
- Liu, X.; Jiang, S.; Ma, L.; Qu, J.; Zhao, L.; Zhu, X.; Ding, J. Time-dependent effect of 1,6-hexanediol on biomolecular condensates and 3D chromatin organization. Genome Biol. 2021, 22, 230. [Google Scholar] [CrossRef] [Scilit] [PubMed]
- Strom, A.R.; Emelyanov, A.V.; Mir, M.; Fyodorov, D.V.; Darzacq, X.; Karpen, G.H. Phase separation drives heterochromatin domain formation. Nature 2017, 547, 241–245. [Google Scholar] [CrossRef] [Scilit] [PubMed]
- Tatavosian, R.; Kent, S.; Brown, K.; Yao, T.; Duc, H.N.; Huynh, T.N.; Zhen, C.Y.; Ma, B.; Wang, H.; Ren, X. Nuclear condensates of the Polycomb protein chromobox 2 (CBX2) assemble through phase separation. J. Biol. Chem. 2019, 294, 1451–1463. [Google Scholar] [CrossRef] [Scilit] [PubMed]
- Itoh, Y.; Iida, S.; Tamura, S.; Nagashima, R.; Shiraki, K.; Goto, T.; Hibino, K.; Ide, S.; Maeshima, K. 1,6-hexanediol rapidly immobilizes and condenses chromatin in living human cells. Life Sci. Alliance 2021, 4, e202001005. [Google Scholar] [CrossRef] [Scilit] [PubMed]
- Xu, J.; Xu, X.; Huang, D.; Luo, Y.; Lin, L.; Bai, X.; Zheng, Y.; Yang, Q.; Cheng, Y.; Huang, A.; et al. A comprehensive benchmarking with interpretation and operational guidance for the hierarchy of topologically associating domains. Nat. Commun. 2024, 15, 4376. [Google Scholar] [CrossRef] [Scilit] [PubMed]
- Harris, C.R.; Millman, K.J.; van der Walt, S.J.; Gommers, R.; Virtanen, P.; Cournapeau, D.; Wieser, E.; Taylor, J.; Berg, S.; Smith, N.J.; et al. Array programming with NumPy. Nature 2020, 585, 357–362. [Google Scholar] [CrossRef] [Scilit] [PubMed]
- Virtanen, P.; Gommers, R.; Oliphant, T.E.; Haberland, M.; Reddy, T.; Cournapeau, D.; Burovski, E.; Peterson, P.; Weckesser, W.; Bright, J.; et al. SciPy 1.0: Fundamental algorithms for scientific computing in Python. Nat. Methods 2020, 17, 261–272, Correction in Nat. Methods 2020, 17, 352. https://doi.org/10.1038/s41592-020-0772-5. [Google Scholar] [CrossRef] [Scilit] [PubMed]
- Reback, J.; McKinney, W.; Van Den Bossche, J.; Augspurger, T.; Cloud, P.; Klein, A.; Hawkins, S.; Roeschke, M.; Tratner, J.; She, C. pandas-dev/pandas: Pandas 1.0. 5; Zenodo: Geneva, Switzerland, 2020. [Google Scholar] [CrossRef] [Scilit]
- Collette, A. Python and HDF5, 1st ed.; O’Reilly: Beijiing, China, 2014; pp. xiv, 135 pages. [Google Scholar]
- An, L.; Yang, T.; Yang, J.; Nuebler, J.; Xiang, G.; Hardison, R.C.; Li, Q.; Zhang, Y. OnTAD: Hierarchical domain structure reveals the divergence of activity among TADs and boundaries. Genome Biol. 2019, 20, 282. [Google Scholar] [CrossRef] [Scilit] [PubMed]
- Bolger, A.M.; Lohse, M.; Usadel, B. Trimmomatic: A flexible trimmer for Illumina sequence data. Bioinformatics 2014, 30, 2114–2120. [Google Scholar] [CrossRef] [Scilit] [PubMed]
- Li, B.; Dewey, C.N. RSEM: Accurate transcript quantification from RNA-Seq data with or without a reference genome. BMC Bioinform. 2011, 12, 323. [Google Scholar] [CrossRef] [Scilit] [PubMed]
- Wickham, H.; François, R.; Henry, L.; Müller, K.; Vaughan, D. dplyr: A Grammar of Data Manipulation, R package version 1.1.4; Comprehensive R Archive Network: Vienna, Austria, 2023; Available online: https://dplyr.tidyverse.org/authors.html (accessed on 1 September 2026).
- Lee, S.; Cook, D.; Lawrence, M. Plyranges: A grammar of genomic data transformation. Genome Biol. 2019, 20, 4. [Google Scholar] [CrossRef] [Scilit] [PubMed]
- Brent, R.P. Algorithms for Minimization Without Derivatives; Dover Publications: Mineola, NY, USA, 2002; pp. x, 195 p. [Google Scholar]
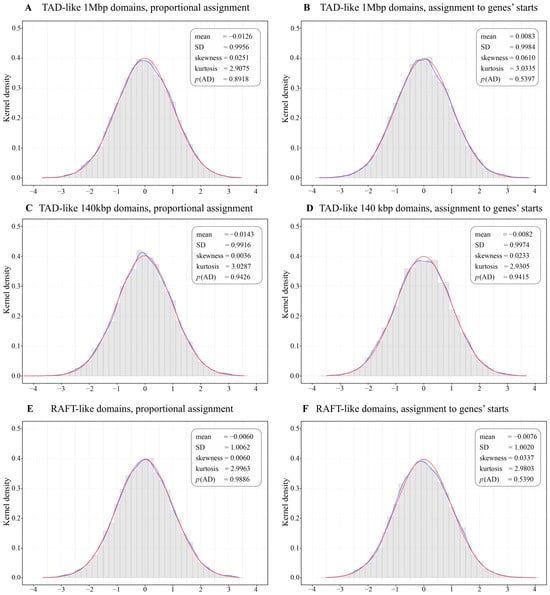
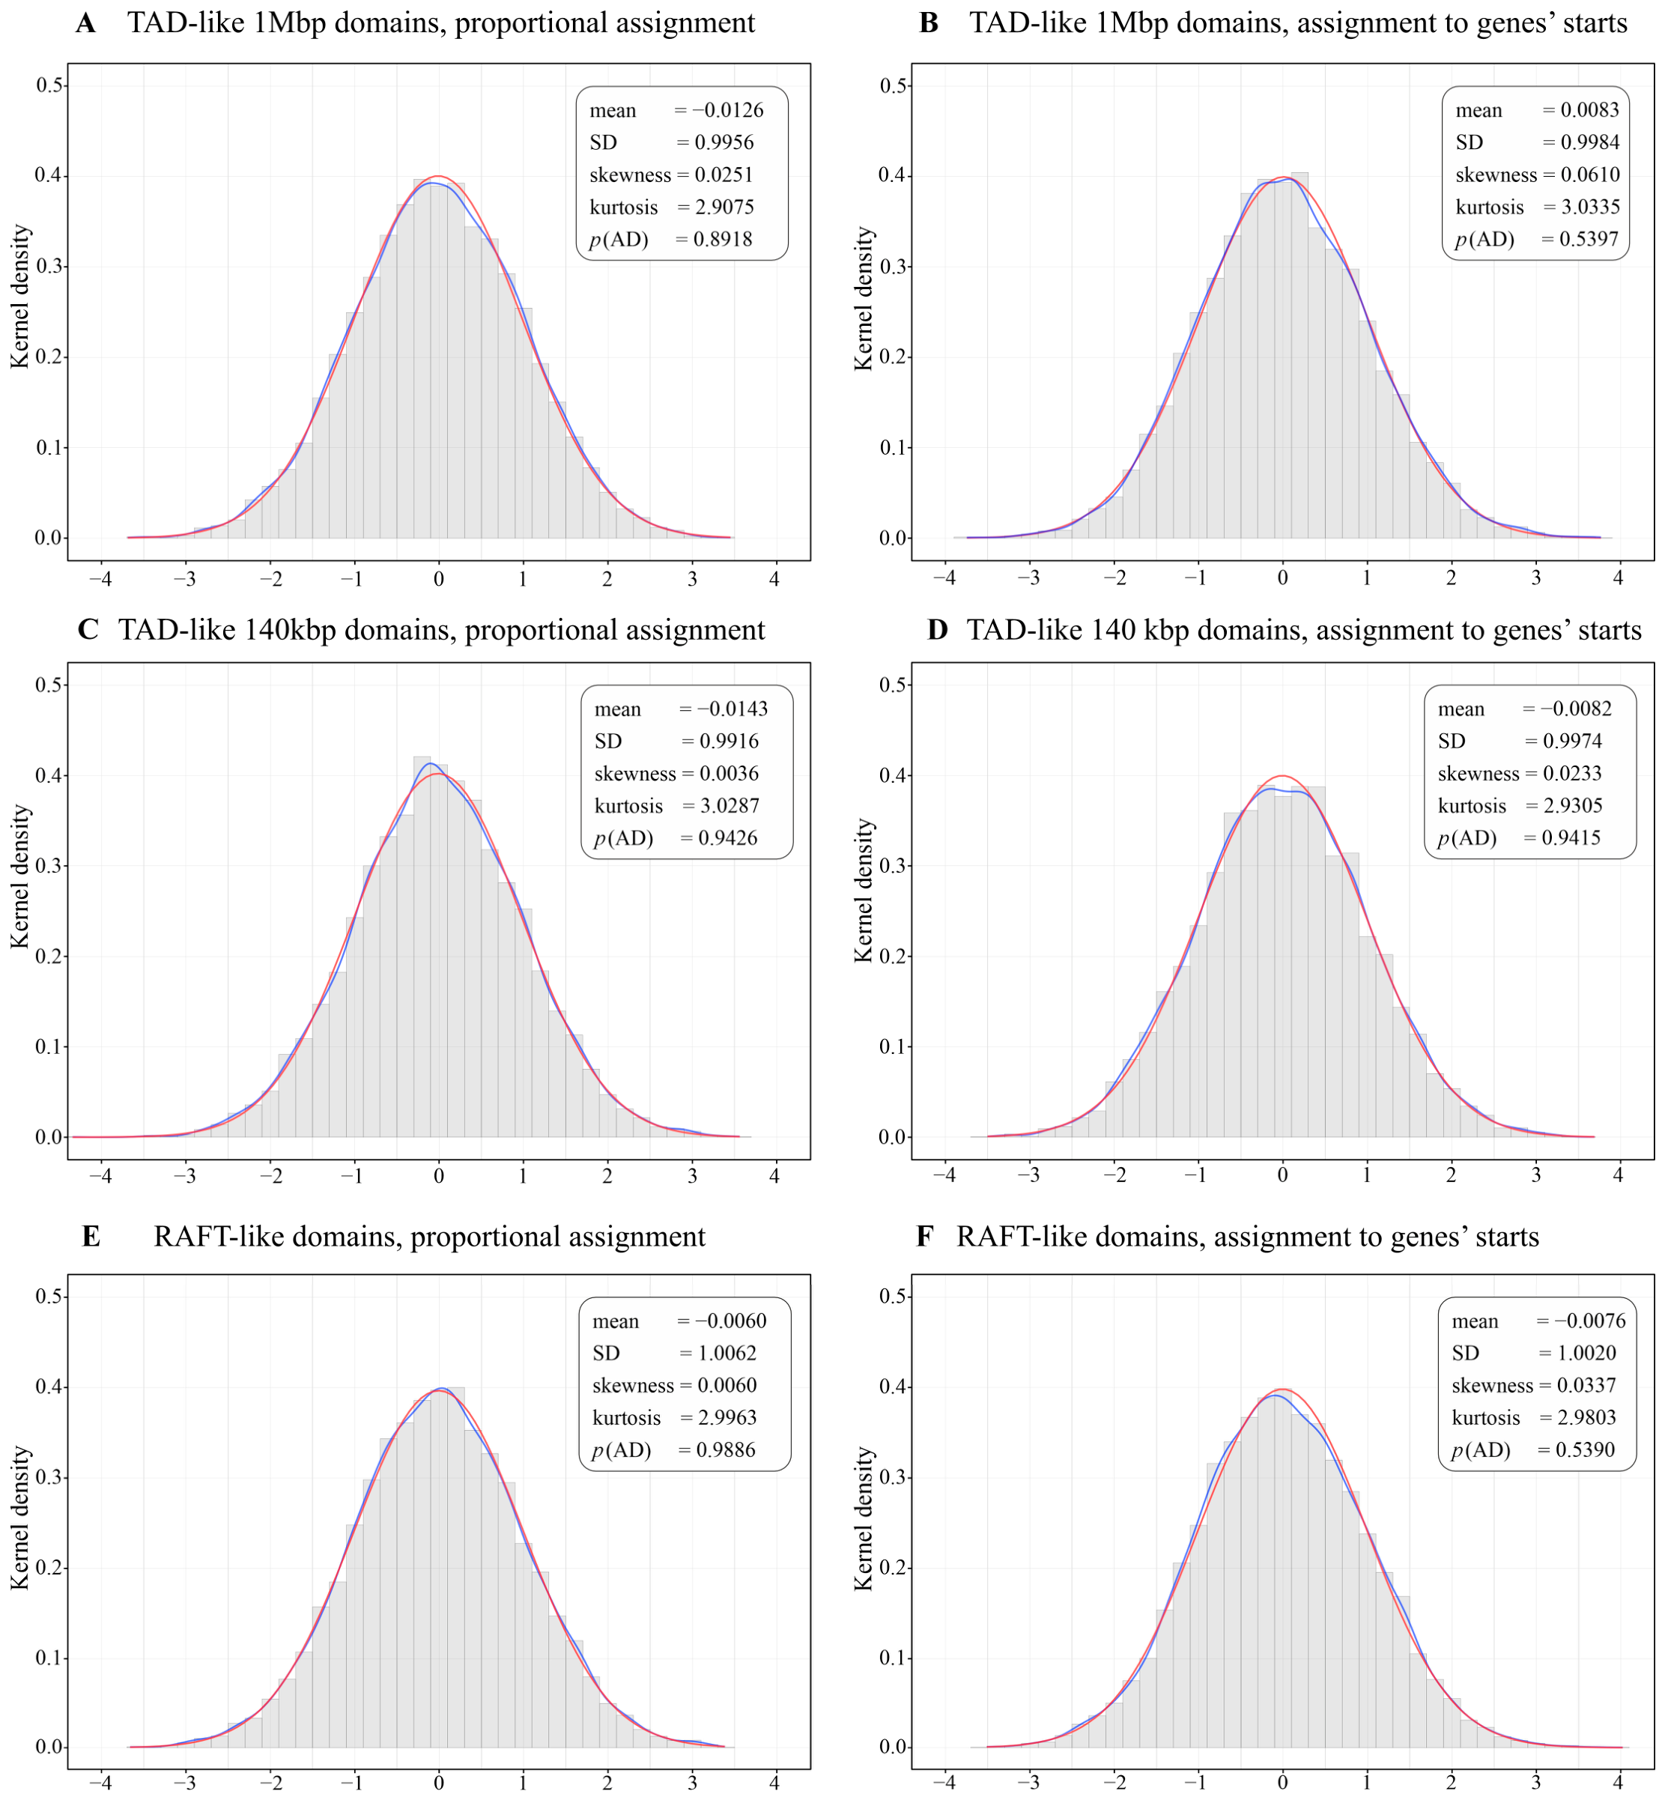

Disclaimer/Publisher’s Note: The statements, opinions and data contained in all publications are solely those of the individual author(s) and contributor(s) and not of MDPI and/or the editor(s). MDPI and/or the editor(s) disclaim responsibility for any injury to people or property resulting from any ideas, methods, instructions or products referred to in the content. |
© 2026 by the authors. Licensee MDPI, Basel, Switzerland. This article is an open access article distributed under the terms and conditions of the Creative Commons Attribution (CC BY) license.