


Abstract
This study aimed to investigate the integrated in vivo impact of progressive high altitude on metabolic, inflammatory, and vascular adaptation pathways and to assess their modulation by biological sex and anthropometric profile. A Himalayan expedition was conducted with fifteen volunteers (nine men, six women; age 43 ± 15 years; body mass index (BMI) of 24.2 ± 3.70 kg/m2). Participants received acetazolamide (250 mg/day). Blood samples were collected before (50 m above sea level), during (1400 m and 5000 m), and after the Himalayan trip (return to 1400 m). Serum concentrations of Adipocyte Complement-Related Protein of 30 kDa (Adiponectin/Acrp30), C-Reactive Protein (CRP), Plasminogen Activator Inhibitor-1 (Serpin E1/PAI-1), Monocyte Chemoattractant Protein-1/chemokine (C-C motif) ligand 2 (MCP-1/CCL2), basic Fibroblast Growth Factor (bFGF), Insulin, Leptin, Macrophage Migration Inhibitory Factor (MIF) and Tumor Necrosis Factor alpha (TNF-α) were measured. Progressive exposure to high altitude induced significant activation of inflammatory pathways, documented by progressively increased serum levels, compared to baseline, of CRP, MCP-1, PAI-1, and TNF-α (all p < 0.05). Insulin increased significantly at maximum altitude (p = 0.032), with persistence during descent (p = 0.042). bFGF showed a biphasic trend. Leptin, adiponectin, and MIF changes did not reach statistical significance. A mixed repeated-measures ANOVA confirmed a significant main effect of altitude on insulin concentration (p = 0.005), on CRP (p = 0.009), on MCP-1 (p = 0.004), and on TNF-α levels (p < 0.001). However, no significant interaction of sex and BMI (Body Mass Index) with altitude was observed. Elevated CRP, MCP-1, PAI-1, and TNF-α persisted during descent, suggesting delayed resolution of the high-altitude-induced inflammatory response. These results show that progressive high altitude induces systemic inflammation and hyperinsulinemia, which persist during descent, providing new insights into the relationship between altitude-induced inflammatory pathways and insulin dynamics.
Keywords:
high-altitude exposure; inflammation; hyperinsulinemia; CRP; MCP-1; PAI-1; TNF-α; insulin; adiponectin; leptin 1. Introduction
Exposure to hypobaric hypoxia elicits multisystemic physiological responses in the human body to ensure survival despite the reduced availability of oxygen. The processes through which the body adapts to the reduced partial pressure of inspired oxygen (PiO2) are collectively referred to as acclimatisation [1], with acute and immediate compensatory mechanisms (which occur within a few seconds to a few hours after exposure) and chronic adaptive changes that develop over days or weeks at high altitude [1,2,3].
Hypoxia-inducible factor (HIF) is a key transcriptional regulator of the cellular response to hypoxia. It is a heterodimer composed of the HIF-1α and HIF-1β/ARNT subunits, the latter of which is constitutively expressed [4]. Under normoxic conditions, the cytoplasmic half-life of HIF-1α is extremely short as it undergoes a hydroxylation reaction catalysed by prolyl hydroxylase enzymes (Prolyl Hydroxylase Domain proteins, PHD); hypoxia reduces the enzymatic activity of PHDs, therefore stabilising HIF-1-α. The stabilized subunit then translocates to the nucleus, where HIF recognises specific consensus DNA sequences known as hypoxia response elements (HREs), located in the promoter or enhancer regions of target genes [4]. Through this molecular pathway, HIF stimulates the transcription of genes involved in cellular adaptation to hypoxia [5].
A previous study reported changes in inflammatory markers following exercise at high altitude, including an increase in C-Reactive Protein (CRP) and Interleukin-6 (IL6) concentration 20 h after exercise [6].
In two cohorts of subjects exposed to altitudes of 3458 m and 3647 m above sea level, respectively, acute high-altitude exposure was associated with systemic inflammatory activation, evidenced by significant increases in IL6, interleukin-1 receptor antagonist (IL-1ra), and CRP [7].
Hypoxia and inflammation are closely interrelated and regulated by HIF and the Nuclear Factor kappa-light-chain-enhancer of activated B cells (NF-κB), with HIF and NF-κB sharing common regulatory elements [8]. Stabilisation of HIF-1α during hypoxia, together with activation of the NF-κB/HIF-1α axis, exerts profound effects on adipose tissue, altering its endocrine function, insulin sensitivity, and inflammatory profile [9]. Reduced oxygen availability may impair adipocyte insulin sensitivity through direct and indirect mechanisms. The HIF-1α-mediated glycolytic switch increases lactate production, which has been associated with insulin resistance not only in adipocytes but also in skeletal muscle tissue [9]. Activation of the NF-κB/HIF-1α axis also stimulates Monocyte Chemoattractant Protein-1 (MCP-1) release by adipocytes, resulting in macrophage recruitment into the adipose tissue, which in turn is responsible for releasing MCP-1. Inflammatory adipose tissue is also characterised by increased release of IL-6, Tumor Necrosis Factor alpha (TNF-α), Macrophage Migration Inhibitory Factor (MIF), and Plasminogen Activator Inhibitor-1 (PAI-1) [10,11,12], all NF-κB-induced pro-inflammatory mediators that contribute to the development of insulin resistance, in part through inhibitory effects on Insulin Receptor Substrate 1 (IRS1) gene [13].
Adipose tissue hypoxia has also been associated with impaired synthesis and release of adipokines, contributing to insulin resistance and a sustained pro-inflammatory state. Studies have documented reduced adiponectin secretion [10,11], a hormone with anti-inflammatory and insulin-sensitising effects. Conversely, leptin levels released by hypoxic adipocytes have been shown to be higher than those released under normoxic conditions [9]. Leptin promotes NF-κB activation, pro-inflammatory cytokine production [14], macrophage recruitment, and their polarization toward the M1 phenotype [15,16], contributing to adipocyte dysfunction and the amplification of local and systemic inflammation.
In recent years, interest has increased in the molecular mechanisms linking the effects of hypoxia on the inflammatory response and on systemic energy metabolism. Evidence from studies on these molecular pathways in adipose tissue shows that adipocyte hypoxia is one of the primary driving forces behind the metabolic alterations and inflammatory complications associated with conditions such as obesity [9].
Previous in vivo studies in humans have demonstrated that exposure to hypobaric hypoxia represents a potent pro-inflammatory stimulus, while other studies have investigated the effects of high-altitude exposure on individual metabolic mediators. However, inflammatory and metabolic responses have often been investigated separately, and an integrated in vivo characterization of the interplay between these two components during high-altitude exposure is still lacking. This study therefore aimed to evaluate and characterise in vivo the integrated impact of progressive high-altitude exposure on metabolic biomarkers, systemic inflammatory status, and growth factors involved in vascular adaptation during a high-altitude expedition involving 15 volunteers (9 men, 6 women). We also explored whether these responses differed according to biological sex and anthropometric profile. For this purpose, participants were monitored longitudinally from sea level at 50 m up to an altitude of 5000 m above sea level and during descent. By evaluating gradual exposure to altitude, the study aimed to map the kinetics of the investigated variables to their reference physiological domains.
2. Results
Fifteen participants (mean age 43 ± 15 years, BMI 24.2 ± 3.7 kg/m2) were included in the analysis (Table 1). Blood samples were collected at four time points: baseline (50 m), mid-altitude ascent (1400 m), high altitude (5000 m), and descent to 1400 m.
Table 1.
Anthropometric characteristics of study subjects.
2.1. Inflammatory Markers
A significant increase in systemic inflammation was observed during the expedition.
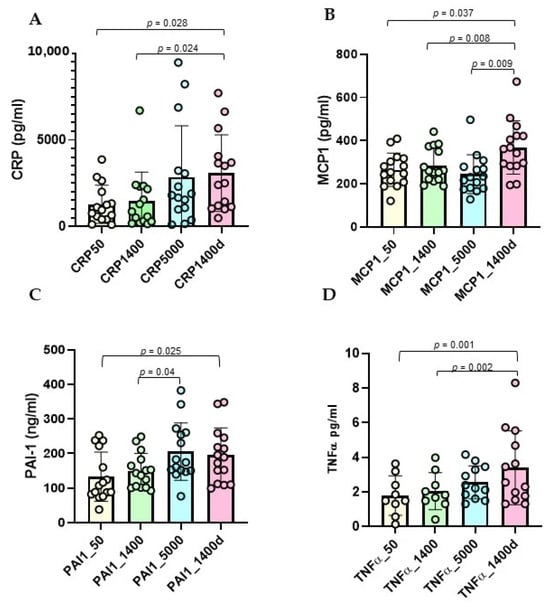
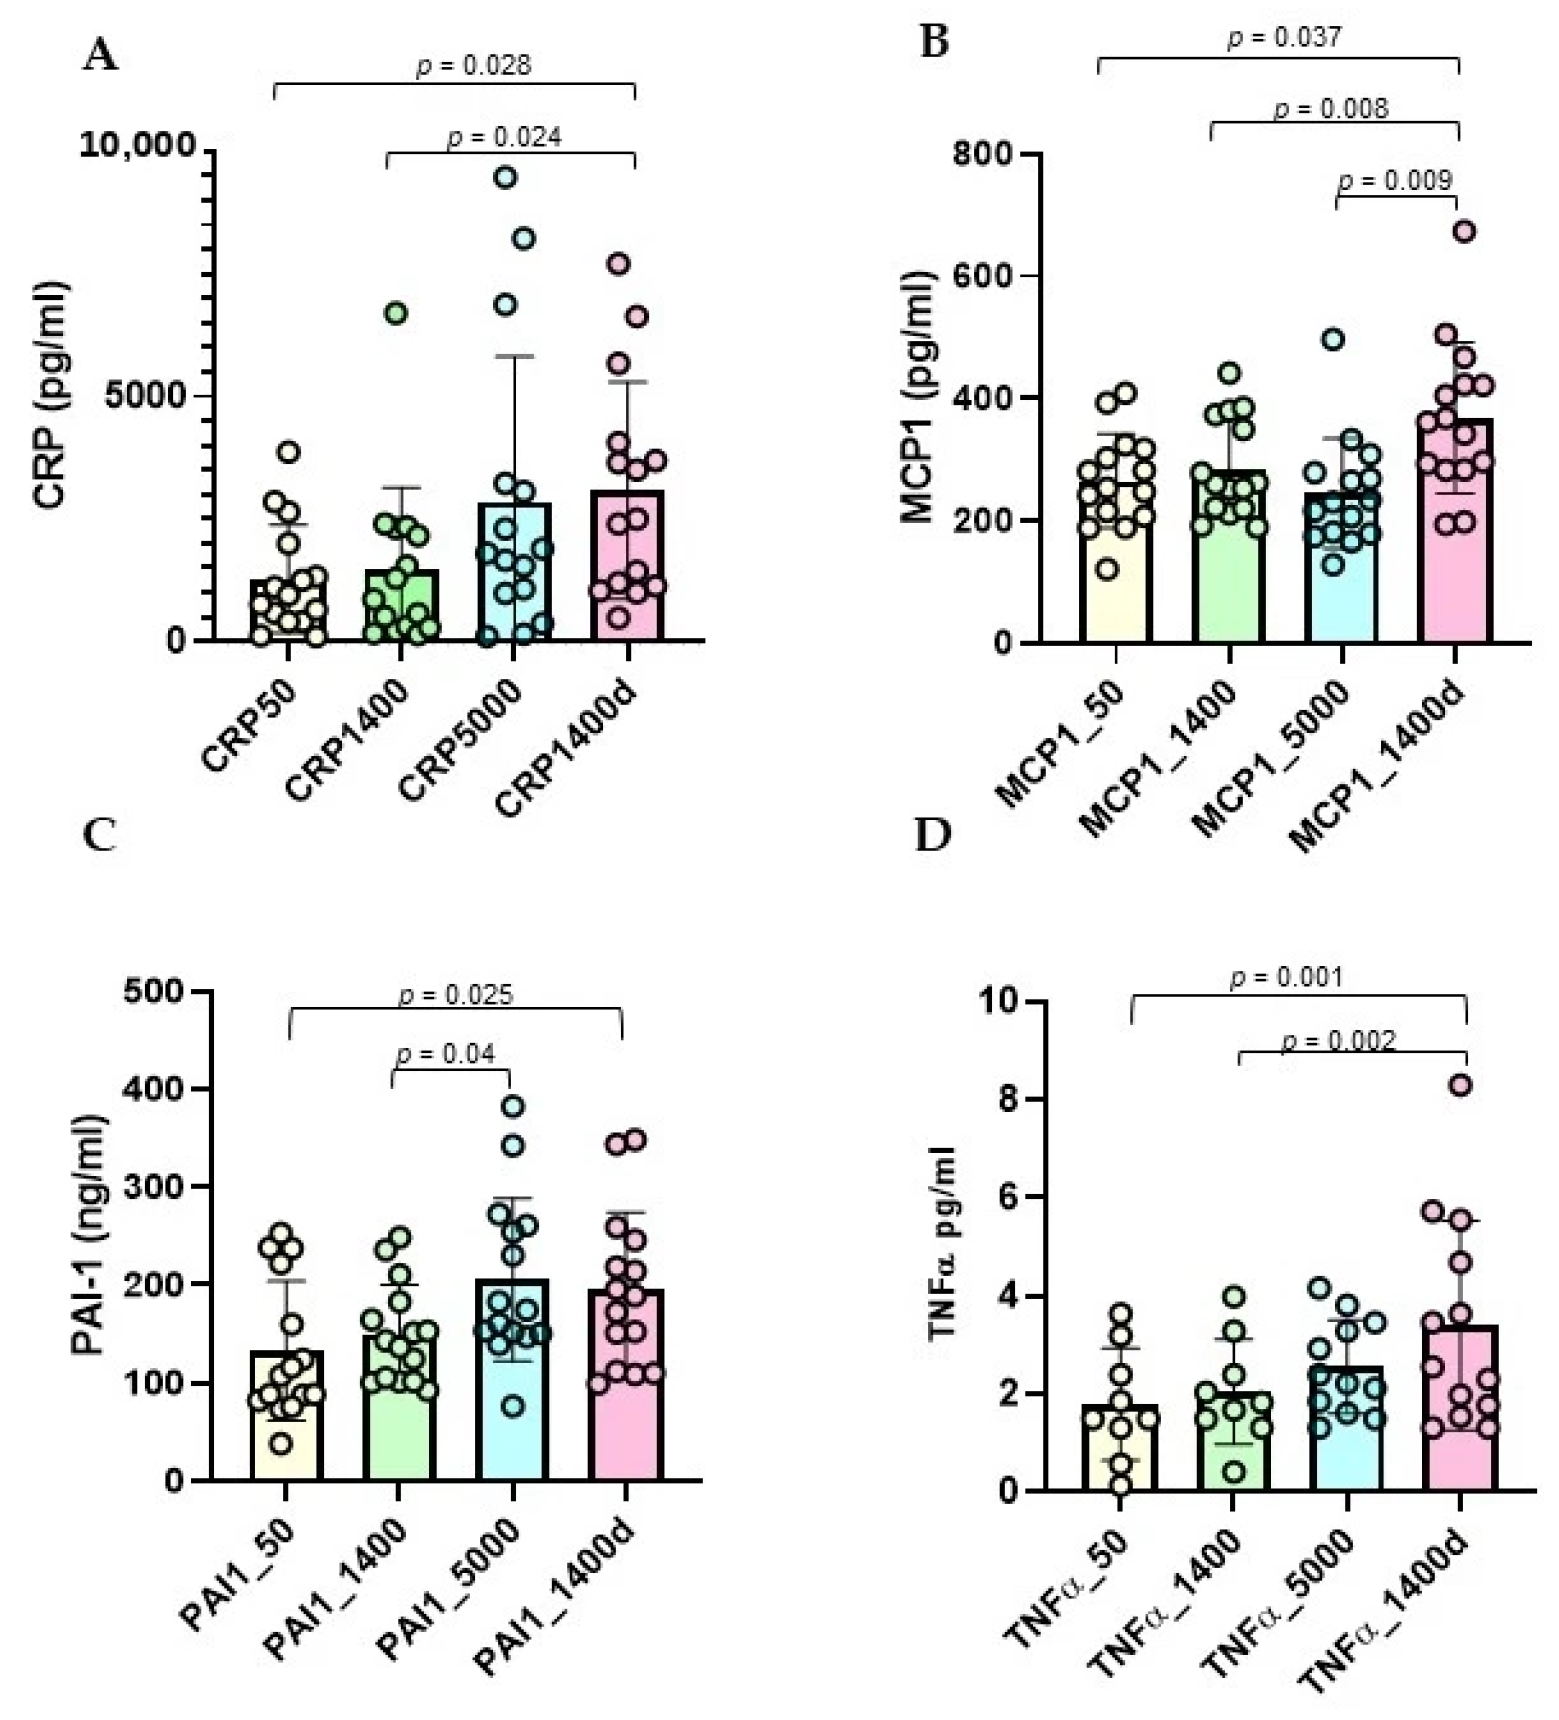
CRP levels progressively increased from baseline (1271.8 ± 1104.2 pg/mL) to 5000 m (2853.5 ± 2955.8 pg/mL) and remained elevated after descent to 1400 m (3076.5 ± 2215.8 pg/mL) (Figure 1A). One-way repeated-measures ANOVA analysis with post hoc comparisons showed significant increases between baseline and descent (p = 0.028) and between 1400 m and descent (p = 0.024).
Figure 1.
Longitudinal trend of inflammatory marker concentrations at various time points during the expedition: 50 m (baseline), 1400 m (ascent), 5000 m, and 1400d m (descent). (A) CRP, (B) MCP1, (C) PAI-1 (D) TNF-α. Individual data points are overlaid on the bars, with each circle representing one participant. Bars represent mean ± SD.
MCP-1 levels significantly changed over time with a notable increase during descent (367.9 ± 123.5 pg/mL) (Figure 1B). Post hoc comparisons following one-way repeated-measures ANOVA showed significant differences between baseline and descent (264.9 ± 77.6 vs. 367.9 ± 123.5 pg/mL, p = 0.037), between mid-altitude ascent measurement and descent (284.9 ± 80.3 pg/mL, p = 0.008), and between 5000 m and descent (244.6 ± 89.9 pg/mL, p = 0.009).
PAI-1 concentrations also showed a significant progressive increase across altitudes (Figure 1C). Compared with baseline (133.0 ± 71.0 ng/mL), no significant change was observed at 1400 m (150.3 ± 50.3 ng/mL, p = 0.191), whereas PAI-1 levels were significantly higher after return to mid-altitude condition at 1400 m (194.9 ± 79.4 ng/mL, p = 0.025). PAI-1 levels were also significantly higher at 5000 m than at 1400 m (205.5 ± 83.3 vs. 150.3 ± 50.3 ng/mL, p = 0.04).
Post hoc comparisons for TNF-α following one-way repeated-measures ANOVA showed no significant difference between baseline (50 m) and 1400 m (p = 0.290) (Figure 1D). In contrast, TNF-α levels were significantly increased after return to 1400 m (3.4 ± 2.1 pg/mL, p = 0.001) compared with baseline. Moreover, TNF-α concentrations after return to 1400 m were significantly higher than at first ascent to 1400 m (2.1 ± 1.1 pg/mL, p = 0.002), suggesting a sustained inflammatory response following high-altitude exposure. No significant differences were observed between baseline and 5000 m (p = 0.065), between 1400 m and 5000 m (p = 0.074), or between 5000 m and return to 1400 m (p = 0.209).
No statistically significant changes between groups comparing the four altitude time points were observed for MIF (Supplementary Figure S1A).
2.2. Metabolic Markers
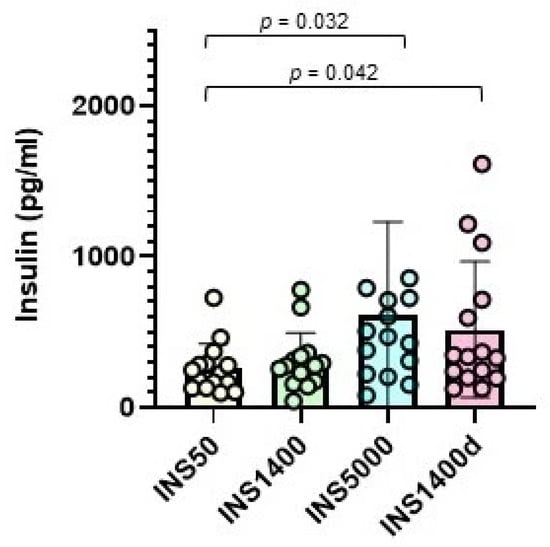
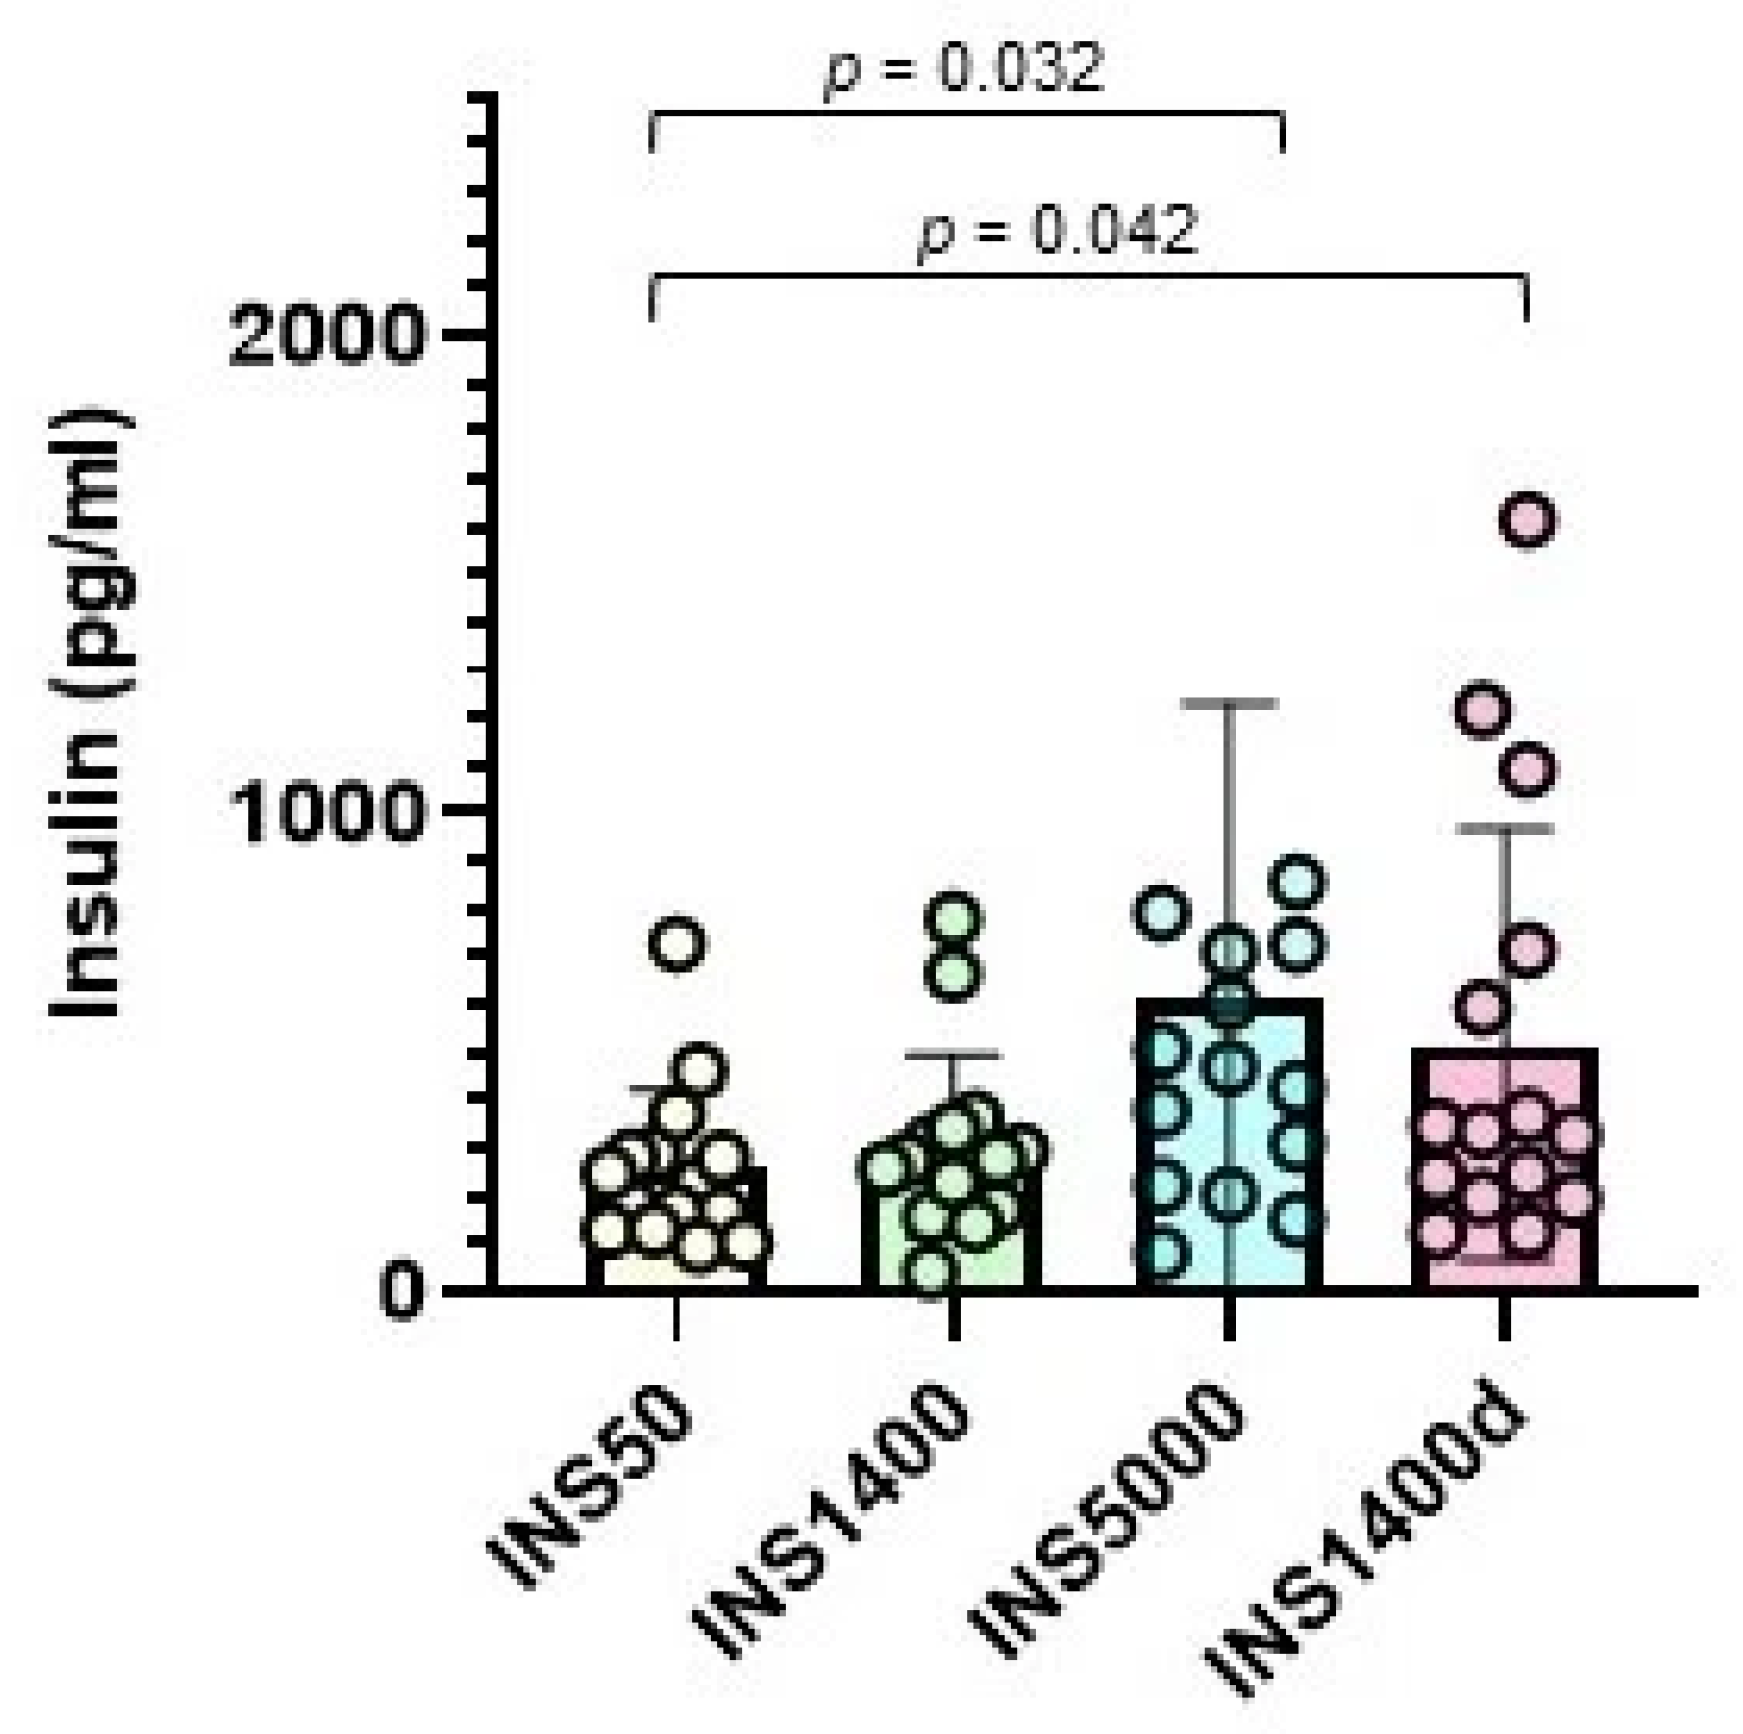
Circulating insulin levels increased during high-altitude exposure (Figure 2). Repeated-measures ANOVA with post hoc comparisons showed that compared with baseline (50 m), insulin levels were significantly higher at 5000 m (mean values 257.5 ± 165.7 vs. 608.5 ± 623.7 pg/mL, p = 0.032) and remained elevated at 1400 m after descent (516.3 ± 451.5 pg/mL, p = 0.042). No difference was observed between 5000 m and after descent (p = 0.691), suggesting persistence of the insulin response after return from extreme altitude. Thus, exposure to high altitude induced a significant increase in circulating insulin concentrations, with the highest values observed at 5000 m.
Figure 2.
Longitudinal trend of insulin concentrations at various time points during the expedition: 50 m (baseline), 1400 m (ascent), 5000 m, and 1400d m (descent). Individual data points are overlaid on the bars, with each circle representing one participant. Bars represent mean ± SD.
One-way repeated-measures ANOVA showed no statistically significant changes in circulating adiponectin or leptin levels across the four time points, suggesting no major modulation of these adipokines in response to high altitude (Supplementary Figures S1B and S1C, respectively).
2.3. Growth Factors
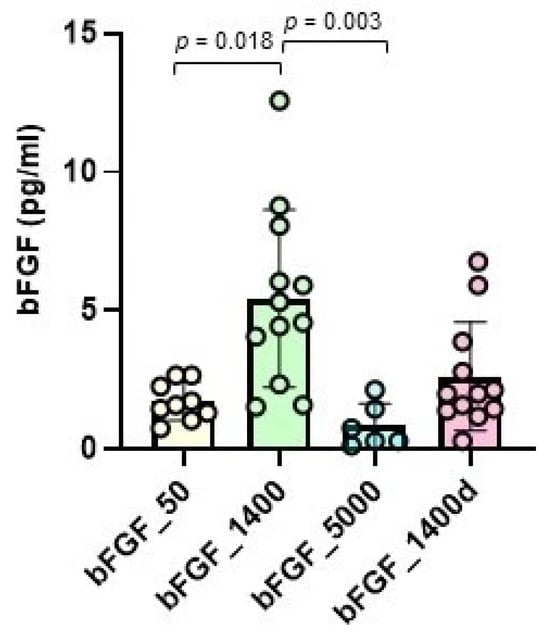
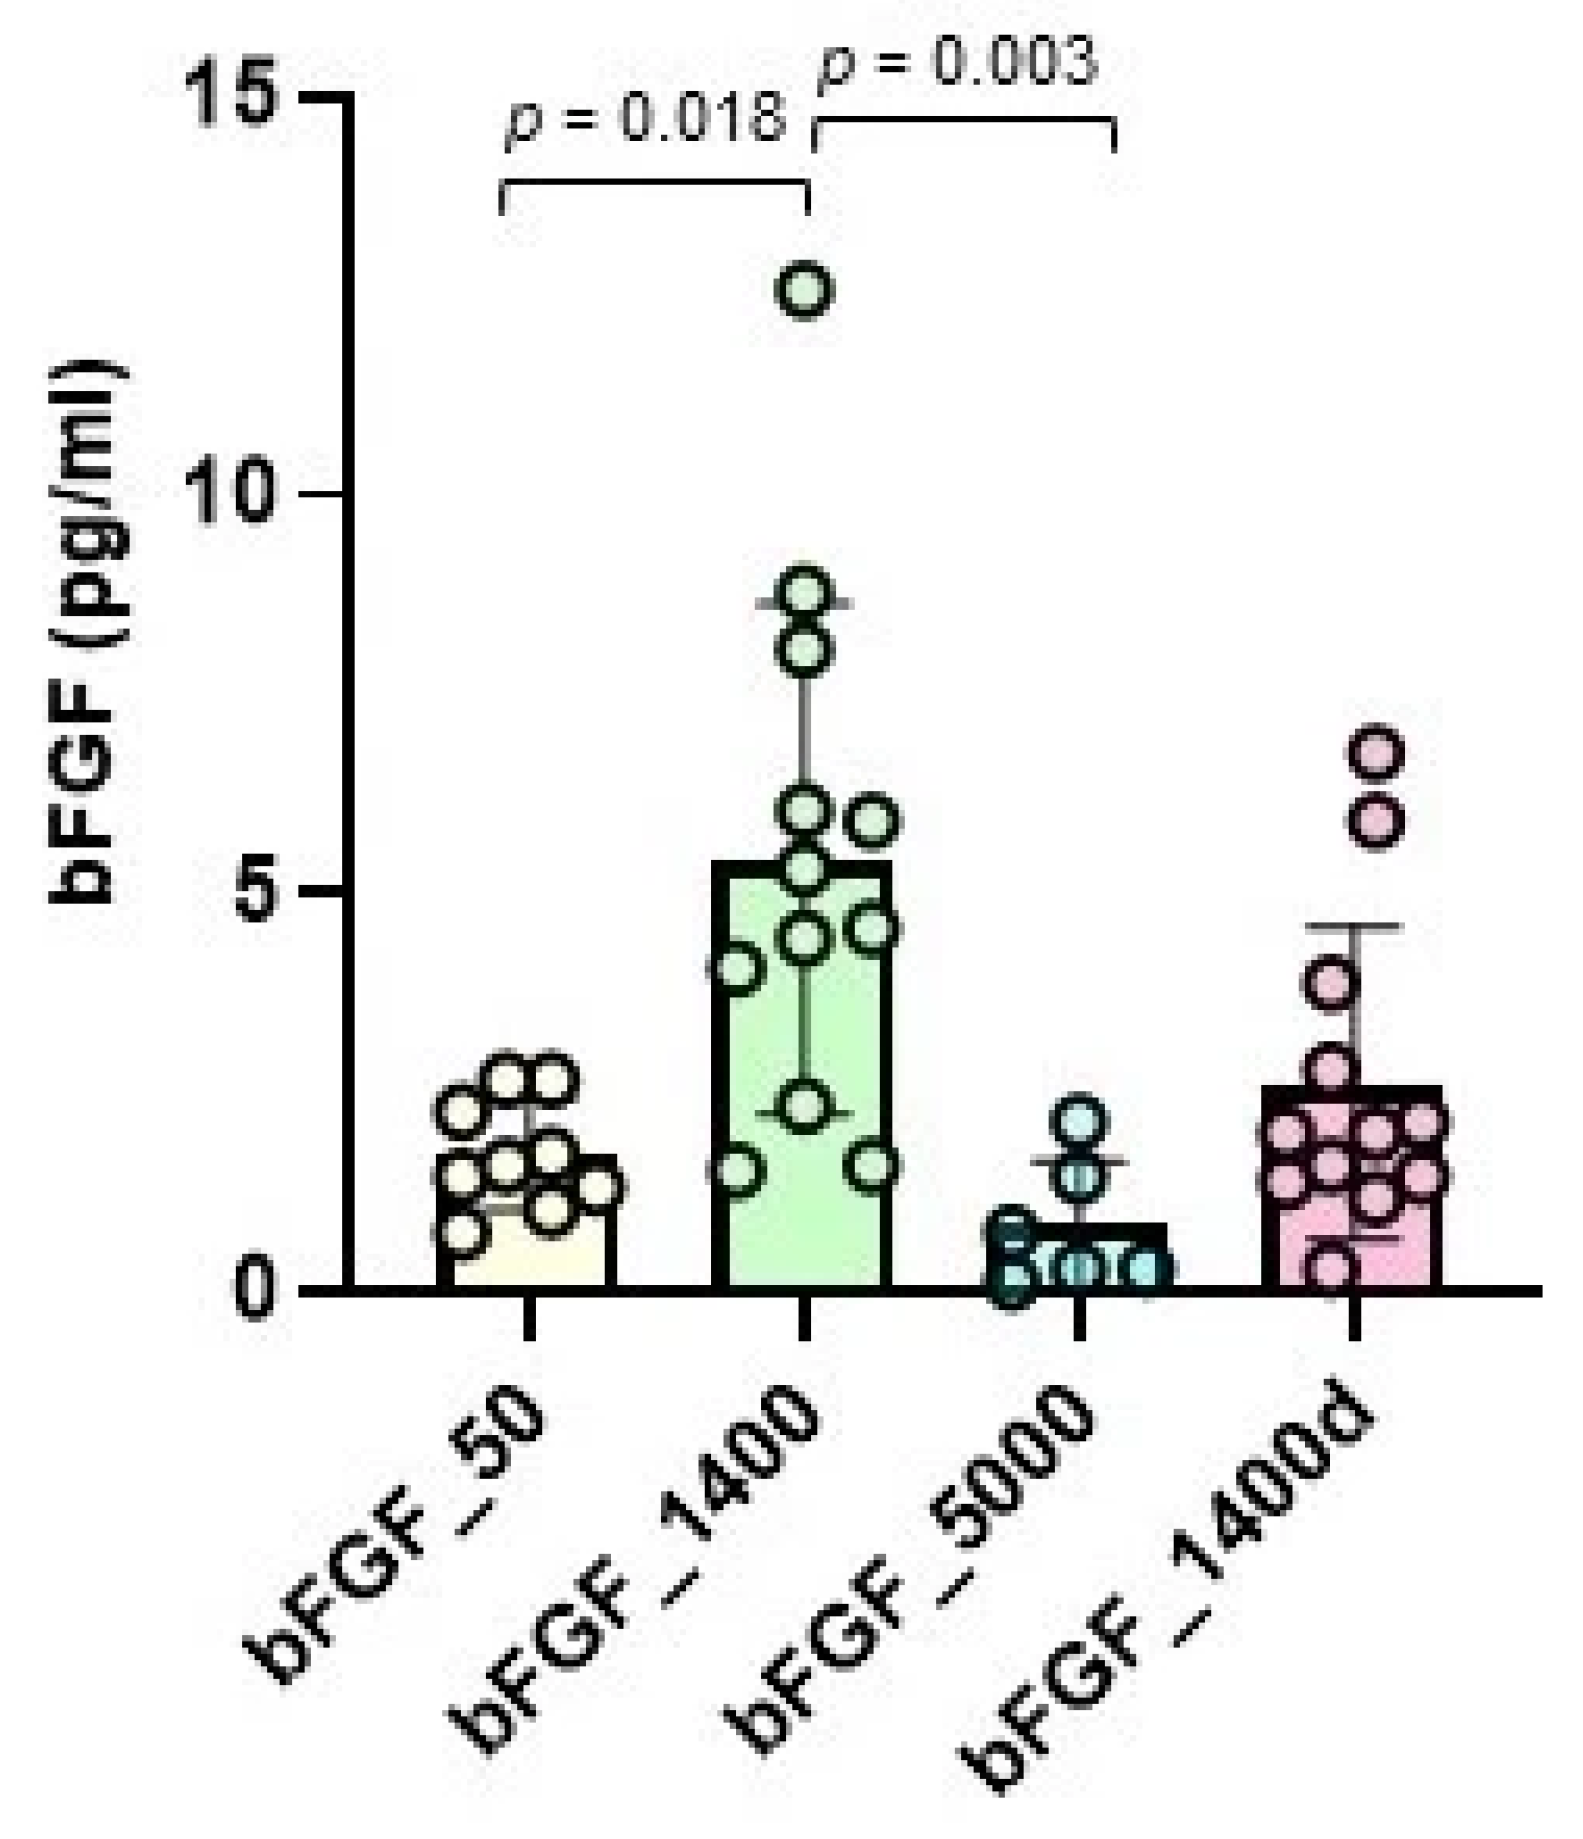
bFGF levels showed significant fluctuations during the expedition (Figure 3). Post hoc comparisons following one-way repeated-measures ANOVA showed that compared to the baseline at 50 m (1.72 ± 0.68 pg/mL), bFGF concentrations increased at 1400 m during ascent (5.44 ± 3.20 pg/mL; p = 0.018), then decreased at the maximum altitude of 5000 m (0.84 ± 0.80 pg/mL, p = 0.028) and rose again during the descent phase at 1400 m although not statistically significant (2.62 ± 1.96 pg/mL, p = 0.137).
Figure 3.
Longitudinal changes in bFGF concentrations at various time points during the expedition: 50 m (baseline), 1400 m (ascent), 5000 m, and 1400d m (descent). Individual data points are overlaid on the bars, with each circle representing one participant. Bars represent mean ± SD.
2.4. Correlation Analyses
Correlation analyses were performed to investigate the relationship between anthropometric parameters and metabolic and inflammatory biomarkers during high-altitude exposure.
Baseline CRP levels were strongly associated with age (r = 0.78, p = 0.001) and BMI (r = 0.62, p = 0.012) at baseline (Supplementary Figure S2A). Significant positive correlations were also observed between CRP and BMI (r = 0.64, p = 0.010) and with waist-to-height ratio at 5000 m (r = 0.58, p = 0.023) (Supplementary Figure S2B).
At baseline, insulin levels were positively associated with BMI (r = 0.59, p = 0.018) and waist-to-height ratio (r = 0.61, p = 0.016), even if these correlations were weaker and no longer statistically significant during altitude exposure (Supplementary Figure S2C). These findings suggest that baseline insulin levels are associated with adiposity-related traits, while altitude exposure may partially uncouple insulin regulation from anthropometric determinants.
No significant correlations were observed between PAI-1 levels and anthropometric parameters at baseline. However, during altitude exposure, PAI-1 concentrations were strongly associated with adiposity indices. At 1400 m, PAI-1 levels correlated positively with BMI (r = 0.72, p = 0.002) and waist-to-height ratio (r = 0.74, p = 0.001) (Supplementary Figure S2D). Similar associations were observed after descent to mid-altitude conditions at 1400 m (BMI: r = 0.62, p = 0.013; waist-to-height ratio: r = 0.64, p = 0.010) (Supplementary Figure S2E).
2.5. Effect of Body Weight Status on Inflammatory and Metabolic Responses
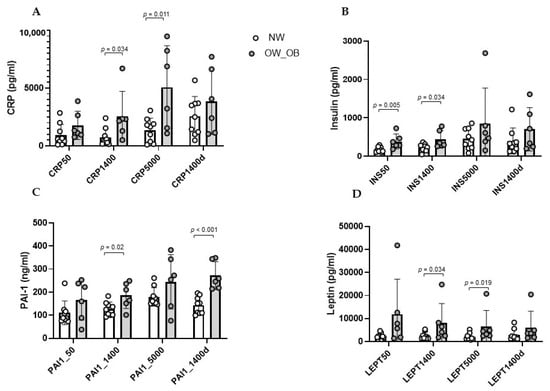
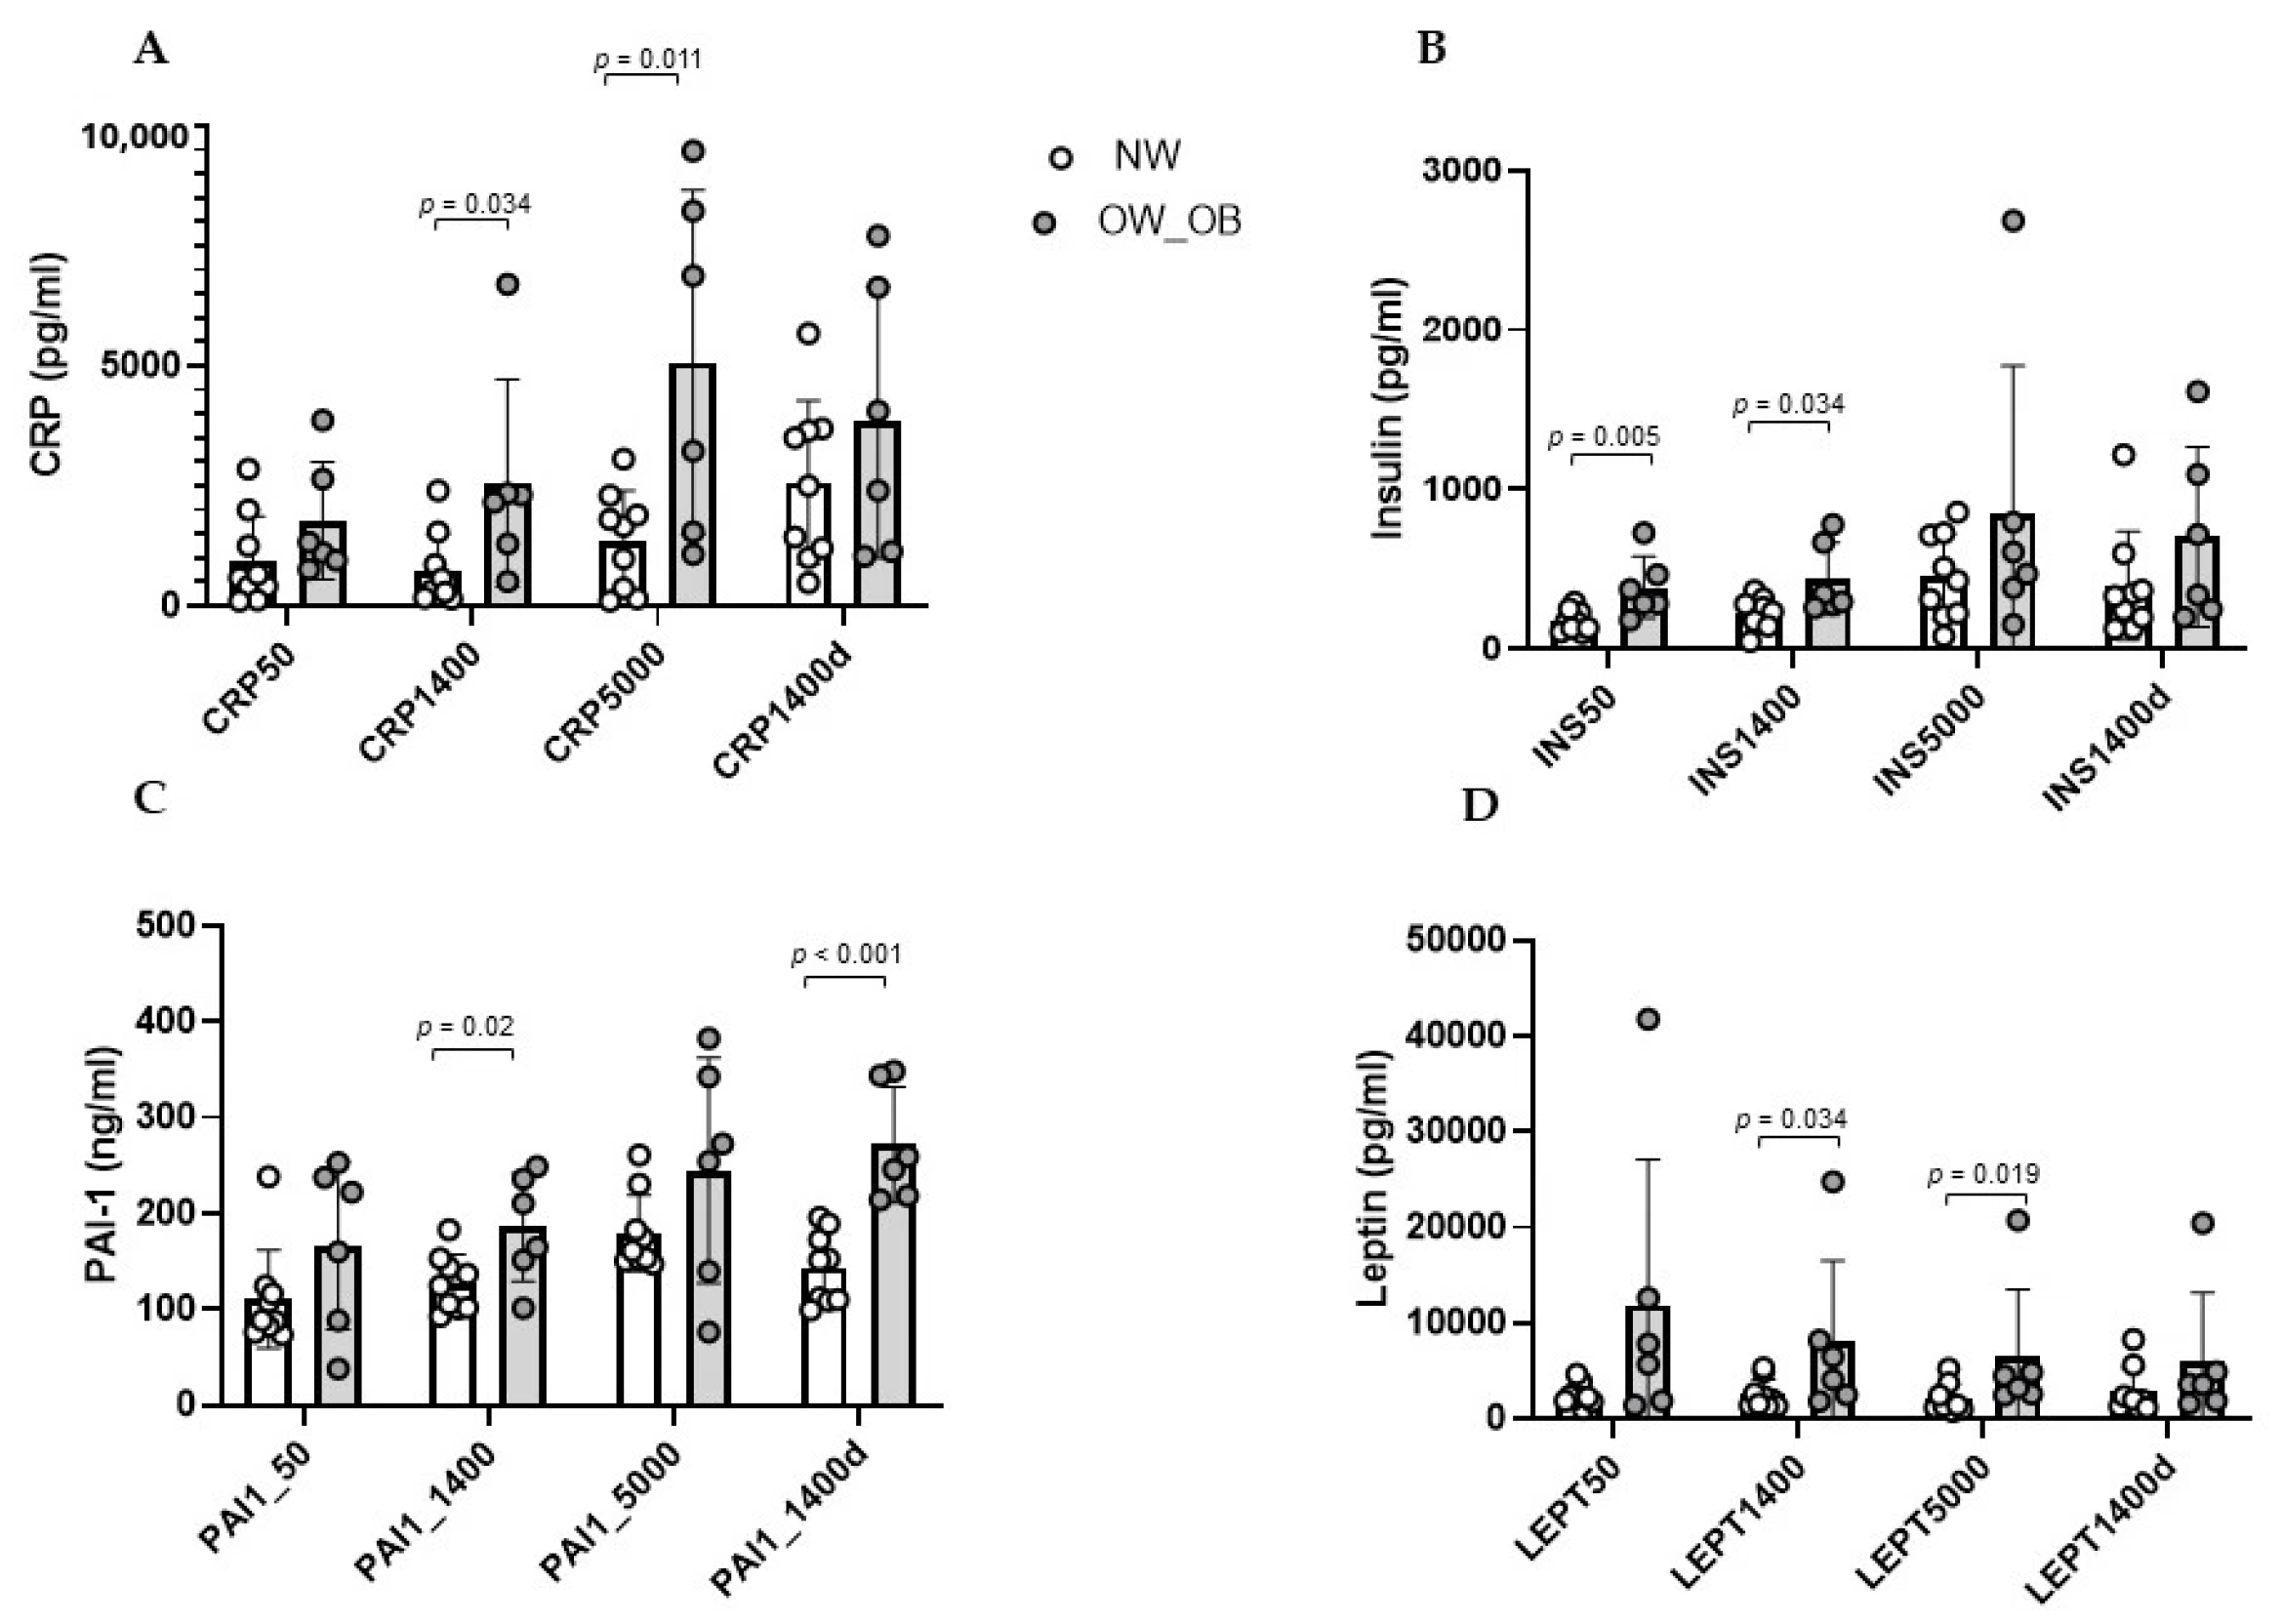
Body weight status significantly influenced several inflammatory and metabolic biomarkers, although the magnitude and persistence of these effects differed across markers. CRP concentrations were higher in overweight/obese participants than in normal-weight subjects at 1400 m (2556.7 ± 2153.6 vs. 725.4 ± 773.8 pg/mL; p = 0.034) and 5000 m (5074.9 ± 3590.0 vs. 1372.5 ± 1032.8 pg/mL; p = 0.011) (Figure 4A). Repeated-measures ANOVA showed a significant effect of altitude on circulating CRP concentrations (F = 4.471, p = 0.009, partial η2 = 0.256), but no significant altitude × BMI interaction was observed (F = 1.331, p = 0.278, partial η2 = 0.093), suggesting that the temporal pattern did not differ significantly between BMI groups.
Figure 4.
Effect of body weight status on inflammatory and metabolic responses during high-altitude exposure. Bars represent mean ± SD. White bars indicate normal-weight participants, whereas grey bars indicate overweight/obese participants. Individual participant values are superimposed as individual dots. Measurements were obtained at 50 m, 1400 m, 5000 m, and after return to 1400 m (1400d descent). (A) CRP, (B) insulin, (C) PAI-1, and (D) leptin.
The insulin response showed a distinct and potentially relevant pattern. Insulin concentrations were significantly higher in overweight/obese participants at baseline (383.9 ± 193.4 vs. 173.2 ± 68.2 pg/mL; p = 0.005) and at 1400 m (435.4 ± 227.0 vs. 217.7 ± 98.5 pg/mL; p = 0.034), consistent with the expected metabolic phenotype associated with excess body weight (Figure 4B). However, this difference was no longer statistically significant at 5000 m and after returning to 1400 m. Importantly, altitude significantly affected circulating insulin concentrations overall (F = 4.243, p = 0.011, partial η2 = 0.246), whereas no significant altitude × BMI interaction was detected (F = 0.250, p = 0.861, partial η2 = 0.019). Thus, although adiposity was associated with higher insulin concentrations at lower altitude, the insulin response to progressively higher altitude was not significantly modified by body weight status, and the baseline difference between groups was no longer evident at 5000 m.
PAI-1 concentrations were significantly higher in overweight/obese participants at 1400 m (185.5 ± 56.3 vs. 126.9 ± 29.9 ng/mL; p = 0.020) and after descent to 1400 m (271.8 ± 60.1 vs. 143.6 ± 37.2 ng/mL; p < 0.001) (Figure 4C). At 5000 m, PAI-1 levels were also numerically higher in overweight/obese subjects (244.8 ± 117.4 vs. 179.3 ± 40.1 ng/mL), although the difference did not reach statistical significance. Repeated-measures analysis confirmed significant effects of both altitude (F = 6.225, p = 0.008, partial η2 = 0.324) and BMI (p = 0.011), with no significant altitude × BMI interaction (F = 1.079, p = 0.350, partial η2 = 0.077).
Leptin concentrations were significantly higher in overweight/obese participants at 1400 m (8022.2 ± 8577.1 vs. 2551.0 ± 1547.6 pg/mL; p = 0.034) and 5000 m (6423.9 ± 7103.5 vs. 2101.6 ± 1500.2 pg/mL; p = 0.019) (Figure 4D). However, altitude did not significantly affect leptin concentrations overall (F = 2.606, p = 0.065, partial η2 = 0.167), and no significant altitude × BMI interaction was observed (F = 1.324, p = 0.280, partial η2 = 0.092).
MCP-1 and adiponectin levels did not differ significantly according to BMI, despite a significant overall effect of altitude on MCP-1 concentrations (F = 5.731, p = 0.009, partial η2 = 0.306).
Overall, these findings indicate that excess body weight was associated with a persistent pro-inflammatory and pro-thrombotic phenotype, characterised by higher CRP and PAI-1 concentrations, together with higher leptin levels. The between-group difference in insulin concentrations was evident at baseline and 1400 m but was not statistically significant at 5000 m. The absence of a significant altitude × BMI interaction suggests that exposure to high altitude induced comparable longitudinal changes in insulin between the two BMI groups, potentially attenuating the metabolic differences associated with body weight status at extreme altitude.
2.6. Effect of Sex Status on Inflammatory and Metabolic Responses
A mixed repeated-measures ANOVA was also applied to investigate the effects of sex (between-subjects factor: Male vs. Female) and altitude exposure (within-subjects factor: altitude) on circulating marker levels.
The analyses showed a significant main effect of altitude on insulin (F = 4.953, p = 0.005, partial η2 = 0.276), CRP (F = 4.417, p = 0.009, partial η2 = 0.254), MCP-1 (F = 5.208, p = 0.004, partial η2 = 0.286) and TNF-α (F = 13.49, p < 0.001, partial η2 = 0.730) concentrations. However, no significant main effect of sex was observed, and the altitude × sex interaction was not significant for any of the variables analysed, indicating that no sex-related differences in the temporal patterns were detected in this sample.
3. Discussion
This study demonstrates that exposure to high altitude is associated with a significant activation of inflammatory pathways, accompanied by metabolic and growth factor alterations, while classical adipokines remain largely unchanged. The pattern observed suggests a high altitude-driven systemic response with delayed resolution during descent.
3.1. Inflammatory Biomarkers Remain Elevated During Descent to Lower Altitude
The progressive increase in CRP, PAI-1, and MCP-1, with peak or sustained elevation during descent, supports the presence of a systemic inflammatory response associated with the expedition at high altitude. This is consistent with previous studies showing that high-altitude exposure triggers innate immune activation and cytokine release, mediated in part by hypoxia-inducible factors (HIFs) [17], and that a previous high-altitude trek was also associated with an acute oxy-inflammatory outbreak [18].
The marked increase in MCP-1 after the high-altitude trek is noteworthy. MCP-1 is a key chemokine involved in monocyte recruitment and vascular inflammation, and its higher concentration during descent suggests a prolonged immune activation beyond the high-altitude exposure itself. This phenomenon is consistent with evidence of increased MCP-1 levels following reperfusion of ischemic tissue [19]. Therefore, the increase in MCP-1 observed during high-altitude exposure in this study is consistent with in vitro findings showing the transcriptional activation of MCP-1 in response to the HIF-1α/NF-κB axis [20] and suggests the activation of an inflammatory response at high altitude in vivo, which is amplified during the relative reoxygenation phase.
CRP levels showed a statistically significant increase with increasing altitude, peaking during the descent phase, confirming high altitude as a potent systemic pro-inflammatory stimulus in vivo. These data are consistent with those reported by Hartmann et al., who documented a significant increase in CRP in healthy participants exposed to high altitude [7]. The concurrent elevation of CRP and MCP-1 documented during descent is consistent with in vitro evidence of a role for CRP in stimulating MCP-1 expression in human endothelial cells [21]. These results suggest the emergence of a CRP-MCP-1-mediated inflammatory loop, which does not cease upon arrival at lower altitudes but exhibits slower resolution kinetics.
PAI-1 progressively increased with altitude, reaching significantly higher concentrations at 5000 m than at baseline and remaining elevated during descent. This pattern is consistent with in vitro evidence of increased PAI-1 production upon stimulation by HIF-1α and NF-κB [10,22]. To date, few studies have investigated the effects of high altitude on PAI-1 production in vivo through direct measurement. Magalhães et al. reported increased PAI-1 levels in mountaineers after a four-week expedition up to 7161 m, with concentrations remaining elevated 24 h after returning to sea level [23].
It is noteworthy that a similar pattern in the dynamics of MCP-1, which shares the HIF-1α and NF-κB signalling pathways with PAI-1, has been documented in this study, reinforcing the hypothesis of a sustained response of biomarkers known to be downstream targets of HIF-1α and NF-κB signalling pathways. However, direct mechanistic activation of these factors was not evaluated in the present study. Given the limited number of studies assessing serial PAI-1 measurements during high-altitude exposure, our data provide novel evidence on the temporal kinetics of this biomarker.
Interestingly, although no association between PAI-1 concentration and anthropometric parameters was detected at baseline, significant positive correlations with BMI and waist-to-height ratio were observed at 1400 m and persisted during the descent to mid-altitude conditions at 1400 m. Repeated-measures ANOVA further showed a significant main effect of BMI, indicating consistently higher PAI-1 concentrations in overweight/obese participants throughout the expedition, irrespective of altitude. The absence of a significant Altitude × BMI interaction suggests that altitude induced a comparable temporal pattern of PAI-1 changes in both BMI groups, while individuals with greater adiposity maintained overall higher circulating levels. This interpretation is in agreement with experimental evidence demonstrating that hypoxia upregulates PAI-1 expression and secretion in adipocytes and that obesity is characterized by chronic adipose tissue hypoxia, leading to increased PAI-1 production [9,10,12].
The gradual increase in TNF-α observed in this study is consistent with the findings reported by Nourkami-Tutdibi et al. in a cohort of 15 mountaineers exposed to progressive hypobaric hypoxia [24], supporting the concept that severe hypoxia induces a systemic pro-inflammatory response during high-altitude exposure. In our cohort, TNF-α concentrations remained significantly elevated after descent to 1400 m, suggesting that the inflammatory response persisted beyond the period of maximal high-altitude exposure. This finding may indicate that the inflammatory response does not immediately normalize following descent to a lower altitude and warrants further investigation in larger cohorts.
3.2. High-Altitude Exposure Is Associated with Persistent Hyperinsulinemia
A significant increase in insulin levels was observed, particularly at 5000 m, followed by a partial decline during the downward phase, while remaining at significantly high levels. This pattern may indicate the development of acute alterations in insulin metabolism. Elevated fasting insulin levels may reflect compensatory hyperinsulinemia in response to reduced insulin sensitivity, particularly in individuals with preserved pancreatic β-cell function, as in our study group. These findings are consistent with those reported by Larsen et al. in a cohort of eight healthy, normal-weight men (72 ± 2 kg) living at sea level. Following a rapid, passive ascent to an altitude of 4559 m above sea level, insulin levels increased after two days at high altitude (47 ± 9 pmol/L vs. 73 ± 14 pmol/L), with a documented reduction in insulin action consistent with a state of hypoxia-induced insulin resistance [25]. The relationship between hypoxia and insulin resistance is well documented, including in the context of adipose tissue hypoxia [26]. The study by Oltmanns et al. confirms that exposure to hypoxia leads to the development of insulin resistance, which persists even after hypoxic stress [27], consistent with the findings in the cohort of the present study.
Our findings are also consistent with those reported by Siervo et al., who observed increases in insulin and C-peptide during prolonged exposure to high altitude, together with changes in inflammatory and oxidative stress markers [28]. Collectively, these observations support the hypothesis that high-altitude exposure may be associated with altered glucose-insulin regulation, particularly with hyperinsulinemia, consistent with a possible reduction in insulin sensitivity. A direct measure of insulin sensitivity was not available in our study. However, fasting insulin concentrations were used as an indicator of altered insulin dynamics and an indirect surrogate marker of insulin resistance, as demonstrated by Yeni-Komshian H et al., who showed that estimates of insulin resistance appear to offer little advantage over fasting plasma insulin, particularly in a non-diabetic population [29].
Insulin concentrations remained elevated during descent, despite the reduction in altitude. Several mechanisms could potentially contribute. Hypoxia-related changes in insulin signalling and oxidative stress have been proposed as possible mechanisms [30,31]. HIF-dependent inhibition of the insulin signalling cascade may not normalise immediately with the reduction in hypoxia. Furthermore, prolonged exposure to severe hypoxia generates reactive oxygen species (ROS) that damage insulin signalling pathways [30], an effect that may persist beyond the normalisation of oxygen tension. As was recently stressed, hypoxia triggers insulin resistance as long as tissue oxygenation is reduced, but the detailed pathophysiological mechanisms that enable the implementation of this metabolic adaptation are not yet fully elucidated; this includes the timeline of HIF-1 stabilisation and the interrelationship between HIF-1, PPAR-γ, and PGC-1α, as well as the molecular mechanisms underlying the effects of PPAR-γ and PGC-1α [31]. The hyperinsulinemia observed in the study cohort may also reflect a compensatory mechanism for insulin resistance mediated by the action of NF-κB-induced pro-inflammatory mediators, including TNF-α, MIF, and PAI-1 [10,11,12], as previously described. This study also revealed a positive correlation between weight and BMI and insulin levels at baseline, but these correlations were no longer statistically significant with altitude exposure. This might suggest that the response to high altitude outweighs the influence of anthropometric characteristics, as also shown by Larsen in normal-weight subjects. Taken together with the present study, data suggest that the hyperinsulinemic response mediated by systemic hypoxia is independent of anthropometric profile [25]. This increase in insulin levels may also reflect an adaptive change to preserve glucose utilisation for insulin-independent tissues (brain, erythrocytes) and to stimulate utilisation of alternative fuels (free fatty acids (FFAs)). Therefore, the present study is consistent with evidence of compensatory hyperinsulinemia in response to high altitudes and suggests that anthropometric profile does not influence the magnitude of the metabolic response to extreme altitudes. As for other field factors possibly promoting transient insulin resistance, we can exclude the acute effect of trekking, as non-eccentric bouts of activity should trigger insulin-sensitizing effects [32].
Previous studies have reported heterogeneous leptin responses during mountaineering expeditions. Tschöp et al. reported increased leptin concentrations associated with loss of appetite at high altitude, whereas Smith et al. found no significant changes in leptin during ascent to 5300 m [33,34]. We also observe a trend in decreasing levels of leptin, but the change was not statistically significant. These differences suggest that the leptin response to high-altitude exposure is not uniform and may vary according to exposure duration and conditions, as well as changes in energy balance and body composition.
3.3. Growth Factor Responses Vary According to Altitude
The biphasic pattern of bFGF, increasing at moderate altitude followed by a decrease at 5000 m, may reflect early functional angiogenic signalling and tissue repair mechanisms in response to high-altitude exposure, although the underlying mechanisms cannot be determined from circulating concentrations alone.
The initial rise at 1400 m may indicate early angiogenic signalling or tissue repair mechanisms, promoting vascular adaptation to reduced oxygen availability. Under hypoxic conditions, stabilization of HIF-1α (and in some contexts HIF-2α) activates several adaptive genes. Although VEGF is the best-established direct HIF target, bFGF is also frequently increased during hypoxia through both HIF-dependent and HIF-independent mechanisms (activation of MAPK/ERK and PI3K/Akt signalling, stimulation by inflammatory cytokines, and increased release of stored bFGF from the extracellular matrix following tissue injury) [35]. The subsequent decrease at extreme altitude suggests suppression or exhaustion of this response, possibly due to severe hypoxia or metabolic stress resulting in a reduction in circulating bFGF levels.
3.4. Limitations
This study has some limitations. The small sample size (N = 15) limits the statistical power for detecting small or moderate effects. This limitation, however, is intrinsic to the nature of high-altitude expeditions, which make the recruitment of larger cohorts difficult. All participants received acetazolamide to prevent acute mountain sickness, so our study lacks an untreated control group, which prevents us from ruling out direct pharmacological effects on the parameters measured. Acetazolamide induces metabolic acidosis and can increase ventilation and oxygenation [36]. However, its effects on inflammation and metabolism remain unclear. Some evidence suggests it may modulate oxidative stress and influence endothelial function. Furthermore, the lack of direct measurement of oxygen saturation prevented us from directly correlating the degree of individual hypoxia with changes in biomarkers, and we cannot rule out the influence of other expedition-related stressors—such as physical exertion, thermal stress, changes in diet, psychological stress, and sleep disturbances—on the observed inflammatory and metabolic changes. Another limitation that is important to consider is the lack of control for confounding factors relevant to the interpretation of changes in metabolic biomarkers, such as physical activity level, catecholamine levels, and changes in body composition.
3.5. Strengths
Despite these limitations, the study has several strengths that enhance its value. The simultaneous in vivo measurement of circulating metabolic, inflammatory, and vascular parameters at high altitude provides a comprehensive view of immune, metabolic, and endothelial interactions, overcoming the limitations of in vitro and animal models. The longitudinal monitoring of the cohort and serial blood samples allowed us to characterise the kinetics of the metabolic and inflammatory response to high-altitude exposure and measured parameters during the return to mid-altitude at 1400 m.
4. Materials and Methods
4.1. Study Design
Among twenty-one participants in the mountaineering expedition on the Nepalese side of Mount Everest, fifteen (9 men, 6 women), aged 43 ± 15 years, with a BMI of 24.2 ± 3.70 kg/m2 were included in this study, as logistical constraints precluded appropriate blood sampling and processing for all the participants (Table 1). The expedition took place from 18 October 2022 to 9 November 2022 and included a gradual ascent from an altitude of 1400 m above sea level to an altitude of 5000 m above sea level (International Pyramid Laboratory-Observatory), followed by a descent to 1400 m above sea level.
The ages of the 15 volunteers are reported in Supplementary Material (Supplementary Table S1).
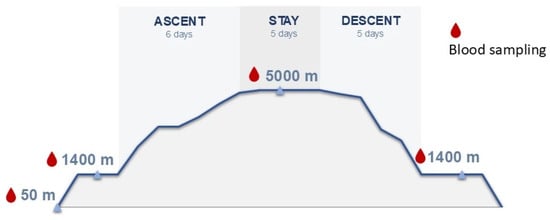
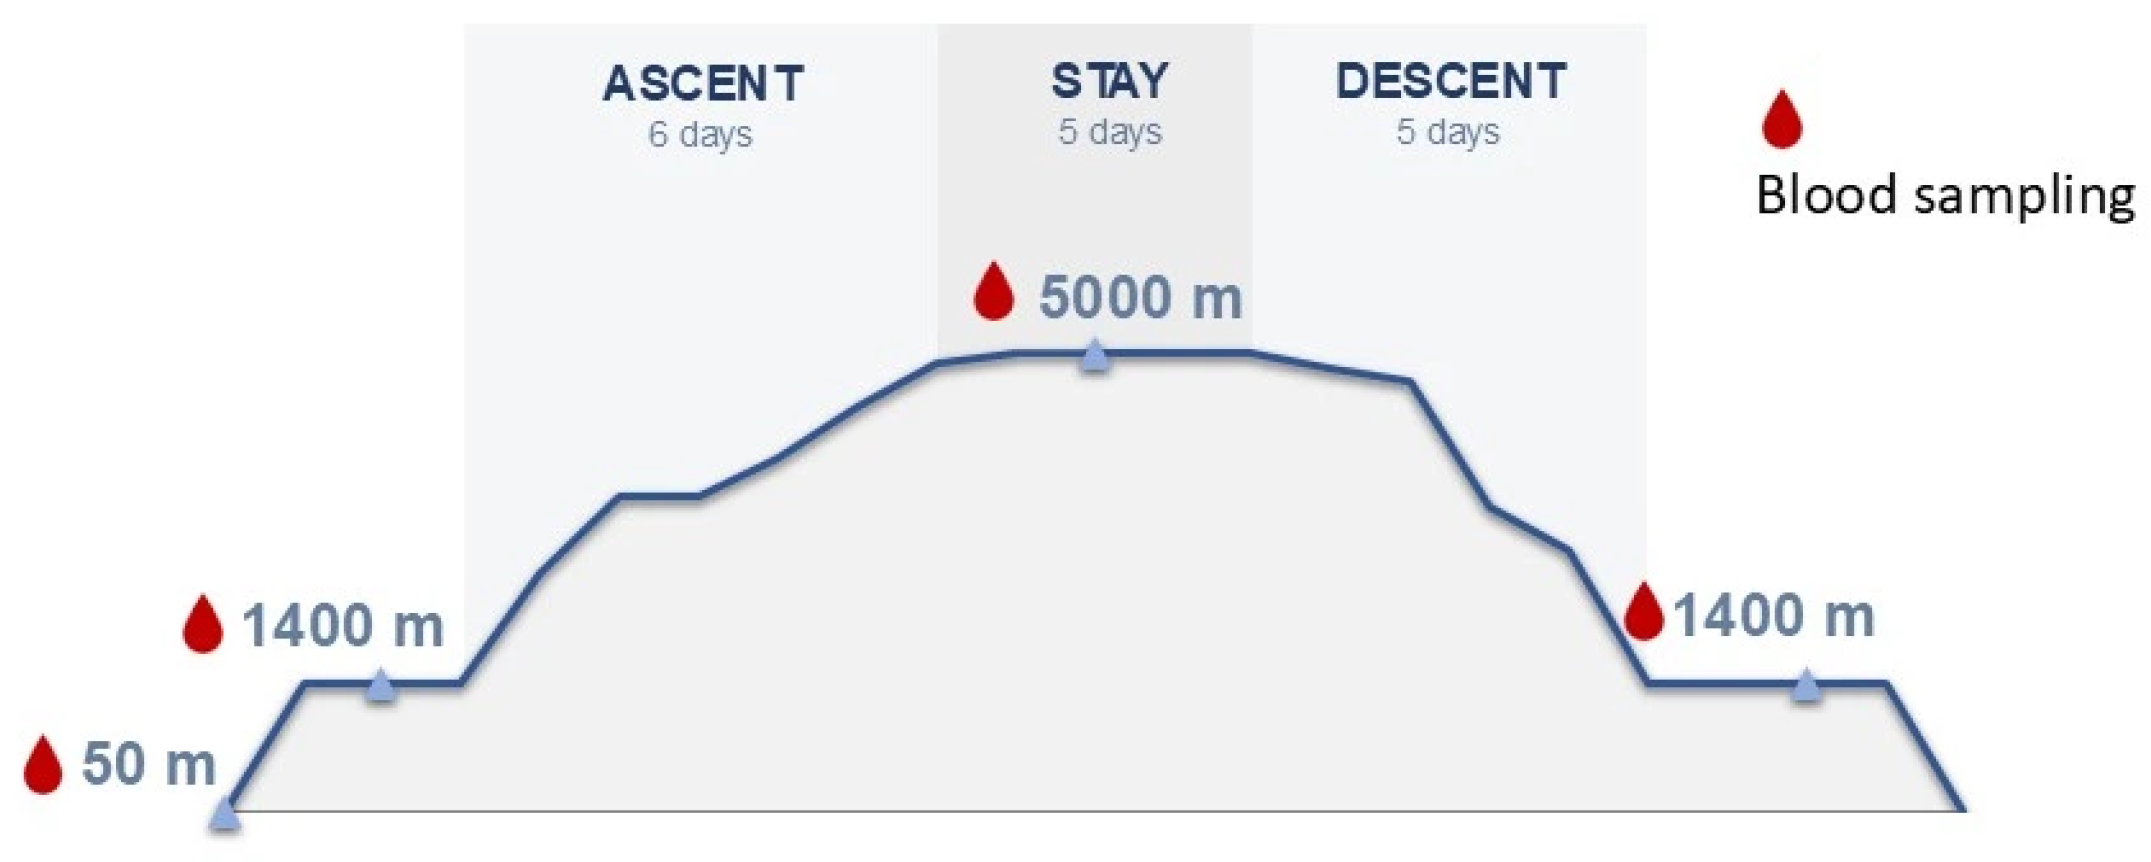
Blood samples were collected across four specific time points to account for altitude changes (Figure 5) as described previously [37,38]:
Figure 5.
Ascent profile and blood sampling protocol across different altitudes (50 m, 1400 m, and 5000 m).
- Baseline (50 m): Collected prior to departure at Chieti University and “San Salvatore” Hospital in L’Aquila, Italy.
- Pre-trek (1400 m): Collected at Omkaar Polyclinic (Kathmandu, Nepal), 1–2 days before beginning the trek.
- High Altitude (5000 m): Collected at the International Pyramid Laboratory (Khumbu Valley) after 2–3 days of acclimatization at altitude (following the 6-day ascent). After 5 days at high altitude, the descent to 1400 started.
- Post-descent (1400 m): Collected 2–3 days after completing the 4-day descent back to 1400 m.
To avoid the acute physiological effects of travel (ascent and descent), sampling at 1400 m, 5000 m, and post-descent 1400 m was consistently performed 2 to 3 days after arrival at the site after an overnight fast. Meal and sleep schedules were kept uniform throughout the baseline, ascent, altitude stay, and descent phases.
Finally, the last post-expedition time point was evaluated upon return to a moderate altitude of 1400 m rather than at sea level (50 m baseline). Due to field expedition logistics and participant travel schedules, a final follow-up at sea level was not possible.
Inclusion criteria were: >18 years of age and signed informed consent. Exclusion criteria were: diagnosis of cardiovascular disease; diagnosis of respiratory failure; diagnosis of chronic obstructive pulmonary disease; diagnosis of neurological diseases; diagnosis of psychiatric diseases; and uncontrolled hypertension. To facilitate acclimatisation, all participants took 250 mg of acetazolamide once daily during the ascent.
Participants were classified according to body mass index (BMI) as normal weight (BMI < 25 kg/m2), overweight (BMI 25–29.9 kg/m2), or obese (BMI ≥ 30 kg/m2).
All procedures were conducted in accordance with the ethical standards of the institutional and/or national research committee and with the 1964 Helsinki Declaration and its later amendments.
4.2. Blood Sampling and Sample Analysis
Venous blood samples were obtained in the morning following an overnight fast, collected in tubes and then centrifuged at 3000 rpm for 10 min before departure at the baseline level of 50 m and during the expedition at altitudes of 1400 m, 5000 m and 1400 m descending.
Circulating markers of metabolic alterations and inflammation were investigated using xMAP technology on a Luminex® 200™ System (Luminex Corporation, Austin, TX, USA; catalog no. LX200-XPON-RUO) by measuring the serum concentrations of Adiponectin/Acrp30, C-Reactive Protein/CRP and Serpin E1/PAI-1 with a custom Human Magnetic Luminex Assay (Kit Catalog Number LXSAHM-03, Bio-Techne S.r.l, Milan, Italy) and MCP-1/CCL2, FGF basic, Insulin, Leptin, MIF and TNF-α with a custom Human Magnetic Luminex Assay (Kit Catalog Number LXSAHM-06, Bio-Techne S.r.l, Milan, Italy) at each time point.
In the absence of concomitant fasting glucose measurements, fasting insulin concentrations were used as an indicator of altered insulin dynamics and an indirect surrogate marker of insulin resistance, as demonstrated by Yeni-Komshian H et al., which shows that estimates of insulin resistance appear to offer little advantage over fasting plasma insulin, particularly in a non-diabetic population [29].
4.3. Statistical Analysis
Analyses were conducted using SPSS (version 20, IBM Corp., Armonk, NY, USA) and GraphPad Prism (version 8.0, GraphPad Software, San Diego, CA, USA), and p value < 0.05 were considered statistically significant.
To test for normal distribution, a Shapiro–Wilk test was performed, and variables were log-transformed if not normally distributed prior to statistical analyses to satisfy the assumptions of parametric testing. Descriptive statistics are presented as mean ± standard deviation (SD) for continuous variables in the manuscript and tables.
Longitudinal changes in circulating biomarkers across the four study time points (50 m a.s.l., 1400 m a.s.l., 5000 m a.s.l., and 1400 m a.s.l. during descent) were assessed using one-way repeated-measures ANOVA. When a significant main effect of altitude was detected, Bonferroni-adjusted post hoc pairwise comparisons were performed to identify differences between individual time points.
A 2 × 4 mixed repeated-measures ANOVA was applied to investigate the effects of body weight status (Between-Subjects Factor: Normal Weight vs. Overweight/Obese) and altitude exposure (Within-Subjects Factor: Altitude (50 m, 1400 m, 5000 m, and 1400 m descent) on circulating marker levels. An analogous analysis was performed to assess the effect of sex (between-subjects factor: Male vs. Female) and altitude exposure (within-subjects factor: altitude) on circulating marker levels. Bonferroni-adjusted post hoc comparisons were performed, as appropriate, to account for multiple comparisons.
Correlations between circulating markers of metabolic alterations and inflammation concentrations and clinical parameters were assessed by Spearman or Pearson’s correlation coefficient depending on data distribution.
5. Conclusions
The objective of this study was to evaluate and characterize in vivo the impact of progressive high-altitude exposure on selected inflammatory markers, metabolic biomarkers (insulin, leptin, and adiponectin), and growth factors involved in vascular adaptation.
Gradual exposure to high altitude under real-world expedition conditions was associated with changes in circulating inflammatory markers, as evidenced by significant increases in CRP, MCP-1, TNF-α, and PAI-1. Concurrently, progressive altitude exposure was associated with a significant rise in serum insulin levels. Notably, elevated levels of CRP, MCP-1, TNF-α, PAI-1, and insulin persisted during the descent phase, indicating that several inflammatory and metabolic changes persisted after the return from the highest altitude. In addition, bFGF exhibited a biphasic response, reflecting transient functional growth factor dynamics during altitude adaptation.
Overall, these findings provide a longitudinal characterization of inflammatory, metabolic, and growth factor responses during real-world high-altitude exposure. Our findings contribute to the understanding of the physiological and potentially maladaptive consequences of oxygen deprivation and high altitude.
Supplementary Materials
The following supporting information can be downloaded at https://www.mdpi.com/article/10.3390/ijms272210113/s1.
Author Contributions
Conceptualization, M.G.B., A.B., D.B., V.V.; Methodology, F.S., A.L., D.B.; Formal analysis, F.S., M.G.B.; Investigation, F.S., A.L., D.B.; Resources, M.G.B., A.B., V.V., D.B.; Writing—Original Draft, F.S., A.L., C.I.; Writing—Review & Editing, M.G.B., V.V., A.B., D.B., M.G.C.; Visualization, F.S., D.T., C.M.; Supervision, M.G.B., A.B.; Project Administration, M.G.B.; Funding Acquisition, M.G.B. All authors have read and agreed to the published version of the manuscript.
Funding
This research was funded by grants to M.G.B. from the Ministry of University and Research (MUR) (PRIN 2022 PNRR programme, Project ID: P20222CB2B) and from the Horizon EU4Health Programme (EU4H) (Grant Agreement No. 101128983, PROVIDE project), and from the European Union – NextGenerationEU, under the National Recovery and Resilience Plan (NRRP), Mission 4, Component 2, Investment 1.5, National Innovation Ecosystem VITALITY (ECS00000041; CUP: E13C22001060006; Coordinator: Prof. F. Graziosi).; and by grant to F.S. from Department of Life, Health and Environmental Sciences (MESVA), University of L’Aquila, through the Ordinary University Funding (FFO 2026 MESVA).
Institutional Review Board Statement
The study was conducted in accordance with the Declaration of Helsinki and approved by the local ethics committee (Comitato Etico delle Province di Chieti e Pescara, protocol n.18, approval date 29 July 2021).
Informed Consent Statement
All participants were informed in detail about the study procedures, and written informed consent was obtained from all subjects involved in the study.
Data Availability Statement
The original contributions presented in this study are included in the article and in Supplementary Material. Further inquiries can be directed to the corresponding author.
Acknowledgments
The authors thank Going Nepal Pvt. Ltd. (Kathmandu, Nepal), OMKAAR Polyclinic Medical Diagnostic and Therapeutic Center (Kathmandu, Nepal), and EvK2CNR for logistic support. No GenAI tool has been used in the preparation of this manuscript.
Conflicts of Interest
The authors declare no conflicts of interest.
Abbreviations
The following abbreviations are used in this manuscript:
| Acrp30 | Adipocyte Complement-Related Protein of 30 kDa |
| ANOVA | Analysis of Variance |
| bFGF | basic Fibroblast Growth Factor |
| BMI | Body Mass Index |
| CCL2 | chemokine (C-C motif) ligand 2 |
| CRP | C-Reactive Protein |
| DNA | Deoxyribonucleic Acid |
| FFA | Free Fatty Acids |
| HIF | Hypoxia-Inducible Factor |
| HREs | Hypoxia Response Elements |
| IL-1ra | Interleukin-1 Receptor Antagonist |
| IL-6 | Interleukin-6 |
| IRS1 | Insulin Receptor Substrate 1 |
| MAPK | Mitogen-Activated Protein Kinase |
| MCP-1 | Monocyte Chemoattractant Protein-1 |
| MIF | Macrophage Migration Inhibitory Factor |
| NF-κB | Nuclear Factor Kappa-Light-Chain-Enhancer of Activated B |
| PAI-1 | Plasminogen Activator Inhibitor-1 |
| PGC-1α | Peroxisome Proliferator-Activated Receptor Gamma Coactivator 1-Alpha |
| PHD | Prolyl Hydroxylase Domain |
| PI3K | Phosphoinositide 3-Kinase |
| PiO2 | Pressure of Inspired Oxygen |
| PPAR-γ | Peroxisome Proliferator-Activated Receptor Gamma |
| TNF-α | Tumor Necrosis Factor Alpha |
| VEGF | Vascular Endothelial Growth Factor |
References
- Grocott, M.; Montgomery, H.; Vercueil, A. High-altitude physiology and pathophysiology: Implications and relevance for intensive care medicine. Crit. Care 2007, 11, 203. [Google Scholar] [CrossRef] [Scilit] [PubMed]
- Luks, A.M.; Hackett, P.H. Medical Conditions and High-Altitude Travel. N. Engl. J. Med. 2022, 386, 364–373. [Google Scholar] [CrossRef] [Scilit] [PubMed]
- Prosperi, P.; Verratti, V.; Taverna, A.; Rua, R.; Bonan, S.; Rapacchiale, G.; Bondi, D.; Di Giulio, C.; Lorkowski, J.; Spacone, A. Ventilatory function and oxygen delivery at high altitude in the Himalayas. Respir. Physiol. Neurobiol. 2023, 314, 104086. [Google Scholar] [CrossRef] [Scilit] [PubMed]
- Schofield, C.J.; Ratcliffe, P.J. Oxygen sensing by HIF hydroxylases. Nat. Rev. Mol. Cell Biol. 2004, 5, 343–354. [Google Scholar] [CrossRef] [Scilit] [PubMed]
- Semenza, G.L. HIF-1 and mechanisms of hypoxia sensing. Curr. Opin. Cell Biol. 2001, 13, 167–171. [Google Scholar] [CrossRef] [Scilit] [PubMed]
- Hagobian, T.A.; Jacobs, K.A.; Subudhi, A.W.; Fattor, J.A.; Rock, P.B.; Muza, S.R.; Fulco, C.S.; Braun, B. Cytokine responses at high altitude: Effects of Exercise and Antioxidants at 4300 m. Med. Sci. Sports Exerc. 2006, 38, 1488–1497. [Google Scholar]
- Hartmann, G.; Tschöp, M.; Fischer, R.; Bidlingmaier, C.; Riepl, R.; Tschöp, K.; Hautmann, R.E.; Endres, S.; Toepfer, M. High altitude increases circulating interleukin-6, interleukin-1 receptor antagonist and C-reactive protein. Cytokine 2000, 12, 246–252. [Google Scholar] [CrossRef] [Scilit] [PubMed]
- Pham, K.; Parikh, K.; Heinrich, E.C. Hypoxia and Inflammation: Insights From High-Altitude Physiology. Front. Physiol. 2021, 12, 676782. [Google Scholar] [CrossRef] [Scilit] [PubMed]
- Trayhurn, P. Hypoxia and Adipose Tissue Function and Dysfunction in Obesity. Physiol. Rev. 2013, 93, 1–21. [Google Scholar] [CrossRef] [Scilit] [PubMed]
- Chen, B.; Lam, A.K.Y.; Wang, Y.; Xu, A.; Lam, K.S.L.; Chung, S.K.; Chung, S.S.M. Hypoxia dysregulates the production of adiponectin and plasminogen activator inhibitor-1 independent of reactive oxygen species in adipocytes. Biochem. Biophys. Res. Commun. 2006, 341, 549–556. [Google Scholar] [CrossRef] [Scilit] [PubMed]
- Ye, J.; Gao, Z.; Yin, J.; He, Q. Hypoxia is a potential risk factor for chronic inflammation and adiponectin reduction in adipose tissue of ob/ob and dietary obese mice. Am. J. Physiol. Endocrinol. Metab. 2007, 293, E1118–E1128. [Google Scholar] [CrossRef] [Scilit] [PubMed]
- Wang, B.; Wood, I.S.; Trayhurn, P. Dysregulation of the expression and secretion of inflammation-related adipokines by hypoxia in human adipocytes. Pflüg. Arch. Eur. J. Physiol. 2007, 455, 479–492. [Google Scholar] [CrossRef] [Scilit] [PubMed]
- Mirabelli, M.; Chiefari, E.; Tocci, V.; Greco, M.; Foti, D.P.; Brunetti, A. Hypoxia in Human Obesity: New Insights from Inflammation towards Insulin Resistance—A Narrative Review. Int. J. Mol. Sci. 2024, 25, 9802. [Google Scholar] [CrossRef] [Scilit] [PubMed]
- Liu, C.; Li, X. Role of leptin and adiponectin in immune response and inflammation. Int. Immunopharmacol. 2025, 148, 115082. [Google Scholar] [CrossRef] [Scilit] [PubMed]
- Li, Y.; Zhang, L.; Wang, X.; Chen, J.; Liu, H. Leptin Enhances M1 Macrophage Polarization and Impairs Tendon-Bone Healing in Rotator Cuff Repair: A Rat Model. Clin. Orthop. Relat. Res. 2025, 483, 939–951. [Google Scholar] [CrossRef] [Scilit] [PubMed]
- Wang, Y.; Wan, R.; Hu, C. Leptin/obR signaling exacerbates obesity-related neutrophilic airway inflammation through inflammatory M1 macrophages. Mol. Med. 2023, 29, 162. [Google Scholar] [CrossRef] [Scilit] [PubMed]
- Eltzschig, H.K.; Carmeliet, P. Hypoxia and inflammation. N. Engl. J. Med. 2011, 364, 656–665. [Google Scholar] [CrossRef] [Scilit] [PubMed]
- Mrakic-Sposta, S.; Gussoni, M.; Montorsi, M.; Porcelli, S.; Vezzoli, A. Effects of acute and sub-acute hypobaric hypoxia on oxidative stress: A field study in the Alps. Eur. J. Appl. Physiol. 2021, 121, 297–306. [Google Scholar] [CrossRef] [Scilit] [PubMed]
- Morimoto, H.; Takahashi, M.; Izawa, A.; Ise, H.; Hongo, M.; Kolattukudy, P.E.; Ikeda, U. Cardiac overexpression of monocyte chemoattractant protein-1 in transgenic mice prevents cardiac dysfunction and remodeling after myocardial infarction. Circ. Res. 2006, 99, 891–899. [Google Scholar] [CrossRef] [Scilit] [PubMed]
- Singh, S.; Anshita, D.; Ravichandiran, V. MCP-1: Function, regulation, and involvement in disease. Int. Immunopharmacol. 2021, 101, 107598. [Google Scholar] [CrossRef] [Scilit] [PubMed]
- Pasceri, V.; Cheng, J.S.; Willerson, J.T.; Yeh, E.T.H. Modulation of C-Reactive Protein-Mediated Monocyte Chemoattractant Protein-1 Induction in Human Endothelial Cells by Anti-Atherosclerosis Drugs. Circulation 2001, 103, 2531–2534, Correction in Circulation 2001, 104, e10–e11. [Google Scholar] [CrossRef] [Scilit] [PubMed]
- Li, X.; Kimura, H.; Hirose, K.; Kasuno, K.; Torii, K.; Okada, T.; Kuroda, E. Synergistic effect of hypoxia and TNF-α on production of PAI-1 in human proximal renal tubular cells. Kidney Int. 2005, 68, 569–583. [Google Scholar] [CrossRef] [Scilit] [PubMed]
- Magalhaes, J.; Ascensão, A.; Marques, F.; Soares, J.M.C.; Neuparth, M.J.; Ferreira, R.; Amado, F.; Duarte, J.A. Skeletal Muscle Ultrastructural and Plasma Biochemical Signs of Endothelium Dysfunction Induced by a High-Altitude Expedition (Pumori, 7,161m). Basic Appl. Myol. 2005, 15, 29–35. [Google Scholar]
- Nourkami-Tutdibi, N.; Küllmer, J.; Dietrich, S.; Monz, D.; Zemlin, M.; Tutdibi, E. Serum vascular endothelial growth factor is a potential biomarker for acute mountain sickness. Front. Physiol. 2023, 14, 1083808. [Google Scholar] [CrossRef] [Scilit] [PubMed]
- Larsen, J.J.; Hansen, J.M.; Olsen, N.V.; Galbo, H.; Dela, F. The effect of altitude hypoxia on glucose homeostasis in men. J. Physiol. 1997, 504, 241–249. [Google Scholar] [CrossRef] [Scilit] [PubMed]
- Rasouli, N. Adipose tissue hypoxia and insulin resistance. J. Investig. Med. 2016, 64, 830–832. [Google Scholar] [CrossRef] [Scilit] [PubMed]
- Oltmanns, K.M.; Gehring, H.; Rudolf, S.; Schultes, B.; Rook, S.; Schweiger, U.; Born, J.; Fehm, H.L.; Peters, A. Hypoxia causes glucose intolerance in humans. Am. J. Respir. Crit. Care Med. 2004, 169, 1231–1237. [Google Scholar] [CrossRef] [Scilit] [PubMed]
- Siervo, M.; Riley, H.L.; Fernandez, B.O.; Leckstrom, C.A.; Martin, D.S.; Mitchell, K.; Levett, D.Z.H.; Montgomery, H.E.; Mythen, M.G.; Grocott, M.P.W.; et al. Effects of Prolonged Exposure to Hypobaric Hypoxia on Oxidative Stress, Inflammation and Gluco-Insular Regulation: The Not-So-Sweet Price for Good Regulation. PLoS ONE 2014, 9, e92827. [Google Scholar] [CrossRef] [Scilit] [PubMed]
- Yeni-Komshian, H.; Carantoni, M.; Abbasi, F.; Reaven, G.M. Relationship between several surrogate estimates of insulin resistance and quantification of insulin-mediated glucose disposal in 490 healthy nondiabetic volunteers. Diabetes Care 2000, 23, 171–175. [Google Scholar] [CrossRef] [Scilit] [PubMed]
- Newsholme, P.; Keane, K.N.; Carlessi, R.; Cruzat, V. Oxidative stress pathways in pancreatic β-cells and insulin-sensitive cells and tissues: Importance to cell metabolism, function, and dysfunction. Am. J. Physiol. Cell Physiol. 2019, 317, C420–C433. [Google Scholar] [CrossRef] [Scilit] [PubMed]
- Adeva-Andany, M.M.; Adeva-Contreras, L.; Carneiro-Freire, N.; Ameneiros-Rodríguez, E.; Vila-Altesor, M.; Calvo-Castro, I. The impact of high altitude (hypobaric hypoxia) on insulin resistance in humans. J. Physiol. Biochem. 2025, 81, 35–55. [Google Scholar] [CrossRef] [Scilit] [PubMed]
- Whytock, K.L.; Goodpaster, B.H. Unraveling Skeletal Muscle Insulin Resistance: Molecular Mechanisms and the Restorative Role of Exercise. Circ. Res. 2025, 137, 184–204. [Google Scholar] [CrossRef] [Scilit] [PubMed]
- Tschöp, M.; Strasburger, C.J.; Hartmann, G.; Biollaz, J.; Bärtsch, P. Raised leptin concentrations at high altitude associated with loss of appetite. Lancet 1998, 352, 1119–1120. [Google Scholar] [CrossRef] [Scilit] [PubMed]
- Smith, J.D.; Cianflone, K.; Martin, J.; Poirier, P.; Broderick, T.L.; Noël, M. Plasma adipokine and hormone changes in mountaineers on ascent to 5300 meters. Wilderness Environ. Med. 2011, 22, 107–114. [Google Scholar] [CrossRef] [Scilit] [PubMed]
- Pugh, C.W.; Ratcliffe, P.J. Regulation of angiogenesis by hypoxia. Nat. Med. 2003, 9, 677–684. [Google Scholar] [CrossRef] [Scilit] [PubMed]
- Leaf, D.E.; Goldfarb, D.S. Mechanisms of action of acetazolamide in the prophylaxis and treatment of acute mountain sickness. J. Appl. Physiol. 2007, 102, 1313–1322. [Google Scholar] [CrossRef] [Scilit] [PubMed]
- Bondi, D.; Bonan, S.; Cantarelli, S.; Ietta, F.; Casini, I.; Taverna, A.; Rua, R.; Guagnano, M.T.; Barbonetti, A.; Bhandari, S.; et al. Sex-sensitive and insensitive endocrine responses and infradian changes while trekking in the Himalayas. Pflüg. Arch. Eur. J. Physiol. 2026, 478, 37. [Google Scholar] [CrossRef] [Scilit] [PubMed]
- Prosperi, P.; Spacone, A.; Taverna, A.; Rua, R.; Bonan, S.; Rapacchiale, G.; Bondi, D.; Di Giulio, C.; Lorkowski, J.; Verratti, V. Altered breathing pattern of lowlanders sleeping at high altitude: Novel insights from home sleep apnoea test procedures. Respir. Physiol. Neurobiol. 2025, 334, 104415. [Google Scholar] [CrossRef] [Scilit] [PubMed]

Disclaimer/Publisher’s Note: The statements, opinions and data contained in all publications are solely those of the individual author(s) and contributor(s) and not of MDPI and/or the editor(s). MDPI and/or the editor(s) disclaim responsibility for any injury to people or property resulting from any ideas, methods, instructions or products referred to in the content. |
© 2026 by the authors. Licensee MDPI, Basel, Switzerland. This article is an open access article distributed under the terms and conditions of the Creative Commons Attribution (CC BY) license.