


Abstract
The identification of plastic particles below 10 µm in the environment is a challenge. Freshwater molluscs, widely used as model organisms for biomonitoring of water pollution, are able to filtrate large volume of water and naturally concentrate contaminants in their excretions. Based on this observation, this work aims to describe a method to collect and detect smaller plastic particles in feces and pseudofeces after animals’ exposure to polyethylene terephthalate micro/nanoparticles, expected to be present in the environment at the end of its uncontrolled life cycle. Our findings, mainly based on Raman spectroscopy for polymer identification and electron microscopy, can be considered a qualitative to semi-quantitative proof of concept that can be further developed to build up a new system to collect plastics using molluscs, naturally exposed to environmental contaminants, without sacrificing them. In addition, the use of feces and pseudofeces of filtering organisms could be the solution to concentrate environmental plastics and confirm their presence.
1. Introduction
Nanoplastics, typically defined as plastic particles smaller than 1 µm in size, have emerged as an environmental and health concern due to their ubiquity, persistence, and potential toxicity [1]. These minute particles are mainly derived from the breakdown of larger plastic debris and just a small percentage from synthetic products such as personal care products, cleaning agents, or industrial waste. Because of their small size, high surface area, and chemical stability, small plastic particles can easily enter ecosystems, accumulate in food chains, and cause adverse effects on organisms at various trophic levels [2,3]. Identifying smaller plastic particles in water, soil, and tissue is complicated due to their size and the presence of interfering matrix particulates. This difficulty in differentiating polymeric nanoparticles from other environmental particulates creates a significant gap in the evaluation of their ecological consequences [4].
The analysis of plastic particles in a range below 10 µm, especially nanoplastics, is still in its early stages, prompting research to move beyond generic screening toward more focused analytical approaches [5,6]. Rather than relying on a single “gold-standard” method, robust characterisation now concentrates on environmental hotspots and sentinel species that naturally accumulate these particles [7,8]. A key challenge lies in developing matrix-reduction protocols—such as enzymatic digestion or chemical oxidation—that can isolate nanoplastics while preserving their physical and chemical integrity, a delicate balance that remains a major technical frontier [9].
Within this framework, mussels represent a strategic focal point for environmental monitoring. While their efficacy as sentinel organisms for microplastics is well-documented [10,11], their utility in tracking particles below 10 µm thresholds, and specifically within the nanoscale, remains an analytical challenge. By filtering vast volumes of water and translocating sub-micron particles into their body, mussels function as biological pre-concentrators. This natural sequestration provides a critical bridge between dilute ambient concentrations, and the sensitivity limits of current instrumentation. Nevertheless, there are still significant gaps in understanding the mechanisms by which sub-micron particles are assimilated [12]. Determining whether these particles are merely transient in the digestive tract or are internalized into the circulatory system is essential for transitioning mussels from qualitative bioindicators to precise quantitative tools for measuring nanoplastic fate.
This research area remains highly challenging, and the scientific community is still striving to develop reliable techniques for detecting nanoplastics in complex matrices, with the goal to incorporating them into routine monitoring programmes in the future [13,14]. At present, investigations of micro and sub-micron plastic particles in the environment focus mainly on simpler matrices such as water-based samples. In this context, the most frequently employed analytical techniques are mass spectrometry-based techniques or analytical strategies to use spectroscopic techniques [15,16]. While spectroscopy is a cornerstone of microplastic analysis (>20 µm), it is rarely applicable to nanoplastics unless specific modification on surface or laser beam can be done to improve detection sensitivity [17,18,19]. However, analyzing complex environmental or food matrices using conventional techniques like Raman spectroscopy remains challenging due to strong background interference post-extraction and the need for high nanoparticle concentrations [20,21].
To enable detection even at trace concentrations, an alternative approach would be to exploit the natural filtration and concentration mechanisms of freshwater mussels. While microplastics are largely confined to the digestive tract and exhibit moderate depuration rates, nanoplastics pose a more complex challenge. Microplastics, being relatively large, are treated by the mussel as indigestible silt or sand; they are rapidly conveyed through the gut by ciliary action and the majority are expelled in feces within 24 hours [22,23,24]. Consequently, a single “grab-sample” of feces may miss them unless the mussel is continuously exposed to high concentrations. In contrast, nanoplastics are hypothesized to exhibit a slightly delayed or extended clearance window compared to microplastics, remaining present in the digestive system for up to 48 h before final elimination [25]. Targeting this excretion matrix could give information of environmental plastic contamination and streamlines routine monitoring.
In this framework, this study aims to establish a proof-of-concept for a novel, non-lethal monitoring framework that leverages the natural particle-concentrating capacity of freshwater bivalve biodeposits (feces and pseudofeces).
2. Experimental Design and Methodology
The methodology presented in this work builds upon prior studies in which transmission electron microscopy (TEM) confirmed the presence of various nanoplastics in fresh mollusk feces and pseudofeces (Table S1, preliminary unpublished studies). These findings highlighted that biological pre-concentration by bivalves could represent a valid alternative to standard lab extraction methods [7].
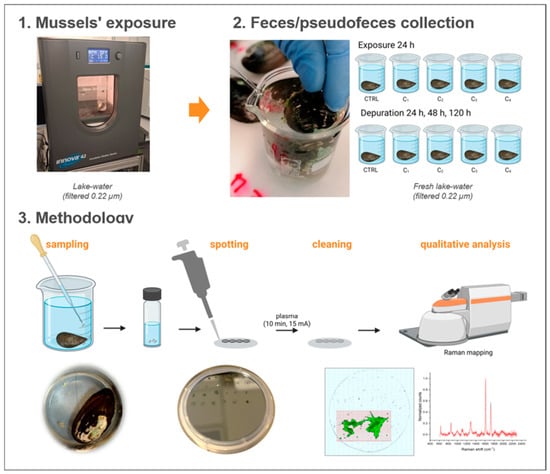
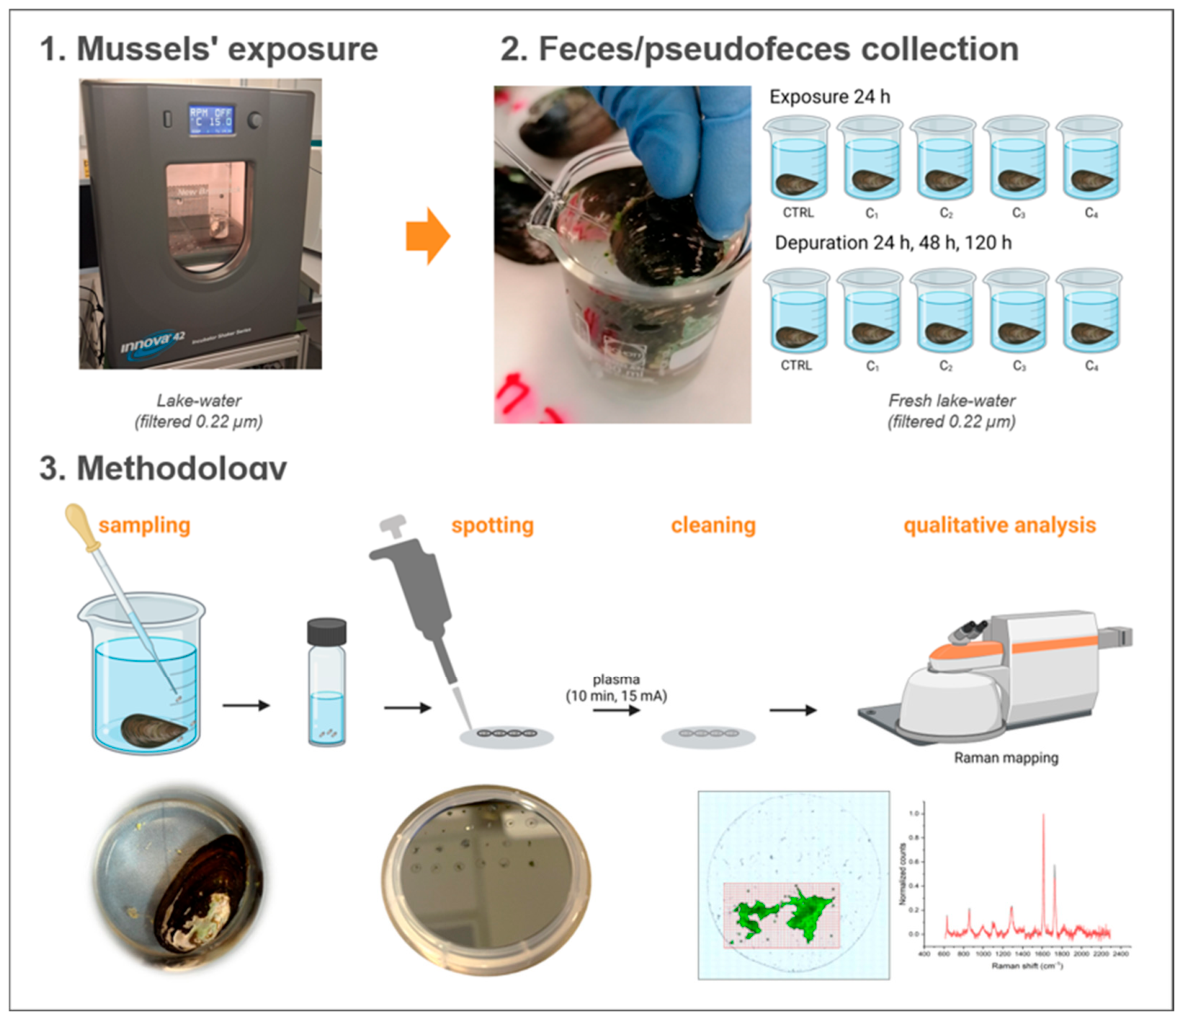
To assess micro- (<5 µm) and nanoplastics we used freshwater mussels, employing a streamlined exposure framework. Mussels were depurated for 48 h under controlled conditions, before a 24 h exposure to pristine and aged polyethylene terephthalate (PET) suspensions across multiple concentrations. Feces and pseudofeces were collected immediately post-exposure and throughout a 120 h depuration period (24, 48, and 120 h). Subsequent analyses were done by µ-Raman spectroscopy (Figure 1).
Figure 1.
Experimental workflow for micro/nanoplastic detection in Unio elongatulus egesta. (1) Exposure and depuration: mussels were exposed to micro/nanoplastics for 24 h in filtered lake water (0.22 µm) at 15 °C, followed by depuration up to 120 h. (2) Biodeposits collection: collection of feces and pseudofeces using a Pasteur pipette. (3) Analytical pipeline: egesta processing involving sampling, sample spotting, plasma cleaning, and identification of plastic particles via Raman mapping. Figure partially created in BioRender. Ponti, J. (2026).
3. Results
3.1. Characterization and Dosage Validation of PET Suspensions
Before conducting the exposure experiments, both pristine- and aged-PET suspensions were comprehensively characterized. TEM was employed to evaluate primary particle size distribution and particle morphology. Concurrently, SPES and TOC analyses were utilized to quantify particle size distribution and mass concentration, respectively. Establishing this baseline was essential to accurately define the effective exposure dose.
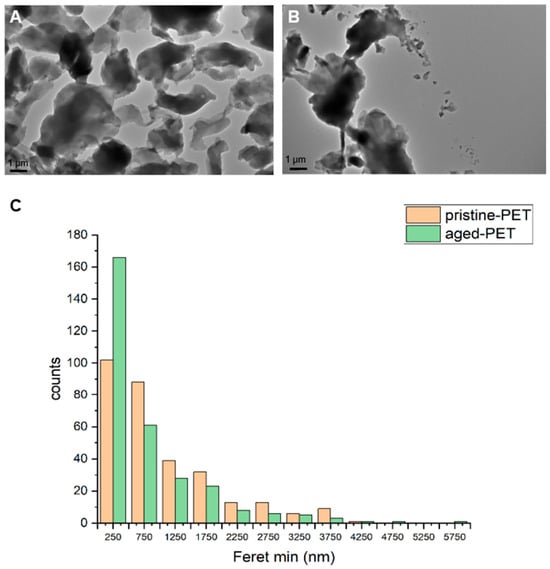
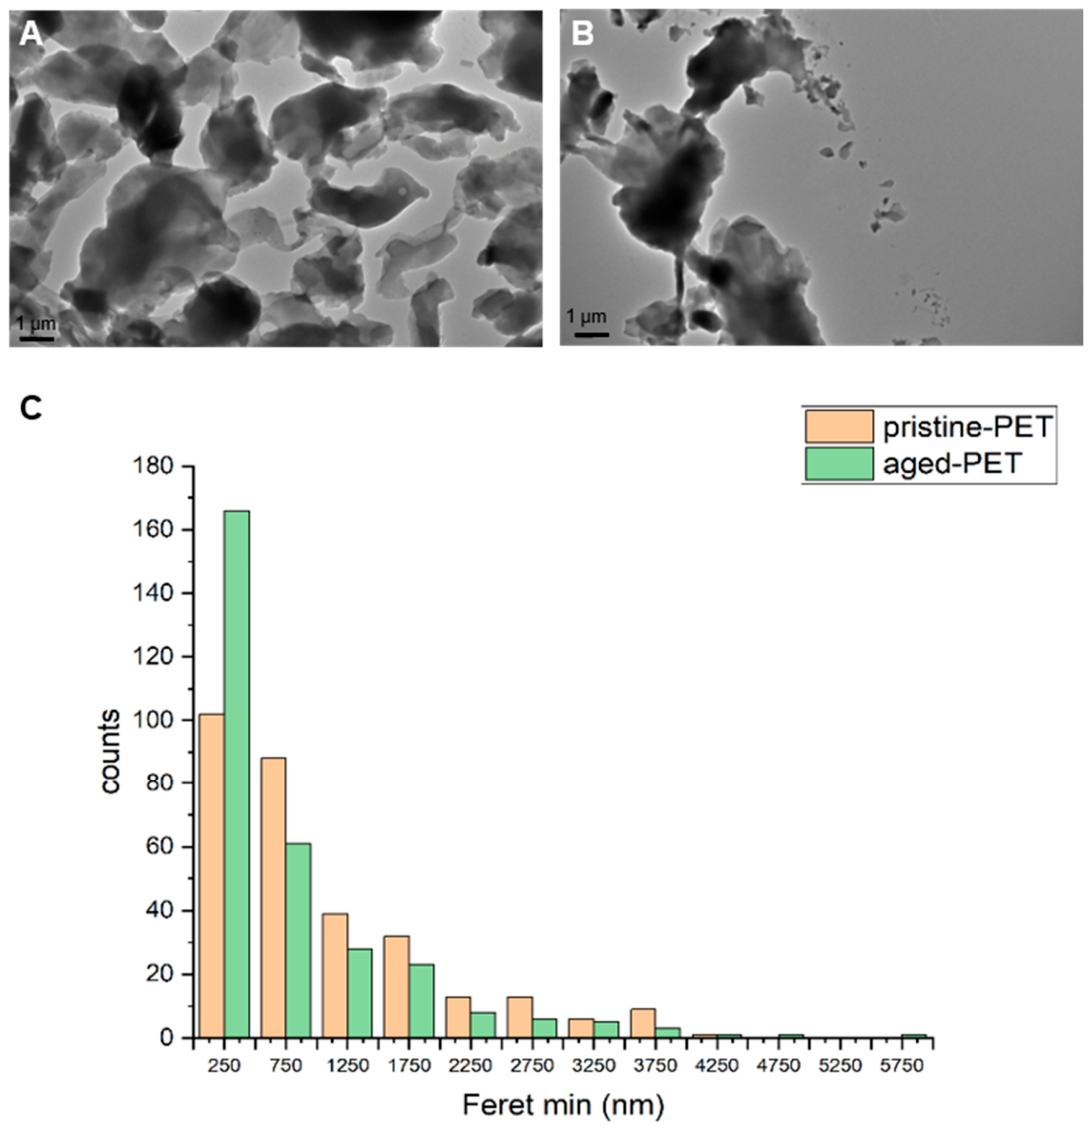
TEM images confirmed that both pristine- and aged-PET exhibited highly irregular, flake-like morphologies with lateral dimensions in the micrometer range (Figure 2). Notably, the pristine-PET appeared as more cohesive, sharply defined irregular aggregates. In contrast, the aged-PET suspensions displayed distinct signs of degradation, including edge erosion and the presence of sub-micron fragments detached from the primary particles. To characterize the physical dimensions and dispersion state of the initial suspensions, particle size distributions of pristine- and aged-PET in MilliQ water were evaluated using both SPES and TEM. The size distribution (Feret Min size) was also verified in filtered lake water (Table S2).
Figure 2.
TEM micrographs of (A) pristine-PET and (B) aged-PET micro/nanoparticles in MilliQ water. (C) Primary particle size distribution based on the minimum Feret diameter (Feret min) measured from TEM images using ImageJ Fiji 2.15.1 (n = 300 particles per sample).
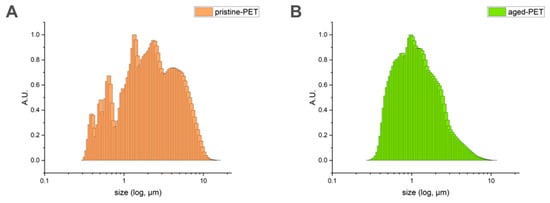
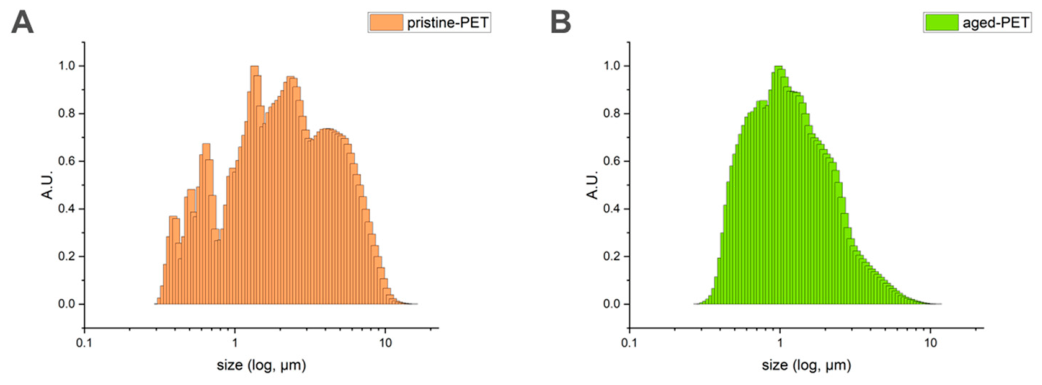
The SPES analysis provided hydrodynamic/effective size distributions above the technique’s limit of detection (~200 nm) (Figure 3). Pristine-PET exhibited a broad, multi-modal size distribution spanning from approximately 0.3 µm to over 10 µm, with distinct population peaks near 0.6 µm, 1.5 µm and 4 µm (Figure 3A). In contrast, aged-PET displayed a more continuous, unimodal-like distribution shifted toward smaller sizes, peaking strongly around 1 µm (Figure 3B). TEM analysis corroborated the overall size range observed by SPES, with both pristine- and aged-PET showing a predominance of particles with Feret min diameters below 750 nm mean size (Figure 2C).
Figure 3.
Size distribution of pristine- (A) and aged-PET (B) in MilliQ water (C1 exposure level) as determined by SPES analysis. Signal intensities have been normalized for comparison across samples.
The two materials exhibited fundamentally different size distribution profiles from the outset (Figure S1) as also confirmed by the statistical comparison based on the minimum Feret value derived from TEM images (Table S3). Pristine-PET suspensions were heterogeneous, clustering into discrete size populations with pronounced gaps, particularly in the sub-micrometer range. Aged-PET suspensions, by contrast, displayed continuous polydispersity: despite spanning a wide size range because of weathering-induced fragmentation, particle sizes were homogeneously distributed along the dilution curve. This divergence in size distribution caused non-linear responses upon dilution, deviating from expected concentration scaling. Consistent with this, the number concentration of aged-PET decreased systematically by approximately one order of magnitude with each dilution step (from ~106 to ~104 particles/mL), whereas the initial number concentration of pristine-PET was markedly low despite its comparatively high mass concentration. This pattern supports the interpretation that pristine-PET suspensions were dominated by larger microparticles, while aged-PET suspensions contained a much higher concentration of smaller fragments (Figure S1).
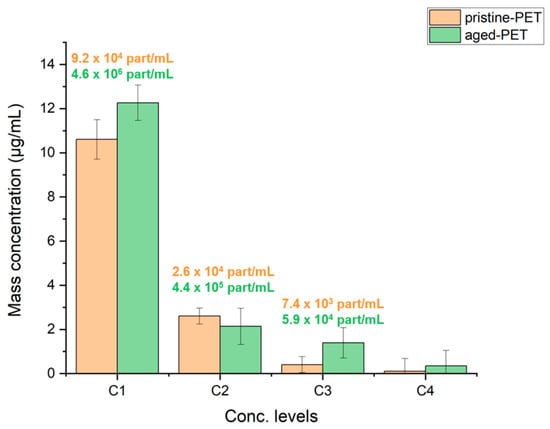
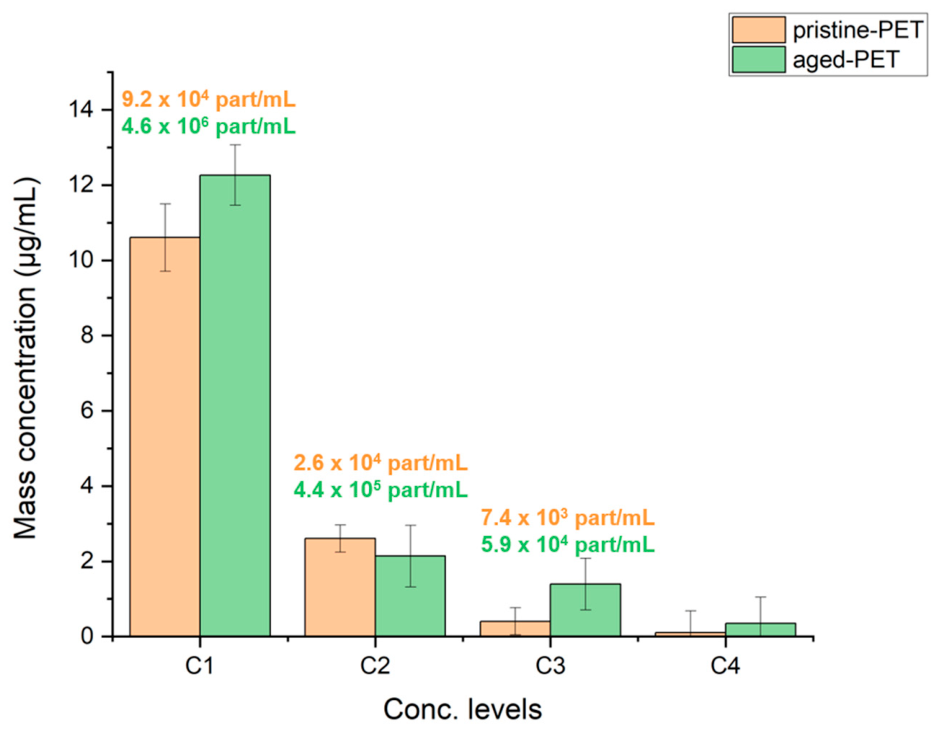
Effective exposure concentrations of pristine- and aged-PET suspensions were further validated by TOC analysis across four nominal concentration levels (C1–C4: 10, 1, 0.1, and 0.01 µg/mL; Figure 4). Measured TOC values consistently exceeded the nominal spiked concentrations, and this positive bias became more pronounced at the lower exposure levels (C3 and C4). This is likely attributable to a combination of factors: (i) a residual dissolved organic carbon fraction that passed through the filtration step, and (ii) the relatively larger proportional contribution of background/matrix carbon at low nominal concentrations, compounded by the intrinsic polydispersity of both plastic suspensions.
Figure 4.
Mass concentration levels of pristine- and aged-PET in the medium (lake water filtered) before exposure, determined by TOC analysis. Labels above the bars represent the corresponding experimental particle number concentrations determined by SPES. Error bars represent the standard deviation (n = 3 independent preparation replicates).
3.2. Raman Mapping Methodology and Correlative Analysis
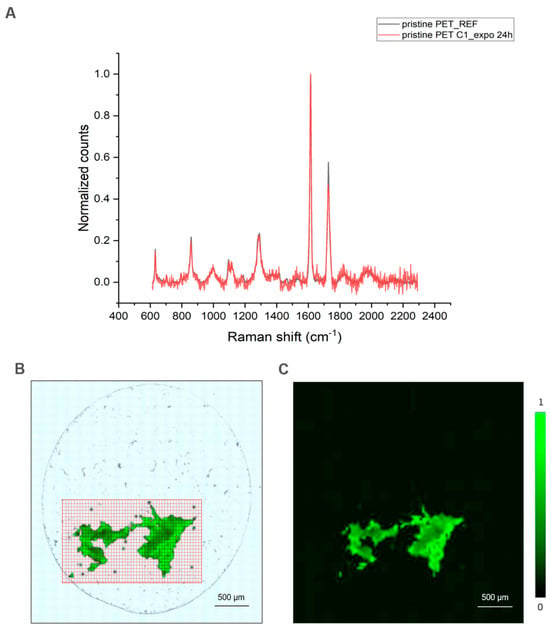
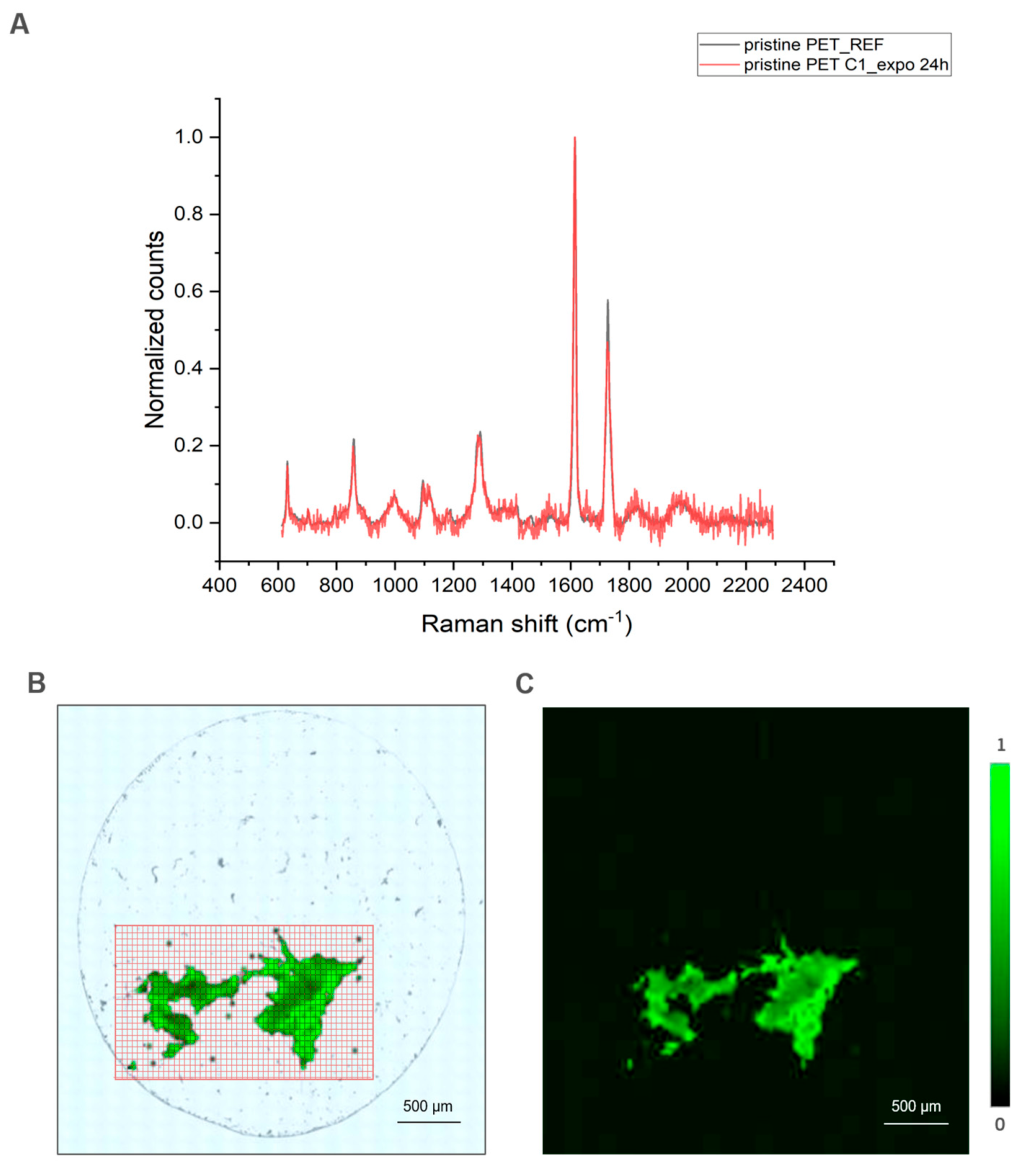
To evaluate the presence of PET micro/nanoparticles in feces and pseudofeces collected during the exposure phase (24 h) and depuration phases (24, 48, and 120 h), samples were analysed using confocal Raman spectroscopy. The chemical identity of the polymeric particles was confirmed by matching their characteristic Raman spectra against reference spectra for pristine and aged PET (Figure 5A). A grid scan surrounding the biodeposit pellet was analyzed using component analysis in WiRE 5.7 software. After spectra collection for each mapping pixel, the software calculated a fractional contribution at each pixel by fitting measured spectra to reference PET spectra while accounting for baseline offsets (non-negative least squares, NNLS, correlation scores). These component scores were rendered into spatial maps using a 256-color Look-Up Table (LUT)—green for pristine PET and yellow for aged PET—where pixel brightness scaled linearly with PET signal intensity (up to 1.0). The resulting Raman maps were overlaid on ImageJ color-channel-enhanced micrographs (Figure 5B,C) to clearly distinguish plastic fragments from the biological background. The LUT scale was adjusted individually for each map to optimize visual contrast, thereby clearly highlighting the spatial distribution and localized PET spectral characteristics within each specific region of the sample.
Figure 5.
Identification and spatial mapping of pristine-PET particles in biodeposit following 24 h exposure (C1 replicate). (A) Spectral verification comparing the normalized Raman signal of particles (red line) against the pristine-PET reference spectrum (black line). (B) Optical micrograph of the biodeposit-matrix showing the assigned Raman grid scan region (red box). (C) Final composite map displaying spatial distribution and component correlation scores of PET (green LUT, normalized scale: 0 to 1), optimized via ImageJ color-channel processing and overlaid on the sample background (scale bar = 500 µm).
3.3. Egestion Dynamics of Pristine- vs. Aged-PET in Exposed Mussels
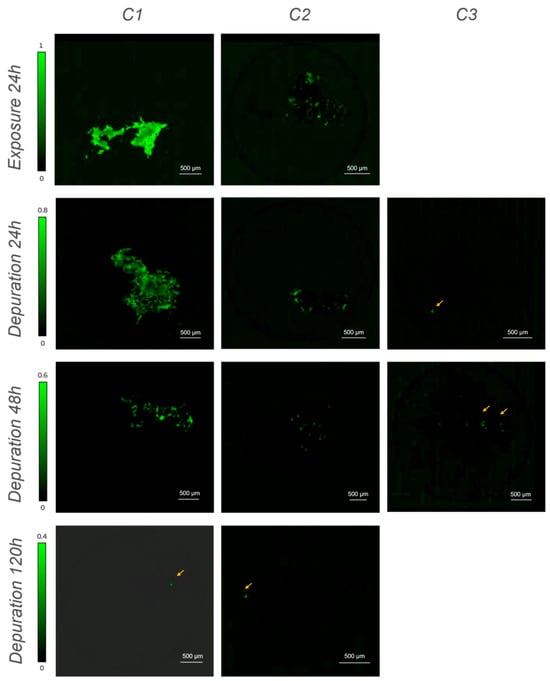
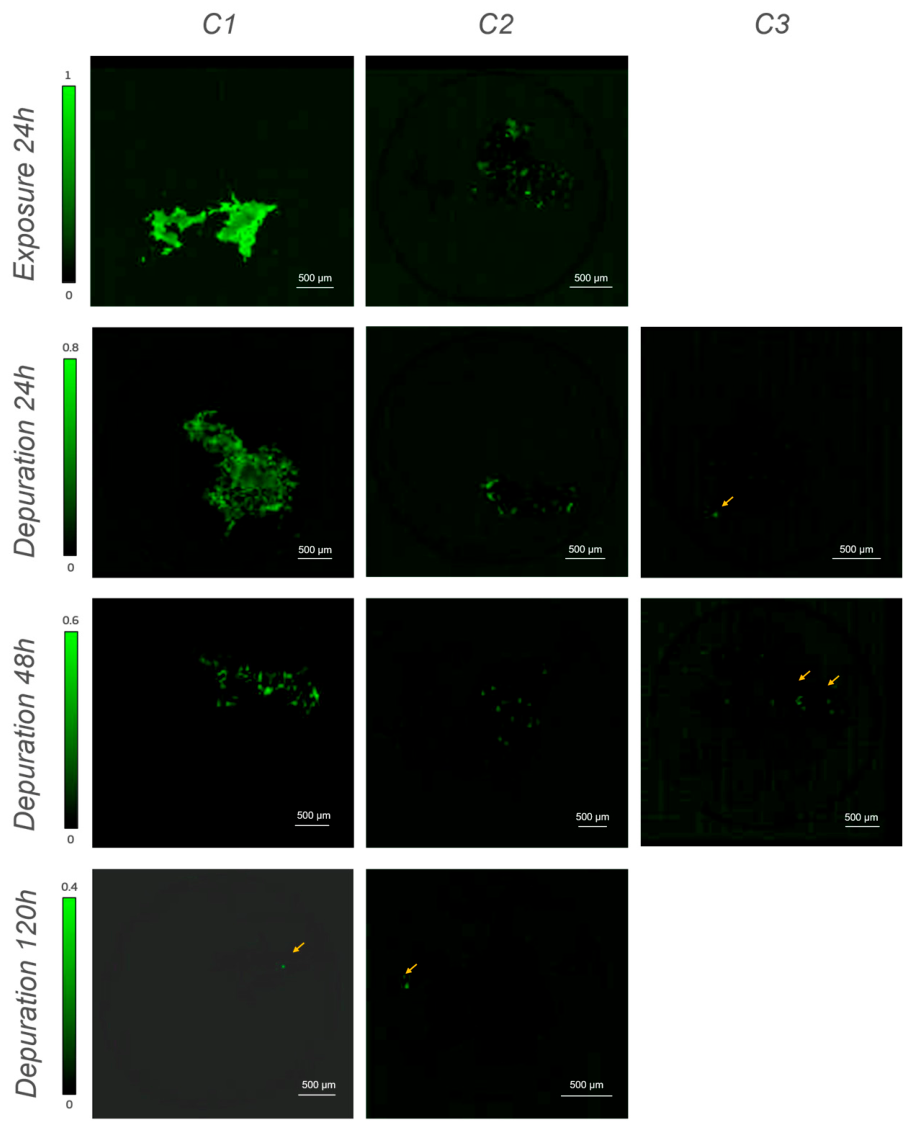
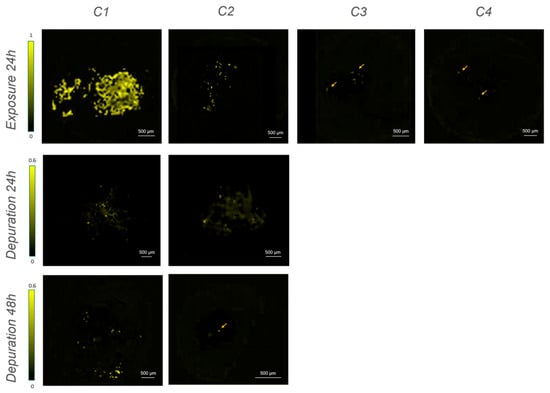
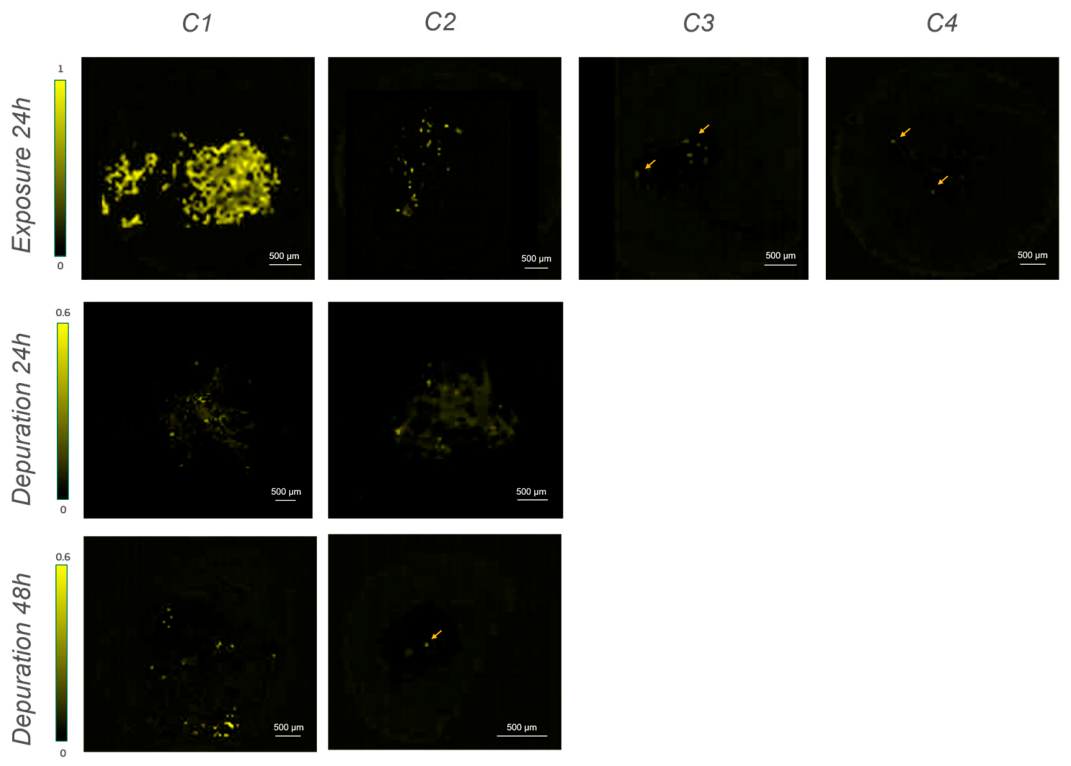
Spatial mapping across exposure and depuration phases demonstrated clear temporal dynamics in PET egestion for both polymer types: pristine (Figure 6 and Figure S3) and aged (Figure 7 and Figure S4).
Figure 6.
Confocal Raman mapping of pristine-PET micro-particles in feces and pseudofeces across exposure levels (C1–C3) during 24 h exposure and subsequent depuration phases (24, 48, and 120 h). Component correlation scores were calculated via Non-Negative Least Squares (NNLS)) and visualized using a 256-color green Look-Up Table (LUT) overlaid on contrast-enhanced optical micrographs processed via ImageJ color-channel separation. Green intensity scale bars (left) represent normalized correlation limits. Intensity scales are standardized within each timepoint to allow direct comparison across exposure concentrations but are rescaled across timepoints (decreasing upper limits from 1.0 to 0.4) to optimize signal visualization at later depuration stages. Yellow arrows denote isolated residual micro-particles. Scale bar = 500 µm.
Figure 7.
Confocal Raman mapping of aged PET micro-particles in feces and pseudo-feces across exposure levels (C1–C4) during 24 h exposure and subsequent depuration phases (24, 48, and 120 h). Particle distribution and relative concentration were evaluated via component analysis, with component correlation scores mapped using a 256-color yellow Look-Up Table (LUT) overlaid on ImageJ color-channel-processed optical micrographs. Yellow intensity scale bars (left) represent normalized correlation limits. Intensity scales are standardized within each timepoint to allow direct comparison across exposure concentrations but are rescaled across timepoints (decreasing upper limits from 1.0 to 0.6) to optimize signal visualization at later depuration stages. Orange arrows highlight trace or isolated micro-particles. Scale bar = 500 µm.
3.3.1. Exposure Phase (24 h)
After 24 h of exposure, a highly abundant signal corresponding to PET was successfully mapped within the organic matrix of the feces/pseudofeces for both pristine- and aged- PET. At the highest concentration, massive, highly cohesive clusters of particles were identified, covering a substantial portion of the pellet area. At lower concentrations, PET particles remained clearly detectable especially for aged-PET, although they appeared as smaller, more localized aggregates embedded within the organic matrix. Analysis of the negative control samples confirmed the complete absence of PET-specific spectral signatures, displaying only the characteristic background spectra of the native biological matrix (Figure S2).
3.3.2. Depuration Phase (24, 48 and 120 h)
Once transferred to filtered freshwater, Raman spectroscopic mapping revealed a qualitative decrease in accumulated plastics across the analyzed biodeposits over time. At 24 h of depuration, a significant amount of both pristine- and aged-PET was still being egested. The presence of dense mapped clusters in both C1 and C2 suggests clearance of plastics from the mantle cavity and digestive tract, resulting in ongoing particle deposition over the 24 h depuration phase. At 48 h of depuration, the mapped areas transitioned from large continuous clusters to small, highly scattered, and isolated particles dispersed within the biodeposit-matrix. Finally, after 120 h of depuration, particle detection in the analyzed biodeposit subsamples was markedly reduced. For pristine-PET, only isolated, sporadic microparticles (indicated by orange arrows) were detected at highest exposure concentrations. Similarly, for aged-PET, signal detection was minimal, with particles being largely undetected or restricted to single, isolated spots across the analyzed areas.
3.4. Matrix Aggregation and Integration Within Egesta Matrix
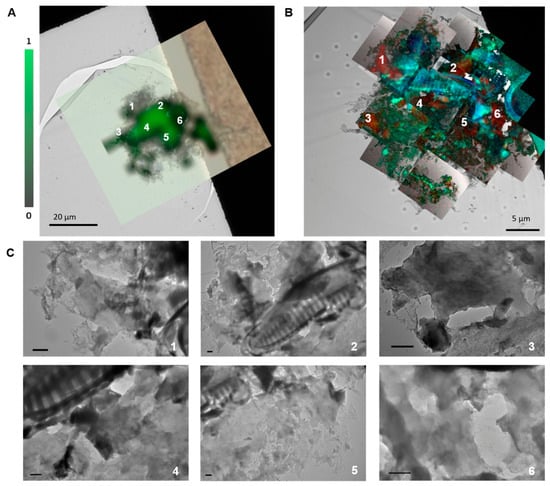
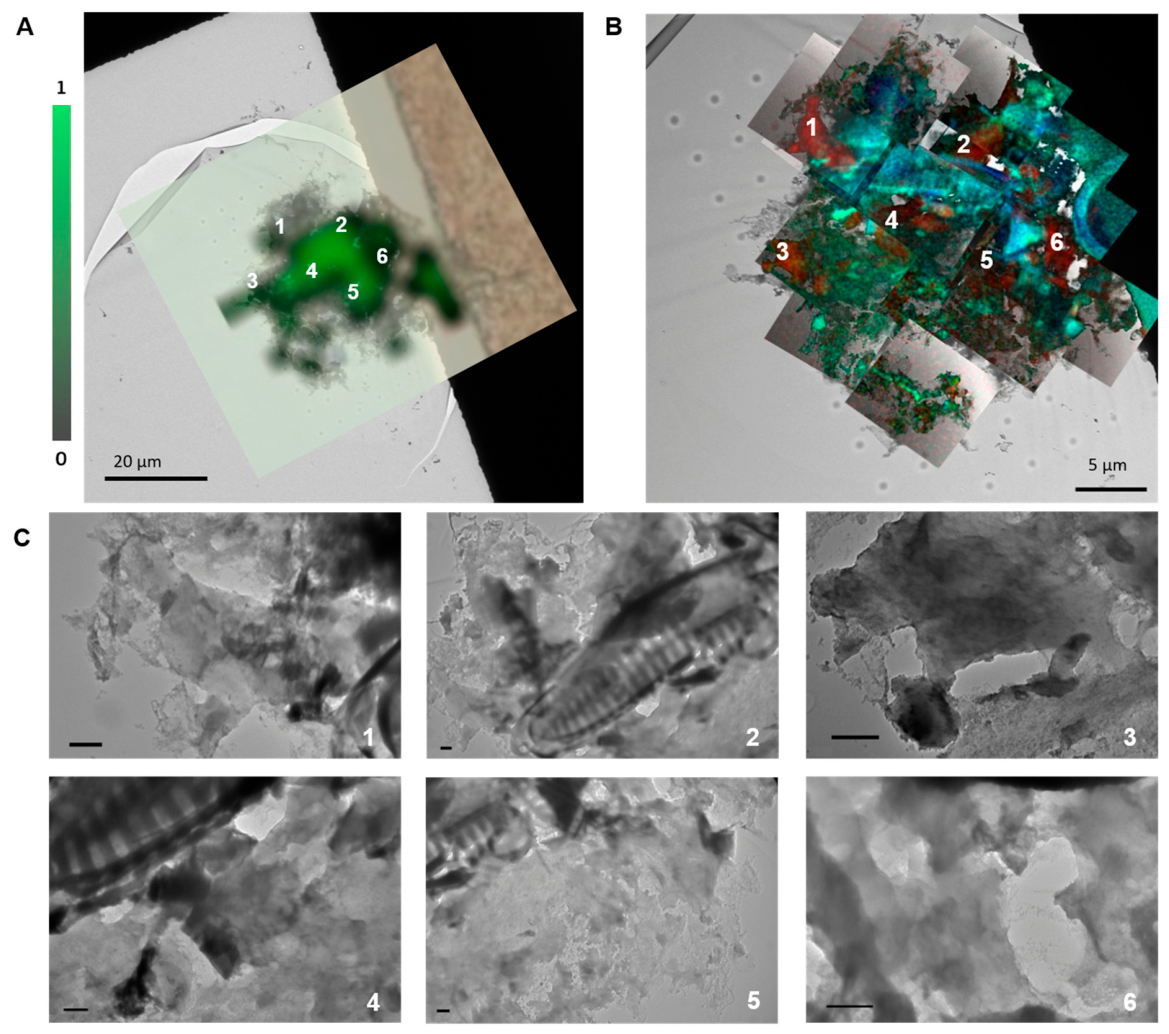
Correlative Raman-TEM microscopy aims to provide more information on the integration of plastics into the biodeposit matrix, seeking to overcome the spatial resolution limitations of Raman spectroscopy. Driven by initial TEM observations of nanoscale particles, biodeposits from aged-PET exposed mussels (C1) were analyzed after 24 h of depuration. Spatial correlation was achieved by overlaying confocal Raman microscopy with scanning transmission electron microscopy coupled with energy-dispersive X-ray spectroscopy (STEM-EDX) for targeted elemental and structural mapping (Figure 8A,B). At the spatial location corresponding to the Raman signal attributed to PET, high-magnification TEM identified irregular, flake-like structures with minimum Feret diameters between 500 nm and 1 µm (Figure 8C). While elemental mapping confirmed C- dominated signatures consistent with organic micro/nanoplastics at these sites and differentiated them from silica- and iron-rich zooplankton skeletal remains (Figure 8B), the spatial overlap between the Raman spectral signature and these nanoscale features supports their potential identity as PET particles.
Figure 8.
Correlative TEM, confocal Raman, and STEM-EDX analysis of biodeposits after aged-PET depuration (24 h, C1). (A) Overlaid confocal Raman spectral map (foreground, green) and low-magnification TEM micrograph (background) identifying PET particle clusters. The green colour bar indicates normalized Raman correlation intensity (scale bar = 20 µm). (B) Overlaid STEM-EDX elemental map (foreground) and TEM micrograph (background) showing elemental distribution: carbon (red), oxygen (green), silicon (blue), and iron (light blue) (scale bar = 5 µm). (C) High-magnification TEM micrographs of candidate regions labelled 1–6 in panels A and B, resolving the detailed morphology and irregular flake-like structure of the entrapped particles, images at different magnifications (scale bars = 500 nm each).
3.5. Application of the Method to Field-Collected Mussels
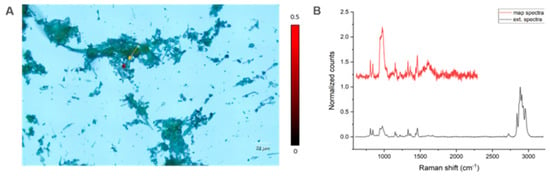
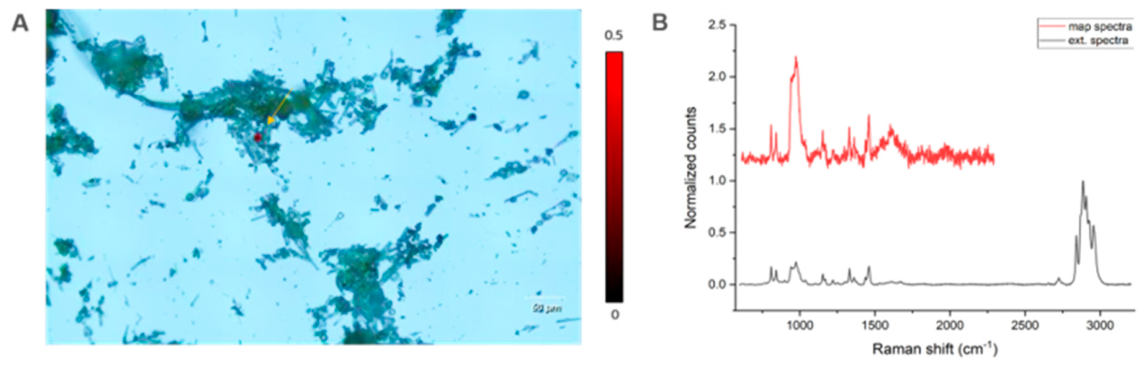
Mussels collected across four field sites underwent 24 h of depuration before feces and pseudofeces were collected and then analyzed. Polymer signals were detected exclusively in samples from the Tresa River mouth (Luino, Varese, Italy)—a site characterized by strong anthropogenic pressure due to urban runoff, riverine input, and high population density where heavy river discharge acts as a primary sink and pathway for anthropogenic waste into the lake [26]. Polypropylene (PP), widely utilized in single-use items and packaging, was the polymer identified (Figure 9). Procedural blanks were processed in parallel with field samples through the entire analytical pipeline; no background micro- or nanoplastic contamination was detected.
Figure 9.
Confocal Raman mapping of feces and pseudofeces from field-collected mussels (Tresa River mouth) following a 24 h depuration phase. (A) Raman map highlighting a polypropylene (PP) microplastic particle (yellow arrow). (B) Corresponding low-resolution Raman spectrum acquired during mapping (red) alongside a high-resolution reference spectrum (black) (100 X objective, 10 s exposure, 10% laser power, 3 accumulations).
4. Discussion
Raman mapping of analysed biodeposits (feces and pseudofeces) from Unio elongatulus confirmed the presence of PET following 24 h of exposure. Rather than using commercial, spherical, monodisperse reference plastics, which offer analytical convenience but represent a poor proxy for real-world environmental contamination, organisms were exposed to two distinct PET variants (pristine and aged) that differ significantly in surface morphology, size distribution, and numerical particle density. Pristine-PET was generated via mechanical stress, yielding irregular, flake-like particles with a broad, multimodal size distribution in the micro-scale range. In contrast, aged-PET, produced through combined mechanical stress and chemical oxidation, more closely mimics particles subjected to prolonged weathering in aquatic systems and exhibits higher hydrophilicity than pristine material. This increase in surface hydrophilicity alters particle–biota interactions, including bioavailability, aggregation state, and adhesion to mucosal surfaces, in ways that idealized spherical particles cannot replicate [27]. TEM imaging corroborated these material differences, showing pristine-PET as cohesive, sharply defined aggregates, whereas aged-PET exhibited pronounced surface erosion and detached sub-micron fragments. Consequently, evaluating both particle types captures a broader spectrum of the physicochemical diversity characteristic of sub-micrometric plastics in the environment, thereby enhancing the ecological relevance of the egestion data. Although previous studies have generally been based on high concentrations of homogeneous commercial plastics [28,29], it is only possible to realistically represent environmental conditions if one can distinguish the particles subject to weathering at ecologically relevant concentrations [30,31].
Crucially, interpreting these detection limits relied entirely on thorough pre-exposure characterization. The integration of TEM, SPES, and TOC analyses allowed independent verification of mass and numerical concentrations across dilution series, uncovering non-linear relationships between nominal and actual concentrations. Specifically, at lower concentrations, pristine- and aged-PET exhibited markedly different dilution dynamics. Without this multi-technique validation, variations in egestion or uptake could be mistakenly attributed to biological responses rather than suspension-specific properties. Although full quantitative particle tracking was beyond the scope of this study due to the qualitative nature of µRaman mapping, such robust pre-exposure characterization—paired with quantitative mapping protocols—is essential for accurate data interpretation in future low-dose studies involving real-world micro/nanoplastics.
Overall, while both PET variants followed similar temporal patterns—being primarily localized within the egested matrix at the end of the exposure period (24 h) and persisting through 48 h post-exposure—distinct spatial differences were observed between the two materials. Specifically, aged-PET produced a denser, more widespread mapping signal consistent with its higher number concentration of sub-micron fragments, whereas pristine-PET appeared as fewer, more localized, and cohesive aggregates. Notably, PET was successfully detected even at the lowest nominal exposure levels tested, representing concentrations that are much more realistic from an environmental perspective and have already been tested on other model organisms in freshwater [32]. No signal was observed at 120 h of depuration at these lowest concentrations. Although detecting particles under extreme low-concentration conditions is constrained by the spatial resolution limits of µRaman spectroscopy, all maps were acquired under identical parameters to maintain consistency. While higher mapping resolutions or extended spatial coverage would further capture low-frequency events, the chosen protocol was deliberately optimized to provide representative, normalized spatial comparisons within practical and feasible acquisition timeframes.
Detecting low-concentration, sub-5 µm plastics in biological samples remains a major analytical bottleneck due to the diffraction-limited spatial resolution and weak Raman scattering cross-sections of micro- and nanoplastics, which typically demand specialized SERS substrates or low-background filters even in simple water matrices [5,18,33,34,35]. Analysing whole bivalve tissues usually necessitates aggressive chemical or enzymatic digestion [13]; however, these processing steps risk degrading sensitive polymers, introducing exogenous contamination, and leaving residual organic matter that masks spectral signals [14]. In contrast, working directly with intact bivalve biodeposits bypasses these severe limitations entirely. The filter-feeding process serves as a natural biological pre-concentration step, where the organic matrix entraps dispersed sub-micrometric plastics into dense, localized clusters. This matrix-induced aggregation significantly amplifies Raman signal intensity and spatial detectability without chemical extraction, allowing samples to be analysed directly on silicon wafers following minimal preparation.
This dramatically reduces sample preparation time, minimizes the risk of laboratory-induced artefacts, and preserves the particles’ native morphology for correlative morphological analysis, making the method far more tractable for routine or field-based monitoring than tissue-based approaches, where matrix complexity remains one of the principal bottlenecks especially in nanoplastic analysis.
Taken together, these three elements—realistic test micro/nanoparticles, sensitivity at low concentrations, and a simplified bio-matrix—converge on what is arguably the study’s most significant implication: they reframe the mussel not merely as a passive bioindicator to be sacrificed and dissected, but as an active biological pre-concentrating devices. By filtering large water volumes during normal feeding activity [36,37], freshwater mussels entrap and concentrate micro- and nanoplastics within their biodeposits. As demonstrated here, this natural aggregation enhances spectral signal intensity, enabling reliable polymer detection from dilute water matrices. Furthermore, because biodeposition is a non-destructive physiological pathway, it allows for repeated, non-lethal monitoring of aquatic environments over time. Therefore, organisms can be collected in the field, held for fecal and pseudofecal sampling, and returned to their native habitat unharmed. The approach was field-tested on wild Lake Maggiore mussels, whose biodeposits were analysed before the organisms were safely returned to their natural environment.
5. Materials and Methods
5.1. Polyethylene Terephthalate Particles and Characterisation in Freshwater
Mussels were exposed to suspensions of pristine and aged polyethylene terephthalate (PET) as mixture of micro- and nanoparticles. Pristine-PET (<5 µm) was generated by cryomilling [38,39]; the stock suspension was prepared by weighing 15 mg of the resulting powder, suspending in 1 mL of Milli-Q water, and sonicate with vial twitter for 10 min. Aged-PET, generated as described by Schirinzi et al. 2026 [27], was supplied pre-suspended in MilliQ water at a concentration of 0.3 mg/mL. The morphology and primary size distribution of the PET micro/nanoplastic suspensions were characterised by TEM (JEM2100, Jeol, Milan, Italy). The exposure medium was prepared by spiking filtered freshwater (0.22 µm) with the target suspension, followed by systematic serial dilution.
Both suspensions were further analysed by Single-Particle Extinction and Scattering (SPES, EOS Classizer™ One, Milano, Italy) analysis to determine particle size distribution and number concentration, while Total Organic Carbon (TOC-L CPH, Shimadzu, Tokio, Japan) analysis to know initial mass concentration [40]. To account for background organic carbon and interfering particulates originating from the medium, PET-free filtered-water was systematically prepared and analyzed via TOC and SPES under identical conditions. The mean TOC background values and particle counts obtained from these control blanks were subsequently subtracted from the exposure suspension measurements to isolate the specific signal attributable to PET particles. In addition, for the conversion of TOC values to PET mass concentrations, the data were processed using a polymer-specific conversion factor based on the stoichiometric percentage of carbon by weight (62.5%) of the PET chemical structure [40].
5.2. Unio Elongatulus Exposure
Unio elongatulus (Pfeiffer) specie were collected in Lake Maggiore (Varese, Italy) at 5 m depth. After sampling and cleaning of peryphitic film from the shell, mussels were maintained in a flow-through aquarium in filtered freshwater (0.22 μm-PES filter assembly, Nalgene, Rochester, NY, USA) at 15 °C for 48 h to allow gut clearance [21].
Before the experiment, the animals were measured in terms of weight (ranging from 25 g to 44 g) and length (ranging from 65 mm to 81 mm) and left overnight in dark incubator at 15 °C at 50 rpm oscillation in a glass beaker containing 4 L of previously filtered freshwater (0. 22 µm pore filter cup).
Three animals for each experimental condition, and three for negative control, were fed with environmental algae (3 × 10⁴ cells/mL) immediately before exposure. Subsequently, each organism was exposed in beakers containing 500 mL of freshly filtered freshwater (0.22 µm), spiked with pristine-PET or aged-PET micro/nanoplastics at the concentration ranging from 0.01 to 10 µg/mL (namely 0.01, 0.1, 1, 10 µg/mL) for 24 h in the incubator as described above. These animals represent replicates for the experiment; of one of them was later considered for the analysis while the others kept for future investigation. Before mussels’ exposure, the medium at different concentration levels were characterized by SPES and TOC analysis to determine number and mass concentration for each exposure experiment. After exposure time, the mussels were transferred to clean beakers containing 500 mL of freshly filtered freshwater for the depuration phase. The medium was completely renewed at the end of each designated sampling time point.
5.3. Biodeposits Collection and Analysis
Feces and pseudofeces were collected independently from each animal after 24 h of exposure and after 24, 48 and 120 h of depuration. Each animal was removed from the beaker, organic fragments appearing as ribbons/filaments of compact pellets (feces) or mucus permeated and fragile masses (pseudofeces) [41] were manually collected from the bottom of the beaker with a glass pipette and pooled in glass vials as a combined biodeposit matrix before analysis. To ensure that un-bound or loosely adhering environmental plastic particles were not erroneously collected alongside the biodeposits, all sampled feces and pseudofeces were immediately and gently rinsed with ultrapure water upon collection prior to downstream analysis. Samples of one animal were immediately prepared for the analysis by deposition on a silicon wafer, dried overnight at room temperature, and treated by glow discharge (10 min, 15 mV; Leica EM ACE200, Microcontrol, Milan, Italy) before analysis to clean the superficial matrix layer. Remaining fresh samples were also stored at −20 °C to avoid bacterial contamination, for further investigation. Biodeposits from the negative control organisms (maintained under exposure conditions without PET) were also collected and analyzed using the same procedure. Following the collection of feces and pseudofeces, the surviving mussels were returned to the environment. No physiological or stress-related parameters were measured before or after the procedure.
The analysis to confirm the presence and chemical structure of the plastic particles in biodeposit was performed using by confocal Raman microscope (inVia™ Renishaw, Wotton-under-Edge, UK, equipped with 532 nm laser, 1200 L/mm grating). The spectra of samples were collected in static mode (mean value 1500 cm−1, covering a spectral range from 600 to 2300 cm−1) using the 50X objective and 10% power laser (5 mV) by averaging at least 3 spectra and an accumulation time of 1 second. Raman area mapping was executed using Renishaw WiRE 5.7 software within the area setup configuration, defining a spatial grid of 50 × 50 measurement steps to yield a total of 2500 spatial pixels. Raw Raman mapping data were pre-processed using cosmic ray removal and baseline subtraction via Renishaw WiRE software. Component distribution and identification were performed using Non-Negative Least Squares (NNLS) fitting against authentic reference spectra. Optical micrographs of feces/pseudofeces were further processed with ImageJ Fiji 2.15.1 software (NIH, Bethesda, MD, USA) to enhance particle boundary definition and contrast.
5.4. Correlative TEM–EDX–Raman Characterization
A correlative microscopy approach was used to directly link the polymeric Raman fingerprint with the nanoscale morphology provided by the TEM. Combination of TEM, Energy-Dispersive X-ray Spectroscopy (EDX) and confocal Raman spectroscopy was implemented to detect, identify, and morphologically characterize irregular, non-model nanoplastics (e.g., aged-PET fragments) entrapped within fecal matrices. Samples were prepared by depositing 3 µL of feces/pseudofeces suspension onto Cu-Formvar carbon-coated grids and drying overnight in a desiccator. Grids were analyzed by TEM at 120 kV to assess electron density, size, and morphological features typical of PET particles. Small fragments were then elementally screened using TEM in Scanning Transmission Electron Microscopy (STEM) acquisition mode coupled with EDX spectroscopy (Quantax, Bruker, Italy) and further validated by Raman spectroscopy.
5.5. In-Situ Sampling and Micro/Nanoplastic Extraction from Mussels’ Biodeposit
To investigate the presence of micro- and nanoplastics in Lake Maggiore (VA, Italy), four sampling sites were selected and classified according to their level of anthropogenic pressure, based on the presence of human settlements, transport activities and recreational facilities in their immediate surroundings. Two sites were classified as having high anthropogenic pressure: (i) Boesio mouth, located near the town of Laveno-Mombello and a ferry terminal, where ferries operate approximately every 30 minutes during daytime; (ii) Tresa mouth, located near the town of Luino, its lakeside promenade and frequently visited beaches. While, the other two classified as low anthropogenic pressure sites are: (iii) Arcate (Castelveccana), a small beach located along the main road, with no towns or significant human activities in its immediate surroundings; (iv) Brezzo di Bedero a public pebble beach accessible directly from the provincial road (SP69), with a row of trees bordering the beach and limited visitor facilities (Table 1).
Table 1.
Exposure sites and animal characteristics details.
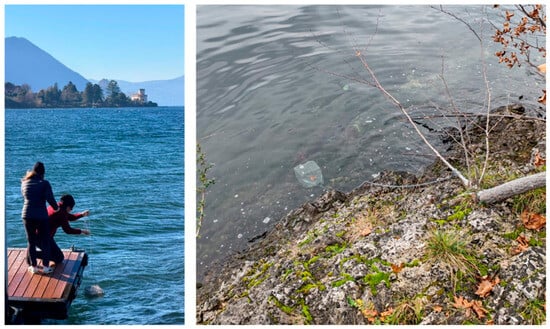
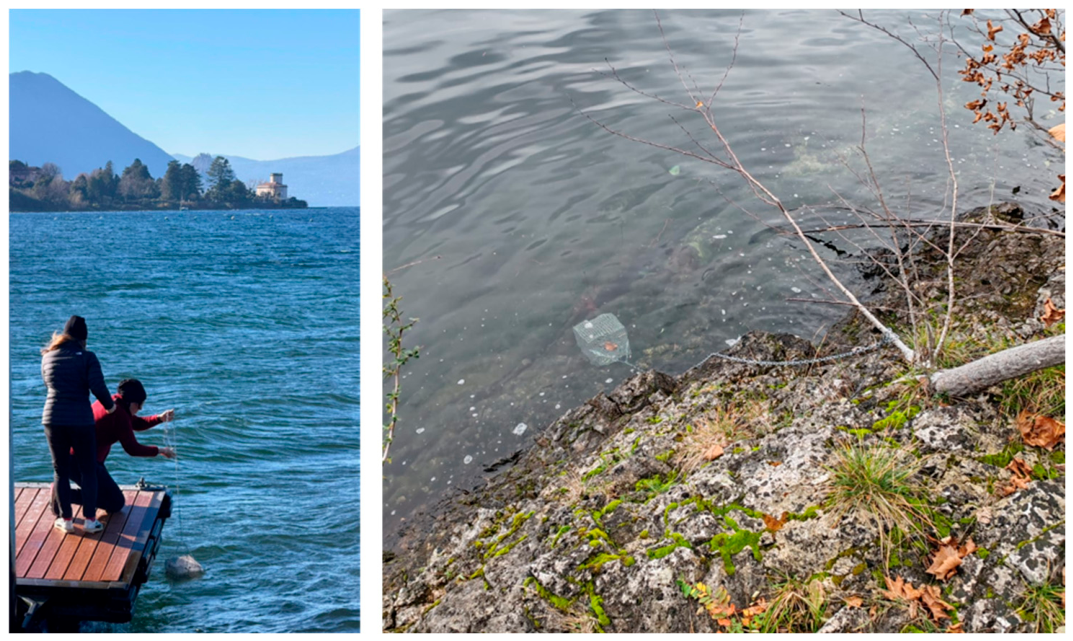
Five previously depurated mussels were deployed in each steel cages, to prevent experimental contamination, and exposed in the lake for 24 h (Figure 10). After exposure, the recovered individuals were placed in a new, clean glass bottle containing pre-filtered freshwater by 0.22 µm pore filter cup. Feces/pseudofeces were then collected and, where possible, analysed directly by Raman spectroscopy, as previously described. When direct analysis was not feasible, a Fenton reaction protocol was applied: 500 µL of sample water, 250 µL of 30% H2O2 (Sigma-Aldrich, St. Louis, MO, USA) and 250 µL of 0.05 M FeSO4 (Sigma-Aldrich, St. Louis, MO, USA) were combined for 1 mg of biodeposit and heated for 30 min at 40 °C in a heating block. The reaction was then quenched with 300 µL of absolute ethanol, and then samples were filtered and concentrated using Amicon 100 kDa MWCO PES filters (MilliporeSigma, Burlington, MA, USA) reaching 200 µL as a final volume. Finally, 2 µL of each sample was spotted onto a silicon wafer for Raman analysis. Procedural blanks were processed through the entire digestion protocol to ensure no laboratory contamination.
Figure 10.
Active biomonitoring deployment in Lake Maggiore. Deployment of steel cages containing depurated mussels (Unio elongatulus) from a dock at Tresa river mouth (left). In-situ exposure of the submerged cage anchored near the shoreline for the 24 h exposure period, designed to prevent experimental plastic contamination during field monitoring (right).
6. Conclusions
This study demonstrates that freshwater mussels can serve as effective, biological concentrators for tracking micro/nanoplastic contamination in aquatic environments. By exposing Unio elongatulus to pristine- and aged-PET particles, thoroughly characterized by TEM, SPES, and TOC prior to exposure, it was demonstrated that feces and pseudofeces can be a suitable matrix for plastic contamination. Even at lower exposure concentrations—selected based on limited literature monitoring data for plastic particles smaller than 10 µm—these matrices remained detectable by the proposed analytical approach. Detection was successful within 24–48 h of depuration and extended up to 120 h of depuration at higher exposure levels under controlled laboratory conditions. It is essential to highlight that the mussel biodeposits required minimal sample preparation compared to conventional tissue-based analyses. Furthermore, the successful application of the protocol to field-deployed mussels demonstrates its potential outside beyond controlled laboratory conditions. Despite these encouraging findings, key limitations must be noted. First, the present approach is qualitative to semi-quantitative: although Raman mapping effectively resolves spatial distribution and relative particle density within egested matrices, it does not yield absolute particle counts or mass flux per individual. Developing fully quantitative protocols, such as pairing spectroscopic mapping with automated particle enumeration, will be essential to transform egestion rates into a reliable dosimetric tool for low-dose environmental exposure. Parallel to advancing toward full quantification, extending this non-destructive methodology across additional polymer classes, diverse bivalve taxa, and complex natural waters will be crucial to transition this proof-of-concept into a scalable, routine tool for freshwater plastic surveillance.
Supplementary Materials
The following supporting information can be downloaded at: https://www.mdpi.com/article/10.3390/molecules31224167/s1. Figure S1: SPES particle size distribution and relative concentration of (A) pristine-PET and (B) aged-PET in the medium prior to exposure (C1–C3). Level C4 is omitted due to the instrument’s limit of detection. Figure S2: Confocal Raman mapping of representative negative control biodeposits from unexposed organisms: (A) pristine-PET control and (B) aged-PET control. Component analysis score maps show a complete absence of PET-specific spectral features. The corresponding Raman spectra displayed below each map exhibit only the native baseline and background characteristics of the biodeposit-matrix, confirming the absence of false-positive polymer signals. Scale bar = 500 µm. Figure S3: Confocal Raman mapping overlays showing the spatial distribution of pristine PET particles in feces and pseudo-feces across exposure levels (C1–C4) during the 24 h exposure phase and subsequent depuration timepoints (24, 48, and 120 h). Component analysis score maps were rendered into a 256-color green Look-Up Table (LUT) and co-registered onto optical micrographs. The green intensity bars on the left display the maximum normalized correlation limits (decreasing from 1.0 at 24 h exposure to 0.4 at 120 h depuration). Orange arrows indicate localized, trace micro-particles. Scale bar = 500 µm. N.D. = Not Detected. Figure S4: Confocal Raman mapping overlays showing the spatial distribution of aged PET particles in feces and pseudo-feces across exposure levels (C1–C4) during the 24 h exposure phase and subsequent depuration timepoints (24, 48, and 120 h). Relative correlation scores calculated via component analysis were mapped using a 256-color yellow Look-Up Table (LUT) overlaid on contrast-optimized optical micrographs using ImageJ color-channel processing. Yellow intensity bars on the left display the normalized correlation limits (decreasing from 1.0 at 24 h exposure to 0.6 at 48 h depuration). Orange arrows indicate localized, trace micro-particles. Scale bar = 500 µm. N.D. = Not Detected. Table S1: Representative TEM images of synthetized micro/nanoplastics in milliQ water and in biodeposit-matrix. Images were acquired at 120 kV showing commercial stock suspensions in Milli-Q water alongside particles recovered from bivalve feces and pseudofeces. Tested materials include commercial polystyrene (PS; 1000, 200, and 50 nm) as well as Joint Research Centre (JRC) synthesized polyethylene (PE; 200 nm) and JRC-synthesized gold-labeled polymers: polyvinylchloride (Au-PVC; 200 nm), polypropylene (Au-PP; 200 nm), and polyethylene (Au-PE; 200 nm). Scale bars are indicated on individual micrographs. Preliminary unpublished studies. Table S2: Feret min size obtained by manually counting 300 particles for each PET-suspension sample. Table S3: Statistical comparisons (t-test) evaluating particle characterization across aging treatments and water matrices.
Author Contributions
G.F.S. Schirinzi: Conceptualization; Data curation; Formal Analysis; Investigation; Methodology; Validation; Visualization; Writing—original draft; Writing—Review and Editing; I.G.: Investigation; Writing—review and editing; S.R.: Investigation; Writing—review and editing; N.R.: Conceptualization; Formal Analysis; Project administration; Funding acquisition; Writing—Review and Editing; J.P.: Conceptualization; Formal Analysis; Project administration; Investigation; Data curation; Methodology; Validation; Visualization; Supervision; Writing—original draft; Writing—review and editing. All authors have read and agreed to the published version of the manuscript.
Funding
This research was funded by the European Union’s Horizon Europe programme (SYMBIOREM, Grant Agreement No. 101060361). The experimental data used in this research were generated through access to the Nano-biotechnology laboratory under the Framework for access to the Joint Research Centre physical Research Infrastructures of the European Commission (project ‘Microplastics detection in Lake Maggiore by native and invasive freshwater mussels: a case study exploitation to improve bio-monitoring methodologies, MDM’ Research Infra-structure Access Agreement N° 36689/3) and (project ‘µPA-LKM Assessing microplastic abundance and distribution in Lake Maggiore using native and invasive freshwater mussels: a case study exploitation to improve bio-monitoring methodologies’ Research Infra-structure Access Agreement N° 35559/1).
Data Availability Statement
Data is unavailable due to privacy restrictions.
Acknowledgments
Marco Roncaglia for the building of cages and support in the sample preparation. John Seghers (F.6-JRC-Reference Material) for supplying PET-materials.
Conflicts of Interest
The authors declare no conflicts of interest.
Abbreviations
The following abbreviations are used in this manuscript:
| CNR | National Research Council (Consiglio Nazionale delle Ricerche) |
| DOC | Dissolved Organic Carbon |
| EDX | Energy-Dispersive X-ray Spectroscopy |
| JRC | Joint Research Centre |
| LUT | Look-Up Table |
| MWCO | Molecular Weight Cut-Off |
| NIH | National Institutes of Health |
| N.D. | Not Detected |
| NNLS PES | Non-Negative Least Squares Polyethersulfone |
| PET | Polyethylene terephthalate |
| PP | Polypropylene |
| SPES | Single-Particle Extinction and Scattering |
| STEM | Scanning Transmission Electron Microscopy |
| TEM | Transmission Electron Microscopy |
| TOC | Total Organic Carbon |
References
- Lai, H.; Liu, X.; Qu, M. Nanoplastics and human health: Hazard identification and biointerface. Nanomaterials 2022, 12, 1298. [Google Scholar] [CrossRef] [Scilit] [PubMed]
- Okeke, E.S.; Chukwudozie, K.I.; Addey, C.I.; Okoro, J.O.; Chidike Ezeorba, T.P.; Atakpa, E.O.; Okoye, C.O.; Nwuche, C.O. Micro and nanoplastics ravaging our agroecosystem: A review of occurrence, fate, ecological impacts, detection, remediation, and prospects. Heliyon 2023, 9, e13296. [Google Scholar] [CrossRef] [Scilit] [PubMed]
- McHale, M.E.; Sheehan, K.L. Bioaccumulation, transfer, and impacts of microplastics in aquatic food chains. J. Environ. Expo. Assess. 2024, 3, 15. [Google Scholar] [CrossRef] [Scilit]
- Debri, R.P.; Sepe, F.; Romano, S.; D’Orazio, N.; De Lorenzo, A.; Calarco, A.; Conte, R.; Peluso, G. Nanodevice Approaches for Detecting Micro- and Nanoplastics in Complex Matrices. Nanomaterials 2026, 16, 55. [Google Scholar] [CrossRef] [Scilit] [PubMed]
- De-la-Torre, G.E.; Bapp, C.; Forero-López, A.D.; Dobaradaran, S. Analytical techniques for quantifying and identifying nanoplastics: Recent advances. Curr. Opin. Chem. Eng. 2025, 48, 101134. [Google Scholar] [CrossRef] [Scilit]
- Jakubowicz, I.; Enebro, J.; Yarahmadi, N. Challenges in the search for nanoplastics in the environment—A critical review from the polymer science perspective. Polym. Test. 2021, 93, 106953. [Google Scholar] [CrossRef] [Scilit]
- Skawina, A.; Dąbrowska, A.; Bonk, A.; Paterczyk, B.; Nowakowska, J. Tracking the micro- and nanoplastics in the terrestrial-freshwater food webs. Bivalves as sentinel species. Sci. Total Environ. 2024, 917, 170468. [Google Scholar] [CrossRef] [Scilit] [PubMed]
- Lefevre, M.C.; Bernardeschi, M.; Battaglini, M.; Ciofani, G. Evaluation of the Dual Impact of Nanotechnologies on Health and Environment Through Alternative Bridging Models. Adv. Healthc. Mater. 2026, 15, e05218. [Google Scholar] [CrossRef] [Scilit] [PubMed]
- Cavalcante, F.T.T.; Ferreira, A.M.; Rocha-Santos, T.; De Santiago-Aguiar, R.S.; Coutinho, J.A.P. Analytical strategies for micro- and nanoplastics in aqueous matrices: Progress and the separation bottleneck. TrAC Trends Anal. Chem. 2026, 200, 118823. [Google Scholar] [CrossRef] [Scilit]
- Van Cauwenberghe, L.; Claessens, M.; Vandegehuchte, M.; Janssen, C. Microplastics are taken up by mussels (Mytilus edulis) and lugworms (Arenicola marina) living in natural habitats. Environ. Pollut. 2015, 199, 10–17. [Google Scholar] [CrossRef] [Scilit] [PubMed]
- Li, R.; Zhang, L.; Xue, B.; Wang, Y. Abundance and characteristics of microplastics in the mangrove sediment of the semi-enclosed Maowei Sea of the south China sea: New implications for location, rhizosphere, and sediment compositions. Environ. Pollut. 2019, 244, 685–692. [Google Scholar] [CrossRef] [Scilit] [PubMed]
- Merzel, R.L.; Purser, L.; Soucy, T.L.; Olszewski, M.; Colón-Bernal, I.; Duhaime, M.; Elgin, A.K.; Banaszak Holl, M.M. Uptake and Retention of Nanoplastics in Quagga Mussels. Glob. Chall. 2020, 4, 1800104. [Google Scholar] [CrossRef] [Scilit] [PubMed]
- Valsesia, A.; Quarato, M.; Ponti, J.; Fumagalli, F.; Gilliland, D.; Colpo, P. Combining microcavity size selection with Raman microscopy for the characterization of Nanoplastics in complex matrices. Sci. Rep. 2021, 11, 362. [Google Scholar] [CrossRef] [Scilit] [PubMed]
- Valsesia, A.; Parot, J.; Ponti, J.; Mehn, D.; Marino, R.; Melillo, D.; Muramoto, S.; Verkouteren, M.; Hackley, V.A.; Colpo, P. Detection, counting and characterization of nanoplastics in marine bioindicators: A proof of principle study. Microplastics Nanoplastics 2021, 1, 5. [Google Scholar] [CrossRef] [Scilit]
- Wang, Z.; Pilechi, A.; Ariya, P.A. Waterborne nanoplastics and microplastics: Analytical advances, modelling, and future directions. Environ. Sci. Nano 2026, 13, 1776–1802. [Google Scholar] [CrossRef] [Scilit]
- Wang, Z.; Saadé, N.K.; Panetta, R.J.; Ariya, P.A. A HoLDI mass spectrometry platform for airborne nanoplastic detection. Commun. Chem. 2025, 8, 90. [Google Scholar] [CrossRef] [Scilit] [PubMed]
- Vitali, C.; Peters, R.J.B.; Janssen, H.G.; Nielen, M.W.F. Microplastics and nanoplastics in food, water, and beverages; part I. occurrence. TrAC—Trends Anal. Chem. 2023, 159, 116670. [Google Scholar] [CrossRef] [Scilit]
- Mikac, L.; Rigó, I.; Himics, L.; Tolić, A.; Ivanda, M.; Veres, M. Surface-enhanced Raman spectroscopy for the detection of microplastics. Appl. Surf. Sci. 2023, 608, 155239. [Google Scholar] [CrossRef] [Scilit]
- Bernatova, S.; Foti, A.; Kizovsky, M.; Donato, M.; Marago, O.; Magazzu, A.; Jezek, J.; Zemanek, P.; Gucciardi, P.G. Detection of microplastics and nanoplastics: Are Raman tweezers and enhanced Raman methods the solution for sub 20 µm particles? EPJ Web Conf. 2024, 309, 10001. [Google Scholar] [CrossRef] [Scilit]
- Masseroni, A.; Schirinzi, G.F.; Villa, S.; Pozzi, S.; Paoli, F.; Ponti, J.; Valsesia, A.; Lencioni, V. Investigating the presence of nanoplastics in freshwater chironomids from glacial habitats using Raman spectroscopy. Environ. Toxicol. Chem. 2025, 44, 1770–1778. [Google Scholar] [CrossRef] [Scilit] [PubMed]
- Facchetti, S.V.; La Spina, R.; Fumagalli, F.; Riccardi, N.; Gilliland, D.; Ponti, J. Detection of metal-doped fluorescent pvc microplastics in freshwater mussels. Nanomaterials 2020, 10, 2363. [Google Scholar] [CrossRef] [Scilit] [PubMed]
- Wolinski, A.; Ferret, M.; Bergeron, B.; Tettling, L.; Lavergne, E.; Pruski, A.M.; Calvès, I.; Meistertzheim, A.-L.; Lartaud, F. Marine and freshwater mussels as biomonitors for microplastic concentrations: A comparative laboratory study. Aquat. Toxicol. 2025, 291, 107659. [Google Scholar] [CrossRef] [Scilit] [PubMed]
- Rodrigues, J.M.S.; de Oliveira, A.E.P.; Amado, L.L.; Dipold, J.; Wetter, N.U.; Freitas, A.Z.; Ferreira, M.A.P.; da Rocha, R.M. Short-term depuration reduces the levels of microplastics of a commercial mussel from Eastern Amazon. Environ. Sci. Pollut. Res. 2026, 33, 10963–10974. [Google Scholar] [CrossRef] [Scilit] [PubMed]
- Blasco, N.; Ibeas, M.; Aramendia, J.; Castro, K.; Soto, M.; Izagirre, U.; Garcia-Velasco, N. Depuration kinetics and accumulation of microplastics in tissues of mussel Mytilus galloprovincialis. Mar. Environ. Res. 2024, 202, 106731. [Google Scholar] [CrossRef] [Scilit] [PubMed]
- Schirinzi, G.F.; Bucher, G.; de Passos, M.S.P.; Modesto, V.; Serra, M.Á.; Gilliland, D.; Riccardi, N.; Ponti, J. Exploring Nanoplastics Bioaccumulation in Freshwater Organisms: A Study Using Gold-Doped Polymeric Nanoparticles. Nanomaterials 2025, 15, 116. [Google Scholar] [CrossRef] [Scilit] [PubMed]
- Della Torre, C.; Riccardi, N.; Magni, S.; Modesto, V.; Fossati, M.; Binelli, A. First Comparative Assessment of Contamination by Plastics and Non-Synthetic Particles in Three Bivalve Species from an Italian Sub-Alpine Lake. Environ. Pollut. 2023, 330, 121752. [Google Scholar] [CrossRef] [Scilit] [PubMed]
- Schirinzi, G.F.; Seghers, J.; Roncari, F.; Valsesia, A.; Emteborg, H. Controlled Modification of the Hydrophilicity of Polyethylene Terephthalate Micro- and Nanoplastic Particles and Their Analysis in Bottled Drinking Water. Anal. Bioanal. Chem. 2026. [Google Scholar] [CrossRef] [Scilit] [PubMed]
- Kelpsiene, E.; Torstensson, O.; Ekvall, M.T.; Hansson, L.-A.; Cedervall, T. Long-Term Exposure to Nanoplastics Reduces Life-Time in Daphnia Magna. Sci. Rep. 2020, 10, 5979. [Google Scholar] [CrossRef] [Scilit] [PubMed]
- ten Hietbrink, S.; Materić, D.; Holzinger, R.; Groeskamp, S.; Niemann, H. Nanoplastic Concentrations across the North Atlantic. Nature 2025, 643, 412–416. [Google Scholar] [CrossRef] [Scilit] [PubMed]
- Xu, Y.; Ou, Q.; Jiao, M.; Liu, G.; van der Hoek, J.P. Identification and Quantification of Nanoplastics in Surface Water and Groundwater by Pyrolysis Gas Chromatography–Mass Spectrometry. Environ. Sci. Technol. 2022, 56, 4988–4997. [Google Scholar] [CrossRef] [Scilit] [PubMed]
- Bulannga, R.B.; Schmidt, S. Micro- and Nanoplastics in Freshwater Ecosystems—Interaction with and Impact upon Bacterivorous Ciliates. Front. Earth Sci. 2024, 12, 1349865. [Google Scholar] [CrossRef] [Scilit]
- Rajtar, N.; Starek, M.; Vincenti, L.; Dąbrowska, M.; Romek, M.; Rinaldi, R.; Lionetto, F.; Kepczynski, M. Effect of PET Micro/Nanoplastics on Model Freshwater Zooplankton. Polymers 2025, 17, 1256. [Google Scholar] [CrossRef] [Scilit] [PubMed]
- Jüngling, I.S.; Schmitt, L.; De Franceschi, F.; Da Costa Filho, P.A.; Lei, L.; Coic, L.; Benismail, N.; Dubascoux, S.; Ambühl, M.E.; Ivleva, N.P. Challenges and Solutions in the Analysis of Micro- and Nanoplastics down to 500 nm with Automated Raman Microspectroscopy: Suitable Filters, Accuracy in the Detection, Identification, and Quantification. Anal. Bioanal. Chem. 2026, 418, 5283–5302. [Google Scholar] [CrossRef] [Scilit] [PubMed]
- Schymanski, D.; Goldbeck, C.; Humpf, H.-U.; Fürst, P. Analysis of Microplastics in Water by Micro-Raman Spectroscopy: Release of Plastic Particles from Different Packaging into Mineral Water. Water Res. 2018, 129, 154–162. [Google Scholar] [CrossRef] [Scilit] [PubMed]
- Shiwani, S.; Latka, I.; Islam, S.M.M.; Popp, J.; Schie, I.W. Characterizing the Influence of Filter Substrates on Raman Measurements of Microplastics. Anal. Chem. 2026, 98, 22359–22373. [Google Scholar] [CrossRef] [Scilit] [PubMed]
- Vaughn, C.C.; Hakenkamp, C.C. The Functional Role of Burrowing Bivalves in Freshwater Ecosystems. Freshw. Biol. 2001, 46, 1431–1446. [Google Scholar] [CrossRef] [Scilit]
- Verma, A.K.; Rahman, A.; Hussain, S.; Singh, N.S. Freshwater Mussels as Multifaceted Ecosystem Engineers: Insights into Their Ecological Importance, Bioindication, and Economic Contributions. Water 2025, 17, 1629. [Google Scholar] [CrossRef] [Scilit]
- Seghers, J.; Cella, C.; Pequeur, E.; La Spina, R.; Roncari, F.; Valsesia, A.; Mehn, D.; Gilliland, D.; Trapmann, S.; Emteborg, H. Approaches for the Preparation and Evaluation of Hydrophilic Polyethylene and Polyethylene Terephthalate Microplastic Particles Suited for Toxicological Effect Studies. Anal. Bioanal. Chem. 2025, 417, 2589–2602. [Google Scholar] [CrossRef] [Scilit] [PubMed]
- Jacob, O.; Stefaniak, E.A.; Seghers, J.; La Spina, R.; Schirinzi, G.F.; Chatzipanagis, K.; Held, A.; Emteborg, H.; Koeber, R.; Elsner, M.; et al. Towards a Reference Material for Microplastics’ Number Concentration—Case Study of PET in Water Using Raman Microspectroscopy. Anal. Bioanal. Chem. 2024, 416, 3045–3058. [Google Scholar] [CrossRef] [Scilit] [PubMed]
- Bucher, G.; Schirinzi, G.F.; Verra, C.; El Hadri, H.; Geiss, O.; Gilliland, D. Total Organic Carbon (TOC): A Simple Tool for Assessing Micro(Nano)Plastics and Nanocellulose Recovery during Size-Based Fractionation. Anal. Bioanal. Chem. 2025, 417, 2983–2996. [Google Scholar] [CrossRef] [Scilit] [PubMed]
- Galimany, E.; Rose, J.M.; Dixon, M.S.; Alix, R.; Li, Y.; Wikfors, G.H. Design and Use of an Apparatus for Quantifying Bivalve Suspension Feeding at Sea. J. Vis. Exp. 2018, 2018, e58213. [Google Scholar] [CrossRef] [Scilit] [PubMed]

Disclaimer/Publisher’s Note: The statements, opinions and data contained in all publications are solely those of the individual author(s) and contributor(s) and not of MDPI and/or the editor(s). MDPI and/or the editor(s) disclaim responsibility for any injury to people or property resulting from any ideas, methods, instructions or products referred to in the content. |
© 2026 by the authors. Licensee MDPI, Basel, Switzerland. This article is an open access article distributed under the terms and conditions of the Creative Commons Attribution (CC BY) license.