


Abstract
Security concerns now lead many governments to restrict cross-border flows of data and digital services, while a growing number of trade agreements commit selected partners to open rules on data and e-commerce. We examine whether digital restrictions reduce international trade, whether their effect varies with the political alignment between partners, and how the trade effect of agreements with digital chapters differs across regulatory regimes. Our panel combines the OECD Digital Services Trade Restrictiveness Index (Digital STRI) with bilateral and within-country flows from the 2025 release of the OECD Trade in Value Added (TiVA) database for 64 economies over the period 2014–2022 (36,864 observations). We estimate a structural gravity model using PPML with exporter-by-year, importer-by-year and country-pair effects, using home sales to identify policies that apply equally to all partners. The composite index has no detectable average effect, and political distance based on UN voting does not alter it. Intellectual property restrictions, however, do matter: for partners without an agreement, a one-standard-deviation increase is associated with about 10% less international trade; a smaller association for payment restrictions (about 5%) does not survive the Holm adjustment and is unstable under the bias corrections. The trade effect of agreements with digital chapters rises with the importer’s restrictiveness, from about −6% for the most open importers to +17% at the 90th percentile, or to about +10% when only foreign partners are compared. The gradient remains positive under both jackknife bias corrections and is robust to agreement-level inference and to the exclusion of each major agreement. Event-study and staggered-adoption estimates confirm it but show that trade between future partners was already rising before agreements took effect. The estimates therefore describe how agreement effects differ across regulatory regimes; they do not show that agreements causally shield trade from tightening restrictions.
1. Introduction
Security considerations increasingly drive trade policy. Tariffs, export controls, investment screening and rules on data are now deployed to protect national security as much as to manage commerce [1]. Gravity estimates indicate that, since 2022, trade and foreign investment across rival geopolitical blocs have weakened relative to flows within those blocs [2]. The pandemic reinforced this shift, as disrupted supply chains led governments to value resilience above pure efficiency [3]. Evidence from the tariff conflict between the United States and China shows that such measures impose sizeable costs borne by many actors [4,5,6], and supply chains are already being reorganised in response [7]. Industrial policy has returned to the centre of policy debate [8], and geoeconomics has become a research field in its own right [9].
Digital policy is central to this shift. By reducing the costs of search, replication, transport, tracking and verification, digital technologies lower the cost of organising production across several countries [10]. Many states, however, now require data to be stored locally, limit cross-border data transfers, and cap foreign ownership of telecommunications networks. The OECD Digital Services Trade Restrictiveness Index (Digital STRI) shows that these barriers are widespread and that several countries tightened them after 2014 [11]. Earlier work links restrictions on cross-border data flows to lower imports of data-intensive services [12], and privacy regulation has been found to depress online activity [13].
These measures raise a question that existing evidence cannot yet answer. Global value chains (GVCs) rely on a constant exchange of data, designs, payments and services among firms located in different countries [14,15]. A manufacturer that assembles goods abroad needs cloud access to share designs, payment channels to settle invoices and licensing arrangements to protect its technology; a barrier to any of these also raises the cost of trading the physical goods. If digital barriers operate through this coordination channel, studies that measure their effect on services trade alone understate their cost. Such studies also cannot tell whether the burden falls on intermediate inputs, which tie production networks together, or on final products. The distinction matters for research because it determines which trade flows a gravity model of digital policy should explain. It also matters for practice: firms deciding where to source inputs and how to serve restrictive markets need to know whether digital rules affect goods-based supply chains or only digitally delivered services. Most studies nonetheless examine services alone [12,16,17], and few distinguish intermediate inputs from final products.
A second question concerns the motive behind these restrictions. Governments often defend data localisation, limits on data transfers and rules on network equipment on security grounds. Such rules usually apply formally to all foreign suppliers, yet they may be enforced more strictly against suppliers from countries regarded as strategic rivals, for example through vetting, licensing or certification. If security is the real motive, the trade cost of a given restriction should be larger between politically distant partners than between allies; if it is not, the restriction behaves like an ordinary non-discriminatory barrier. Testing this distinction indicates to policymakers whether digital rules are a channel of geoeconomic fragmentation [1,2], and to firms whether political alignment should enter their assessment of regulatory risk. To our knowledge, no study has examined this question. A third question is whether selective openness through trade agreements changes this picture. Many governments that keep restrictive general rules also sign agreements with digital chapters [18], but it is not known whether such agreements are more valuable where the general regime is restrictive.
We therefore address three research questions, whose answers we summarise here:
- RQ1. Do digital trade restrictions lower international trade, including trade in intermediate inputs? The composite Digital STRI has no detectable average effect, but intellectual property restrictions are associated with about 10% less international trade with partners without an agreement per standard deviation; a smaller association for payment restrictions (about 5%) does not survive the Holm adjustment and is unstable under the bias corrections.
- RQ2. Is the effect larger between geopolitically distant partners, as a security-based explanation would suggest? We find no detectable difference, and equivalence tests rule out differences larger than about 4% per standard deviation of political distance.
- RQ3. How does the trade effect of agreements with digital chapters vary with the importer’s digital restrictiveness? The effect rises from about −6% for the most open importers to between +10% and +17% for the most restrictive, with no detectable difference between inputs and final products. Event-study evidence shows that this gradient reflects differences across regulatory regimes, and partly anticipation or partner selection, rather than a causal response to tightening restrictions.
The paper makes three contributions. First, we apply the method of Heid, Larch and Yotov [19] to the study of digital policy. Adding home sales from TiVA allows us to estimate the effect of an index that varies only by country and year, even though the gravity model includes exporter-by-year, importer-by-year and pair effects. Earlier studies of digital trade either cannot identify such indices because the multilateral resistance terms absorb them, or omit those terms altogether; our approach avoids both problems. Second, we interact digital restrictions with a continuous measure of political distance based on voting in the UN General Assembly [20], thereby connecting research on digital trade with the growing literature on geoeconomic fragmentation. Third, we show how the trade effect of agreements with digital chapters varies with the importer’s regulatory regime, distinguish between new agreements and chapters added to existing ones, and trace trade before and after adoption using event-study and staggered-adoption estimators [21,22].
The findings have practical implications, which we develop in Section 6. Two stand out. First, for firms and supply chain managers, trade with a restrictive market is considerably higher when the exporting country is linked to it by an agreement with a digital chapter: at the 90th percentile of importer restrictiveness, agreement coverage is associated with 10–17% more trade, and the gain for intermediate inputs is as large as that for final products. This suggests that decisions on where to locate assembly or source inputs destined for restrictive markets may need to weigh agreement coverage, which brings tariff and institutional commitments as well as digital rules, alongside tariffs and logistics. Second, not all digital rules are equally costly. Intellectual property rules are associated with measurable trade costs, the evidence for payment rules is weaker, and infrastructure rules show no average association, which suggests that the trade costs associated with digital rules are concentrated in intellectual property. The pattern also sheds light on observed behaviour: much of the new agreement coverage in our sample comes from large regional agreements such as the CPTPP and RCEP, whose members include economies with restrictive digital regimes. Our estimates indicate that these are the settings in which digital chapters are associated with the largest trade gains.
Section 2 reviews related work and states the hypotheses. Section 3 presents the data and estimation strategy. Section 4 reports the estimates, the evidence on agreement timing and the robustness tests; Section 5 compares the findings with earlier studies; and Section 6 sets out the policy and managerial implications and the limitations.
2. Literature Review and Hypotheses
The literature relevant to our questions falls into three thematic streams. The first, on digital connectivity and digital trade restrictions (Section 2.1 and Section 2.2), establishes that digital technologies lower trade costs and that restrictions raise them, mostly for services. The second, on global value chains and geoeconomic fragmentation (Section 2.3 and Section 2.4), explains why digital barriers may affect goods trade and why their effect may depend on political alignment. The third, on deep and digital trade agreements (Section 2.5), examines whether preferential rules can offset unilateral barriers. Section 2.6 synthesises the three streams and identifies the gap we address.
2.1. Digital Connectivity and International Trade
One line of work shows that the internet lowers trade costs. Freund and Weinhold link the spread of the internet to faster growth in services trade [23] and in exports overall, with the largest gains for developing economies [24]. Distance nevertheless continues to matter online: Blum and Goldfarb [25] report that even for goods delivered entirely in digital form, users favour websites based in nearby countries, which they attribute to cultural and information frictions. Online marketplaces appear to reduce these frictions considerably. Trade on eBay is far less sensitive to distance than offline trade, a gap that reflects the role of seller ratings and search tools in reducing information costs [26]. Ratings published by marketplaces also shape operational decisions within supply chains: when delivery-time ratings are displayed, coordinated retailers and suppliers can shorten promised delivery times without losing reliability [27]. Within the European Union, online cross-border purchases depend less on distance than offline purchases but more on language [28]. Goldfarb and Tucker [10] set out the underlying mechanism in terms of falling costs of search, copying, transport, tracking and verification. A recent multi-country study finds that higher bandwidth and internet use increase both within-country and cross-border trade, while digital clauses in trade agreements benefit exporters from rich countries, above all in services [29]. Work carried out by the OECD likewise finds that connectivity increases trade and that digital chapters can strengthen the effect of an agreement [30].
Papers in this journal have applied these ideas to electronic commerce. Wang et al. [31] estimate a gravity model for China and 178 partners over the period 2006–2019 and find that international e-commerce raises Chinese exports while weakening the negative effect of distance. In a sample of 133 countries, Paun et al. [32] show that the quality of regulation, financial access and ICT infrastructure explain how widely e-commerce is adopted. Reviewing the Chinese literature, Liu et al. [33] identify customs procedures, oversight, tax refunds and payment risk as the main obstacles to cross-border e-commerce, and Qiu et al. [34] find that customs, payment and tax policy influence whether exporting firms engage in it. These contributions confirm that the digital environment matters for trade but do not separate the effect of unilateral restrictions from that of digital trade agreements.
2.2. Digital Trade Restrictions: Measurement and Effects
Regulation has expanded alongside digital commerce. Requirements to store data locally, limits on transferring data abroad, rules that oblige foreign suppliers to set up a local office and caps on foreign stakes in telecommunications are all becoming more common. Whether these rules count as “digital protectionism” depends on whether they serve legitimate aims through the least trade-distorting means available [35]. Policy research treats data regulation as a balance between openness and goals such as privacy and security [36], and examines how far WTO law and newer agreements can govern cross-border data flows [37,38].
Measurement has kept pace. Using the OECD Services Trade Restrictiveness Index, Nordås and Rouzet showed that barriers to services lower both services imports and exports, and that differences in regulation between partners reduce trade further [16]. The Digital STRI applies the same logic to horizontal barriers that affect services supplied digitally, grouped into five areas: infrastructure and connectivity, electronic transactions, payment systems, intellectual property rights, and other barriers [11]. When first applied to the G20, it identified telecommunications infrastructure and burdens on data transfers as the most restrictive areas [39]. Other indices track data policies [12] and online platforms [40], and an early simulation study estimated substantial economy-wide costs of data rules [41].
Econometric studies broadly agree. Restrictions on data flows reduce imports of data-intensive services [12] and weaken productivity in user industries and firms [42]. Barriers to digital trade lower bilateral digital trade, especially when they are imposed by the importing country [17]. Within the Digital STRI, the payment and intellectual property areas appear to harm the export efficiency of digital services the most [43]. For the General Data Protection Regulation of the European Union, firm-level data show that recorded page views and website revenue fell by roughly 12% after the rules took effect [13]. Intellectual property has long been studied as a trade cost: tighter patent protection raises manufacturing imports into the protecting country [44], weak patent rights hold back US exports to countries able to imitate easily [45], and stronger patents boost high-technology exports to the developing world [46]. Payment frictions are likewise among the main obstacles to cross-border e-commerce [33,34]. Our first hypothesis follows.
H1.
A more restrictive digital regime in the importing country lowers its international trade relative to its home sales.
2.3. Digital Restrictions and Global Value Chains
Inputs that cross several borders are counted repeatedly in gross trade data. Value-added accounting removes this double counting and reveals the true structure of production links [47,48], and a large body of research now measures the extent of countries’ participation in GVCs and their position within them [49,50]. Such networks depend on coordinating tasks across firms and borders [14,15], and services such as telecommunications, transport, finance and business support make up a large and rising part of the value contained in manufactured exports [51]. A study in this journal finds that digital development improves both the participation and the position of service sectors in GVCs, in part by cutting the cost of trading services [52]. Because digital barriers make these coordinating services more expensive, they should reduce trade in goods that use digital services as inputs, and not only trade in services. Yet most analyses of digital barriers use gross services flows [12,16,17], leaving their effect on total trade and on input trade largely unexamined.
Following this reasoning, we estimate our models on total bilateral trade in goods and services rather than on services alone. We further compare flows of intermediate inputs with flows of final products; if the supply chain channel is at work, inputs should respond at least as strongly.
2.4. Economic Security, Geopolitics and Fragmentation
Research on geoeconomic fragmentation, broadly defined as the use of economic tools for strategic and security purposes, has expanded rapidly [9]. Aiyar et al. [1] trace the spread of security-motivated trade barriers and project potentially large output losses, and a volume edited by Aiyar, Presbitero and Ruta [53] assesses the risks for trade, investment and finance. Gopinath et al. [2] show that, since 2022, trade and FDI across geopolitical blocs have weakened relative to flows inside them, while non-aligned “connector” economies have gained ground. Measuring alignment with UN votes, Qiu, Xia and Yetman [54] find that between 2017 and 2023 trade among politically distant countries grew about 2.5% more slowly each quarter than trade among aligned ones.
The trade war between the United States and China has received the most attention. The 2018 tariffs were passed on almost entirely to US import prices and lowered US real income [4,5,6]. Meanwhile, third countries increased their sales of the targeted products both to the United States and to other destinations [55], and US trade measures have begun to reorganise supply chains [7]. Industrial policy has regained a central place in policy debates [8], and model simulations indicate that friendshoring or full decoupling would bring large and lasting welfare losses [56,57]. Baldwin and Freeman [3] contend that policy shocks now drive supply chain risk as much as natural disasters or pandemics do.
Security arguments are often used to justify digital restrictions, for example to protect critical networks or sensitive data. If that motive is real, the restrictions should reduce trade most between politically distant partners. A rule that is formally uniform may also be applied more strictly to such partners through additional scrutiny, licensing or certification requirements. To our knowledge, no study has tested this interaction. We measure political distance with ideal points estimated from votes in the UN General Assembly [20]. Simple shares of matching votes can be misleading unless they are corrected for chance agreement [58]; ideal points, moreover, remain comparable over time because they adjust for changes in the voting agenda [20].
H2.
The trade-reducing effect of digital restrictions grows with the political distance between partners.
2.5. The Role of Digital Trade Agreements
Trade agreements now reach far beyond tariff cuts. Recent treaties cover investment, competition, intellectual property and, increasingly, digital trade [59], and deeper agreements generate more trade among their members while diverting less trade from non-members [60]. The TAPED database records how e-commerce and data clauses have spread through trade agreements since 2000, ranging from general pledges to cooperate to binding commitments on data flows, data localisation, e-authentication and duties on electronic transmissions [18]. The impact of agreements also differs greatly, both from one agreement to another and among pairs covered by the same agreement [61], and agreements can shift trade away from non-members [62].
Evidence on digital clauses is accumulating. Agreements that include them raise digital trade among signatories, particularly when the commitments are precise and enforceable [17,30]. Provisions that facilitate digital trade increase trade, particularly services exports from high-income countries [29]. Drawing on TAPED, Jiang et al. [63] show that digital trade rules boost exports of digital services and that low- and middle-income countries gain more. If agreements secure openness among their members, their value should be greatest where a partner’s general regime is most restrictive, because that is where the preferential access granted to members differs most from the treatment of outsiders.
H3.
The trade effect of agreements containing digital trade provisions is larger when the importing country’s general digital regime is more restrictive.
2.6. Synthesis and Research Gap
Table 1 summarises the three streams. Taken together, they suggest that digital restrictions raise trade costs, that these costs should reach goods-based supply chains, that security motives could make them discriminatory in practice, and that agreements could carve out exceptions for members. Yet the three streams have largely developed in isolation. The restriction literature mostly uses services flows and leaves agreements aside; the fragmentation literature measures political alignment but not digital rules; and the agreement literature estimates average effects without asking how they depend on the partner’s unilateral regime. Our study brings the three together in one structural gravity framework with home sales, so that the composite index, its interaction with political distance and its interaction with agreements are estimated jointly.
Table 1.
Thematic streams of the literature and the gap addressed in this study.
3. Data and Methodology
3.1. Theoretical Framework
Our starting point is the structural gravity framework developed by Anderson [64] and by Anderson and van Wincoop [65]. In this framework, trade from exporter i to importer j in year t rises with the size of both economies, falls with the cost of trading between them, and depends on each country’s overall remoteness from all its partners, captured by multilateral resistance. In the usual notation [66,67]:
X denotes the flow from i to j, Y the exporter’s output, E the importer’s expenditure, t the bilateral trade cost, Π and P outward and inward multilateral resistance, and σ the elasticity of substitution. Digital barriers work through the trade cost term. A barrier set by the importer makes it more expensive to serve that market from abroad while leaving the cost of serving it domestically unchanged.
3.2. Empirical Specification
Estimation uses Poisson pseudo-maximum likelihood (PPML), which remains consistent when errors are heteroskedastic and which keeps zero trade values in the sample [68]. Fixed effects for each exporter-year and importer-year absorb multilateral resistance, together with any variable defined at the country-year level, and Poisson estimation with these effects respects the adding-up conditions implied by structural gravity [69]. Country-pair fixed effects account for bilateral trade costs that do not change over time and help address the endogeneity of trade agreements [67,70].
Since the Digital STRI varies only across countries and years, it would be perfectly collinear with the country-year effects if used on its own. We follow Heid, Larch and Yotov [19], as well as earlier work that uses within-country flows to measure border and distance effects [71,72], by including flows where i = j and multiplying the index by an indicator for cross-border flows. Barriers to cross-border digital services do not apply to sales within a country, so the coefficient is identified from variation in a country’s international trade relative to its home sales. Once home sales are included, the version of this term based on the exporter’s index and the version based on the importer’s index draw on identical variation, and only one can be estimated. We therefore use a single term and interpret it as the effect of a country’s digital restrictiveness on its international trade relative to its home sales. The terms that combine the index with political distance and with digital trade agreements differ across the partners of a given importer in a given year, so they are estimated from bilateral variation. The full model reads:
The terms in this equation are:
- X: goods and services shipped from i to j in year t; when i = j it measures home sales.
- DSTRI: the Digital STRI, standardised to a mean of zero and a standard deviation of one across the 576 country-years in our sample.
- INTL: a dummy set to 1 for cross-border flows and 0 for home sales.
- GEO: political distance with a one-year lag, standardised to a mean of zero and a standard deviation of one across cross-border pairs (so that GEO = 0 denotes average distance) and set to 0 for home sales.
- DTA: a dummy set to 1 when the two countries share an agreement in force that contains a dedicated digital trade or e-commerce chapter.
- RTA: a dummy set to 1 when any regional trade agreement links the two countries.
- INTL × D_s: border-by-year dummies that capture common globalisation trends [73].
- π, χ, μ: exporter-by-year, importer-by-year and country-pair fixed effects.
- H1 predicts a negative β1, H2 a negative β2 and H3 a positive β3. As the indices are standardised, the expression (exp (β) − 1) × 100 gives the percentage response of trade to a one-standard-deviation shift. Because the model contains interactions, β1 is not an average effect over all pairs: it is the effect of restrictiveness for a pair without an agreement at average political distance. Likewise, γ2 is the effect of an agreement with a digital chapter for an importer of average restrictiveness, and γ1 + γ2 + β3·DSTRI is the effect of a new agreement that switches on both indicators. Section 4.2 therefore reports conditional effects with confidence intervals obtained by the delta method.
3.3. Data
Trade flows are total gross exports of goods and services (TiVA indicator EXGR, summed over industries, in millions of current US dollars) from the 2025 release of the OECD TiVA database. TiVA is built from the OECD Inter-Country Input–Output tables and spans 81 economies from 1995 to 2022 [74]. Following common practice in structural gravity work, home sales equal gross output (indicator PROD) less total gross exports to the world [66]. Both series come from the same input–output tables, so home sales are measured consistently with cross-border flows. They cover goods and services produced and sold within the economy, including intermediate inputs. Because the Digital STRI begins in 2014 [11], our panel runs from 2014 to 2022. Of the 81 economies in TiVA, 64 are also covered by the Digital STRI. The economies excluded are Bangladesh, Belarus, Bulgaria, Côte d’Ivoire, Croatia, Cyprus, Egypt, Hong Kong (China), Jordan, Malta, Morocco, Nigeria, Romania, Chinese Taipei, Ukraine, the United Arab Emirates and the TiVA aggregate for all other countries. This yields a balanced panel of 64 × 64 × 9 = 36,864 observations, none of which records zero cross-border trade. Section 4.4 additionally draws on bilateral exports of inputs (EXGR_INT) and of final products (EXGR_FNL) from TiVA; together, these add up to total gross exports. Table 2 summarises the variables and their sources.
Table 2.
Variables used in the analysis and their sources.
The five components of the Digital STRI (infrastructure and connectivity, electronic transactions, payment systems, intellectual property rights, and other barriers) add up to the overall index [11]. To build the RTA dummy from WTO records, we split blocs such as the European Union, ASEAN, EFTA and MERCOSUR into their member countries in each year; the United Kingdom, for instance, exits the EU after 2020 and joins the EU–UK agreement from 2021. The DTA dummy is based on 147 agreements with a dedicated digital chapter, including stand-alone digital economy agreements such as the DEPA and the digital trade agreement between Japan and the United States. It switches on in the year in which the agreement containing the chapter enters into force, as recorded in TAPED. Because the Democratic Republic of the Congo lacks an ideal point for 2022, we use its 2021 value.
Pairs are directed, so each country pair appears twice. In 2014, 812 directed pairs were already covered by an agreement with a digital chapter. Between 2015 and 2022, a further 442 directed pairs (221 country pairs) became covered through 36 agreements; seven of them (the CPTPP, RCEP, and the EU agreements with Canada, Japan, Singapore, the United Kingdom and Viet Nam) account for 360 of these switches. In 184 cases, the two countries were already linked by a trade agreement, so the digital chapter was added to existing preferences (44 of these are EU–UK pairs, whose relationship changed with Brexit); in the remaining 258 cases, there was no agreement in force in the preceding year. Table 3 lists the digital commitments contained in the 81 agreements with a dedicated chapter that link at least two sample economies and were in force by 2022, and indicates how many of these commitments are binding.
Table 3.
Digital commitments in agreements with a dedicated chapter linking sample economies (81 agreements in force by 2022).
Almost all agreements bind members not to levy duties on electronic transmissions, and most also address e-signatures, consumer protection and personal data, although mainly in best-endeavour language. Binding rules on free data flows, bans on localisation requirements and protection of source code appear in only 13–17 agreements. Our DTA dummy therefore captures a bundle of commitments of varying depth, and its estimated effect should be read as that of agreements with digital chapters rather than of any single provision.
3.4. Estimation
We estimate every model by PPML with three high-dimensional sets of fixed effects using the Python package pyfixest (version 0.60.0) [77], whose estimator matches that of ppmlhdfe [78]. In line with current guidance on estimating gravity models [79], standard errors are clustered by country pair. Weidner and Zylkin [80] show that three-way PPML estimates are asymptotically biased because of the exporter-year and importer-year effects, and that cluster-robust standard errors tend to be too small. We therefore report jackknife bias-corrected estimates and alternative inference in Section 4.7.
All computations were carried out in Python 3.13 with pyfixest 0.60.0, pandas 3.0.5, NumPy 2.5.3 and SciPy 1.18.1; the figures were drawn with matplotlib 3.11.2. The random seeds are fixed in the code: seed 7 for the country-split jackknife and seed 20261029 for the wild score bootstrap; the time-split jackknife uses fixed splits and involves no randomness. A generative artificial intelligence tool, Claude (Anthropic; model Claude Opus 5.5), was used in the analysis. At the authors’ request, it wrote the Python code that assembles and merges the data, cleans and transforms the variables, estimates all models, and produces the tables and figures, and it executed this code; its role therefore went beyond helping the authors prepare commands. It also drafted parts of the text, including the descriptions of the results and the responses to reviewers, which the authors revised. The authors specified the research questions, data sources, variable definitions and estimation strategy, reviewed the code and the results, and are responsible for the interpretation. The merged dataset and the complete code provided as Supplementary Materials reproduce all tables and figures.
3.5. Robustness Checks and Agreement Adoption
We assess the stability of the results with five groups of tests. The first group concerns measurement. Because the composite index may average out components with opposite effects, we replace it with each of its five components in turn. We also measure political distance with ideal points based on foreign-policy votes only, and we extend the DTA dummy to agreements with any e-commerce clause rather than a dedicated chapter.
The second group concerns timing. Trade may adjust to policy changes with a delay, so we keep only every third year (2016, 2019 and 2022) [66,81] and lag the Digital STRI by one and by two years. As placebo tests, we replace the index with its values one and two years ahead; if these leads mattered as much as the current index, the interaction would not reflect a response to current policy. We also hold the index at its 2014 level, which separates differences in agreement effects across regulatory regimes from reactions to policy changes.
The third group concerns the sample. We drop pairs within the European Union, drop EU–UK pairs (whose agreement status changed with Brexit), drop China and Russia, drop pairs covered by an agreement throughout the period, and split importers into OECD and non-OECD members. For the two hypotheses that the data do not support, and for the comparison between inputs and final products, we add two one-sided equivalence tests [82], which assess whether the confidence interval excludes differences of a given economic size.
The fourth group addresses the adoption of agreements. Pair fixed effects remove time-invariant bilateral differences but do not rule out the possibility that countries sign agreements because their trade is already changing. We therefore distinguish digital chapters added to an existing agreement from new agreements, estimate event-study models that trace trade in the years before and after entry into force and signature, and apply a staggered-adoption estimator with cohort-by-year effects [21,22]. In the last two exercises, the importer’s Digital STRI is held at its 2014 value so that the gradient is measured with respect to the regime in place before adoption.
The fifth group concerns estimation and inference. We correct for incidental-parameter bias with two split-sample jackknives, one that splits the sample by countries [83] and one that splits it by time [84]. Because the five components of the index are correlated, we estimate a joint model with all components and their interactions, and we adjust the p-values of the component tests for multiple testing with the Holm [85] and Benjamini–Hochberg [86] procedures. Because seven agreements account for most of the switches in agreement coverage, we drop the pairs covered through each of them in turn, cluster standard errors at the agreement, adoption-cohort and importer levels and two-way by exporter and importer, and compute wild score bootstrap p-values [87,88].
4. Results
4.1. Descriptive Statistics
Digital restrictiveness increased slightly over the sample period. Across the 64 economies, the mean Digital STRI fell from 0.171 in 2014 to 0.161 in 2015, rose to 0.186 by 2019 and stood at 0.182 in 2022. Comparing 2014 with 2022, and treating changes smaller than 0.005 as no change, the index rose in 30 economies, fell in 13 and remained unchanged in 21. Kazakhstan (+0.38), Russia (+0.27) and Türkiye (+0.16) recorded the sharpest increases, followed by Austria, Latvia and Poland (+0.14 each); Myanmar, Angola, Mexico and Brazil recorded the largest declines. Differences across countries dominate: changes within countries account for only 11% of the variance of the index. Coverage by digital trade agreements expanded rapidly, from 20.1% of country pairs in 2014 to 31.1% in 2022. Table 4 reports summary statistics.
Table 4.
Summary statistics, 2014–2022.
4.2. Baseline Results
Table 5 presents the main PPML estimates. Column (1) includes the interaction of the Digital STRI with the cross-border dummy; column (2) adds its interaction with political distance; column (3) instead adds its interaction with digital trade agreements; and column (4) includes all terms.
Table 5.
PPML estimates of digital restrictions and bilateral trade.
None of the four columns shows a meaningful effect of the composite index in the reference case, and every coefficient on DSTRI × INTL is small and statistically insignificant. In column (1), the 95% confidence interval ranges from −0.015 to 0.068, which excludes any average decline in cross-border trade larger than about 1.5% per standard deviation of restrictiveness. For the composite index, therefore, the data do not support H1.
The interaction with political distance is close to zero in columns (2) and (4) and far from statistically significant, so the data do not support H2. This does not, however, establish that no difference exists. The 90% confidence interval for the column (4) coefficient is [−0.032, 0.026], and a two one-sided equivalence test rejects differences of 0.04 or more in absolute value (p = 0.018) [82]. A one-standard-deviation increase in political distance therefore changes the effect of a one-standard-deviation rise in restrictiveness by less than about 4%, which rules out large differences but not small ones.
The interaction with digital trade agreements is sizeable, positive and significant at the 1% level. According to column (4), each additional standard deviation of importer restrictiveness raises the trade effect of a digital trade agreement by around 10.5%. Figure 1 shows what this implies across the distribution of restrictiveness. Among the most open importers (10th percentile, Digital STRI of 0.04), sharing a digital trade agreement is associated with 6.2% less trade; at the median the effect is close to zero (+1.0%); and among restrictive importers it becomes large, reaching +10.3% at the 75th percentile and +17.4% at the 90th. H3 is therefore supported: agreement effects are largest where unilateral barriers are highest.
Figure 1.
Trade effect of a digital trade agreement across levels of the importer’s Digital STRI. Dots show the estimated percentage change based on column (4) of Table 5, and bars show 95% confidence intervals. Orange markers denote negative and blue markers positive point estimates; the dashed line marks zero. Source: Authors’ estimates based on the data listed in Table 2.
Because of the interactions, the coefficients in Table 5 describe reference cases rather than averages. Table 6 therefore reports the conditional effects implied by column (4), with delta-method confidence intervals. Panel A shows the effect of a one-standard-deviation rise in the importer’s restrictiveness for different partners. For partners without an agreement, the effect is close to zero regardless of political distance. For agreement partners, the same rise in restrictiveness is associated with 9.3% more trade relative to home sales. Panel B distinguishes two cases. The first column, which corresponds to Figure 1, gives the effect of a digital chapter for a pair already linked by a trade agreement, so that only the DTA indicator changes; the second gives the effect of a new agreement that switches on both the RTA and the DTA indicators. For importers at the 90th percentile of restrictiveness, the two effects are +17.4% and +21.0%; for importers at the 10th percentile, neither is positive.
Table 6.
Conditional effects implied by Table 5, column (4). Panel A. Effect of a one-standard-deviation rise in the importer’s Digital STRI on international trade relative to home sales. Panel B. Effect of agreement coverage by the importer’s Digital STRI.
4.3. Which Restrictions Matter?
In Table 7, each of the five components replaces the composite index in turn, with all interactions and controls retained. The last column gives the conditional effect for agreement partners at average political distance.
Table 7.
Estimates by component of the Digital STRI.
Two components reduce cross-border trade with partners that have no agreement. Raising intellectual property restrictions by one standard deviation reduces international trade, relative to home sales, by 10.0%, and the reduction is the same for agreement partners (−10.3%), so agreements do not offset this barrier. The payment result requires more careful interpretation. The figure of −4.6% applies to partners without an agreement at the average political distance. For agreement partners, the combined coefficient is positive (−0.047 + 0.088 ≈ 0.040, p = 0.08), corresponding to +4.1% with a confidence interval that includes zero. Payment restrictions are therefore associated with less trade only where no agreement links the partners. Infrastructure, electronic transactions and the residual category show no significant effect in the reference case. The positive agreement interaction is driven by infrastructure and connectivity, payments and the residual category. For electronic transactions, the political distance term is positive (0.033), contrary to the sign predicted by H2; for politically close partners (10th percentile of GEO), the effect of this component is −5.9% (p = 0.04), and for distant partners it is not significant.
Because the five components are positively correlated across countries (correlations of 0.20–0.52; Table A1), the separate regressions in Table 7 may attribute to one component the influence of others. The correlations of within-country changes, which identify the coefficients, are lower (between −0.37 and 0.31), and the variance inflation factors are below 1.7, so a joint model can be estimated. Table A2 reports a model that contains all five components and their interactions. The intellectual property coefficient becomes larger in absolute value (−0.130, s.e. 0.029), and the payment coefficient is almost unchanged (−0.046, s.e. 0.018). The agreement interactions for infrastructure, payments and other barriers become smaller individually (0.036–0.043), because correlated components share a common gradient, but they remain jointly significant (χ2 (5) = 32.6, p < 0.001). Table A2 also reports p-values adjusted for the 15 tests in each model. In the separate regressions, the intellectual property coefficient (Holm p = 0.016), the agreement interactions for infrastructure, payments and other barriers (Holm p < 0.001) and the political distance interaction for electronic transactions (Holm p = 0.030) survive both adjustments. The payment coefficient survives the false-discovery-rate adjustment (q = 0.046) but not the Holm adjustment (p = 0.186). In the joint model, only the intellectual property coefficient and the political distance interaction for electronic transactions survive the Holm adjustment. We therefore regard the intellectual property result as robust and the payment result as suggestive.
4.4. Intermediate Versus Final Flows
If digital barriers and agreements operate through the organisation of supply chains, trade in inputs should react at least as much as trade in final products. TiVA does not split home sales by use, so this test uses cross-border flows alone, again with exporter-by-year, importer-by-year and pair effects. In this setting, the effect of the index in the reference case cannot be identified, but its interactions with political distance and with digital trade agreements can be, since they differ among the partners of each importer. Table 8 gives the estimates, and its final column reports a pooled regression that tests whether the input and final-product coefficients are equal.
Table 8.
Inputs versus final products (cross-border flows only).
The agreement interaction is positive and significant at the 1% level for both inputs (0.055) and final products (0.049). The gap between the two is small and statistically insignificant (0.005, p = 0.81), so we find no detectable difference between them. The 90% confidence interval for the gap is [−0.031, 0.041]; an equivalence test rejects gaps of 0.05 or more (p = 0.020) but not gaps of 0.04 (p = 0.056) [82]. Differences of up to about 4% per standard deviation of restrictiveness therefore cannot be excluded. For an importer at the 90th percentile of restrictiveness, a digital trade agreement is associated with 10.2% more trade in inputs and 8.7% more trade in final products. Agreements are thus associated with comparable additional trade in the components on which production networks rely and in final goods and services, in line with the supply chain channel. The political distance term remains insignificant in both cases.
Estimated on cross-border flows only, the agreement term for total trade equals 0.054, roughly half of the 0.100 obtained with home sales in Table 5. The difference arises from the role of home sales in the fixed effects. When we keep home sales but allow exporter-year and importer-year effects to differ between foreign and home flows, each home sales observation is absorbed by its own effect, and the estimate falls to exactly 0.054. In the main model, by contrast, the importer-year effect is shared by home and foreign sales, so the model also exploits the importer’s total purchases from abroad relative to its home sales. Restrictive importers with many agreement partners buy more from abroad, relative to home sales, than the common DSTRI × INTL term predicts, and this between-importer component is captured by the interaction. The estimate of 0.054 thus reflects only how an importer’s purchases shift towards agreement partners and away from other foreign suppliers, and it is the more conservative figure. At the 90th percentile, it implies an agreement effect of about +10%, compared with +17% in the main model. These two figures come from different specifications and indicate sensitivity to the choice of benchmark; they do not form a confidence interval.
4.5. Agreement Adoption and Timing
Table 9 and Figure 2 examine the adoption of agreements. Panel A of Table 9 splits the agreement terms by type, excluding EU–UK pairs. Where a digital chapter was added between pairs already linked by a trade agreement, the DTA indicator alone is associated with 9.7% more trade (exp (0.092) − 1), and this effect does not vary significantly with the importer’s restrictiveness (0.033, s.e. 0.030). Because the RTA indicator does not change for these pairs, this estimate comes closest to isolating the digital chapter from the rest of the agreement. For new agreements, the level effect is small, but the gradient with respect to restrictiveness is large (0.108) and significant at the 1% level; the difference between the two gradients is −0.075 (s.e. 0.043, p = 0.08). For pairs covered throughout the period, the gradient (0.086) is identified from changes in the importer’s index over time and is also positive. The restrictiveness gradient in the main model is therefore driven mainly by new agreements and by pairs covered throughout, not by chapters added to existing agreements.
Table 9.
Agreement types, staggered adoption and pre-adoption trends.
Figure 2.
Trade between agreement partners before and after adoption. Panel (a) measures time relative to entry into force and panel (b) relative to signature; year −1 is the reference. Circles show the agreement effect for an importer of average Digital STRI; squares show the additional effect per standard deviation of the importer’s 2014 Digital STRI. Bars give 95% confidence intervals based on pair-clustered standard errors. The dashed line marks zero; the grey shading and the dotted vertical line mark the pre-adoption years, and hollow markers denote the reference year. Source: Authors’ estimates based on the data listed in Table 2.
Panel B applies a staggered-adoption estimator in the spirit of Nagengast and Yotov [21] and Wooldridge [22], which compares each adoption cohort only with pairs not yet covered or never covered and holds the importer’s restrictiveness at its pre-adoption level. Coverage by an agreement with a digital chapter is associated with 6.9% more trade on average (95% CI: +1.3% to +12.7%), and each standard deviation of the importer’s 2014 Digital STRI adds 0.105 to this effect, almost the same gradient as in the main model.
Figure 2 shows how trade evolved before adoption. Relative to entry into force (panel a), trade between future partners was 7.6% lower four or more years earlier and 5.5% lower three years earlier than in the year before entry into force, and the joint test of pre-period coefficients rejects zero (p = 0.004). The pre-period gradient with respect to restrictiveness is weaker (p = 0.09). Most agreements enter into force about one year after signature (mean gap 1.0 years). Measured from signature (panel b), the coefficient two years before signature is close to zero, trade rises from the year of signature onwards, and the gradient increases to 0.125 two years after signature. Coefficients three or more years before signature are, however, still negative and significant (p = 0.04 for both joint tests). Part of the pre-trend relative to entry into force therefore reflects anticipation between signature and entry into force. Another part reflects trade that was already growing before negotiations concluded, which is consistent with countries choosing partners with whom trade is expanding. We therefore interpret the agreement estimates as conditional associations that describe how agreement effects differ across regulatory regimes, not as causal effects of agreements or as evidence that agreements protect trade when restrictions tighten.
4.6. Robustness
Table 10 collects the robustness tests described in Section 3.5, grouped into measurement, timing and sample tests.
Table 10.
Results of the robustness tests.
The measurement tests leave the main pattern unchanged. Using foreign-policy votes to measure political distance gives virtually identical estimates, and extending the agreement indicator to any e-commerce clause lowers the agreement interaction to 0.073 while keeping it significant at 1%, as expected when weaker provisions are added to the treated group. The timing tests show that the interaction is similar when only every third year is used and when the index is lagged by one year, and somewhat smaller (0.070) with a two-year lag.
The placebo tests call for caution. The agreement interaction remains as large when the Digital STRI is taken one or two years ahead, and holding the index at its 2014 level yields the same estimate (0.105). Because the index changes little within countries, its future and past values are close to its current value, so the interaction cannot be read as a reaction of trade to changes in restrictiveness. It reflects how the effect of agreements differs across importers with different, largely persistent, regulatory regimes, which is the interpretation we adopt throughout.
The sample tests show that the interaction is not driven by particular groups of countries. It stays between 0.08 and 0.12 when intra-EU pairs, EU–UK pairs, China and Russia, or pairs covered throughout the period are dropped. Among OECD importers, it is smaller (0.057) but significant at the 5% level; among non-OECD importers, it remains positive but is imprecisely estimated (0.037, s.e. 0.032). The composite index is never significant at the 5% level, and the political distance term is insignificant in every row.
4.7. Bias Correction and Agreement-Level Inference
Weidner and Zylkin [80] show that three-way PPML estimates are asymptotically biased because the exporter-year and importer-year effects are each estimated from a limited number of partners, and that the usual standard errors can be too small. Table A3 reports two jackknife corrections. The first targets this source of bias. Following the split-sample jackknife for two-way fixed effects of Fernández-Val and Weidner [83], we re-estimate each model on random halves of the importers and, separately, of the exporters, and compute 3 minus the average estimates from the two types of split, averaging over ten random splits for the main model and five for the others. The second, following Dhaene and Jochmans [84], addresses the short time dimension directly: it splits the panel into 2014–2017 and 2018–2022, and into 2014–2018 and 2019–2022, and computes 2 minus the average of the half-panel estimates.
Under both corrections, the agreement interaction remains positive: it rises from 0.100 to 0.139 with the country-split jackknife and to 0.153 with the time-split jackknife, so the uncorrected estimate, if anything, understates the gradient. For cross-border flows only, the corresponding estimates are 0.068 and 0.077, and the estimates for inputs and final products remain positive and similar to each other. The agreement interactions for infrastructure, payments and other barriers also increase, as does the political distance interaction for electronic transactions (to 0.062 and 0.067). By contrast, the reference-case terms, which are identified from small within-country changes, are unstable. The composite index moves to −0.039 with one correction and to +0.064 with the other, and the payment coefficient moves to −0.075 and −0.025. The intellectual property coefficient remains negative under both corrections (−0.369 and −0.093), but its country-split correction varies widely across random splits (standard deviation 0.52), so its corrected magnitude is not informative. These reference-case terms should therefore be read with caution. Because the corrections are not accompanied by their own standard errors, Table A3 is a sensitivity analysis of the point estimates rather than a test; for the country-split jackknife, it also reports the standard deviation of the corrected estimate across the random splits, which indicates how stable the correction is. Inference for the main coefficients is reported in Table A4.
Table A4 addresses common shocks within agreements and cohorts. Clustering standard errors by agreement or adoption cohort for covered pairs, by importer, or two-way by exporter and importer leaves the agreement interaction significant at the 1% level, with standard errors between 0.016 and 0.023, against 0.020 with pair clustering. Because covered pairs fall into only 59 agreement clusters and nine adoption cohorts, we also compute wild score bootstrap p-values [87] with the six-point weights of Webb [88]. They are below 0.0001 for the agreement interaction under all three cluster definitions, while the composite index remains insignificant (p ≈ 0.75). Finally, dropping the pairs that became covered through each of the seven major agreements in turn yields interactions between 0.084 (EU–UK TCA) and 0.116 (RCEP); dropping the CPTPP and RCEP pairs together yields 0.124, and dropping the pairs of all seven agreements yields 0.102 (s.e. 0.028). The gradient is therefore not driven by any single agreement or by common shocks within agreements.
5. Discussion
Table 11 compares our main findings with those of earlier studies. Three differences stand out.
Table 11.
Comparison of the findings with earlier studies.
The absence of a detectable effect of the composite index in the reference case contrasts with studies reporting that data and services barriers reduce services imports [12,16,17]. Three features of our design account for the difference. First, we analyse total trade in goods and services, of which digitally supplied services are a modest part, so an effect concentrated in data-intensive services is diluted. Second, the Heid–Larch–Yotov method relies only on shifts in a country’s international trade relative to its home sales [19]. Since the index hardly changes within countries, such shifts are limited, and earlier cross-sectional findings partly reflect persistent differences between open and closed economies. The method also assumes that digital restrictions do not affect home sales in the same way as foreign sales. If payment or intellectual property rules also reduce domestic transactions, the coefficient measures the difference between the two effects and understates the absolute effect on international trade, so our estimates for H1 are conservative. Third, the composite index combines components with different effects. Intellectual property and payment restrictions are associated with 10.0% and 4.6% less trade with non-agreement partners per standard deviation, although only the intellectual property estimate survives the Holm adjustment and remains negative under both bias corrections, whereas infrastructure and the residual category have no significant effect in the reference case. Weak or discriminatory protection of intellectual property makes it riskier to license technology and designs to foreign partners, in line with a long tradition of evidence that patent rules shape trade [44,45,46]. Payment restrictions add to the cost of every transaction, and payment risk ranks among the main obstacles to cross-border e-commerce [33,34]. Our estimate for intellectual property, and more tentatively that for payments, agrees with recent work showing that payment and intellectual property barriers lower the export efficiency of digital services [43]. Both areas affect trade in goods as well as in services, as the value chain channel implies [14,15].
We find no evidence that political distance makes digital barriers more binding, although equivalence tests leave room for small differences. Other studies document the fragmentation of trade and investment along geopolitical lines [1,2], and research based on UN votes reports slower trade growth between distant partners [54]. Our estimates suggest that this fragmentation does not operate mainly through the broad digital rules measured by the Digital STRI. More likely channels are instruments aimed at particular partners, such as tariffs, export controls and investment screening, none of which the index covers. For electronic transactions, the interaction even has the opposite sign, implying that rules on e-contracts and e-signatures weigh less heavily on distant partners.
Our main result concerns digital trade agreements. For the median importer, their effect is close to zero, but it rises to between +10% and +17% when the importer is among the most restrictive economies, depending on whether home sales are used as the benchmark. These two figures reflect sensitivity across specifications; they do not form a confidence interval. Treaties with a dedicated digital chapter bind members to rules on customs duties on electronic transmissions and, in a minority of cases, on data transfers, localisation and source code (Table 3) [18]. Where the importer’s general regime is restrictive, such rules may grant members preferential access that outsiders lack. This is consistent with evidence that detailed digital clauses increase digital trade among members [17,29,30,63] and the broader observation that agreement effects vary a great deal [61]. Our contribution is to show that the trade associated with agreements with digital chapters depends on the restrictiveness of the regime from which they carve out an exception. Because deeper agreements tend to generate trade with little diversion [60], members’ gains need not come at the expense of non-members. Two qualifications apply. First, the event-study evidence shows that trade between future partners was already rising before adoption, so the estimates combine the effect of agreements with the selection of partners. Second, security is not measured in our data, so we cannot say whether governments use agreements to pursue security goals; the estimates show only that agreement coverage is associated with more trade where general regimes are restrictive. Among the components, the agreement interaction is positive and significant for payments, infrastructure and connectivity, and the residual category of other barriers, with similar magnitudes (0.079–0.088; Table 7), and their point estimates increase under both bias corrections. It is absent for intellectual property, where agreement partners are associated with as large a reduction in trade as other partners. As Table 8 shows, the association is similar for inputs and final products.
Among the most open importers, a digital trade agreement is associated with about 6% less trade. When both partners are already open, an agreement offers little additional preferential access, and the estimate may capture trade being redirected towards other partners [62] or the timing of treaties among advanced economies. We therefore draw no firm conclusion from it.
Our evidence adds to simulation studies of decoupling and friendshoring. Felbermayr et al. [57] project sizeable long-term losses from separating Eastern and Western value chains, and Javorcik et al. [56] estimate that friendshoring could lower real GDP by as much as 4.7% in some economies. Third countries, meanwhile, profited from the US–China trade war by selling more of the affected products [55]. Our findings indicate that broad digital rules are not yet a major driver of such decoupling, and that agreements with digital chapters are associated with more trade for restrictive economies and their selected partners.
6. Conclusions
We set out to examine whether digital trade restrictions reduce international trade, whether geopolitics shapes their effect, and how the trade effect of agreements with digital chapters varies across regulatory regimes. A structural gravity model with home sales, estimated for 64 economies over the period 2014–2022, shows no detectable effect of the composite Digital STRI. Intellectual property restrictions are associated with roughly 10% less international trade with non-agreement partners per standard deviation; a smaller association for payment restrictions does not survive the Holm adjustment and is unstable under the bias corrections. Political distance does not detectably alter the effect of digital barriers. The trade effect of agreements with digital chapters increases with the importer’s restrictiveness and reaches +10% to +17% for the most restrictive importers. This gradient remains positive under both jackknife bias corrections and is robust to agreement-level inference and to the exclusion of each major agreement. Because it is weak where a digital chapter was added to an existing agreement, it describes agreements that contain digital chapters, including their tariff and institutional content, rather than the digital provisions alone. Event-study and staggered-adoption estimates confirm the gradient but reveal that trade was already rising before adoption. The results therefore describe how agreement effects differ across regimes; they do not show that agreements causally shield trade from tightening restrictions.
6.1. Policy Implications
- Intellectual property restrictions are associated with the largest trade costs. Among the five areas, only intellectual property restrictions are robustly associated with less international trade, by about 10% per standard deviation, whether or not an agreement links the partners. The association for payment restrictions is weaker and not robust, and infrastructure and other barriers show none in the reference case. For governments reviewing their digital rules, this suggests that the trade costs associated with restrictive regimes are concentrated in intellectual property rules, an association that is no smaller for partners linked by agreements with digital chapters.
- Agreements with digital chapters are associated with more trade where regimes are restrictive. The trade associated with these agreements is largest where the importer’s general regime is restrictive, in particular with respect to payments, infrastructure and connectivity, and other horizontal barriers, but not intellectual property. Because the agreements also contain tariff preferences and institutional commitments, and because the gradient is weak where a digital chapter was added to an existing agreement (Table 9), these estimates refer to agreements that contain digital chapters as a whole, not to the digital provisions alone.
- Restrictive economies show the largest associations, but evidence for them is less precise. Economies at the restrictive end of the distribution, many of them outside the OECD, show the largest estimated agreement effects. Because the estimate for non-OECD importers alone is imprecise, this conclusion should be treated as indicative for individual countries.
- Monitor other instruments to track fragmentation. Since broad digital rules do not weigh detectably more on distant partners, our results suggest that general restrictiveness indices do not capture the digital channel of fragmentation; partner-specific tools, such as tariffs, export controls and investment screening, may be more informative indicators to monitor.
6.2. Managerial Implications
The results also speak to firms that organise production and sales across borders. We highlight two implications.
First, agreement coverage may be relevant to location and sourcing decisions for restrictive markets. For an importer at the 90th percentile of restrictiveness, coverage by an agreement with a digital chapter is associated with 10–17% more trade, and the association is as strong for intermediate inputs as for final products. Trade with such markets is thus observed to be higher, other things equal, from countries that share an agreement with the destination. This suggests that supply chain managers choosing between production sites with similar costs may consider agreement coverage alongside tariffs and logistics. Because the estimates describe agreements as a whole, this consideration reflects the full package of tariff, institutional and digital commitments rather than the digital chapter alone. For open destinations, agreement coverage is associated with little difference in trade.
Second, the estimates indicate which rules are associated with lower trade. Intellectual property restrictions are associated with about 10% less trade per standard deviation, whether or not an agreement exists. This suggests that firms entering markets with weak or discriminatory intellectual property protection may face additional costs of protecting designs and technology, for example through licensing structures, local partners or contractual safeguards. The association for payment restrictions is weaker and less robust, and infrastructure rules show no average association with trade in our data.
6.3. Theoretical Implications
The results refine the structural gravity treatment of non-discriminatory policies. Home sales allow a country-level index to be estimated alongside exporter-by-year and importer-by-year effects, but the estimate depends on the assumption that the policy leaves home sales unaffected and on whether country-year effects are shared by home and foreign flows. Reporting both the specification with home sales and the specification with foreign partners only, as we do, shows how much the benchmark matters. The results also suggest that agreement effects should be modelled as depending on the partner’s unilateral regime rather than as a single average.
6.4. Limitations and Future Research
Several caveats apply. The Digital STRI starts only in 2014 and covers 64 of the 81 TiVA economies, so many low-income countries are missing. TiVA ends in 2022 and therefore does not capture the tariffs and export controls adopted from 2023 onwards. Because the index changes little within countries, its average effect is estimated imprecisely, and the agreement term measures how agreement effects differ across regimes rather than how trade reacts to changes in restrictiveness. Home sales are constructed as gross output less exports and may themselves respond to digital rules. They are not split between intermediate and final use, so the comparison between inputs and final products rests on cross-border flows alone, where the agreement term is roughly half as large. We also use gross rather than value-added trade. The DTA indicator captures a bundle of commitments of varying depth (Table 3); the estimates reflect the full content of agreements with digital chapters rather than the digital provisions alone; and trade between future partners was already rising before adoption, so the agreement estimates are not causal. Security motives are not measured directly. Finally, the jackknife corrections in Section 4.7 rely on sample splits that further reduce the limited within-country variation, so the corrected reference-case estimates are imprecise. Future work could extend the panel, measure the depth of individual digital commitments rather than rely on a single indicator, use sector-level and value-added flows with home sales split by use [50], and feed the estimates into a general equilibrium model to quantify welfare effects.
Supplementary Materials
The following supporting information can be downloaded at: https://www.mdpi.com/article/10.3390/jtaer21110423/s1, Data S1: Merged estimation panel (CSV), 2014–2022, with all variables used in the models, and the source data extracts (OECD TiVA and Digital STRI, WTO Regional Trade Agreements Database, TAPED and UN General Assembly ideal points); Code S1: Python scripts that reproduce all tables and figures, with a README listing the run order, the software and package versions and the random seeds, and a requirements file.
Author Contributions
Conceptualisation, M.A. and M.G.; methodology, M.A., M.G. and N.K.; software, N.K.; validation, M.G., H.A. and F.A.; formal analysis, M.A., M.G. and N.K.; investigation, M.A., M.G. and N.K.; data curation, M.G. and N.K.; writing—original draft preparation, M.A., M.G. and N.K.; writing—review and editing, M.A., M.G., N.K., H.A. and F.A.; visualisation, N.K.; supervision, M.A.; project administration, M.G. During the revisions, M.A., M.G. and N.K. carried out the additional analyses requested by the reviewers, including the bias corrections, multiple-testing adjustments and agreement-level inference, and H.A. and F.A. contributed to the synthesis of the literature, the comparison with earlier studies and the managerial implications. All authors have read and agreed to the published version of the manuscript.
Funding
This research received no external funding.
Institutional Review Board Statement
Not applicable.
Informed Consent Statement
Not applicable.
Data Availability Statement
Every dataset we use is open to the public. Trade flows (indicators EXGR, EXGR_INT, EXGR_FNL and PROD) come from the 2025 edition of OECD TiVA, and the Digital STRI is also published by the OECD; both can be downloaded at https://data-explorer.oecd.org (accessed on 2 October 2026). Agreement records are taken from the WTO database at https://rtais.wto.org (accessed on 2 October 2026) and from TAPED at https://unilu.ch/taped (accessed on 2 October 2026), and UN voting ideal points from Harvard Dataverse at https://hdl.handle.net/1902.1/12379 (accessed on 2 October 2026). Our merged panel and the code that reproduces all tables and figures accompany the article as Supplementary Materials (Data S1 and Code S1).
Acknowledgments
During the preparation of this manuscript, the authors used Claude (Anthropic; model Claude Opus 5.5, used between October and November 2026) for the purposes of writing and executing the code for data assembly, cleaning and estimation, producing the tables and figures, drafting and editing text, and preparing the responses to the reviewers. The authors have reviewed and edited the output and take full responsibility for the content of this publication.
Conflicts of Interest
The authors declare no conflicts of interest.
Appendix A
Table A1.
Correlations among the five Digital STRI components and variance inflation factors.
Table A2.
Separate and joint component models with multiple-testing adjustments.
Table A3.
Jackknife bias-corrected estimates.
Table A4.
Agreement-level inference and leave-one-agreement-out estimates.
References
- Aiyar, S.; Chen, J.; Ebeke, C.H.; Garcia-Saltos, R.; Gudmundsson, T.; Ilyina, A.; Kangur, A.; Kunaratskul, T.; Rodriguez, S.L.; Ruta, M.; et al. Geo-Economic Fragmentation and the Future of Multilateralism; IMF Staff Discussion Note SDN/2023/001; International Monetary Fund: Washington, DC, USA, 2023. [Google Scholar]
- Gopinath, G.; Gourinchas, P.-O.; Presbitero, A.F.; Topalova, P. Changing global linkages: A new Cold War? J. Int. Econ. 2025, 153, 104042. [Google Scholar] [CrossRef] [Scilit]
- Baldwin, R.; Freeman, R. Risks and global supply chains: What we know and what we need to know. Annu. Rev. Econ. 2022, 14, 153–180. [Google Scholar] [CrossRef] [Scilit]
- Fajgelbaum, P.D.; Goldberg, P.K.; Kennedy, P.J.; Khandelwal, A.K. The return to protectionism. Q. J. Econ. 2020, 135, 1–55. [Google Scholar] [CrossRef] [Scilit]
- Amiti, M.; Redding, S.J.; Weinstein, D.E. The impact of the 2018 tariffs on prices and welfare. J. Econ. Perspect. 2019, 33, 187–210. [Google Scholar] [CrossRef] [Scilit]
- Fajgelbaum, P.D.; Khandelwal, A.K. The economic impacts of the US–China trade war. Annu. Rev. Econ. 2022, 14, 205–228. [Google Scholar] [CrossRef] [Scilit]
- Freund, C.; Mattoo, A.; Mulabdic, A.; Ruta, M. Is US trade policy reshaping global supply chains? J. Int. Econ. 2024, 152, 104011. [Google Scholar] [CrossRef] [Scilit]
- Juhász, R.; Lane, N.; Rodrik, D. The new economics of industrial policy. Annu. Rev. Econ. 2024, 16, 213–242. [Google Scholar] [CrossRef] [Scilit]
- Mohr, C.; Trebesch, C. Geoeconomics. Annu. Rev. Econ. 2025, 17, 563–587. [Google Scholar] [CrossRef] [Scilit]
- Goldfarb, A.; Tucker, C. Digital economics. J. Econ. Lit. 2019, 57, 3–43. [Google Scholar] [CrossRef] [Scilit]
- Ferencz, J. The OECD Digital Services Trade Restrictiveness Index; OECD Trade Policy Papers, No. 221; OECD Publishing: Paris, France, 2019. [Google Scholar]
- Ferracane, M.F.; van der Marel, E. Do data policy restrictions inhibit trade in services? Rev. World Econ. 2021, 157, 727–776. [Google Scholar] [CrossRef] [Scilit]
- Goldberg, S.G.; Johnson, G.A.; Shriver, S.K. Regulating privacy online: An economic evaluation of the GDPR. Am. Econ. J. Econ. Policy 2024, 16, 325–358. [Google Scholar] [CrossRef] [Scilit]
- Antràs, P. Conceptual aspects of global value chains. World Bank Econ. Rev. 2020, 34, 551–574. [Google Scholar] [CrossRef] [Scilit]
- World Bank. World Development Report 2020: Trading for Development in the Age of Global Value Chains; World Bank: Washington, DC, USA, 2020. [Google Scholar]
- Nordås, H.K.; Rouzet, D. The impact of services trade restrictiveness on trade flows. World Econ. 2017, 40, 1155–1183. [Google Scholar] [CrossRef] [Scilit]
- Suh, J.; Roh, J. The effects of digital trade policies on digital trade. World Econ. 2023, 46, 2383–2407. [Google Scholar] [CrossRef] [Scilit]
- Burri, M.; Polanco, R. Digital trade provisions in preferential trade agreements: Introducing a new dataset. J. Int. Econ. Law 2020, 23, 187–220. [Google Scholar] [CrossRef] [Scilit]
- Heid, B.; Larch, M.; Yotov, Y.V. Estimating the effects of non-discriminatory trade policies within structural gravity models. Can. J. Econ. 2021, 54, 376–409. [Google Scholar] [CrossRef] [Scilit]
- Bailey, M.A.; Strezhnev, A.; Voeten, E. Estimating dynamic state preferences from United Nations voting data. J. Confl. Resolut. 2017, 61, 430–456. [Google Scholar] [CrossRef] [Scilit]
- Nagengast, A.J.; Yotov, Y.V. Staggered difference-in-differences in gravity settings: Revisiting the effects of trade agreements. Am. Econ. J. Appl. Econ. 2025, 17, 271–296. [Google Scholar] [CrossRef] [Scilit]
- Wooldridge, J.M. Simple approaches to nonlinear difference-in-differences with panel data. Econom. J. 2023, 26, C31–C66. [Google Scholar] [CrossRef] [Scilit]
- Freund, C.; Weinhold, D. The Internet and international trade in services. Am. Econ. Rev. 2002, 92, 236–240. [Google Scholar] [CrossRef] [Scilit]
- Freund, C.L.; Weinhold, D. The effect of the Internet on international trade. J. Int. Econ. 2004, 62, 171–189. [Google Scholar] [CrossRef] [Scilit]
- Blum, B.S.; Goldfarb, A. Does the internet defy the law of gravity? J. Int. Econ. 2006, 70, 384–405. [Google Scholar] [CrossRef] [Scilit]
- Lendle, A.; Olarreaga, M.; Schropp, S.; Vézina, P.-L. There goes gravity: eBay and the death of distance. Econ. J. 2016, 126, 406–441. [Google Scholar] [CrossRef] [Scilit]
- Zhou, C.; Becerril-Arreola, R.; Leng, M. Retailer–supplier coordination of pricing and delivery ratings availability decisions in online marketplaces. Prod. Oper. Manag. 2026; in press. [CrossRef] [Scilit]
- Gomez-Herrera, E.; Martens, B.; Turlea, G. The drivers and impediments for cross-border e-commerce in the EU. Inf. Econ. Policy 2014, 28, 83–96. [Google Scholar] [CrossRef] [Scilit]
- Herman, P.R.; Oliver, S. Trade, policy, and economic development in the digital economy. J. Dev. Econ. 2023, 164, 103135. [Google Scholar] [CrossRef] [Scilit]
- López González, J.; Sorescu, S.; Kaynak, P. Of Bytes and Trade: Quantifying the Impact of Digitalisation on Trade; OECD Trade Policy Papers, No. 273; OECD Publishing: Paris, France, 2023. [Google Scholar]
- Wang, C.; Liu, T.; Wen, D.; Li, D.; Vladislav, G.; Zhu, Y. The impact of international electronic commerce on export trade: Evidence from China. J. Theor. Appl. Electron. Commer. Res. 2021, 16, 2579–2593. [Google Scholar] [CrossRef] [Scilit]
- Paun, C.; Ivascu, C.; Olteteanu, A.; Dantis, D. The main drivers of e-commerce adoption: A global panel data analysis. J. Theor. Appl. Electron. Commer. Res. 2024, 19, 2198–2217. [Google Scholar] [CrossRef] [Scilit]
- Liu, A.; Osewe, M.; Shi, Y.; Zhen, X.; Wu, Y. Cross-border e-commerce development and challenges in China: A systematic literature review. J. Theor. Appl. Electron. Commer. Res. 2022, 17, 69–88. [Google Scholar] [CrossRef] [Scilit]
- Qiu, Y.; Chen, T.; Cai, J.; Yang, J. The impact of government behavior on the development of cross-border e-commerce B2B export trading enterprises based on evolutionary game in the context of “dual-cycle” policy. J. Theor. Appl. Electron. Commer. Res. 2022, 17, 1741–1768. [Google Scholar] [CrossRef] [Scilit]
- Aaronson, S.A. What are we talking about when we talk about digital protectionism? World Trade Rev. 2019, 18, 541–577. [Google Scholar] [CrossRef] [Scilit]
- Mattoo, A.; Meltzer, J.P. International data flows and privacy: The conflict and its resolution. J. Int. Econ. Law 2018, 21, 769–789. [Google Scholar] [CrossRef] [Scilit]
- Meltzer, J.P. Governing digital trade. World Trade Rev. 2019, 18, S23–S48. [Google Scholar] [CrossRef] [Scilit]
- Mitchell, A.D.; Mishra, N. Regulating cross-border data flows in a data-driven world: How WTO law can contribute. J. Int. Econ. Law 2019, 22, 389–416. [Google Scholar] [CrossRef] [Scilit]
- Ferencz, J.; Gonzales, F. Barriers to Trade in Digitally Enabled Services in the G20; OECD Trade Policy Papers, No. 232; OECD Publishing: Paris, France, 2019. [Google Scholar]
- Ferracane, M.F.; van der Marel, E. Patterns of trade restrictiveness in online platforms: A first look. World Econ. 2020, 43, 2932–2959. [Google Scholar] [CrossRef] [Scilit]
- van der Marel, E.; Bauer, M.; Lee-Makiyama, H.; Verschelde, B. A methodology to estimate the costs of data regulations. Int. Econ. 2016, 146, 12–39. [Google Scholar] [CrossRef] [Scilit]
- Ferracane, M.F.; Kren, J.; van der Marel, E. Do data policy restrictions impact the productivity performance of firms and industries? Rev. Int. Econ. 2020, 28, 676–722. [Google Scholar] [CrossRef] [Scilit]
- Wang, X.; Zhang, J.; Zhu, Y. Barriers to digital services trade and export efficiency of digital services. Sustainability 2024, 16, 7517. [Google Scholar] [CrossRef] [Scilit]
- Maskus, K.E.; Penubarti, M. How trade-related are intellectual property rights? J. Int. Econ. 1995, 39, 227–248. [Google Scholar] [CrossRef] [Scilit]
- Smith, P.J. Are weak patent rights a barrier to U.S. exports? J. Int. Econ. 1999, 48, 151–177. [Google Scholar] [CrossRef] [Scilit]
- Ivus, O. Do stronger patent rights raise high-tech exports to the developing world? J. Int. Econ. 2010, 81, 38–47. [Google Scholar] [CrossRef] [Scilit]
- Johnson, R.C.; Noguera, G. Accounting for intermediates: Production sharing and trade in value added. J. Int. Econ. 2012, 86, 224–236. [Google Scholar] [CrossRef] [Scilit]
- Koopman, R.; Wang, Z.; Wei, S.-J. Tracing value-added and double counting in gross exports. Am. Econ. Rev. 2014, 104, 459–494. [Google Scholar] [CrossRef] [Scilit]
- Johnson, R.C. Measuring global value chains. Annu. Rev. Econ. 2018, 10, 207–236. [Google Scholar] [CrossRef] [Scilit]
- Borin, A.; Mancini, M. Measuring What Matters in Global Value Chains and Value-Added Trade; Policy Research Working Paper No. 8804; World Bank: Washington, DC, USA, 2019. [Google Scholar]
- Miroudot, S.; Cadestin, C. Services in Global Value Chains: From Inputs to Value-Creating Activities; OECD Trade Policy Papers, No. 197; OECD Publishing: Paris, France, 2017. [Google Scholar] [CrossRef]
- Kan, D.; Lyu, L.; Huang, W.; Yao, W. Digital economy and the upgrading of the global value chain of China’s service industry. J. Theor. Appl. Electron. Commer. Res. 2022, 17, 1279–1296. [Google Scholar] [CrossRef] [Scilit]
- Aiyar, S.; Presbitero, A.F.; Ruta, M. (Eds.) Geoeconomic Fragmentation: The Economic Risks from a Fractured World Economy; CEPR Press: Paris, France; London, UK, 2023. [Google Scholar]
- Qiu, H.; Xia, D.; Yetman, J. Deconstructing Global Trade: The Role of Geopolitical Alignment. BIS Quarterly Review, 16 September 2024. Available online: https://www.bis.org/publ/qtrpdf/r_qt2409c.htm (accessed on 3 October 2026).
- Fajgelbaum, P.D.; Goldberg, P.K.; Kennedy, P.J.; Khandelwal, A.K.; Taglioni, D. The US–China trade war and global reallocations. Am. Econ. Rev. Insights 2024, 6, 295–312. [Google Scholar] [CrossRef] [Scilit]
- Javorcik, B.; Kitzmüller, L.; Schweiger, H.; Yıldırım, M.A. Economic costs of friendshoring. World Econ. 2024, 47, 2871–2908. [Google Scholar] [CrossRef] [Scilit]
- Felbermayr, G.; Mahlkow, H.; Sandkamp, A. Cutting through the value chain: The long-run effects of decoupling the East from the West. Empirica 2023, 50, 75–108. [Google Scholar] [CrossRef] [Scilit] [PubMed]
- Häge, F.M. Choice or circumstance? Adjusting measures of foreign policy similarity for chance agreement. Polit. Anal. 2011, 19, 287–305. [Google Scholar] [CrossRef] [Scilit]
- Hofmann, C.; Osnago, A.; Ruta, M. The content of preferential trade agreements. World Trade Rev. 2019, 18, 365–398. [Google Scholar] [CrossRef] [Scilit]
- Mattoo, A.; Mulabdic, A.; Ruta, M. Trade creation and trade diversion in deep agreements. Can. J. Econ. 2022, 55, 1598–1637. [Google Scholar] [CrossRef] [Scilit]
- Baier, S.L.; Yotov, Y.V.; Zylkin, T. On the widely differing effects of free trade agreements: Lessons from twenty years of trade integration. J. Int. Econ. 2019, 116, 206–226. [Google Scholar] [CrossRef] [Scilit]
- Dai, M.; Yotov, Y.V.; Zylkin, T. On the trade-diversion effects of free trade agreements. Econ. Lett. 2014, 122, 321–325. [Google Scholar] [CrossRef] [Scilit]
- Jiang, T.; Hu, Y.; Haleem, F.; Zeng, S. Do digital trade rules matter? Empirical evidence from TAPED. Sustainability 2023, 15, 9074. [Google Scholar] [CrossRef] [Scilit]
- Anderson, J.E. A theoretical foundation for the gravity equation. Am. Econ. Rev. 1979, 69, 106–116. [Google Scholar]
- Anderson, J.E.; van Wincoop, E. Gravity with gravitas: A solution to the border puzzle. Am. Econ. Rev. 2003, 93, 170–192. [Google Scholar] [CrossRef] [Scilit]
- Yotov, Y.V.; Piermartini, R.; Monteiro, J.-A.; Larch, M. An Advanced Guide to Trade Policy Analysis: The Structural Gravity Model; World Trade Organization and UNCTAD: Geneva, Switzerland, 2016. [Google Scholar]
- Head, K.; Mayer, T. Gravity equations: Workhorse, toolkit, and cookbook. In Handbook of International Economics; Gopinath, G., Helpman, E., Rogoff, K., Eds.; Elsevier: Amsterdam, The Netherlands, 2014; Volume 4, pp. 131–195. [Google Scholar]
- Santos Silva, J.M.C.; Tenreyro, S. The log of gravity. Rev. Econ. Stat. 2006, 88, 641–658. [Google Scholar] [CrossRef] [Scilit]
- Fally, T. Structural gravity and fixed effects. J. Int. Econ. 2015, 97, 76–85. [Google Scholar] [CrossRef] [Scilit]
- Baier, S.L.; Bergstrand, J.H. Do free trade agreements actually increase members’ international trade? J. Int. Econ. 2007, 71, 72–95. [Google Scholar] [CrossRef] [Scilit]
- Anderson, J.E.; Yotov, Y.V. The changing incidence of geography. Am. Econ. Rev. 2010, 100, 2157–2186. [Google Scholar] [CrossRef] [Scilit]
- Yotov, Y.V. A simple solution to the distance puzzle in international trade. Econ. Lett. 2012, 117, 794–798. [Google Scholar] [CrossRef] [Scilit]
- Bergstrand, J.H.; Larch, M.; Yotov, Y.V. Economic integration agreements, border effects, and distance elasticities in the gravity equation. Eur. Econ. Rev. 2015, 78, 307–327. [Google Scholar] [CrossRef] [Scilit]
- OECD. Trade in Value Added (TiVA) Database, 2025 Edition; OECD Publishing: Paris, France, 2025; Available online: https://oe.cd/tiva (accessed on 2 October 2026).
- World Trade Organization. Regional Trade Agreements Database. Available online: https://rtais.wto.org (accessed on 2 October 2026).
- Burri, M.; Vásquez Callo-Müller, M. TAPED: Trade Agreement Provisions on Electronic Commerce and Data; University of Lucerne: Lucerne, Switzerland, 2026; Available online: https://unilu.ch/taped (accessed on 2 October 2026).
- pyfixest Developers. pyfixest: Fast High-Dimensional Fixed Effects Regression in Python, version 0.60.0; GitHub: San Francisco, CA, USA, 2026; Available online: https://github.com/py-econometrics/pyfixest (accessed on 2 October 2026).
- Correia, S.; Guimarães, P.; Zylkin, T. Fast Poisson estimation with high-dimensional fixed effects. Stata J. 2020, 20, 95–115. [Google Scholar] [CrossRef] [Scilit]
- Larch, M.; Shikher, S.; Yotov, Y.V. Estimating gravity equations: Theory implications, econometric developments, and practical recommendations. Rev. Int. Econ. 2025, 33, 1019–1200. [Google Scholar] [CrossRef] [Scilit]
- Weidner, M.; Zylkin, T. Bias and consistency in three-way gravity models. J. Int. Econ. 2021, 132, 103513. [Google Scholar] [CrossRef] [Scilit]
- Larch, M.; Wanner, J.; Yotov, Y.V.; Zylkin, T. Currency unions and trade: A PPML re-assessment with high-dimensional fixed effects. Oxf. Bull. Econ. Stat. 2019, 81, 487–510. [Google Scholar] [CrossRef] [Scilit]
- Lakens, D. Equivalence tests: A practical primer for t tests, correlations, and meta-analyses. Soc. Psychol. Personal. Sci. 2017, 8, 355–362. [Google Scholar] [CrossRef] [Scilit] [PubMed]
- Fernández-Val, I.; Weidner, M. Individual and time effects in nonlinear panel models with large N, T. J. Econom. 2016, 192, 291–312. [Google Scholar] [CrossRef] [Scilit]
- Dhaene, G.; Jochmans, K. Split-panel jackknife estimation of fixed-effect models. Rev. Econ. Stud. 2015, 82, 991–1030. [Google Scholar] [CrossRef] [Scilit]
- Holm, S. A simple sequentially rejective multiple test procedure. Scand. J. Stat. 1979, 6, 65–70. [Google Scholar]
- Benjamini, Y.; Hochberg, Y. Controlling the false discovery rate: A practical and powerful approach to multiple testing. J. R. Stat. Soc. Ser. B 1995, 57, 289–300. [Google Scholar] [CrossRef] [Scilit]
- Kline, P.; Santos, A. A score based approach to wild bootstrap inference. J. Econom. Methods 2012, 1, 23–41. [Google Scholar] [CrossRef] [Scilit]
- Webb, M.D. Reworking wild bootstrap-based inference for clustered errors. Can. J. Econ. 2023, 56, 839–858. [Google Scholar] [CrossRef] [Scilit]
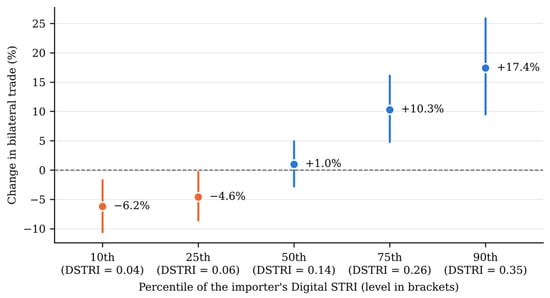
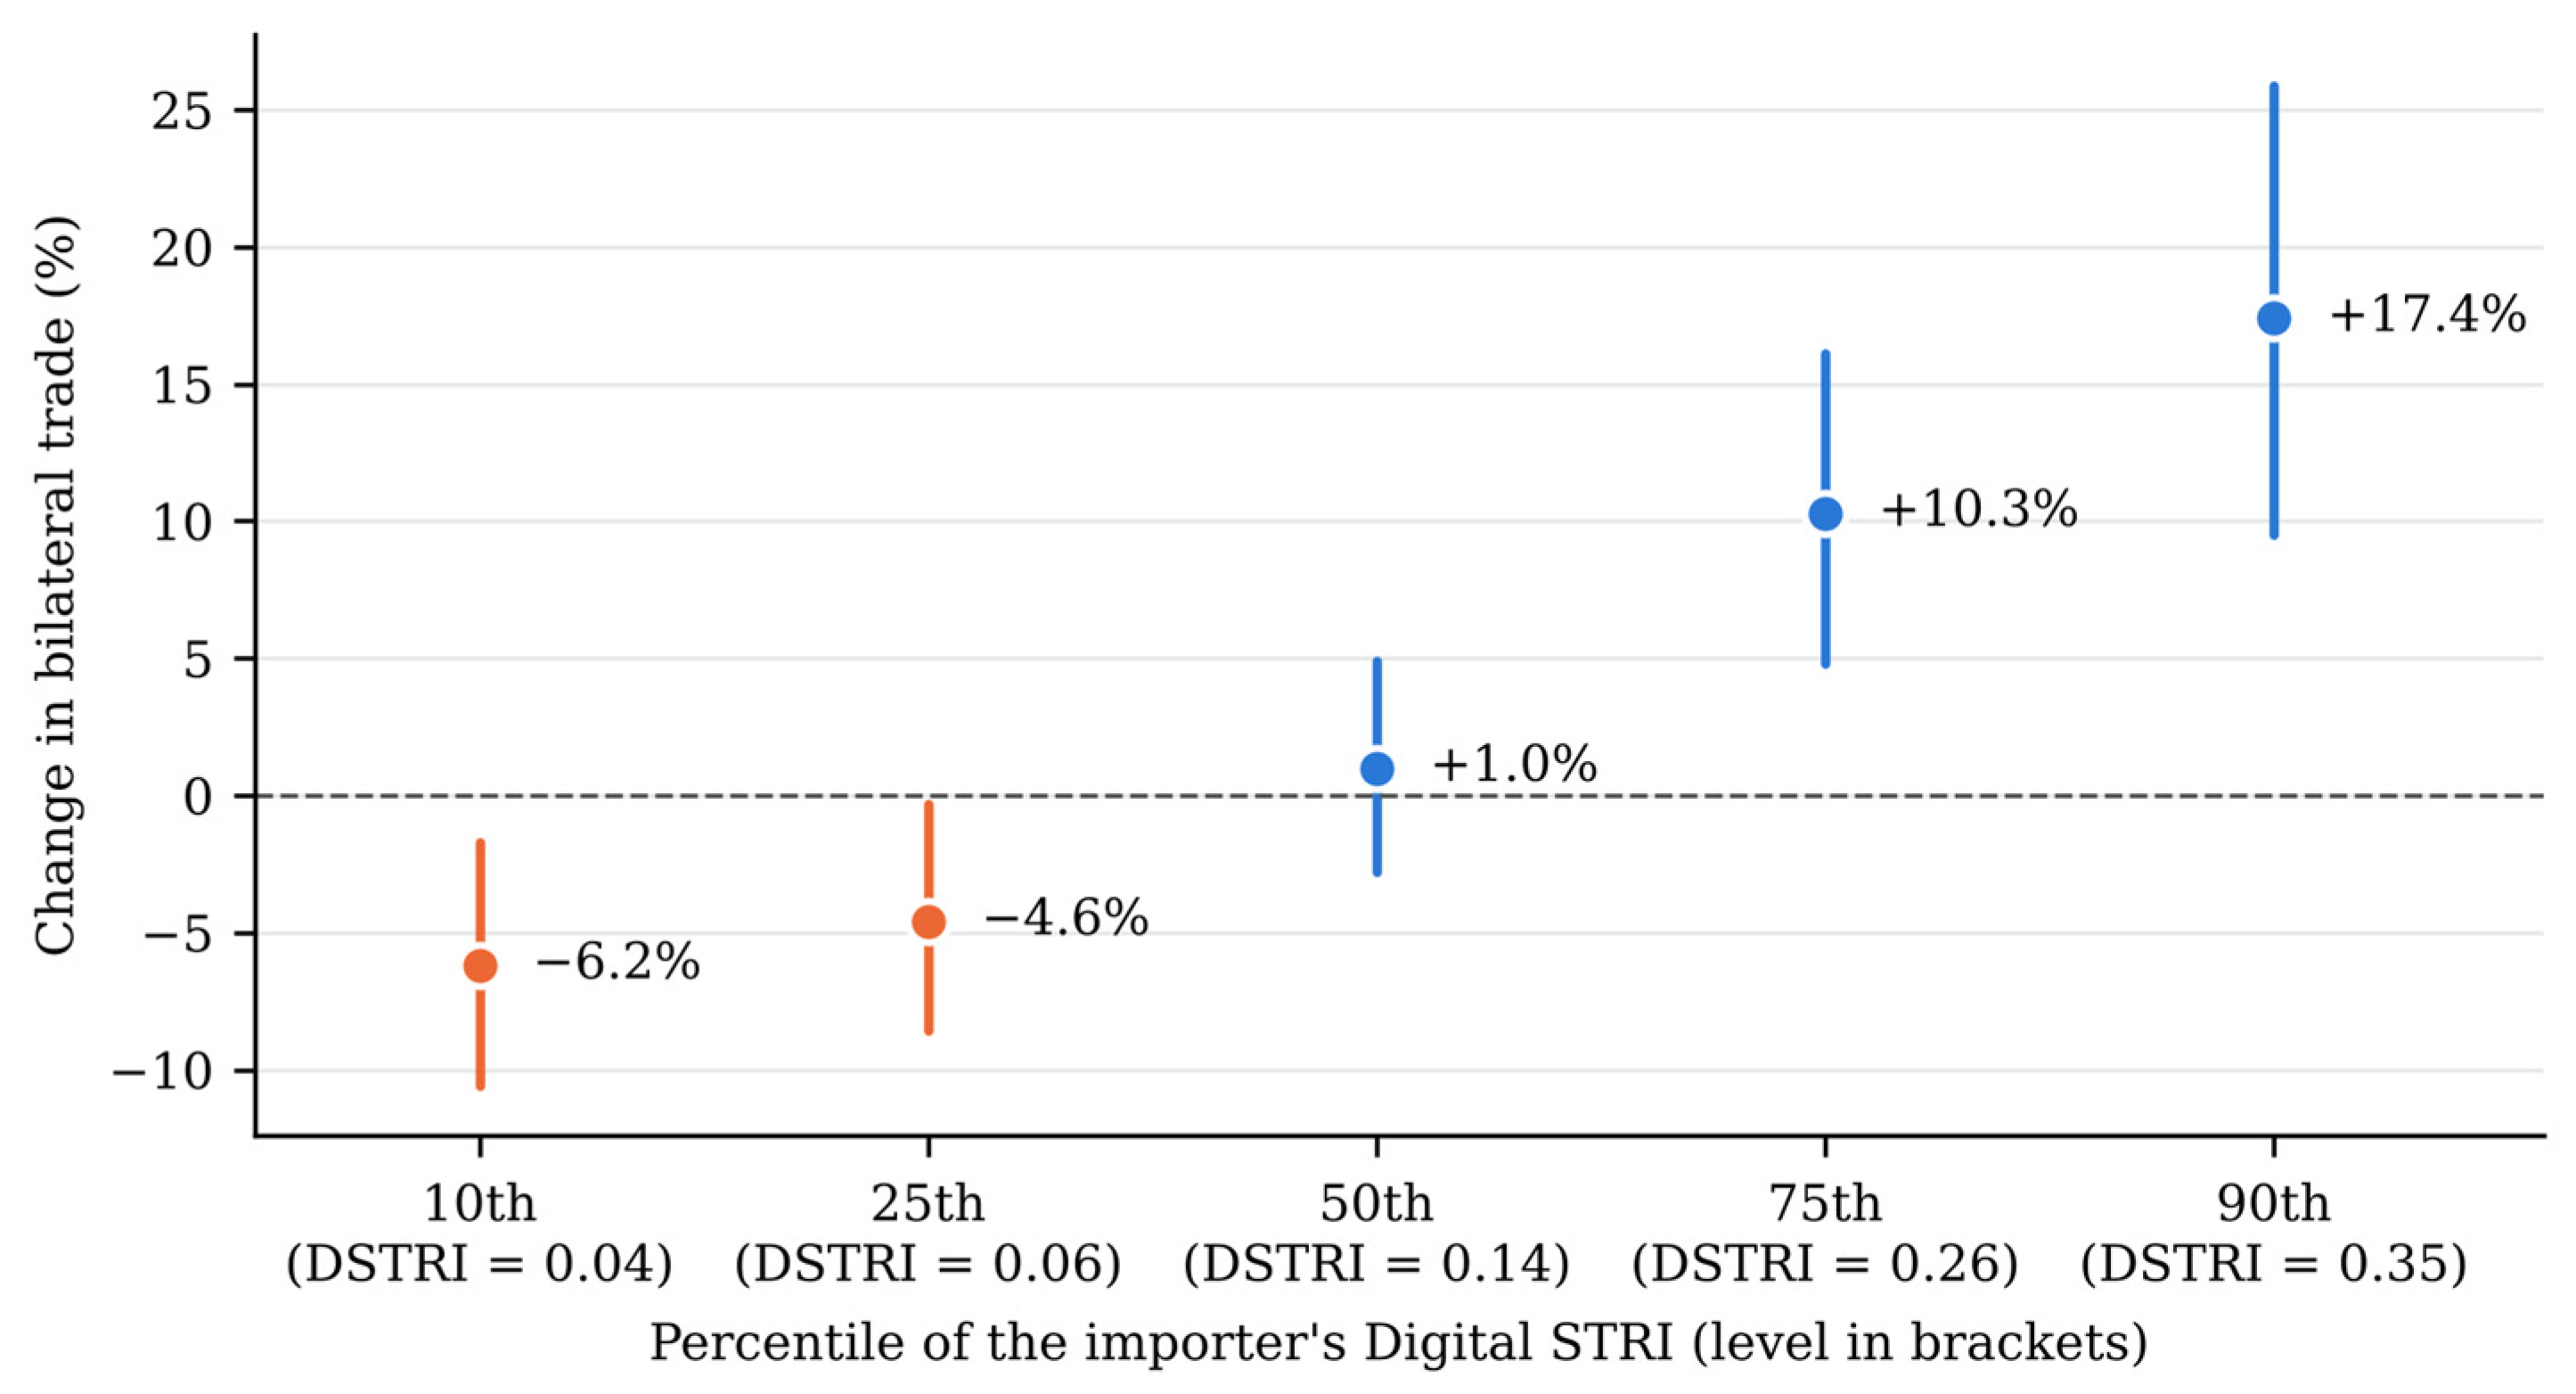
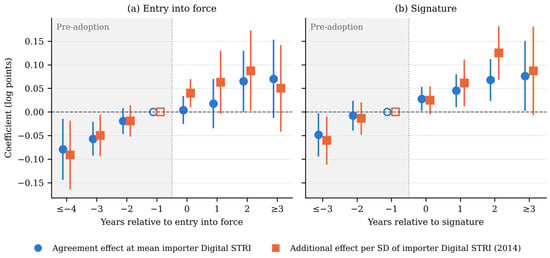
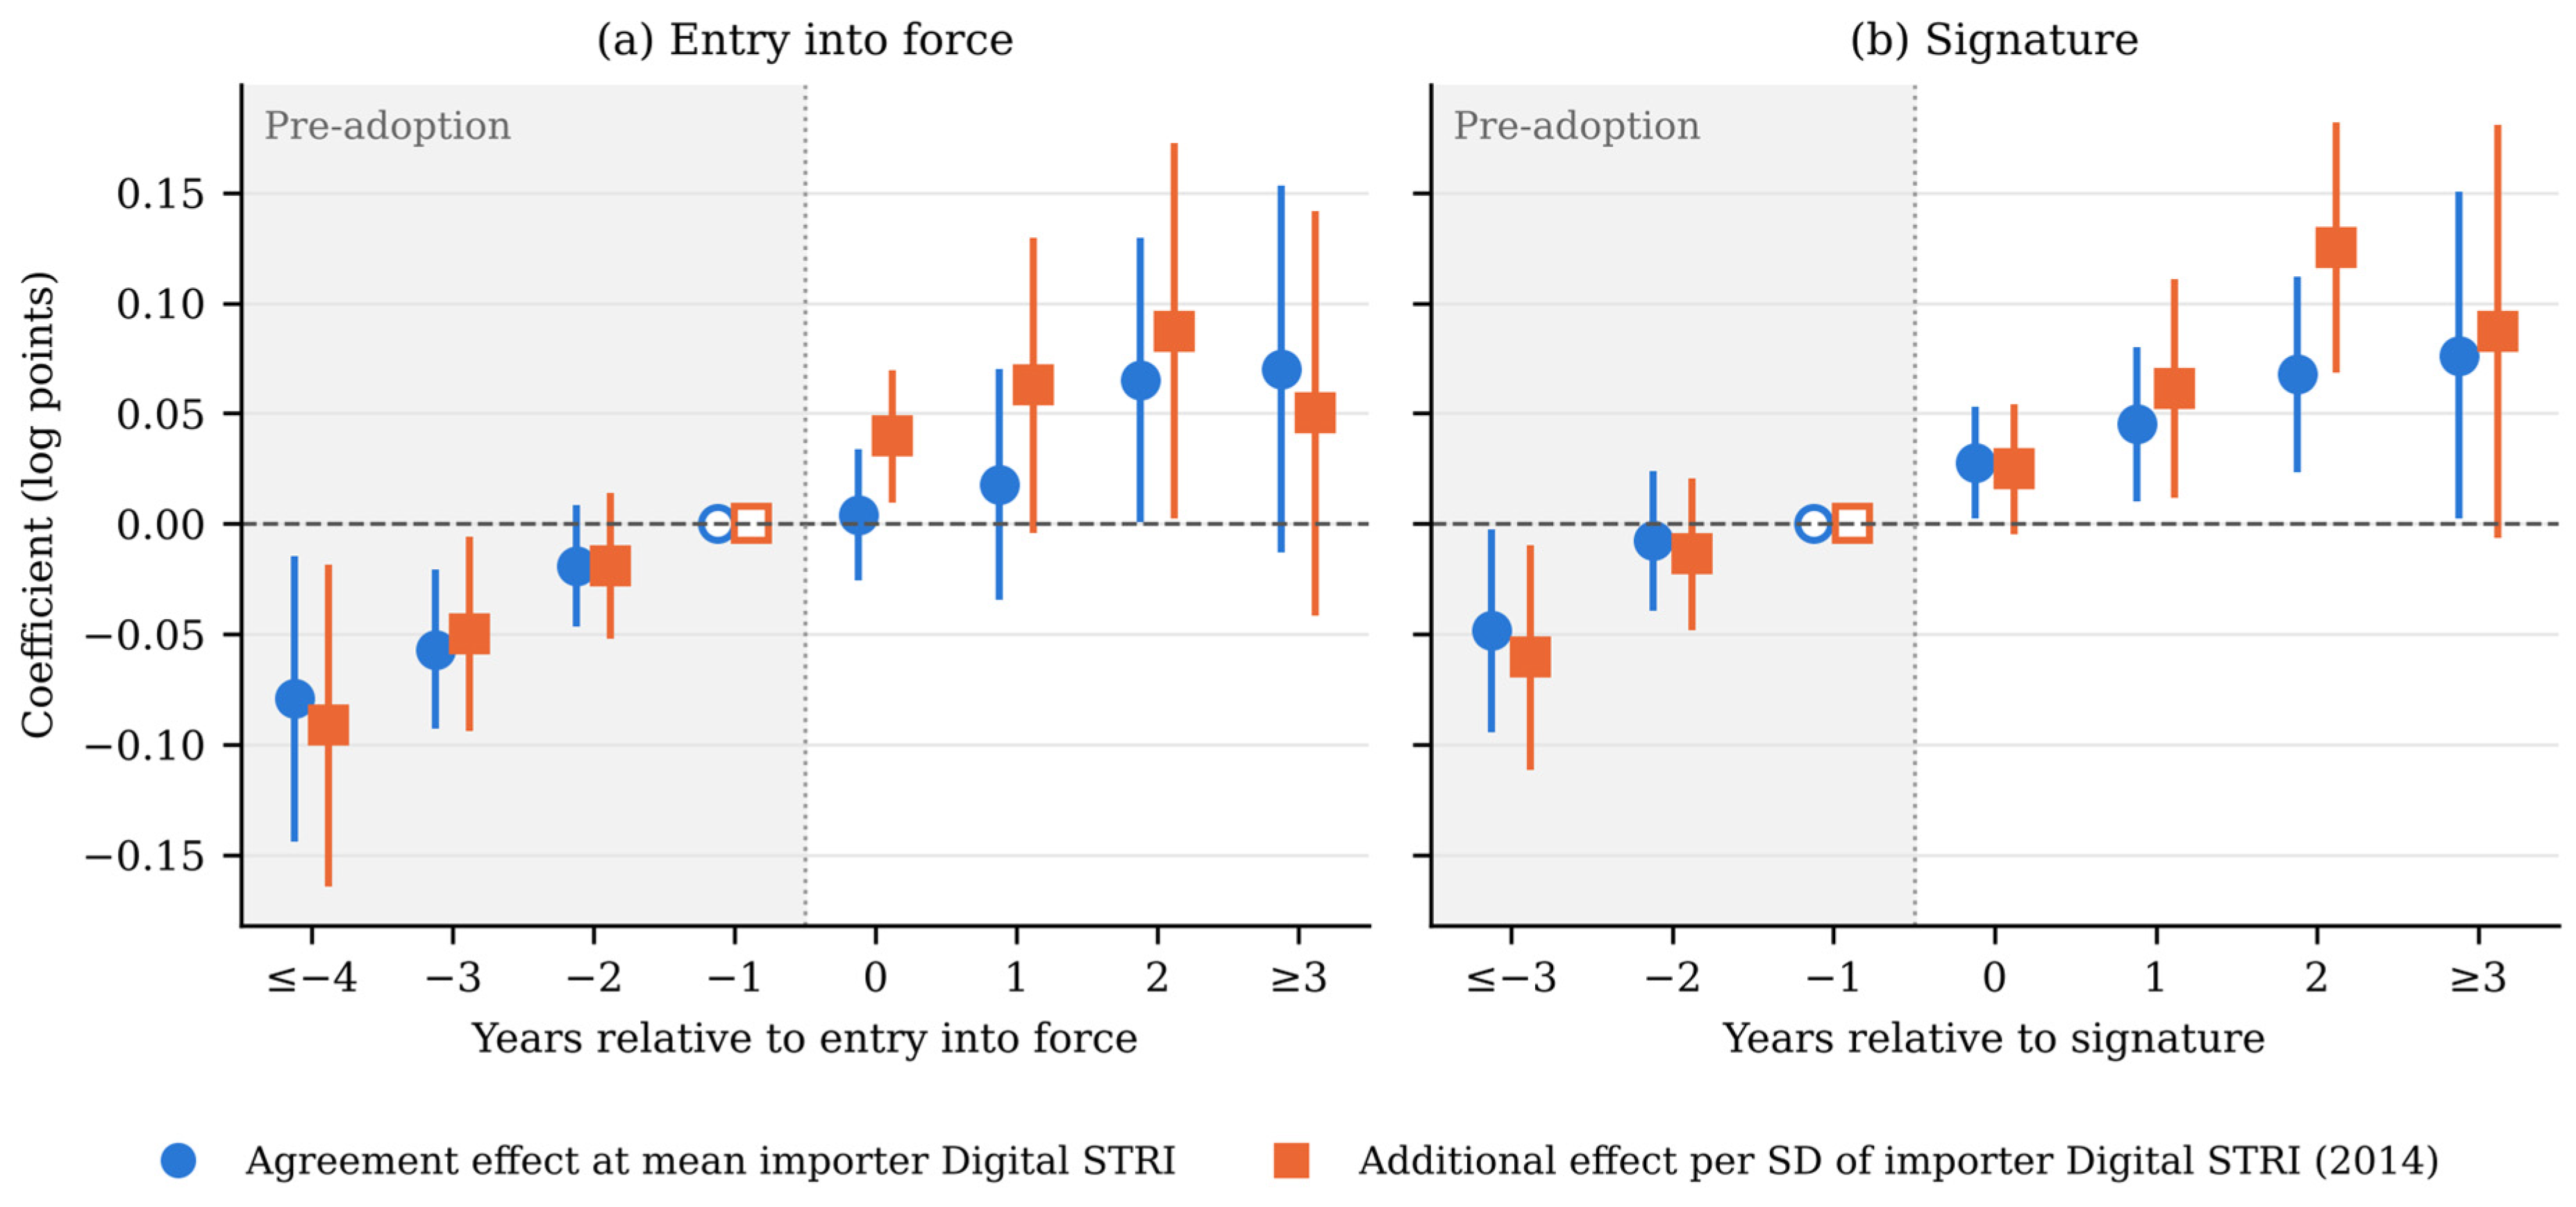

Disclaimer/Publisher’s Note: The statements, opinions and data contained in all publications are solely those of the individual author(s) and contributor(s) and not of MDPI and/or the editor(s). MDPI and/or the editor(s) disclaim responsibility for any injury to people or property resulting from any ideas, methods, instructions or products referred to in the content. |
© 2026 by the authors. Licensee MDPI, Basel, Switzerland. This article is an open access article distributed under the terms and conditions of the Creative Commons Attribution (CC BY) license.