


Abstract
In the current competition process of e-commerce platforms, the technical and algorithmic wars that can quickly grasp user needs and accurately recommend target commodities are the core tools of platform competition. At the same time, the existing online purchase behavior prediction models lack consideration of time series features. This paper combines the Recurrent Neural Network, which is more suitable for the commodity recommendation scenario of the e-commerce platform, with Naive Bayes, which is simple in logic and efficient in operation and constructs the online purchase behavior prediction model RNN-NB, which can consider the features of time series. The RNN-NB model is trained and tested using 3 million time series data with purchase behavior provided by the Ali Tianchi big data platform. The prediction effect of the RNN-NB model and Naive Bayes model is evaluated and compared respectively under the same experimental conditions. The results show that the overall prediction effect of the RNN-NB model is better and more stable. In addition, through the analysis of user time series features, it can be found that the possibility of user purchase is negatively correlated with the length of time series, and merchants should pay more attention to those users with shorter time series in commodity recommendation and targeted offers. The contributions of this paper are as follows: (1) By constructing an online purchasing behavior model RNN-NB, which integrates the N vs 1 structure Recurrent Neural Network and naive Bayesian model, the validity limitations of some single-architecture recommendation algorithms are solved. (2) Based on the existing naive Bayesian model, the prediction accuracy of online purchasing behavior is further improved. (3) The analysis based on the features of the time series provides new ideas for the research of later scholars and new guidance for the marketing of platform merchants.
1. Introduction
In recent years, the competitive pattern and competitive means of e-commerce platforms have rapidly evolved. The traditional competitive strategy based on advertising war and price war has become increasingly ineffective in the current e-commerce market where the commodity system is converging and the profit margins are shrinking. The technical war and algorithm war that can quickly grasp user needs and accurately recommend target commodities have gradually become the core weapon of platform competition. Bodduluri et al. (2024) pointed out that with the increase in the amount and complexity of data, it is particularly important to induce users to choose the commodity that meets their preference features through recommendation algorithms [1]. Recommendation algorithms can not only make the marketing goal of e-commerce platforms consistent with the purchase preference of target users but also ensure the acceptance and satisfaction of users (Stalidis et al., 2023; Li et al., 2023). Because of this, Amazon, eBay, Shopify, Alibaba, and other e-commerce platforms continue to make efforts in the field of recommendation algorithms [2,3]. Based on historical user data and artificial intelligence technology, they build user online purchase behavior prediction models to analyze user behavioral preferences and guide commodity recommendation, thus improving transaction probability and platform revenue.
In the existing research of online purchase behavior prediction models, user behavior sequence is usually considered to be the important data containing user behavior features and preference features. The traditional method is to map the original ID class feature information to the low-dimensional space through the embedding technology and then input it into the Multi-Layer Perception (MLP) network. Models such as Workflow Description Language (WDL), DeepFM [4], Deformable Convolutional Networks (DCNs), and so on all meet this paradigm, but such methods cannot fully extract the feature information in the user behavior sequence. Since then, an attention mechanism has been introduced to extract the information of users’ historical behavior sequences. Common models such as Deep Interest Network (DIN) describe the distribution of users’ diverse interests by calculating the degree of correlation between users’ historical behavior sequence and the current Item. Still, such methods only consider the correlation between users’ behaviors without considering their order. In addition to this, the effectiveness of single-architecture recommendation algorithms is often limited by issues such as data sparsity, challenges in understanding user needs, and the cold start problem. Hybridization, which combines multiple algorithms in different methods, has emerged as a dominant solution to these limitations (Bodduluri et al., 2024) [1].
In view of this, this paper uses 3 million time series data with purchase behavior provided by the Ali Tianchi big data platform, combines the Recurrent Neural Network, which is more suitable for the commodity recommendation scenario of an e-commerce platform, with Naive Bayes, which is simple in logic and efficient in operation, to build an online purchase behavior prediction model RNN-NB, which can consider the features of time series. Compared with the single-architecture collaborative filtering model and deep neural network model widely used in current e-commerce platforms, the RNN-NB constructed in this paper mainly makes breakthroughs and innovations in feature engineering and model construction. In the aspect of feature engineering, this paper makes statistics from three aspects: user feature, commodity feature, and interaction feature, and considers the corresponding feature events and their time nodes. In terms of model construction, this paper designs a Recurrent Neural Network with an N vs. 1 structure to extract the feature information in the user behavior sequence, forms the corresponding feature data matrix, and then obtains the final prediction result through the Naive Bayes classifier.
2. Related Work
User behavior sequence refers to some or all events triggered by a single user in a fixed time in chronological order, including positive feedback information such as click, browse, favorite, purchase, and order, as well as negative feedback information such as dislike and exposure not viewed. The sequential recommendation is to take these user behavior sequence data as input, predict the user’s possible subsequent interaction behavior by modeling the dependency between the user and item interaction, and then output the corresponding item recommendation list. At present, sequential recommendation algorithms can be divided into two categories. One is based on traditional recommendation algorithms, such as collaborative filtering, Markov chain, etc. The other category is sequence recommendation based on deep neural networks, such as Recurrent Neural Networks, Convolutional Neural Networks, and Graph Neural Networks.
2.1. Sequential Recommendation Based on Traditional Recommendation Algorithm
Most of the early studies directly applied mature and classical traditional recommendation algorithms to sequential recommendation. Collaborative filtering is the most widely used algorithm in recommendation algorithms. Latent factor representation and embedded representation are typical representatives. The potential factor representation first obtains the potential representation of users and items through decomposition learning and then uses the obtained representation information to predict. The embedded representation will decompose the learned potential representation input, using cosine or Pearson similarity to calculate the user’s similarity to the item as a prediction. Markov chains are also used in sequence recommendations because they are defined by the assumption that the probability of a state transition at a given time depends only on its state at a previous time.
2.1.1. Sequence Recommendation Based on Collaborative Filtering
Hidasi et al. (2016) proposed a general decomposition framework, taking the preference model as input to calculate the potential feature matrix of input dimensions. One dimension is users, the other is items, and other behavioral operations can affect users’ preferences [5]. This framework enables different linear frames to perform experiments in any context-aware recommendation task and provides a new idea for a sequential recommendation algorithm. He et al. (2017) proposed a scalable tensor decomposition method, which adopted a model to simulate three kinds of relations between users, items, and interactions. Items were embedded in the transition space as a point, each user was a transition vector in the space, and users’ transformations from one item to another were captured by user-specific transformation operations. The user’s pending recommendation is completely derived from the user’s past interactions with the item and the user transfer vector. Finally, the potential representation between the user and the pending item is obtained, and the item prediction expressed by Euclidean distance is directly used [6]. However, collaborative filtering for a sequential recommendation has some shortcomings, such as sparse data, new users, and other problems that will affect the recommendation effect. In addition, due to the relationship between time and space in the real user interaction sequence, this relationship cannot be well expressed through collaborative filtering, which also affects the recommendation effect.
2.1.2. Sequence Recommendation Based on Markov Chain
Rendle et al. (2010) successfully applied the Markov chain to the sequence recommendation model of short sequences, which can capture the transformation of items in short sequences and perform well even when the data is somewhat sparse [7]. Feng et al. (2015) mapped each point of interest into a potential space through distance embedding and then used the Markov chain model to predict the changes in the points of interest. The distance between the points of interest was used as the basis to measure the sequential relationship between the two points, and the points were finally recommended based on the sequencing [8]. Aghdam et al. (2015) modeled user behavior as a hidden Markov chain to capture changes in user preferences and modeled the user’s current context information as a hidden variable in the model [9]. Similarly, Le et al. (2016) also modeled user behavior as a hidden Markov chain, but the latter took into account factors such as user dynamic preference for emissions. For example, different users would consider the seasons when purchasing clothing, but the clothing brands they choose in each season are different [10]. However, the Markov chain also has obvious shortcomings in sequence recommendation. First, it can only achieve an obvious effect in short sequences, and sequence length will significantly decrease the recommendation effect. Secondly, it is more about acquiring the connection between individual items and individual items and ignores the interaction between multiple items; the interaction between multiple items is an important feature of the reality sequence.
2.2. Sequence Recommendation Based on Deep Neural Networks
With the development of hardware technology, deep neural networks gradually mature and are gradually applied to recommendation algorithms. The current mainstream deep neural network models include Recurrent Neural Networks (RNNs), Convolutional Neural Networks (CNNs), and Graph Neural Networks (GNNs).
2.2.1. Sequential Recommendation Based on Recurrent Neural Networks
Hidasi et al. (2016) innovatively introduced RNNs into the recommendation algorithm, taking the interaction of a series of items viewed in a session as a sequence and inputting the sequence into the model to predict the next viewed item [11]. The model uses RNNs to integrate sequence recommendation. This solves the problem that only the interactive sequence is used in the case of a lack of long-term user history record, but the recommendation effect is not good. As a variant of RNNs, Wu et al. (2017) adopted the Long Short-Term Memory network (LSTM) to build a model to adapt to the dynamics of users and movies and achieve more accurate video recommendations [12]. Every time a user scores a movie, the LSTM model is used to update the user representation, and the corresponding movie representation is also updated. The recommendation model predicts the user’s rating of a movie through the representation of the two. To solve the problem that the single-layer RNN model cannot effectively capture the long-term preferences of users, Quadrana et al. (2017) proposed the Hierarchical Recurrent Neural Network model (HRNN), which adopts different strategies for different user groups. If the user has a history, the general preferences can be obtained according to the user history and passed to the next sequence. If the user does not have a history, the user behavior sequence is simply modeled [13]. Compared with the single-layer RNN model, the advantage of this model is that it can integrate the user’s general preferences, combined with the short-term preferences reflected by the sequence information, and jointly improve the recommendation efficiency. Ying et al. (2019) proposed that the influence of users’ past and present behaviors on users’ preferences will change with the change of time and used the contextual time attention mechanism to learn the influence weight of users’ past behaviors. This not only contains information about the behaviors themselves but also includes information about time and space. Finally, a Bidirectional Recurrent Neural Network (BiRNN) is integrated to output together [14]. Therefore, from the point of view of the problem scenario, the Recurrent Neural Network is more suitable for the commodity recommendation scenario of the e-commerce platform.
As a kind of deep neural network, the advantage of a Recurrent Neural Network is that it is good at processing sequence feature data, and it can more effectively mine the hidden behavior feature information and timing feature information in user behavior sequences. Since the purchasing lines of users on the e-commerce platform have very obvious serial features, and their needs and preferences for commodities are very personalized, Recurrent Neural Networks are an ideal choice for predicting online purchasing behavior.
2.2.2. Sequence Recommendation Based on Convolutional Neural Network
Tang et al. (2018) proposed a Caser model, which takes the interaction sequences of items closest to each other in time and space as an image matrix, the rows of which represent the interaction sequence of items, and then uses different convolution filters to learn the sequence patterns as local features of the image. This model can not only represent the user’s sequence preference but can also indicate the user’s general preferences [15]. However, the Caser model will lose some important and repetitive information when facing long sequences due to the structural limitation of CNNs. The longer the sequence, the more obvious the problem will be. Yuan et al. (2019) proposed the NextItNet model based on the Caser model in view of the poor performance of CNNs in long series. The core of this model is an expanded CNN. Different from standard CNNs, the width of the receiving domain increases linearly, while the width of the receiving domain increases exponentially. The information used is broader, so compared with the traditional CNN model, it can efficiently process long sequences of rich information when using the same kernel and the same level [16].
As another general deep neural network, the advantages of Convolutional Neural Networks lie in local perception and weight sharing. Different from Recurrent Neural Networks in mining sequence feature information, Convolutional Neural Networks are better at predicting incomplete sequences with missing or fuzzy data based on existing complete sequences, which makes Convolutional Neural Networks more suitable for application scenarios such as image recognition and speech processing.
2.2.3. Sequence Recommendation Based on Graph Neural Network
Wu et al. (2019) applied a Graph Neural Network to sequence recommendations for the first time and proposed the SR-GNN model. The model treated each session sequence as a directed graph, adopted the edge weight homogenization for repeated edges and nodes, and then used a GNN to obtain the potential vector of nodes. Finally, through the concatenation of local and global vectors, a sequence vector representation combining long-term and short-term preferences is obtained, and the recommendation effect is significantly improved [17]. Xu et al. (2019) proposed a GC-SAN model based on the complementarity of a Graph Neural Network and a self-attention network and used a multi-layer self-attention network to obtain global dependence between long distances. The model sought to establish a complex context representation relationship among adjacent items, thus achieving a better recommendation effect than the SR-GNN model [18].
Compared with the above two kinds of deep neural networks, a Graph Neural Network is better at processing graph structure data, such as social network diagrams, traffic road maps, person relationship diagrams, molecular structure diagrams, computational junction network topology diagrams, etc. It can complete a graph structure budget, graph representation classification, and graph expansion prediction.
In summary, although serial recommendation based on traditional recommendation algorithms can achieve certain recommendation effects, it has obvious shortcomings in the face of problems such as new users and long sequences. In contrast, a serial recommendation based on deep neural networks can use algorithm improvement or a combination of multiple algorithms to solve these problems, and good recommendation effects have been obtained. Drawing on the research of existing scholars, this paper, on the basis of fully considering the features of the user behavior sequence data of e-commerce platform, combines the Recurrent Neural Network, more suitable for the commodity recommendation scenario of e-commerce platform, with Naive Bayes, with simple logic and efficient operation, to build an RNN-NB online purchase behavior prediction model that can consider the features of time series.
3. Online Purchase Behavior Prediction Model
3.1. Problem Scenario
The online purchase behavior prediction model is the main part of the recommendation algorithm of the e-commerce platform. Its purpose is to model the dependence relationship between the user and the commodity through the user behavior sequence data, predict the possible subsequent purchase behavior of the user, and provide guidance for the corresponding commodity recommendation. The historical data generated by users during platform activities, such as clicking, browsing, collecting, adding, and placing orders, often implies the user’s subsequent behavioral preferences. For example, the user views the page of the commodity before purchasing, the user likes to buy a commodity from the collection of commodities, and the user adds the commodity to the shopping cart before each purchase. Therefore, users’ historical behavioral sequences often predict their subsequent behavioral choices. E-commerce platforms can use these user behavioral sequence data to train and test online purchase behavior prediction models so as to analyze users’ behavioral preferences and guide commodity recommendations.
3.2. Feature Engineering
When extracting features, we must first understand the research objectives and the overall data situation so as to improve the classification accuracy. The data set provided to us by the Ali Tianchi big data platform includes “User ID”, “Commodity category ID”, “Commodity ID”, behavior category, and behavior time stamp. In order to predict whether users will have purchase behaviors for a certain commodity, we select all feature variables in the data set that can be used to represent user features, commodity features, and interaction features, as shown in Table 1. Then, we process user behavior data twice according to different time spans to obtain corresponding time series feature data.
Table 1.
Feature set after preprocessing.
- (1)
- User features are the description of the user’s behavior pattern to the commodity in order to capture the user’s personalized behavior law so as to highlight the individual features. Here, we extract the relevant metrics involved in the conversion rate of users from clicks to purchases, including the number of times that the user viewed the commodity, the number of categories of commodities viewed by the user, the number of times that the user favored the commodity, the number of categories of commodities favored by the user, the number of times that the user added the commodities to the shopping cart, the number of categories of user added commodities to the shopping cart, the number of times user purchased the commodity, and the number of categories of commodities purchased by the user;
- (2)
- From the perspective of the commodity, the features of the commodity itself are studied on the impact of user behavior, including “page view (pv)”, “favor (fav)”, “add to the shopping cart (cart)”, “purchase (buy)”, and other behaviors. These features reflect the degree of favor and popularity of the commodity in the same category by users. For example, the conversion rate of the commodity from being viewed to being purchased reflects the competitiveness of the commodity in the same category. The higher the conversion rate, the more users favor the commodity in the same category. Relevant indicators include the number of times the commodity was viewed, the number of times the commodity was favored, the number of times that the commodity was added to the shopping cart, the number of times the commodity was purchased, the number of users who viewed the commodity, the number of users who favored the commodity, the number of users who add the commodity to the shopping cart, and the number of users who purchase the commodity;
- (3)
- Interactive features are the various behaviors of users for specific commodities. In this paper, the user behavior sequence is statistically analyzed according to the keywords of user, commodity category and commodity ID in chronological order, and the time series generated by the behavior is analyzed; each user behavior is arranged within a 24 h interval. The interaction features reflect the number and sequence of the user’s behavior towards the commodity of this category. This feature reflects the user’s interest in the category of the commodity and helps judge the user’s subsequent behavior toward the commodity. Relevant indicators include user behavior sequence for the particular commodity, time series of user behaviors for the commodity, and the number of times the user viewed the categories of commodities.
3.3. Model Construction
Since the effectiveness of a single architecture recommendation algorithm is often limited by issues such as data sparsity, challenges in understanding user requirements, and cold start problems, fusion models have become the primary approach to address these limitations. As a recommendation algorithm that can more effectively mine the hidden behavior feature information and timing feature information in the user behavior sequence, a Recurrent Neural Network has a natural algorithm advantage in processing the user behavior sequence and predicting the purchase behavior; therefore, it becomes an ideal choice for us to build a fusion model. In addition, a Naive Bayes model, as a typical representative of the classifier model, has the advantages of simple logic and efficient operation and naturally becomes an indispensable part of our fusion model.
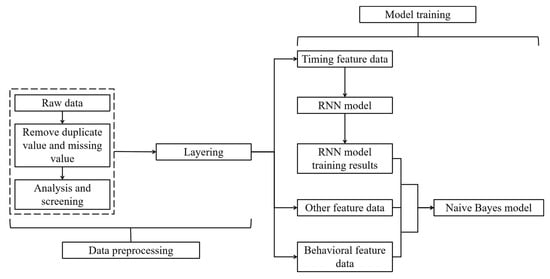
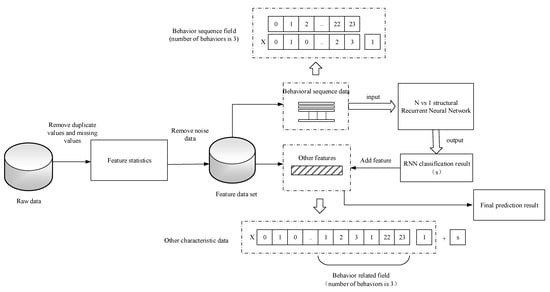
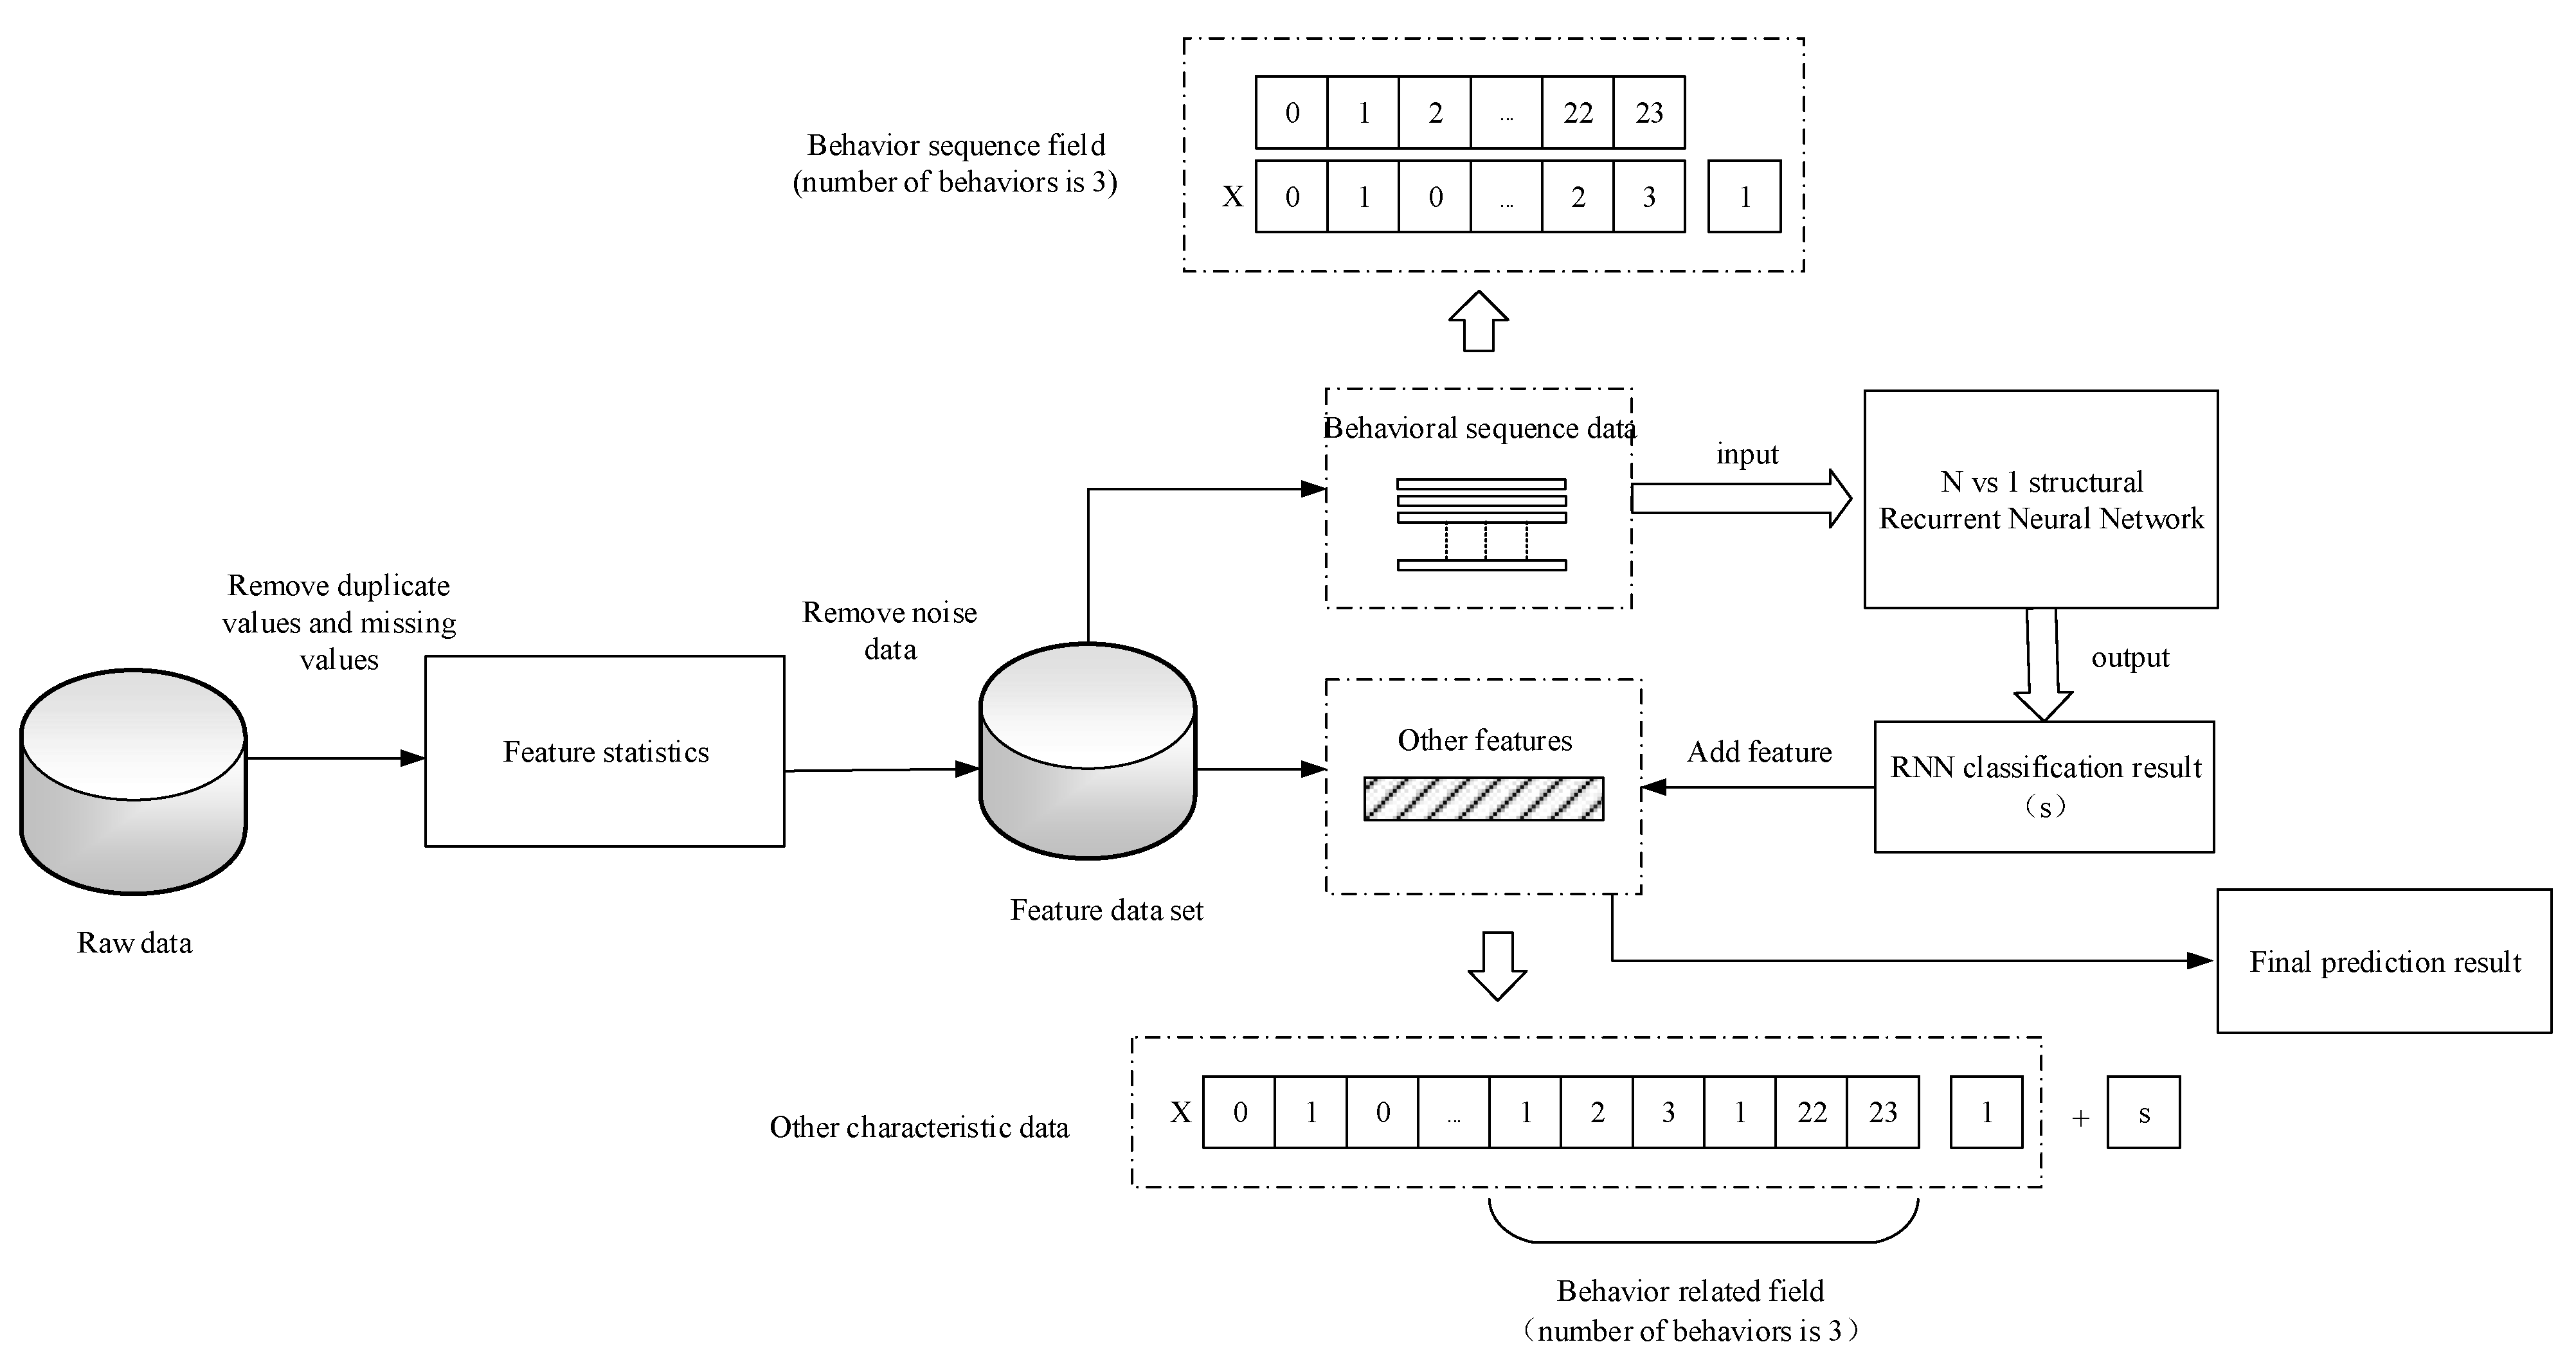
The overall framework of the online purchase behavior prediction model, the RNN-NB model, constructed in this paper is shown in Figure 1. The RNN-NB model is mainly composed of a Recurrent Neural Network (RNN) model layer and a Naive Bayes (NB) model layer. The RNN model layer is mainly used to mine the feature information in the user behavior sequence, and the Naive Bayes model layer is to predict the user’s purchase behavior according to the feature information. The top layer of the RNN-NB model uses a Recurrent Neural Network with an N vs. 1 structure. Specifically, the RNN model consists of an input layer, a hidden layer, and an output layer from top to bottom. After the user behavior sequence is divided into levels according to different sequence lengths, the behavior sequence of any level is denoted as X (Formula (1)). n is the length of the user behavior sequence, the value range of each time is between 0 and 24 h, and all behaviors are represented by integer values. If each behavior is filled to the time node where it is located, the value of other hour points is 0, and the length of the sequence is 24 × 1. M; this indicates the total number of input behavior records.
Figure 1.
Overall framework of the RNN-NB model.
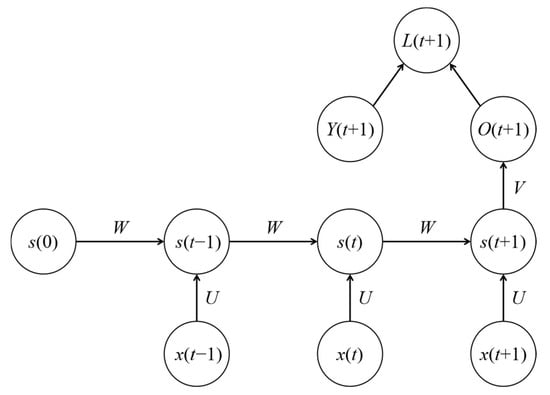
The hidden layer h(0) = 0 at t1 is initialized. The parameters U, W, and V of the input layer, hidden layer, and output layer are randomly initialized. The calculation is carried out by input Formula (2), where f is the activation function of the RNN, b is the bias term of the linear relation of the model, and the initial bias term is 1.
Since the problem studied in this paper is a classification problem, Formula (3) is used to finally obtain Score, where c is the value obtained by the calculation of the last hidden layer.
L(t+1) in Figure 2 is the final loss generated by the RNN, which is used to measure the distance between the output O(t+1) and the training result Y(t+1) and is used to judge the prediction effect of the model. The loss function of the Recurrent Neural Network selects the entropy function. The definition formula is as follows (Formula (4)): yt is the correct answer of the sequence and is the output value of the model prediction.
Figure 2.
Structure diagram of the N vs. 1 RNN model.
Due to the large amount of data in the training set and the test set, in this experiment, Batch_Size is set between [100 and 150]. In the RNN training, the value of iteration is set between [1000 and 2000], and the value of the learning rate is set between [0.001 and 0.1].
In the Naive Bayes model, the data set has two possible classification tags, C = {Y1, Y2}, which are the two different behaviors that the user can have. X is the set of samples to be classified. The score of the preliminary classification result obtained by the Recurrent Neural Network model (RNN) is taken as one of the attribute features of the set of samples to be classified. There are a total of d + 1 attributes, and the d + 1 attribute is the result obtained by RNN classification; that is, xd+1 = yl, and the original matrix input to the model is marked by X (Formula (5)).
Before entering the data into the model, the data is preprocessed to generate a feature data matrix suitable for the binary classification model (Formula (6)).
where A is the classifier model feature dimension vector, and A = (a1,a2,…,ak), k = m, and ak represent a specific classification feature. Then, the final prediction result is obtained by the Naive Bayes classifier (Formula (7)).
where C is the category label purchased by the user, Yj is the category label value, and P(C = Yj) is the prior probability. P(ak = ωik|C = Yj) is the conditional probability of the value of the feature variable when the class label is determined. The closer C is to 0, the less likely the user is to purchase the commodity later. The closer C is to 1, the more likely the user is to make a subsequent purchase.
4. Results and Analysis
This paper uses time series data with purchase behavior provided by the Tianchi big data platform, which records the behavior sequence of 980,000 users who purchased different kinds of commodities at different times. After pre-processing, these data will be used for the training and testing of the user’s online purchase behavior prediction model (RNN-NB), as shown in Figure 3.
Figure 3.
Model training demonstration.
4.1. Data Preprocessing Procedure
Firstly, we processed the raw data, eliminated the duplicate values and missing values, and carried out statistical analysis to remove the noise data and obtain the feature data set used in this paper. Then, we divided the feature data set into user behavior sequence data and other feature data. These user behavior sequence data will be input into the RNN model, and the classification results of the RNN model will be integrated with other feature data. Then, they will be input into the Naive Bayes model to obtain the final prediction result. In order to describe the user’s certain consumption choice of the commodity, this paper grouped the data according to the “User ID”, “Commodity category ID”, and “Commodity ID” and counted the user’s behavior sequence data, respectively, according to the category. Then, the time series generated by the user with the behavior sequence was matched, and it was finally identified whether the user purchased the commodity.
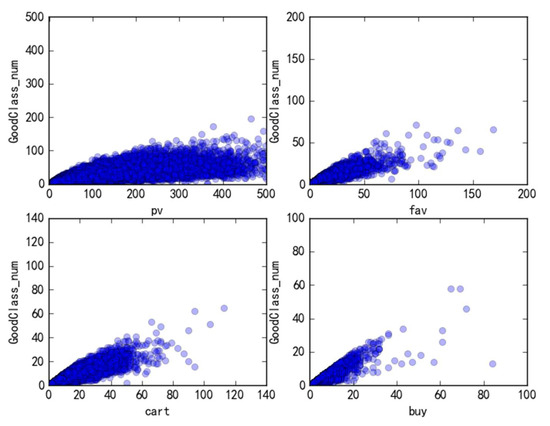
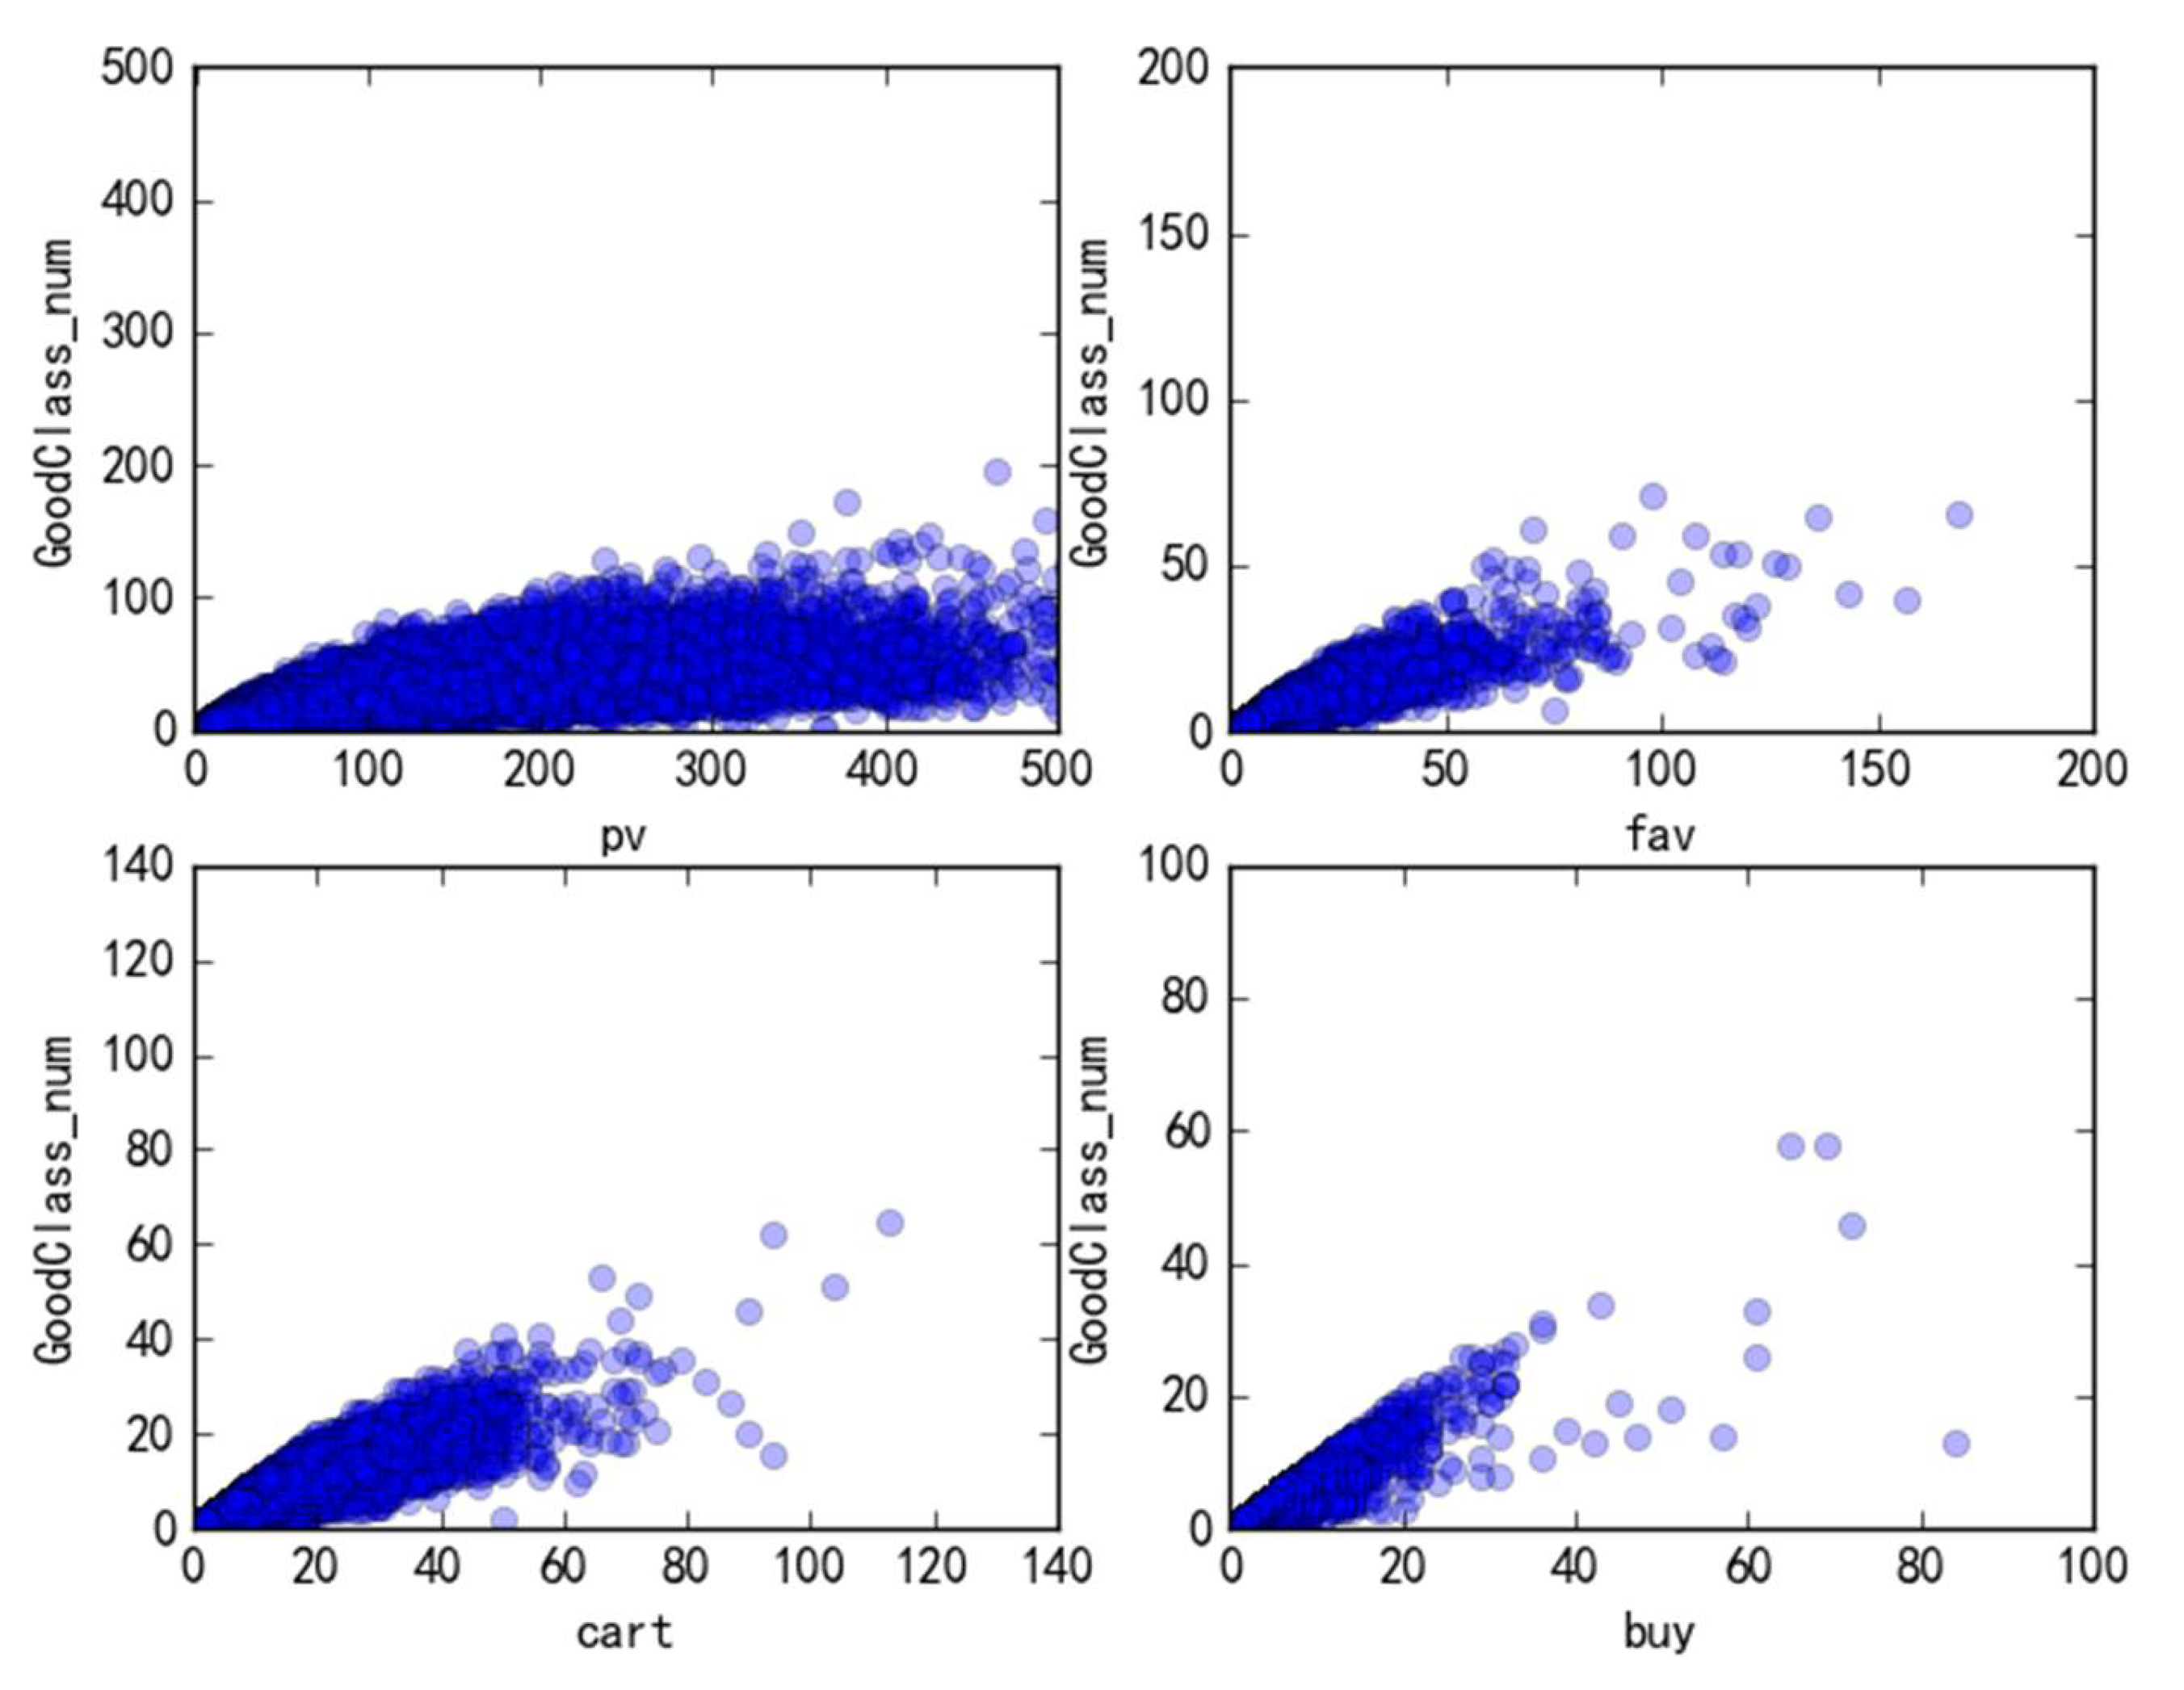
In purchase behavior analysis, the purchase conversion rate is an important indicator. As shown in Figure 4, the vertical axis represents commodity categories, and the horizontal axis represents user behavior. As can be seen from the dot distribution diagram, “page view (pv)” accounts for the vast majority of users’ pre-purchase behaviors, while the types of the commodity involved in page view behavior are less than half of the “pv” behavior. This means that users often conduct multiple operations on the selected commodity before purchasing online, “page view (pv)”, “favor (fav)”, and “add to the shopping cart (cart)” before “buy” behavior. In addition, the “pv” point distribution is very close to the X-axis, which means that consumers browse similar commodities more times before buying, and their purchase behavior is more cautious.
Figure 4.
User behavior and commodity category association.
Through data analysis, it was also found that the proportion of “pv” behavior in the original data was as high as 89%. At the same time, after the survey of the statistical behavior sequence, it was found that the final purchase of the commodity only accounted for 0.153 of the total number of users, which led to a serious imbalance in the proportion of positive and negative samples. In a machine learning model, such a large difference in data magnitude will cause this property to dominate the experimental process and also cause the iterative convergence to slow down. In order to speed up the prediction rate and accuracy, according to the purpose and demand of the prediction, it is necessary to delete the data meeting the following conditions:
- (1)
- Data on impulse purchases or direct purchases without any other behavior. Some users make a purchase without “pv” behavior on the commodity. In addition to the possibility of brushing, such user behavior may also be an impulse purchase. The occurrence of impulse consumption is related to commodity categories, user economic conditions, environmental factors, and merchants’ promotional activities. For example, during activities like “Double 11” or “Double 12”, when commodities are promoted, or brand-name low-price buying activities are carried out, users often have impulse consumption and even buy some unnecessary commodities. Therefore, impulse consumption not only cannot fully reflect the real purchase intention of users but also interferes with model training and model prediction accuracy;
- (2)
- Low-frequency single operation single commodity. The user has only one page view on a certain category of a commodity (the user only viewed one of the items of this category of a commodity), the number of operations is less than two, and there is no other behavior such as “fav”, “cart”, etc., to show that the user is interested in the commodity. Because the features of such behavior sequences are too few and the dimension is low, it is difficult to judge the subsequent behavior of users through only one behavior of users;
- (3)
- Low-frequency single operation of multiple commodities. When users browse multiple commodities under different categories, each operation is less than two times, and the type of behavior is limited to “pv” behavior; the user does not produce recognizable “fav” or “cart” behavior. The user’s behavior sequence length is too short, which will inevitably affect the accuracy of the final training results of the model. A partial example of the processed user behavior sequence is shown in Table 2.Table 2. Examples of behavior sequence data after processing.
After screening statistics, the statistical results show that the length of the behavior sequence generated by most users before purchase is in the range [3,8]. In order to study behavior sequences of different lengths in more detail, the data were statistically divided into six data sets according to different behavior sequence lengths, and the model was divided into six behavior levels for research during training.
4.2. Model Training
In order to test the predictive effect of the RNN-NB model on users’ online purchase behavior in the e-commerce commodity recommendation scenario, this paper uses the real user behavior sequence after desensitization provided by the Tianchi big data platform for training and testing. First of all, Mysql5.6 is used to remove duplicate values and missing values from the raw data, and 3 million time series data with purchase behavior are obtained after statistical analysis of user behavior features with commodities as the minimum unit and noise removal and other pre-processing steps. These data are merged with other feature data to obtain a new dataset, D1. The Naive Bayes model training was performed on the D1 data set using Python3.5, and the training results were saved for subsequent model comparison. Then, the D1 data set is divided into user behavior sequence data D1 and other feature data D2. The d1 data set is divided into a training set and a test set according to a 3:1 ratio, and the training set is divided into six levels according to the sequence length. The N vs. 1 RNN model layer based on the TensorFlow1.2.1 framework is input for training and testing. In this way, the RNN classification probability result is obtained, and then the classification probability result is carted to the D1 dataset as a new feature item to form a new dataset D2. The D2 data set is divided into a training set and a test set in a 10:1 ratio, and the training set is input into the Naive Bayes model layer for training tests to obtain the final classification result.
4.3. Model Comparison
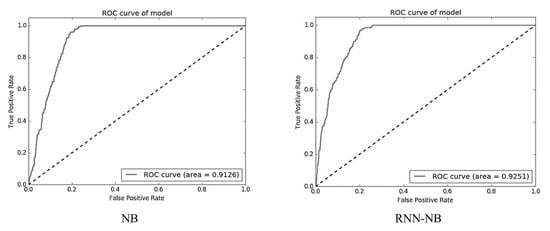
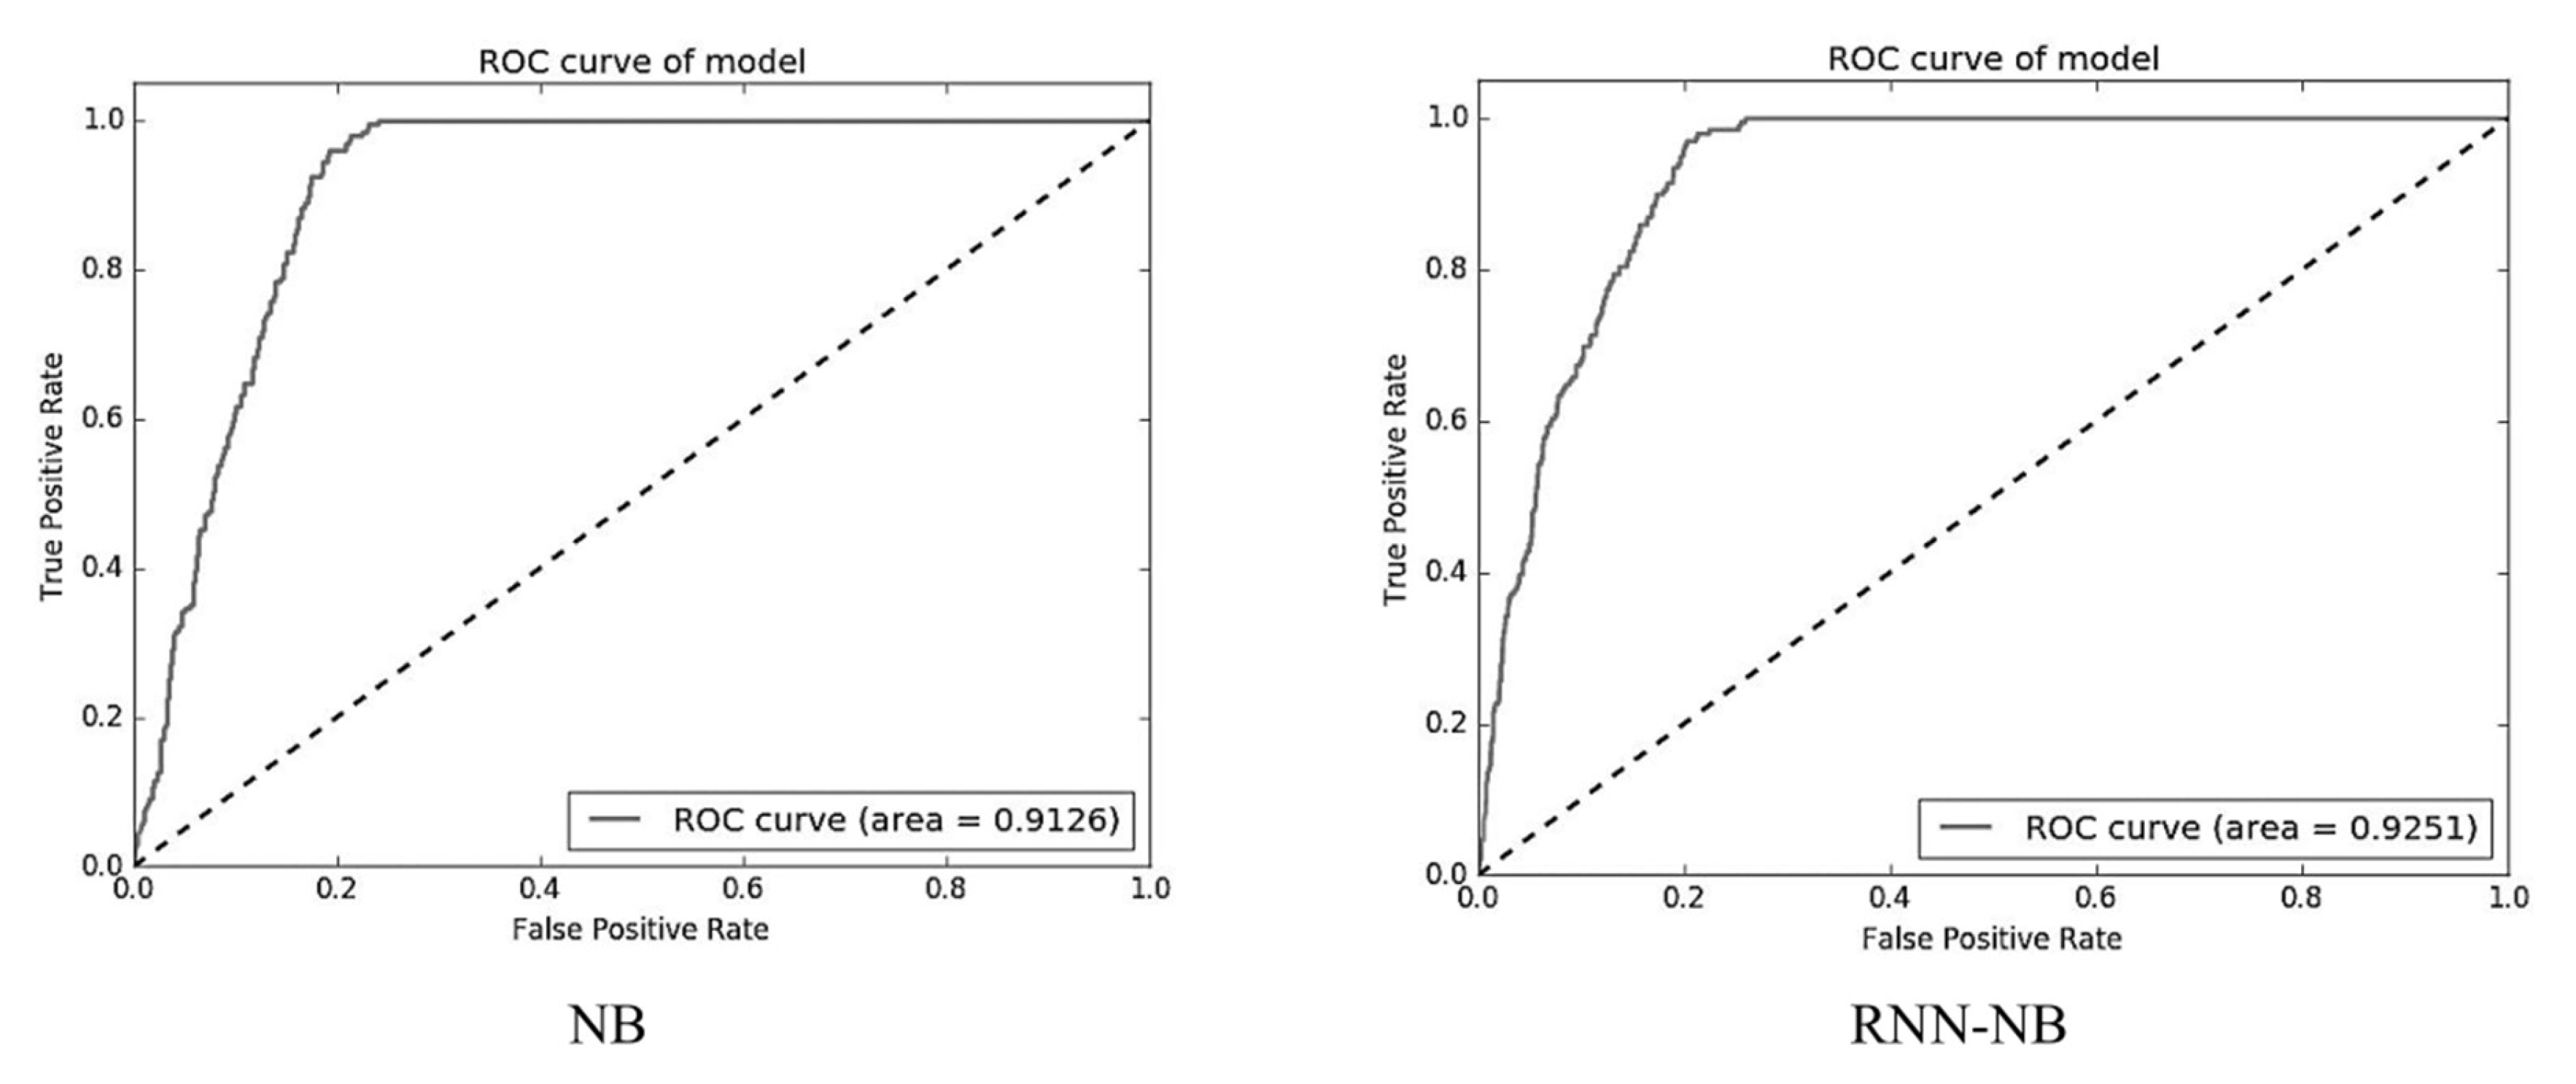
In order to test the training effect of the RNN-NB model, this paper selects the widely used Naive Bayes model in the recommended algorithm. According to the data set D1 obtained by the fusion of 3 million user behavior sequence data and other feature data after preprocessing, Python3.5 was used to perform the Naive Bayes model training on the D1 data set. The training results of the Naive Bayes model were compared with the ACC, PPV, TPR, TNR, F1-Score, and ROC curves of the RNN-NB model, as shown in Table 3 and Figure 5.
Table 3.
Comparison of prediction results.
Figure 5.
ROC curve comparison.
The ACC value predicted by the Naive Bayes model as a whole was 0.7925, and the TPR value was 0.8695. The F1-Score increased with the increase in sequence length, indicating that the overall prediction effect of the Naive Bayes model increased with the increase in sequence length; this was consistent with the conclusion of Borisov et al. (2018) that “the longer the sequence of user behavior, the higher the prediction accuracy” [19]. However, it is regrettable that the F1-Score only reached above 0.5 when the sequence length was 8. Compared with the recognition ability of negative samples, the Naive Bayes model has a stronger recognition ability of positive samples. With the increase in sequence length, the ability of the Naive Bayes model to identify positive samples gradually weakens. According to the ROC curve, the maximum AUC of the Naive Bayes model was 0.9126.
The overall predicted ACC value of the RNN-NB model was 0.8456, and the TPR value was 0.9192. The F1-Score decreased with the increase in sequence length, indicating that the overall prediction effect of the RNN-NB model decreased with the increase in sequence length. The F1-Score of each sequence length remained above 0.5, indicating that the overall prediction effect of the RNN-NB model was relatively stable. Compared with the recognition ability of negative samples, the RNN-NB model has a stronger recognition ability of positive samples. With the increase in sequence length, the recognition ability of the RNN-NB model to positive samples is gradually weakened. According to the ROC curve, the maximum value of AUC was 0.9251.
In conclusion, under the same conditions, the RNN-NB model has a better prediction effect and stability than the Naive Bayes model.
4.4. Time Series Feature Analysis
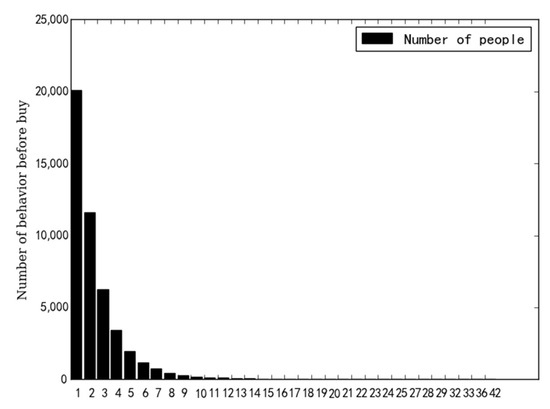
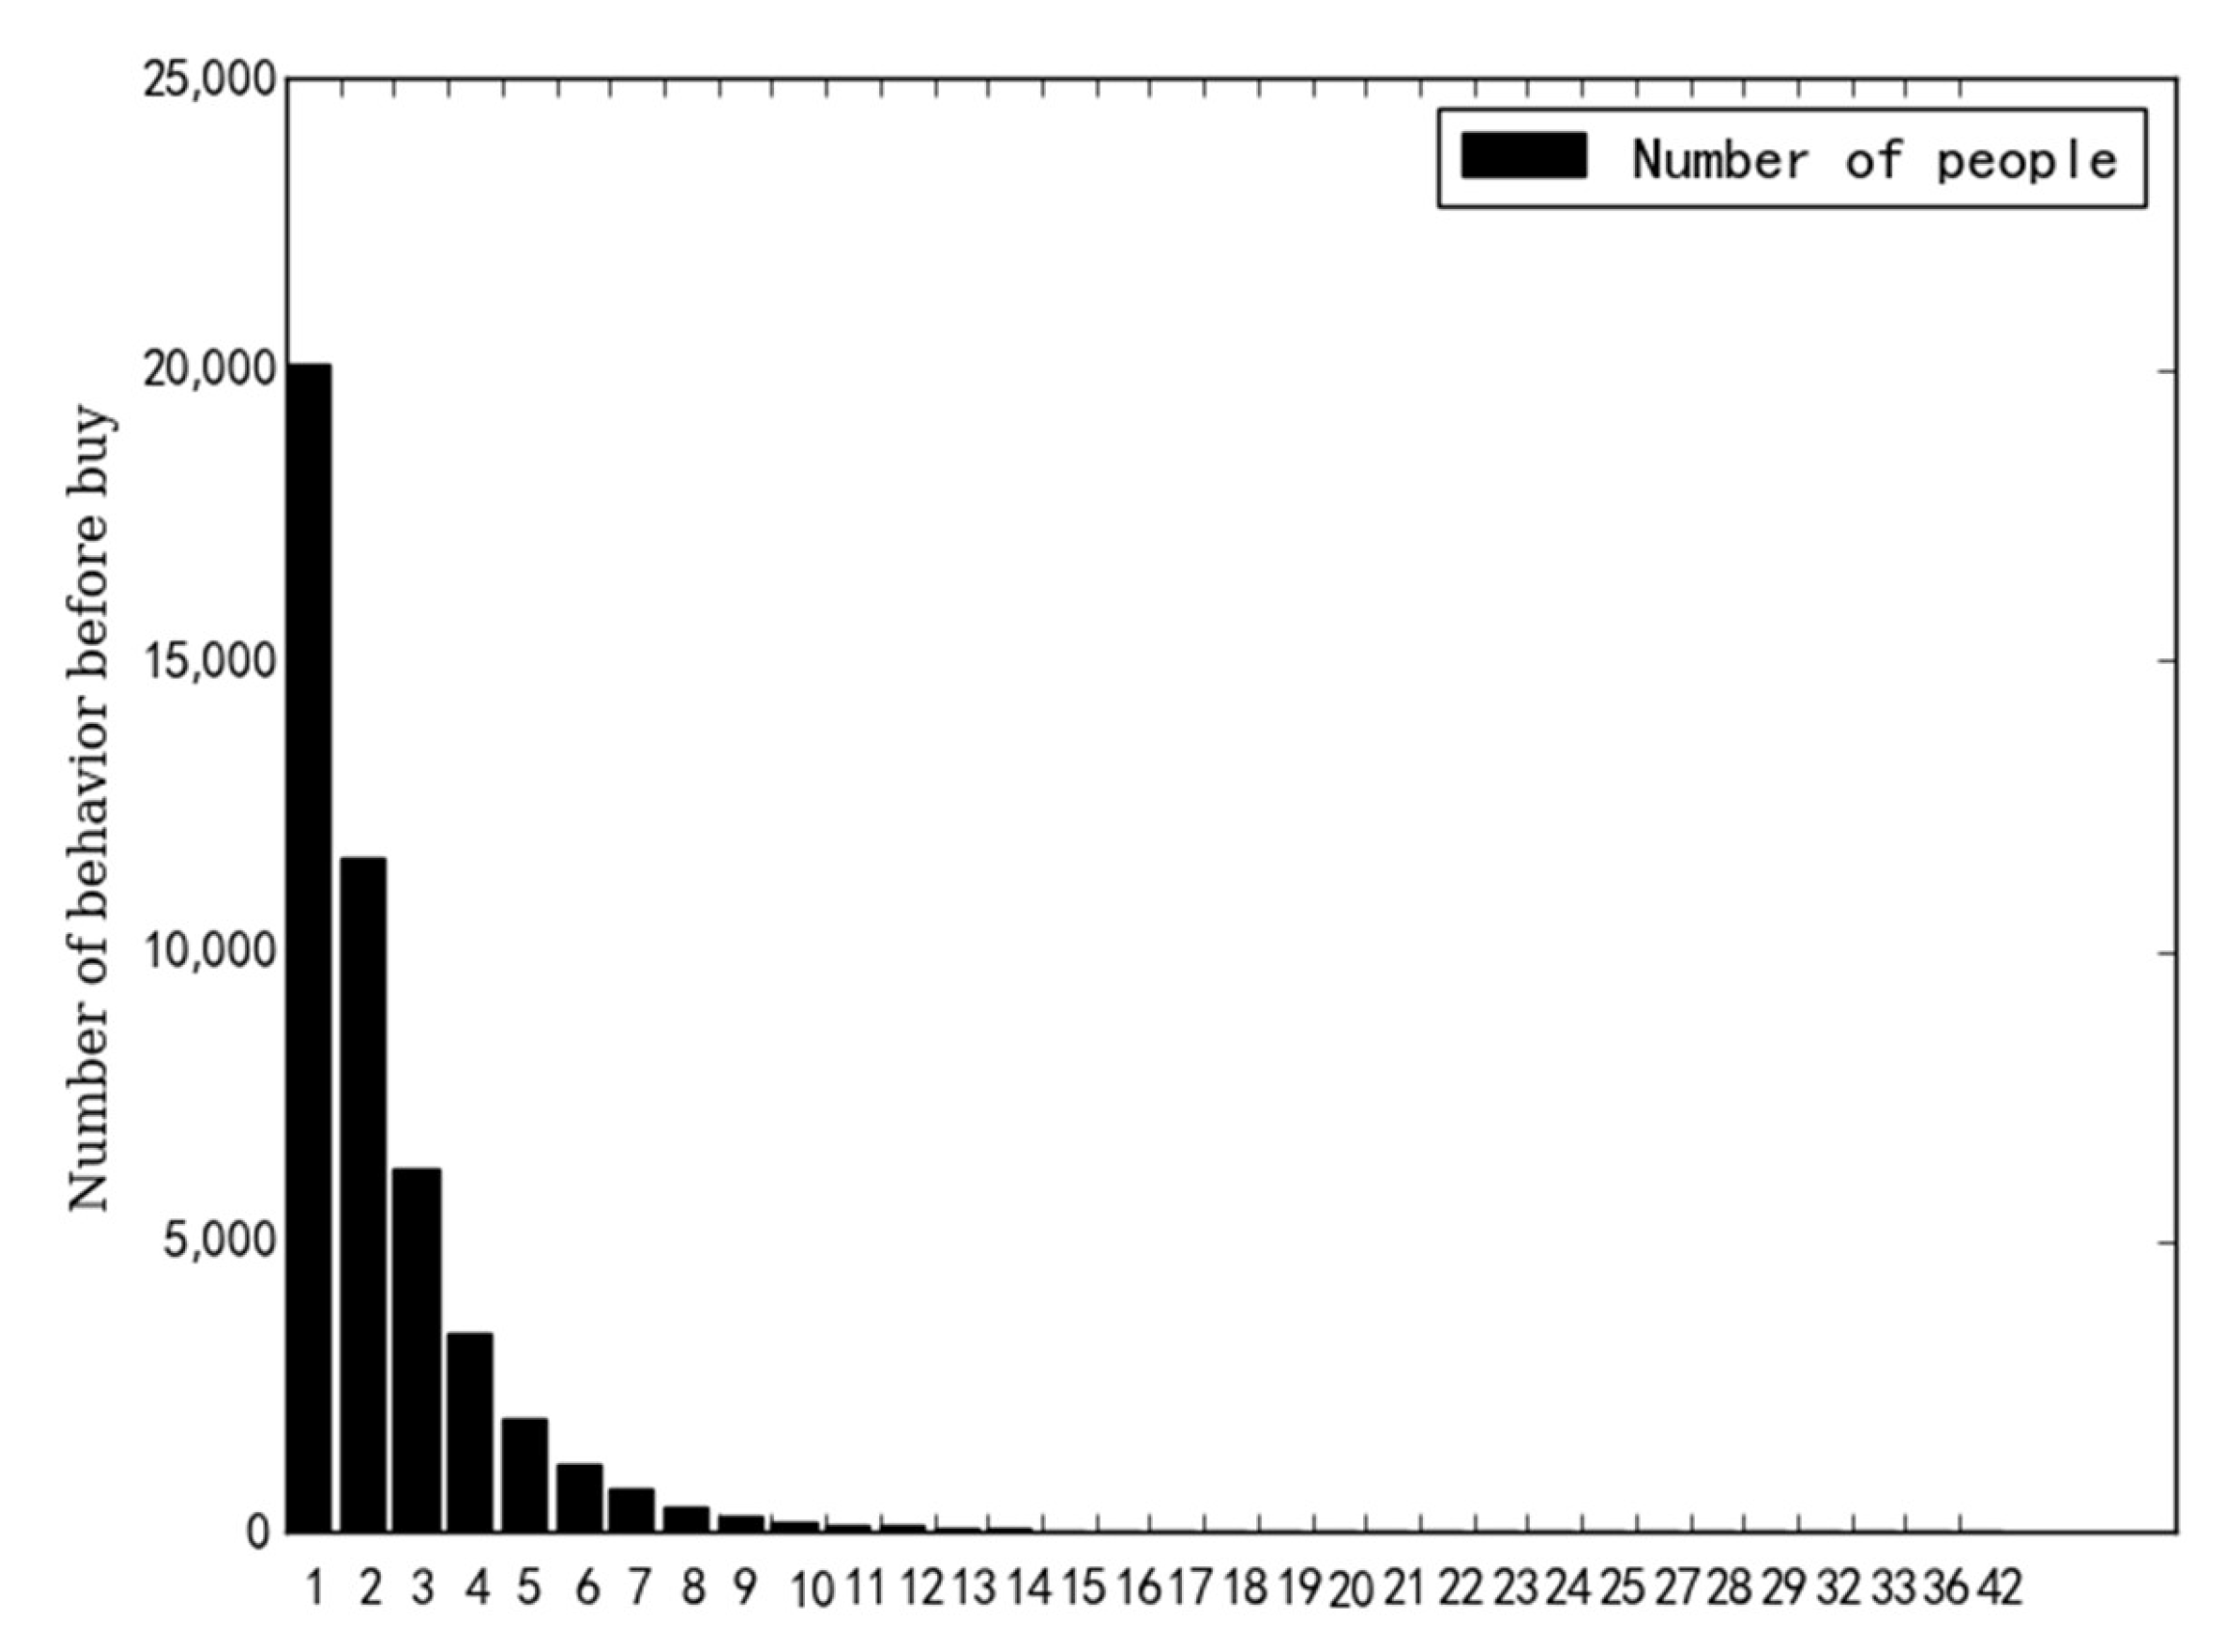
Excluding abnormal purchasing behavior, most sequences with purchasing behavior are between [2 and 7] in length (as shown in Figure 6). With the increase in the sequence length, the number of users with purchase behavior gradually decreases; that is, the possibility of users buying gradually decreases, which indicates that the possibility of users buying is negatively correlated with the sequence length. If the user has more behavioral events during this period of time before purchasing a commodity, that is, the longer the sequence of user behaviors, it indicates that the user is more cautious. The purchase decision of such users often has to undergo a lot of trade-offs and comparisons. Therefore, if the merchant gives a larger price discount, they will not make a purchase decision immediately. On the contrary, if the user has fewer behavioral events in the period before purchasing the commodity, that is, the shorter the sequence of user behaviors, the more decisive the user is; as long as the merchant gives a certain level of price concessions, they will immediately make a purchase decision. Therefore, for targeted offers, exclusive gifts, and other e-commerce marketing activities, merchants and platforms should pay more attention to those users with shorter sequence lengths and more decisive purchase behaviors.
Figure 6.
Analysis of the number of behaviors before buying.
5. Conclusions
User behavior sequence has always been the focus of the online purchase behavior prediction model. Existing research usually uses collaborative filtering or deep neural networks to extract the feature information contained in it and then predict the user’s subsequent purchase behavior based on it. In addition to the problems of cold start and data scarcity of the single architecture model, the lack of timeliness and personalization are also unavoidable defects of these models. In order to solve the above problems, this paper combines the Recurrent Neural Network, which is more suitable for the commodity recommendation scenario of the e-commerce platform, with Naive Bayes, which is simple in logic and efficient in operation, to build an online purchase behavior prediction model (RNN-NB) that can consider the feature of time series. Compared with the widely used Naive Bayes model, the results show that the RNN-NB model has a better prediction effect and stability. Compared with the existing models, the RNN-NB model constructed in this paper not only considers the time series feature of users’ online purchase behavior more effectively but also solves the problems of prediction efficiency and prediction accuracy of the single structural model from the perspective of architecture. This method provides a new idea for prediction model research and fusion model research. It fills the gap in the study of time series features of users’ purchase behavior in the field of online purchase prediction and opens up a new direction for follow-up research.
Based on the RNN-NB model, this paper analyzes the time series feature of user purchasing behavior and finds that the possibility of a user purchasing a commodity is negatively correlated with the sequence length. This finding suggests that if the user’s sequence of actions is longer, that is the more behavioral events they experience and the more time before purchase, the less likely they are to make the purchase decision. For these more “cautious” users, it is difficult to impress these users even if the platform merchants give greater incentives for activities. On the other hand, if the user’s sequence of actions is shorter, that is, the fewer behavioral events they experience and the less time before purchase, the more likely they are to make the purchase decision. For these more “decisive” users, as long as the platform merchants give a certain amount of activity, concessions can impress these users. Therefore, for platform merchants, when they develop targeted offers, exclusive gifts, and other marketing programs, they should pay more attention to those users with shorter series lengths or more decisive purchase behaviors, which will make it easier for them to sell commodities and improve revenue.
Although certain breakthroughs and innovations have been made in the construction of the RNN-NB model in this paper, due to user privacy protection and other reasons, we use the desensitized data provided by the Tianchi big data platform, which means that the model can only consider the behavior sequence of specific users within the single platform and cannot extract cross-platform feature information. However, in some cases, the user’s purchase decision is not made alone, and cross-platform product recommendations, such as family or friend recommendations and content marketing, will also promote the corresponding purchase behavior. Therefore, if the cross-platform historical behavior sequence of specified users can be obtained and cross-platform feature information can be extracted on the premise of ensuring the privacy and security of users, the prediction efficiency and prediction accuracy of the prediction model will be further improved, which will be an important direction for the prediction model of online purchase behavior in the future.
Author Contributions
Conceptualization, J.L. and S.Z.; methodology, J.L.; software, S.Z.; validation, C.Z., J.L. and S.Z.; formal analysis, J.L.; investigation, S.Z.; resources, S.Z.; data curation, S.Z.; writing—original draft preparation, S.Z.; writing—review and editing, C.Z. and J.L.; visualization, J.L.; supervision, C.Z.; project administration, C.Z.; funding acquisition, C.Z. All authors have read and agreed to the published version of the manuscript.
Funding
This study was funded by the National Social Science Foundation of China (21BTQ058), Jilin University Labor Relations Project (2023LD005), Jilin University Graduate Education Teaching Reform Project (2024JGZ006) and Jilin University National Development and Security Research Project (GAY2024ZXY08).
Data Availability Statement
The data presented in this study are available on request from the corresponding author.
Conflicts of Interest
The authors declare no conflicts of interest.
References
- Bodduluri, K.C.; Palma, F.; Jusufi, I.; Kurti, A.; Löwenadler, H. Exploring the Landscape of Hybrid Recommendation Systems in E-Commerce: A Systematic Literature Review. IEEE Access 2024, 12, 28273–28296. [Google Scholar] [CrossRef] [Scilit]
- Stalidis, G.; Karaveli, I.; Diamantaras, K.; Delianidi, M.; Christantonis, K.; Tektonidis, D.; Katsalis, A.; Salampasis, M. Recommendation Systems for e-Shopping: Review of Techniques for Retail and Sustainable Marketing. Sustainability 2023, 15, 16151. [Google Scholar] [CrossRef] [Scilit]
- Li, L.; Yuan, L.; Tian, J. Influence of online E-commerce interaction on consumer satisfaction based on big data algorithm. Heliyon 2023, 9, e18322. [Google Scholar] [CrossRef] [Scilit] [PubMed]
- Guo, H.; Tang, R.; Ye, Y.; Li, Z.; He, X. DeepFM: A Factorization-Machine based Neural Network for CTR Prediction. In Proceedings of the twenty-Sixth International Joint Conference on Artificial Intelligence IJCAI, Melbourne, Australia, 19–25 August 2017; pp. 1725–1731. [Google Scholar]
- Hidasi, B.; Tikk, D. General factorization framework for context-aware recommendations. Data Min. Knowl. Discov. 2016, 30, 342–371. [Google Scholar] [CrossRef] [Scilit]
- He, R.; Kang, W.; McAuley, J. Translation-based Recommendation. In Proceedings of the Eleventh ACM Conference on Recommender Systems ACM, Como, Italy, 27–31 August 2017; pp. 161–169. [Google Scholar]
- Rendle, S.; Freudenthaler, C.; Schmidt-Thieme, L. Factorizing Personalized Markov Chains for Next-Basket Recommendation. In Proceedings of the Nineteenth International World Wide Web Conference WWW, Raleigh, NC, USA, 26–30 April 2010; pp. 811–820. [Google Scholar]
- Feng, S.; Li, X.; Zeng, Y.; Cong, G.; Chee, Y.M.; Yuan, Q. Personalized ranking metric embedding for next new POI recommendation. In Proceedings of the Twenty-Fourth International Joint Conference on Artificial Intelligence IJCAI, Buenos Aires, Argentina, 25–31 July 2015; pp. 2069–2075. [Google Scholar]
- Aghdam, M.H.; Hariri, N.; Mobasher, B.; Burke, R. Adapting Recommendations to Contextual Changes Using Hierarchical Hidden Markov Models. In Proceedings of the Ninth ACM Conference on Recommender Systems ACM, Vienna, Austria, 16–20 September 2015; pp. 241–244. [Google Scholar]
- Le, D.; Fang, Y.; Lauw, H.W. Modeling Sequential Preferences with Dynamic User and Context Factors. In Proceedings of the Joint European Conference on Machine Learning and Knowledge Discovery in Databases ECML, Riva del Garda, Italy, 19–23 September 2016; pp. 145–161. [Google Scholar]
- Hidasi, B.; Karatzoglou, A.; Baltrunas, L.; Tikk, D. Session-based Recommendations with Recurrent Neural Networks. In Proceedings of the Third International Conference on Learning Representations ICLR, San Diego, CA, USA, 7–9 May 2015. [Google Scholar]
- Wu, C.Y.; Ahmed, A.; Beutel, A.; Smola, A.J.; Jing, H. Recurrent Recommender Networks. In Proceedings of the Tenth ACM International Conference on Web Search and Data Mining WSDM, Cambridge, UK, 6–10 February 2017; pp. 495–503. [Google Scholar]
- Quadrana, M.; Karatzoglou, A.; Balázs, H.; Cremonesi, P. Personalizing Session-based Recommendations with Hierarchical Recurrent Neural Networks. In Proceedings of the Eleventh ACM Conference on Recommender Systems ACM, Como, Italy, 27–31 August 2017; pp. 130–137. [Google Scholar]
- Ying, H.; Zhuang, F.; Zhang, F.; Liu, Y.; Xu, G.; Xie, X.; Xiong, H.; Wu, J. Sequential Recommender System based on Hierarchical Attention Networks. In Proceedings of the Twenty-Seventh International Joint Conference on Artificial Intelligence IJCAI, Stockholm, Sweden, 13–19 July 2018; pp. 3926–3932. [Google Scholar]
- Tang, J.; Wang, K. Personalized Top-N Sequential Recommendation via Convolutional Sequence Embedding. In Proceedings of the Eighteenth ACM International Conference on Web Search and Data Mining WSDM, Marina Del Rey, CA, USA, 5–9 February 2018; pp. 565–573. [Google Scholar]
- Yuan, F.; Karatzoglou, A.; Arapakis, I.; Jose, J.M.; He, X. A Simple Convolutional Generative Network for Next Item Recommendation. In Proceedings of the Twelfth ACM International Conference on Web Search and Data Mining WSDM, Melbourne, VIC, Australia, 11–15 February 2019; pp. 582–590. [Google Scholar]
- Wu, S.; Tang, Y.; Zhu, Y.; Wang, L.; Wang, L.; Xie, X.; Tan, T. Session-based Recommendation with Graph Neural Networks. In Proceedings of the Thirty-Third AAAI Conference on Artificial Intelligence AAAI, Honolulu, HI, USA, 27 January–1 February 2019; pp. 346–353. [Google Scholar]
- Xu, C.; Zhao, P.; Liu, Y.; Sheng, V.S.; Xu, J.; Zhuang, F.; Fang, J.; Zhou, X. Graph contextualized self-attention network for session-based recommendation. In Proceedings of the Twenty-Eighth International Joint Conference on Artificial Intelligence IJCAI, Macao, China, 10–16 August 2019; pp. 3940–3946. [Google Scholar]
- Borisov, A.; Wardenaar, M.; Markov, I.; De Rijke, M. A click sequence model for web search. In Proceedings of the Forty-first International ACM SIGIR Conference on Research & Development in Information Retrieval ACM, Ann Arbor, MI, USA, 8–12 July 2018; pp. 45–54. [Google Scholar]

Disclaimer/Publisher’s Note: The statements, opinions and data contained in all publications are solely those of the individual author(s) and contributor(s) and not of MDPI and/or the editor(s). MDPI and/or the editor(s) disclaim responsibility for any injury to people or property resulting from any ideas, methods, instructions or products referred to in the content. |
© 2024 by the authors. Licensee MDPI, Basel, Switzerland. This article is an open access article distributed under the terms and conditions of the Creative Commons Attribution (CC BY) license (https://creativecommons.org/licenses/by/4.0/).