


Highlights
What are the main findings?
- 3D point-cloud workflows using combined terrestrial and mobile laser scanning reliably document diverse Transylvanian heritage sites and support deformation and decay reading.
- Embedding this dual-sensor survey pipeline in an architectural curriculum increases students’ technical 3D skills and their ability to interpret cultural values from digital heritage data.
What are the implications of the main findings?
- Mixed TLS–SLAM point-cloud survey strategies provide a transferable model for evidence-based heritage documentation that can feed HBIM, digital-twin and monitoring workflows in other contexts.
- Treating point clouds as shared digital heritage records helps train future architects as responsible co-creators of archives that support long-term conservation, education and public access.
Abstract
This paper presents a pilot educational workflow that couples 3D remote sensing with heritage-driven pedagogy by engaging architecture master’s students in the documentation and digital archiving of Transylvanian cultural sites. Using terrestrial and mobile 3D scanning, students documented multiple typologies—wooden churches (Târgușor, Tioltiur), historical ensembles (Mociu, Coplean), industrial sites (1 Mai–Luduș, Vânătorilor–Luduș), and an urban street segment (Potaissa)—to generate dense point clouds that served as the basis for geometric reconstruction, semantic interpretation, and condition assessment. The study describes how the characteristics of different construction systems (timber, brick, stone, mixed structures) relate to point-cloud quality, survey coverage, and subsequent CAD/BIM drafting, with attention to the qualitative reading of minor deformations in wooden churches and of degradation patterns in masonry and industrial buildings. We also consider how artefacts in the data (noise, occlusions, registration errors) affect scene understanding and the interpretation of derived observations relevant to condition assessment and, prospectively, to monitoring. For the Tioltiur dual-sensor case, the TLS and SLAM datasets were compared through an internal CloudCompare registration check (final RMS 0.1121 on 50,000 points, fixed scale 1.0 and theoretical overlap 100%), surface-density displays (r = 0.005 for the Z+F dataset and for the GeoSLAM dataset), fitted-wall-plane readings (dip values around 89 deg. and 85 deg.) and a longitudinal section documenting roof/vault deformation. Beyond technical performance, the paper examines the self-reported formative impact on students’ digital skills and their understanding of cultural values, arguing that participation in 3D data acquisition, processing, and interpretation positions them as co-creators of a living digital archive. Pre- and post-workshop questionnaires (n = 13 each) are analysed descriptively—counts, percentages and medians with interquartile ranges—because the two instruments are unmatched and carry no shared identifier, so no paired test is applied; post-workshop self-ratings of technical competence, heritage understanding, archival awareness and collaboration were consistently high (medians 4–5), with uneven access to VR the main gap. By connecting point-cloud-based documentation workflows with heritage education, the project outlines a transferable, monitoring-ready baseline model in which 3D remote sensing supports both careful documentation and the transmission of regional identity and cultural meaning in architectural training. As an exploratory pilot with a small, self-reported sample, the study reports descriptive and qualitative findings rather than validated metric or statistical results.
1. Introduction
In cultural-heritage documentation, 3D survey workflows based on terrestrial laser scanning (TLS), image-based dense reconstruction and point-cloud processing have become standard tools for recording complex sites and supporting conservation analyses. Existing studies in remote sensing and photogrammetry usually present expert-driven pipelines in which acquisition, registration, geometric analysis and model generation are optimised for accuracy and completeness, but rarely examined as educational processes. In contrast, the present work implements a reproducible educational pipeline in which architecture master’s students participate in all stages of the workflow: a pre-survey of prior experience and expectations, preparatory instruction and laboratory familiarisation, on-site documentation and 3D scanning, point-cloud processing and CAD-based survey drafting, followed by a post-survey of learning outcomes. Each stage is linked to specific indicators that structure the analysis: general experience and exposure to point clouds and VR (EXP, PC_EXP, VR_EXP), technical competence in 3D workflows (IT3D), sensitivity to heritage and cultural values (SPV), awareness of digital archiving, digital twins and digital conservation (AD), motivation and anticipated difficulties (MOT), and the perceived role of collaboration in producing reliable digital records (COL). This design allows the educational impact of the 3D survey workflow to be evaluated systematically, while remaining consistent with current methodological priorities in remote sensing for cultural heritage.
3D point-cloud workflows form the methodological foundation for this educational pipeline. Work on Heritage Building Information Modelling (HBIM) has shown how reality-based point clouds can be transformed into information-rich building models that encode both geometry and material decay [1]. Chiabrando et al. demonstrate a scan-to-HBIM workflow in which TLS and photogrammetry are integrated to produce dense point clouds that are converted into parametric components and decay maps in a BIM environment [1]. Their case studies underline recurring challenges—vaults, irregular surfaces, non-standard elements—but also show that once a coherent HBIM is constructed, deterioration can be represented and queried systematically within a single information model. This approach anticipates a key idea in the present work: students should regard point clouds not as static outputs, but as starting points for diagnostic modelling and condition representation.
Recent contributions further refine the role of 3D point clouds and HBIM in cultural heritage conservation. Crisan et al. propose an intelligent HBIM-based framework that starts from 3D scanning and defines detailed information requirements (OIR, AIR, EIR, AIM) to integrate geometric, material, historical and decay-related data into OpenBIM-compliant models, while explicitly distinguishing between an expert-oriented HBIM and a high-fidelity visualisation model for immersive public experiences [2]. Their case studies, including Transylvanian sites, exemplify how point clouds can become the backbone of heritage asset information models rather than isolated survey products [2]. In a related direction, recent work on HBIM and intelligent models argues that such enriched representations are essential for linking point-cloud-based documentation with predictive maintenance, IoT-based monitoring and stakeholder engagement, further reinforcing the view of point clouds as central, long-lived information assets in heritage conservation and education [2,3].
Other studies emphasise that the quality and interpretive potential of point-cloud data depend strongly on acquisition and processing workflows. Gagliolo et al. compare several photogrammetric software packages using identical cultural-heritage image sets and show that differences in algorithms and parameterisation yield measurable variations in accuracy, completeness and noise [4]. D’Agostino et al. propose an integrated 3D survey for rock-cut underground heritage, combining TLS with photogrammetry to cope with occlusions, complex morphologies and multi-scale requirements [5]. Their pipeline—from survey planning through registration and fusion to final model generation—illustrates that decisions about sensor combination, viewpoint distribution and data fusion are critical for capturing subtle deformations and decay features. These insights support the structure of the educational workflow here, where students explicitly plan acquisition, assess completeness and confront the limitations of their own point clouds before attempting interpretation.
Complementing HBIM-focused work, Selim et al. demonstrate an integrated TLS–GIS workflow for documenting endangered Shanasheel wooden houses in Al-Basrah, Iraq, achieving millimetric registration accuracy and high point densities, then deriving CAD plans, textured 3D models and a GIS-based heritage database that links geometric documentation with risk assessment and spatial analysis [6]. This work underscores the importance of rigorous accuracy evaluation and structured archiving when point clouds are used for deformation analysis, condition mapping and long-term management [6]. At the scale of digital preservation practice, recent reviews of tools and techniques emphasise that high-resolution point clouds and 3D models act as “digital safeguards” within wider disaster and preservation cycles, but also warn about unresolved issues of storage, metadata standardisation, interoperability and access rights, which are critical when aiming to build living digital archives of architectural heritage [3]. On the processing side, Li et al. address missing regions in large-scale heritage point clouds by combining voxelization with a geometry-aware Transformer and a feature-expansion upsampling module, improving completion efficiency and point-density uniformity and thereby enhancing transparent visualization of complex structures such as timber roofs and cave sites [7].
A second line of literature extends point-cloud use from documentation to monitoring and digital twins, directly engaging with deformation and time-varying damage. Kong and Hucks introduce a photogrammetry-based digital-twin framework for historic structures, in which UAV image sets are collected at multiple inspection epochs, processed to produce time-stamped virtual models and aligned to extract differential geometric features associated with deterioration [8]. Their work shows that repeated 3D surveys, combined with careful registration, can reveal crack evolution and other damage processes at a structural scale and that these digital twins can inform maintenance and rehabilitation decisions. Moyano et al. and related HBIM-focused studies similarly use TLS point clouds as the basis for information modelling, evaluating how scan density, occlusions and registration residuals affect the reliability of HBIM elements used for conservation planning [9]. Together, these contributions reinforce the idea that point-cloud workflows are inherently dynamic and diagnostic, and that training students to think in terms of deformation, decay and temporal comparison is essential for contemporary heritage practice.
Recent reviews provide a broader synthesis of this research landscape. Yang et al. present a scientometric survey of 3D point clouds in cultural heritage, identifying documentation, HBIM, damage detection, virtual restoration and multi-source fusion as major clusters and highlighting rapid growth in methods that couple geometric data with semantic information [10]. A companion review by the same authors surveys semantic-segmentation techniques for heritage point clouds, discussing feature-based, machine-learning and deep-learning approaches and stressing the need for benchmark datasets [11]. Li et al. review digital-preservation tools and techniques for architectural heritage across disaster cycles, proposing a framework that links digital recording, preservation and application and emphasising the central role of digital archives, HBIM and emerging digital-twin approaches in resilience strategies [12]. These reviews situate individual workflows within a trajectory from high-precision acquisition, through knowledge-rich modelling, to long-term management and risk-informed interventions, and they show that interpreting deformations and decay from 3D data is now a core component of heritage practice.
Finally, several contributions foreground access, dissemination and education, directly aligning with the pedagogical focus of this article. Tommasi et al. discuss access and web-sharing of 3D digital documentation, framing 3D models as resources that must be curated for multiple audiences—conservators, decision makers and the public—and arguing that HBIM and web platforms should support both technical monitoring and “edutainment” experiences [13]. Mayer and Mitterecker examine how surveying content can be calibrated “as simple as possible, as much as necessary” for architecture students, integrating basic measurement and data-processing exercises into design curricula [14]. Kowalski et al. show how 3D scanning can be used to create immersive learning experiences, with students exploring processed point clouds in virtual environments to understand complex spaces [15]. Additional work on visualisation and teaching innovation demonstrates how point-cloud-based and BIM-based workflows can be embedded in architectural curricula and evaluated through targeted educational studies [16,17,18]. Taken together, these educational and access-oriented studies support the design of an integrated pipeline in which students participate in the full sequence from acquisition to interpretation and archiving, and they justify the use of pre- and post-workshop surveys to evaluate changes in technical competence, sensitivity to deformation and decay, awareness of digital-preservation frameworks and the perception of their role as co-creators of a living digital-heritage archive.
2. Materials and Methods
The workshop methodology was organised as a structured educational pipeline combining preparatory instruction, laboratory familiarization, on-site data acquisition, digital processing, survey drafting and post-activity evaluation. The teaching format comprised two group workshops and three individual collaborations linked to architecture diploma projects, which allowed the workflow to be tested in both collective and project-specific settings. The process began with a classroom session and a preparatory meeting, during which students were introduced to the architectural and historical context of the selected heritage sites, the principles of 3D remote sensing and point-cloud generation, and the organization of the field activities. This preparatory stage also included a visit to the digital technology laboratory, where students were familiarised with the available workflows and equipment for 3D scanning, virtual reality (VR), augmented reality (AR) and digital fabrication, providing a broader technical framework for understanding how point-cloud acquisition is integrated into digital heritage documentation.
2.1. Survey Pipeline
The survey workflow was organised as a three-phase pipeline, following integrated documentation practices for cultural-heritage remote sensing [10,19,20]. Phase 1 comprised documentation and on-site visits. Before any acquisition, students carried out visual inspections, photographic records and sketches of each site (Tioltiur and Târgușor wooden churches, Potaissa street façades, Calvaria stone church, Mociu former hospital, Coplean Castle and the Luduș factories), noting typology, materials, accessibility and safety [5,20]. These observations informed the placement of terrestrial laser scanner (TLS) stations, the definition of mobile trajectories and the prioritisation of areas where deformation and decay signals were expected, in line with survey-planning and condition-assessment studies [9,21,22].
Phase 2 focused on scanning and initial point-cloud processing, using a dual-sensor setup: a Z+F Imager 5010X phase-shift TLS and a GeoSLAM ZEB Horizon handheld/mobile laser scanner [21,23]. At Tioltiur, the wooden church was scanned twice with both instruments to enable direct comparison of static and mobile datasets [21,24]. At Târgușor, Potaissa street and Calvaria, single ZEB Horizon surveys followed looped walking trajectories designed to maximise coverage and SLAM stability, reflecting mobile-mapping guidelines [19,23]. For Mociu, Coplean Castle and the Luduș factories, mixed campaigns were adopted: the Z+F Imager 5010X was used for exteriors, and the ZEB Horizon for interiors and timber roofs, consistent with multi-sensor strategies in complex heritage sites [9,11,24]. Raw scans were registered, filtered and clipped into unified point-cloud blocks and georeferenced at site level, producing analysis-ready datasets comparable to those used in multi-source fusion and digital-twin frameworks [8,11].
Phase 3 translated point clouds into 2D and 3D survey outputs. In 2D, orthophotos, plans, elevations and sections were generated by slicing and projecting point clouds onto reference planes, enabling quantitative measurement of deviations from planarity and verticality and visualisation of wall inclinations and roof sagging, following geometric condition-assessment and photogrammetric documentation workflows [20,22]. In 3D, cleaned point clouds were segmented and used either as direct rendering assets or as geometric bases for preliminary HBIM components and mesh-based visualisations, in line with proposals for using survey clouds directly in virtual and diagnostic applications [1,16,25]. These products served simultaneously as traditional survey deliverables, diagnostic layers for deformation and decay reading, and teaching resources, operationalising the documentation–recording–application triad emphasised in digital-preservation and scientometric reviews [10,11,12].
2.2. Equipment and Acquisition Strategies
The Z+F Imager 5010X is a phase-shift TLS system. Its nominal manufacturer specifications quote an unambiguity (single-shot) range of 187.3 m, a range resolution of 0.1 mm, a linearity error of ≤1 mm, a maximum acquisition rate of about 1.016 million pixels s, and a field of view of 320° (vertical) × 360° (horizontal); the quoted range noise at 10 m is approximately 0.4 mm RMS on a black (14%) target and 0.2 mm RMS on a white (80%) target. (Z+F IMAGER 5010X datasheet: https://www.waps.net.au/wp-content/uploads/2017/01/2-ZF-Imager-5010X-Datasheet.pdf) (accessed on 17 August 2026). These are nominal manufacturer specifications and do not represent the accuracy achieved in this study. Field-achieved accuracy depends on range, incidence angle, surface material, registration quality and environmental conditions, and was not independently verified here [9,21]. In this pipeline the instrument was used mainly for exteriors and selected interiors (Tioltiur, Mociu, Coplean Castle, Luduș façades) where tripod deployment was feasible and where geometric reference shells were required [22]. Station layouts were designed to provide sufficient overlap, appropriate incidence angles and reasonably homogeneous point density, following TLS accuracy-assessment protocols [9,21]. These configurations were intended to yield reference shells suitable, in principle, for point-to-primitive and point-to-model comparison of global geometry, as in HBIM-oriented workflows that model decay from point-cloud geometry [1].
The GeoSLAM ZEB Horizon is a mobile laser scanner based on Simultaneous Localization and Mapping (SLAM), acquiring 3D data along continuous trajectories and reconstructing both geometry and scanner path in real time [19,23]. Its nominal manufacturer specifications quote a maximum range of 100 m, an acquisition rate of 300,000 points s, a field of view of 360° × 270°, and a relative accuracy of up to 6 mm. (GeoSLAM/FARO ZEB Horizon technical specifications: https://knowledge.faro.com/Hardware/GeoSlam/ZEB_Horizon_and_Horizon_RT/Technical_Specifications_Sheet_for_ZEB_Horizon (accessed on 17 August 2026); As above, these are nominal manufacturer specifications rather than achieved field performance; SLAM relative accuracy in particular is trajectory- and environment-dependent and was not independently verified in this study. It was deployed in interiors, timber roof spaces, narrow circulation areas and linear urban sequences (Tioltiur exterior, interior and roof structure, Târgușor, Potaissa street, Calvaria interior, Mociu interior and roof, Luduș factories). Acquisition strategies emphasised closed loops, repeated passes and controlled walking speed to reduce drift and improve SLAM robustness, in line with systematic reviews of mobile point-cloud damage detection [23]. Mobile scans generally have lower geometric precision than static TLS; their dense coverage of complex volumes and occluded spaces makes them well suited to documenting internal geometry and to the visual mapping of material losses and decay patterns, as reported in multi-source studies [11,24].
By registering Z+F and ZEB datasets into common reference frames, multi-source ensembles were created in which accurate static shells and rich mobile interiors could be analysed together [9,21,24]. This configuration follows trends identified by Yang et al. and Sánchez-Aparicio et al., where TLS and mobile or photogrammetric point clouds are integrated to support both documentation and damage assessment and to feed HBIM, GIS and digital-twin workflows [8,10,11,23]. Within an educational context, this dual-sensor, three-phase pipeline exposes students to the full sequence from reconnaissance through multi-sensor acquisition to point-cloud-based 2D/3D survey and remote-sensing-driven interpretation.
2.3. Pre- and Post-Workshop Questionnaires
2.3.1. Design and Rationale
To document the educational experience of the workflow, participants completed a questionnaire before the fieldwork and a second questionnaire after completing the practical work. The pre-workshop questionnaire established a baseline profile in relation to previous site-survey experience, prior exposure to point clouds and VR, self-assessed technical competence, awareness of heritage values, familiarity with digital archiving concepts and expectations regarding the workshop. The operational phase consisted of guided on-site visits to the selected buildings, combining direct architectural observation, photographic documentation, conventional recording and supervised 3D scanning with particular attention to scan coverage, overlap and the recording of acquisition conditions. After data capture, the scans were imported, registered, cleaned and organised into usable point clouds, which were then used to extract sections, measurements and geometric information supporting the production of survey drawings in CAD. During this stage, students were asked to weigh geometric regularisation against fidelity to the irregularities and deformations of the existing structures. The post-workshop questionnaire, structured in parallel with the pre-workshop instrument, was administered to record self-reported changes in perceived 3D competence, heritage understanding, experience with VR, awareness of digital archives and digital twins, and the perceived role of collaboration.
2.3.2. Instrument and Constructs
The pre-workshop questionnaire was organised around seven descriptive dimensions: general experience with site-based relevé (EXP), prior exposure to point clouds (PC_EXP) and VR (VR_EXP), self-reported technical competence in 3D workflows (IT3D), sensitivity to heritage and cultural values (SPV), awareness of digital archiving and digital twins (AD), and motivations, expectations and concerns (MOT). The post-workshop questionnaire was organised around five dimensions: technical 3D competence (IT3D), sensitivity to heritage and cultural values (SPV), VR experience and impact (VR_EXP), digital archive awareness (AD), and collaboration (COL). The pre- and post-instruments therefore do not share an identical set of constructs: MOT and the general-experience baseline (EXP) are specific to the pre-workshop questionnaire, while COL is introduced only in the post-workshop questionnaire, and the item wording differs between the two phases. For this reason the two questionnaires are treated as unmatched instruments, and no paired, item-by-item pre/post comparison is reported. IT3D captured students’ perceived understanding of point-cloud principles and their self-reported ability to contribute to cleaning, registration, measurement and future use of 3D workflows; SPV examined whether students felt better able to interpret construction systems, recognise cultural significance and reconsider Transylvanian heritage through 3D data; VR_EXP captured both the extent of exposure to VR and the perceived contribution of VR to spatial comprehension and condition reading; AD measured self-reported understanding of digital archiving, digital twins and digital conservation and the associated sense of responsibility; and COL assessed the perceived contribution of teamwork to output quality and interpretive depth.
2.3.3. Scales and Analysis
Most closed items used a 5-point Likert scale, ranging from 1 (“strongly disagree”/“not at all”) to 5 (“strongly agree”/“very much”), while one item documented prior experience with point clouds through ordinal categories. Three open questions invited students to describe the most important learning outcome of the workshop, to give a concrete example of what point clouds, models or VR revealed beyond direct on-site observation, and to formulate advice for the following cohort. Open responses were analysed with a qualitative, thematic coding approach: responses were read repeatedly, segments were assigned descriptive codes, and codes were grouped into recurrent themes related to technical skill acquisition, heritage understanding, digital-preservation awareness and reflective agency. Given the exploratory nature and small size of the dataset, the analysis is restricted to item-level descriptive statistics—counts and percentages for categorical items, and medians with interquartile ranges (IQR) for Likert items, reported separately for each instrument—together with qualitative interpretation; inferential statistics, effect sizes and significance testing are not reported. Respondent-level pairing of the pre- and post-workshop questionnaires was not attempted, because the post-workshop form contained no stable identifier (only a timestamp) and the optional pre-workshop email field was incomplete and non-unique; pairing on timestamps, submission order or names was deliberately avoided. As the two instruments are also non-equivalent and the pre-workshop Likert battery has a smaller effective sample than the post-workshop battery, no paired within-subject test (such as the Wilcoxon signed-rank test) is valid, and the two instruments are reported as independent descriptive snapshots (see Section 3.3 for exact sample sizes and results).
2.3.4. Limitations of the Survey Design
Several limitations should be stated explicitly and borne in mind when reading the questionnaire results. The study relies on a small, single-cohort convenience sample and has no control or comparison group, so observed tendencies cannot be attributed to the workflow with any causal certainty. All outcomes are based on self-report, which is subject to recall effects and to demand characteristics and social-desirability bias, particularly because the questionnaires were administered by the instructors within a course context; students may have reported more favourable perceptions than they held. The questionnaire is a purpose-built instrument that has not undergone formal validation (no assessment of internal consistency, test–retest reliability or construct validity), and the pre- and post-instruments are not fully matched at the item level. Prior exposure to point clouds and VR was heterogeneous across the cohort, and participation was voluntary, which may introduce self-selection bias. Item non-response was also uneven: only seven of the thirteen pre-workshop respondents completed the pre-workshop Likert battery, so those baseline items rest on a very small effective sample () and are reported with corresponding caution. These constraints are consistent with the study’s framing as an exploratory pilot, and they define the boundaries within which the questionnaire evidence should be interpreted.
3. Results
3.1. Technical Results: Sensor Performance and Site-Specific Outcomes
Recent work on 3D point-cloud workflows in cultural heritage shows that the choice of sensors, acquisition configurations and processing methods directly affects the diagnostic value of the resulting datasets [9,10,21]. In this study, the survey pipeline was structured around two complementary terrestrial systems: a Z+F Imager 5010X phase-shift terrestrial laser scanner (TLS) and a GeoSLAM ZEB Horizon handheld/mobile laser scanner (Figure 1). The Z+F Imager 5010X provides high-accuracy range measurements with millimetric precision at medium distances, a full-dome field of view and control over scan resolution and noise through static station planning and instrument parameters [9,21]. The GeoSLAM ZEB Horizon, by contrast, is a lightweight mobile system based on Simultaneous Localisation and Mapping (SLAM), which acquires 3D data continuously along a walking trajectory, trading some geometric precision and registration control for rapid coverage and flexibility in constrained interiors [19,23].
Figure 1.
Architecture heritage analysis and survey pipeline.
From a methodological perspective, this combination aligns with recommendations that advocate multi-sensor setups and explicit attention to scan geometry when documenting complex heritage sites [5,11,24]. At Tioltiur, a wooden church in Cluj county, a double survey was carried out with both the Z+F Imager 5010X and the ZEB Horizon. The static TLS campaign followed a station-based approach: scan positions were selected to minimise occlusions and to capture the full exterior envelope and key interior features, with overlapping fields of view to support robust registration and error analysis, in line with HBIM-oriented workflows for accuracy assessment [1,9]. The mobile ZEB Horizon survey complemented this by walking trajectories through the exterior, interior, timber roof and adjacent spaces, exploiting its capacity to traverse narrow passages and complex structures that are difficult to cover with static stations [23]. The resulting multi-source point-cloud fusion echoes recent work on deformation and pathology detection in vernacular heritage, where combining static and mobile datasets improves the visibility of small-scale pathologies while maintaining global geometric consistency [24].
For Târgușor wooden church, the Potaissa street façade sequence in Cluj-Napoca and the Calvaria stone church, each site was documented through a single GeoSLAM ZEB Horizon survey. These campaigns followed a continuous-path acquisition strategy, in which operators defined loops and repeated passes to enhance SLAM stability and reduce drift, consistent with mobile-mapping best practices described in recent systematic reviews [19,23]. In these cases, the emphasis was placed on rapid documentation and broad coverage rather than sub-centimetric accuracy, reflecting an educational objective aligned with “as simple as possible – as much as necessary” surveying pedagogy [14]. The resulting point clouds offered sufficient fidelity for geometric understanding, decay observation at the scale of boards, joints and stone blocks, and for use as direct rendering assets in virtual applications, as argued by Lei et al. for heritage visualisation [25]. At the same time, students could compare the smoother but less explicitly controlled geometry of the mobile scans against the more rigidly planned TLS datasets at Tioltiur and Mociu, sharpening their understanding of how acquisition strategy influences deformation reading and defect detection [10,21].
The Mociu former hospital, a brick building with a timber roof structure, was surveyed using a mixed configuration: TLS for the exterior and mobile scanning for the interior and roof. This design responds to the need, highlighted in accuracy and condition-assessment studies, to adapt sensor choice to structural typology and accessibility [9,11,20]. The static TLS exterior provided a high-precision envelope suitable for detecting out-of-plane wall deformations, settlement-related distortions and global verticality deviations, akin to case-study approaches in deformation monitoring of historic buildings [22]. Inside, the mobile scan captured the intricate timber geometry and connections at high density along the operator trajectory, enabling students to visualise and interpret joint misalignments, differential deflections and local damage patterns that would be difficult to acquire with a tripod-based system [24]. The combined dataset mirrored multi-scale workflows in HBIM and digital-twin literature, where precise external references are linked to flexible internal models to support integrated structural, material and decay analysis [8,26].
A similar mixed approach was adopted for Coplean Castle in Cluj county and for the industrial heritage sites in Luduș (former furniture factory on Vânătorilor no. 6 and former hemp factory on 1 Mai no. 34, Mureș county). In these cases, the Z+F Imager 5010X was used to scan exteriors, capturing overall volumetry, façade planes and large-scale deformation indicators—such as bowing of walls, subsidence of cornices or misalignments in window axes—in a form compatible with baseline condition-assessment practices described by Baselga et al. [22]. The GeoSLAM ZEB Horizon was deployed in interiors, including long halls, staircases and machinery spaces, where its mobility allowed rapid acquisition of extensive and cluttered environments, creating dense point clouds that served both for spatial understanding and for initial decay mapping [16,23]. This configuration resonates with integrated 3D survey strategies for underground and industrial heritage, which emphasise combining different acquisition modes to document hidden, complex volumes while retaining a stable external reference frame [5,27].
Comparing the scanning processes and outputs across these sites reveals several technical and interpretive patterns that connect directly to the literature. First, static TLS campaigns (Tioltiur exterior, Mociu exterior, castle and factory exteriors) produced point clouds with higher local accuracy, more controlled noise characteristics and more predictable registration, making them better suited to quantitative deformation analysis and HBIM-grade modelling [1,9,21]. These datasets allowed students to measure deviations from planarity, verticality and alignment using established geometric descriptors, and to relate such deformation fields to structural and pathological hypotheses, as described in recent scientometric surveys of 3D point-cloud applications [10,11]. Second, mobile scans (church interiors, façades and industrial halls) excelled in coverage and operational efficiency, capturing complex spaces in shorter times and with fewer logistical constraints, consistent with systematic reviews that emphasise mobile systems for rapid heritage documentation [19,23]. The trade-off lay in SLAM-related artefacts (drift, loop-closure errors) and local geometric smoothing, which students learned to recognise and to consider when interpreting subtle deformations or crack patterns [24].
Third, the mixed-sensor workflows (Mociu, Coplean Castle, Luduș factories) illustrated in practice the multi-source fusion perspective advanced by Zhang et al. for deformation and pathology detection and by Yang et al. for semantic segmentation and research clustering [11,24]. By registering Z+F and ZEB point clouds to common reference frames, students could overlay precise exterior shells with rich interior volumes and explore how discrepancies between external and internal geometries might signal structural distress, construction tolerances or survey artefacts. This experience echoed digital-twin and disaster-cycle preservation frameworks, where heterogeneous point-cloud datasets are integrated into monitoring and resilience architectures [8,12,28]. Finally, across all sites, the use of point clouds as direct rendering assets—without necessarily meshing or simplifying them—supported immersive visualisation and teaching activities, aligning with recent arguments for using raw survey data in educational applications and for multi-audience access to 3D heritage documentation [13,15,16,17,18,25].
In summary, the dual-sensor pipeline (Z+F Imager 5010X and GeoSLAM ZEB Horizon), the differentiated acquisition strategies per site and the comparative reading of static versus mobile datasets position the present work within contemporary remote-sensing and heritage-science discourse. The workflow operationalises key themes from the literature—accuracy and geometric reliability, multi-source fusion for condition assessment, integration into HBIM and digital-twin frameworks and educational embedding of 3D survey competencies—while providing concrete case studies through which students move from seeing point clouds as mere geometric models to understanding them as high-dimensional evidence for structural and material diagnosis, digital preservation and long-term heritage monitoring [9,10,11,12,18,23]. At Tioltiur, where both instruments were used on the same wooden church, a bounded cross-dataset check was carried out in CloudCompare after the TLS and SLAM point clouds had been brought into a common reference frame. The final registration report gave an RMS of 0.1121 computed on 50,000 points, with a fixed scale factor of 1.0 and a theoretical overlap of 100%. This value should be read as an internal residual for the registered TLS-SLAM pair, not as an independent absolute-accuracy certificate; nevertheless, it provides the quantitative evidence needed to qualify the comparison between the static and mobile datasets (Figure 2 and Figure 3).
Figure 2.
Tioltiur dual-sensor comparison in CloudCompare: (a) registration report for the TLS-SLAM alignment; (b) Z+F surface-density display, r = 0.005; (c) GeoSLAM surface-density display, r = 0.005; and (d) M3C2-PM comparison output used to inspect local cloud-to-cloud differences. The screenshots document the analysis workflow and should be interpreted as internal comparative evidence rather than independent control-survey validation. The same dataset was used for selected condition-assessment examples. Fitted planes on the pronaos walls returned near-vertical dips of about 89 deg. for one wall and 88.88 deg. for the corresponding interior face, while the lateral wall with the entrance returned a dip of 85.24 deg. These values demonstrate how the point cloud can move the reading of deformation from visual impression to measured geometric evidence. A longitudinal section through the church further made the deformation of the roof/vault legible for students and provided a concrete example of the diagnostic use of the survey outputs.
Figure 3.
Quantified diagnostic examples from the Tioltiur point cloud: (a) exterior pronaos wall fitted plane, dip about 89 deg.; (b) interior wall fitted plane, dip 88.88 deg.; (c) lateral wall with entrance, dip 85.24 deg.; and (d) longitudinal section showing roof/vault deformation.
3.2. Transition: From Technical Documentation to Educational Outcomes
The technical results above describe how sensor choice and acquisition strategy shaped the point clouds and the observations that could be drawn from them. These technical decisions were not ends in themselves: within the pilot, each documentation, scanning and survey activity was also a learning situation in which students confronted heritage complexity, instrument limitations and interpretive choices. The following subsection therefore turns from the properties of the datasets to the self-reported experience of the students who produced and interpreted them, using the pre- and post-workshop questionnaires described in Section 2. The two sets of results are complementary: the technical account establishes what the workflow can document, while the educational account describes how participation in that workflow was perceived to affect students’ competence, sensitivity and sense of responsibility. Because the survey evidence is exploratory and self-reported, it is presented descriptively and read alongside, rather than as a validation of, the technical observations. At the Mociu site, the Z+F survey was performed exclusively from the exterior of the building, whereas the GeoSLAM survey also covered the interior spaces and the roof framework (Figure 4, Figure 5, Figure 6 and Figure 7).
Figure 4.
Detailed perspective view of the GeoSLAM point cloud showing the roof framework and internal building structure that were excluded from the comparison with the exterior-only Z+F dataset.
Figure 5.
Top view of the GeoSLAM point cloud after removal of the roof. Interior walls and structural elements captured during the indoor survey remain visible.
Figure 6.
Final registration ICS: 0.69 cm The final registration report gave an RMS of 0.69 cm computed on 50,000 points, with a fixed scale factor of 1.0 and a theoretical overlap of 100%.
Figure 7.
M3c2-PM comparison output. M3c2-PM comparison was used to assess local cloud-to-cloud differences after removing areas not common to both point clouds, as they were not captured by the Z+F scanner.
Therefore, the original point clouds did not represent identical structural components and could not be compared directly. Before registration and point-density assessment, the roof and the interior elements captured only in the GeoSLAM dataset were removed (Figure 5). The resulting datasets thus contained, as closely as possible, only the exterior surfaces common to both surveys. This filtering step was necessary to prevent points belonging to non-corresponding interior and roof surfaces from influencing the registration and density results. Otherwise, differences caused by the unequal spatial coverage could have been incorrectly interpreted as differences in scanner performance and would have introduced substantial, difficult-to-quantify errors (Figure 5, Figure 6 and Figure 7).
3.3. Educational Results: Questionnaire Indicators and Student Perceptions
3.3.1. Samples, Pairing and Analytical Approach
Thirteen students completed the pre-workshop questionnaire and thirteen completed the post-workshop questionnaire ( for each instrument). The pre-workshop instrument recorded complete responses for the demographic and categorical items (Q1–Q4, ), but only seven respondents completed the pre-workshop Likert battery (Q5–Q18); the remaining six left that section blank, so the effective sample for pre-workshop Likert items is . All post-workshop Likert items were complete (), except the conditional VR-impact item Q14, which was answered only by the eight respondents who reported having used VR. Two pre-workshop Likert cells contained double selections and were resolved to the first selected value and flagged; no other imputation was performed (Appendix A).
Respondent-level pairing of the pre- and post-workshop questionnaires was not possible. The post-workshop form collected no email address, name or other stable identifier (only a submission timestamp), and the optional pre-workshop email field was completed by only nine of thirteen respondents and contained one duplicated address. In line with good practice, we did not attempt to pair records on timestamps, submission order or name guesses. In addition, the two instruments are not equivalent: they contain different constructs and differently worded items (Section 2.3), and the pre-workshop Likert battery has a smaller effective sample () than the post-workshop battery (). For these two independent reasons—absence of a valid linking key and non-equivalent instruments with unequal effective samples—no paired within-subject test (e.g., Wilcoxon signed-rank) is valid, and none is reported. We therefore restrict the analysis to descriptive, item-level statistics: response counts and percentages, and medians with interquartile ranges (IQR) for Likert items, reported separately for each instrument. Open responses are analysed with a transparent thematic coding scheme (below). Because the sample is small, single-cohort and self-reported, all figures are descriptive and should not be read as estimates of a population effect.
3.3.2. Baseline Profile (Pre-Workshop)
The cohort spanned study years 3–6 plus one graduate, with year 6 the most frequent (Figure 8 summarises the categorical baseline). Prior real-project survey experience was polarised: 6 of 13 (46%) reported more than three prior projects, while 6 of 13 (46%) were undertaking their first project. Hands-on exposure to point clouds was limited—eight of 13 (62%) reported none at all, four of 13 (31%) only a brief or demonstration-level experience, and just one of 13 (8%) had worked with them regularly. Virtual-reality experience was lower still, with 10 of 13 (77%) reporting no prior educational or professional VR use. Among the seven respondents who completed the pre-workshop Likert battery, self-rated confidence was mixed: understanding of what a point cloud is had a median of 3 (IQR 2.5–4.0), comfort with 3D software a median of 3 (IQR 3.0–4.0), and knowledge of application examples a lower median of 2 (IQR 1.5–2.5). Perceived relevance was nonetheless high—the expectation that point clouds would be useful in future projects had a median of 4 (IQR 4.0–5.0), and the conviction that digital documentation helps protect heritage a median of 5 (IQR 5.0–5.0). Awareness of the digital-twin concept was the weakest baseline item (median 2, IQR 1.0–2.5).
Figure 8.
Pre-workshop baseline profile (): prior real-project survey experience (Q2), prior point-cloud work (Q3) and prior VR use (Q4). Bars show respondent counts with percentages of the 13 respondents.
3.3.3. Post-Workshop Indicators
Post-workshop self-ratings were high across almost all constructs (Figure 9; medians and IQR by construct in Figure 10). For technical competence (IT3D), understanding of point-cloud principles (Q6) had a median of 5 (IQR 4–5), extracting measurements and sections (Q8) a median of 5 (IQR 4–5), and readiness to use 3D tools in future work (Q9) a median of 5 (IQR 4–5); the ability to contribute to cleaning and registration (Q7) was slightly lower and more dispersed (median 4, IQR 3–5), consistent with these being the more procedurally demanding tasks. For heritage sensitivity (SPV), reading construction systems (Q10) and identifying cultural values (Q11) both had a median of 4 (IQR 4.0–4.0 and 4–5 respectively), while the item on whether 3D data refined the students’ view of Transylvanian heritage (Q12) was more mixed (median 4, IQR 3–5). Digital-archive awareness (AD) was high for understanding digital archiving (Q15, median 4, IQR 4–5), agreeing that the projects contribute to digital conservation (Q17, median 5, IQR 4–5) and feeling responsible for long-term data quality (Q18, median 4, IQR 4–5); understanding of the digital-twin concept (Q16) remained the most dispersed AD item (median 4, IQR 2–4), echoing its low baseline. Collaboration (Q19, COL) was rated highly (median 4, IQR 4–5). The clearest exception was VR: actual VR use (Q13) was low and widely spread (median 3, IQR 1–4; 6 of 13 rated it 1–2), whereas among the eight students who did use VR its perceived impact (Q14) was high (median 5, IQR 3.75–5.0). This pattern indicates uneven access to VR rather than a negative appraisal of it.
Figure 9.
Post-workshop Likert responses by item (self-reported, ). Each bar shows the number of respondents choosing each point of the 1–5 agreement scale; cell labels give counts. Items are grouped by construct (IT3D: Q6–Q9; SPV: Q10–Q12; AD: Q15–Q18; COL: Q19).
Figure 10.
Post-workshop item medians (dots) and interquartile ranges (bars) by construct (; VR-use item Q13 shown, conditional item Q14 excluded). Higher values indicate stronger agreement on the 1–5 scale.
3.3.4. Thematic Analysis of Open Responses
The three open post-workshop questions (Q20 most important takeaway; Q21 a concrete example of what 3D data revealed; Q22 one piece of advice to the next cohort) were coded thematically. Responses were read in the original Romanian, segmented, assigned descriptive codes, and grouped into recurrent themes; a response could receive more than one code. Theme frequencies are shown in Figure 11.
Figure 11.
Thematic coding of the three open-ended post-workshop questions (; responses could receive more than one code). Q20: most important takeaway; Q21: a concrete example of what the point cloud, 3D model or VR revealed; Q22: one piece of advice to the next cohort.
For the most important takeaway (Q20), the dominant theme was the acquisition of point-cloud and 3D technical skill (nine of 13), followed by an appreciation of the value of heritage documentation (four), digital conservation and archiving (three), and the importance of field/site understanding (two). One respondent wrote, in Romanian, “Am dezvoltat de la zero cunoștințe legate de modelarea cu ajutorul norului de puncte” (“I developed from zero my knowledge of point-cloud-based modelling”); another emphasised refinement of practice on irregular fabric: “Am învățat să îmi optimizez și rafinez munca, mai ales în ceea ce privește releveele arhitecturii de patrimoniu care în 98% din cazuri nu prezintă structuri drepte. Acuratețea reprezentării este mult mai mare acum” (“I learned to optimise and refine my work, especially for heritage surveys, which in 98% of cases do not have straight structures. The accuracy of representation is much higher now”). A third linked the technology to conservation: “Am înțeles cum tehnologia de vârf poate salva și conserva trecutul” (“I understood how cutting-edge technology can save and conserve the past”).
For what the 3D data revealed beyond on-site observation (Q21), the most frequent theme was access to inaccessible or high elements such as roof trusses and towers (6 of 13), followed by deformation and geometry—wall inclination, variable thickness (4), decorative or architectural detail (3), and improved perspective or spatial reading (2). Representative examples include: “La Biserica din Tioltiur am reușit să facem releveul șarpantei, deși a fost imposibil să o accesăm” (“At the Tioltiur church we managed to survey the roof truss, even though it was impossible to physically access it”); “Grosimile și deformările pereților, mai ales unde vorbim de 2 structuri diferite și alipite” (“The thicknesses and deformations of the walls, especially where two different adjoining structures meet”); and “Motive ornamentale pictate care nu am văzut la fața locului” (“Painted ornamental motifs that I had not seen on site”). These statements are consistent with the qualitative, observation-level readings of deformation and decay described in the technical results, without implying any measured deformation.
For advice to the next cohort (Q22), the recurring themes were to take systematic on-site photographs (four), to attend site visits and ground-truth the data (three), to learn the digital tools (two) and to scan rigorously and completely (two), with teamwork also mentioned (one). One respondent captured the complementarity of field and digital work: “Neapărat să participe la vizitele pe sit, deoarece acestea permit o înțelegere mai profundă a spațiului, decât operarea pur digitală a norului de puncte” (“They should definitely attend the site visits, because these allow a deeper understanding of the space than working purely digitally with the point cloud”); another stressed acquisition completeness: “Să fie riguroși cu scanarea pe teren, pentru că software-ul nu poate inventa punctele care lipsesc” (“Be rigorous with scanning in the field, because the software cannot invent the points that are missing”). These themes are self-reported reflections from a single small cohort and are reported as such, without generalisation.
3.3.5. Summary of Indicators
Table 1 and Table 2 summarise the pre- and post-workshop indicators. Because the instruments are unmatched and the pre-workshop Likert sample is small (), the two tables are read side by side as independent descriptive snapshots rather than as a paired comparison. Read this way, the baseline snapshot shows limited prior exposure and mixed technical confidence, whereas the post-workshop snapshot shows high self-rated competence, heritage sensitivity, archival awareness and collaboration, with VR access—not VR appraisal—as the main gap.
Table 1.
Pre-workshop indicators ( overall; Likert items Q5–Q18 answered by ). Likert items summarised as median [IQR] on a 1–5 scale (1 = strongly disagree/not at all, 5 = strongly agree/very much); categorical items as counts (%). Descriptive statistics only; not a paired comparison.
Table 2.
Post-workshop indicators (; Q14 conditional, ). Likert items summarised as median [IQR] on the 1–5 scale of Table 1. The pre- and post-instruments are unmatched (Section 2.3), so no paired comparison is implied.
4. Discussion
The results presented above suggest that the educational use of 3D point-cloud workflows in heritage documentation is closely linked to the technical characteristics of the sensors, the logic of the survey pipeline and the interpretive framework through which the data are read. In line with current cultural-heritage remote-sensing research, the study indicates that point clouds acquire value not only through geometric precision, but also through their capacity to support the reading of deformation and decay, model generation and long-term digital preservation [10,12]. The discussion is organised around three interrelated dimensions—sensor complementarity and survey performance, the diagnostic potential of point clouds, and the broader educational implications—and closes by making explicit which stages of the workflow are transferable to other settings. Throughout, the study is treated as an exploratory pilot: the interpretations below are grounded in qualitative observation and self-report, not in validated metrological or statistical evidence.
4.1. Sensor Complementarity and Survey Performance
The results are consistent with the view that the quality and interpretability of heritage point clouds depend on the acquisition system and on how each instrument is matched to the spatial and constructive conditions of the site. In this study, the Z+F Imager 5010X and the GeoSLAM ZEB Horizon were used not as interchangeable tools, but as complementary sensors within a differentiated survey strategy. Static TLS appeared more suitable for exterior envelopes and geometrically legible façades, where station planning, overlap control and stable registration supported point clouds with greater apparent geometric consistency and a more reliable basis for reading deformation. This observation is coherent with studies that highlight the metric control of TLS for HBIM construction, façade analysis and deviation assessment, particularly when scan density and incidence geometry are carefully managed [1,9,21]. By contrast, the ZEB Horizon performed better in confined interiors, roof spaces and long circulation paths, where rapid coverage and operator mobility outweighed the lower geometric control typical of SLAM-based systems [19,23].
The mixed campaigns at Tioltiur, Mociu, Coplean Castle and the Luduș industrial sites suggested that survey value increased when both systems were combined. TLS datasets provided external reference shells, while mobile scans captured interior complexity, timber structures and difficult-to-access zones that would have been inefficient to document with tripod-based acquisition alone. This is consistent with recent multi-source approaches in which complementary point-cloud datasets are combined to improve building comprehension and the interpretation of damage [11,24]; in the present pilot the combination was implemented at the level of the documentation workflow and was not quantitatively validated against control measurements. At the same time, comparison between static and mobile outputs made the trade-off between precision and operational efficiency visible to students. TLS datasets supported clearer readings of apparent out-of-plane deformation, vertical deviation and façade bowing, whereas mobile datasets privileged continuity of spatial coverage over local metric robustness. This distinction is particularly useful for heritage-survey pedagogy, because it shows students that data quality is not an abstract technical property but a consequence of survey-design decisions. The results therefore support a methodological position in which sensor selection is treated as part of the interpretive process rather than as a purely logistical step.
4.2. Point Clouds as Diagnostic and Interpretive Media
A second outcome concerns the role of point clouds not simply as representational products, but as media through which deformation, decay and constructive logic can be interpreted. Across the surveyed sites, students moved from perceiving the scans as visually impressive three-dimensional records towards understanding them as metric datasets capable of supporting architectural reading. This shift matters because the literature increasingly frames point clouds as analytical resources for detecting damage, modelling pathology and informing conservation workflows, rather than as neutral geometric archives [10,20,23]. The present workshops indicate that a similar shift can occur in an educational setting when point-cloud processing is explicitly connected to 2D and 3D survey derivation.
The third phase of the pipeline—plans, sections, elevations and 3D models based on point clouds—was particularly important in this respect. Through the extraction of sections and orthographic views, students began to identify apparent wall inclinations, roof deformations, irregular settlements and discontinuities in wooden or masonry elements. These observations resonate with geometric approaches in the literature that use sections, point-to-primitive comparison and local deviation analysis to characterise structural deformation and material loss [1,9,22]; here, they remained qualitative readings rather than measured quantities. In the mixed-sensor case studies, interior and exterior datasets could also be discussed together, allowing students to consider whether misalignments reflected actual structural behaviour, accumulated construction tolerances or scanning artefacts. This is methodologically important, since recent reviews stress that damage detection from point clouds is meaningful only when geometric anomalies are interpreted critically and in relation to acquisition limitations [11,23].
The findings also support a broader understanding of point clouds as intermediate knowledge objects. They are not yet complete HBIM models, nor are they merely raw scans; instead, they function as evidence platforms from which multiple outputs can be generated—orthographic drawings, geometric measurements, visualisation assets and preliminary semantic models. This position aligns with research that connects point clouds to HBIM, digital twins and direct rendering environments [8,25,26]. In this sense, the educational value of the survey did not reside only in learning how to scan, but in learning how to interpret point-cloud evidence across scales and formats.
4.3. Educational Implications and Digital Heritage Workflows
A third set of results concerns the educational significance of embedding remote-sensing technologies within a structured heritage-survey workflow. The three-phase pipeline—documentation and site visit, scanning and processing, and 2D/3D survey based on point clouds—supported a progressive learning process in which students connected direct observation, instrument operation and interpretive representation. This staged progression appears well suited to architectural education, where the challenge is not only to teach technical acquisition, but also to relate digital outputs to architectural reasoning. Earlier studies on surveying pedagogy argue that students benefit most when complexity is calibrated and when measurement tasks are embedded in meaningful architectural questions rather than presented as isolated technical exercises [14]. The present results are consistent with this view, since the point clouds became more understandable to students once they were linked to recognisable survey products such as plans, sections and decay observations.
At the same time, the workshop indicated that students reported an increased awareness of digital archiving and long-term value. Rather than treating scans as temporary classroom deliverables, many participants described them as durable records that could support future documentation, comparison and dissemination. This perception corresponds to recent work on digital preservation and cultural-heritage resilience, where point clouds are described as foundational datasets within larger infrastructures of recording, archiving and monitoring [10,12,28]. It also aligns with access-oriented studies that promote the reuse of point-cloud-derived content for web sharing, immersive learning and broader public engagement [13,16,25]. In qualitative responses, students framed their scans and models as “evidence” for future work and emphasised the importance of accuracy and completeness to make the data reusable, reinforcing this archival perspective; the digital-archive items were rated highly in the post-workshop questionnaire (e.g., agreeing that the projects contribute to digital conservation, median 5, and feeling responsible for long-term data quality, median 4). Understanding of the digital-twin concept was the most dispersed item at both stages (baseline median 2; post-workshop median 4 with a wide interquartile range), suggesting it remains the least consolidated notion for students. These remain self-reported perceptions from a small, single-cohort sample (), analysed descriptively from unmatched pre/post instruments with no valid paired test, and are reported as such.
From a methodological perspective, the discussion extends beyond educational assessment. The workshop can be read as a small-scale implementation of the broader shift identified in heritage remote sensing: from isolated scans towards integrated, knowledge-oriented and reusable digital workflows [11,19]. By exposing students to mixed-sensor acquisition, registration, point-cloud interpretation and derived survey production, the pipeline reproduced, in pedagogical form, many of the stages that underpin current professional workflows in HBIM and in the development of monitoring and digital-twin systems [8,24,26]. The main contribution of this study is to show that these workflows do not only generate technical outputs; they also appear to reshape how future architects perceive heritage documentation, condition assessment and their own responsibility towards the creation of shared digital-heritage records.
4.4. Transferability of the Workflow
The primary practical contribution of this pilot is a transferable, monitoring-ready baseline and condition-assessment workflow rather than a set of measured results. To make transferability concrete, the workflow can be decomposed into stages, each with defined inputs, safeguards and limits.
Transferable stages. (1) Reconnaissance and documentation: visual inspection, photography and sketching to characterise typology, materials, accessibility and safety, and to prioritise areas of expected deformation and decay. (2) Acquisition planning and dual-sensor capture: matching static TLS to legible exteriors requiring geometric reference shells, and mobile SLAM to confined interiors, roofs and linear sequences, with an explicit choice of single, double or mixed campaigns per site. (3) Registration and organisation: referencing datasets into common frames and producing clean, documented point-cloud blocks. (4) Survey derivation: extracting plans, sections, elevations and preliminary 3D/HBIM assets, and using them for the qualitative reading of condition. (5) Educational and archival framing: pre/post reflection and the treatment of outputs as durable, reusable archive records.
Required inputs. Access to a phase-shift TLS and a SLAM mobile scanner (or comparable instruments), processing software for registration and CAD/HBIM derivation, trained supervision, safe site access, and a documentation protocol for acquisition parameters and metadata.
Safeguards. To transfer responsibly, adopters should: distinguish manufacturer specifications from field performance; record acquisition parameters and registration residuals; retain raw and processed data with provenance metadata; treat single-epoch outputs as baselines rather than as monitoring results; and interpret geometric anomalies critically, in relation to acquisition limitations, before attributing them to structural behaviour.
Limits. The workflow, as demonstrated here, does not establish measured accuracy, does not perform validated multi-sensor fusion, and does not track change over time. Its educational claims rest on a small, unmatched, self-report sample without a control group. Transfer should therefore begin with the documentation and baseline stages, and extend to quantitative monitoring only when control measurements, repeated epochs and validated instruments are added.
4.5. Study Limitations and Future Directions
Several limitations should be considered when interpreting these results. First, the surveyed sites were heterogeneous in typology, scale and state of conservation, which enriched the educational experience but reduced the possibility of a strictly controlled technical comparison between datasets. Second, the study focused on the pedagogical and interpretive outcomes of point-cloud production rather than on a full metrological benchmarking of the two instruments; no independent ground-truth or control measurements were used to quantify TLS or SLAM error, so the comparison between the two systems remains grounded in workflow performance and usability rather than in a statistical error model. This limitation reflects a broader issue identified in the literature, where many heritage applications still rely on context-dependent assessments and where standardised benchmarks for damage-oriented point-cloud evaluation remain limited [11,23]. Third, the educational findings are based on a small, single-cohort, self-report sample without a control group, using an instrument that has not been formally validated and whose pre- and post-forms are not fully matched; the results are therefore descriptive and exploratory, and may be affected by demand characteristics and social-desirability bias. Future work could integrate independent control measurements and reference models to allow a more rigorous quantification of TLS and SLAM error in similar educational contexts, and could strengthen the questionnaire through validation and matched pre/post items.
A further limitation concerns the temporal dimension of the survey. Although the point clouds were discussed in relation to monitoring and digital-twin frameworks, the workshop relied on single-epoch campaigns and therefore could not test temporal change detection; the datasets are best understood as monitoring-ready baselines. Future work could revisit selected sites and compare successive point clouds to evaluate whether the educational pipeline can also support multi-temporal reading of crack evolution, displacement or material loss, as proposed in recent photogrammetry- and digital-twin-based studies [8,24]. In parallel, future research may strengthen the connection between student survey outputs and downstream applications such as HBIM enrichment, semantic segmentation, GIS integration or web-based dissemination, and may add complementary sensors (for example photogrammetry or thermography) to enrich radiometric and condition analysis, thereby aligning educational workflows more closely with the interoperable and reusable data ecosystems increasingly advocated in cultural-heritage remote sensing [10,13,26].
Author Contributions
Conceptualisation, A.E.V. and C.N.; methodology, A.E.V., C.N. and V.P.; formal analysis, A.E.V. and C.N.; investigation, A.E.V. and V.P.; resources, C.N.; data curation, A.E.V.; writing—original draft preparation, A.E.V.; writing—review and editing, A.E.V., C.N. and V.P.; visualisation, A.E.V. and C.N.; supervision, C.N. and V.P.; project administration, A.E.V. and C.N.; funding acquisition, A.E.V., C.N. and V.P. All authors have read and agreed to the published version of the manuscript.
Funding
This work was supported by a grant of the Ministry of Education and Research, CCCDI-UEFISCDI, project number 3CoEx PN-lV-P6-6.1-CoEx-2024-0206, within PNCDI IV.
Institutional Review Board Statement
The study was conducted in accordance with the Declaration of Helsinki. According to the local regulations of the Technical University of Cluj-Napoca and the nature of the research (non-interventional educational study with anonymised questionnaire data), formal ethical approval was not required. No sensitive personal data were collected, and all responses were analysed in aggregated form.
Informed Consent Statement
Informed consent was obtained from all subjects involved in the study. Participation in the workshop questionnaires and interviews was voluntary, and students were informed that their anonymised responses could be used for research and publication purposes.
Data Availability Statement
Aggregated questionnaire data and anonymised point-cloud-derived survey materials are available from the corresponding author on reasonable request. Due to privacy and institutional policy constraints, raw student-level responses and full point-cloud datasets cannot be made openly available.
Acknowledgments
The authors gratefully acknowledge the support of the Technical University of Cluj-Napoca and the CulTech–Centrul de Excelență Digitală pentru Patrimoniul Cultural project. The authors thank the architecture students who participated in the workshop for their engagement and reflective contributions, as well as the staff of the digital technology laboratory for assistance with scanning equipment, VR infrastructure and logistics at the heritage sites.
Conflicts of Interest
The authors declare no conflicts of interest. The funders had no role in the design of the study; in the collection, analyses or interpretation of data; in the writing of the manuscript; or in the decision to publish the results.
Appendix A. Questionnaire Items (Supplementary)
The questionnaires were administered in Romanian via Google Forms. The exact original items are reproduced below, each followed by an English translation in parentheses. Response options for Likert items were a 1–5 agreement scale (1 = “Dezacord total”/strongly disagree or “deloc”/not at all; 5 = “Acord total”/strongly agree or “foarte mult”/very much) unless a categorical set of options is listed. Both instruments were completed by respondents; the pre-workshop Likert battery (Q5–Q18) was completed by (see Section 3.3).
Appendix A.1. Pre-Workshop Questionnaire (Relevé 3D și Patrimoniu—Chestionar PRE Workshop)
Section A1—Profile and prior experience.
- Q1. An de studiu. (Year of study.)—categorical: Year 3/4/5/6/ Graduate.
- Q2. Ai mai participat până acum la proiecte de relevéu pe situri reale (indiferent dacă au fost digitale sau analogice)? (Have you previously taken part in survey projects on real sites, whether digital or analogue?)—No, this is my first project/Yes, once/Yes, 2–3 times/Yes, more than 3 times.
- Q3. Ai mai lucrat până acum cu nori de puncte (vizualizare sau procesare)? (Have you previously worked with point clouds, viewing or processing?)—Not at all/Only a very brief/demo experience/Worked a few times/Worked regularly in other projects.
- Q4. Ai mai folosit VR (realitate virtuală) în context educațional sau profesional (nu doar jocuri)? (Have you used VR in an educational or professional context, not just games?)—Not at all/One experience/A few times/Fairly often.
Section A2—Point clouds and 3D tools (Q5–Q9, Likert).
- Q5. Înțeleg, în linii mari, ce este un nor de puncte și cum este generat. (I broadly understand what a point cloud is and how it is generated.)
- Q6. Știu câteva exemple de situații în care nori de puncte sunt utili în arhitectură sau patrimoniu. (I know a few examples of situations where point clouds are useful in architecture or heritage.)
- Q7. Mă simt confortabil să lucrez cu software 3D (de ex. CAD, modelare 3D, vizualizatoare de nori de puncte). (I feel comfortable working with 3D software, e.g., CAD, 3D modelling, point-cloud viewers.)
- Q8. Mă aștept ca lucrul cu nori de puncte să fie mai degrabă tehnic și dificil. (I expect working with point clouds to be rather technical and difficult.)
- Q9. Mă aștept ca lucrul cu nori de puncte să îmi fie util în proiecte viitoare (atelier, diplomă, profesie). (I expect working with point clouds to be useful in my future projects: studio, diploma, profession.)
Section A3—Heritage and expectations (Q10–Q14, Likert).
- Q10. Mă simt încrezător/încrezătoare în capacitatea mea de a identifica valori culturale (istorice, sociale, simbolice) ale unui sit de patrimoniu. (I feel confident in my ability to identify the cultural values—historical, social, symbolic—of a heritage site.)
- Q11. Până acum, am avut mai multă experiența cu abordări clasice de relevéu (măsurători, schițe, fotografii) decât cu metode digitale avansate. (So far I have had more experience with classical survey approaches—measurements, sketches, photos—than with advanced digital methods.)
- Q12. Mă aștept ca acest workshop să mă ajute să leg mai bine partea tehnică (scanare, 3D) de înțelegerea patrimoniului și a contextului local. (I expect this workshop to help me better connect the technical side—scanning, 3D—with understanding heritage and the local context.)
- Q13. Sunt interesat(ă) în mod special de siturile din Transilvania și de felul în care acestea exprimă identitatea regională. (I am especially interested in Transylvanian sites and how they express regional identity.)
- Q14. Consider că documentarea digitală poate contribui real la protejarea și transmiterea patrimoniului către viitoarele generații. (I consider that digital documentation can genuinely contribute to protecting and transmitting heritage to future generations.)
Section A4—Digital archive and VR (Q15–Q18, Likert).
- Q15. Înțeleg, în linii mari, ce înseamnă arhivă digitală pentru patrimoniu (stocare, organizare, acces pe termen lung). (I broadly understand what a digital archive for heritage means: storage, organisation, long-term access.)
- Q16. Am o idee (chiar dacă vagă) despre conceptul de digital twin pentru o clădire sau un sit. (I have an idea, even if vague, of the digital-twin concept for a building or site.)
- Q17. Mă aștept ca în acest workshop să învăț cum pot contribui responsabil la o arhivă digitală (prin modul în care colectez, denumesc și predau datele). (I expect to learn in this workshop how I can responsibly contribute to a digital archive through how I collect, name and hand over data.)
- Q18. Sunt curios/curioasă să văd cum se pot folosi VR și nori de puncte împreună pentru a înțelege mai bine siturile de patrimoniu. (I am curious to see how VR and point clouds can be used together to better understand heritage sites.)
Section A5—Open questions and logistics.
- Q19. Ce ți-ai dori cel mai mult să înveți sau să clarifici în cadrul unui workshop (tehnic sau legat de patrimoniu)? (What would you most like to learn or clarify in a workshop, technical or heritage-related?)—open.
- Q20. Care este cea mai mare îngrijorare sau dificultate pe care o anticipezi (de ex. partea tehnică, lucrul în echipă, timpul, partea de interpretare)? (What is the biggest concern or difficulty you anticipate, e.g.,the technical side, teamwork, time, interpretation?)—open.
- Q21–Q22. Logistical items on attending a half-day digital-tools demonstration and on receiving related event information (email address). Not analysed.
Appendix A.2. Post-Workshop Questionnaire (Experiențe de Relevéu 3D și Patrimoniu—Chestionar POST Workshop)
- Q1. An de studiu. (Year of study.)—categorical.
- Q2. Pe câte situri de patrimoniu ai lucrat în cadrul acestor proiecte? (On how many heritage sites did you work within these projects?)—categorical.
- Q3. La care dintre relevee/situri ai participat? (poți selecta unul sau mai multe) (Which surveys/sites did you take part in? Select one or more.)—multi-select.
- Q4. Cum îți descrii nivelul general de experiența cu proiectele reale? (How would you describe your overall level of experience with real projects?)—categorical.
- Q5. Înainte de aceste proiecte, câte experiențe concrete aveai cu nori de puncte (vizualizare, procesare, modelare)? (Before these projects, how many concrete experiences did you have with point clouds—viewing, processing, modelling?)—ordinal: 0 (none)/1 (a single short experience)/2–3 experiences/more.
- Q6. În prezent, înțeleg principiile de bază ale norilor de puncte și modul în care sunt obținuți din scanare 3D. (I now understand the basic principles of point clouds and how they are obtained from 3D scanning.)—Likert.
- Q7. Sunt capabil(ă) să contribui la curățarea și registrarea unui nor de puncte. (I am able to contribute to cleaning and registering a point cloud.)—Likert.
- Q8. Pot folosi norii de puncte pentru a extrage măsurători simple și secțiuni relevante. (I can use point clouds to extract simple measurements and relevant sections.)—Likert.
- Q9. Mă simt mai pregătit(ă) să folosesc nori de puncte și instrumente 3D în proiectele mele viitoare. (I feel better prepared to use point clouds and 3D tools in my future projects.)—Likert.
- Q10. Proiectul m-a ajutat să înțeleg mai bine cum sistemele de construcție (lemn, zidărie, piatră etc.) influențează lectura unui sit de patrimoniu. (The project helped me better understand how construction systems—timber, masonry, stone—shape the reading of a heritage site.)—Likert.
- Q11. Pot identifica și descrie câteva valori culturale importante ale sitului/siturilor pe care le-am documentat. (I can identify and describe some important cultural values of the site(s) I documented.)—Likert.
- Q12. Lucrul cu date 3D (nori de puncte, modele) mi-a schimbat sau rafinat modul în care privesc patrimoniul din Transilvania. (Working with 3D data changed or refined how I view Transylvanian heritage.)—Likert.
- Q13. Am folosit sau am experimentat VR în legătură cu aceste situri sau cu alte proiecte de patrimoniu. (I used or experimented with VR in connection with these sites or other heritage projects.)—Likert (1 = not at all, 5 = yes, intensively/repeatedly).
- Q14. Experiența VR (acolo unde a existat) m-a ajutat să înțeleg mai bine spațiul, detaliile și starea de conservare a sitului. (The VR experience, where it existed, helped me better understand the space, details and conservation state of the site.)—Likert, conditional; option “Nu am folosit VR” (I did not use VR) available.
- Q15. Înțeleg în linii mari ce înseamnă arhivare digitală a patrimoniului. (I broadly understand what digital archiving of heritage means.)—Likert.
- Q16. Am o idee clară despre ce înseamnă un “digital twin” al unui sit de patrimoniu. (I have a clear idea of what a digital twin of a heritage site means.)—Likert.
- Q17. Consider că proiectele noastre contribuie la un proces de conservare digitală a siturilor. (I consider that our projects contribute to a process of digital conservation of the sites.)—Likert.
- Q18. M-am simțit responsabil(ă) pentru calitatea și utilitatea pe termen lung a datelor pe care le-am produs, ca parte a unei arhive digitale/digital twin. (I felt responsible for the quality and long-term usefulness of the data I produced, as part of a digital archive/digital twin.)—Likert.
- Q19. Colaborarea în echipă a îmbunătățit atât calitatea tehnică a rezultatelor, cât și înțelegerea patrimoniului. (Team collaboration improved both the technical quality of the results and the understanding of heritage.)—Likert.
- Q20. Care este cel mai important lucru cu care simți că ai rămas în urma acestei experiențe (tehnic sau legat de patrimoniu)? (What is the most important thing you feel you took away from this experience, technical or heritage-related?)—open.
- Q21. Dă un exemplu concret în care norul de puncte, modelul 3D sau experiența VR ți-a arătat ceva despre clădire sau sit pe care nu îl observaseși la fața locului. (Give a concrete example where the point cloud, 3D model or VR showed you something about the building or site that you had not noticed on-site.)—open.
- Q22. Dacă ar fi să dai un singur sfat grupei de anul viitor, care ar fi acesta? (If you had to give a single piece of advice to next year’s group, what would it be?)—open.
References
- Chiabrando, F.; Lo Turco, M.; Rinaudo, F. Modeling the decay in an HBIM starting from 3D point clouds. A followed approach for cultural heritage knowledge. Int. Arch. Photogramm. Remote Sens. Spat. Inf. Sci. 2017, 42, 605–612. [Google Scholar] [CrossRef] [Scilit]
- Crisan, A.; Pepe, M.; Costantino, D.; Herban, S. From 3D Point Cloud to an Intelligent Model Set for Cultural Heritage Conservation. Heritage 2024, 7, 1419–1437. [Google Scholar] [CrossRef] [Scilit]
- Visutsak, P.; Liu, X.; Choothong, C.; Pensiri, F. SIFT-Based Depth Estimation for Accurate 3D Reconstruction in Cultural Heritage Preservation. Appl. Syst. Innov. 2025, 8, 43. [Google Scholar] [CrossRef] [Scilit]
- Gagliolo, S.; Ausonio, E.; Federici, B.; Ferrando, I.; Passoni, D.; Sguerso, D. 3D cultural heritage documentation: A comparison between different photogrammetric software and their products. Int. Arch. Photogramm. Remote Sens. Spat. Inf. Sci. 2018, XLII-2, 347–354. [Google Scholar] [CrossRef] [Scilit]
- D’Agostino, G.; Figuera, M.; Russo, G.; Galizia, M.; Militello, P.M. integrated 3D survey for the documentation and visualization of a rock-cut underground built heritage. Int. Arch. Photogramm. Remote Sens. Spat. Inf. Sci. 2022, XLVI-2/W1-2022, 167–174. [Google Scholar] [CrossRef] [Scilit]
- Selim, G.; Bachagha, N.; Alobaydi, D.; Farhan, S.L.; Tarabeih, A. Integrated Surveying for Architectural Heritage Documentation in Iraq: From LiDAR Scanner to GIS Applications. Remote Sens. 2025, 17, 3632. [Google Scholar] [CrossRef] [Scilit]
- Li, W.; Pan, J.; Hasegawa, K.; Li, L.; Tanaka, S. Missing Region Completion Network for Large-Scale Laser-Scanned Point Clouds: Application to Transparent Visualization of Cultural Heritage. Remote Sens. 2024, 16, 2758. [Google Scholar] [CrossRef] [Scilit]
- Kong, X.; Hucks, R.G. Preserving our heritage: A photogrammetry-based digital twin framework for monitoring deteriorations of historic structures. Autom. Constr. 2023, 152, 104928. [Google Scholar] [CrossRef]
- Moyano, J.; Justo-Estebaranz, Á.; Nieto-Julián, J.E.; Barrera, A.O.; Fernández-Alconchel, M. Evaluation of records using terrestrial laser scanner in architectural heritage for information modeling in HBIM construction: The case study of the La Anunciación church (Seville). J. Build. Eng. 2022, 62, 105190. [Google Scholar] [CrossRef] [Scilit]
- Yang, S.; Xu, S.; Huang, W. 3D Point Cloud for Cultural Heritage: A Scientometric Survey. Remote Sens. 2022, 14, 5542. [Google Scholar] [CrossRef] [Scilit]
- Yang, S.; Hou, M.; Li, S. Three-Dimensional Point Cloud Semantic Segmentation for Cultural Heritage: A Comprehensive Review. Remote Sens. 2023, 15, 548. [Google Scholar] [CrossRef] [Scilit]
- Li, Y.; Du, Y.; Yang, M.; Liang, J.; Bai, H.; Li, R.; Law, A. A review of the tools and techniques used in the digital preservation of architectural heritage within disaster cycles. Herit. Sci. 2023, 11, 199. [Google Scholar] [CrossRef] [Scilit]
- Tommasi, C.; Fiorillo, F.; Jiménez Fernández-Palacios, B.; Achille, C. access and web-sharing of 3D digital documentation of environmental and architectural heritage. Int. Arch. Photogramm. Remote Sens. Spat. Inf. Sci. 2019, XLII-2/W9, 707–714. [Google Scholar] [CrossRef] [Scilit]
- Mayer, I.; Mitterecker, T. Surveying for architectural students: As simple as possible–as much as necessary. Isprs Ann. Photogramm. Remote Sens. Spat. Inf. Sci. 2017, IV-2/W2, 135–141. [Google Scholar] [CrossRef] [Scilit]
- Kowalski, S.; Lebiedź, J.; Parrinello, S.; Picchio, F. New skills for architects: 3D scanning for an immersive experience in architectural education. Glob. J. Eng. Educ. 2024, 26, 115–121. [Google Scholar]
- Brown, C.J.; Yao, S.; Zhang, X.; Brown, C.J.; Caven, J.B.; Krusche, K.U.; Wang, C. Visualizing digital architectural data for heritage education. In Proceedings of the IS&T Conference on Visualization and Data Analysis, Online, 16–19 January 2023. [Google Scholar] [CrossRef] [Scilit]
- Álvarez, M.; Morón, A.; Zaragoza, A.; Ferrández, D.; Morón, C. Transforming architectural education: A teaching innovation approach using laser scanning and bim. In Proceedings of the 19th International Technology, Education and Development Conference, Valencia, Spain, 3–5 March 2025; pp. 5438–5444. [Google Scholar] [CrossRef] [Scilit]
- Jiang, Y.; Liang, X.; Coscia, C. Assessing Digital Tools in Education Process for Cultural Heritage: A Literature Review. Int. Arch. Photogramm. Remote Sens. Spat. Inf. Sci. 2025, XLVIII-M-9-2025, 645–652. [Google Scholar] [CrossRef] [Scilit]
- Chen, F.; Ma, P.; Chen, S.; Hu, Q.; Guo, H. Remote sensing for cultural heritage: A systematic review. Int. J. Appl. Earth Obs. Geoinf. 2026, 146, 105039. [Google Scholar] [CrossRef] [Scilit]
- De Fino, M.; Galantucci, R.A.; Fatiguso, F. Condition Assessment of Heritage Buildings via Photogrammetry: A Scoping Review from the Perspective of Decision Makers. Heritage 2023, 6, 7031–7066. [Google Scholar] [CrossRef] [Scilit]
- Capolupo, A. Accuracy assessment of cultural heritage models extracting 3D point cloud geometric features with RPAS SfM-MVS and TLS techniques. Drones 2021, 5, 145. [Google Scholar] [CrossRef] [Scilit]
- Baselga, S.; Garrigues, P.; Berné, J.; Anquela, A.; Martín, A. Deformation monitoring in historic buildings: A case study. Surv. Rev. 2011, 43, 484–492. [Google Scholar] [CrossRef] [Scilit]
- Sánchez-Aparicio, L.J.; del Blanco-García, F.L.; Mencías-Carrizosa, D.; Villanueva-Llauradó, P.; Aira-Zunzunegui, J.R.; Sanz-Arauz, D.; Pierdicca, R.; Pinilla-Melo, J.; Garcia-Gago, J. Detection of damage in heritage constructions based on 3D point clouds. A systematic review. J. Build. Eng. 2023, 77, 107440. [Google Scholar] [CrossRef] [Scilit]
- Zhang, J.; Zou, S.; Zhang, W.; Tian, H. Deformation and disease detection of Tulou based on multi-source 3D point cloud fusion. Npj Herit. Sci. 2026, 14, 66. [Google Scholar] [CrossRef] [Scilit]
- Lei, Y.; Fiorillo, F.; Fassi, F. 3D survey point cloud data as direct rendering assets for visualising complex heritage in virtual applications. Int. Arch. Photogramm. Remote Sens. Spat. Inf. Sci. 2024, 48, 279–286. [Google Scholar] [CrossRef] [Scilit]
- Cotella, V.A. From 3D point clouds to HBIM: Application of artificial intelligence in cultural heritage. Autom. Constr. 2023, 152, 104936. [Google Scholar] [CrossRef] [Scilit]
- Balzani, M.; Maietti, F.; Raco, F.; Rizzi, D.; Rossato, L. Ipirangadigital: 3D documentation activities for conservation and awareness increasing of cultural heritage in brazil. Int. Arch. Photogramm. Remote Sens. Spat. Inf. Sci. 2023, XLVIII-M-2-2023, 163–169. [Google Scholar] [CrossRef] [Scilit]
- Lee, K.H.; Slattery, O.; Lu, R.; Tang, X.; McCrary, V. The state of the art and practice in digital preservation. J. Res. Natl. Inst. Stand. Technol. 2002, 107, 93. [Google Scholar] [CrossRef] [Scilit] [PubMed]
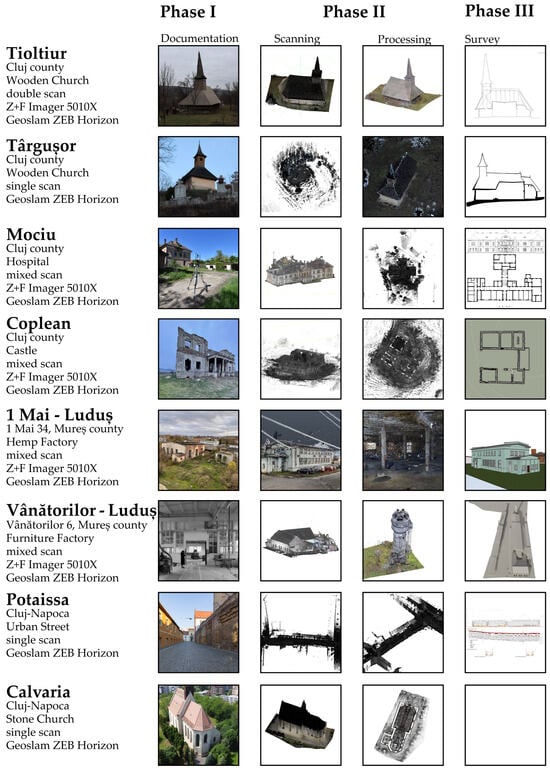
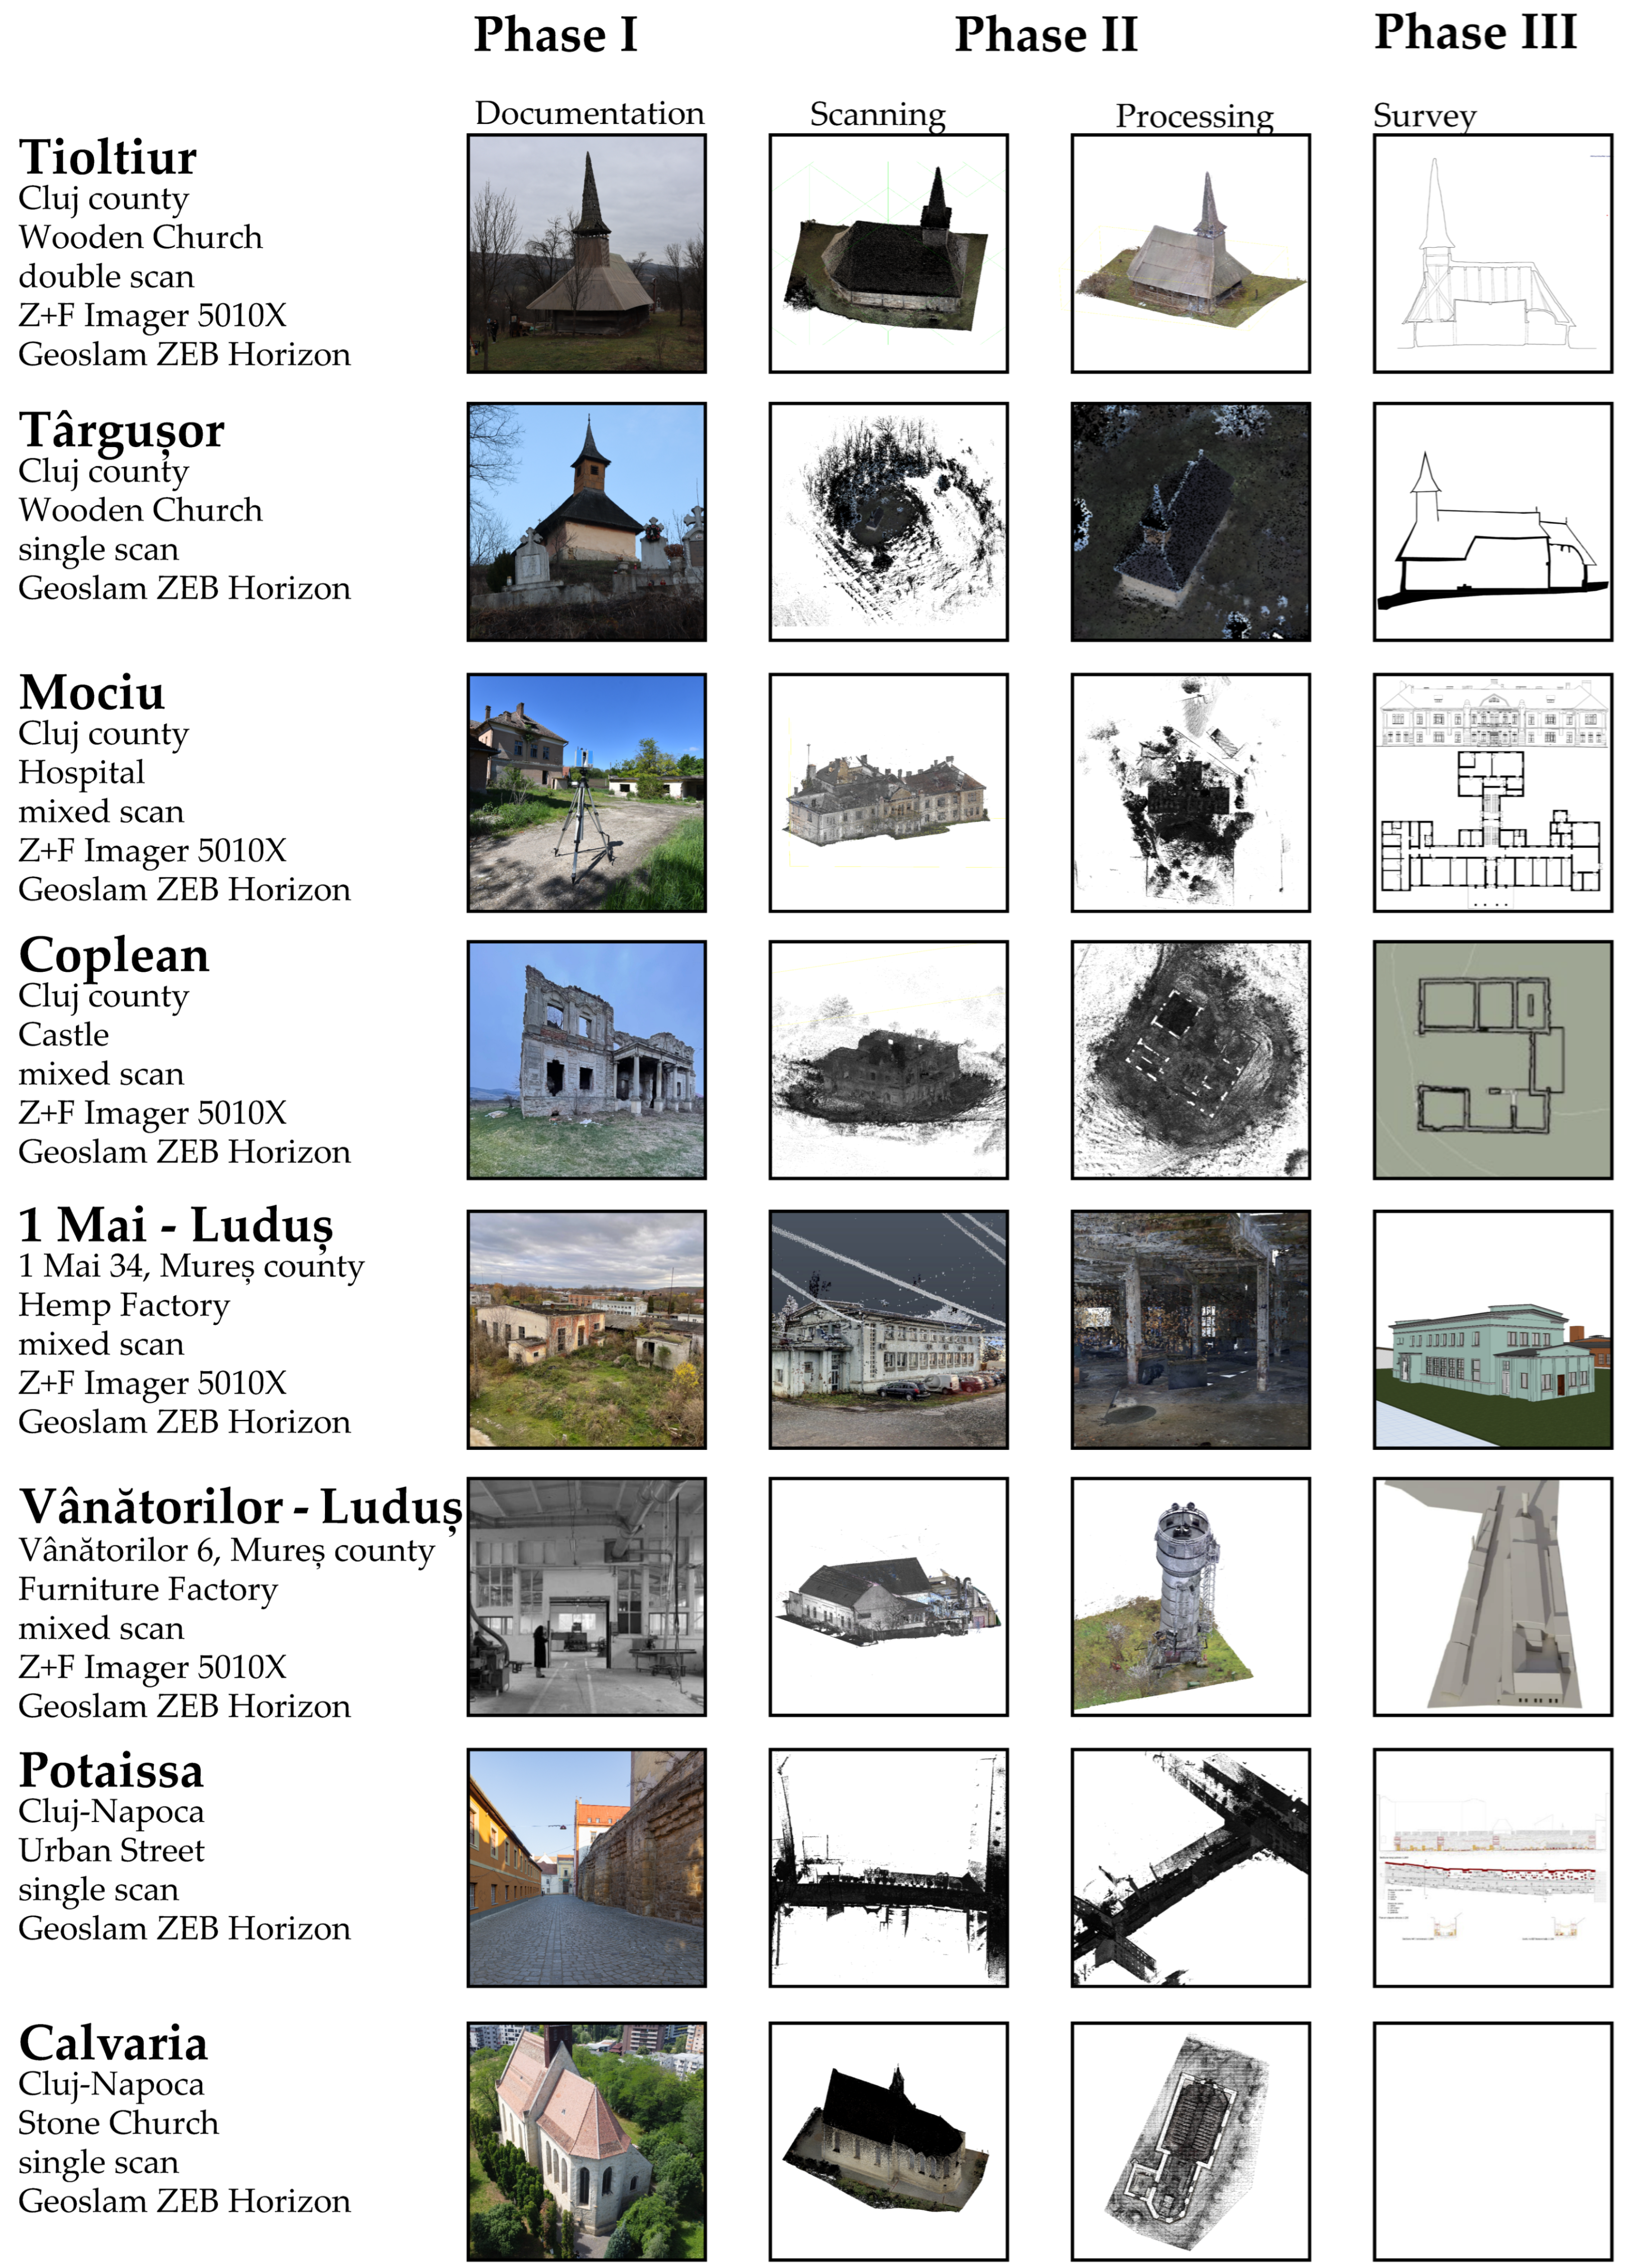
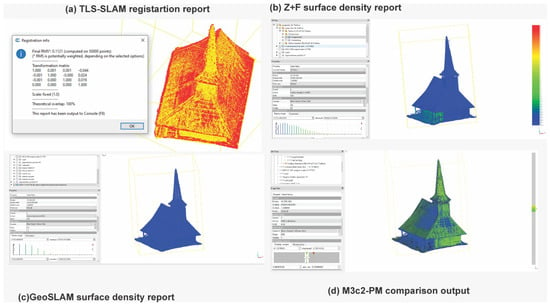
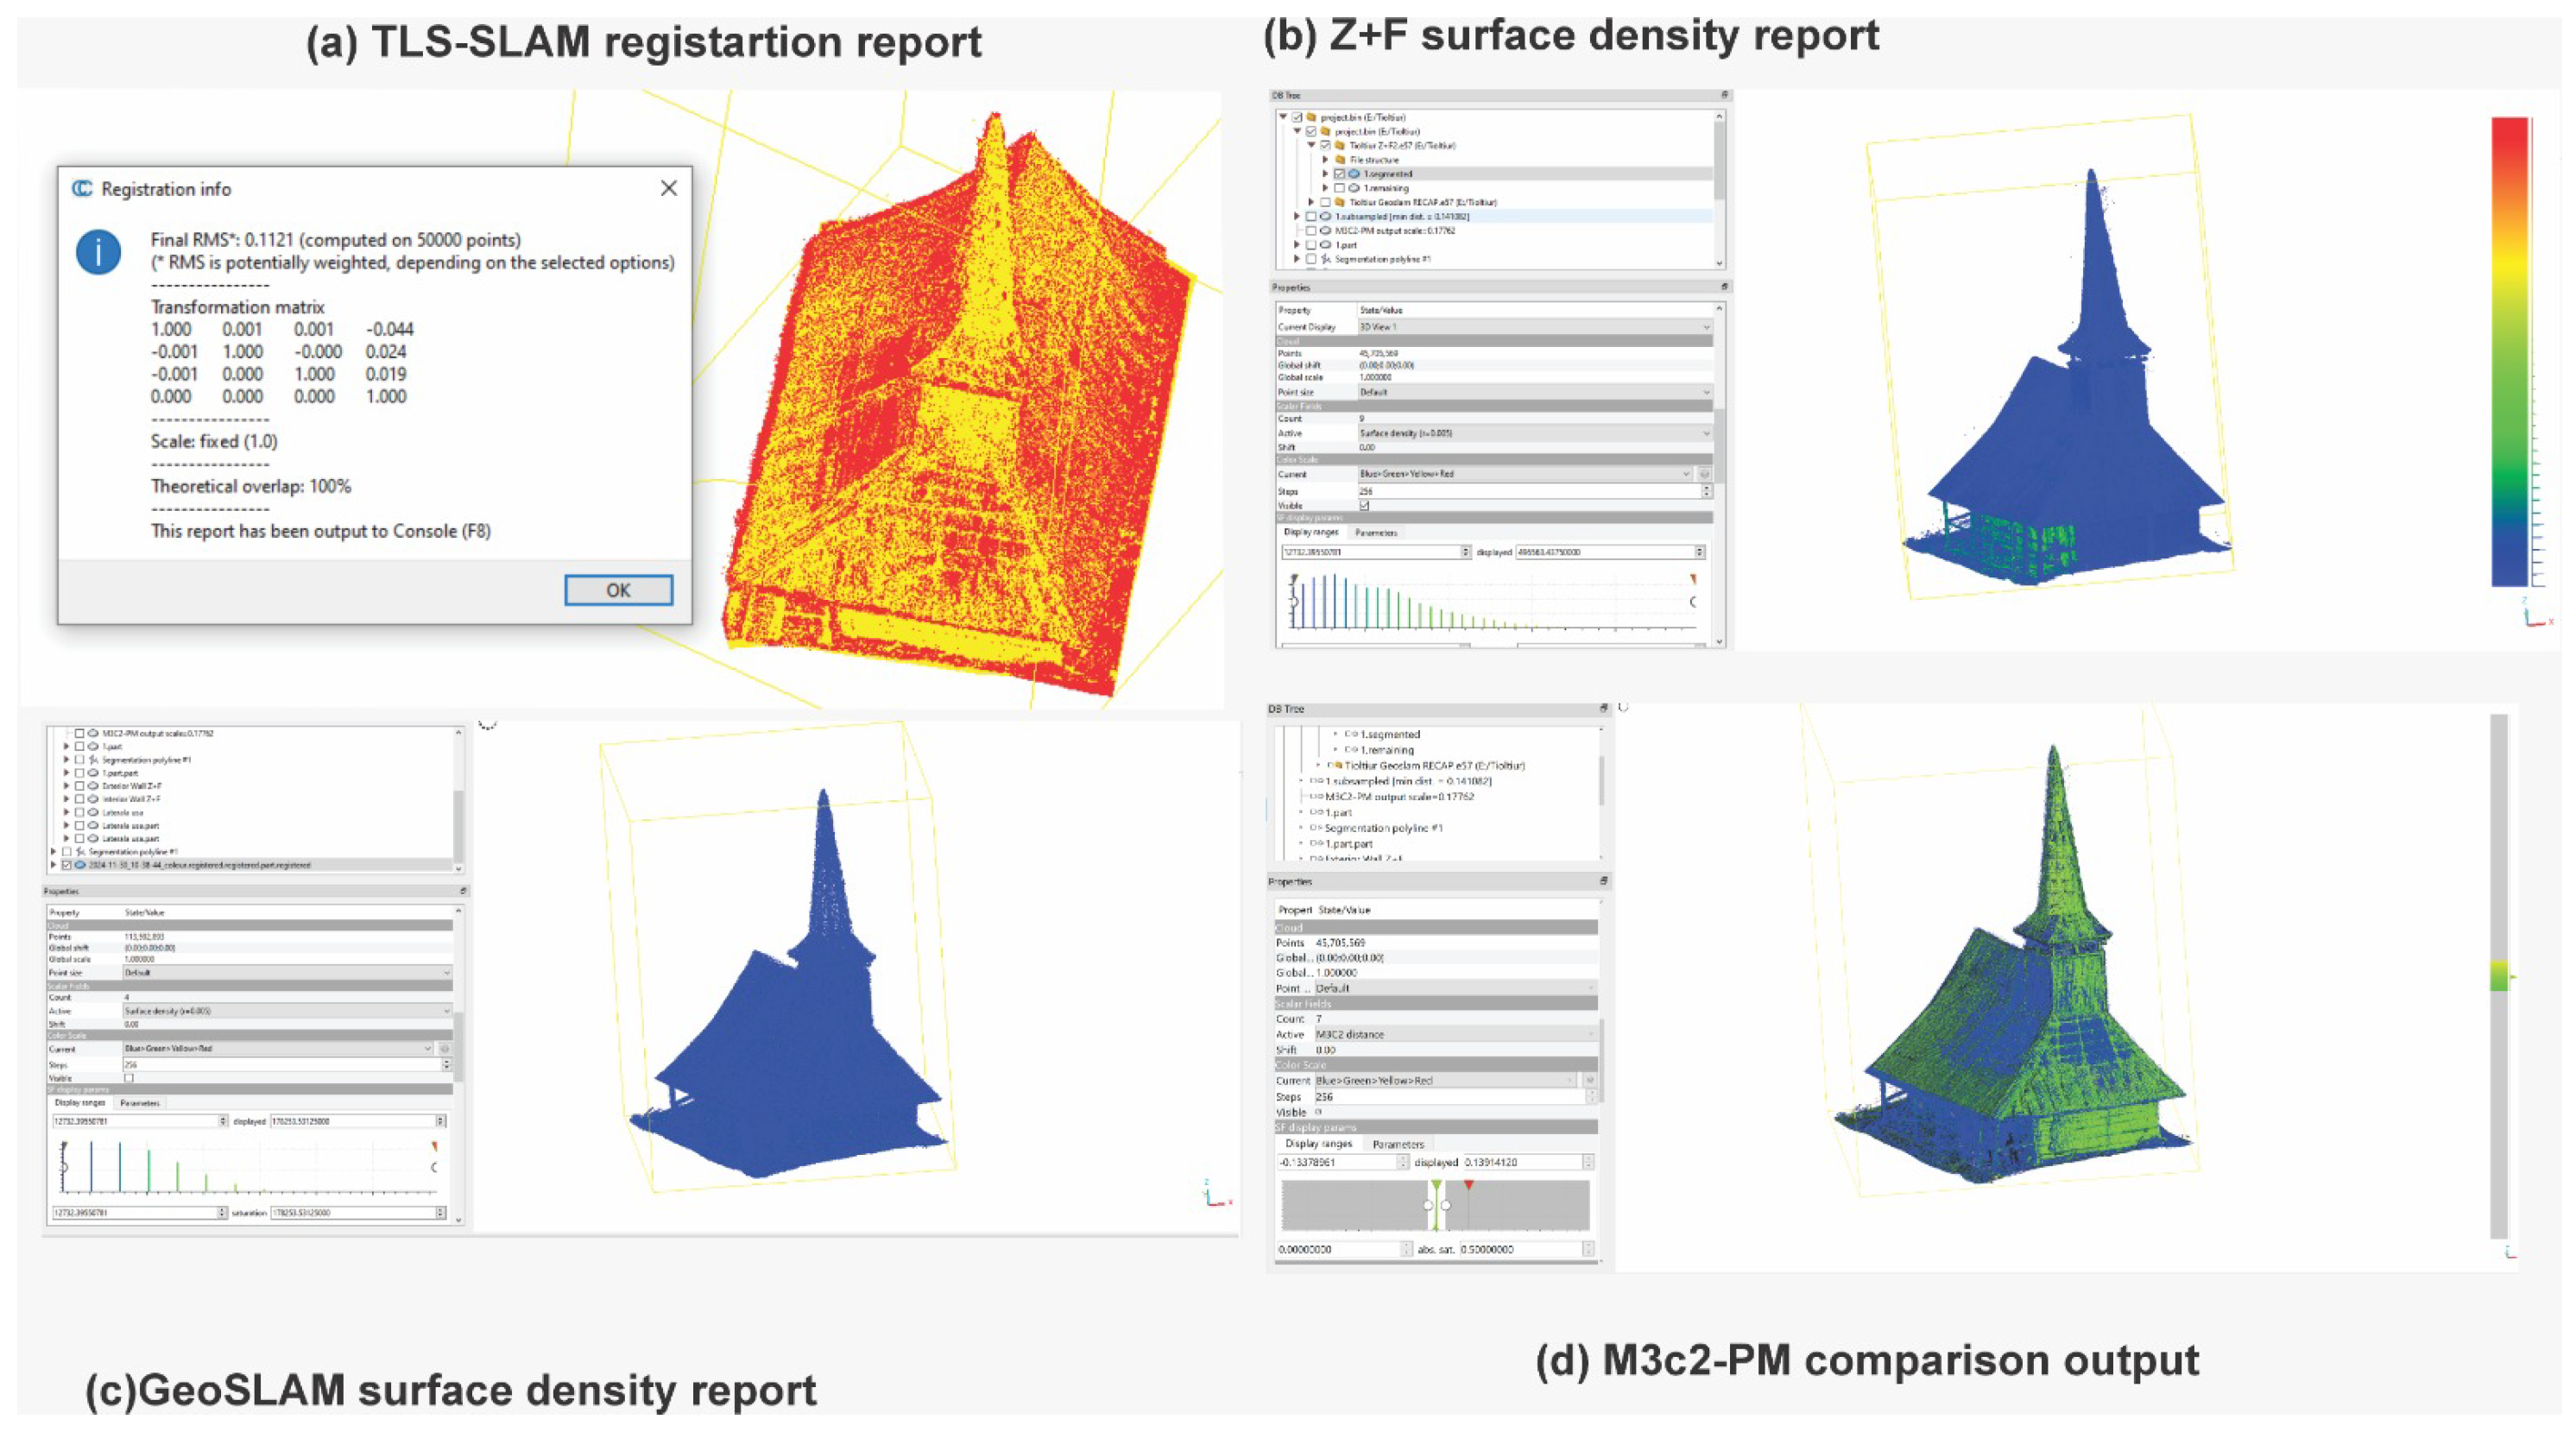
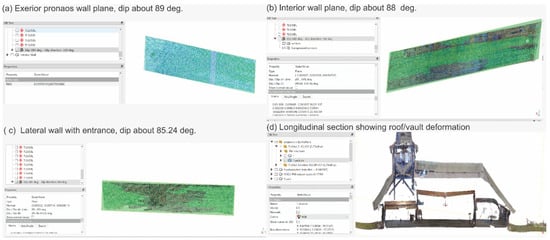
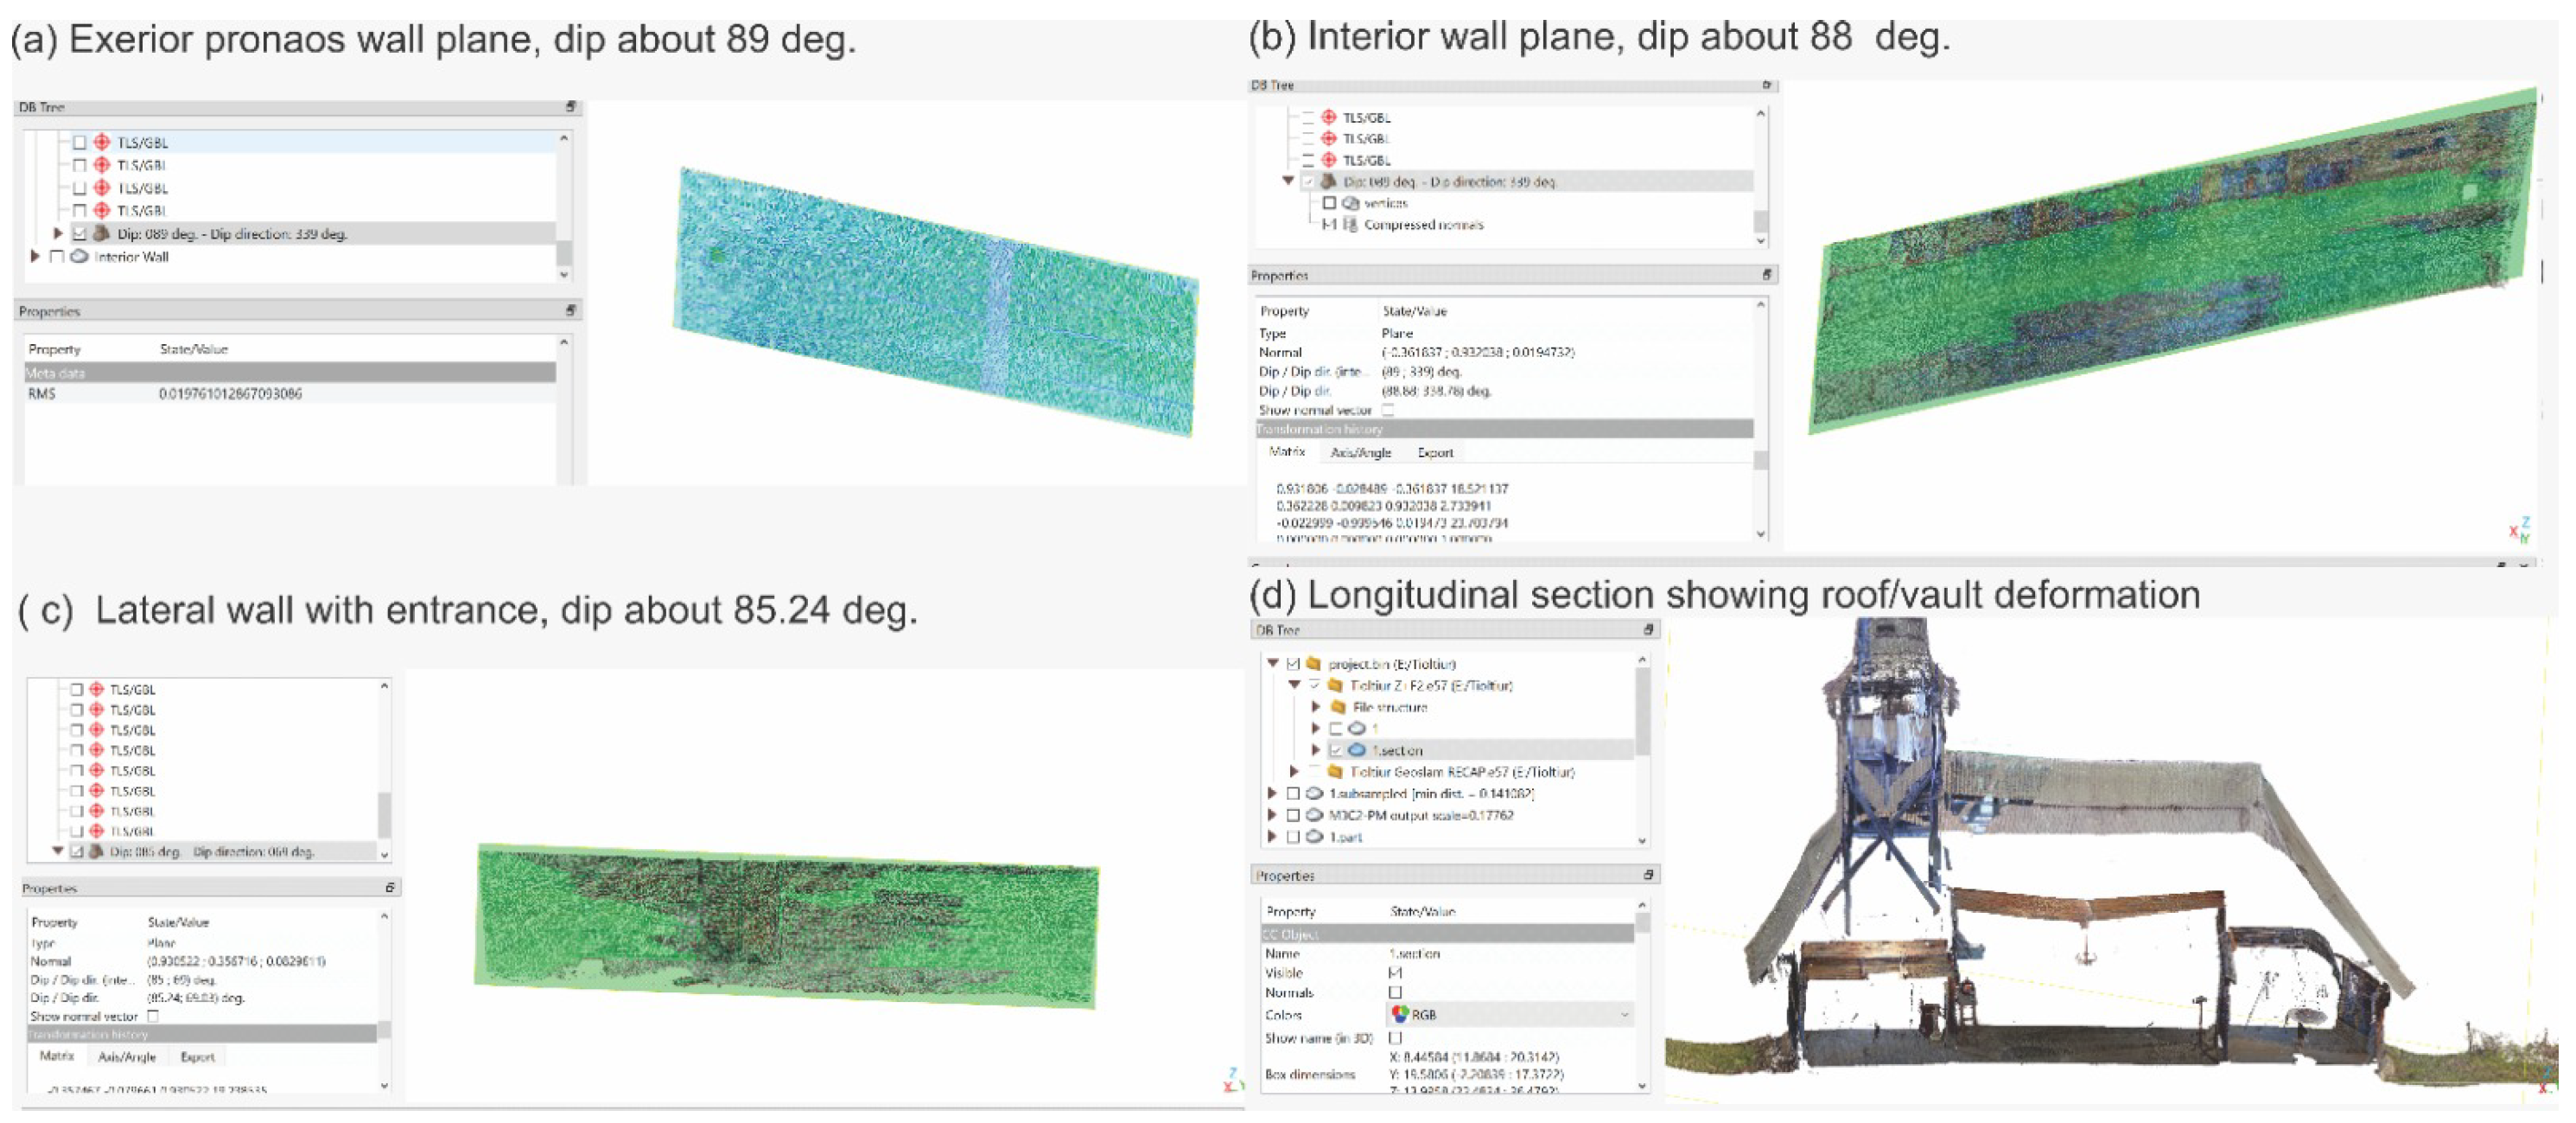
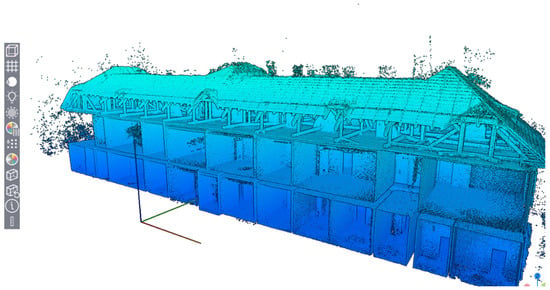
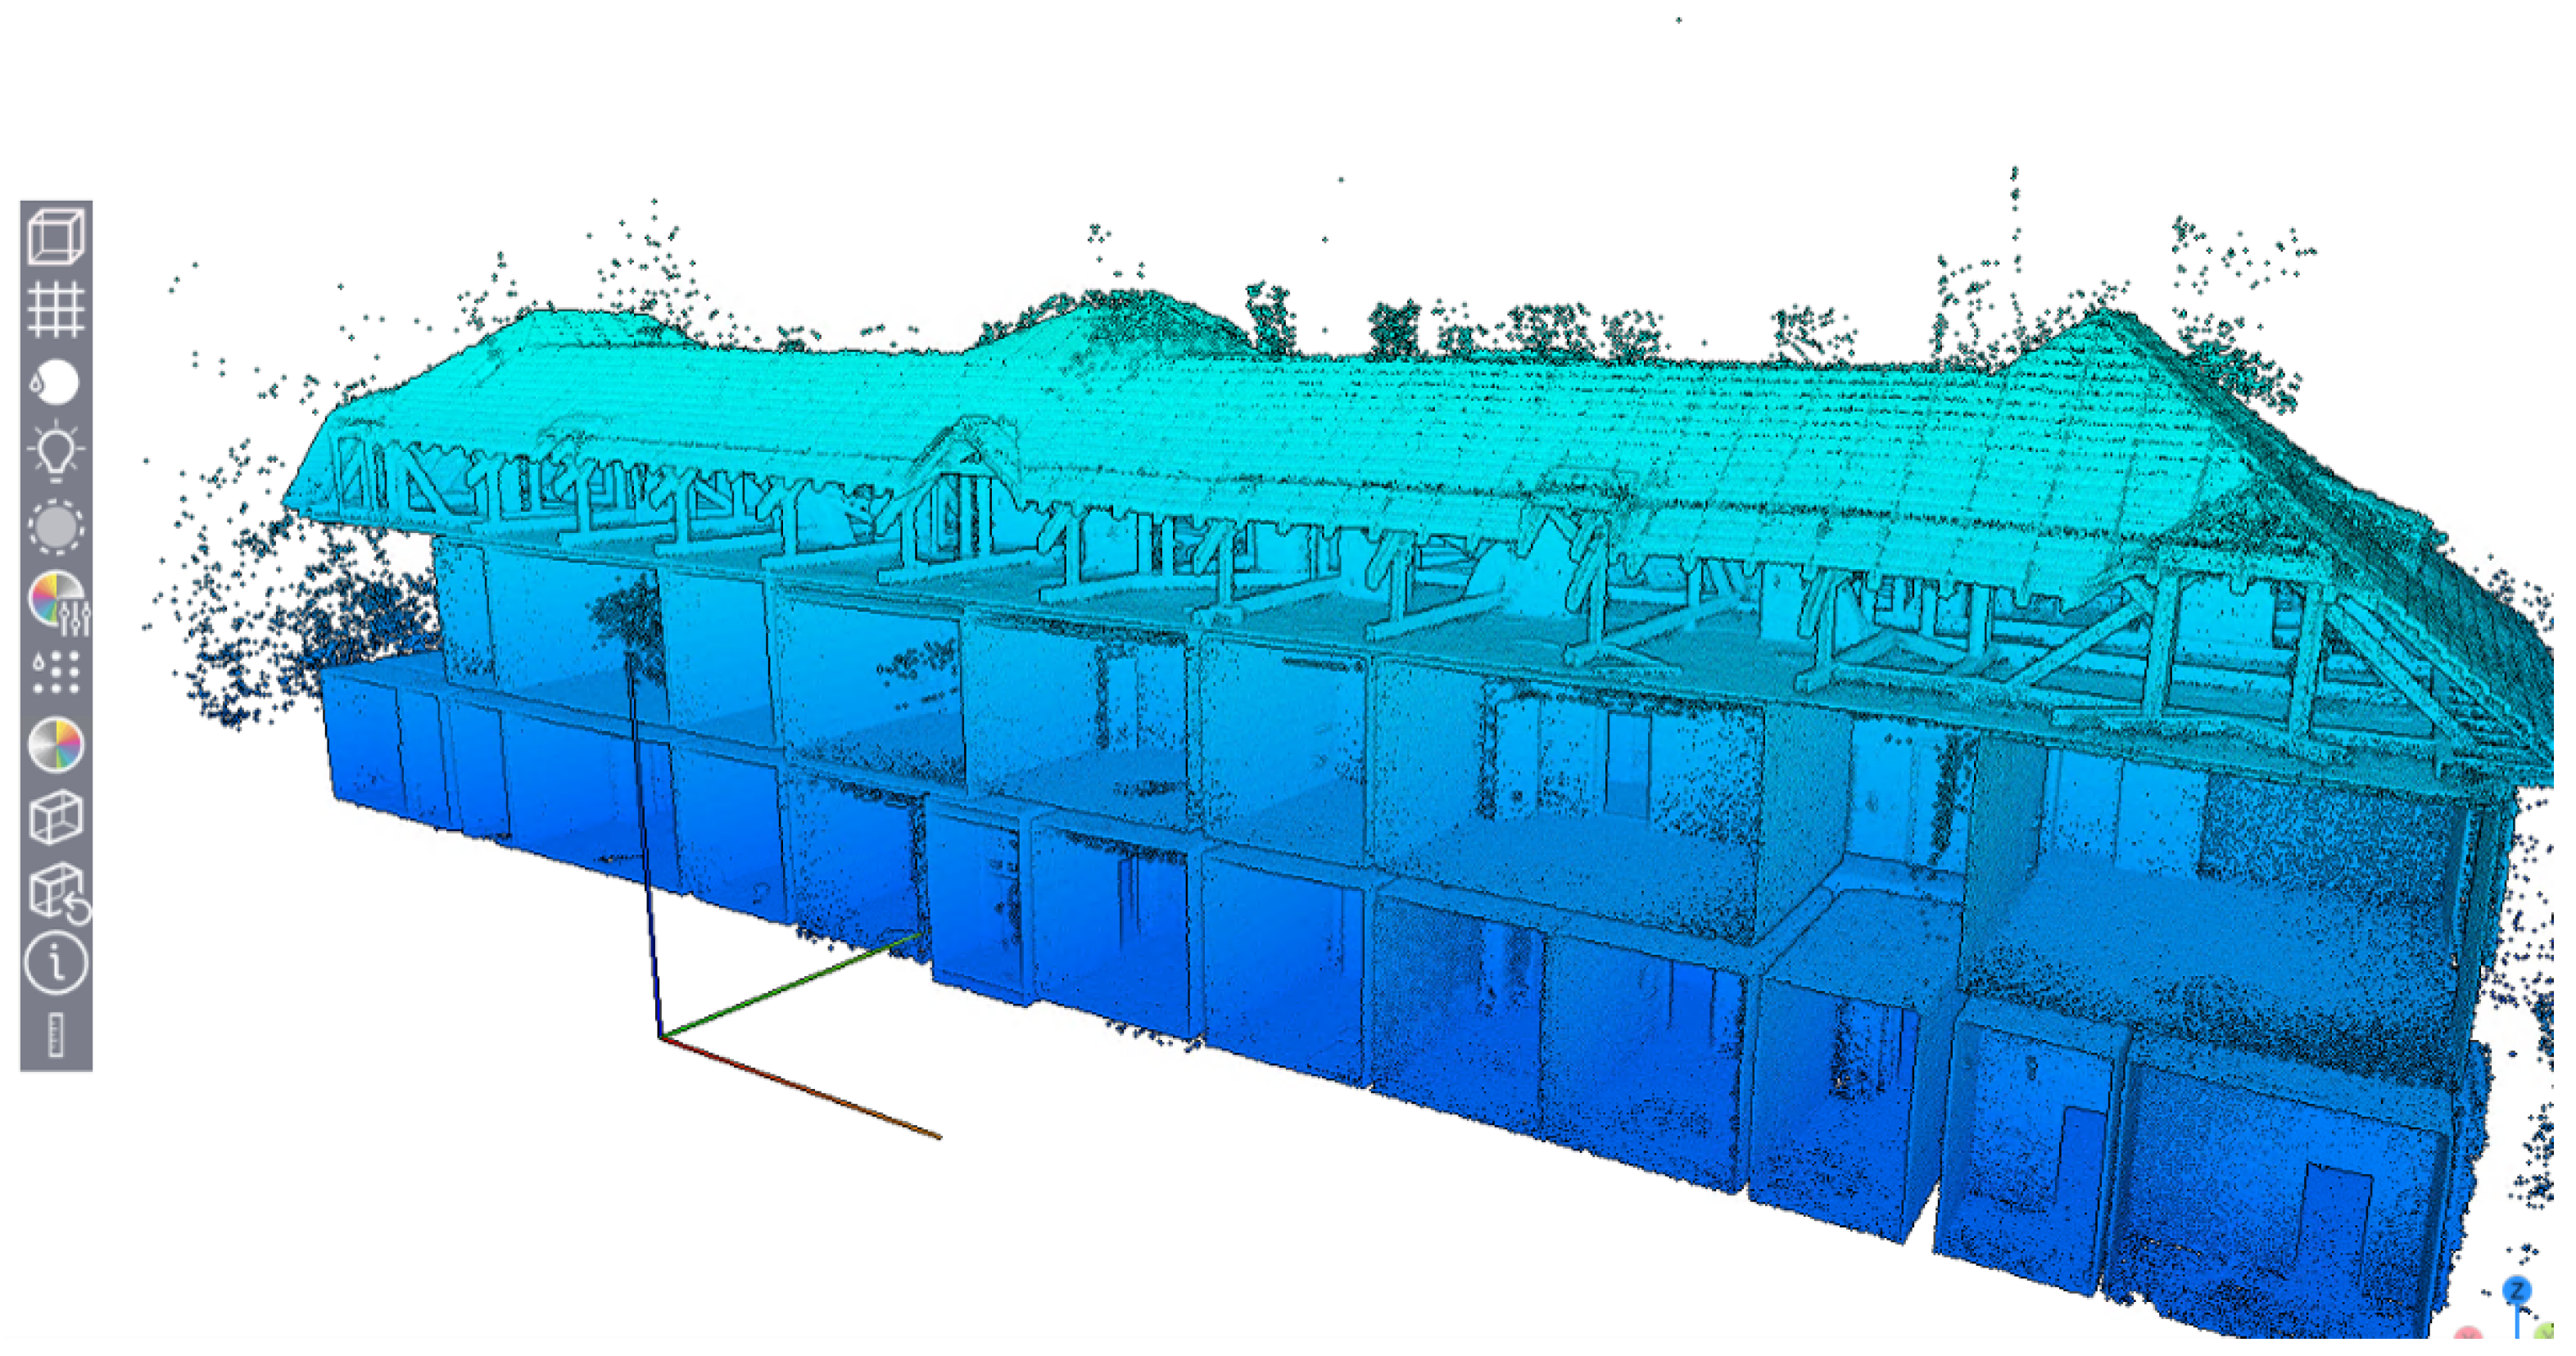
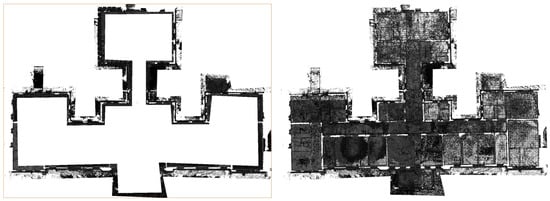
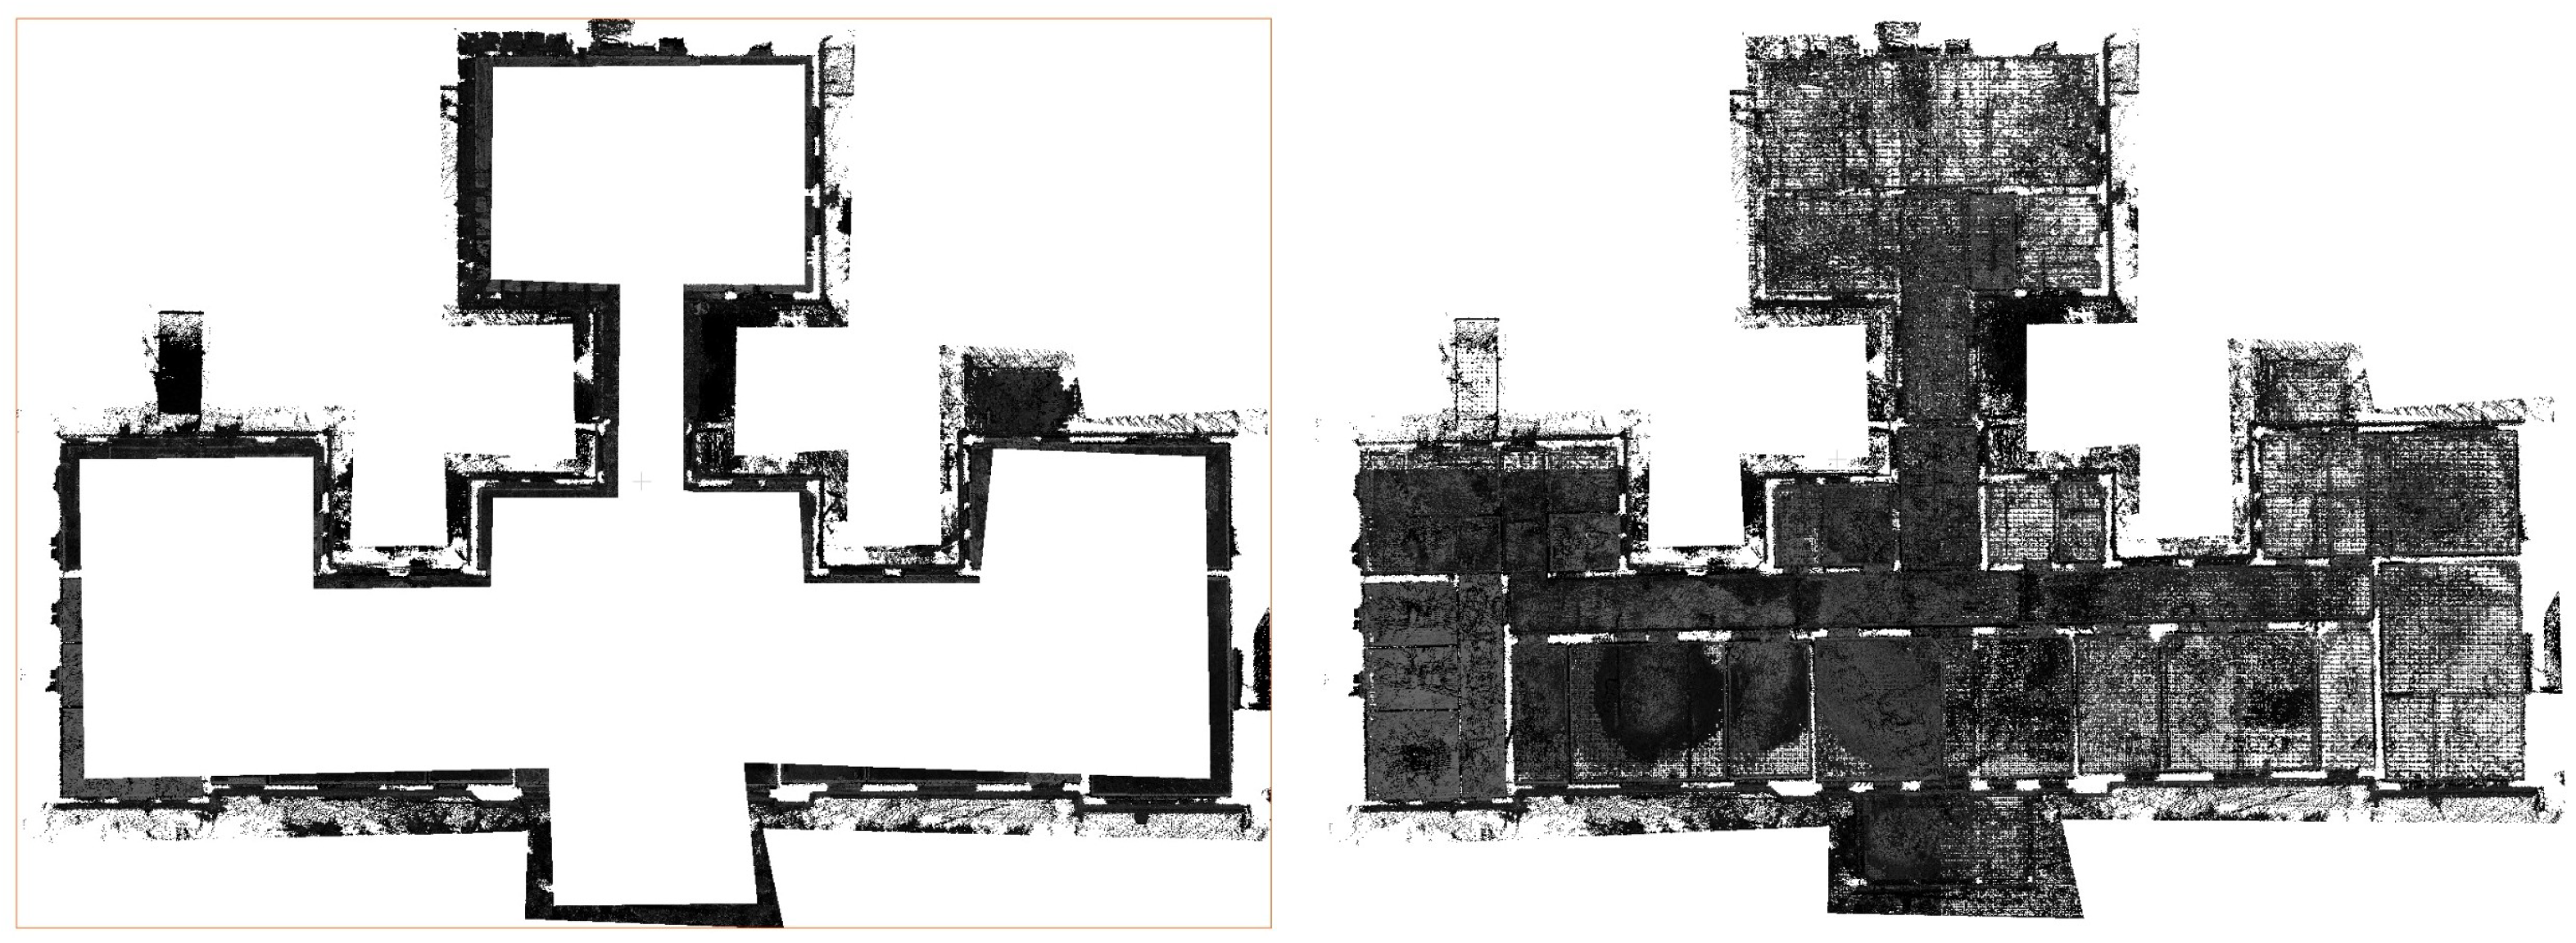
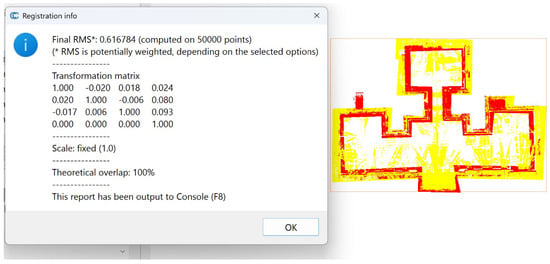
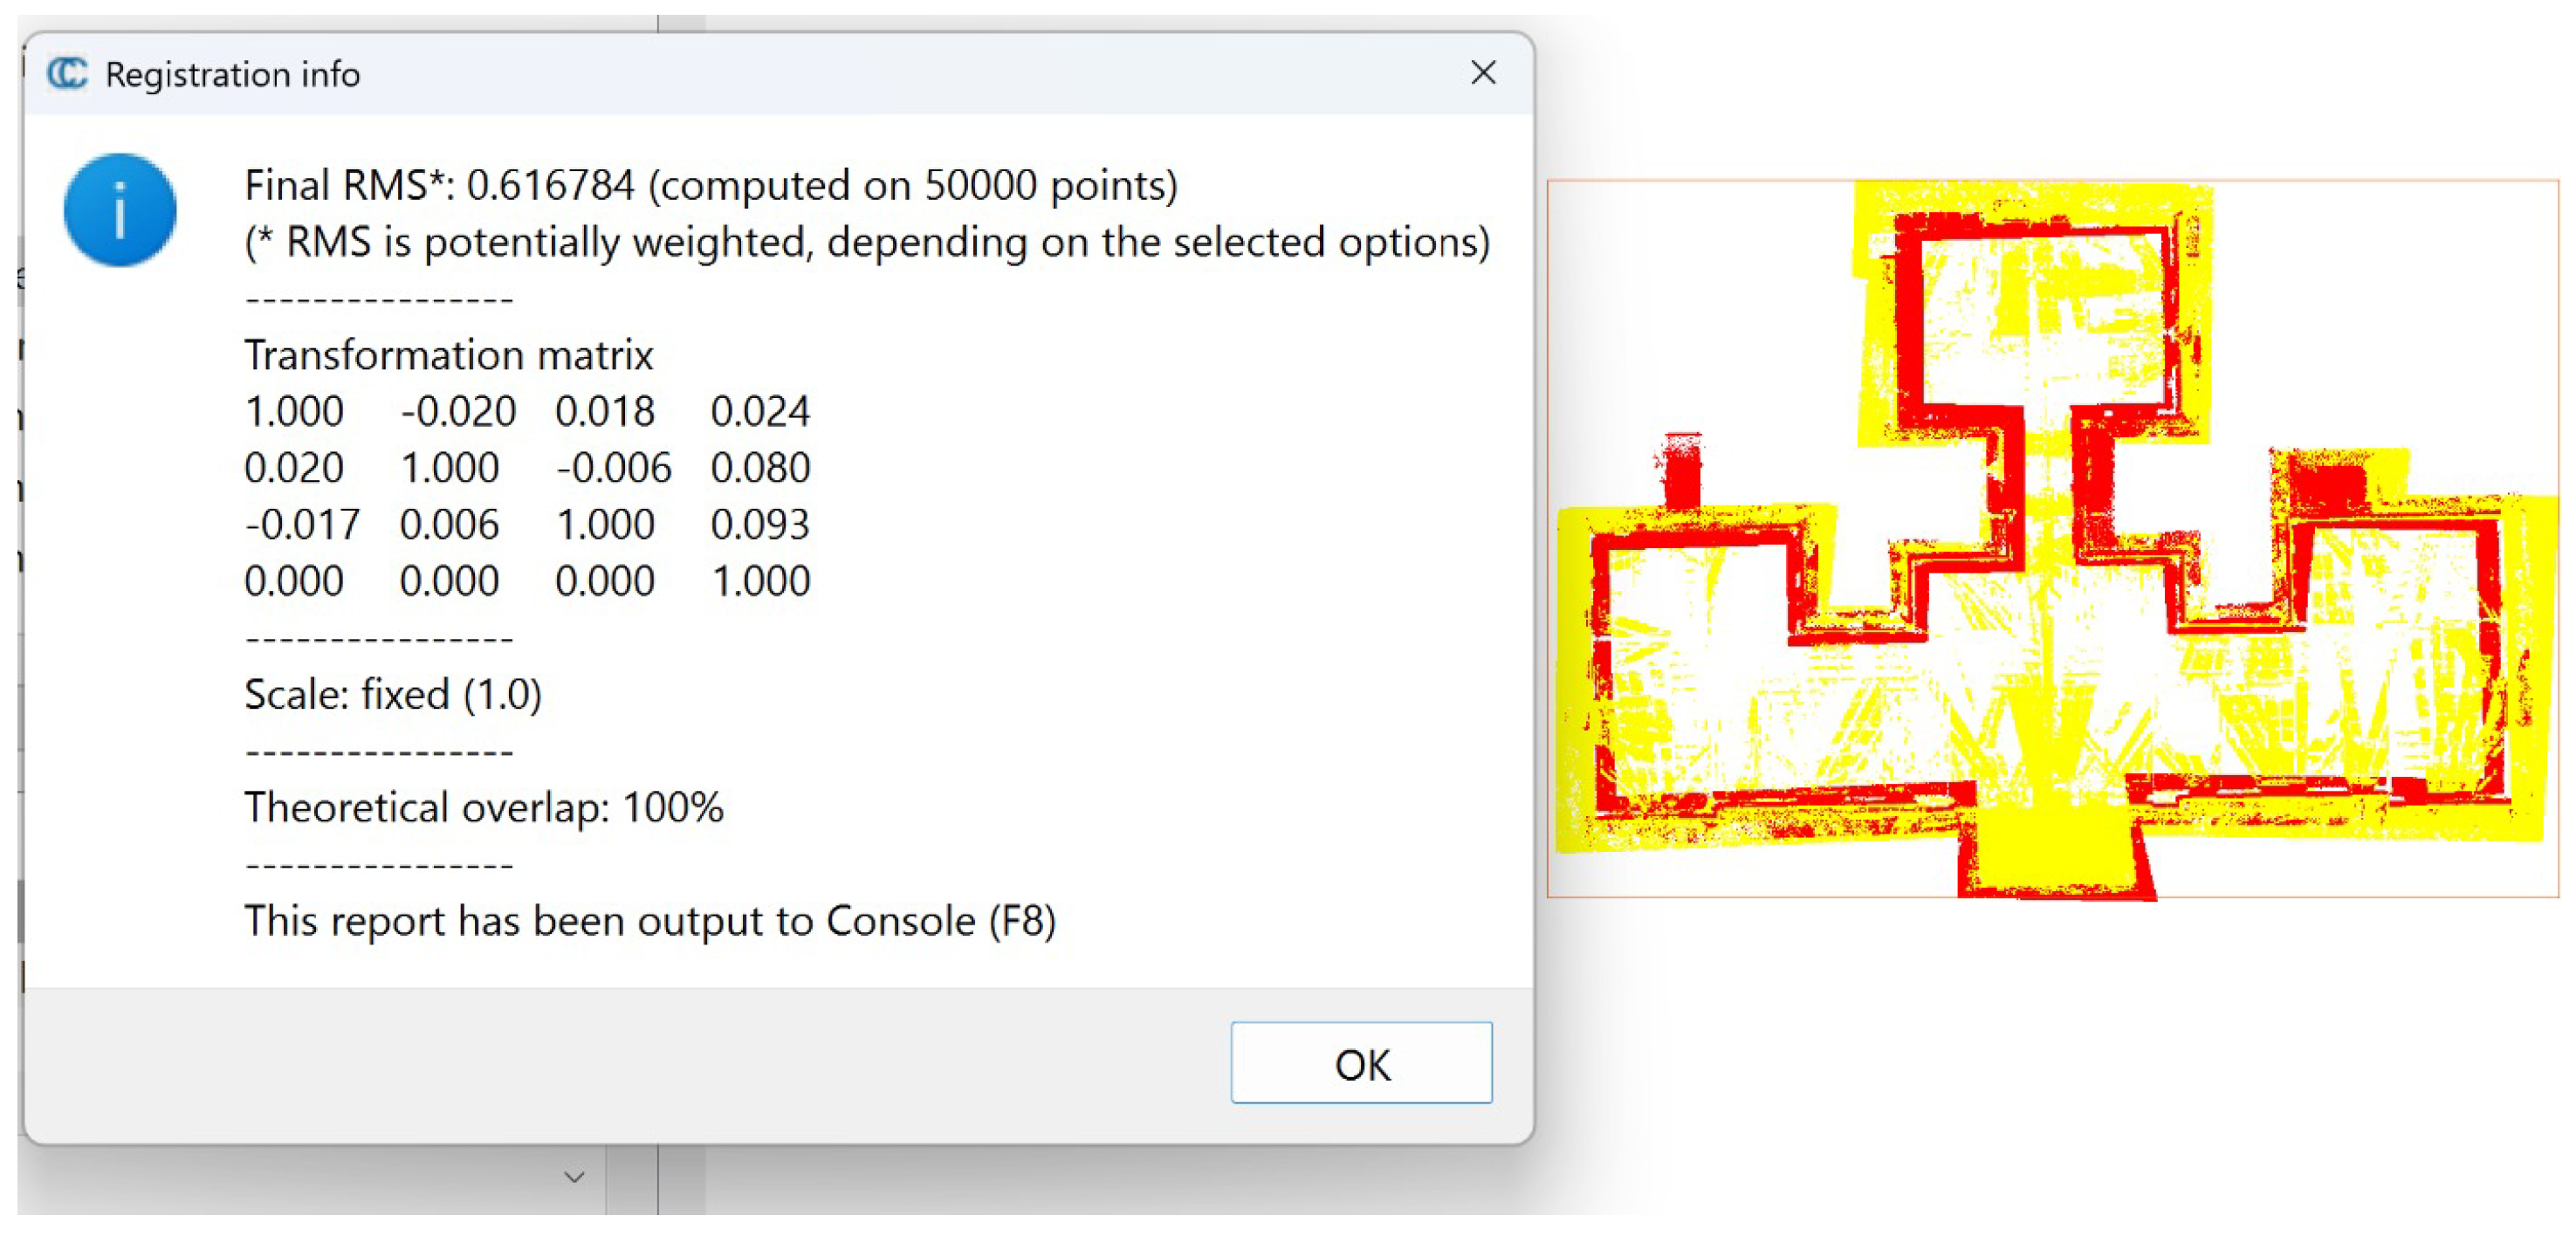
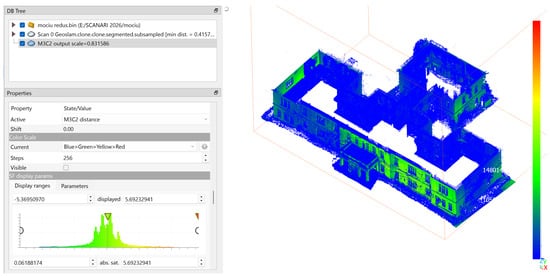
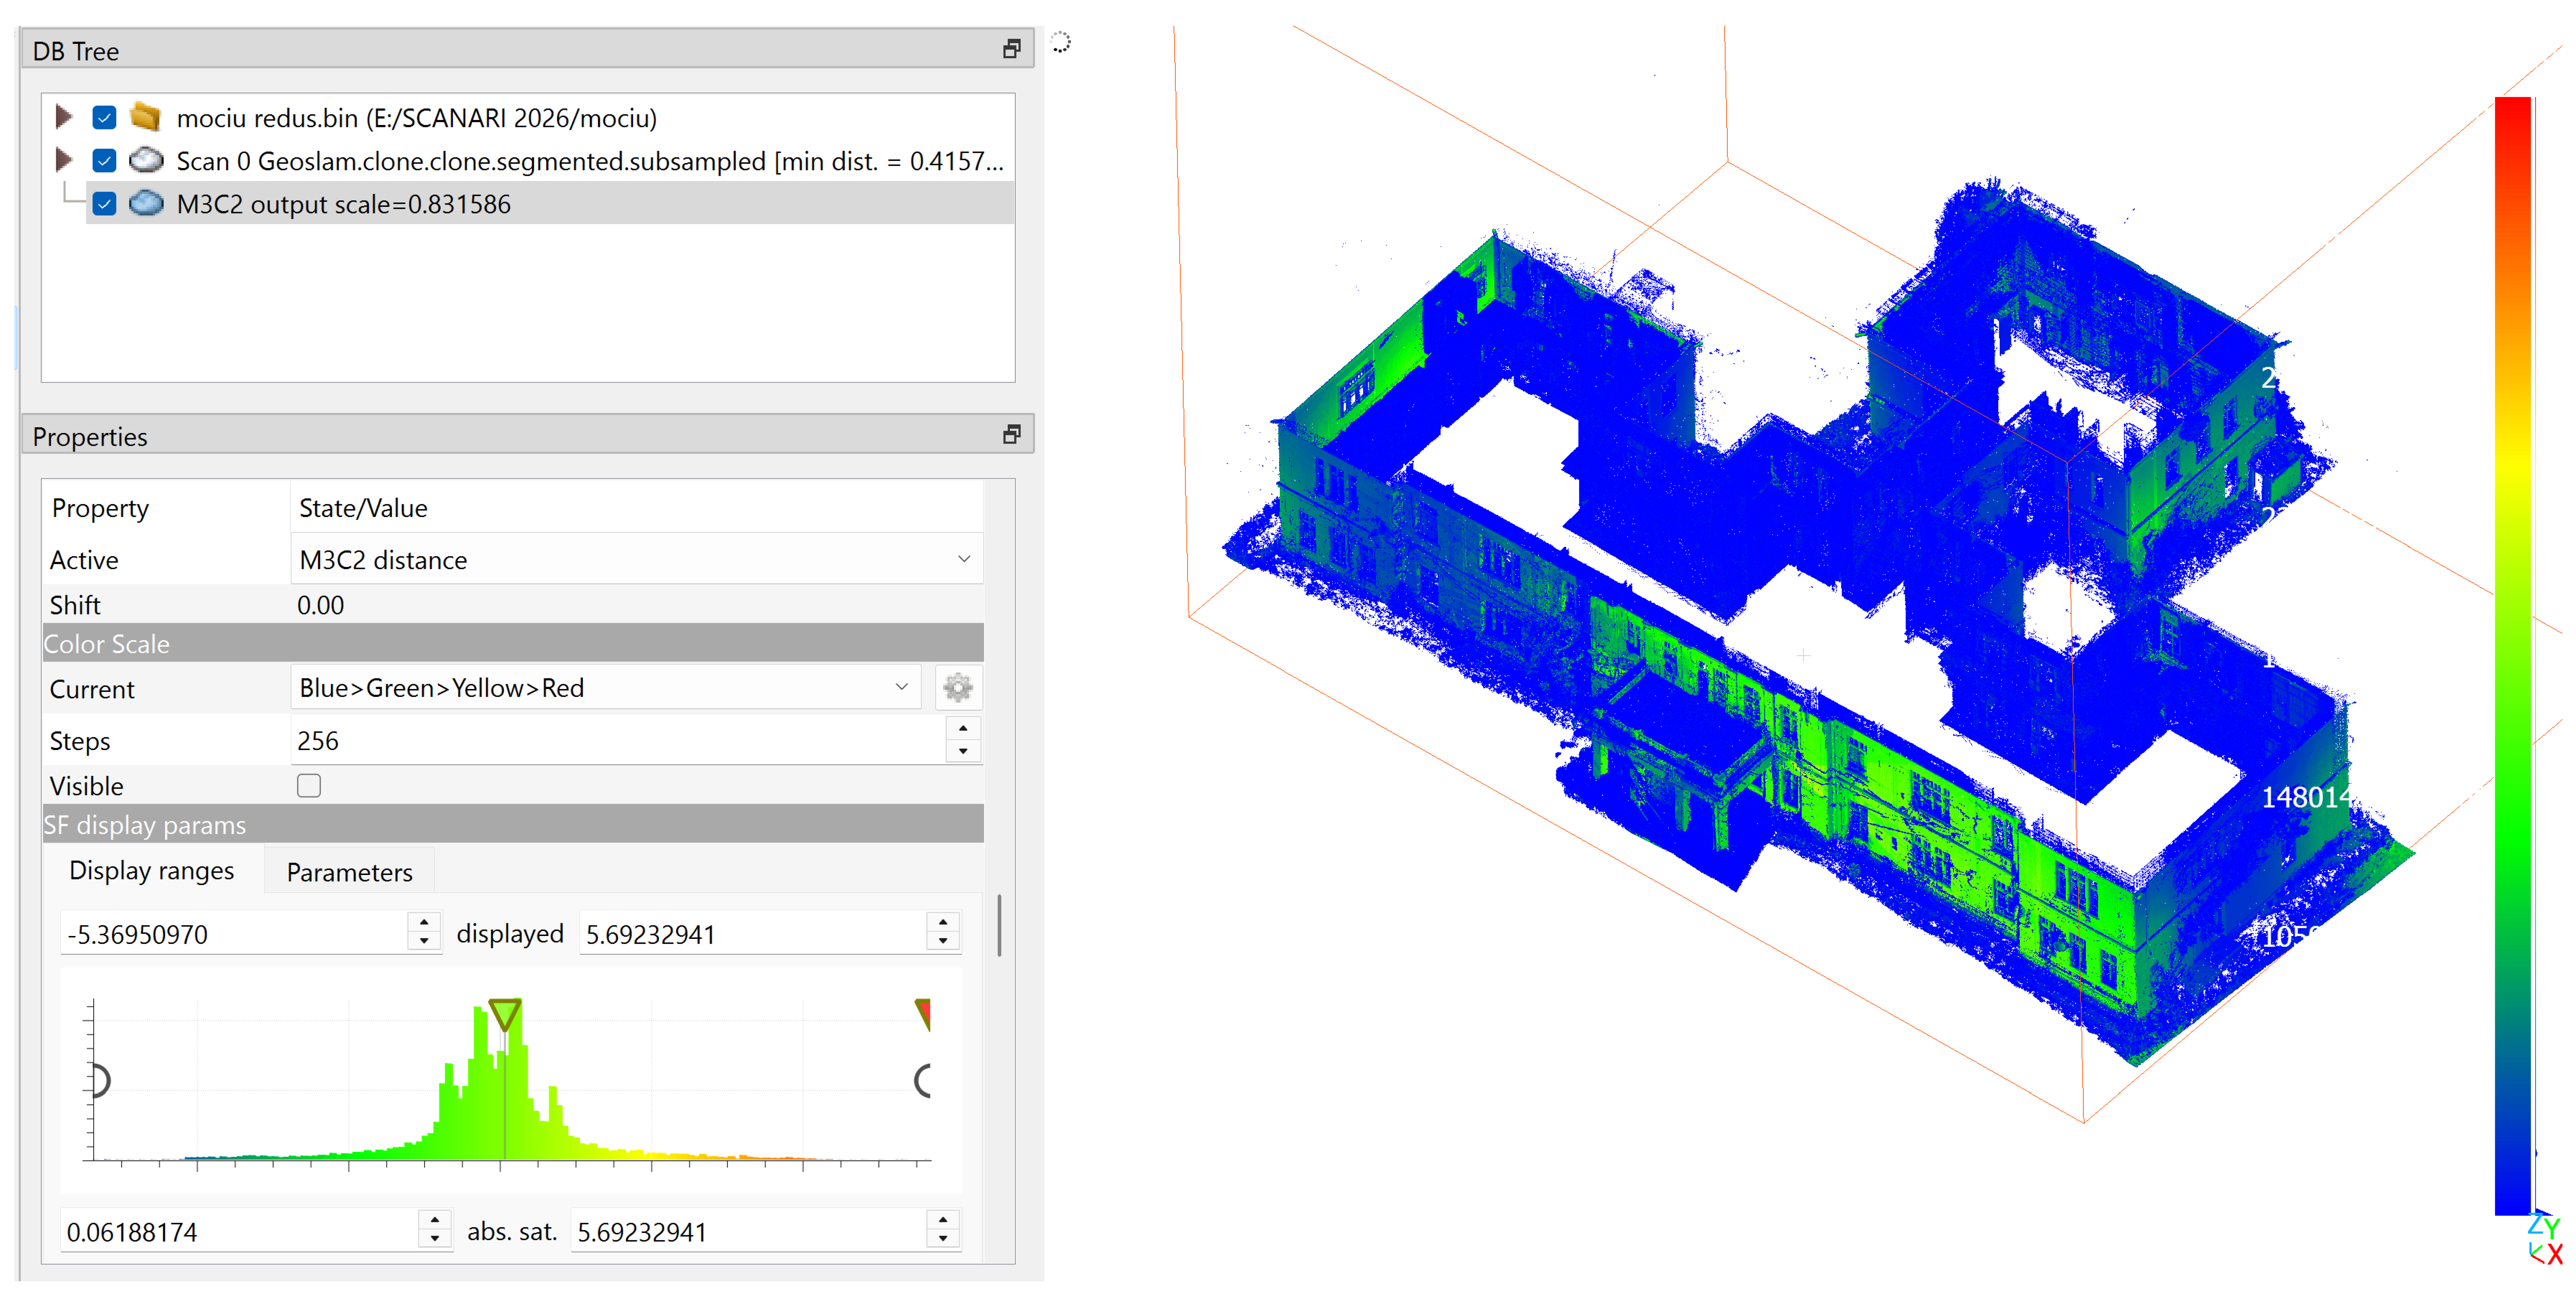
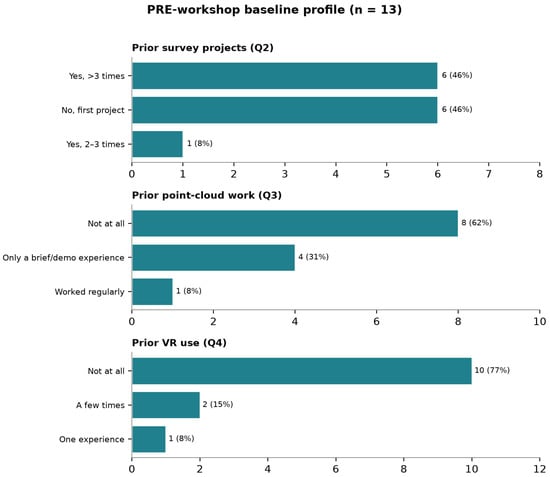
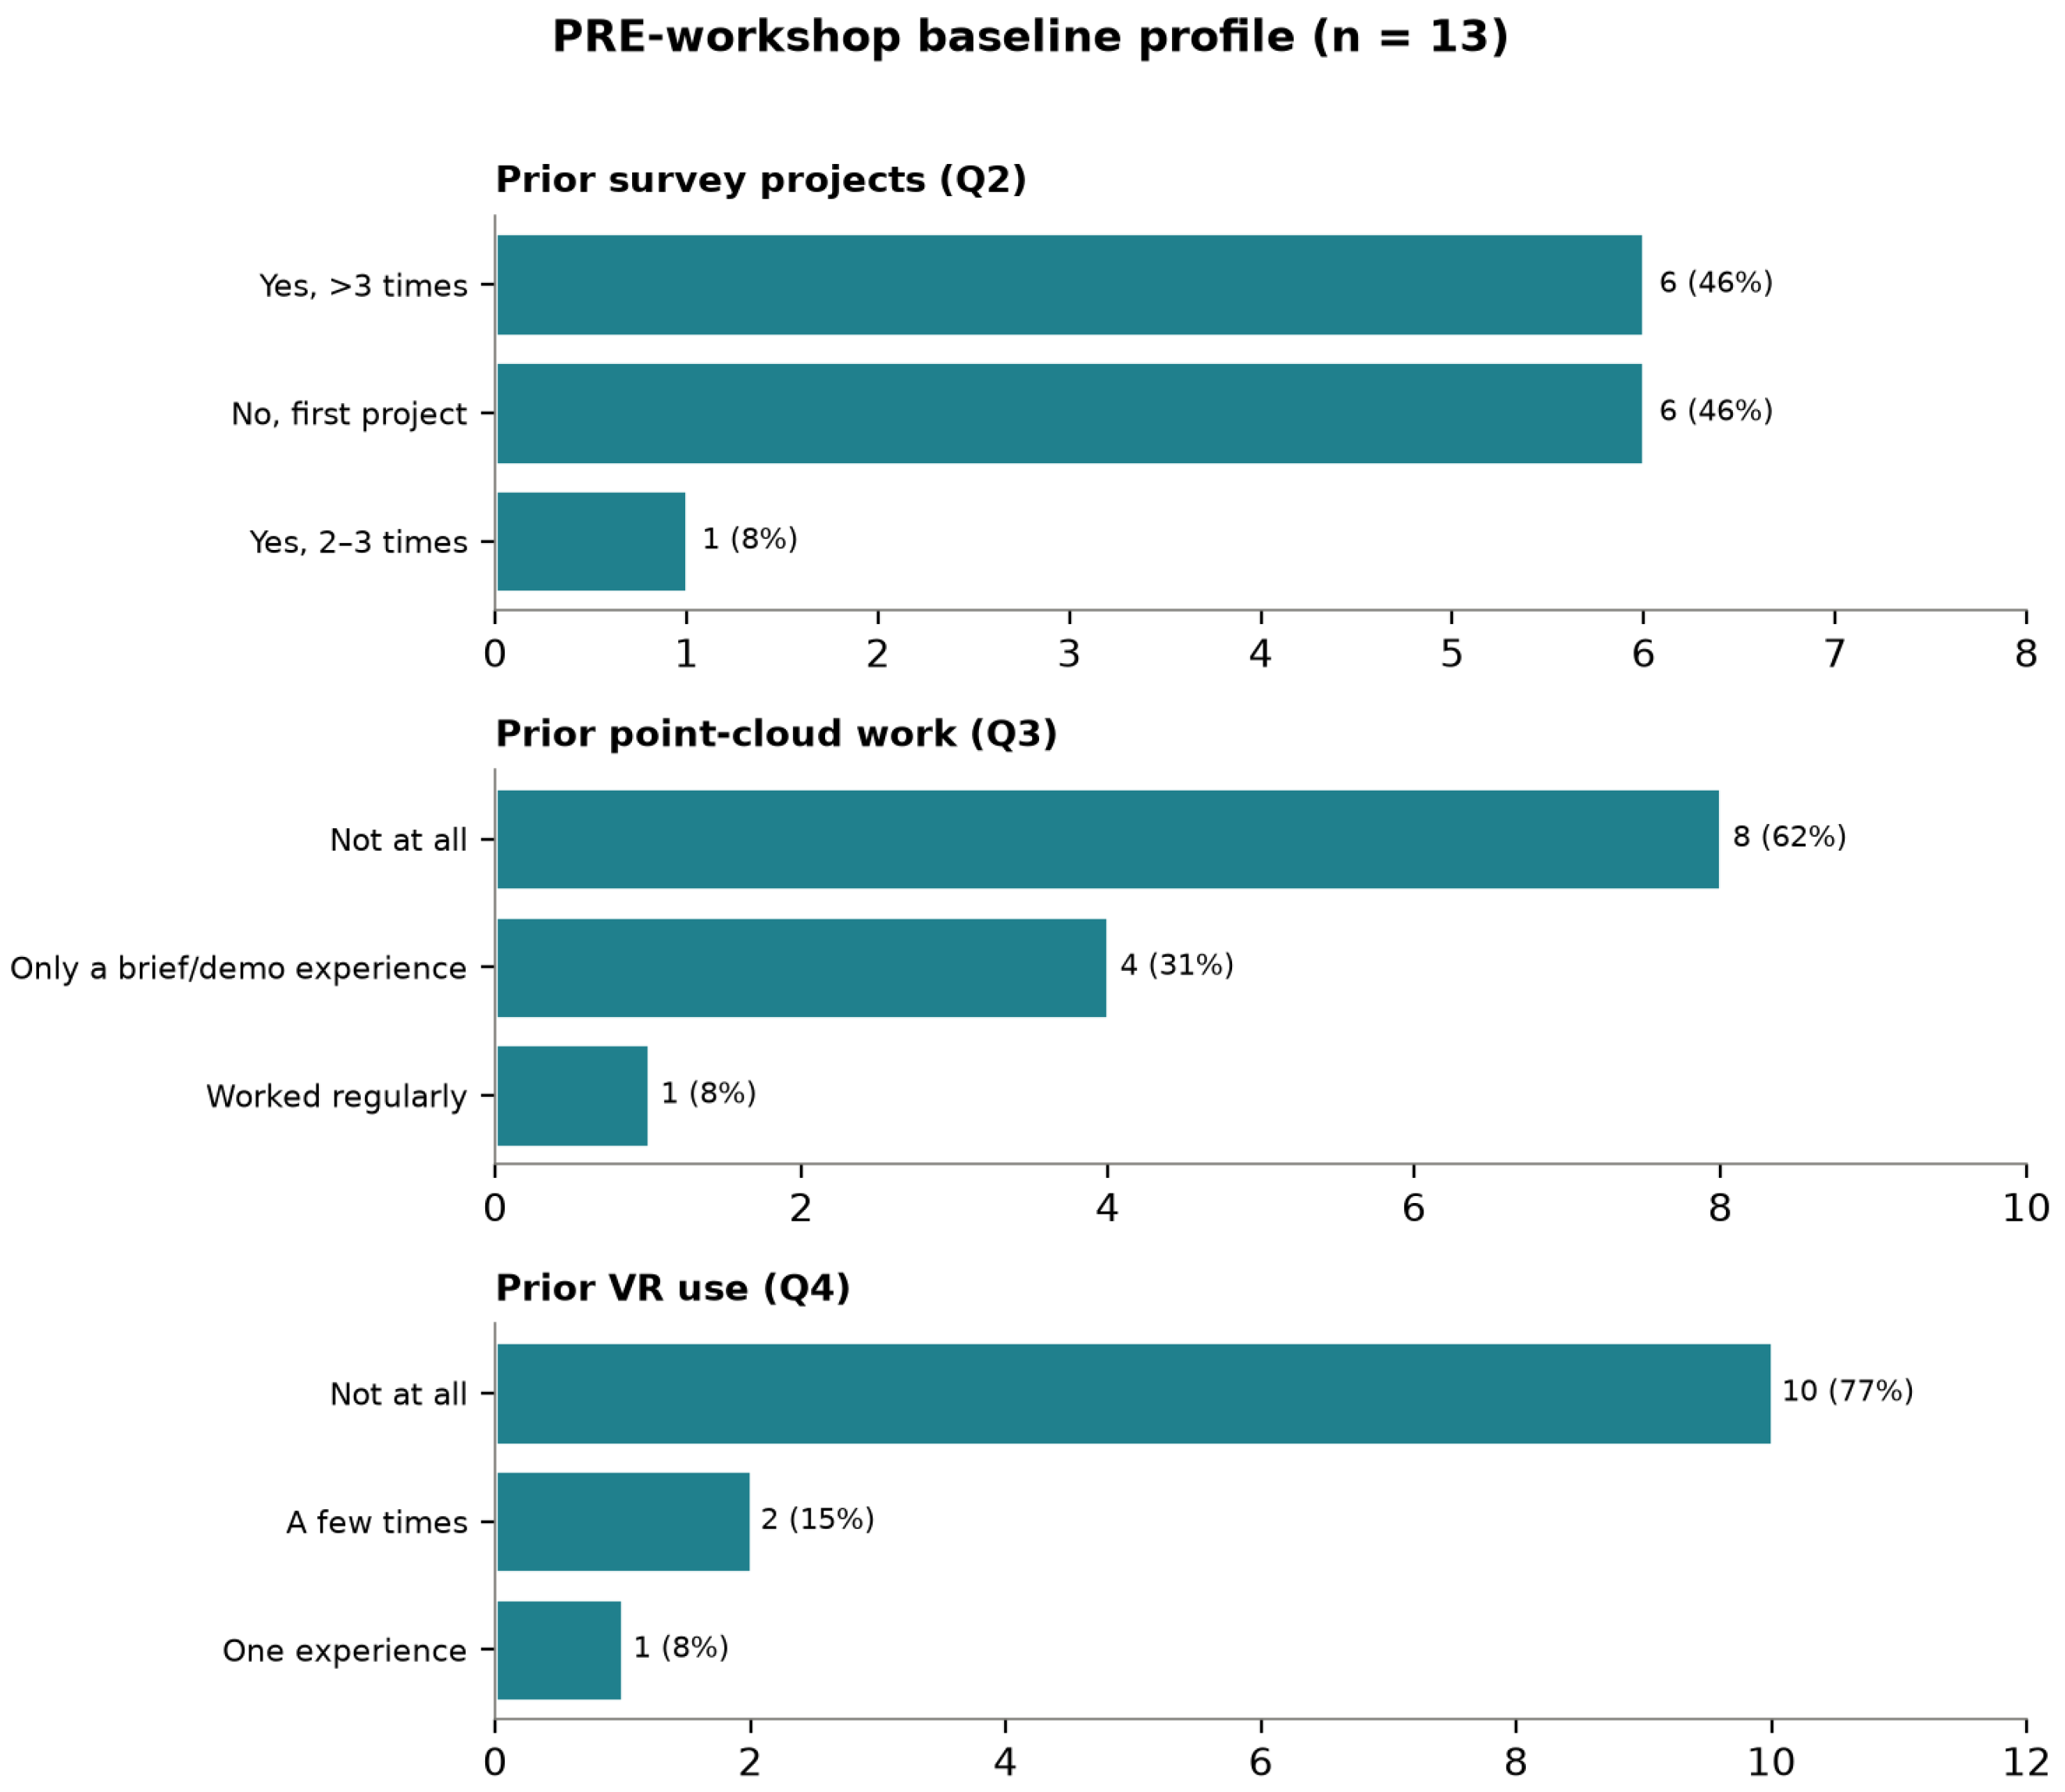
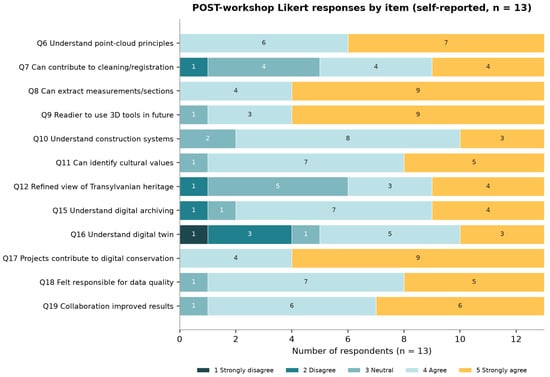
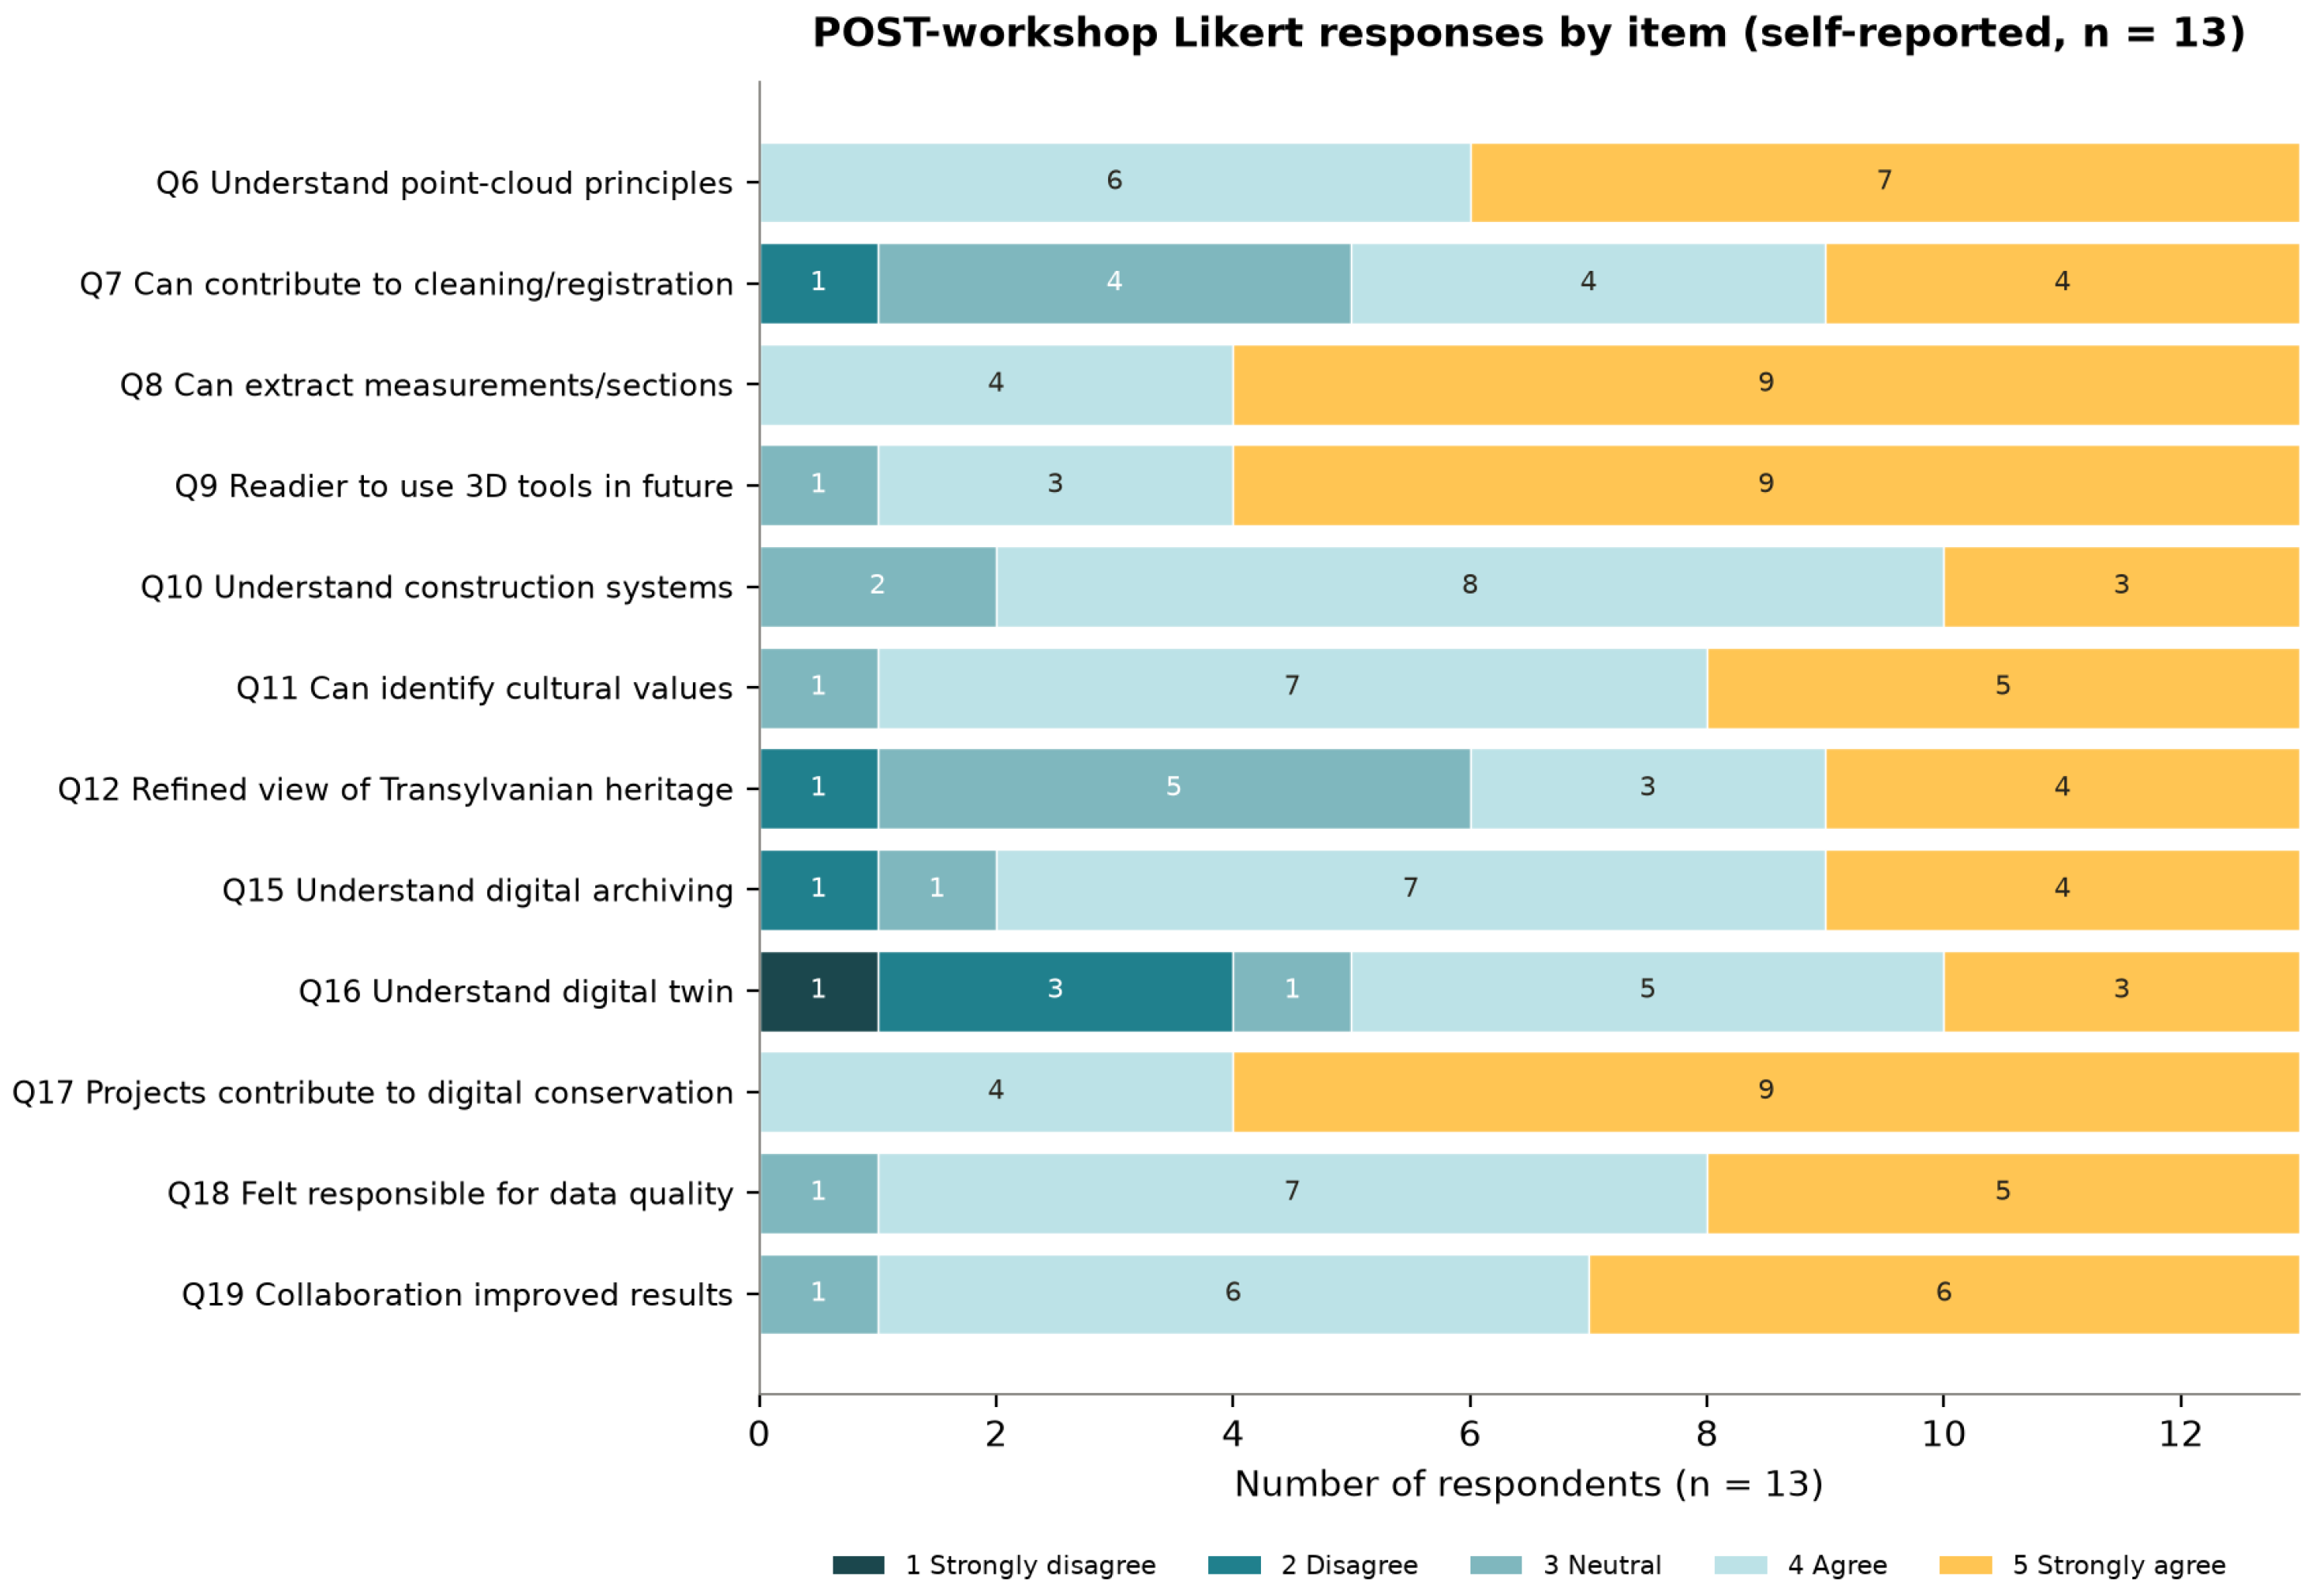
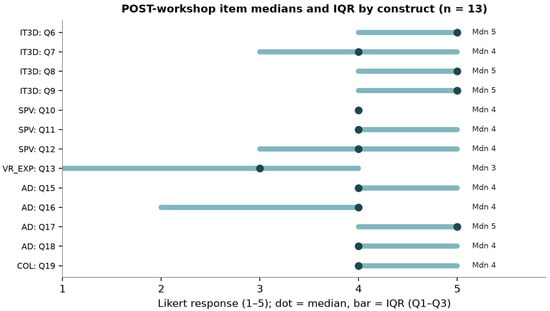
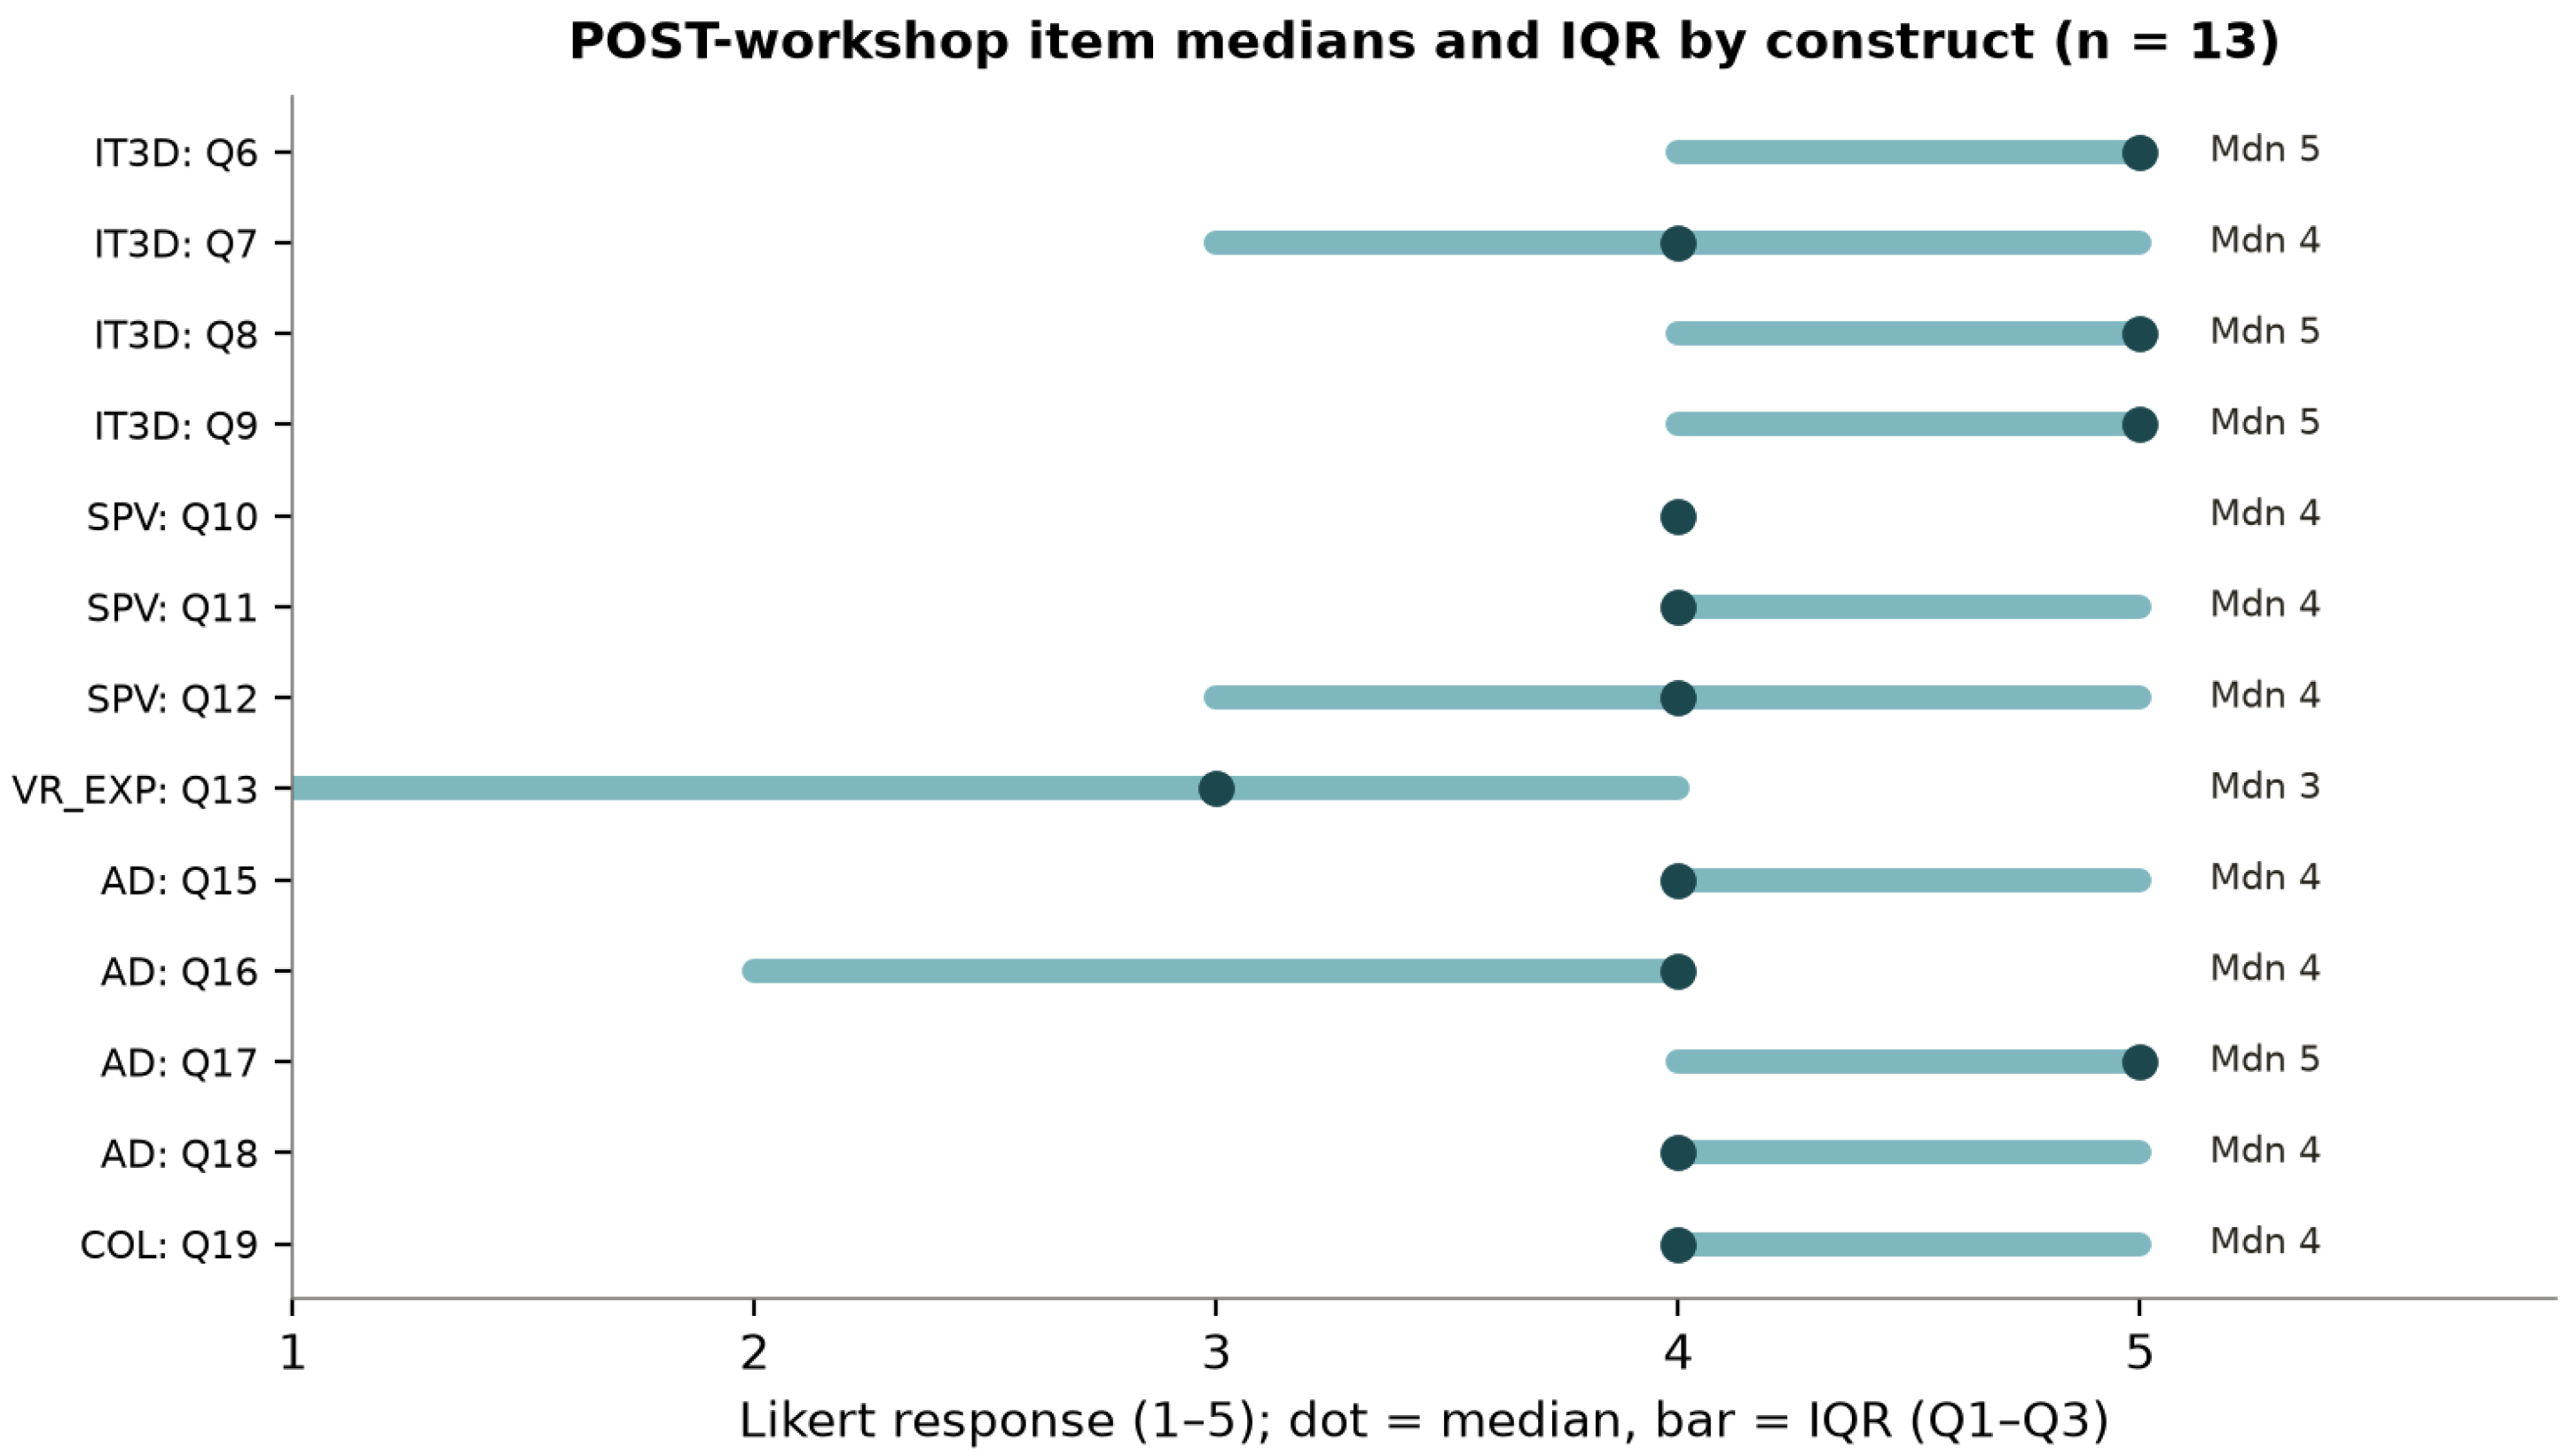
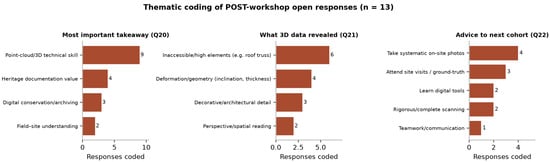
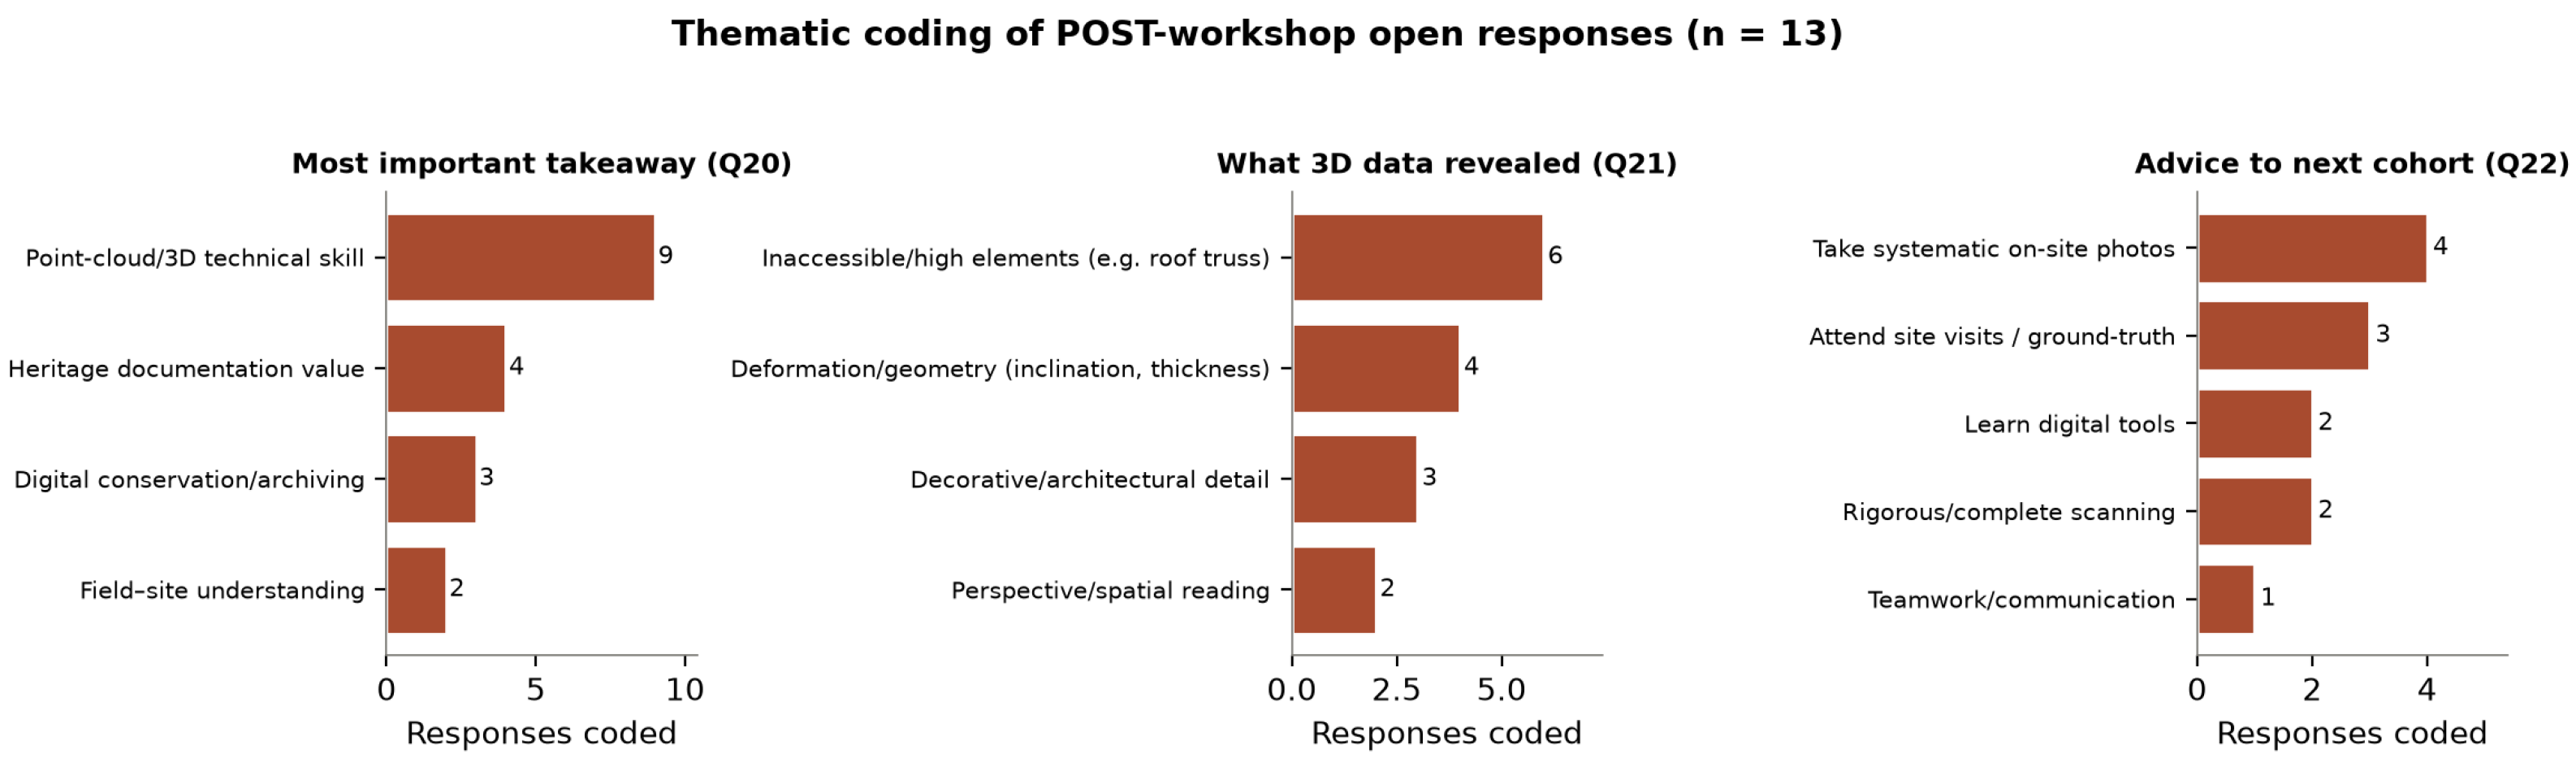

Disclaimer/Publisher’s Note: The statements, opinions and data contained in all publications are solely those of the individual author(s) and contributor(s) and not of MDPI and/or the editor(s). MDPI and/or the editor(s) disclaim responsibility for any injury to people or property resulting from any ideas, methods, instructions or products referred to in the content. |
© 2026 by the authors. Licensee MDPI, Basel, Switzerland. This article is an open access article distributed under the terms and conditions of the Creative Commons Attribution (CC BY) license.