


Abstract
The growing share of variable renewable energy sources increases the need for operational flexibility in power systems. In regions with cascaded hydropower systems, upgrading existing plants may be a more practical short-term planning option than developing new hydropower facilities. This study employed a multi-criteria decision-making (MCDM) framework based on the VIKOR method to screen and prioritize existing hydropower plants for potential infrastructure upgrading and capacity development in the Skellefte River, located in Northern Sweden. According to this prefeasibility study, six hydropower stations with installed capacities above 50 MW along that river were evaluated using six technical criteria: installed capacity, hydraulic head, efficiency, generation cost, average turbine discharge, and normal annual production; their weights were derived using the Shannon entropy method to minimize subjectivity. The ranking suggests Gallejaur, Kvistforsen, and Bastusel as the most favorable alternatives, mainly due to their strong performance in annual production and hydraulic head. Vargfors, Krångfors, and Selsforsen rank lower because of head and/or production constraints. The proposed pre-feasibility hydropower ranking workflow provides a transparent and reproducible preliminary technical screening tool. More detailed studies, including hydraulic cascade operation, environmental permitting and grid constraints, are required before practical implementation and feasibility assessment studies for future investigations.
1. Introduction
Electrical power systems with increasing shares of wind and solar power need additional flexibility to balance short-term variability and to efficiently use existing transmission capacity. In the Nordic power system, hydropower provides a large share of dispatchable electricity generation and therefore plays an important role for flexibility services such as load following, operating reserves, integration of wind and solar power, and congestion management [1,2,3].
Developing new hydropower installations is often restricted by environmental regulations, long project lead times, and high capital costs. Consequently, system planners should focus on refurbishment of and reinvestment in existing plants to improve plant efficiency, operational flexibility and capacity expansions.
Upgrade decisions on individual installations in a cascaded hydropower system cannot be made independently because the installations are hydraulically interconnected; a change at one unit can shift operational bottlenecks upstream or downstream. Therefore, a systematic screening method is required to identify and rank hydropower stations to check their priority for a more detailed techno-economic evaluation.
Multi-criteria decision-making (MCDM) methods are well suited to such ranking problems because they allow alternatives to be compared across multiple quantitative criteria with different units. In this study, the focus is on technical pre-feasibility indicators that influence plant production performance and operational capability, including hydraulic head, average turbine discharge, installed capacity and other criteria for considering long-term water availability and normal annual production.
The main purpose of this work is to develop a transparent and reproducible MCDM to rank existing hydropower plants on the Skellefte River in Northern Sweden for potential infrastructure upgrades. Six hydropower plants with installed capacities above 50 MW are evaluated using the VIKOR compromise-ranking method with criteria weights derived from the Shannon entropy method.
It is noteworthy to mention here that the value of hydropower for the optimum benefit is not only seen in its storage aspect but also in a scheduled water release plan, which is needed for a balanced grid and demand in the case of adjusting prices during high consumption periods. As cascaded units cannot operate independently, they may need to be combined with other renewable energy resources to improve flexibility utilization for high seasonal demand compensation and to balance demand and production in the electricity network.
Different types of hydropower have different levels of flexibility; reservoir-type dams are more appropriate for flexibility in case of supplying demand variations; runoff-river-type hydropower plants offer less flexibility [1].
This research is based on real data from hydropower installations along the Skellefte River; it aims to determine the best development alternative or hydropower site. The analysis uses the VIKOR method, which is a multi-criteria decision-making (MCDM) technique. In comparison with other MCDM techniques, VIKOR explicitly balances overall performance (group utility) with the shortfall of the worst-performing criterion (individual regret). This feature makes it attractive for pre-feasibility screening, where trade-offs among criteria evaluation are often unavoidable. To further improve the methodology and to limit the subjectivity in the weighting process, Shannon entropy is employed to derive data-driven weights from the dispersion of each criterion across the alternatives.
The reason for selecting the Skellefte River and its hydropower stations as a case study in this research was its location, as it flows past our university campus, and the availability of sufficiently consistent public data for comparative screening. It provides a suitable case for testing a pre-feasibility ranking framework for a cascaded hydropower system. As all the stations are on the same river, it is easier to integrate them with other sources of energy or work on their capabilities by considering their locations and distances from each other. Therefore, it is not possible to benefit from one of the plants without impacting another one in the same river. Combining hydropower with other renewable sources of energy such as wind may help balance demand and production by using hydropower as a flexible base resource.
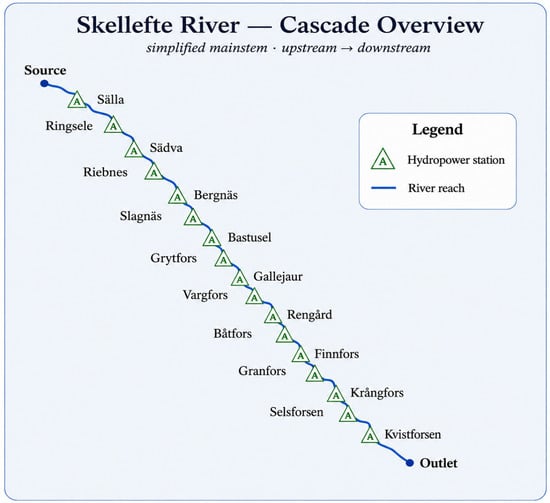
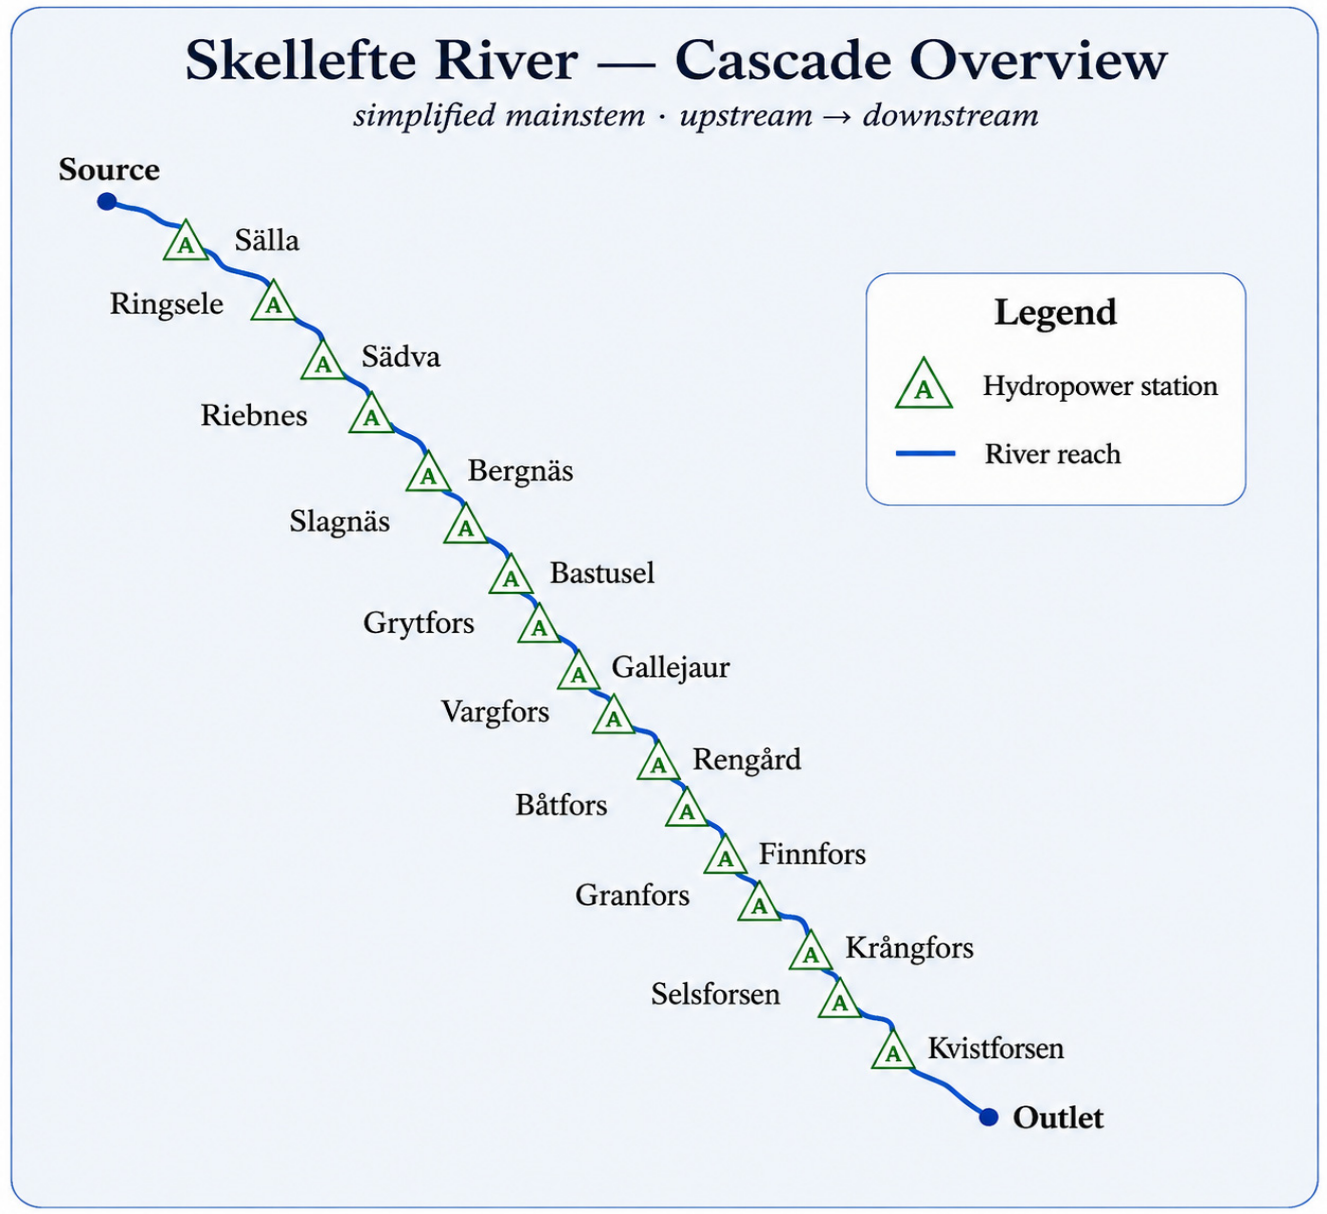
The Skellefte River, as illustrated in Figure 1, is a relevant example case for other rivers in the northern part of Sweden, such as the Ume and Lule rivers. Sweden’s average yearly hydropower production is approximately 65 TWh and accounts for 40% of the electricity generation of the entire country; it consists of 2100 hydropower stations with a total installed capacity of 16.2 GW [2,3].
Figure 1.
Schematic representation of hydropower stations along the Skellefte River based on the stations listed in Table 1. The figure is illustrative and not a georeferenced map.
It was also necessary to choose the appropriate quantitative criteria for the hydropower plant case studies (alternatives, using the VIKOR terminology). The criteria selected for our research study were technical criteria and not the environmental or social aspects in this context. The reason for selecting technical parameters is to evaluate how output efficiency could be upgraded to increase the flexibility of an electricity network for improvement trade-off between the needs of demand and production of the hydropower installations.
Another important consideration in this research was the availability of a capable transmission grid to accommodate both the additional produced electricity and the demand growth for consumption. The grid must be carefully planned and managed to balance the system while integrating new renewable energy sources and continuously supporting the increasing demand of different sectors. As the energy system develops, the need for flexibility increases and will lead to more complex interconnection between different sectors, such as power generation and consumption from industry, which results in adding complexity to grid planning and operation. As a consequence, ensuring a resilient and flexible transmission network is necessary to balance demand and supply while facilitating the energy transition and maintaining reliable system performance under operational condition variations [4].
The novelty of this work is not in the development of a new MCDM algorithm, as both VIKOR and Shannon entropy are well-established methods. Instead, the MCDM contribution in our study is the application of an entropy-weighted VIKOR workflow as an early-stage technical screening tool for prioritizing existing hydropower plants in a developed Swedish cascaded river system based on common publicly available technical data, while detailed data such as refurbishment cost, grid data, and environmental and hydraulic operation are not yet available. It is worth mentioning that the present study does not model upstream–downstream hydraulic coupling, water travel time, spillage, grid hosting capacity or reservoir dispatch. These aspects are treated as future work. Thus, the cascaded system is used as the geographical case study context, not as a coupled hydraulic operation model.
The remainder of the paper is organized as follows. Section 2 presents the methodological background and materials, including the justification for selecting the MCDM framework, the Skellefte River case study, the hydropower plants and technical criteria, the construction of the decision matrix, the VIKOR procedure, and its implementation in MATLAB. R2025b. Section 3 reports the results of the Shannon entropy weighting and VIKOR calculations, including the criterion weights, weighted decision matrix, and final ranking indices. Section 4 discusses and interprets the ranking results with specific attention to the characteristics of the higher- and lower-ranked hydropower plants and the broader implications of the findings for future infrastructure upgrading at the feasibility level. Section 5 summarizes the main conclusions, acknowledges the limitations of the present analysis, and outlines directions for future research work.
2. Methodology Background and Materials
2.1. Background
Analyzing the hydropower stations along the Skellefte River and ranking them using the VIKOR method is an example of multi-criteria decision-making analysis; the abbreviation (MCDM) is used in this paper. The reason for choosing this method is its suitability for reinvestment planning, which differs from greenfield site selection. The selected hydropower plant locations are fixed, but the decision concerns budget constraints and engineering effort to get the largest system benefit from reinvestment. An individual criterion (e.g., installed capacity) rarely captures upgrade potential, because its functionality depends coherently on water availability (average discharge), head, efficiency, and expected energy yield. MCDM allows these heterogeneous technical criteria to be combined vividly into a ranking that can be used as an initial observation before detailed feasibility studies.
MCDM could be considered as a planning method for electricity generation projects, industry, and many other sectors. This method was first introduced by Bernard Roy in the 1960s [5] to improve operational processes. MCDM methods have been widely used for energy planning and for comparing renewable technologies, including applications in hydropower development and water-resource management.
Later on, many researchers and scientists used this method to expand their investigations in many different fields. The VIKOR method has been used by Katal and Fazelpour [6] to rank different types of power plants by considering different power plants’ resources and climate diversity. Results were obtained by evaluating real data gathered from different renewable energy sectors and private companies in the electricity industry of Iran [6].
An application of this method to water resource management modelling was published by Al-Ani Ibrahim et al., who ranked the runoff control alternatives against the criteria with different units to get the optimal control strategy for using a hydropower reservoir for different sector allocations [7].
In recent years, electricity generation has become more complex in parallel with the expansion of new types of renewable sources. As a result, this priority ranking analysis is becoming increasingly used to get more benefits from the available and previous energy resources.
Bosona and Gebresenbet [8] found that water management can be improved by increasing the efficiency of dam reservoir utilization by enhancing their yearly energy production and improving their monthly energy production. In a detailed simulation analysis, they used the average monthly inflow over 36 years; different simulations were conducted by changing the values of initial reservoir storage and acceptable reservoir release for power generation with the purpose of obtaining a maximized yearly energy output with improved uniformity of energy production. The paper proposed a new reservoir operation guide curve for the optimum energy production from this plant, which indicated that the yearly energy production was increased by 5.67%, while evaporation loss was reduced by 38.33%.
MCDM methods offer structured approaches to rank such projects amid diverse objectives and constraints. It was, however, found in [9] that despite numerous available techniques, no single method suits all scenarios, as outcomes vary with modeling approaches. While differing mathematically, these methods share conceptual similarities in assessing alternatives.
There are several MCDM techniques available, such as ELECTRE, TOPSIS, AHP and ANP, which are used by decision-makers. However, the results of the optimization can differ based on the selected criteria weights [10].
In this paper, VIKOR is used because it provides a compromise solution by considering the overall distance to the ideal solution across all chosen criteria, the group utility (S), and the maximum deficit of any individual criterion, the individual regret (R). The key point here is to screen the results to identify the plant with the best performance across all criteria, while avoiding critical weaknesses.
To reduce the subjectivity in criterion weighting, the Shannon entropy method was adopted to calculate weights of each common criterion separately based on the dispersion of them across all the hydropower plants. Furthermore, an integrated entropy–VIKOR framework provides a data-driven complement to the VIKOR ranking procedure. The entropy–VIKOR integrated framework is intended as a transparent screening tool rather than a substitute for detailed techno-economic design.
Based on the mentioned methodological framing, the following sections introduce the alternatives, chosen criteria, implementation steps used to construct the decision matrix, and the VIKOR ranking application.
2.2. Alternatives and Selected Common Technical Criteria
The Skellefte River, known in Swedish as Skellefteälven, is an important river in northern Sweden. It originates in Norrbotten County, then goes south-east into Västerbotten County, passing through the town of Skellefteå (the name of which has a similar origin to the name of the river), and finally discharges in the Gulf of Bothnia, in the Västerbotten province. The river is approximately 410 km long and, like many northern Swedish rivers, has long been cultivated for hydropower production [11].
The average discharge of the river is around 157 m3/s, and the river is extensively developed for hydroelectric power generation. It consists of several hydropower stations at different locations in the river, summarized in Table 1.
Table 1.
Hydropower installations along the Skellefte River [12].
2.2.1. Alternative Selection
From Table 1, six hydropower stations have been selected with more than 50 MW installed capacity: Gallejaur, Kvistforsen, Vargfors, Bastusel, Krångfors and Selsforsen. Although Riebnes has an installed capacity above 50 MW, it is excluded due to insufficient available data and a lack of consistency with the six selected stations. The final decision matrix includes only stations that satisfy both conditions: installed capacity above 50 MW and availability of a complete dataset.
Gallejaur
The Gallejaur hydropower plant makes use of the natural hydraulic head (water drop) available along the stretch of the river between the Dyngseleforsen and Treholmsforsen rapids (fast-flowing turbulent parts of a river; the Swedish word “forsen” means “the rapid”). The plant was constructed in two stages to optimize the use of the river’s elevation difference and to ensure efficient operation under varying flow conditions. This staged development allowed for a gradual expansion of generation capacity and improved regulation of water flow within the Skellefte River’s hydropower system. The first unit was built in 1964 and the second in 1988. The construction of the second unit greatly increased the scope available for short-term regulation and flexibility. This plant is 100% owned by Vattenfall and is in operation now, with an almost 220 MW electricity capacity and two Francis turbines. It has an 80 m head of fall and an average water discharge of 228 [13]. The reported discharge values may differ depending on whether average, design, or maximum turbine capacity is used; therefore, consistent discharge data are required for later feasibility-level analysis.
Gallejaur has a normal yearly production of 705 GWh [12], a total cost of 396.9 for electricity production, and a total output efficiency of 86% [14].
Kvistforsen
Kvistforsen hydropower plant is located in Skellefteå municipality in Västerbotten County in northern Sweden, and its first year of operation was 1962. Kvistforsen Power Station is a diversion power plant with a reservoir formed by damming the Skellefte River. It is owned and operated by Statkraft [15].
The installed capacity is 150 MW, with 671 GWh annual production. The plant consists of two Kaplan turbine units, with a gross head of 51 m, and maximum water flow up to 320 . The reservoir’s water level is regulated between 50.5 and 52 m above sea level [12].
The estimated plant’s efficiency is 84%, and the total cost of electricity production is estimated at around 312 .
Vargfors
This plant is located about 15 km southwest of Norsjö in Västerbotten County and is 100% owned and operated by Vattenfall AB [16]. It was built in two stages: the first unit was built in 1961, and the second one was added in 1987. It has one Francis and one Kaplan turbine unit with a power plant efficiency of 85% [17]. The total investment in it is estimated at around 235 for generating power annually, and it delivers roughly 452.162GWh per year, with a total capacity of ~131 MW, which is supported by a 49 m head and 136 flow capacity [18].
Bastusel
The utilized head of Bastusel is 77 m, with 120 MW electricity output and 86% efficiency [19]. The annual production of the plant is 557.473 GWh, with an average water flow of 170 and the total costs for building the station were 289.6 .
The Bastusel power station is an underground facility equipped with a single Francis turbine unit and is fully owned by Vattenfall. As part of Vattenfall’s dam safety program, major investments have been made at Bastusel to ensure that the dam can withstand the extreme water levels expected to occur once in 10,000 years. To achieve this, the dam has been raised, and the spillways have been renovated [20].
Krångfors
The Krångfors Power Plant has an installed capacity of 62 MW, with a normal annual energy production of approximately 350 GWh and a maximum water flow of 265 m3/s through the turbines. It has two Francis units and one Kaplan unit, followed by a 30 m net head and 86% turbine efficiency. The investment cost was also estimated to be around 182 MSEK [21].
The plant was initially constructed in 1928 and expanded in 1948 and 1973. Skellefteå Kraft plans to expand the Krångfors and Granfors hydropower plants, representing the largest investment in the river since hydropower was first established along it. The project will begin once the environmental permit is granted, and construction is expected to take about five years [22].
Currently, the Krångfors power plant is a bottleneck in the Skellefte River. Increasing output will match the upstream and downstream capacity better, and expanding the plant will improve the river’s ability to deliver power, which is important for Sweden’s transition to 100% renewable energy. Krångfors currently has 60 MW capacity; after the renovations, it will be increased to around 100 MW. As Sweden adds more wind and solar to the transmission network, hydropower will play a greater role in terms of flexibility by producing more electricity when solar and wind power have less availability [22].
Selsforsen
The Selsforsen power station, owned by Skellefte Kraft, has an installed capacity of 65 MW and produces, on average, 265 GWh of electricity yearly. The dam is 22.2 m high and operates with an average discharge of 31.8 . The plant has a total efficiency of 85% and required an investment of 34 MSEK for its initial commissioning [23]. The station is an above-ground facility equipped with two coupled Kaplan turbines.
2.2.2. Selection of Common Quantitative Criteria
There are various criteria for proving the performance of hydropower plants. The selection of criteria should reflect the specifications and performance of different hydropower plants, and evaluating several criteria together gives better results than evaluating each individually. Therefore, the selection of these discrete criteria requires parameters based on reliability, appropriateness, practicality, and measurement limitations [10].
The selected criteria in the presented study are used as preliminary technical screening indicators; they do not present final refurbishment potential, as the actual upgrade feasibility is dependent on additional indicators such as civil works, grid connection, operation and maintenance costs, and owner priorities. These indicators were not available for all the plants, and therefore the selected technical criteria are chosen based on a composite technical performance ranking rather than a direct measurement of the final upgrade feasibility level. Therefore, the ranking should be read as an initial technical performance screening, not as a direct measurement of upgrade potential.
Power Criterion (MW)
The first and most influential criterion is the installed power capacity, which represents the maximum power plant output and is typically expressed in megawatts (MW). Although this value is used to classify and compare different types of power plants, actual power production often remains below this capacity due to operational constraints.
One of the purposes of our future studies, increasing the hosting capacity of the transmission network, could be linked to this criterion; increasing the installed capacity typically increases the hosting capacity for new consumption. This criterion allows for the identification of power plants with greater potential for future investment.
Height of Falling Water in the Dam Criterion (M)
The height of falling water, or hydraulic head, is a crucial technical criterion in MCDM analysis for hydropower projects because it directly influences power generation capacity and project feasibility. According to the IPCC (2011), hydropower output is proportional to both the water flow and the head height, making it a fundamental factor in estimating a project’s energy efficiency and feasibility [24].
A higher head allows for greater energy production even at lower flow rates or efficiency, improving overall performance and economic viability, which is especially useful in run-of-river projects where head is limited and varies seasonally. The head also influences the choice of turbine technology, civil infrastructure design, and the environmental footprint of the dam, making it essential for comprehensive site evaluation and decision-making.
Efficiency Criterion
Efficiency is one of the most widely used criteria for evaluating power plants and energy systems.
The efficiency criterion determines how much energy can be obtained from a useful energy source [25]; in this study, hydropower is the main source of energy. This factor is defined as the ratio of useful output energy to total input energy. The considered hydropower plants in this research study have different power capacities and hydraulic heads, which result in their efficiency factor variations. However, since the plants are cascaded along the same river and operation, their efficiency variations are expected to be relatively small.
For combined-cycle, gas, and CHP power plants, efficiency is typically defined as thermal efficiency, since these systems convert fossil fuel energy into useful power. In contrast, in hydro and wind power plants, there is no fuel combustion, and efficiency is generally expressed as annual or conversion efficiency.
Cost of Electricity Generation Criterion
Investment cost is a critical criterion that could be considered as an economic factor in evaluating energy systems and power plants, as it encompasses all initial expenses, including equipment purchase, construction of facilities, roads, grid connections, and engineering services. These costs vary depending on factors like regional labor, terrain, and proximity to transmission lines or fuel sources [26].
In this study, the cost indicator refers specifically to the initial construction phase, excluding maintenance and operational expenses, and the cost value used here should not be interpreted as plant refurbishment or upgrade costs. Because fully comparable economic data were unavailable, this criterion is treated as a limitation rather than a final investment cost measure. It is a simplified proxy cost indicator because detailed plant-specific economic data were not publicly available for all alternatives, and further assumptions are needed for complete feasibility studies using real refurbishment, civil work, and operation and maintenance costs. This proxy cost indicator is included only for preliminary comparison and should not be interpreted as a plant-specific refurbishment cost ranking criterion.
As there was no specific information about cost information in our research, we tried to calculate the expenses manually based on a rated base price that was reported for the cost calculations. The process of calculation is based on the following steps:
1. Consider the total annual reported energy output.
2. Consider the total installed capacity.
3. By dividing the above factors, find out how much electricity in kWh could be produced in a year for each kW of installed capacity.
4. The LCOE (levelized cost of energy) is 0.63 SEK/kWh in Sweden [27].
5. The electricity production per unit of installed capacity calculated in Step 3 is multiplied by the LCOE value in this step (0.63 SEK/kWh). This provides the annual cost associated with generating electricity per kW of installed capacity, and to facilitate the analysis and comparison in this study, they need to be converted into the relevant metric unit here.
Average Water Flow Criterion (m3/s)
Average water flow is a basic and initial technical parameter when evaluating hydropower potential because, together with the head, it directly influences the amount of energy that can be generated over time. The flow rate, combined with the hydraulic head, determines the potential power output using the equation: , where is the average water flow, and a greater average flow enables greater and more consistent electricity generation, increasing the overall efficiency and capacity factor of the hydropower plant.
Furthermore, average flow data are crucial for infrastructure design, including turbine selection, reservoir sizing, and spillway capacity. Hydropower plants in regions with highly variable or low flow rates may face seasonal or year-round generation limitations, which impact economic returns and grid reliability. Therefore, assessing average flow as a technical criterion in MCDM supports a comprehensive evaluation of feasibility, particularly when balancing environmental, technical, and economic objectives. According to the International Energy Agency (IEA), a well-measured average flow is one of the key inputs in determining the levelized cost of electricity (LCOE) for hydropower projects, alongside investment cost and head height [26]. Its inclusion in decision-making frameworks strengthens the ability to identify hydropower solutions that are both effective and resilient.
Normal Yearly Production Criterion (GWh)
The normal yearly production (GWh/year) is used as a technical criterion in MCDM analysis for hydropower projects. It is also referred to as annual energy output and is a vital technical criterion in MCDM analysis for hydropower projects because it reflects the actual expected energy generation over a typical year. Unlike theoretical capacity, this measure accounts for real-world variables such as seasonal water flow variations, turbine efficiency, plant availability, and operational constraints.
The normal yearly production is able to provoke a realistic assessment of a plant’s performance and energy contribution to the grid. This value is essential for comparing different sites or technologies because it allows stakeholders to evaluate how much usable electricity can be delivered annually, which directly affects revenue forecasts and energy planning strategies in different countries [24,26].
Moreover, this criterion is tightly linked and close to other technical and economic factors, such as capacity factors, hosting capacity of the network, and grid integration value. A hydropower plant with a high annual production is generally more attractive to investors and planners, as it suggests a higher return on investment and better alignment with long-term energy security goals.
It could also be interesting in our research results to identify which plant is better to invest more in and get a higher output from. According to the International Energy Agency (IEA), consistent annual production is a key indicator of project viability and is often used to calculate the levelized cost of electricity (LCOE), a central economic metric in energy system evaluation. Including this criterion in MCDM ensures that decisions are based not only on installed capacity or investment cost but also on the plant’s actual contribution to meeting electricity demand over time [28].
2.3. Decision Matrix Table of Study with the Collected Data
Table 2 shows the main decision matrix (DM) of the data from Section 3.1, with the alternatives or case studies in each row and the relevant technical criteria in the columns.
Table 2.
Main decision table for calculations and evaluation for ranking hydropower plants along the Skellefte River.
It is important to note that all the units for each column must be the same to get the best result in MCDM methodology, and this is the primary table of ranking assessments to be followed by the normalization matrix and VIKOR algorithm calculations using the MCDM method.
In order to get the most appropriate result in MCDM analysis, the initial requirement is to identify the parameters or criteria that are most relevant to the study. For example, in the case of technical priority, there is no need to consider environmental impacts in detail, so here we consider the parameters that have an effect on the selection of the proper hydropower plant sites for infrastructure upgrades. The criteria here are efficiency, height of dam for falling water, total efficiency of the power plant, which is mostly related to the turbine efficiency, general cost of electricity generation, average water flow through turbines, and the normal yearly electricity production.
The selected hydropower sites (alternatives) are also chosen on purpose. The older and lower-efficiency sites are not beneficial to consider, so we selected those which produce more than 50 MW and are currently in operation.
2.4. VIKOR Method Explanation and Its Implication Under MCDM
The different steps employed in this study are as follows:
1. Site selection, discussed in Section 2.2.1.
2. Criteria selection. Discussed in Section 2.2.2.
3. Data normalization, which is the first step when using the VIKOR Method.
4. Weighing criteria.
5. Evaluation of alternatives.
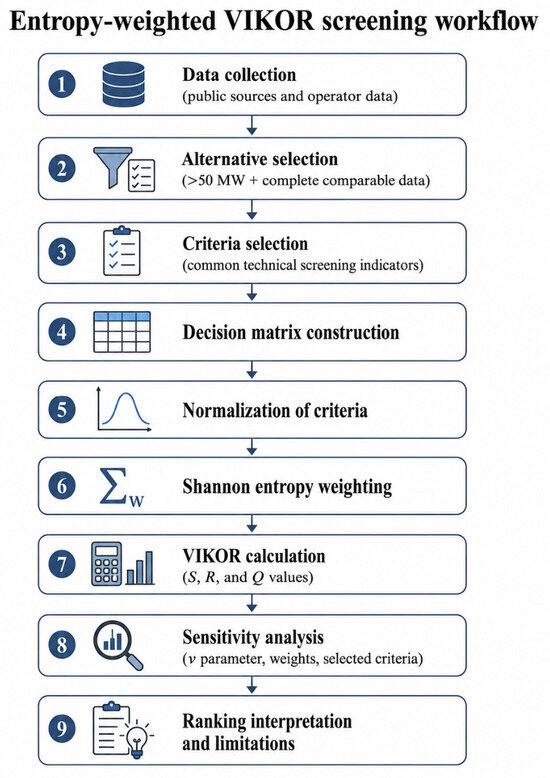
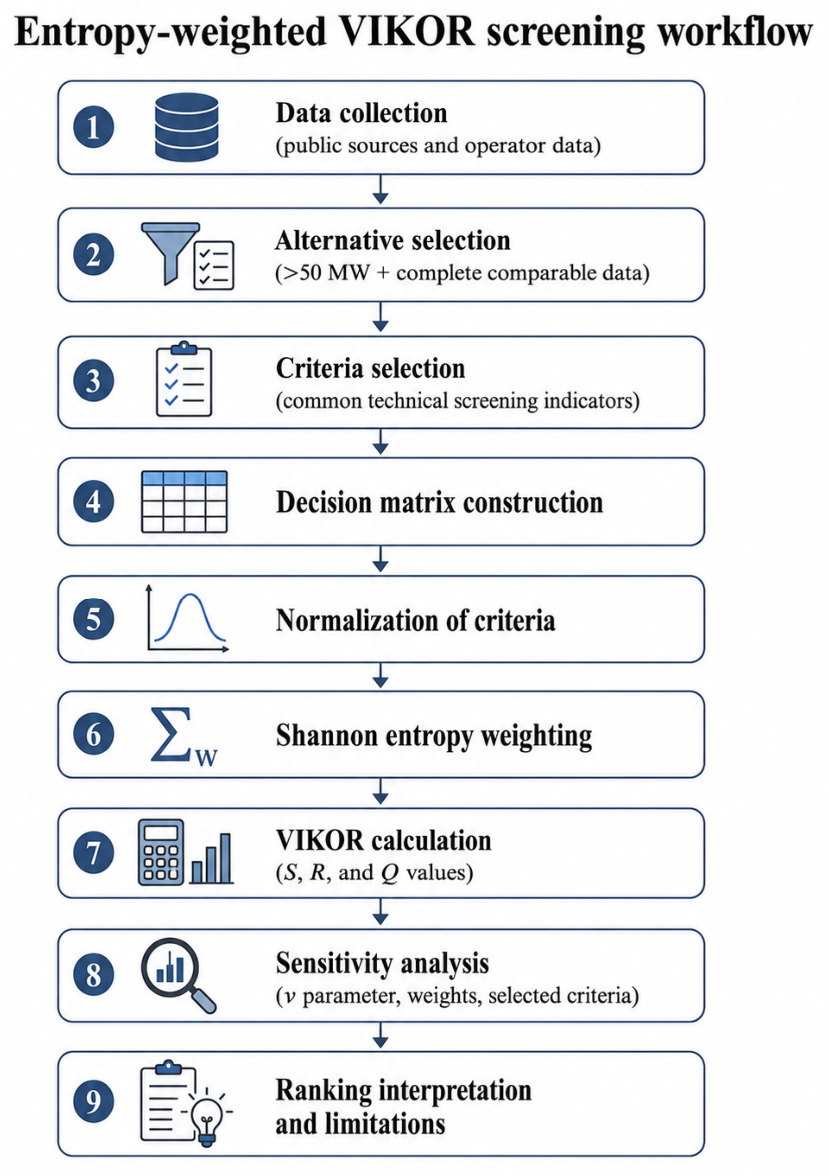
The overall implementation workflow used in this study is summarized in Figure 2.
Figure 2.
Workflow of the entropy-weighted VIKOR screening framework used in this study. The figure summarizes the main steps from data collection and alternative selection to entropy weighting, VIKOR ranking, sensitivity analysis, and interpretation of limitations.
VIKOR Technique
Modern decision-making must consider several conflicting factors, including social, economic, technological, and environmental aspects. Traditional single-criterion methods are no longer effective, and the VIKOR method, which is a type of multi-criteria decision-making (MCDM), helps rank options by measuring how close they are to an ideal solution. This method is commonly used to evaluate and compare the sustainability of energy plans and renewable technologies, supporting the selection of the most suitable option between them.
VIKOR is the short form of the Serbian name ‘VlseKriterijumska Optimizacija I Kompromisno Resenje’, which means multi-criteria optimization and compromise solution. This method was founded and developed by Opricovic in late 1998 [29].
The VIKOR method is a decision-making tool designed to handle problems involving multiple, often conflicting, criteria. Its primary aim is to identify and rank alternatives by determining a compromise solution that is closest to the ideal outcome. The process begins with establishing the positive-ideal and negative-ideal solutions, which represent the best and worst values across all criteria, respectively. Alternatives are then evaluated based on their relative distance to these reference points. As a result, VIKOR is classified as a multi-attribute decision-making method that relies on the ideal point strategy [30].
One of the dominant benefits of VIKOR is that, when evaluating case studies, we can directly use the available raw data based on accessible numerical parameters, and this makes it different and special in comparison with other models such as AHP or ANP; this benefit makes it easier for researchers to use the method.
The initial formula used in VIKOR is based on the adopted form of the LP-metric method shown below; it aggregates different functions for evaluating and comparing different alternatives based on the ranking MCDM method [6].
where 1 ≤ ≤ ∞;
- ➢
- j = 1, …, n, is the number of criteria;
- ➢
- i = 1, …, m, corresponding to alternatives such as A1, A2, …, Am;
- ➢
- f ij is the evaluated value of the jth criterion for the alternative Ai.
The measured shows the distance between the alternative Ai and the positive-ideal solution [31].
VIKOR Technique Steps
The steps of the method, in a multi-criteria decision-making problem, with criteria and alternatives (index of selected hydropower plants), are as follows:
- A.
- Formation of Decision Matrix:
The decision matrix scoring options (indicators) are based on criteria and denoted here by , with xij for each element. According to the evaluation of all options for different criteria, the decision matrix is formed as follows:
xij is the performance of alternative i in relation to criterion j; is the number of alternatives (hydropower plants) and is the number of criteria.
- B.
- Data Normalization:
The next step is to normalize the decision matrix using the following formula:
Each is the value of each criterion for each alternative (power plant index).
- C.
- Determination of the Positive and Negative Ideal Points:
For each criterion, the best and worst of each of the options are referred to as and , respectively. is the best possible value for the j th criterion among all alternatives and is called the positive ideal value, and is vice versa. So, in the case of a usefulness criterion:
Installed capacity, hydraulic head, efficiency, average turbine discharge, and normal annual production were treated as benefit criteria, where higher values are preferred. The cost criterion was treated such that lower values are preferred. Therefore, for benefit criteria, the positive ideal value is the maximum value, while for the cost criterion, the positive ideal value is the minimum value.
- D.
- Determination of Usefulness and Regret (compute the values and by the equations below):
Opricovic [29] introduced two basic concepts of utility (S) and regret (R) in VIKOR calculations.
The value of utility (S) indicates the relative distance of option i from the ideal point, and the value of regret (R) indicates the maximum discomfort of option i from the distance of the ideal point.
where wj is the weight function of the criterion which is calculated by the Shannon entropy weighting algorithm as explained below:
- E.
- Shannon Entropy Weighting Method
This method is mainly based on the assumption that the greater the dispersion in the values of a criterion, the more significant the criterion. This weighting method has a significant impact on the overall performance of the optimum power plant because it normalizes all the criteria and alternatives. Therefore, to calculate the weights of the indicators, we proceed as follows: (m is the number of alternatives, n is the number of criteria and rij is the elements of the DM.)
- ✓
- The first step is to normalize the columns of the decision matrix (DM).
- ✓
- Second, we calculate Equation (6) for each column.
- ✓
- Third is the diversification factor, which is calculated for each column.
- ✓
- Finally, to normalize the weight vector through wj, formula (8) is used:
- F.
- Calculating the VIKOR Index
The next step is to calculate the VIKOR index (Q) for each alternative (:):
While:
is defined as the weight of the strategy of ‘‘the majority of criteria” (assuming that ). It is possible to do a sensitivity analysis with other values of , but we considered the baseline value of 0.5 because it gives equal importance to group utility S and individual regret R. For future feasibility studies, different values of need to be considered to compare different ranking scenarios for practical implications and to examine whether the ranking remains stable under different VIKOR strategy weights. Since the present paper is limited to pre-feasibility screening, a full robustness analysis is reserved for the next feasibility stage.
- G.
- Final Conditions of Decision-Making with the VIKOR Technique
In the final step of the VIKOR technique, the options are sorted into three groups from small to large, based on the values of Q, R, and S derived from the results. The best option to choose has the minimum value of .
VIKOR is an appropriate method in multi-criteria decision-making, in particular when the decision-maker could not initially identify or prioritize the different criteria. The gained compromise solution could be acknowledged by the decision-makers because it provides a maximum ‘‘group utility” (represented by min ) of the ‘‘majority” and a minimum ‘‘individual regret” (represented by min ) of the ‘‘opponent”. The compromise solution reached must be accepted by decision-makers, because compromise solutions can be the basis for negotiation and decision-makers’ prioritization of weight criteria [6].
2.5. Coding VIKOR Algorithm in MATLAB Environment:
In this study, we used MATLAB software to implement VIKOR properly, and it is an efficient way to employ the above-mentioned methodology. Thus, we encoded all the VIKOR formulas (Q, R, S) in the MATLAB environment and associated them with the corresponding DM data file.
The formulation of how we calculated the weight factors was introduced in formulas (5) to (8), and the implication of them for the data is expanded in the result section.
The table input into MATLAB needs to be in the format of the table below. A1 to A6 are alternatives or power plants, and C1 to C6 are the selected criteria, which are in quantitative scales.
3. Results
3.1. Calculation of Weight Functions of Selected Criteria by Shannon Entropy Weighting Method
The first step was to apply the Shannon entropy normalization and weighting formulas described in VIKOR technique steps section to the decision matrix in Table 2. As shown in Table 3, the final row gives the column sums used for normalization.
Table 3.
Decision matrix with column sums used for Shannon entropy normalization.
3.2. Applying Shannon Entropy Weighting Method on Decision Matrix Data
Table 4.
Normalized decision matrix used for Shannon entropy weighting.
At this step, according to the Shannon entropy method, the entropy constant (k), which is defined as and is the number of columns, is calculated as:
Then, the calculated entropy of each column based on formula (6) is shown in Table 5.
Table 5.
Entropy weight values for each criterion.
Table 6 shows the diversification factor calculation based on formula (7), which is the degree of deviation and scatter of the columns from Table 5.
Table 6.
Diversification factor derived from the entropy values for each criterion.
In the final step, the weight vector of each column is calculated from formula (8), which presents the weight vector of Shannon’s entropy function in Table 7.
Table 7.
Final entropy-based weights of the selected criteria.
3.3. Formation of Decision Matrix with Weighting Functions
According to Table 7, all the weighting factors for the criteria are obtained. Thus, this row is appended to the initial decision matrix, and Table 8 shows the functional format of the initial data required for further assessments using the VIKOR method.
Table 8.
Decision matrix with entropy-based criterion weights used as input for the VIKOR calculation.
3.4. Implementation and Analysis of VIKOR Index Formulas in Table 8
Using Equations (3), (4) and (9), the utility (S), regret (R), and compromise index (Q) values were calculated for the six hydropower plants, as shown in Table 9.
Table 9.
Values of obtained Q, R and S factors for each hydropower plant with prioritizing and ranking based on the VIKOR method.
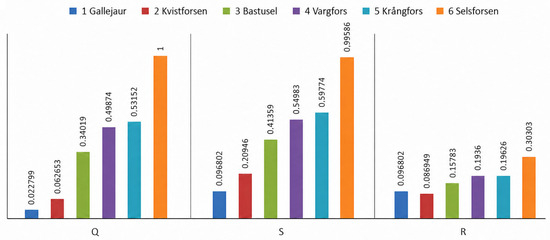
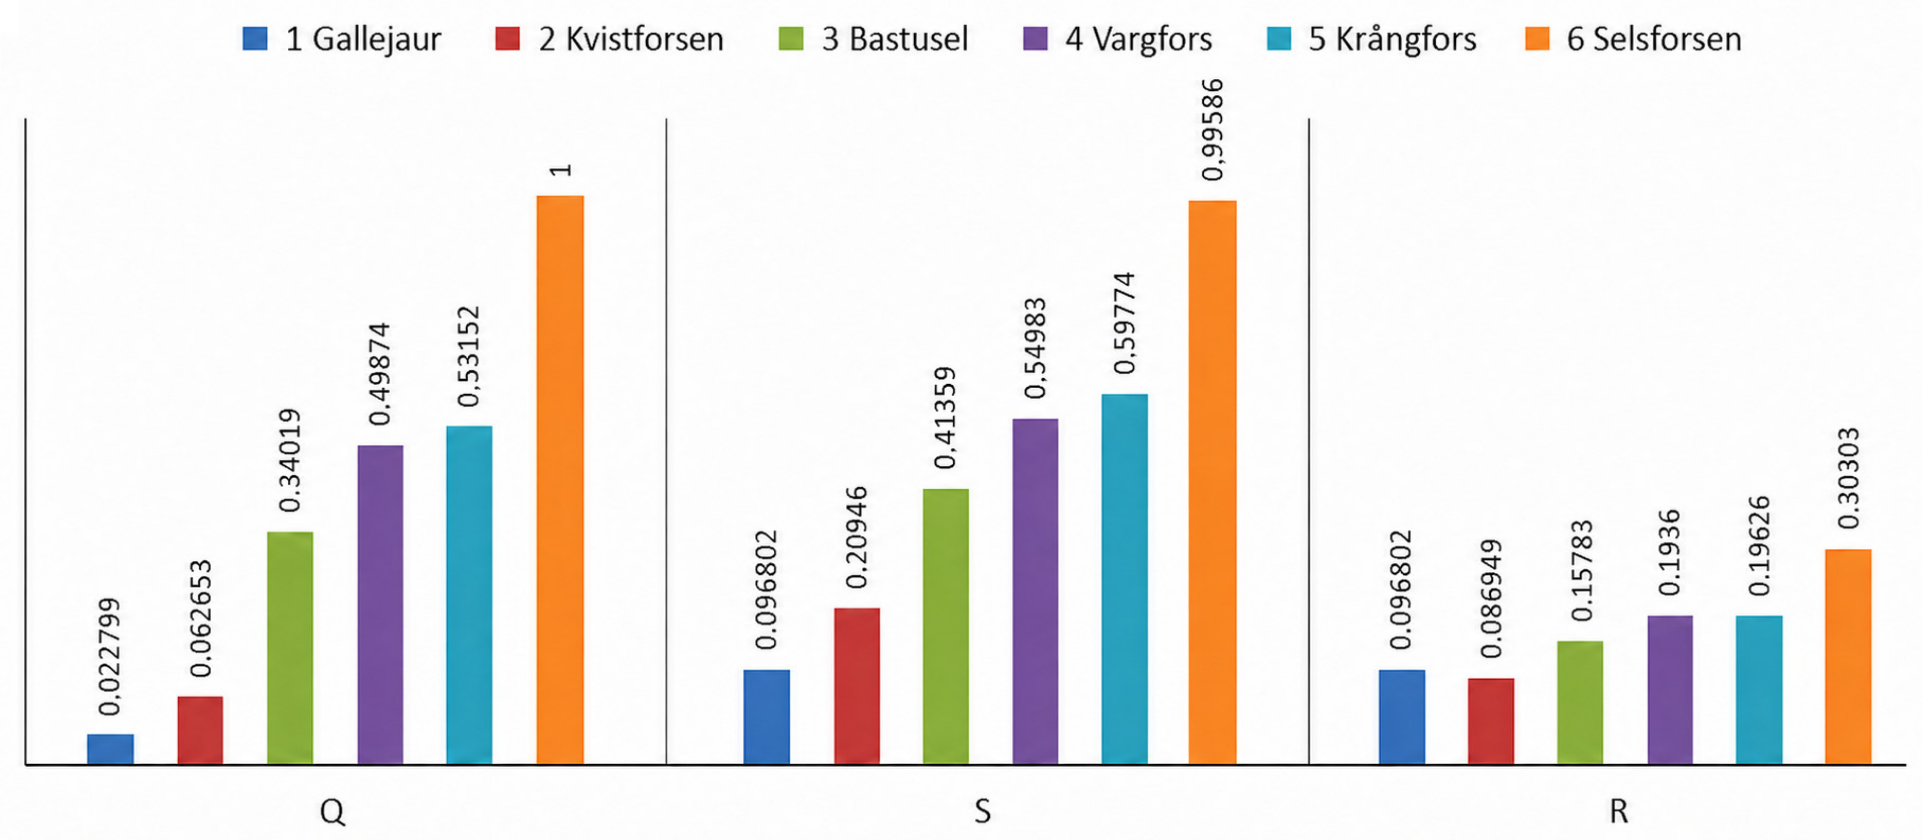
The ranked values of Q, R and S are prioritized from 0 to 1 for the results, and the alternative with the lowest Q value is ranked first in the VIKOR framework. The VIKOR compromise conditions were also checked. For six alternatives, the acceptable advantage threshold is DQ = 1/(m − 1) = 0.20. The difference between the two lowest Q values is Q(Kvistforsen) − Q(Gallejaur) = 0.062653 − 0.022799 = 0.039854, which is smaller than DQ. Therefore, the acceptable advantage condition is not satisfied. The acceptable stability condition is satisfied because Gallejaur, the first-ranked alternative by Q, is also the best-ranked alternative by S. Consequently, the results should be interpreted as a leading set of close compromise alternatives, particularly Gallejaur and Kvistforsen, rather than as one unique final best option.
4. Discussion
4.1. Evaluation of the Obtained Results from Table 9
Based on the obtained values for the Q, R and S factors and their prioritization according to Table 9, the results are summarized in Figure 3.
Figure 3.
Ranking of hydropower plants along the Skellefte River with their Q, R and S factor values.
According to the VIKOR methodology, the case study or hydropower alternative with the lowest Q value indicates the most appropriate compromise solution, considering both overall performance (S) and individual regret (R). Based on this fact, Gallejaur, Kvistforsen, and Bastusel are ranked as the top three hydropower plants, while Vargfors, Krångfors, and Selsforsen got lower rankings. Due to several hydropower indicators being physically related, the result is interpreted as a composite technical performance ranking rather than a set of fully independent criteria.
4.2. Top-Ranked Hydropower Plants
Gallejaur obtained the highest rank because it performs strongly across several technical criteria, including the highest installed capacity, the largest hydraulic head, and the highest normal annual electricity production among the selected hydropower plants. These high values will reduce both the utility distance (S) and the regret measure (R), and in total will result in the lowest overall VIKOR index of Q.
Kvistforsen, in second place, has the same advantages as Gallejaur except for hydraulic head, but instead it shows a relatively large water flow through the turbines, which was the reason for it getting a higher rank than other alternatives. Its balanced performance across all criteria will make it a favorable solution for future expansion projects.
Finally, Bastusel, in third place, benefits mostly from its high hydraulic head, efficiency and stable annual production, although its installed capacity is lower than that of Gallejaur and Kvistforsen.
Overall, these top three ranked plants are characterized by higher annual energy production and larger hydraulic head.
4.3. Lower-Ranked Hydropower Plants
Vargfors, Krångfors, and Selsforsen are ranked lower due to limitations in one or more key criteria. Vargfors, despite having a moderate installed capacity, has lower annual production compared to the high-ranked hydropower plants, which increases its utility distance (S). Krångfors is limited by its low installed capacity and low hydraulic head, reducing its overall technical performance. The lower ranking of Krångfors should not be interpreted as evidence that it lacks practical development value. Krångfors is described earlier in the Krångfors section as a bottleneck with planned expansion, but the present decision matrix mainly reflects current plant-scale and production performance indicators. It does not include bottleneck-removal values, upstream–downstream balancing benefits, strategic owner priorities, permitting status, or local grid constraints. This illustrates why the ranking should not be used as a stand-alone refurbishment priority decision-maker.
Selsforsen reached the last rank because of its small hydraulic head, comparatively low average water flow, and limited annual electricity production.
4.4. General Implications of the Ranking
The results of the MCDM simulation demonstrate that hydropower plants with higher generation capacity, greater hydraulic head, and larger annual energy production are more suitable for infrastructure upgrading and future investment aimed at increasing hosting capacity or other purposes for power system expansion.
5. Conclusions
This study employed a multi-criteria decision-making (MCDM) framework based on the VIKOR method to evaluate and rank selected hydropower plants along the Skellefte River in northern Sweden. The initial purpose was to identify the plants with the highest technical potential for infrastructure upgrading or refurbishment. An important purpose of upgrading is the need for a higher hosting capacity of the transmission network for new consumption, wind power and solar power. In the MCDM framework, real and publicly available data have been used.
In this regard, six technical criteria were adopted for a common quantitative comparison: installed capacity, falling or hydraulic head, efficiency, cost of electricity generation, average water flow through the turbine, and normal annual energy production. As alternatives, six hydropower plants have been selected for decision-making evaluation, among the fifteen hydropower plants along the Skellefte River. All selected alternatives have more than 50 MW installed capacity.
The simulation results demonstrate that Gallejaur, Kvistforsen, and Bastusel are the most favorable and compatible solutions; their top rankings are attributed to their better overall technical performance, characterized by higher annual energy production, larger hydraulic heads, and stronger balanced performance across the criteria. Conversely, Vargfors, Krångfors, and Selsforsen ranked lower due to constraints in the common key technical parameters, such as lower installed capacity or reduced annual production, which led to higher measures of group utility (S) and individual regret (R) within the VIKOR framework index.
From a technical perspective, the results indicate that the entropy-weighted VIKOR workflow can serve as a preliminary technical screening tool for organizing available technical data and identifying hydropower plants that may deserve further feasibility assessment. However, the ranking should not be considered as the final refurbishment priority because this pre-feasibility study did not consider hydraulic cascade simulation, grid hosting capacity calculation, and environmental permitting. The methodology tries to effectively integrate multiple technical criteria into a single ranking framework, thereby supporting preliminary organization of available technical data for later feasibility assessment, particularly in hydraulically multi-interconnected or cascaded river systems like the Skellefte River.
Future work should extend the analysis by incorporating plant-specific refurbishment costs, operation and maintenance costs, reservoir operation, hydraulic coupling between cascaded stations, environmental and regulatory constraints and grid hosting capacity assessment. Such further extensions would allow the preliminary pre-feasibility ranking to be connected more directly to practical refurbishment feasibility planning and support long-term flexible power system integration to reach higher demand capacity.
Author Contributions
Conceptualization, F.K.; methodology, F.K.; software, F.K.; investigation, F.K.; writing—original draft preparation, F.K.; writing—review and editing, F.K. and M.H.J.B.; visualization, F.K.; supervision, M.H.J.B.; funding acquisition, M.H.J.B. All authors have read and agreed to the published version of the manuscript.
Funding
This research was funded by [Swedish Energy Agency] with grant number [P2023-00451] and [Kempe Foundation] with grant number [JCSMK23-0070].
Data Availability Statement
The original contributions presented in this study are included in the article. Further inquiries can be directed to the corresponding author.
Conflicts of Interest
The authors declare no conflicts of interest.
Correction Statement
This article has been republished with a minor correction to the Data Availability Statement. This change does not affect the scientific content of the article.
References
- Huertas-Hernando, D.; Farahmand, H.; Holttinen, H.; Kiviluoma, J.; Rinne, E.; Söder, L.; Milligan, M.; Ibanez, E.; Martínez, S.M.; Gomez-Lazaro, E.; et al. Hydro power flexibility for power systems with variable renewable energy sources: An IEA Task 25 collaboration. WIREs Energy Environ. 2016, 6, e220. [Google Scholar] [CrossRef] [Scilit]
- Xylia, M.; Bin Asraf, F.; Rudberg, P.M.; Barquet, K.; Han, G. Keeping the Flow: Hydropower, River Ecosystems and Governance in Northern Sweden; SEI report; SEI: Stockholm, Sweden, 2024. [Google Scholar] [CrossRef] [Scilit]
- Sweden–Towards 100% Renewable Energy. Available online: https://www.andritz.com/hydro-en/hydronews/hn-europe/sweden (accessed on 11 March 2025).
- Nordic Grid Development Perspective 2023. Available online: https://www.svk.se/siteassets/2.utveckling-av-kraftsystemet/internationellt-samarbete/ngdp/questions-from-the-webinar.docx.pdf (accessed on 26 March 2025).
- Assad, A.A.; Gass, S.I. Profiles in Operations Research Pioneers and Innovators; Springer: New York, NY, USA, 2011. [Google Scholar] [CrossRef] [Scilit]
- Katal, F.; Fazelpour, F. Multi-criteria evaluation and priority analysis of different types of existing power plants in Iran: An optimized energy planning system. Renew. Energy 2018, 120, 163–177. [Google Scholar] [CrossRef] [Scilit]
- Al-Ani, I.A.; Al-Thamery, H.A.; Al-Ansari, N.; Al-Janabi, A.M.S.; Mohtar, W.H.W. Multi Criteria Decision Making to Optimize the Best Runoff Control Measures for the Haditha Dam Reservoir, Iraq. J. Environ. Hydrol. 2020, 28, 1–14. [Google Scholar]
- Bosona, T.G.; Gebresenbet, G. Modeling hydropower plant system to improve its reservoir operation. Int. J. Environ. Eng. 2010, 2, 87–94. [Google Scholar]
- Adhikary, P.; Kundu, S. MCDA or MCDM Based Selection of Transmission Line Conductor: Small Hydropower Project Planning and Development. Int. J. Eng. Res. Appl. 2014, 4, 357–361. [Google Scholar]
- Wang, J.-J.; Jing, Y.-Y.; Zhang, C.-F.; Zhao, J.-H. Review on multi-criteria decision analysis aid in sustainable energy decision-making. Renew. Sustain. Energy Rev. 2009, 13, 2263–2278. [Google Scholar] [CrossRef] [Scilit]
- Skellefte River. Available online: https://en.wikipedia.org/wiki/Skellefte_River (accessed on 22 July 2025).
- VattenKraft. Available online: https://vattenkraft.info/ (accessed on 9 May 2025).
- Gallejaur. Available online: https://powerplants.vattenfall.com/gallejaur/ (accessed on 22 July 2025).
- Power Plant Profile: Gallejaur, Sweden. Available online: https://www.power-technology.com/data-insights/power-plant-profile-gallejaur-sweden/ (accessed on 22 July 2025).
- Kvistforsen Hydropower Plant. Available online: https://www.statkraft.com/Global-presence/sweden/kvistforsen-hydropower-plant/ (accessed on 22 July 2025).
- Kraftwerk Vargfors. Available online: https://de.wikipedia.org/wiki/Kraftwerk_Vargfors (accessed on 22 July 2025).
- Vargfors. Available online: https://powerplants.vattenfall.com/vargfors/ (accessed on 22 July 2025).
- Power Plant Profile: Vargfors, Sweden. Available online: https://www.power-technology.com/data-insights/power-plant-profile-vargfors-sweden/ (accessed on 22 July 2025).
- Bastusel Kraftverk. Available online: https://sv.wikipedia.org/wiki/Bastusel_kraftverk (accessed on 23 July 2025).
- Bastusel. Available online: https://fiskevatten.vattenfall.com/bastusel/ (accessed on 23 July 2025).
- Kraftwerk Krångfors. Available online: https://de.wikipedia.org/wiki/Kraftwerk_Kr%C3%A5ngfors (accessed on 23 July 2025).
- Major Investments in Krångfors and Granfors. Available online: https://www.skekraft.se/om-oss/verksamhet/vattenkraft/krangfors/ (accessed on 23 July 2025).
- Selsfors Kraftstation. Available online: https://sv.wikipedia.org/wiki/Selsfors_kraftstation (accessed on 23 July 2025).
- Ahenkorah, A.; Caceres Rodriguez, R.; Devernay, J.-M.; Liu, Z. Hydropower. In IPCC Special Report on Renewable Energy Sources and Climate Change Mitigation; Chapter 5; Cambridge University Press: Cambridge, UK; New York, NY, USA, 2011. [Google Scholar]
- Kang, D.; Lee, D.H. Energy and environment efficiency of industry and its productivity effect. J. Clean. Prod. 2016, 135, 184–193. [Google Scholar] [CrossRef] [Scilit]
- International Energy Agency (IEA). Projected Costs of Generating Electricity 2020; OECD Publishing: Paris, France, 2020; Available online: https://www.iea.org/reports/projected-costs-of-generating-electricity-2020 (accessed on 25 July 2025).
- NEA. A Least-Cost Capacity Mix to Satisfy Growing Electricity Demand Without Carbon Emissions in Sweden; OECD Publishing: Paris, France, 2026. [Google Scholar]
- IEA. Hydropower Special Market Report; IEA: Paris, France, 2022; Available online: https://www.iea.org/reports/hydropower-special-market-report (accessed on 25 July 2025).
- Opricovic, S.; Tzeng, G.-H. Compromise solution by MCDM methods: A comparative analysis of VIKOR and TOPSIS. Eur. J. Oper. Res. 2004, 156, 445–455. [Google Scholar] [CrossRef] [Scilit]
- Opricovic, S.; Tzeng, G.-H. Extended VIKOR method in comparison with outranking methods. Eur. J. Oper. Res. 2007, 178, 514–529. [Google Scholar] [CrossRef] [Scilit]
- Yari, M.; Jamali, S.; Abdullah, G.M.S.; Ahmad, M.; Badshah, M.U.; Najeh, T. Development a risk assessment method for dimensional stone quarries. Sci. Rep. 2024, 14, 21582. [Google Scholar] [CrossRef] [Scilit] [PubMed]

Disclaimer/Publisher’s Note: The statements, opinions and data contained in all publications are solely those of the individual author(s) and contributor(s) and not of MDPI and/or the editor(s). MDPI and/or the editor(s) disclaim responsibility for any injury to people or property resulting from any ideas, methods, instructions or products referred to in the content. |
© 2026 by the authors. Licensee MDPI, Basel, Switzerland. This article is an open access article distributed under the terms and conditions of the Creative Commons Attribution (CC BY) license.