


Abstract
Brazilian hydropower plants have been facing increasing challenges during periods of hydrological instability associated with climate change, making adaptation imperative. One promising approach to achieving adaptation is to learn from nature, given its inherent capacity for adaptability and resilience to environmental change. Accordingly, this study proposes an integrated framework that combines Animal Decision-Making (ADM) theory with a successful example of natural adaptation, namely Amazon rainforest ant colonies. The proposed methodology comprises the following stages: (1) identification; (2) definition; (3) alternative generation; (4) solution selection; and (5) implementation and testing. A simulated case study and a real-world case study involving the Ponte de Pedra Hydropower Plant, located in the state of Mato Grosso, Brazil, were investigated. Human operators and ant colonies exhibited similar probabilities of shifting towards adaptation (human operators, pR = 0.7088; ant colonies, pR = 0.7091). However, the adaptation strategy adopted by the ant colonies proved to be more focused, concentrating on a smaller number of performance areas. Human operators identified Operation and Maintenance (O&M), Finance, and Plant as the most affected performance areas, with similar levels of importance (12%, 11%, and 11%, respectively). In contrast, the ant colonies prioritised O&M, Plant, and Environmental Impact, with corresponding importance levels of 18%, 13%, and 10%, respectively. Furthermore, the ant colonies demonstrated a dynamic and integrated decision-making strategy that prioritised different activities according to local environmental conditions. Future research should focus on evaluating, calibrating, and validating the proposed framework using historical data.
1. Introduction
Climate change has significantly impacted hydraulic structures, including water supply systems, drainage systems, and power generation facilities. In response, the scientific community has undertaken efforts to mitigate these impacts and adapt infrastructure for operation in adverse environmental conditions. Motivating factors for hydraulic structures in energy generation include: reliance on substantial and predictable surface water flows, making structures vulnerable to climate change [1]; meeting energy demand and the instability of hydrological conditions, which has led hydroelectric plants to operate under extreme conditions [2]; inefficiency and ineffectiveness of hydraulic works when operated under extreme conditions [3]; the need to further analyse the impacts of climate change at the subnational or local scale for hydroelectric generation [4]; and the imperative need to adapt hydroelectric plants to climate change (adaptive management) and their demand for decision-support information. Some studies on the issue are briefly presented below.
The impact of climate change on hydropower plants indicates significant changes in rainfall volumes, seasonal distribution, and duration [5,6,7]. Reported reductions in hydropower generation potential range from 30% to 95% [5,6,7,8,9]. Representative examples include the Gumti Hydroelectric Power Plant, located on the Gumti River in the state of Tripura, India, where power generation declined from 8–9 MW during the monsoon season to 0.5 MW during the dry season [5]. Similarly, in the province of Manitoba, Canada, hydropower generation potential is projected to decrease by up to 35% and 37% over the periods 2021–2050 and 2041–2070, respectively [6].
A study on the impact of climate change on hydroelectric plants in Latin America indicated that changes in temperature and precipitation patterns could pose a challenge to hydroelectric power generation in Latin America, increasing variability in river flows, altering seasonal flows, and increasing evaporation losses from reservoirs [10]. The increase in temperature, fluctuations in precipitation patterns, and the rise in extreme weather events have significant impacts on flow rates and water availability, affecting hydroelectric power generation [10]. Greater resilience for infrastructure, such as the construction of multi-purpose reservoirs, has been suggested as a solution. Additionally, a combination of both soft and hard resilience measures has been proposed, which should be tailored to each case [10].
In another study, several General Circulation Models (GCMs) were employed to project future climatic conditions, with the HadGEM3-GC31-MM model being selected due to its superior performance [7]. The results indicated that climate change could reduce river streamflow by 4.7% under the optimistic scenario and by 20.1% under the pessimistic scenario. Hydropower generation is expected to decline significantly, with total energy production projected to decrease by 29.5%, resulting in substantial economic impacts estimated at approximately USD 3.47 million per year.
In line with these studies, Brazilian hydroelectric plants have encountered significant challenges during periods of hydrological instability. The National Centre for Monitoring and Early Warning of Natural Disasters has indicated that several hydroelectric basins are experiencing severe, extreme, and exceptional drought conditions, including regions such as: the north (Santo Antônio, Belo Monte, and Jirau hydroelectric plants); between the north and central-west (Tucuruí hydroelectric plant); central-west (Serra da Mesa hydroelectric plant); the southeast (Furnas and Três Marias hydroelectric plants); between the south and southeast (Nova Ponte, Itaipu, Jurumirim, Porto Primavera, Capivara, Emborcação, Itumbiara, Marimbondo, and Rosana hydroelectric plants) [11]. Severe drought has caused large Amazonian hydroelectric plants (Santo Antônio, Jirau, and Belo Monte) to operate at less than 10% of their capacity [8].
In the state of Mato Grosso, Brazil, the Manso hydroelectric plant operated at 25% of its capacity due to the worst water crisis in the past 90 years [9]. The lack of rainfall leads to energy shortages in hydroelectric plants, preventing them from generating power, requiring thermal plants to be activated, thus adding extra costs to electricity bills [9]. A study on rainfall anomalies (from 1998 to 2021) for the state of Mato Grosso showed 16 years with positive rainfall anomalies (above-average rainfall) and 18 years with negative rainfall anomalies (below-average rainfall) [12]. A reversal in precipitation patterns was identified in the state of Mato Grosso: the first half of the 34-year period (1988–2004) was marked by more dry years, while the second half (2005–2021) saw an increase in wet years [12]. In other words, a hydrological instability was observed, which is currently manifested as a drought affecting the operation of hydroelectric plants in the state of Mato Grosso. Another study investigating the rainy season in the state of Mato Grosso—widely recognised as Brazil’s leading agricultural region—attributed the region’s success to the prolonged duration of the rainy season, which has enabled the widespread adoption of the double-cropping system [13]. Based on simulations performed using the Community Earth System Model (CESM), the study identified a concerning trend of declining rainfall volumes, a delayed onset of the rainy season, and a shortening of its duration [13]. These findings highlight a significant threat to ecosystems, intensive agriculture based on the double-cropping system, and hydropower generation, thereby reinforcing the urgent need to implement effective climate change adaptation measures.
In this context, efforts aimed at adapting to the impacts of climate change on hydroelectric operations are of great importance. One pathway to achieving adaptation is learning from nature, as its great adaptability and resilience to environmental changes are among its basic characteristics [14]. Nature provides successful examples of adaptation to abrupt environmental changes to solve everyday problems (e.g., locating food and water, nest building, labour division among individuals, and others). This adaptive capacity is directly linked to the ability to share information—particularly, communicating food resource locations—and to remember previously explored sites to select those with higher yields [15]. In other words, knowledge of the local environmental impact on the best output defines management strategies adopted by nature. In this regard, the aim is to understand the impacts of climate change on key performance indicators of hydroelectric plants (best performance). Consistent with previous work that drew inspiration from nature to improve hydraulic installations in hydropower plants [16], the present study proposes an innovative approach that integrates Animal Decision-Making (ADM) theory with a well-established example of adaptive success observed in nature. This approach extends the scope of the predominant strategies reported in the literature on the impacts of climate change on hydropower systems by introducing a biomimetic decision-support mechanism specifically designed to facilitate the operational adaptation of hydropower plants. Previous studies have predominantly focused on hydrological projections, climate risk assessments, and analyses of changes in hydropower generation potential. In general, these studies seek to answer questions such as: to what extent will climate change reduce hydropower generation and what will be the associated economic impacts [7]? Or, how can future hydropower production be predicted under different climate scenarios [17]? Whilst these approaches provide valuable insights into the impacts of climate change on hydropower systems, they offer limited support for operational decision-making within a hydropower plant experiencing hydrological instability. In this context, the proposed model introduces a biomimetic decision-making mechanism explicitly designed to support the operation, management, and adaptation of hydropower plants. Rather than focusing exclusively on forecasting climate impacts or energy production, the proposed model seeks to address the following question: which hydropower plant performance indicators should be prioritised when the facility is operating under conditions of hydrological instability?
Specifically, a decision-support model based on a Two-Alternative Forced Choice (2AFC) framework is developed, drawing on the adaptive behaviour of leaf-cutter ant colonies in the Amazon rainforest. The 2AFC approach differs fundamentally from Ant Colony Optimisation (ACO). In the 2AFC framework, a forced choice is made between two alternatives, with the method being grounded in the reproduction of behaviours observed in animals. It has been widely employed in fields such as psychophysics, neuroscience, and experimental psychology [18,19,20]. In contrast, ACO aims to identify optimal solutions to combinatorial optimisation problems by drawing inspiration from the foraging behaviour of ant colonies [21,22]. This method is commonly applied in computer science, operations research, and artificial intelligence. The 2AFC approach enables a qualitative–quantitative and operationally driven identification of the key performance indicators most affected under conditions of hydrological instability, thereby providing direct guidance for prioritising concrete adaptation actions—an aspect that remains largely unexplored in current hydropower and climate change studies.
2. Theoretical Background
The key foundations of this work include the following topics: hydrological instability in the state of Mato Grosso (Brazil) [9,12,13,23]; key performance indicators in hydroelectric plants [24,25,26]; biomimetics and bioinspiration [14,18,19,20,27,28,29,30,31]; collaborative animals [15,32,33,34,35,36,37,38,39,40]; Two-Alternative Forced Choice (2AFC) [18,19,20,40,41,42] and Herfindahl–Hirschman Index (HHI) [43,44].
Further information (including references, data, and other materials) regarding the topics listed above is available in the Supplementary Material—Part S1.
3. Methodology
The proposed methodology includes the following steps: (1) identification; (2) definition; (3) alternative generation; (4) choice of solution; (5) implementation and testing, according to the literature [27,28].
For identification (Step 1), it is proposed to describe the problem focusing on providing the proper formalisation of it. This step aims to acquire definitions and concepts that support the mathematical modelling of the problem of identifying the impacts of climate change on the key performance indicators of hydropower plants.
For the definition (Step 2), a set of problem constraints (parameterisation) was adopted. The set of constraints considered the literature and consulted operators of hydropower plants (engineers, managers, maintenance staff, regulatory agents, and environmental analysts).
Following Steps 1 and 2, the problem and its operating environment can be translated into a biological context. In biomimetic studies, a question is typically formulated and directed towards nature in order to explore how a particular function has been achieved [27]. In the present study, the question is as follows: how does a collaborative and production-oriented organisation overcome significant environmental changes? Addressing this question meets a typical requirement of a hydropower plant, which is composed of multiple performance areas and must operate under conditions of hydrological instability [8,9]. One possible answer can be found in the context of leaf-cutter ant colonies in the Amazon rainforest. These colonies, which are organised into specialised castes, have demonstrated a remarkable capacity to adapt, survive, and grow in environments subject to significant environmental change [15,32,45]. It can readily be observed that, although the scales, functions, and processes encountered in nature differ from those found in engineered systems, the underlying design constraints and objectives are essentially the same [29]. Both systems seek to maintain functionality, optimise resource allocation, and ensure long-term survival under changing environmental conditions. Accordingly, to generate the alternatives (Step 3), an analogy was established between the organisational structure of leaf-cutter ant colonies in the Amazon rainforest and the operational structure of a hydropower plant.
Several Multiple-Criteria Decision-Making (MCDM) methods, as well as hybrid approaches, can be used to identify and prioritise [46] the impacts of climate change on the Key Performance Indicators (KPIs) of hydropower plants. Representative examples include the Analytic Hierarchy Process (AHP), PROMETHEE, TOPSIS, and ELECTRE. The Two-Alternative Forced Choice (2AFC) method was adopted as a way to identify the impacts of climate change on the KPIs of the hydropower plant. The 2AFC method constitutes one of the most established approaches for investigating in Animal Decision-Making (ADM) [20]. Therefore, the interest in reproducing these decision-making mechanisms within a biomimetic context provides a justification for its adoption. In turn, the alternative sets of weights (w1, w2, …, wn) were obtained by analogy between the importance values of the leaf-cutter ant colony and the KPIs of the hydropower plant. The importance values were obtained based on the demographic distribution of colony members, which are directly adaptive [30]. In this case, what matters is the percentage of soldiers, nurses, worker ants, and so on, available to deal with contingencies and keep the colony as safe as possible until the point of maximum queen and male production [30]. The importance values (w1, w2, …, wn) obtained through consultations with operators and analysts from government institutions of hydropower plants also formed the alternatives. Experts were selected according to the following criteria: demonstrated professional experience in the field of hydropower plant operation, regulation, and control; previous experience in operating hydropower plants under conditions of hydrological instability; and participation in decision-making processes related to the adaptation of hydropower plants to hydrological instability. Data were collected through a structured process comprising: (1) an invitation to participate in the study and contribute relevant operational data; (2) a presentation of the research objectives, methodology, and expected outcomes; and (3) the administration of a questionnaire designed to elicit expert judgements regarding the adaptation of hydropower plants to hydrological instability.
Whereas conventional MCDM approaches derive criterion weights from decision-makers, experts, stakeholders, or pairwise comparisons, the ADM approach derives them from knowledge of adaptive behaviour and biological fitness. Adaptation to dynamic environments is inherent to ADM but generally requires the updating of criterion weights in MCDM approaches. Nevertheless, further research, including experimentation, calibration, verification, and validation, is still required before systematic comparisons between the two approaches can be undertaken.
The Key Performance Indicators (KPIs) of the hydropower plant are presented in Table 1, according to the literature [24].
Table 1.
Key O&M performance indicators, by performance area.
For the solution selection (Step 4), a comparative analysis of the results (set of identified KPIs) of each alternative (2AFC model) was conducted. The criteria used for selecting the solution are [47,48]:
- Relevance—which set of identified impacts is the most important?
- Scope—which set of identified impacts covers the largest number of performance areas?
- Consistency—which set of identified impacts is coherent with existing scientific and practical knowledge?
A simulated case of a hydropower plant operating in a context of hydrological instability, obtained through consultation with O.HPP (operators and government regulatory agents of hydropower plants), was used for evaluation. The 2AFC model alternative that was most successful according to the criteria used was selected. Furthermore, in order to assess the quality of the responses, a sensitivity analysis, the determination of the Herfindahl–Hirschman Index (HHI) and dispersion statistics (minimum, maximum, range and standard deviation) were carried out. The sensitivity analysis aimed to evaluate the extent to which uncertainties in the input data (i.e., KPI values) influence the results produced by the model, thereby enabling the assessment of its robustness to variations in the input parameters. For the HHI, the objective was to evaluate the degree of concentration of the impacted performance areas, as a decision-making guide to concentration [43].
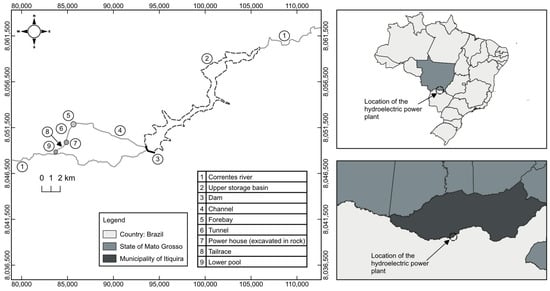
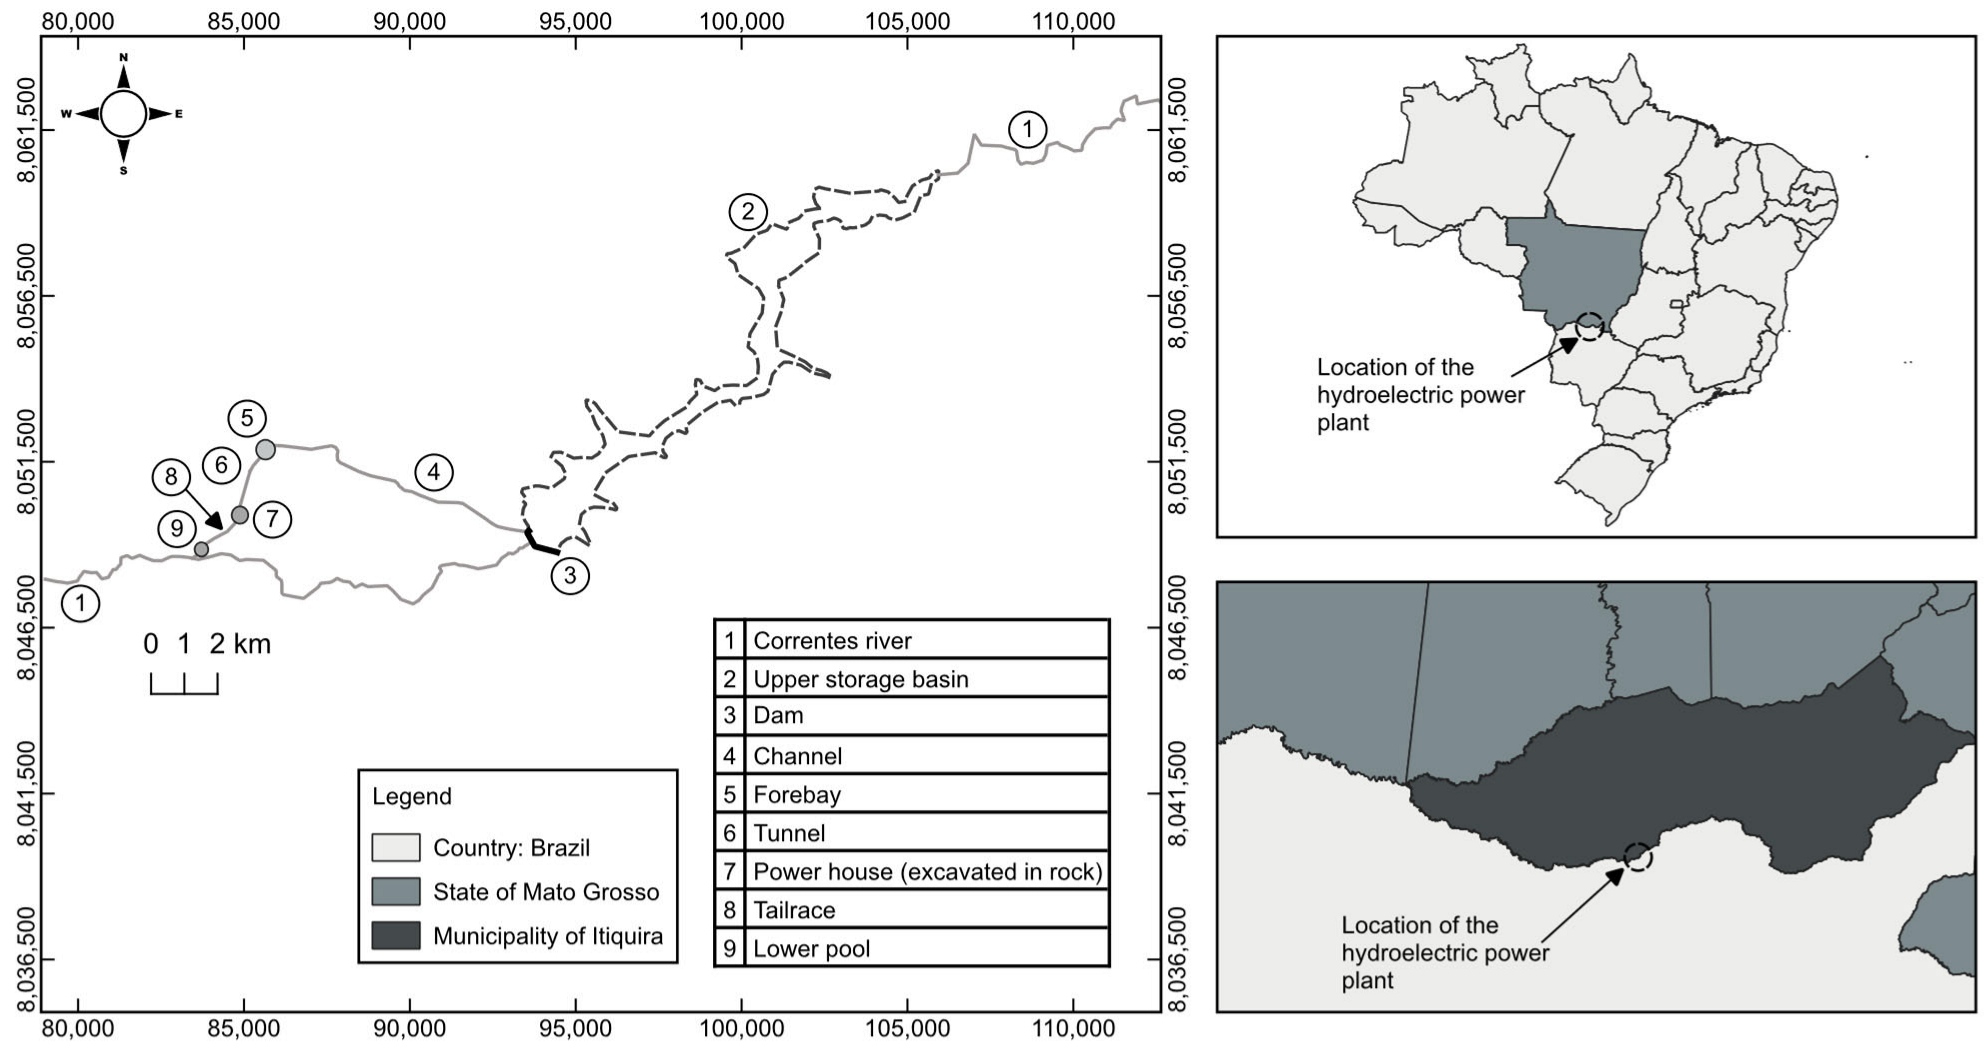
In the implementation and testing stage (Step 5), the developed model (chosen 2AFC model) was inserted into a calculation spreadsheet for easier sharing. In summary, the developed model should indicate, for any given case of a hydropower plant operating in a context of hydrological instability, which key performance indicators deserve concrete actions for adaptation (practical efforts for mitigation). Data from a real case of a Brazilian hydroelectric power plant (Case 1—Ponte de Pedra hydroelectric power plant, located in the municipality of Itiquira, state of Mato Grosso, Brazil, see Figure 1), obtained through consultation with O.HPP, was evaluated according to the chosen 2AFC model. The data were collected by the research team in collaboration with the O.HPP through a series of technical site visits (fieldwork) conducted between 1 May 2022 and 30 April 2023.
Figure 1.
Location hydroelectric power plant, Case 1.
4. Results and Discussion
In accordance with the approach proposed in the literature [27], this section is organised into two subsections. The first, referred to as abstraction, describes the model construction process and corresponds to the technology-to-biology transition (Steps 1–3). The second, referred to as specification, presents the application of the model and corresponds to the biology-to-technology transition (Steps 4 and 5).
4.1. Abstraction (Model Construction)
As a result of the identification (Step 1), it was found that there is a lack of knowledge, or insufficient knowledge, about the impacts of climate change on the operation of hydropower plants. More specifically, the problem is: what is the qualitative–quantitative impact (what type is it and what intensity?) of hydrological instability on the Key Performance Indicators (KPIi) of hydropower plants. The concepts adopted for qualitative impact, quantitative impact, and hydrological instability were:
- Qualitative impact—any modification or consequence that cannot be measured numerically, but is evaluated based on descriptions, qualities, or subjective characteristics caused by hydrological instability [24,49,50];
- Quantitative impact—any modification or consequence that can be numerically measured caused by hydrological instability [24,49,50];
- Hydrological instability—any occurrence of Rainfall Anomaly Index (RAI) values ≥ 3 (extremely wet) or RAI ≤ −3 (extremely dry) was considered as a period of hydrological instability [23].
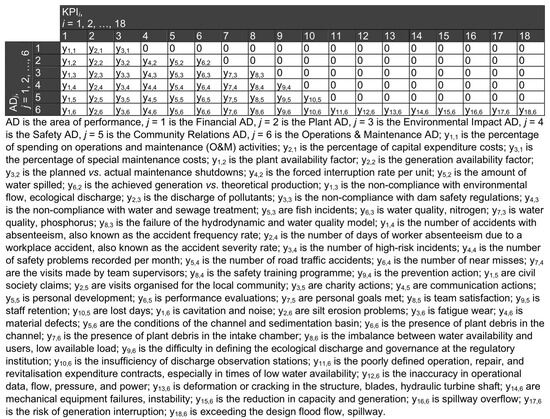
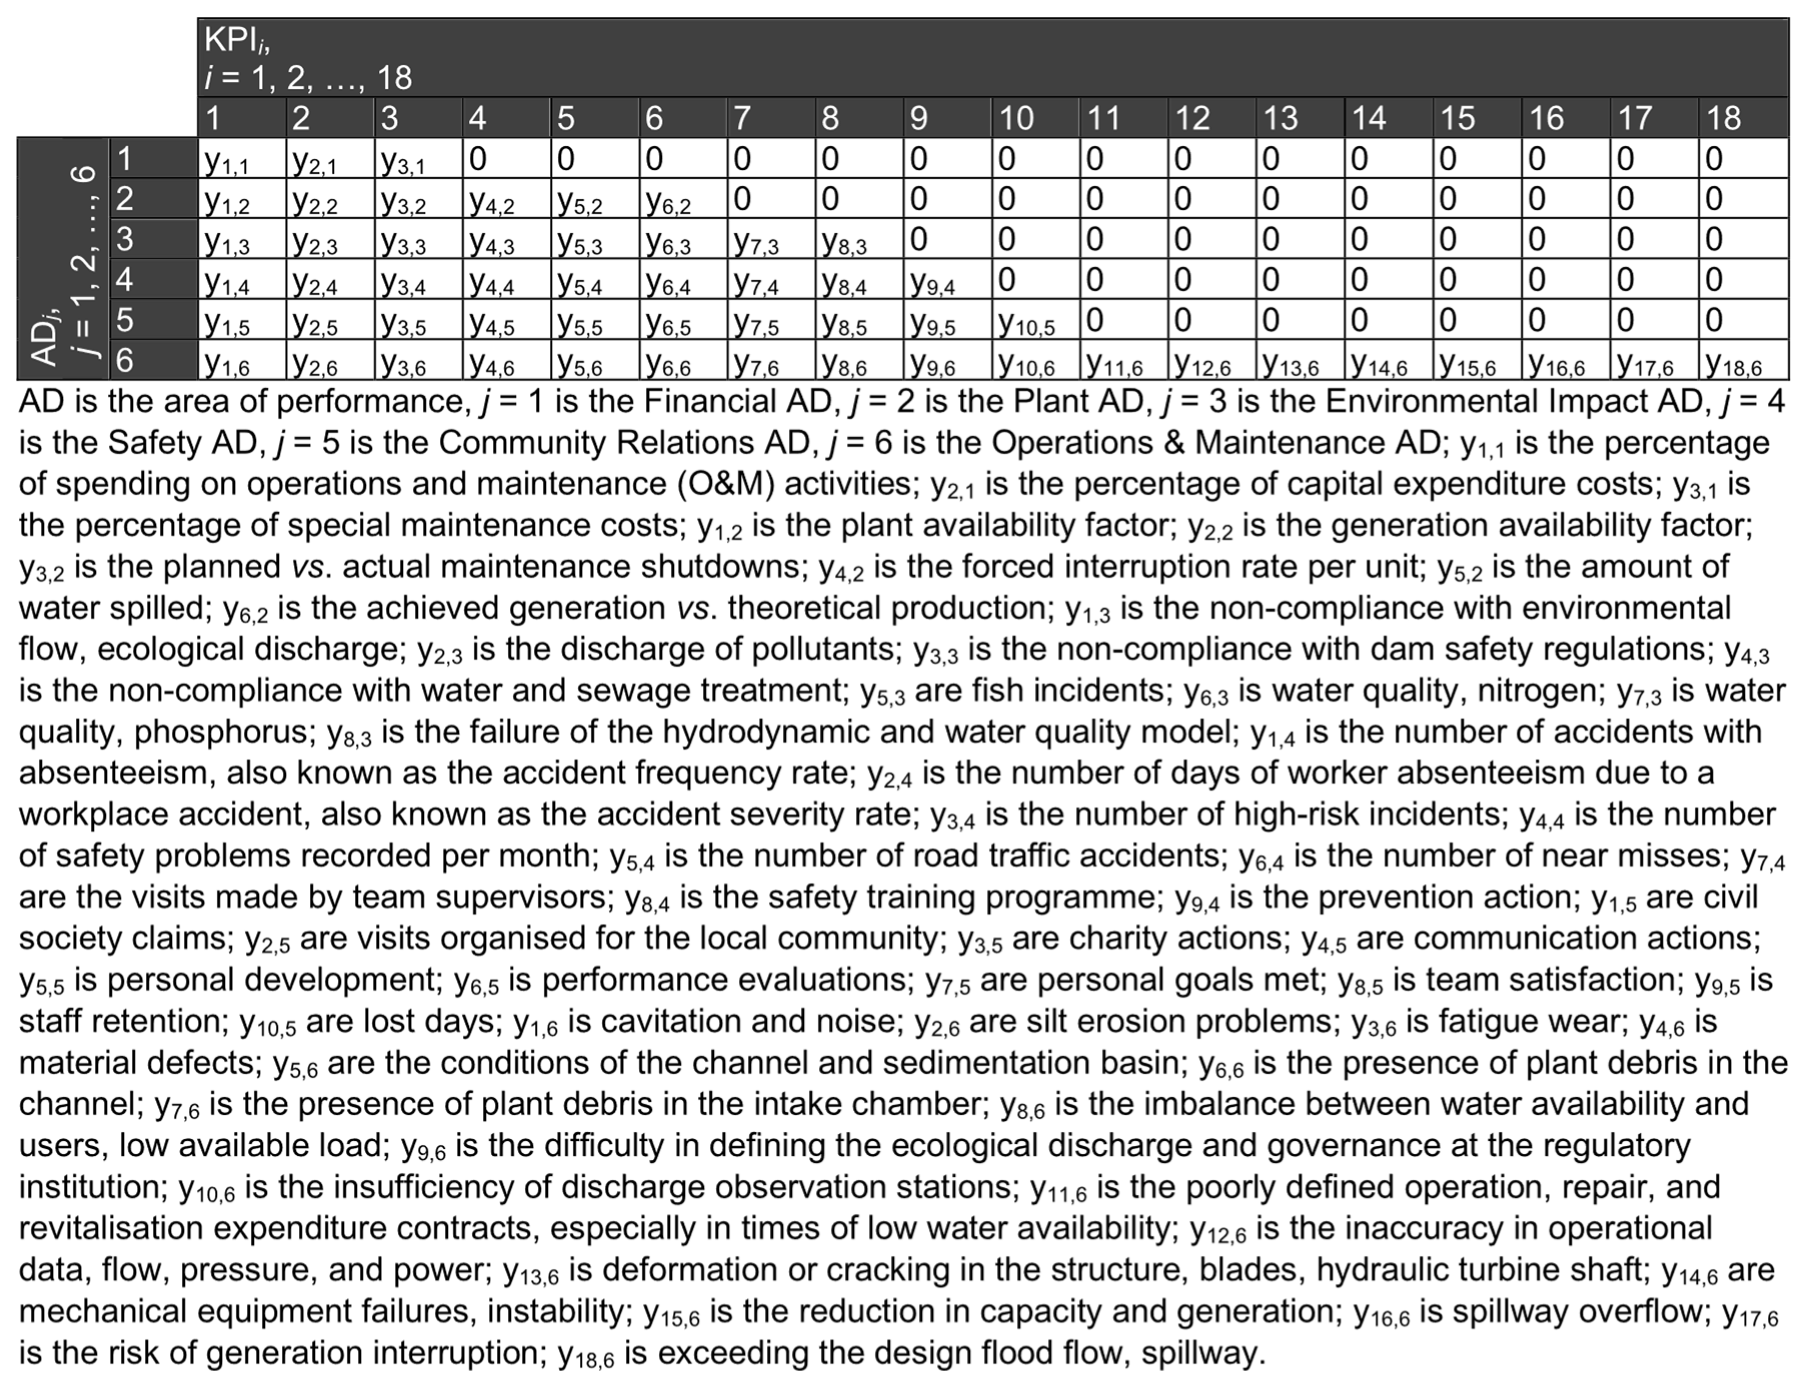
The mathematical modelling of the problem considered equations for calculating the Key Performance Indicators (KPIi) and RAI, in agreement with the literature [23,24,47]. A double index notation provides a convenient description for representing the grouping of KPIs, represented by KPIi,j, where the first index identifies the KPI and the second index provides the performance area, as shown in Figure 2.
Figure 2.
KPIi,j (i = 1, 2, …, m) and performance areas (j = 1, 2, …, n).
The set of constraints (parameterisation)—Step 2—is available in the Supplementary Material—Part S2. The general equation that relates the performance of KPIi,j and the intensity and type of impact is as follows:
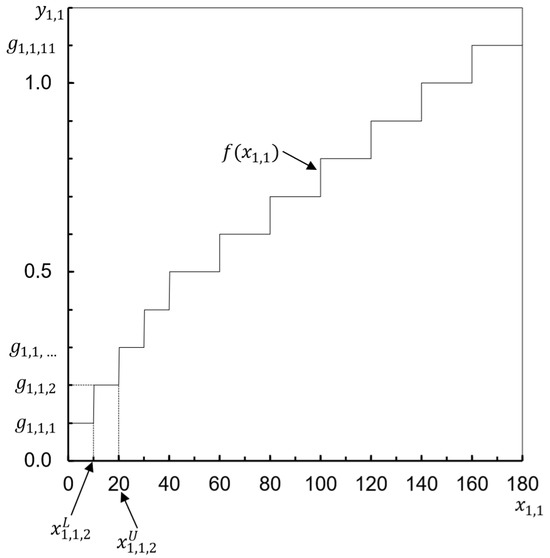
where: yi,j is the intensity of the impact of hydrological instability on KPIi, of performance area j; xi,j is the value of KPIi,j at a moment of hydrological instability; f(xi,j) is the piecewise linear membership function that relates the independent variable xi,j with the dependent variable yi,j; gi,j is the performance of yi,j when the value of xi,j is within the range of xLi,j,k to xUi,j,k; xLi,j,k is the lower bound parameter of xi,j, in the interval k; xUi,j,k is the upper bound parameter of xi,j, in the interval k.
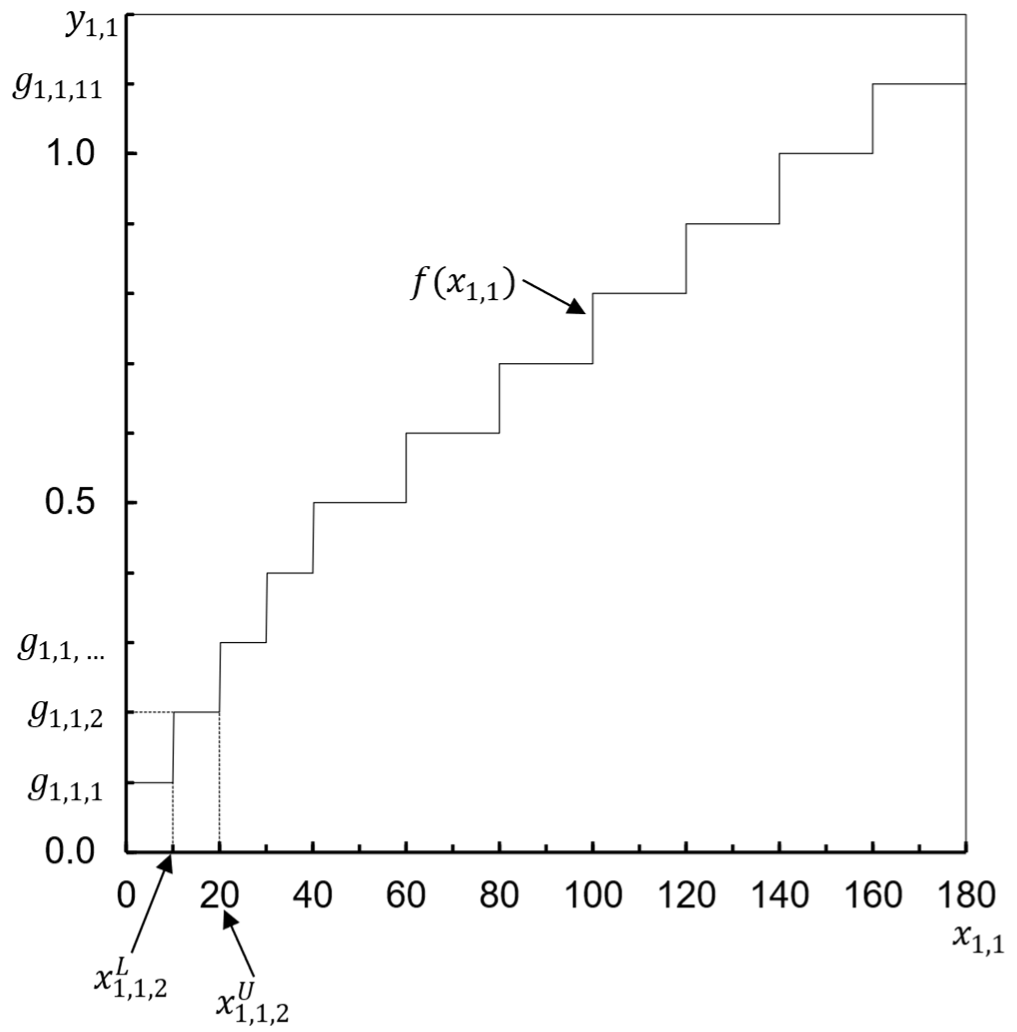
The function f(xi,j) was obtained from the literature and consultations with various operators of hydropower plants, as presented in the Supplementary Material—Part S2. For illustration, the function f(xi,j), for i = 1 and j = 1, and its graphical representation (Figure 3) are presented below.
where: x1,1 is the expenditure on O&M activities versus the O&M budget, expressed as a percentage.
Figure 3.
Graphical representation of the function f(xi,j), to i = 1 and j = 1; showing xL1,1,2, xU1,1,2 and g1,1,2.
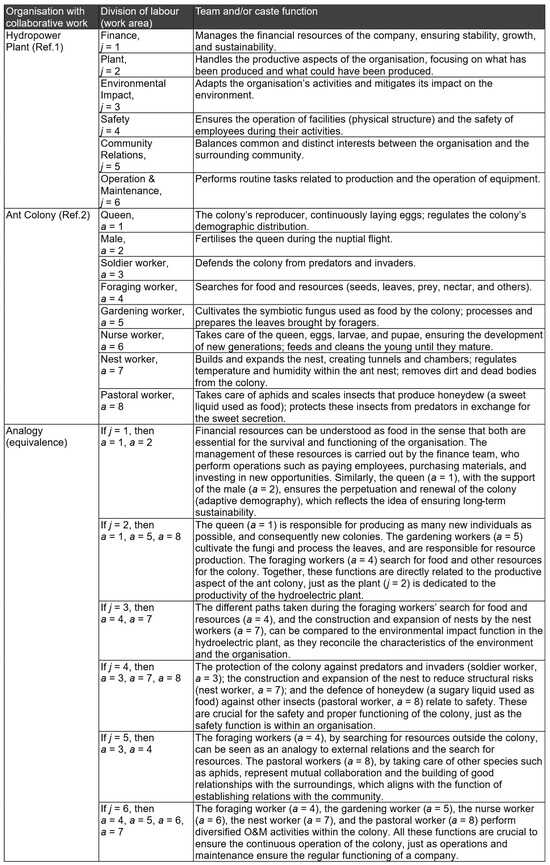
As a result of the generation of alternatives (Step 3), the analogy between the Amazonian leaf-cutter ant colony and the operation of a hydropower plant is presented in Figure 4.
Figure 4.
Analogy between ant colony and hydropower plant operation, Ref.1 [24,25], Ref.2 [30,34].
Although there appears to be a broad consensus among biologists that inspiration flows from biology to the engineering sciences, the roles played by the biological and non-biological sciences during the process of analogue transfer are less clearly defined [28]. This phenomenon has been referred to as cross-domain analogy [31]. The concretisation of ideas through cross-domain analogy may be grounded either in an analogue framework, through the adaptation of principles derived from biology, or in the abstraction, transfer, and application of knowledge from a specific biological system (biomimetics). In the present study, the idea that “a hydroelectric plant staffed by people who interact positively and with a strong spirit of cooperation is most likely to succeed” [25] underpins the analogy presented. Another aspect that supports the analogy is the operational system of leaf-cutter ant colonies, which is based on castes and organised like an assembly line [30]. In other words, an analogy between a successful hydroelectric plant and leaf-cutter ant colonies is possible [25,28,30,31].
The importance value of each work area for the ant colony was obtained from the adaptive demography; the greater the importance of the work area, the greater the number of workers in the caste. Adaptive demography is defined as the scheduled birth, growth, and death timelines of individuals, resulting in age and size frequency distributions among the colony members, which promote the survival and reproduction of the colony as a whole [30]. The calculation of the work area importance (wj,a) considered the frequency of each caste in the population of the leaf-cutter ant colony (Atta cephalotes), as per the literature [30]. The adaptive demography of the ant colony considered scenarios for a young colony (up to 2 years), 1; for an old colony (over 3 years), 2; for a young colony in a climate change environment, 3; and for an old colony in a climate change environment, 4 [30]. The scenario of a colony in a climate change environment was based on the effect of temperature increase, as follows [15,32,45,51]:
- Increased predation by insects; some species may carry small dead arthropods or decaying organic matter into the nest.
- Some species reduce their activity during warmer periods, which may affect the efficiency of resource collection.
- Foraging behaviour plasticity, adjusting the choice of trails and the foraging strategy according to environmental conditions (prioritising shaded regions).
- Task reallocation within the colony, altering the proportion of workers involved in different functions (smaller and younger ants may be less active at high temperatures, while larger ants may take on a more prominent role in foraging).
- Exposure to high temperatures may increase the mortality of workers and affect the development of larvae, reducing the colony’s growth rate.
Based on this evidence, the present study assumes that, under climate change conditions, the forager caste (a = 4) and the nest caste (a = 7) are assigned greater relative functional importance. Considering that gradual microevolutionary change represents the most parsimonious and biologically plausible inference for ant colonies [30], this adaptation was modelled by increasing the importance values of castes (a = 4 and a = 7) by 10%, while proportionally reducing the importance values of the neighbouring castes (a = 3, a = 5, a = 6, and a = 8) by 5%, thereby preserving the total importance assigned to the colony. It should be emphasised that these percentage changes constitute modelling assumptions, rather than empirically determined demographic parameters. Future studies incorporating observational or experimental data on the demographic and behavioural responses of different castes to climate change could be used to refine these weighting factors and further improve the biological realism of the proposed model.
For the colony’s adaptation to the increase in temperature, the highest importance values are assigned to the foraging worker (to overcome the reduction in collection activities) and to the nest worker (to mitigate internal temperature and prevent the development of larvae from being affected). Scenarios 1, 2, 3, and 4 are provided below:
where: c is the scenario identification; 1 is the young colony scenario; 2 is the old colony scenario; 3 is the young colony in a climate change environment scenario; 4 is the old colony in a climate change environment scenario; j is the line of the performance area; a is the column of the ant colony caste.
It can be observed that, for the young colony (c = 1), there is a concentration of importance values in the forager caste (a = 4), gardener caste (a = 5), and nest caste (a = 7). In old colonies (c = 2), importance is distributed among the soldier caste (a = 3), forager caste (a = 4), gardener caste (a = 5), and nest caste (a = 7). For both age groups, the shepherd caste (a = 8) and male caste (a = 2) have the lowest importance values. More information on how the importance values were obtained can be found in the Supplementary Material—Part S2.
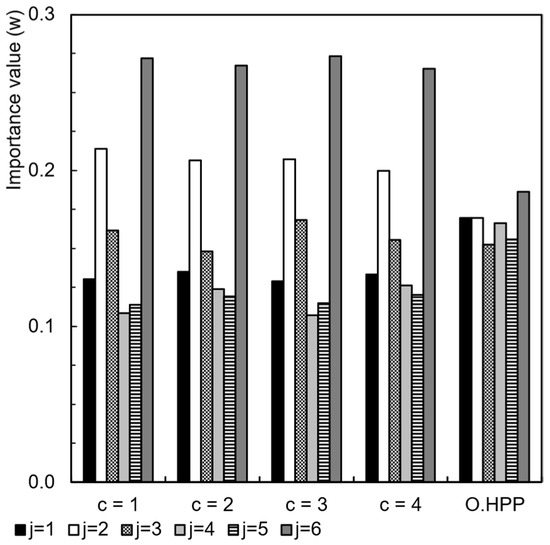
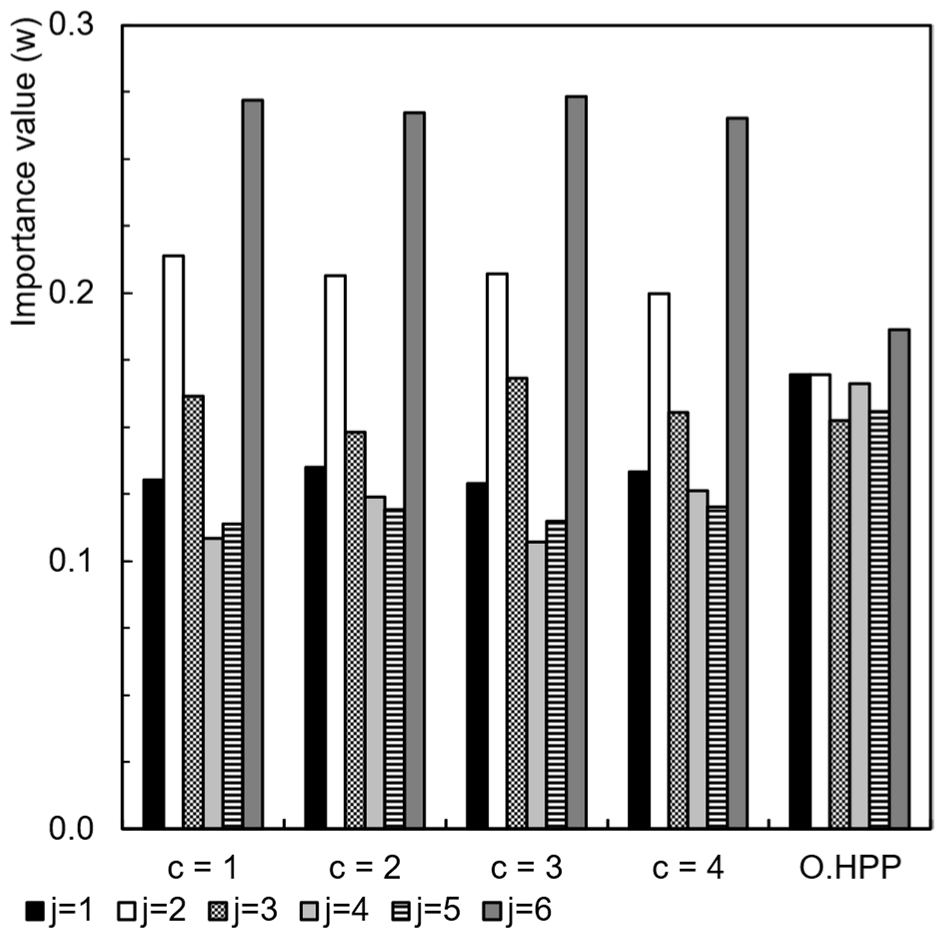
The set of importance values (w1, w2, …, wn) obtained for the ant colony (accumulated and normalised) and the hydroelectric plant (O.HPP) operators consulted are presented in Table 2 and Figure 5. Additional information regarding the importance values of the O.HPP can be found in the Supplementary Material—Part S2.
Table 2.
Importance values (weights) of the performance areas (wj).
Figure 5.
Normalised importance values (from 0 to 1).
For ant colonies, the performance areas with the highest importance are O&M (j = 6) and Plant (j = 2), while the areas of least importance are Safety (j = 4) and Community Relations (j = 5). For the hydropower plants (O.HPP), all areas are considered important (Figure 5), but O&M (j = 6), Financial (j = 1), and Plant (j = 2) hold a slightly higher importance. One question that stands out is: why do ant colonies focus their activities on two main areas, while O.HPPs distribute their activities across all areas? A possible explanation could be the focus, resulting from a collaborative effort that ensures minimum functional activities to achieve a specific mission. In the case of O.HPPs, it is common to encounter multiple focuses within their mission. Let us examine the missions found in the literature for both organisations:
- Ant colony: Generates the largest number of new colonies in the next generation, following the principle of adaptive demography [39];
- Hydropower plant: Generates electricity efficiently, safely, and sustainably, ensuring the availability of water resources, minimising environmental impacts, and promoting socio-economic benefits for local communities [24].
Naturally, this is a possible explanation, and there is still much to study, research, and prove to answer the question. By defining the importance values (weights), the 2AFC models were found, as follows:
where: xt is the linear coupling vector associated with the weight vector wt, used to determine the probability of the O.HPP making the “change to adapt” choice at the hydrological instability moment t; st is the vector of stimuli generated by the impact of hydrological instability on the performance areas; sj is the stimulus generated by the impact of hydrological instability on the performance area j, j = 1, 2, …, n; wt is the vector of importance values (weights) for the performance areas j, j = 1, 2, …, n; wb is the value of the independent bias of the stimulus in the direction of the “change to adapt” choice over the “do not change” choice (if wb = 0, then there is no stimulus; if 0 < wb < 1, then there is a stimulus; if wb = 1, then there is full stimulus); the value of wb = 0.3 was adopted, considering the resistance of the electricity sector to concrete adaptation actions, the strong defence of economic interests, and the hesitance to assume binding commitments, according to the literature [52,53,54]; xt,j is the linear coupling vector associated with the weight vector wt,j, used to determine the probability of the O.HPP making the “change to adapt” choice at the hydrological instability moment t; st,j is the vector of stimuli generated by the impact of hydrological instability on the KPI i, of the performance areas j, i = 1, 2, …, m, j = 1, 2, …, n; wt,j is the vector of importance values (weights) of the KPI i, for the performance areas j, i = 1, 2, …, m, j = 1, 2, …, n; wi,j is the importance value (weight) of the KPI i, for the performance area j, i = 1, 2, …, m, j = 1, 2, …, n.
The choice of wb = 0.3 was based on three complementary arguments. First, studies on climate governance indicate that mitigation and adaptation policies frequently face difficulties in establishing binding commitments, since climate action involves collective costs and an uncertain distribution of benefits, reducing incentives for rapid change and favouring gradual responses [52]. Second, research on socio-technical transitions in the electricity sector demonstrates that incumbent actors often resist structural transformations through political, institutional, economic and discursive mechanisms, generating inertia and delaying adaptation processes [53]. Third, studies on the Brazilian energy transition show that sectoral changes depend not only on technical feasibility but also on the interests of the stakeholders involved, institutional arrangements, private sector influence and political acceptance, factors that constrain the pace of adaptation and decarbonisation [54]. Future work could evaluate the robustness of results through sensitivity analysis of wb values.
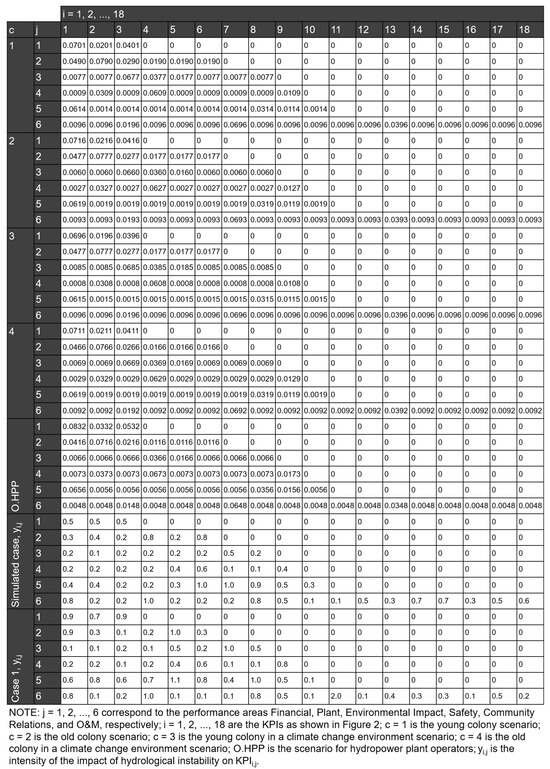
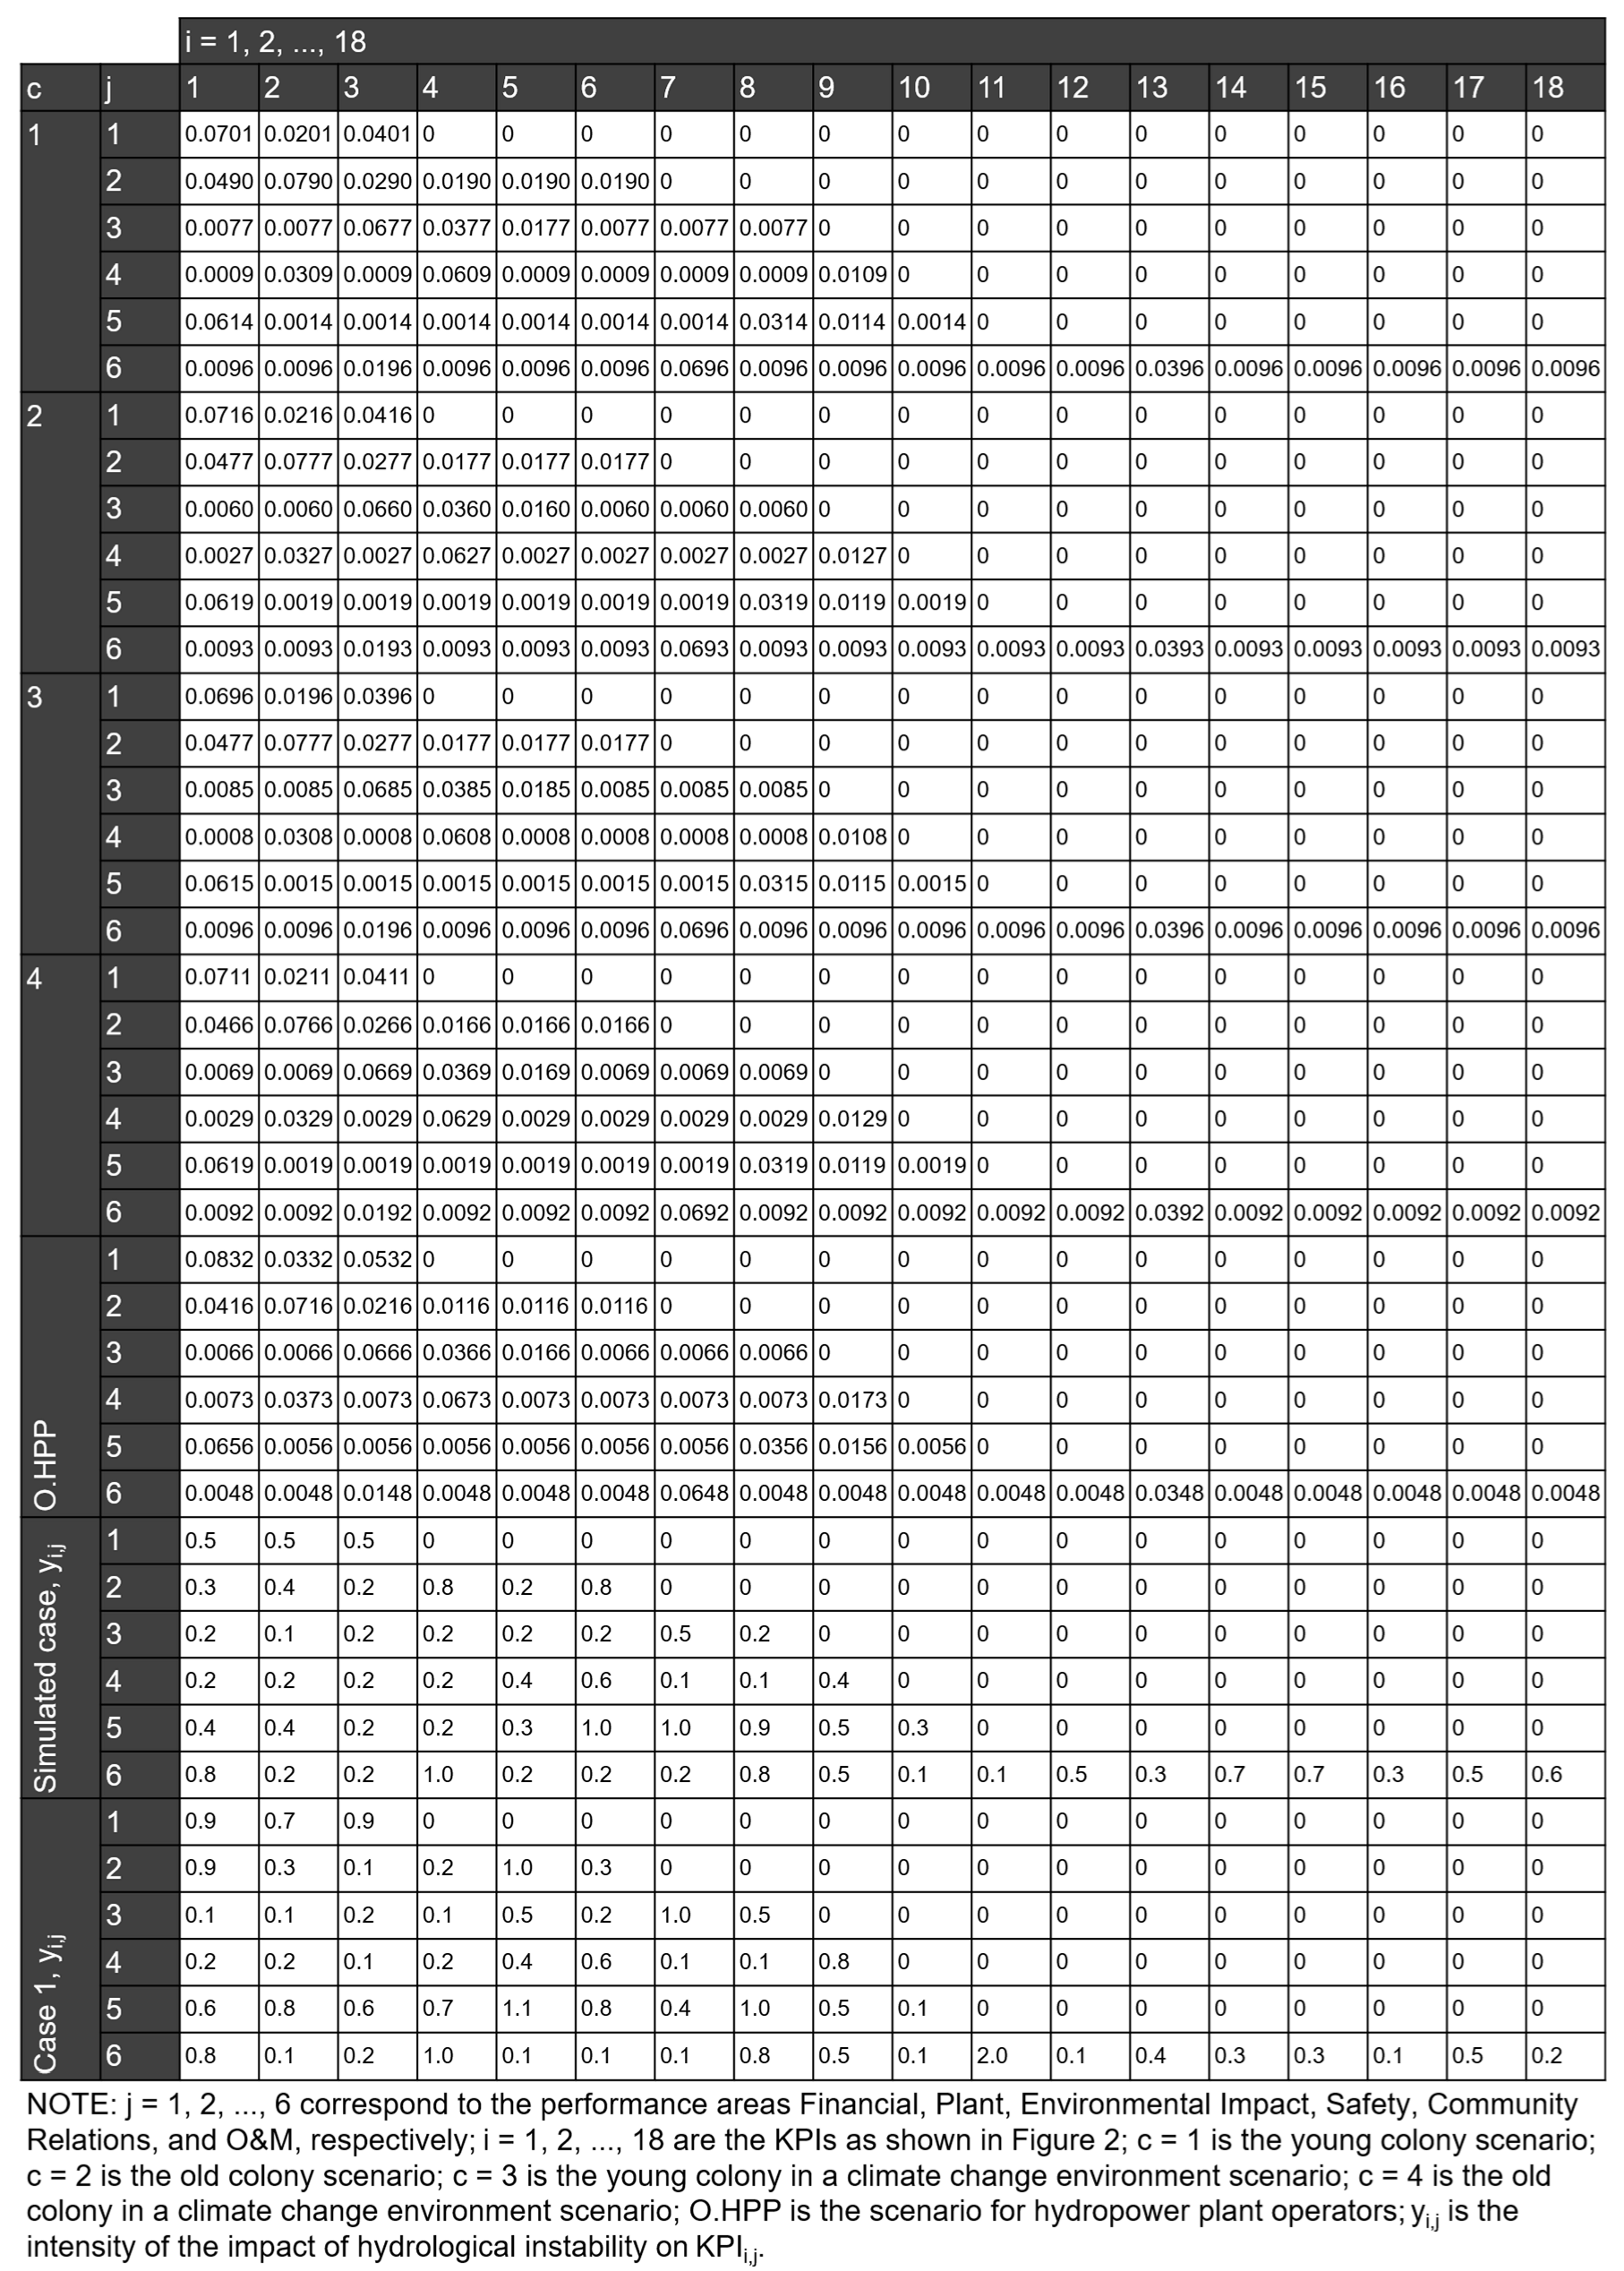
The performance values were obtained from consultations with O.HPP (Supplementary Material—Part S2). The values of wi,j and yi,j (simulated case and Case 1) are shown in Figure 6.
Figure 6.
Importance values (weights) of KPI (wi,j) and yi,j.
The developed model supports the identification of the performance areas and KPIs most affected during a hydrological instability event (RAI < −3 or RAI > 3). Therefore, the model inputs are: RAI < −3 or RAI > 3 and the current KPI performance values (i.e., at the initial stage of the instability event); the model outputs consist of the identification of the performance areas and KPIs expected to be most affected by hydrological instability. This outcome supports the preparedness of O.HPP to cope with hydrological instability, as it enables efforts and resources to be redirected towards priority performance areas and KPIs.
The 2AFC model is based on a forced choice between two alternatives: the first is “change to adapt” and the second is “do not change” in the face of hydrological instability. In the first choice, the O.HPP will implement concrete adaptation actions, such as modifying the hydraulic turbine to make it less susceptible (mitigate) to cavitation. In the second choice, the O.HPP will not implement concrete adaptation actions, meaning the hydraulic turbine will operate with full cavitation. The first choice should be made if the value of pR is equal or higher than 0.70, as per the literature [19,20].
4.2. Specification (Application of the Model)
Based on the 2AFC model (Equations (9)–(16)) and sets of weights (Table 2 and Figure 6), there are five alternatives for identifying the impacts of climate change on hydropower KPIs (Step 4), as follows:
- Alternative 1—identification according to the young colony.
- Alternative 2—identification according to the old colony.
- Alternative 3—identification according to the young colony in a climate change environment.
- Alternative 4—identification according to the old colony in a climate change environment.
- Alternative 5—identification according to the O.HPP.
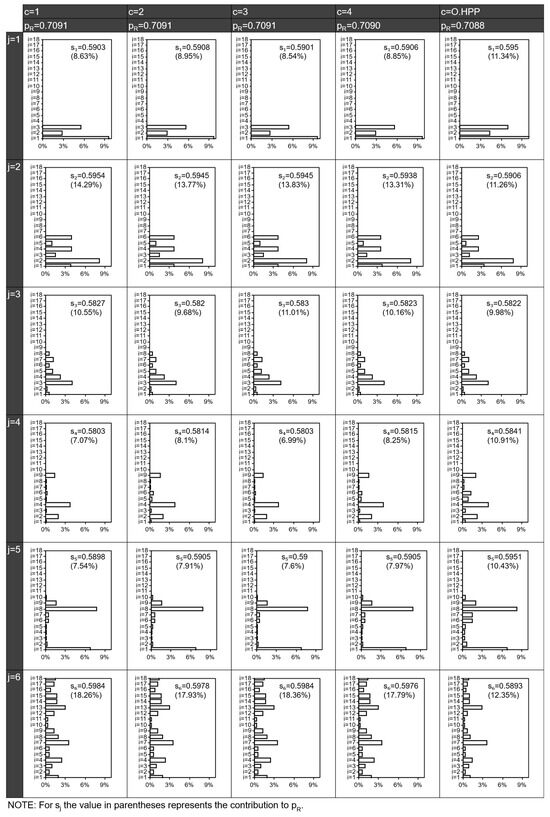
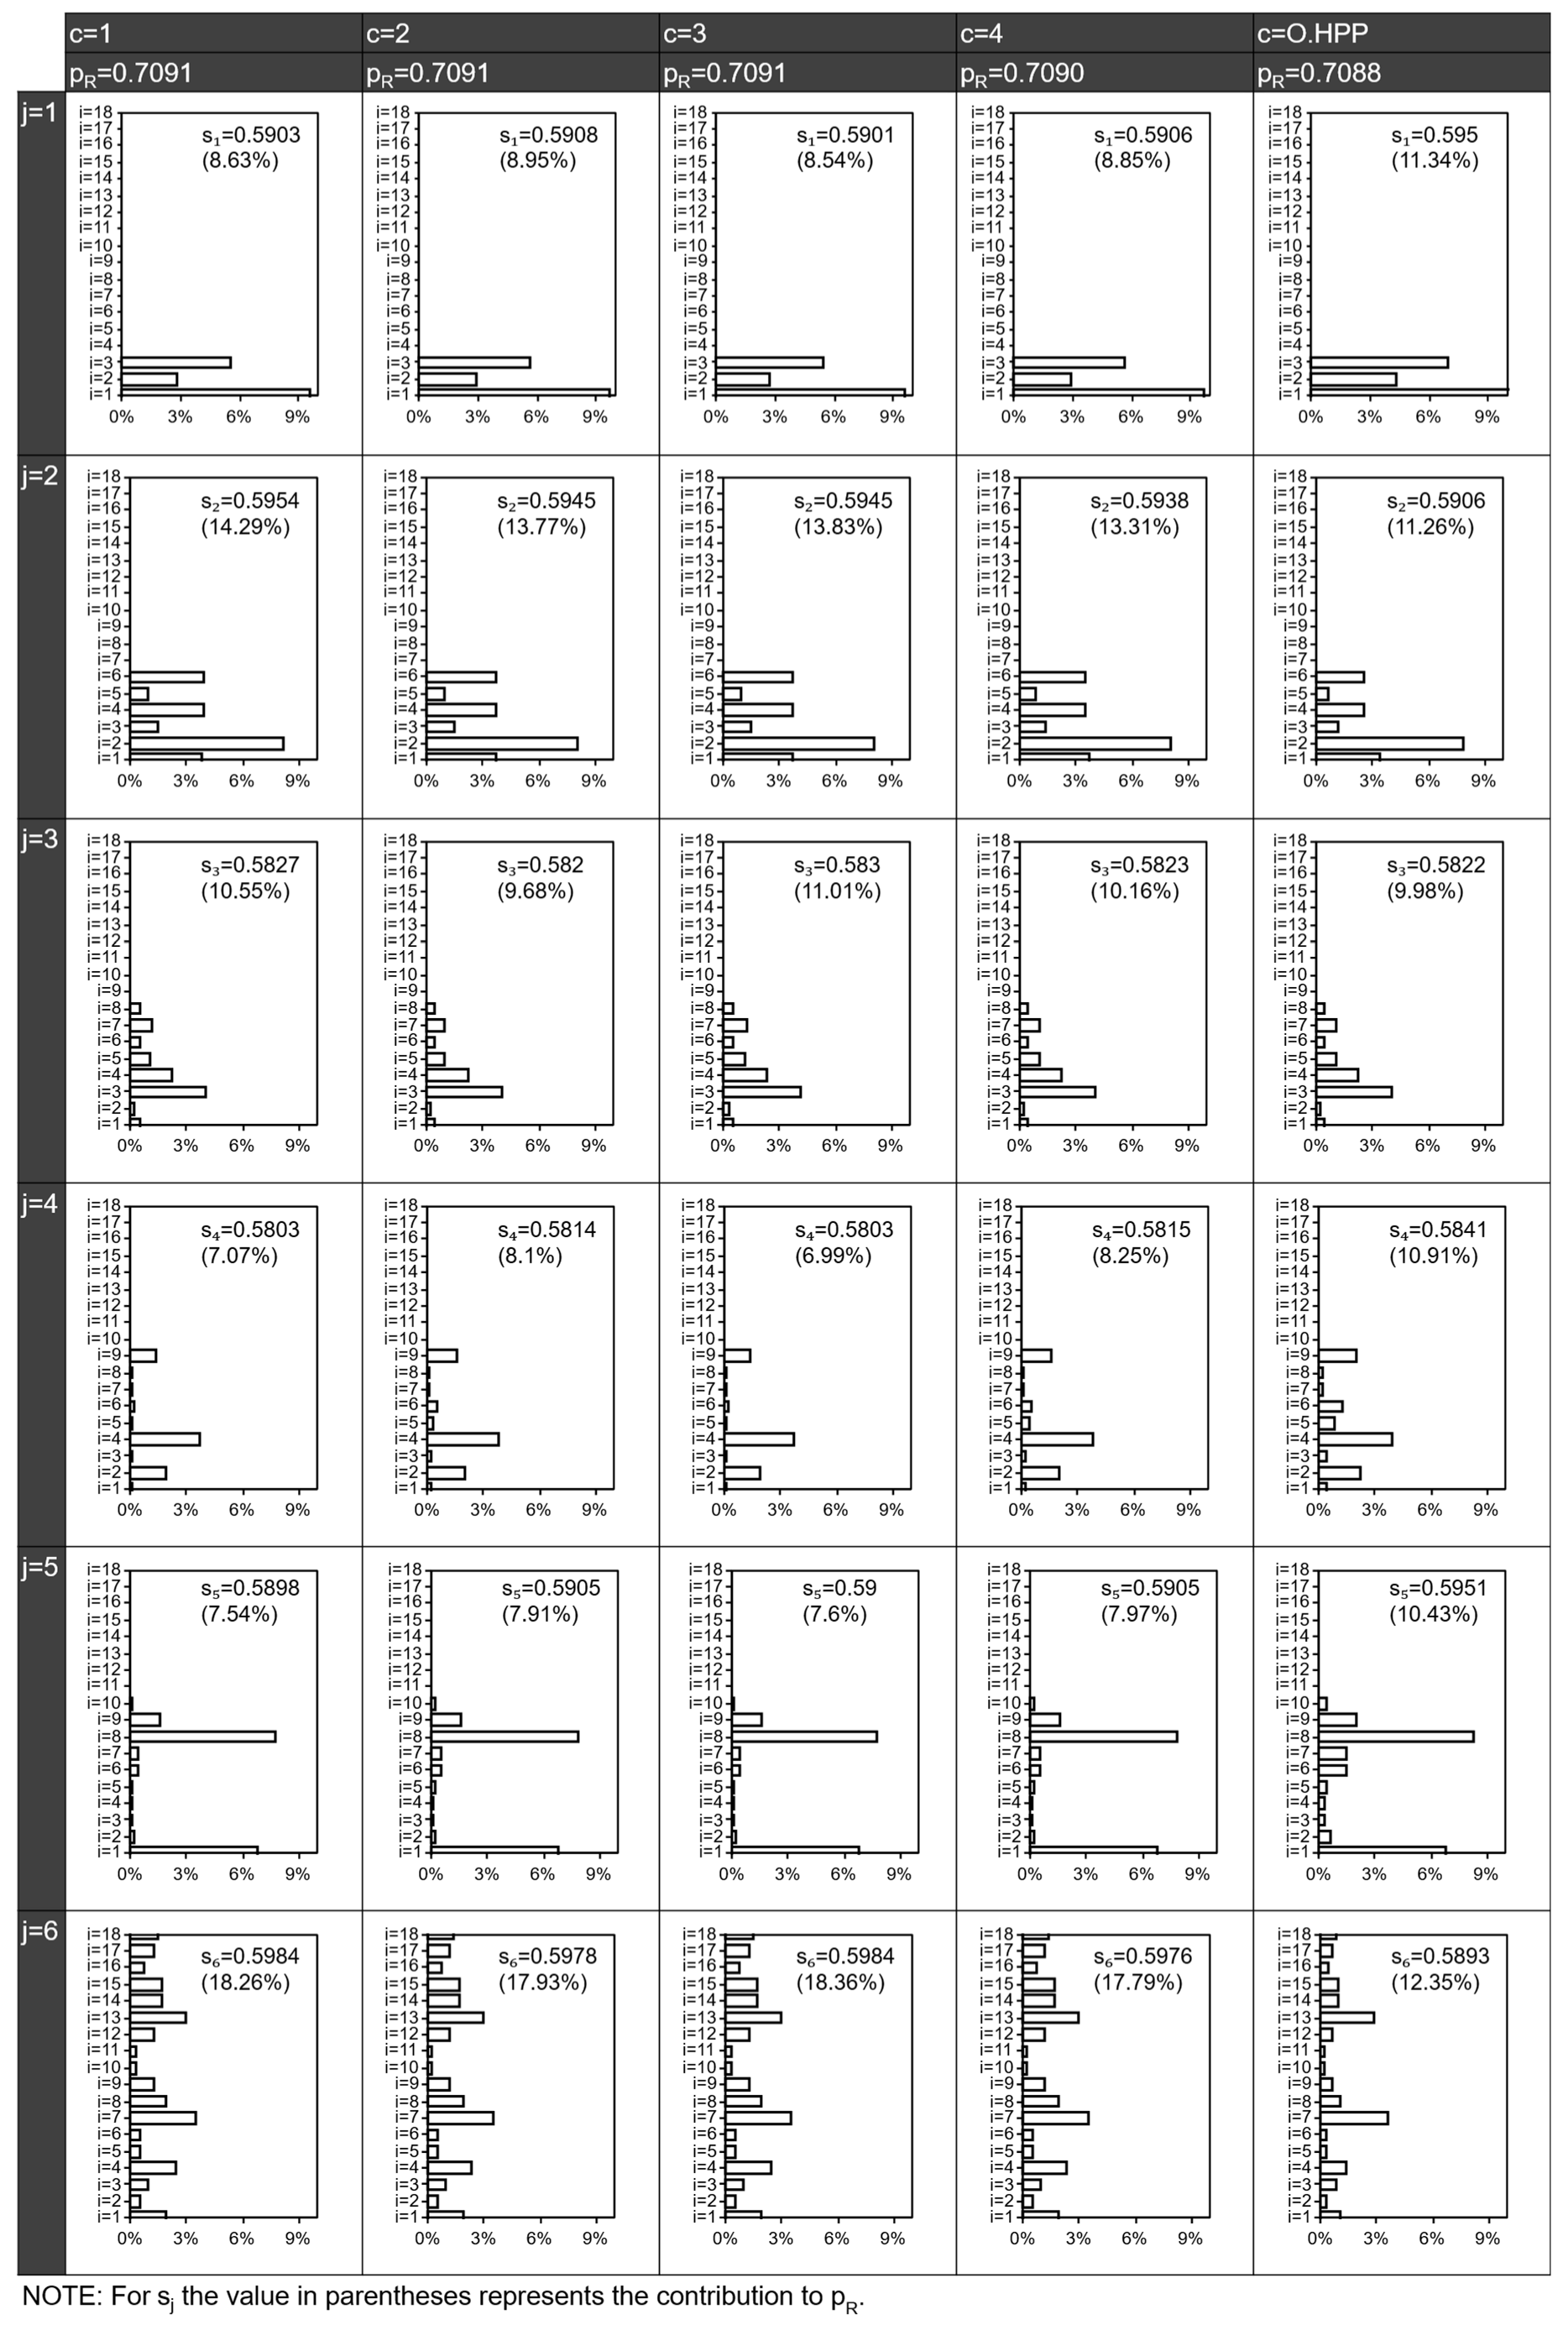
The value of the probability for the O.HPP to “change to adapt” (pR), the stimulus values for each performance area (sj), the KPI stimulus values (yi,j) and the contribution of each stimulus yi,j to sj and sj to pR are presented in Figure 7.
Figure 7.
Results of the 2AFC model.
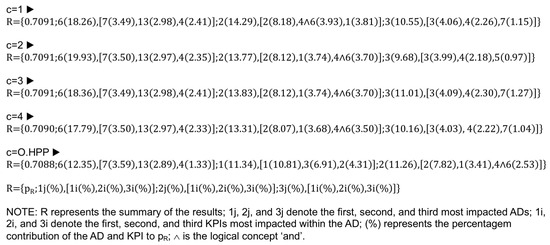
The results indicated that the ant colonies, in all scenarios, showed the same probability value of “change to adapt”, where the value was slightly higher than that of the O.HPP. The probability of the O.HPP “change to adapt” (pR), the performance areas (j) and KPIs (yi,j) that contributed the most to each scenario are presented in Figure 8.
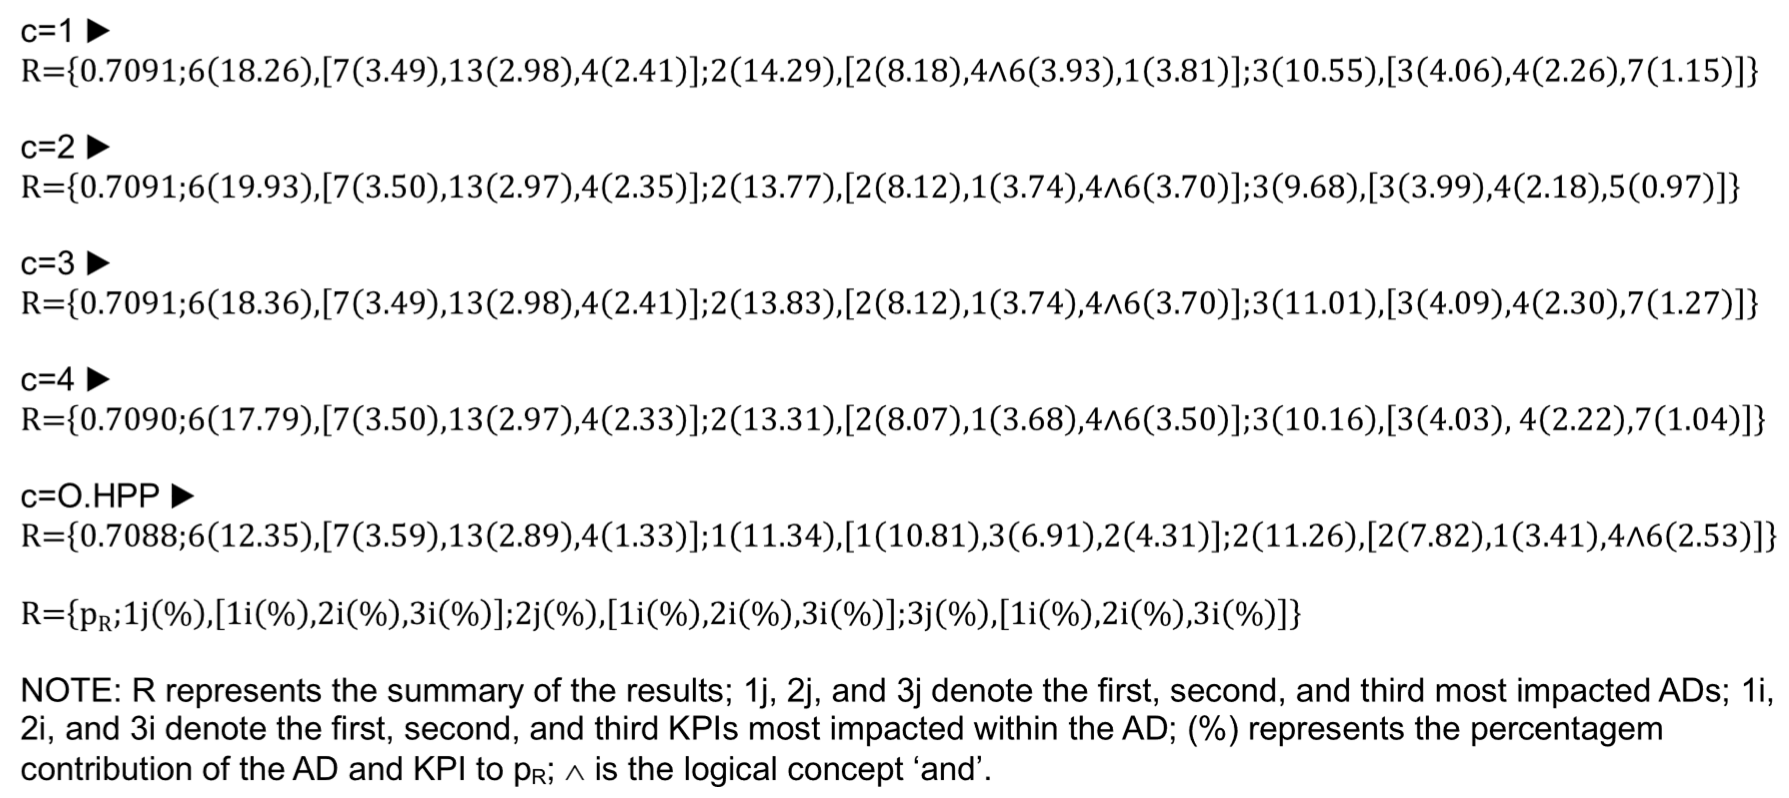
Figure 8.
Identification of impacted performance areas and KPIs (highlights from Figure 7).
The observation of the results indicates that, for the ant colonies, with a probability of 0.7091 (pR), there would be a shift towards adaptation; the impacted performance areas were j = 6 (Operation and Maintenance), 2 (Plant), and 3 (Environmental Impact); the most intensely impacted KPIs (i.e., those that contributed the most to pR) in each performance area were y6,7 (presence of vegetal debris in the intake chamber), y2,2 (generation availability factor); y3,3 (non-compliance with dam safety regulations). For the old ant colony in a climate change environment, the addition of KPIs (y5,3, fish incidents; y7,3, water quality–phosphorus) was observed. For the O.HPP, there would also be a shift towards adaptation with a probability of 0.7088 (pR); the affected performance areas would be j = 6 (Operation and Maintenance), 1 (Finance), and 2 (Plant); the impacted KPIs were y7,6 (presence of vegetable debris in the intake chamber), y1,1 (percentage of spending on operation and maintenance activities, O&M), y2,2 (generation availability factor). For c = 1, 2, 3, 4, and O.HPP, although the pR values were similar, the contribution of the performance areas (ADs) to pR began to diverge substantially (i.e., resulting in changes in prioritisation) from the second-ranked performance area (2j) onwards. Likewise, the contribution of the KPIs to each performance area began to diverge from the highest-ranked KPI (1i) onwards. In other words, consensus was observed only for the highest-ranked performance area (1j) and its corresponding three most influential KPIs ([1i, 2i, 3i]), whereas variations were observed in the remaining rankings. These differences may be attributable to the parameterisation and the performance functions of yi,j (Equations (1) and (2)). Future research should focus on calibrating the model parameters using historical data.
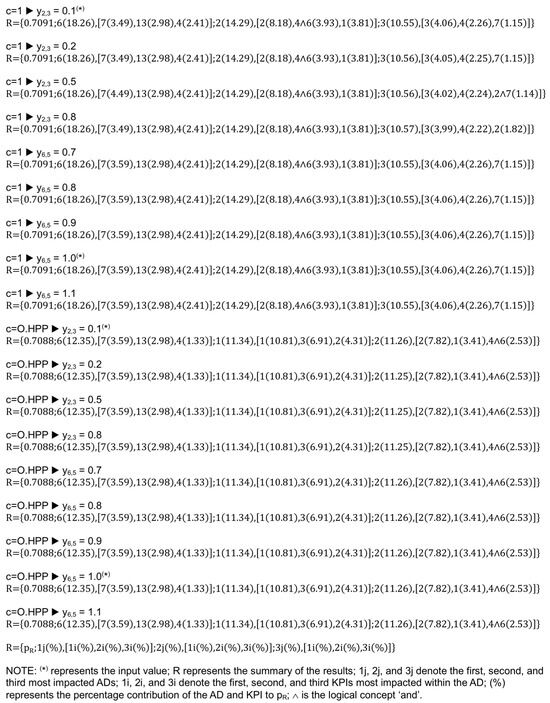
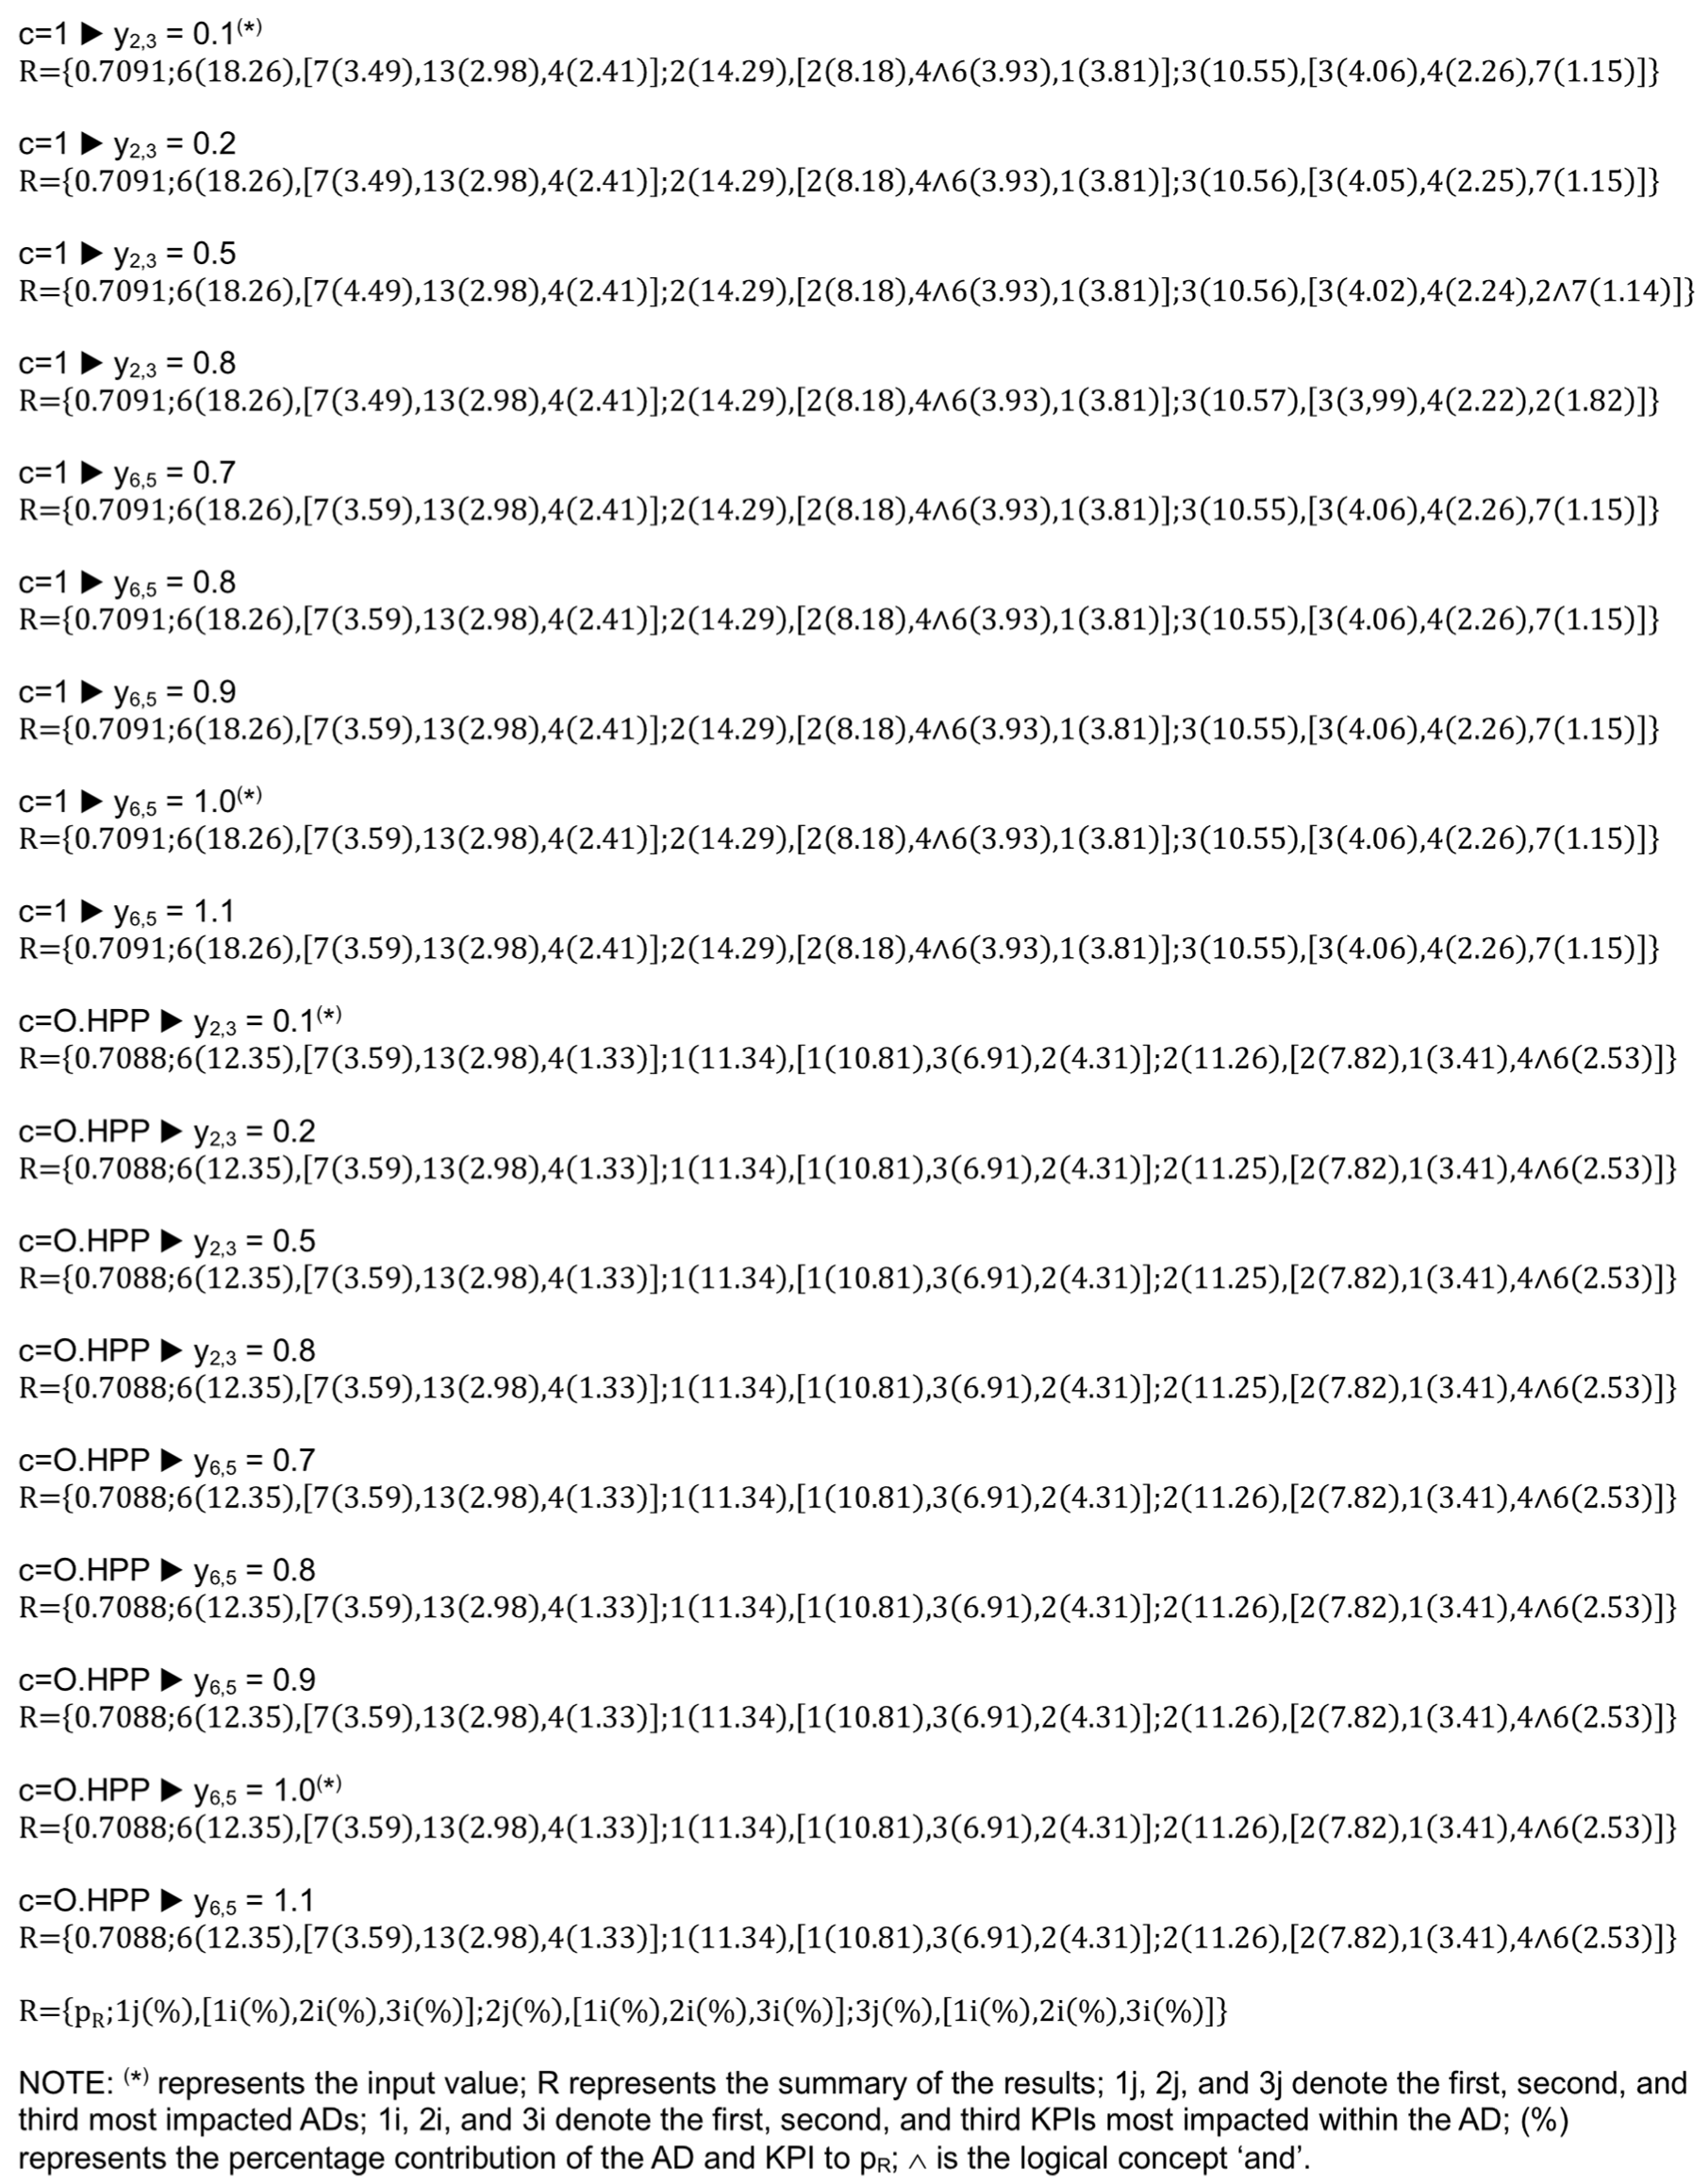
For the sensitivity analysis, input values corresponding to the lowest (y2,3) and highest (y6,5) performance levels were considered, both for the weight sets c = 1 and c = O.HPP, as shown in Figure 9.
Figure 9.
Sensitivity analysis for y2,3 and y6,5.
The results indicated that, for y2,3 values ranging from 0.1 to 0.8 under the weight set c = 1, no changes were observed in the hierarchy of AD identification (i.e., 1j, 2j, and 3j remained constant). However, changes were observed in the KPIs identified as having the greatest contribution within the third AD, specifically in the third KPI (3j, 3KPI). For the same variation range of y2,3 (0.1 to 0.8), under the weight set c = O.HPP, no changes were identified in the hierarchy of either ADs or KPIs. For the highest performance value range, y6,5 (0.7 to 1.1), no changes were observed in the ranking of ADs and KPIs for either weight set (c = 1 and c = O.HPP). A possible explanation for the model’s lack of sensitivity may lie in its integrated conceptual basis; that is, changes in the identification process are driven not by variation in a single KPI performance but rather by a contextual change involving several interrelated KPIs. The parameterisation, including the definition of thresholds and their relationship with the KPIs (Equations (1)–(3) and Figure 3), as well as the potential bias introduced by the weighting vector, may also explain this behaviour. Future studies applying the model to new input datasets, particularly real-world operational data, may help to clarify these issues and support the calibration, verification, and validation of the proposed model.
The HHI, minimum, maximum, and Standard Deviation (SD) values obtained for sj · wj, considering the weight sets c = 1, 2, 3, 4 and O.HPP, are presented below:
- c = 1, HHI = 0.19, min = 0.07, max = 0.18, range = 0.11, SD = 0.04;
- c = 2, HHI = 0.18, min = 0.08, max = 0.18, range = 0.10, SD = 0.04;
- c = 3, HHI = 0.19, min = 0.07, max = 0.18, range = 0.11, SD = 0.04;
- c = 4, HHI = 0.18, min = 0.08, max = 0.18, range = 0.10, SD = 0.04;
- c = O.HPP, HHI = 0.17, min = 0.10, max = 0.12, range = 0.02, SD = 0.01.
For the weight sets c = 1, 2, 3, and 4, a moderate to high concentration of ADs was observed [43]; a ratio between max and min greater than 2 (max > 2 × min); and an SD of 0.04. For the O.HPP weight set, a moderate concentration of ADs was observed; a low degree of superiority between min and max (max > min); and an SD of 0.01. Therefore, whereas the ant colonies identify ADs to be prioritised (i.e., recommending the concentration of efforts on specific ADs, HHI = 0.19), O.HPP places little prioritisation on ADs (i.e., recommending efforts across all ADs, HHI = 0.17).
From the comparison between the results of the ant colonies and the O.HPP, several points are highlighted:
- The impacts identified by the ant colonies were primarily related to O&M aspects, followed by productive and environmental aspects.
- For the O.HPP, aspects of the relationship with O&M, followed by productive and financial aspects, were considered the most important.
- In general, the results for the old ant colony in a climate change environment showed
- —
- Greater relevance, with a higher contribution from the chosen performance areas to the value of pR (41% for the ant colony, 35% for the O.HPP; see Figure 7).
- —
- For the ant colony, there is a greater degree of concentration, or greater importance, assigned to specific ADs, as indicated by the HHI performance values.
- —
- Greater consistency or a closer alignment with an effective O&M strategy, as it aims to address more than just financial aspects [24]. The ant colony suggests a concern for mitigating activities in the areas of O&M, productivity, and environmental impact, while the O.HPP focuses on O&M, financial, and productivity aspects.
- —
- Thus, the set of impacts identified by the old ant colony in a climate change environment was the solution chosen (result of Step 4).
As the results from the implementation and tests (Step 5), there is a calculation spreadsheet with the implemented model, performances in the KPIs, and the identification of impacted performance areas and KPIs for Case Study 1 (a Brazilian hydropower plant located in the state of Mato Grosso). Some characteristics of Case 1 are: three generating units, vertical shaft Francis turbines; installed capacity of 176 MW; a run-of-river reservoir of 14.5 km2; nominal head of 240 m; the spillway has three gates; minimum flow of 9.7 m3/s (ecological flow); faced difficulties with fish mortality and cavitation. The input data (performances in the KPIs) and complete results are available in the Supplementary Material. The identification of performance areas and impacted KPIs for Case 1 is presented in Figure 10.
Figure 10.
Identification of Performance Areas and Impacted KPIs, Case 1.
For Case 1, with a probability of 0.7096 (pR), adaptation would occur; the impacted performance areas were j = 6 (Operation and Maintenance), 2 (Plant), and 3 (Environmental Impact); the most intensely impacted KPIs were y11,6 (operation, repair, and revitalisation expense contracts not clearly defined, especially during periods of low water availability), y13,6 (deformation or cracking of the structure, blades, or turbine shaft), y1,2 (plant availability factor), y3,3 (non-compliance with dam safety regulations) and y5,3 (incidents with fish). A correspondence was observed between the model outputs and historical records, as the KPIs y5,3 and y13,6 identified by the model as the most highly impacted were also associated with events that had actually occurred in the past. This correspondence enhances the credibility of the proposed model and may be regarded as a preliminary assessment of its face validity. The results may assist decision-makers in Case 1 in adapting to mitigate the effects of climate change on operations. For Case 1, mainly strengthening and reinforcing the O&M measures were recommended by the 2AFC model, for example, implementing an effective O&M strategy based on best practices [24,26].
The application of the model to new cases and its contextualisation may help improve the chosen 2AFC model. The limitations of the developed model include: (1) the small sample of input data (the contribution of six experts); (2) the need for calibration and validation using data from other real cases (historical yi,j and RAI data); (3) the weighting process may introduce a preference for particular KPIs, which may significantly influence their identification and prioritisation; and (4) the failure to account for spatial variability (i.e., complex systems such as inter-basin hydropower systems or cascade operations are not considered). For future work, initiatives aimed at overcoming these limitations are recommended.
5. Conclusions
A model for identifying the impacts of climate change on the Key Performance Indicators (KPIs) of hydroelectric power plants was developed and applied to a hydroelectric plant case. The developed model was based on the 2AFC model and the adaptation capacity of leaf-cutter ant colonies in the Amazon rainforest. The way in which ant colonies adapt to significant changes in the local environment proved to be more comprehensive and consistent. Human operators are concerned with O&M, financial, and productivity (Plant) areas, being almost equally important (12%, 11%, and 11%, respectively). Ant colonies prioritise O&M, productivity (Plant), and environmental (Environmental Impact) areas, with importance values of 18%, 13%, and 10%, respectively.
Naturally, different importance values led to different paths for mitigation and adaptation. Considering the success of ant colonies in establishing themselves and adapting, as well as the current difficulties faced by O.HPPs in adapting to changes, there is an expectation that the concerns highlighted by the ant colonies could assist decision-makers in achieving a very high level of availability and a longer life expectancy. A limitation of the model is the need for prior user experience with hydrological instability to obtain Key Performance Indicator (KPI) performance data. There is a need to validate the model (against other observed operational results and historical climate events) using a range of additional cases prior to its implementation in real-world applications. It is recommended that the study continues, focusing on overcoming this limitation.
Supplementary Materials
The following supporting information can be downloaded at: https://www.mdpi.com/article/10.3390/hydropower1020006/s1, Figure S1.1: Time series of the Rainfall Anomaly Index indicators: RAI and RAIS; Table S1.1: Rainfall classification according to the RAI; Figure S2.1: Entry data; Figure S2.2: Parameters of the general equation for KPIi,j indicators; Figure S2.3: Adaptive demography of ant colony; Figure S2.4: Results of questionnaires applied to O.HPP; Figure S2.5: Results of the 2AFC model, Case 1; Table S2.1: Cast and head size.
Author Contributions
Conceptualization, W.T.P.d.S. and G.A.A.; methodology, W.T.P.d.S.; software, W.T.P.d.S.; validation, A.P.F. and G.A.A.; formal analysis, W.T.P.d.S.; investigation, I.A.P.B.; resources, W.T.P.d.S. and G.A.A.; data curation, W.T.P.d.S., I.A.P.B. and A.P.F.; writing—original draft preparation, W.T.P.d.S.; writing—review and editing, W.T.P.d.S., A.P.F. and G.A.A.; visualization, A.P.F. and G.A.A.; supervision, A.P.F. and G.A.A.; project administration, W.T.P.d.S.; funding acquisition, W.T.P.d.S. All authors have read and agreed to the published version of the manuscript.
Funding
This research was funded by National Council for Scientific and Technological Development (CNPq), grant number 308681/2025-8.
Data Availability Statement
The original contributions presented in this study are included in the article and Supplementary Material. Further inquiries can be directed to the corresponding author.
Acknowledgments
The authors gratefully acknowledge the Brazilian Electricity Regulatory Agency (ANEEL), the Regulatory Agency for Delegated Public Services of the State of Mato Grosso (AGER/MT), the Public Prosecutor’s Office of Mato Grosso (MPMT), the State Secretariat for the Environment of Mato Grosso (SEMA), and ENGIE Brasil Energia S.A. for their support (specialist) and for providing access to data.
Conflicts of Interest
Author Alexandre Puls Ferretti was employed by the company ENGIE Brasil Energia S.A. The remaining authors declare that the research was conducted in the absence of any commercial or financial relationships that could be construed as a potential conflict of interest.
Abbreviations
The following abbreviations are used in this manuscript:
| ACO | Ant Colony Optimisation |
| ADM | Animal Decision-Making |
| 2AFC | Two-alternative FORCED CHOICE METHOD |
| KPIs | Key Performance Indicators |
| KPIi | Key Performance Indicator i, i = 1, 2, …, m |
| w1, w2, wn | Sets of weights (importance values of KPIi) |
| O.HPP | Operators and government regulatory agents of hydropower plants |
| RAI | Rainfall Anomaly Index |
| AD | Area of performance j, j = 1, 2, …, n |
| yi,j | The intensity of the impact of hydrological instability on KPIi,j |
| xi,j | The value of KPIi,j at a moment of hydrological instability |
| f(xi,j) | The piecewise linear membership function that relates the independent variable xi,j with the dependent variable yi,j |
| gi,j | The performance of yi,j when the value of xi,j is within the range of xLi,j,k to xUi,j,k |
| xLi,j,k | The lower bound parameter of xi,j, in the interval k |
| xUi,j,k | The upper bound parameter of xi,j, in the interval k |
| wj,a | The importance values (weight) considering the frequency of each caste in the population of the leaf-cutter ant colony |
| c | The scenario identification; 1 is the young colony scenario; 2 is the old colony scenario; 3 is the young colony in a climate change environment scenario; 4 is the old colony in a climate change environment scenario |
| a | The ant colony caste |
| xt | The linear coupling vector associated with the weight vector wt, used to determine the probability of the O.HPP making the “change to adapt” choice at the hydrological instability moment t |
| st | The vector of stimuli generated by the impact of hydrological instability on the performance areas |
| sj | The stimulus generated by the impact of hydrological instability on the performance area j, j = 1, 2, …, n |
| wt | The vector of importance values (weights) for the performance areas j, j = 1, 2, …, n |
| wb | The value of the independent bias of the stimulus in the direction of the “change to adapt” choice over the “do not change” choice |
| pR | The probability for the O.HPP to change to adapt |
References
- Wasti, A.; Ray, P.; Wi, S.; Folch, C.; Ubierna, M.; Karki, P. Climate Change and the Hydropower Sector: A Global Review. WIREs Clim. Change 2022, 13, e757. [Google Scholar] [CrossRef] [Scilit]
- Queiroz, F.R. Avaliação de Cavitação em Turbinas Hidráulicas por Emissão Acústica. Master’s Thesis, Universidade Federal de Minas Gerais, Belo Horizonte, Brazil, 2012. [Google Scholar]
- Costa, H.A. Aumento Da Eficiência Na Geração Pela Determinação Da Conjugação Ótima De Turbinas Hidráulicas Do Tipo Kaplan. Master’s Thesis, UFSC, Florianópolis, Brazil, 2018. [Google Scholar]
- Shu, J.; Qu, J.J.; Motha, R.; Xu, J.C.; Dong, D.F. Impacts of Climate Change on Hydropower Development and Sustainability: A Review. IOP Conf. Ser. Earth Environ. Sci. 2018, 163, 012126. [Google Scholar] [CrossRef] [Scilit]
- Majumder, P.; Majumder, M.; Saha, A.K. Climate Change and Urbanization Impact on Hydropower Plant by Neural Network-Based Decision-Making Methods: Identification of the Most Significant Parameter. Water Conserv. Sci. Eng. 2018, 3, 169–179. [Google Scholar] [CrossRef] [Scilit]
- Kim, S.J.; Asadzadeh, M.; Stadnyk, T.A. Climate Change Impact on Water Supply and Hydropower Generation Potential in Northern Manitoba. J. Hydrol. Reg. Stud. 2022, 41, 101077. [Google Scholar] [CrossRef] [Scilit]
- Hatamkhani, A.; Moridi, A.; Haghighi, A.T. An Integrated Approach for Assessing the Economic Impact of Climate Change on Hydropower Systems. Energy 2025, 319, 134990. [Google Scholar] [CrossRef] [Scilit]
- Fábio, A.C. Seca Severa Faz Grandes Hidrelétricas Da Amazônia Operarem a Menos de 10% Da Capacidade; Folha de S. Paulo: São Paulo, Brazil, 2024. [Google Scholar]
- Corrêa, A.F. Sem Chuva, Hidrelétricas Já Operam Com 25% Da Capacidade e o Sinal é de Alerta; RDNews: Mato Grosso, Brazil, 2021. [Google Scholar]
- Lim, J.; Re, L.L.; D’Adamo, C.; Rentería, Z.; Moarif, S. Climate Impacts on Latin American Hydropower; International Energy Agency (IEA): Paris, France, 2021; p. 57. [Google Scholar]
- Pineda, L.A.C.; Cunha, A.P.M.d.A.; Broedel, E.; Costa, L.C.O.; Seluchi, M.E.; Guedes, M.R.G.; Alvalá, R.C.d.S. Nota Técnica No 529/2024/SEI-CEMADEN 2024. Available online: https://www.gov.br/cemaden/pt-br/assuntos/monitoramento/impactos-seca/monitoramento-de-seca-para-o-brasil/monitoramento-de-secas-e-impactos-no-brasil-agosto-2024/NOTATECNICAN529202SEICEMADENSECAS.pdf (accessed on 19 July 2026).
- Lulu, J.; Nascimento, A.F.d.; Meneguci, J.L.P.; Pezzopane, J.R.M. Boletim Agrometeorológico: Anomalias de Chuva de 1988 a 2022 Em Mato Grosso (1a e 2a Safras). Bol. Agrometeorológico 2023, 20, 2–20. Available online: https://www.infoteca.cnptia.embrapa.br/infoteca/handle/doc/1149023 (accessed on 19 July 2026).
- Commar, L.F.S.; Louzada, L.; Costa, M.H.; Brumatti, L.M.; Abrahão, G.M. Mato Grosso’s Rainy Season: Past, Present, and Future Trends Justify Immediate Action. Environ. Res. Lett. 2024, 19, 114065. [Google Scholar] [CrossRef] [Scilit]
- Vincent, J.F.V.; Bogatyreva, O.A.; Bogatyrev, N.R.; Bowyer, A.; Pahl, A.-K. Biomimetics: Its Practice and Theory. J. R. Soc. Interface 2006, 3, 471–482. [Google Scholar] [CrossRef] [Scilit] [PubMed]
- Viana-Bailez, A.M.; Endringer, F.B. Plasticidade do comportamento de forrageamento em formigas cortadeiras. Acol. Aust. 2016, 20, 332–340. [Google Scholar] [CrossRef] [Scilit]
- da Silva, W.T.P.; Bulhões, I.A.P.; de Brito Junior, E.; Aggidis, G.A. Brazilian Savannah Tree as Bio-Inspiration for Hydraulic Transient Control in a Penstock of a Small Hydropower Plant. J. Hydraul. Res. 2024, 62, 158–175. [Google Scholar] [CrossRef] [Scilit]
- Shao, H.; Chau, K.Y.; Zaman, A.; Moslehpour, M.; Pan, X. Machine Learning Frameworks to Analyze Climate Change Impact on Hydropower Productivity. Appl. Water Sci. 2026, 16, 54. [Google Scholar] [CrossRef] [Scilit]
- Wichmann, F.A.; Hill, N.J. The Psychometric Function: I. Fitting, Sampling, and Goodness of Fit. Percept. Psychophys. 2001, 63, 1293–1313. [Google Scholar] [CrossRef] [Scilit] [PubMed]
- Gescheider, G.A. Psychophysics: The Fundamentals, 3rd ed.; Psychology Press: New York, NY, USA, 2013. [Google Scholar]
- Kingdom, F.A.A.; Prins, N. Psychophysics: A Practical Introduction, 2nd ed.; Elsevier Science & Technology Books: Amsterdam, The Netherlands; Heidelberg, Germany, 2010. [Google Scholar]
- Dorigo, M.; Gambardella, L.M. Ant Colony System: A Cooperative Learning Approach to the Traveling Salesman Problem. IEEE Trans. Evol. Comput. 1997, 1, 53–66. [Google Scholar] [CrossRef] [Scilit]
- Liu, Y.; Sun, A.; Loh, H.T.; Lu, W.F.; Lim, E.-P. Advances of Computational Intelligence in Industrial Systems; Studies in Computational Intelligence; Springer: Berlin/Heidelberg, Germany, 2008; Volume 116. [Google Scholar]
- van Rooy, M.P. A Rainfall Anomaly Index Independent of Time and Space. Notos 1965, 14, 43–48. [Google Scholar] [CrossRef] [Scilit]
- World Bank. Operation and Maintenance Strategies for Hydropower: Handbook for Practitioners and Decision Makers; World Bank: Washington, DC, USA, 2020. [Google Scholar]
- Mobley, R.K.; Higgins, L.R.; Wikoff, D.J. Maintenance Engineering Handbook, 7th ed.; McGraw-Hill: New York, NY, USA, 2008. [Google Scholar]
- Sullivan, G.P.; Pugh, R.; Melendez, A.P.; Hunt, W.D. Operations & Maintenance Best Practices—A Guide to Achieving Operational Efficiency (Release 3); Pacific Northwest National Laboratory: Richland, WA, USA, 2010; p. 321.
- Fayemi, P.E.; Wanieck, K.; Zollfrank, C.; Maranzana, N.; Aoussat, A. Biomimetics: Process, Tools and Practice. Bioinspir. Biomim. 2017, 12, 011002. [Google Scholar] [CrossRef] [Scilit] [PubMed]
- Ulhøi, J.P. From Innovation-as-Usual towards Unusual Innovation: Using Nature as an Inspiration. J. Innov. Entrep. 2021, 10, 2. [Google Scholar] [CrossRef] [Scilit]
- Arslan, S.; Sorguc, A.G. Similarities between “Structures in Nature” and “Man-Made Structures”: Biomimesis in Architecture. In Design and Nature II: Comparing Design in Nature with Science and Engineering; Collins, M.W., Brebbia, C.A., Eds.; WIT Press: Southampton, UK, 2004; pp. 45–54. [Google Scholar]
- Wilson, E.O. Success and Dominance in Ecosystems: The Case of the Social Insects; Ecology Institute: Oldendorf/Luhe, Germany, 1990; Volume 2. [Google Scholar]
- Helms, M.; Vattam, S.S.; Goel, A.K. Biologically Inspired Design: Process and Products. Des. Stud. 2009, 30, 606–622. [Google Scholar] [CrossRef] [Scilit]
- Parr, C.L.; Bishop, T.R. The Response of Ants to Climate Change. Glob. Change Biol. 2022, 28, 3188–3205. [Google Scholar] [CrossRef] [Scilit] [PubMed]
- Duguid, S.; Melis, A.P. How Animals Collaborate: Underlying Proximate Mechanisms. WIREs Cogn. Sci. 2020, 11, e1529. [Google Scholar] [CrossRef] [Scilit] [PubMed]
- Brian, M.V. Social Insects: Ecology and Behavioural Biology; Springer: Dordrecht, The Netherlands, 1983. [Google Scholar]
- Bell, A.M. The Evolution of Decision-Making Mechanisms under Competing Demands. Trends Ecol. Evol. 2024, 39, 141–151. [Google Scholar] [CrossRef] [Scilit] [PubMed]
- Dreyer, T.; Haluts, A.; Korman, A.; Gov, N.; Fonio, E.; Feinerman, O. Comparing Cooperative Geometric Puzzle Solving in Ants versus Humans. Proc. Natl. Acad. Sci. USA 2025, 122, e2414274121. [Google Scholar] [CrossRef] [Scilit] [PubMed]
- Welden, E.A. Conceptualising Multispecies Collaboration: Work, Animal Labour, and Nature-Based Solutions. Trans. Inst. Br. Geogr. 2023, 48, 541–555. [Google Scholar] [CrossRef] [Scilit]
- Aronson, E.; Aronson, J. The Social Animal, 10th ed.; Worth Publishers: New York, NY, USA, 2008. [Google Scholar]
- Bräuer, J.; Hanus, D.; Pika, S.; Gray, R.; Uomini, N. Old and New Approaches to Animal Cognition: There Is Not “One Cognition”. J. Intell. 2020, 8, 28. [Google Scholar] [CrossRef] [Scilit] [PubMed]
- Ashwood, Z.C.; Roy, N.A.; Bak, J.H.; Pillow, J.W. Inferring Learning Rules from Animal Decision-Making. Adv. Neural Inf. Process. Syst. 2020, 33, 3442–3453. [Google Scholar] [CrossRef] [Scilit] [PubMed]
- Budaev, S.; Jørgensen, C.; Mangel, M.; Eliassen, S.; Giske, J. Decision-Making From the Animal Perspective: Bridging Ecology and Subjective Cognition. Front. Ecol. Evol. 2019, 7, 164. [Google Scholar] [CrossRef] [Scilit]
- Ulrich, R.; Miller, J. Threshold Estimation in Two-Alternative Forced-Choice (2AFC) Tasks: The Spearman-Kärber Method. Percept. Psychophys. 2004, 66, 517–533. [Google Scholar] [CrossRef] [Scilit] [PubMed]
- Krivka, A. On the Concept of Market Concentration, the Minimum Herfindahl—Hirschman Index, and Its Practical Application. Panoeconomicus 2016, 63, 525–540. [Google Scholar] [CrossRef] [Scilit]
- Djolov, G. The Herfindahl-Hirschman Index as a Decision Guide to Business Concentration: A Statistical Exploration. J. Econ. Soc. Meas. 2013, 38, 201–227. [Google Scholar] [CrossRef] [Scilit]
- Wilker, I.; Lasmar, C.J.; Schmidt, F.A.; da Costa, M.M.S.; Almeida, D.d.F.; Dutra, D.B.d.S.; Alves, A.d.L.; da Silva, L.L.; Ribas, C.R. Land-Use Change in the Amazon Decreases Ant Diversity but Increases Ant-Mediated Predation. Insect Conserv. Divers. 2023, 16, 379–392. [Google Scholar] [CrossRef] [Scilit]
- da Silva, W.T.P.; de Souza, M.A.A. Development of a Multicriteria Model for Crises in Urban Water Supply and Its Application to the Case of Brasilia, Brazil. Integr. Environ. Assess. Manag. 2023, 19, 99–113. [Google Scholar] [CrossRef] [Scilit] [PubMed]
- Bouyssou, D.; Marchant, T.; Pirlot, M.; Perny, P.; Tsoukiàs, A.; Vincke, P. Evaluation and Decision Models: A Critical Perspective; International Series in Operations Research & Management Science; Springer: Boston, MA, USA, 2000; Volume 32. [Google Scholar]
- Loucks, D.P.; van Beek, E. Water Resource Systems Planning and Management: An Introduction to Methods, Models, and Applications; Springer Nature: Berlin, Germany, 2017. [Google Scholar]
- Sánchez, L.E. Avaliação de Impacto Ambiental: Conceitos e Métodos; Oficina de Textos: São Paulo, Brazil, 2008. [Google Scholar]
- Kothari, C.R. Research Methodology: Methods and Techniques; New Age International: New Delhi, India, 2004. [Google Scholar]
- Brassard, F.; Francoeur, A.; Lessard, J. Temperature Drives Caste-specific Morphological Clines in Ants. J. Anim. Ecol. 2020, 89, 2517–2530. [Google Scholar] [CrossRef] [Scilit] [PubMed]
- da Motta, R.S.; Hargrave, J.; Luedemann, G.; Gutierrez, M.B.S. Climate Change in Brazil: Economic, Social and Regulatory Aspects; Ipea: Brasília, Brazil, 2011. [Google Scholar]
- Geels, F.W. Regime Resistance against Low-Carbon Transitions: Introducing Politics and Power into the Multi-Level Perspective. Theory Cult. Soc. 2014, 31, 21–40. [Google Scholar] [CrossRef] [Scilit]
- Werner, D.; Lazaro, L.L.B. The Policy Dimension of Energy Transition: The Brazilian Case in Promoting Renewable Energies (2000–2022). Energy Policy 2023, 175, 113480. [Google Scholar] [CrossRef] [Scilit]



Disclaimer/Publisher’s Note: The statements, opinions and data contained in all publications are solely those of the individual author(s) and contributor(s) and not of MDPI and/or the editor(s). MDPI and/or the editor(s) disclaim responsibility for any injury to people or property resulting from any ideas, methods, instructions or products referred to in the content. |
© 2026 by the authors. Licensee MDPI, Basel, Switzerland. This article is an open access article distributed under the terms and conditions of the Creative Commons Attribution (CC BY) license.