


Abstract
Cinnabarinic acid (CA) is a phenoxazinone metabolite produced by Pycnoporus fungi and reported to have antibacterial activity. This study compared CA production by Pycnoporus cinnabarinus HEMIM-53 in three culture systems, Shake flasks (FSK), a Stirred-tank reactor (STR), and an airlift reactor (ALR), together with the bacterial growth-inhibitory activity (BGIA) of the crude extracts against Escherichia coli and Staphylococcus aureus. In Petri dishes, radial growth was favored at pH 5.5–7.5, with the highest mycelial density at pH 6.5 and pigmentation at pH 8.5. In submerged cultures, the systems differed markedly in glucose consumption, pH profiles, mycelial morphology, and extracellular laccase activity. Although FSK and STR showed higher laccase activity, HPLC quantification of CA and 3-hydroxyanthranilic acid (3-HAA) revealed the highest final CA concentration in the ALR, indicating that CA accumulation was not proportional to total laccase activity. ALR extracts also produced growth inhibition of both bacteria, whereas FSK extracts produced the weakest. Because the systems differed in scale, aeration, agitation and instrumentation, and the extracts differed in pH and composition, these effects cannot be attributed to the culture configuration or to CA alone. This descriptive comparison provides a basis for controlled studies with matched operating conditions, pH-adjusted and uninoculated-medium controls, and purified CA.
1. Introduction
Multidrug-resistant bacteria are responsible for a substantial number of deaths worldwide each year, and the World Health Organization has identified several bacterial pathogens as high-priority threats due to their increasing resistance to available antibiotics. This constitutes a public health issue, and it is estimated that it will become the leading cause of death in the coming years [1]. Efforts to identify new natural products have focused on testing novel sources of compounds with bactericidal and bacterial growth-inhibitory activity (BGIA) [2,3]. While conventional antibiotics are losing efficacy against bacterial resistance mechanisms, there are unexplored fungi that could inform the discovery or design of new antibacterial agents [4].
The genus Pycnoporus comprises basidiomycete fungi that are widely distributed throughout tropical and subtropical regions; furthermore, it is noted for its significant capacity to produce cellulolytic enzymes, such as laccases [5,6]. This genus includes species such as P. cinnabarinus, P. sanguineus, and P. coccineus, which form red-orange fruiting bodies [7,8,9]. This coloration is attributed to pigments produced—such as cinnabarinic acid, cinnabarin, and tramesanguin—derived from hydroxyanthranilic acid [7,10]. These pigments have been studied for their antioxidant and antibacterial activities, and more recently, for their anti-inflammatory properties [11]. However, various fermentation systems for their production have not yet been explored [8].
Bioreactors offer inherent advantages for culturing diverse microorganisms under controlled, reproducible conditions. For filamentous fungi, mechanically agitated tank systems can generate shear stress that damages the fungal mycelial structure [12,13]. Conversely, airlift systems generate lower shear stress, which helps minimize damage to fungal mycelia; however, they may impose oxygen-transfer limitations because dense mycelial structures or cellular aggregates can obstruct air or oxygen outlets. Finally, shaking flasks promote the formation of distinct pellet-like structures [14]. These variations among submerged fermentation systems can lead to distinct fungal mycelial morphologies; however, their influence on pigment production remains largely unexplored.
In addition to the production system, controlling variables such as the culture medium, temperature, aeration rate, and pH can alter the fungi’s physiological state and promote the biosynthesis of these pigments; this presents an opportunity to optimize the bioprocess by identifying the specific variables and the most suitable production system [15,16]. This study aims to evaluate submerged fermentation systems—FSK, ALR, and STR—to determine which system yields the highest concentration of cinnabarinic acid and to evaluate the growth-inhibitory activity of the crude extracts against E. coli and S. aureus.
2. Materials and Methods
2.1. Strain and Culture
Pycnoporus cinnabarinus strain HEMIM-53 was collected in August 2008 in the community of Quilamula, Tlaquiltenango, Morelos, Mexico (18.510885195534375, −99.01345646913141). We subsequently deposited the strain under accession code HEMIM-53 (Herbario Micrológico de Morelos, strain no. 53) in the fungi culture collection of the Center for Biological Research, Autonomous University of Morelos. The strain was cryopreserved in glycerol (20%) at −80 °C. The culture media used in this study were potato dextrose agar (PDA), modified Téllez–Téllez medium (MTM), and Téllez–Téllez medium (TM) [17]. The composition of MTM was as follows (g L−1): glucose, 10; yeast extract, 5; K2HPO4, 0.4; MgSO4, 0.5; CuSO4, 0.25; MnSO4, 0.05; and bacteriological agar, 15. The TM contained (g L−1): glucose, 10; yeast extract, 5; KH2PO4, 0.6; MgSO4, 0.5; K2HPO4, 0.4; CuSO4, 0.25; FeSO4, 0.05; MnSO4, 0.05; and ZnSO4, 0.001. The pH of the TM was adjusted to 6.5, whereas the pH of the MTM was adjusted to 4.5, 5.5, 6.5, 7.5, and 8.5 using 0.1 M NaOH or HCl. The MTM is used to evaluate the effect of pH on mycelial growth and apparent pigmentation, as it is unbuffered. In contrast, the TM is buffered and used for cultures in FSK, STR, and ALR systems.
To preserve the Pycnoporus cinnabarinus HEMIM-53 strain, a 3 mm mycelial disc excised from the colony margin was inoculated into a Petri dish containing PDA medium and stored at 4 °C for 30 days. For strain activation, a 3 mm mycelial disc excised from the actively growing colony margin with a cork borer and maintained at 4 °C was transferred to a Petri dish (100 mm) containing PDA and incubated at 28 °C for 7 days. To evaluate fungal growth and pigment production on solid media, a 3 mm mycelial disc excised with a cork borer from the margin of an actively growing colony was inoculated onto Petri dishes (100 mm) containing MTM. The medium pH was adjusted using 0.1 N HCl or NaOH. The plates were incubated at 28 °C for 5 days, and radial growth length was measured with a digital caliper every 12 h in the same orientation; the radial growth rate was calculated as the slope of the plot of length (y-axis) versus cultivation time (x-axis). Subsequently, apparent pigmentation was documented over 20 days via photographs. Finally, plates were dried in an oven at 60 °C for 24 h, and dry weight was recorded; mycelium was then removed, and the weight without mycelium was recorded. Mycelial density was determined by dividing the weight difference by the plate surface area (π × r2).
For flask FSK, 125 mL Erlenmeyer flasks containing 50 mL of TM were inoculated with three mycelial discs (3 mm) obtained from the activated strain. The cultures were incubated at 28 °C and 125 rpm. Samples were initially collected at 72 h and subsequently at 24 h intervals up to 408 h, with three independent replicates per condition. To obtain the crude extracts, the culture broth was first filtered through Whatman No. 4 filter paper and then centrifuged at 10,000× g for 10 min. The pH of the resulting supernatant was measured, and biomass was quantified by dry weight after drying at 60 °C for 24 h. The resulting crude extracts were stored at −80 °C until further analysis.
2.2. Biomass Determination and Mathematical Model
Biomass was determined from the difference in dry weight in FSK. A mathematical model based on the logistic growth equation was developed to estimate the specific growth rate:
Solution to the equation:
where:
X0 = Initial biomass concentration;
μ = Specific growth rate;
Xmax = Maximum biomass concentration obtained (X > 0);
Xcal = Biomass concentration calculated as a function of fermentation time.
The values of Xmax and μ were estimated by nonlinear least-squares fitting using the generalized reduced gradient method implemented in Microsoft Excel with the Solver tool [18].
2.3. Bioreactor Operation and Culture
For STR culture, a 3 L vessel (Applikon Biotechnology, Göteborg, Sweden) was operated at a working volume of 75% (2.25 L). The system was sterilized in situ with TM at 121 °C for 15 min. The bioreactor was inoculated with an inoculum prepared from a flask culture containing 0.165 g of mycelium harvested during the middle exponential growth phase previously determined in the FSK system. The culture was performed at 125 rpm with an aeration rate of 1 VVM (volume of air per volume of liquid per minute), equivalent to 135 L h−1 at room temperature (approximately 28 °C). The first sample was collected at 72 h, followed by sampling at 24 h intervals until 408 h. To prepare the crude extract, the culture broth was filtered through Whatman No. 4 filter paper and subsequently centrifuged at 10,000× g for 10 min. The pH and glucose concentration of the resulting supernatant were measured, and the crude extracts were stored at −80 °C until further analysis. Three independent experiments were performed.
For ALR culture, a concentric tube airlift reactor with a total capacity of 5.5 L was operated at a working volume of 75% (4.125 L). The reactor was 60 cm tall, with top and bottom diameters of 13.5 and 11 cm, respectively, and a diffuser diameter of 4 cm. The reactor containing TM was sterilized at 121 °C for 15 min. Subsequently, it was inoculated with 0.165 g of mycelium harvested from a flask culture during the middle exponential growth phase. The reactor was operated at an aeration rate of 1 VVM, equivalent to 250 L h−1, at room temperature (approximately 28 °C). The first sample was collected at 72 h, followed by sampling at 24 h intervals. To prepare the crude extract, the broth was filtered and subsequently centrifuged at 10,000× g for 10 min. The pH and glucose concentration of the resulting supernatant were measured, and the crude extracts were stored at −80 °C until further analysis. Three independent experiments were performed. Both bioreactors were inoculated with the same initial biomass, regardless of the working volume. It should also be noted that the bioreactors are not equipped with any type of sensor; consequently, these monitoring and control conditions are addressed in the results discussion section.
2.4. Determination of Glucose Consumption
For FSK, STR, and ALR systems, glucose consumption was quantified using the 3,5-dinitrosalicylic acid (DNS) colorimetric method (Miller, 1959) [19]. Crude extracts obtained from samples collected throughout the submerged culture processes were analyzed. Briefly, 50 μL of crude extract was mixed with 950 μL of distilled water and 2 mL of DNS reagent containing 1% 3,5-dinitrosalicylic acid, 0.2% phenol, 0.05% sodium sulfite, and 1% sodium hydroxide. The reaction mixture was heated in a boiling water bath for 5 min and subsequently cooled in an ice-water bath. Absorbance was measured at 575 nm using a SpectraMax® Plus 384 spectrophotometer (Molecular Devices, San José, CA, USA). Glucose concentration was calculated from the corresponding absorbance values using a glucose calibration curve.
2.5. Cinnabarinic and 3-Hydroxyanthranilic Acid Concentration
The wavelength (λ) corresponding to the approximate maximum absorbance of cinnabarinic acid (standard) was determined by spectrophotometric analysis. Aliquots (200 μL) of cinnabarinic acid (SML0096, Sigma-Aldrich, Merck KGaA, Darmstadt, Alemania) at concentrations of 0.5, 0.25, 0.125, 0.0615, 0.0312, 0.0156, 0.0078, 0.0039, and 0.00195 mg mL−1 were transferred to a 96-well microplate. The absorption spectrum was recorded using a SpectraMax® Plus 384 microplate reader (Molecular Devices) over the wavelength range of 350–600 nm at 25 nm intervals. Similarly, the absorption spectrum of 3-HAA (H9391, Sigma-Aldrich) was determined at the same concentrations. Spectral measurements were performed over the wavelength range of 200–750 nm at 50 nm intervals using the same microplate reader. Absorbance spectra were plotted for both compounds, and the approximate wavelength corresponding to maximum absorbance (λmax) was identified. A calibration curve of the concentrations (previously mentioned) versus the obtained absorbances allowed for the determination of the apparent concentration of both compounds in the crude extracts.
CA and 3-HAA were quantified in crude extracts at 216, 312 and 408 h by HPLC on an Agilent 1200 Infinity system equipped with a diode array detector (DAD) and a C-18 column HPS; 250 × 4.6 mm, 5 µm, 125 Å; Cat. No. 75018-25P. The method was adapted from Dias and Urban [10]. The sample was prepared by passing the crude extract through a 0.22 µm filter. Elution was performed with an acetonitrile/water gradient (10:90, 0–5 min; 60:40, 5–55 min; 100:0, 55–65 min; 10:90, 65–70 min) at 1 mL min−1 and 25 °C, with 100 µL injections. CA and 3-HAA were detected at 435 and 350 nm, respectively. Peak identity was confirmed by retention time and UV spectrum against authentic standards. Calibration curves were prepared with standards of 1.95–500 µg mL−1 (peak area versus concentration; Figure S1). The LOD and LOQ were not estimated.
2.6. BGIA on E. coli and S. aureus
The growth of Escherichia coli (ATCC 25922) and Staphylococcus aureus (ATCC 25923) was monitored by measuring absorbance at 595 nm using a SpectraMax® Plus 384 microplate reader (Molecular Devices). For BGIA assays, bacterial suspensions were adjusted to a 0.5 McFarland standard (approximately 1 × 10⁸ CFU mL−1), and 200 μL of the assay mixture was prepared by combining 100 μL of bacterial culture in Mueller–Hinton broth with 100 μL of crude extract (1:1 dilution) at different times, to an initial concentration of approximately 5 × 10⁷ CFU mL−1. Mueller–Hinton broth without extract was used as a blank control, Mueller–Hinton broth with TM (1:1 dilution) was used as the growth control, while ampicillin (34.94 µg/mL) was included as the antibiotic control. Absorbance at 595 nm was recorded for 12 h, and growth was expressed relative to the corresponding control after blank correction.
2.7. Laccase Activity and Zymography
Laccase activity was determined spectrophotometrically by monitoring the oxidation of 2,6-dimethoxyphenol (DMP) at 468 nm, using a cuvette with a 1 cm path length. The reaction mixture contained 2 mM 2,6-dimethoxyphenol (2,6-DMP) and 100 µL of enzyme extract in a final volume of 1 mL of either 100 mM sodium phosphate buffer (pH 6.5) or 100 mM sodium acetate buffer (pH 4.5). Reactions were carried out at 40 °C. The increase in absorbance was monitored over time, and the linear portion of the reaction curve was used to calculate the change in absorbance per minute (ΔA min−1) using a SpectraMax® Plus 384 reader (Molecular Devices). Laccase activity was calculated according to the Beer–Lambert law using an extinction coefficient of 27,500 M−1 cm−1 and a 1-cm optical path length. One international unit (IU) of laccase activity was defined as the amount of enzyme catalyzing the formation of 1 µmol of oxidized DMP per minute under the assay conditions. Enzyme activity was expressed as IU L−1 of enzymatic extract.
Laccase activity was detected by in-gel activity assay (zymography) after native polyacrylamide gel electrophoresis (native PAGE) on 12% polyacrylamide gels. Samples were prepared with a non-denaturing, non-reducing loading buffer (without SDS or reducing agents) and were not heated or subjected to any other denaturing treatment. Eighteen microliters of crude extract mixed with loading buffer were loaded per well, and electrophoresis was run at a constant voltage of 80 V. After electrophoresis, the gel was incubated in 2 mM 2,6-dimethoxyphenol (2,6-DMP) prepared in 100 mM sodium acetate buffer (pH 4.5) until activity bands appeared.
2.8. Statistical Analysis and Data Processing
The assumptions underlying the analysis of variance were evaluated before statistical testing. Normality was assessed by inspection of the residual distributions and the Shapiro–Wilk test, while homogeneity of variances was evaluated using the Brown–Forsythe test. Given the limited number of biological replicates (n = 3 per treatment), the results of the normality test were interpreted cautiously because of its low statistical power at small sample sizes. Variations in radial growth and mycelial density as a function of pH were analyzed using one-way analysis of variance (ANOVA) to assess differences among treatment means at a significance level of α = 0.05. The normality assumption was considered for the statistical analysis, and Tukey’s post hoc test was subsequently performed for multiple comparisons among pH treatments. Three biological replicates were evaluated for each pH level. For the quantification of CA and 3-HAA by HPLC, and for laccase activity, ANOVA was performed to assess differences in mean metabolite concentrations among the culture systems at the corresponding sampling times, using a significance level of α = 0.05. When significant differences were detected, Tukey’s post hoc test was used for multiple comparisons among culture systems. Three biological replicates were analyzed for FSK, whereas three independent fermentation runs were performed for STR and ALR systems. For the BGIA test, the area under the curve was calculated, and an ANOVA and Dunnett post hoc test were performed. Statistical analyses and graphs were generated using GraphPad Prism (Trial version).
3. Results
3.1. Radial Growth and Pigmentation
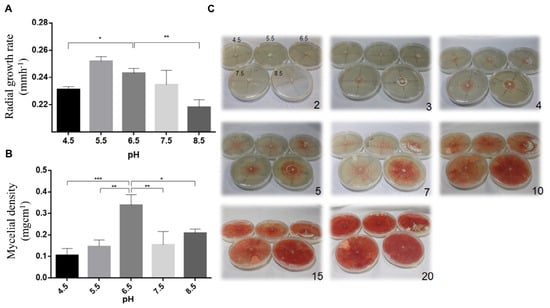
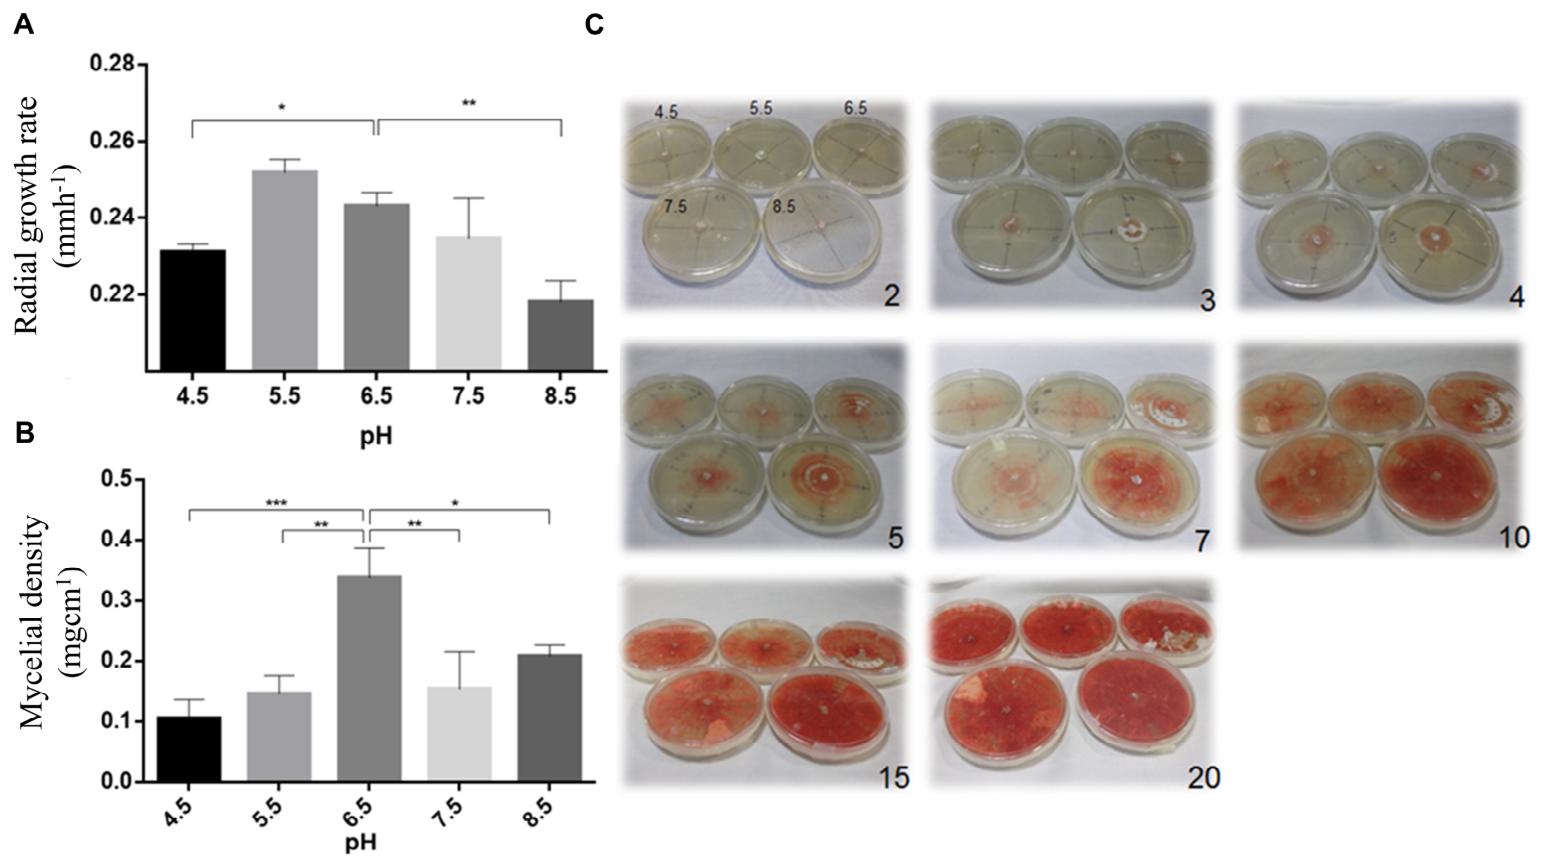
The effect of pH on the growth and pigmentation of Pycnoporus cinnabarinus HEMIM-53 was evaluated by determining the radial growth rate (RGR) and mycelial density (MD) of cultures grown on Petri dishes containing MTM at different pH values. Apparent pigmentation was also monitored over a 20-day culture period. As shown in Figure 1A, the highest RGR values were observed at pH 5.5, 6.5, and 7.5, reaching 0.252, 0.243, and 0.235 mm h−1, respectively. In contrast, lower RGR values were observed at pH 4.5 and 8.5, corresponding to the most acidic and alkaline conditions evaluated, respectively. These findings indicate that the radial growth of P. cinnabarinus HEMIM-53 was favored within the pH range of 5.5–7.5. The highest MD was observed at pH 6.5 (Figure 1B), which falls within the optimal pH range previously reported for the growth of this fungus [20]. Regarding pigmentation, during the early stages of culture, more intense apparent pigmentation was observed as the pH increased. However, these differences gradually decreased over time, and by day 15, pigmentation appeared visually similar among all tested pH conditions (Figure 1C).
Figure 1.
Effect of initial pH on the growth and apparent pigmentation of Pycnoporus cinnabarinus HEMIM-53. (A) Radial growth rate and (B) mycelial density of P. cinnabarinus HEMIM-53 cultivated on modified Téllez–Téllez medium (MTM) at different initial pH values. (C) Representative images showing colony growth and apparent pigmentation during 20 days of cultivation at pH 4.5, 5.5, 6.5, 7.5, and 8.5. Data in panels A and B represent the mean ± standard deviation of three independent biological replicates. Asterisks indicate significant differences among pH treatments (one-way ANOVA followed by Tukey’s multiple-comparison test, p < 0.05).
3.2. Growth and Morphological Characteristics in Submerged Fermentation Systems
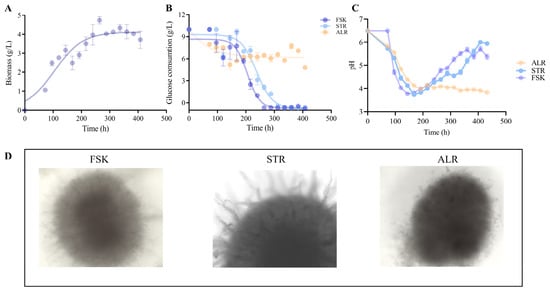
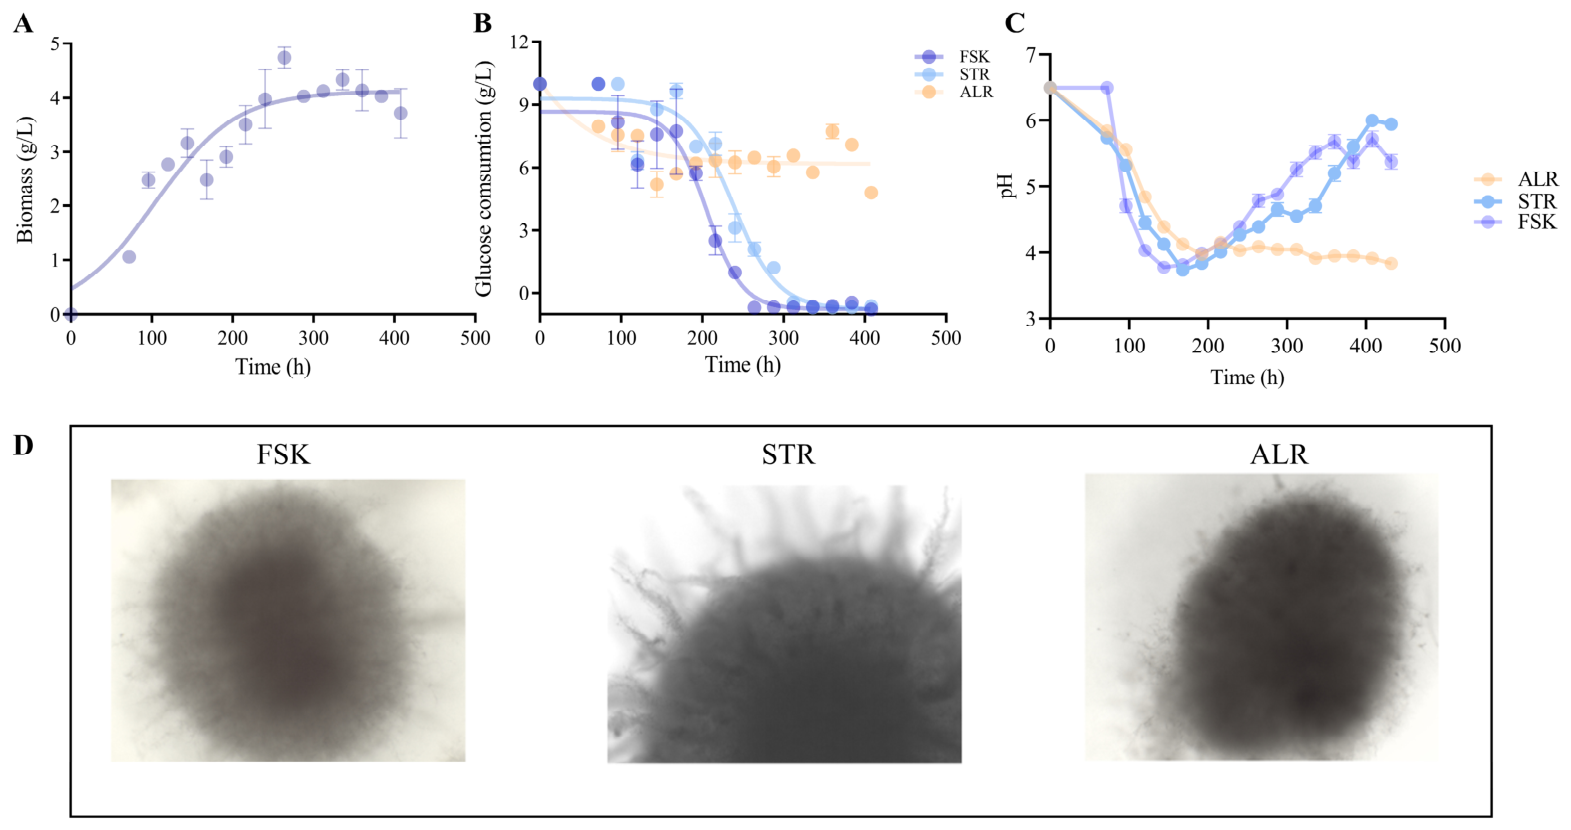
The growth kinetics of Pycnoporus cinnabarinus HEMIM-53 cultivated in the FSK system were evaluated, and the experimental biomass data were fitted to a logistic growth model (Figure 2A). The model estimated a maximum biomass concentration (Xmax) of 4.07 g L−1 and a specific growth rate (μ) of 0.018 h−1. The culture reached the stationary phase at approximately 250 h, coinciding with glucose depletion to undetectable levels (Figure 2A,B). Glucose consumption profiles varied in each culture system (Figure 2B). In the FSK system, glucose was completely depleted after approximately 250 h of culture, whereas depletion occurred later in STR. In contrast, glucose was only partially consumed in ALR, with a decrease of approximately 4 g L−1 relative to the initial concentration by the end of culture. These results indicate marked differences among the culture systems in substrate utilization.
Figure 2.
Growth, glucose consumption, pH profiles, and mycelial morphology of Pycnoporus cinnabarinus HEMIM-53 in different submerged fermentation systems. (A) Biomass growth kinetics of P. cinnabarinus HEMIM-53 in shake flask (FSK) cultures and fitting of the experimental data to the logistic growth model. (B) Glucose consumption profiles and (C) pH changes during cultivation in shake flask (FSK), stirred-tank reactor (STR), and airlift reactor (ALR) systems. (D) Representative optical microscopy images showing the mycelial morphology observed in the three submerged culture systems. Data represent the mean ± SD of three independent biological replicates or fermentation runs.
Distinct pH profiles were observed among the culture systems (Figure 2C). In both the FSK and STR systems, the pH decreased from an initial value of 6.5 to approximately 4.0, followed by a gradual increase to pH 6.0. The initial decrease occurred more rapidly in the FSK system. In ALR, the pH similarly decreased from 6.5 to approximately 4.0; however, it remained close to this value throughout the remainder of the culture period, without the subsequent increase observed in the FSK and STR systems. The total protein concentration in the crude extracts obtained from the three culture systems remained generally similar among the systems throughout most of the culture period. Finally, mycelial morphology differed according to the culture system, as observed by optical microscopy (Figure 2D). Mycelium obtained from the FSK and STR systems exhibited villus-like surface structures, which were particularly prominent in the STR system. In contrast, these structures were not evident in the mycelium cultivated in the ALR, suggesting that the hydrodynamic conditions associated with each culture system influenced mycelial morphology.
3.3. Cinnabarinic Acid Identification and Quantification
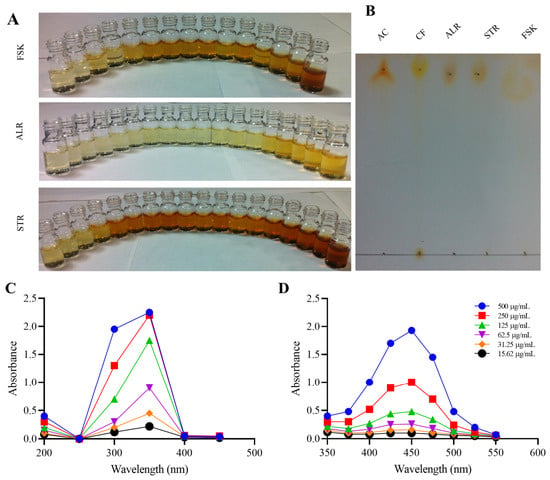
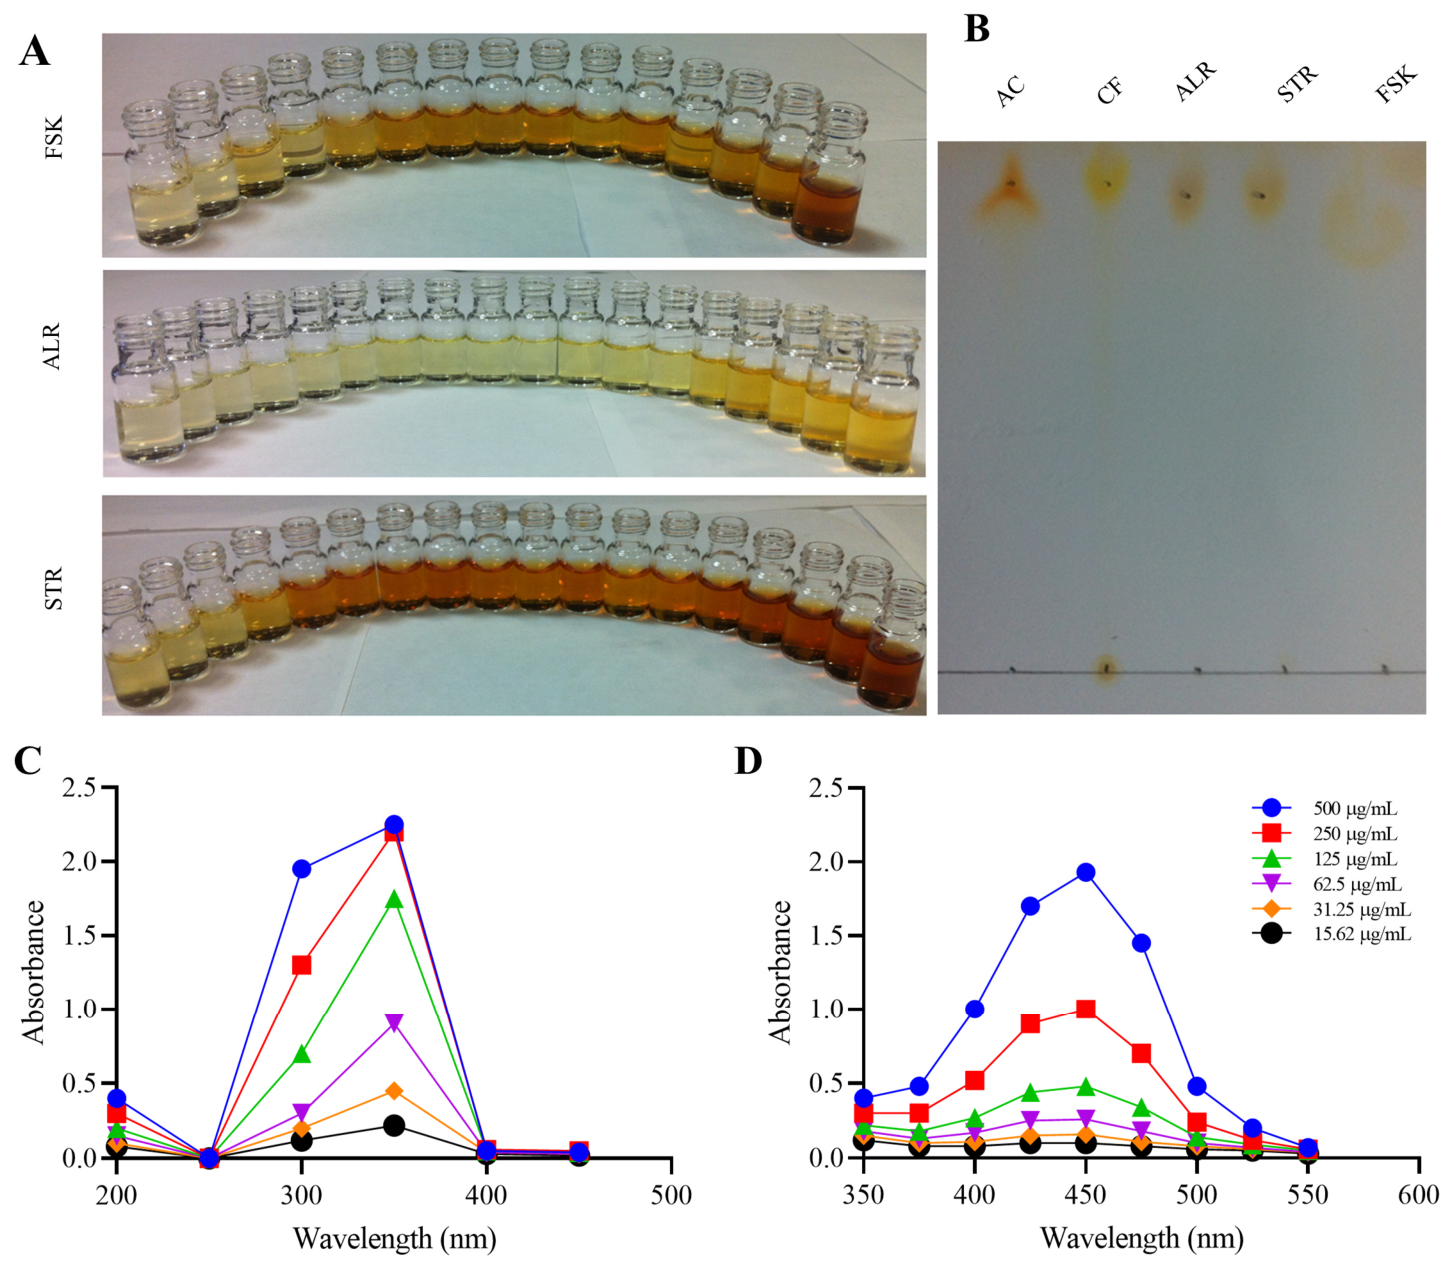
To identify and quantify CA and 3-HAA, color changes in crude extracts from the different culture systems were monitored throughout fermentation (Figure 3A). The presence of CA was then evaluated by thin-layer chromatography (TLC), and the absorption spectra of the CA and 3-HAA standards were recorded. The most pronounced color development was observed in the STR, followed by FSK and the ALR. The presence of CA in the crude extracts was determined by TLC using pure CA (SML0096, Sigma-Aldrich) and an extract obtained from the fruiting body of P. cinnabarinus HEMIM-53 as reference samples. TLC analysis detected signals matching the CA standard in samples from the STR and ALR systems, whereas no CA signal was detected in samples from the FSK system under the conditions used (Figure 3B). Absorption of the CA and 3-HAA standards showed λmax values of approximately 350 nm (Figure 3C) and 450 nm (Figure 3D), respectively. However, the wavelengths used for HPLC analysis, based on the literature, were 350 and 435 nm for 3-HAA and CA, respectively.
Figure 3.
Identification and spectrophotometric characterization of cinnabarinic acid (CA) and 3-hydroxyanthranilic acid (3-HAA) produced by Pycnoporus cinnabarinus HEMIM-53. (A) Changes in the coloration of crude extracts from FSK, STR, and ALR cultures during submerged fermentation. (B) Thin-layer chromatography (TLC) analysis of crude extracts from the different culture systems using pure CA and an extract from the fruiting body of P. cinnabarinus HEMIM-53 as reference samples. (C) Absorption spectrum of the 3-HAA standard used to estimate its wavelength of maximum absorbance (λmax). (D) Absorption spectrum of the CA standard used to estimate its wavelength of maximum absorbance (λmax).
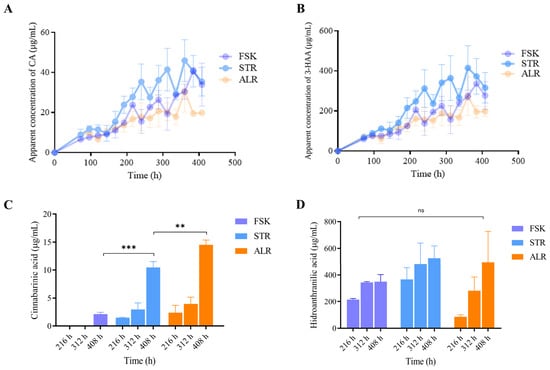
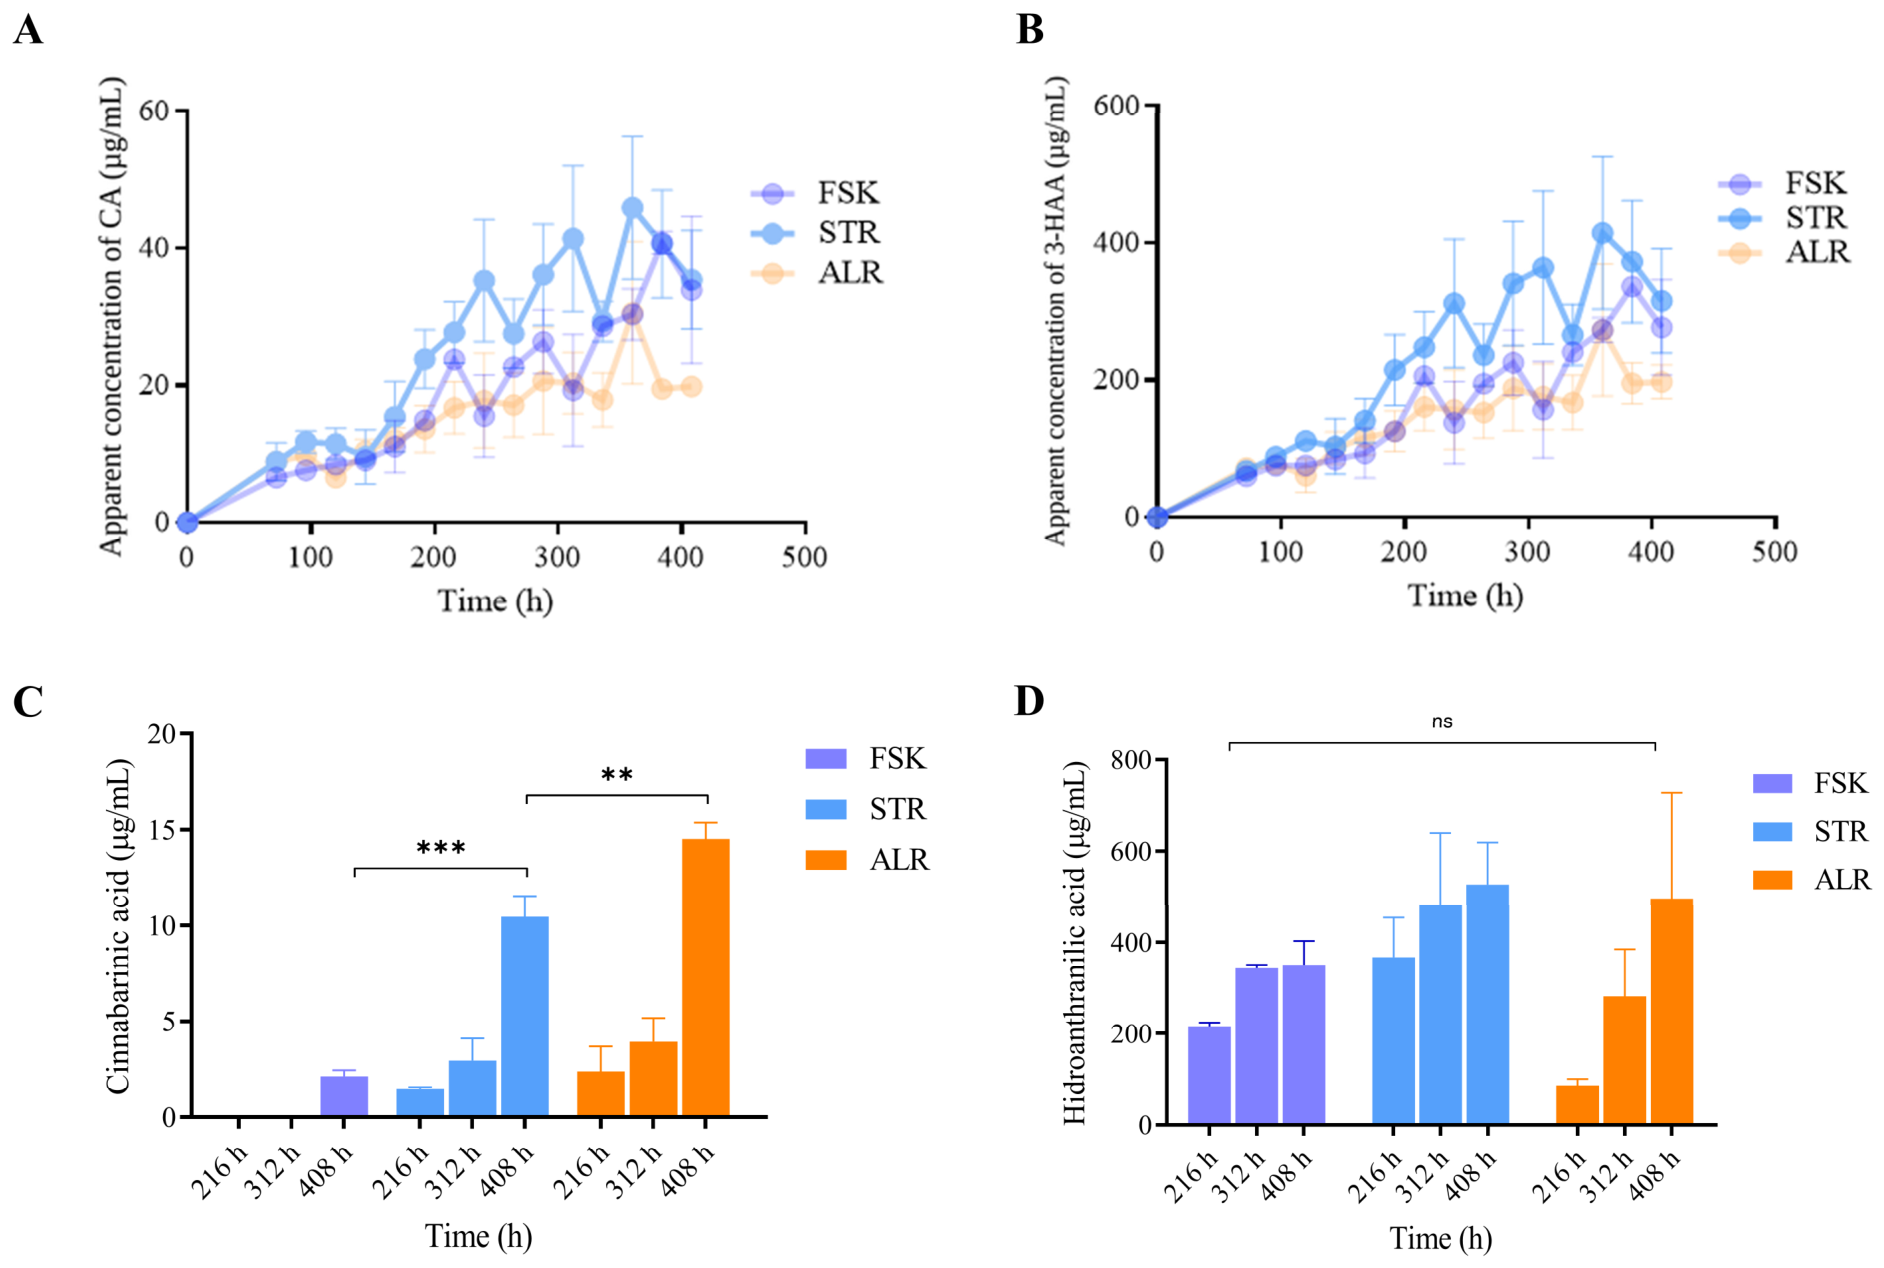
The concentrations of 3-HAA and CA produced in the culture systems were determined by HPLC and compared with the apparent concentrations estimated by spectrophotometry. Spectrophotometric analysis indicated that the STR had the highest apparent concentrations of both CA and 3-HAA, followed by the FSK, whereas the ALR had the lowest (Figure 4A,B). In contrast, HPLC analysis revealed a different profile among the three systems: at 408 h, the ALR reached a CA concentration of approximately 15 μg mL−1, compared with approximately 11 μg mL−1 in the STR and below 5 μg mL−1 in the FSK (Figure 4C). In contrast, 3-HAA reached approximately 500 μg mL−1 in all three systems, with no statistically significant differences among them (Figure 4D). Spectrophotometric and HPLC analyses yielded different estimates for both compounds, with the largest discrepancy observed for CA. Moreover, the ranking of the culture systems by CA concentration depended on the analytical method used, which highlights the limitations of spectrophotometry for estimating CA in crude fermentation extracts.
Figure 4.
Quantification of 3-hydroxyanthranilic acid (3-HAA) and cinnabarinic acid (CA) produced by Pycnoporus cinnabarinus HEMIM-53 in different submerged fermentation systems. Apparent concentrations of (A) CA and (B) 3-HAA estimated by spectrophotometric analysis, and concentrations of (C) CA and (D) 3-HAA determined by high-performance liquid chromatography (HPLC) in crude extracts obtained from shake flask (FSK), stirred-tank reactor (STR), and airlift reactor (ALR) cultures. HPLC analyses were performed at 216, 312, and 408 h of fermentation. Data represent the mean ± SD of three independent biological replicates. Asterisks indicate significant differences among culture systems at the corresponding sampling time (one-way ANOVA followed by Tukey’s multiple-comparison test, p < 0.05).
3.4. BGIA Assay of Crude Extracts
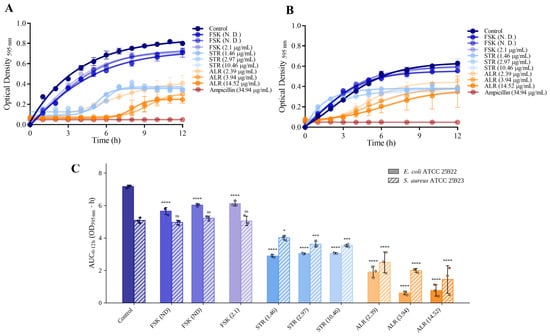
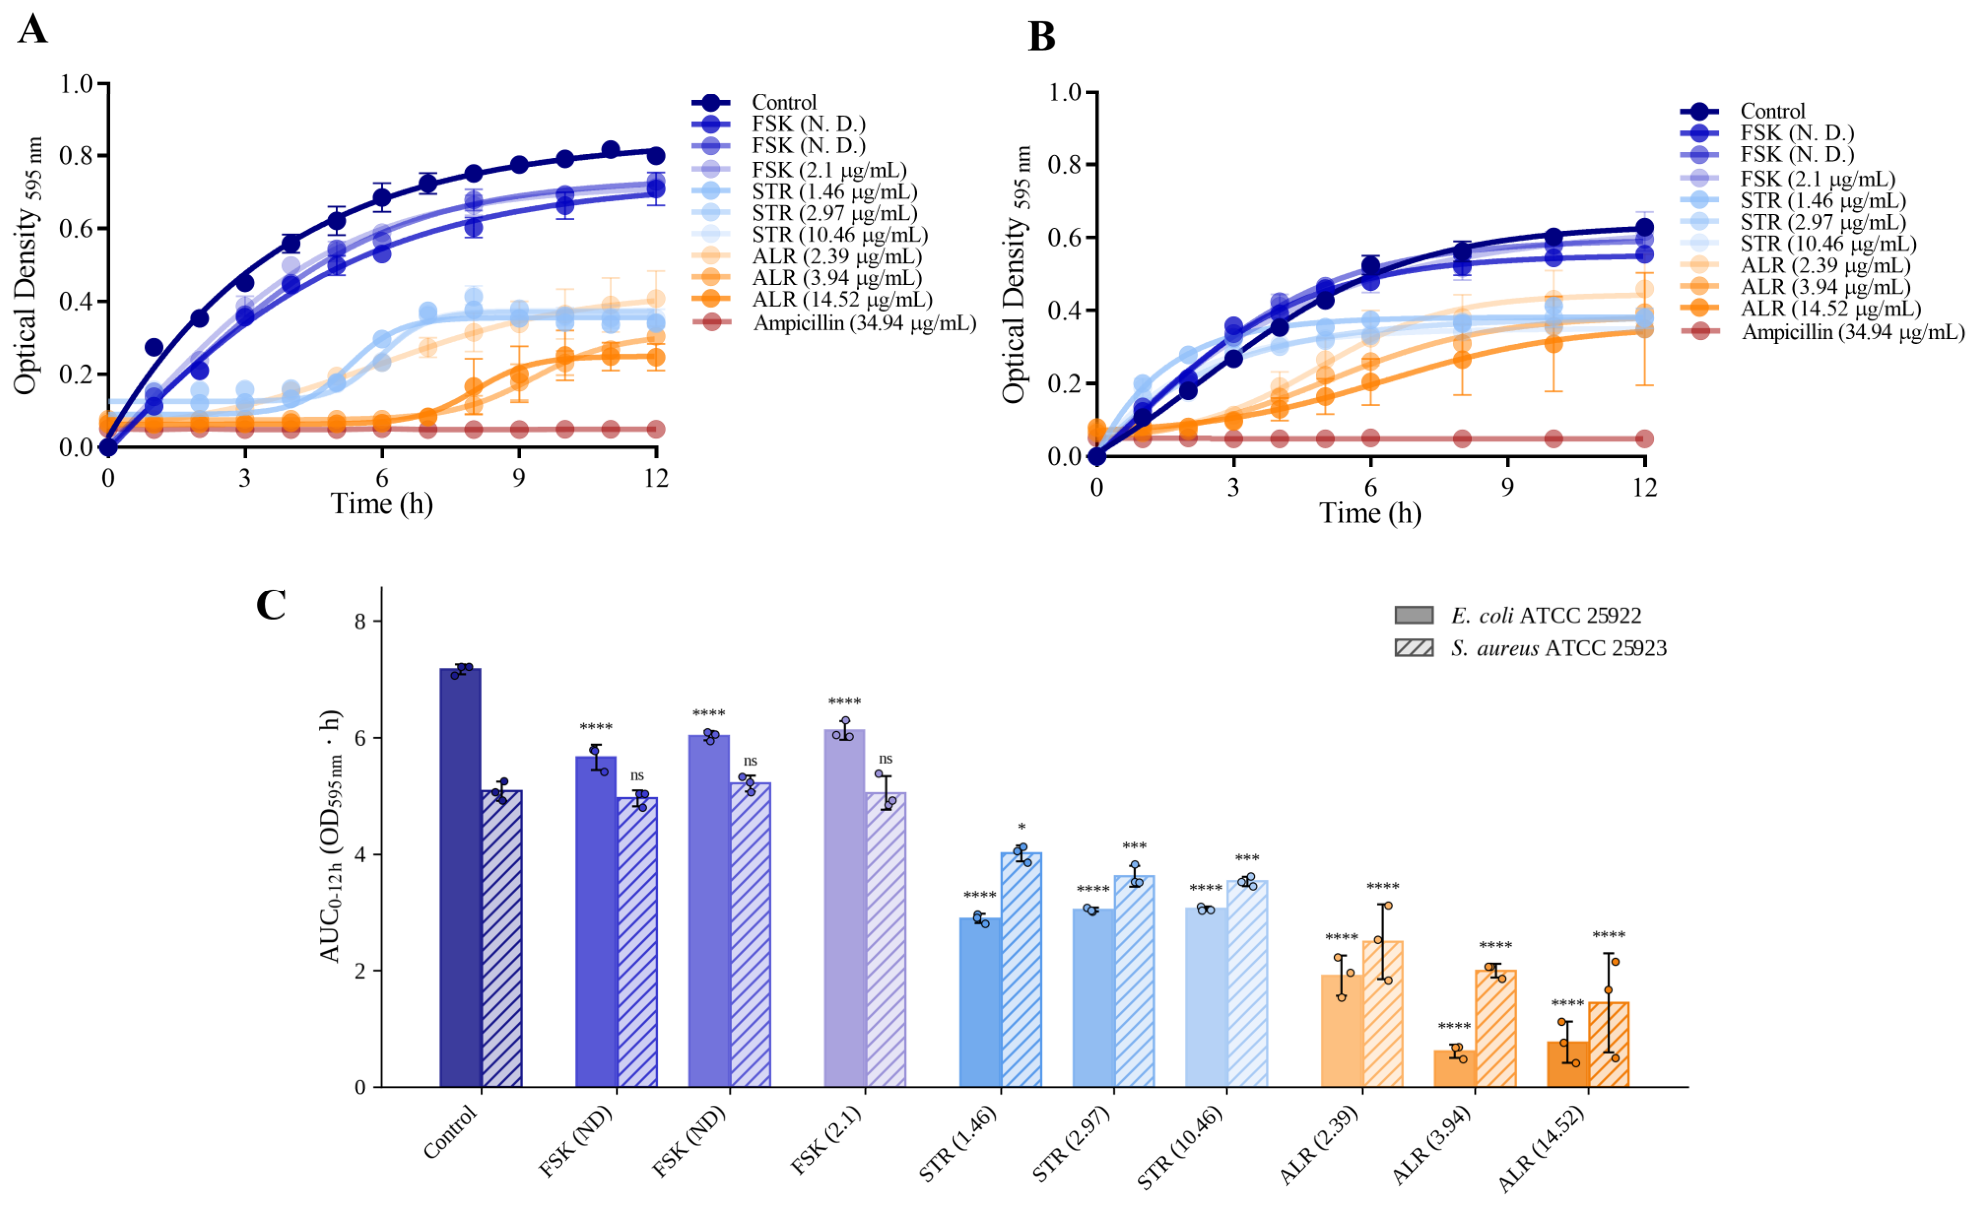
The BGIA of crude extracts obtained from Pycnoporus cinnabarinus HEMIM-53 cultivated in FSK, STR, and ALR systems was evaluated against Escherichia coli ATCC 25922 and Staphylococcus aureus ATCC 25923. BGIA was assessed by monitoring bacterial growth kinetics in the presence of crude extracts collected at different fermentation times (Figure 5). Extracts obtained from the FSK system showed low BGIA against both bacterial strains. In comparison, extracts from the STR system produced an apparent reduction in bacterial growth, whereas those obtained from the ALR exhibited an apparent BGIA effect against both E. coli and S. aureus (Figure 5A and Figure 5B, respectively). Compared with controls (AUC0−12h ≈ 7.2 for E. coli ATCC 25922 and ≈ 5.1 for S. aureus ATCC 25923), FSK reduced E. coli growth by only 15–21% (p < 0.0001) and had no significant effect on S. aureus at any concentration. STR decreased E. coli AUC by ~58–60% at all three concentrations, and S. aureus AUC by 22% at 1.46 µg mL−1 (p < 0.05) and by 29–31% at 2.97 µg mL−1 and 10.46 µg mL−1. ALR showed apparent inhibition: E. coli AUC fell by 74% at 2.39 µg mL−1 and by 89–92% at 3.94 µg mL−1 and 14.52 µg mL−1, while S. aureus AUC fell by 51%, 61%, and 71% at 2.39 µg mL−1, 3.94 µg mL−1, and 14.52 µg mL−1, respectively (Figure 5C).
Figure 5.
Bacterial growth-inhibitory activity (BGIA) of crude extracts from Pycnoporus cinnabarinus HEMIM-53 cultivated in different submerged fermentation systems. Growth kinetics of (A) Escherichia coli ATCC 25922 and (B) Staphylococcus aureus ATCC 25923 exposed to crude extracts collected at different cultivation times from shake-flask (FSK), stirred-tank reactor (STR), and airlift reactor (ALR) cultures. Bacterial growth was monitored by measuring optical density at 595 nm (OD595) for 12 h. Bacterial suspensions (approximately 5 × 10⁷ CFU mL−1 before mixing) were mixed 1:1 with the crude extracts to a final assay volume of 200 μL. Téllez–Téllez medium (TM) was used as the growth control, Mueller–Hinton broth as the blank, and ampicillin (34.94 µg/mL) as the antibiotic control. (C) Bacterial growth was quantified as the area under the OD595 curve from 0 to 12 h (AUC0–12 h). Bars represent the mean ± SD of three independent biological replicates; dots indicate individual values. Statistical comparisons were performed against the control for each bacterial species using one-way ANOVA followed by Dunnett’s post hoc test. Significance levels: ns, not significant; * p < 0.05; *** p < 0.001; **** p < 0.0001. Extract concentrations refer to the original crude extracts before 1:1 dilution. The number indicates the concentration, and N. D. indicates “not detected”.
4. Discussion
Initial pH affected both radial growth and mycelial density: growth was favored between pH 5.5 and 7.5, and the highest density occurred at pH 6.5. Pigmentation was initially more pronounced at higher pH but became less evident during prolonged culture, indicating that growth and pigment accumulation are not equivalent responses. The characteristic coloration of Pycnoporus results from phenoxazinones such as CA and cinnabarin [21]. Visual pigmentation and spectrophotometric analysis provide only preliminary information and cannot be used as a quantitative indicator of CA or 3-HAA.
Different initial culture conditions and configurations of the submerged fermentation system were associated with different growth patterns of Pycnoporus cinnabarinus HEMIM-53 and its CA production. Although growth was favored over a broad pH range, the hydrodynamic environments of FSK, STR, and ALR were associated with distinct patterns of substrate consumption, pH evolution, mycelial morphology, CA accumulation, and consequently BGIA. Previous studies have focused mainly on the CA biosynthetic pathway or on its optimization in a single culture configuration, and direct comparisons among submerged systems remain limited [11].
In submerged culture, biomass in FSK reached a maximum of approximately 4.07 g L−1 (specific growth rate 0.018 h−1), and the stationary phase coincided with glucose depletion. Glucose was completely or nearly completely consumed in FSK and STR, whereas a substantial fraction remained in the ALR. Therefore, the higher CA concentration in the ALR was not associated with greater carbon consumption. Mycelia from FSK, and particularly STR, showed villus-like peripheral structures that were less evident in the ALR, which is consistent with the different shear and mixing conditions inferred from mechanical agitation versus gas-driven circulation. The pH profiles also differed: in FSK and STR, pH decreased from 6.5 to approximately 4.0 and then rose to close to 6.0, whereas the ALR remained near 4.0 after the initial acidification. This acidic condition coincided with CA accumulation, but its role remains to be established. Although these pH values could influence the BGIA assay, the OD profiles at the lowest CA concentration (approximately the same pH) diverged between systems at ~200 h, indicating that pH alone does not account for the observed growth inhibition and that other extract metabolites likely contribute at this concentration; however, this information needs to be corroborated appropriate controls. The highest CA concentration was not associated with the most extensive mycelial development or the greatest glucose utilization, suggesting that growing state, rather than biomass alone, may be relevant for CA accumulation and other non-identified metabolites [6,22].
Analytical methods also gave different results. Spectrophotometric measurements suggested higher apparent CA and 3-HAA concentrations in the STR, whereas HPLC showed the highest CA concentration in the ALR at the final stage, an intermediate value in the STR, and the lowest in FSK, where CA was detectable only in the last sample. Since the samples were crude extracts, absorbance may include contributions from other metabolites with overlapping spectra, while chromatographic separation provides greater selectivity [7]. HPLC data were therefore used as the basis for comparing CA among systems, and pigmentation or absorbance alone should be interpreted cautiously in crude fermentation samples (Figure S1). Therefore, in this study, they are presented as additional information with apparent units.
The ALR culture also showed apparent BGIA against E. coli and S. aureus, coinciding with its higher CA concentration; however, this coincidence does not establish a causal relationship, since other metabolites in the extract may contribute to the activity. Although the assay presents aspects open to improvement, the wavelength of the pigments does not appear to interfere with the one used for OD measurement; however, this will need to be verified in the future. The culture systems were not fully comparable; these results should be interpreted only as showing that, under the conditions tested, the ALR yielded the highest CA concentration. Whether this represents a production advantage, and whether CA is responsible for the observed BGIA, requires further validation under standardized conditions and with assays using purified CA [23].
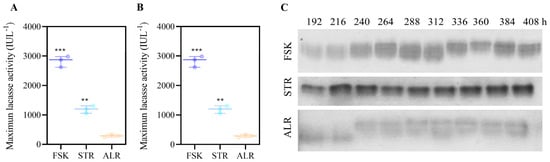
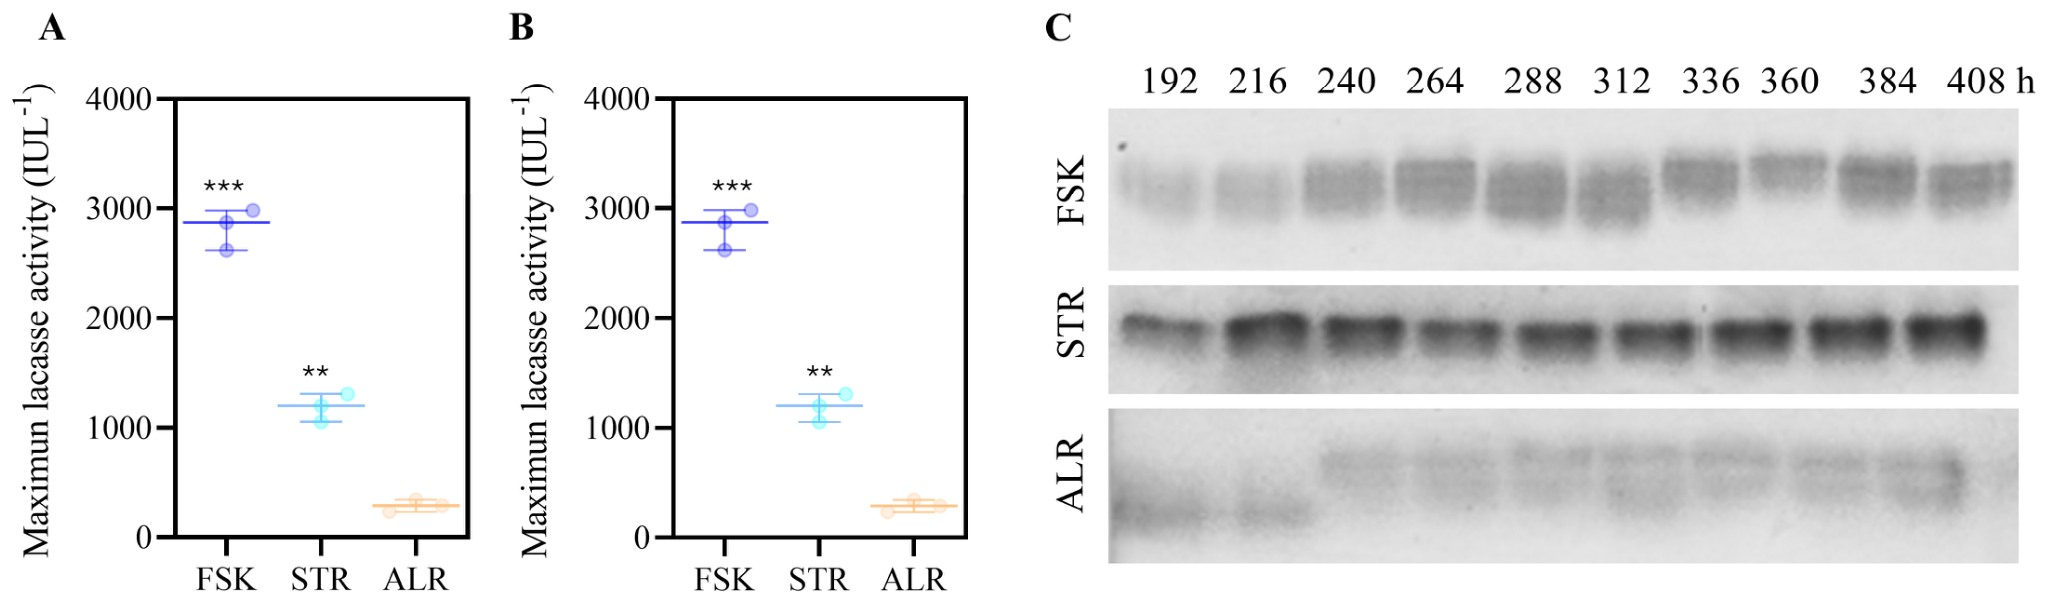
CA formation is mechanistically linked to laccase-mediated oxidative coupling of 3-HAA [5,6]. Both compounds were detected in all systems, but 3-HAA did not differ significantly among them, while CA was significantly higher in the ALR. This indicates that CA accumulation is not explained by precursor availability alone, and differences in conversion efficiency, oxygen availability, possible laccase isoform activity, copper-dependent oxidative activity, or extracellular conditions may contribute [18,24]. The importance of the oxidative step is supported by Yue et al. [25], who raised CA production in engineered Pseudomonas chlororaphis from 20.3 to 136.2 mg L−1 through pathway optimization and Cu2+ and H2O2 supplementation. However, extracellular laccase activity was highest in FSK, followed by STR, and substantially lower in the ALR. Zymography showed active laccase bands in all systems with differences in intensity. However, CA accumulation was not proportional to total laccase activity (Figure 6A); therefore, zymography does not establish the catalytic contribution of individual isoforms to 3-HAA oxidation (Figure 6B), and isoenzyme profiles, substrate specificity, oxygen transfer, pH, and CA stability were not evaluated. Therefore, another perspective is to investigate the possible production of isoforms [26,27].
Figure 6.
Extracellular laccase activity of Pycnoporus cinnabarinus HEMIM-53 in different submerged fermentation systems. (A) Maximum extracellular laccase activity during cultivation in shake flask (FSK), stirred-tank reactor (STR), and airlift reactor (ALR) systems, determined using 2,6-dimethoxyphenol (2,6-DMP) as substrate at pH 4.5. (B) Maximum extracellular laccase activity determined using 2,6-dimethoxyphenol (2,6-DMP) as substrate at pH 6.5. (C) Zymographic analysis showing extracellular laccase activity in crude extracts obtained at different fermentation times from the three culture systems. Data represent the mean ± SD of three independent biological replicates or fermentation runs. Asterisks indicate significant differences among culture systems at the corresponding sampling time (one-way ANOVA followed by Tukey’s multiple-comparison test, p < 0.05).
The ALR extract showed BGIA against E. coli and S. aureus, coinciding with the higher CA concentration. This coincidence does not establish causality, because Pycnoporus species produce several phenoxazinones and other extracellular metabolites that may contribute to the activity, and structural changes in CA can modify its antimicrobial effect [11,28]. Previous reports show that CA-containing extracts inhibit Gram-positive bacteria more strongly than Gram-negative bacteria and that CA is active against B. subtilis, B. cereus, and E. coli (MIC 300–400 μg mL−1) [29]. Assays with purified CA at concentrations equivalent to those quantified here, together with fractionation and chemical characterization of the extracts, are needed to define the contribution of CA to the BGIA observed.
This study has limitations that restrict its interpretation: (a) the three systems differed in volume, initial biomass concentration, aeration, agitation, and instrumentation (the reactors had no pH, dissolved oxygen, or temperature control), so system effects are confounded with scale and operating conditions; (b) biomass was measured only in FSK; therefore, yields and volumetric productivity could not be calculated for STR and ALR, and no definitive conclusions can be drawn regarding these parameters; (c) the extracts were crude culture supernatants whose pH and composition differed among systems including CA concentration; (d) growth inhibition was evaluated by kinetic curves with an inoculum (~5 × 10⁷ CFU mL−1) higher than that used in standard susceptibility testing, without MIC determination or tests with purified CA, so the contribution of CA could not be established.
5. Conclusions
Under the conditions tested, which were not comparable among systems, the three culture systems showed different patterns of glucose consumption, pH evolution, mycelial morphology, extracellular laccase activity, and CA concentration. CA concentration determined by HPLC was highest in the ALR. In contrast, extracellular laccase activity was higher in FSK and STR, indicating that laccase activity alone does not explain CA accumulation in these cultures. ALR extracts also showed growth inhibition against E. coli and S. aureus. However, because the extracts differed in pH and composition and the assays lacked uninoculated-medium, pH-adjusted, and purified-CA controls, we cannot attribute this inhibition to CA or to the culture configuration. These findings are descriptive and hypothesis-generating. Determining whether the ALR offers a production advantage and whether CA contributes to the inhibition will require matched operating conditions, biomass and yield measurements in all systems, validated CA quantification, and assays with purified CA at the concentrations present in the extracts.
Supplementary Materials
The following supporting information can be downloaded at: https://www.mdpi.com/article/10.3390/bioresourbioprod2040023/s1, Figure S1: HPLC calibration and chromatographic analysis of cinnabarinic acid (CA) and 3-hydroxyanthranilic acid (3-HAA).
Author Contributions
Conceptualization, E.C.V.V. and G.D.G.; methodology, V.H.G.P.; validation, V.H.G.P., E.C.V.V. and M.T.T.; formal analysis, V.H.G.P.; investigation, V.H.G.P.; resources, E.C.V.V.; data curation, V.H.G.P.; writing—original draft preparation, V.H.G.P. and E.Y.A.H.; writing—review and editing, O.G.P.; visualization, V.H.G.P.; supervision, E.C.V.V.; project administration, E.C.V.V.; funding acquisition, E.C.V.V. All authors have read and agreed to the published version of the manuscript.
Funding
This research received no external funding.
Data Availability Statement
The original contributions presented in the study are included in the article/Supplementary Material, further inquiries can be directed to the corresponding author.
Conflicts of Interest
The authors declare no conflicts of interest.
Abbreviations
The following abbreviations are used in this manuscript:
| 3-HAA | 3-Hydroxyanthranilic acid |
| ALR | Airlift reactor |
| ANOVA | Analysis of variance |
| ATCC | American Type Culture Collection |
| AUC | Area under the curve |
| BGIA | Bacterial Growth Inhibitory Activity |
| CA | Cinnabarinic acid |
| CFU | Colony-forming unit |
| DAD | Diode array detector |
| DMP | 2,6- Dimethoxyphenol |
| DNS | 3,5-Dinitrosalicylic acid |
| FSK | Shake flask |
| HPLC | High-performance liquid chromatography |
| IU | International units |
| LOD | Limit of detection |
| LOQ | Limit of quantification |
| MD | Mycelial density |
| HEMIM | HErbario MIcológico de Morelos |
| MIC | Minimum inhibitory concentration |
| MTM | Modified Téllez–Téllez Medium |
| OD | Optical density |
| PAGE | Polyacrylamide gel electrophoresis |
| RGR | Radial growth rate |
| SD | Standard deviation |
| SDS | Sodium dodecyl sulfate |
| STR | Stirred tank reactor |
| TLC | Thin-layer chromatography |
| TM | Téllez–Téllez Medium |
| VVM | Volume of gas per volume of liquid per minute |
References
- Bharadwaj, A.; Rastogi, A.; Pandey, S.; Gupta, S.; Sohal, J.S. Multidrug-Resistant Bacteria: Their Mechanism of Action and Prophylaxis. BioMed Res. Int. 2022, 2022, 5419874. [Google Scholar] [CrossRef] [Scilit] [PubMed]
- Caruso, D.J.; Palombo, E.A.; Moulton, S.E.; Zaferanloo, B. Exploring the Promise of Endophytic Fungi: A Review of Novel Antimicrobial Compounds. Microorganisms 2022, 10, 1990. [Google Scholar] [CrossRef] [Scilit] [PubMed]
- Mulani, M.S.; Kamble, E.E.; Kumkar, S.N.; Tawre, M.S.; Pardesi, K.R. Emerging Strategies to Combat ESKAPE Pathogens in the Era of Antimicrobial Resistance: A Review. Front. Microbiol. 2019, 10, 539. [Google Scholar] [CrossRef] [Scilit] [PubMed]
- Dishliyska, V.; Miteva-Staleva, J.; Gocheva, Y.; Stoyancheva, G.; Yovchevska, L.; Abrashev, R.; Spasova, B.; Angelova, M.; Krumova, E. Biological Potential of Extremophilic Filamentous Fungi for the Production of New Compounds with Antimicrobial Effect. Fermentation 2025, 11, 347. [Google Scholar] [CrossRef] [Scilit]
- Eggert, C. Laccase-Catalyzed Formation of Cinnabarinic Acid Is Responsible for Antibacterial Activity of Pycnoporus cinnabarinus. Microbiol. Res. 1997, 152, 315–318. [Google Scholar] [CrossRef] [Scilit] [PubMed]
- Eggert, C.; Temp, U.; Dean, J.F.D.; Eriksson, K.E.L. Laccase-Mediated Formation of the Phenoxazinone Derivative, Cinnabarinic Acid. FEBS Lett. 1995, 376, 202–206. [Google Scholar] [CrossRef] [Scilit] [PubMed]
- Sullivan, G.; Henry, E.D. Occurrence and Distribution of Phenoxazinone Pigments in the Genus Pycnoporus. J. Pharm. Sci. 1971, 60, 1097–1098. [Google Scholar] [CrossRef] [Scilit] [PubMed]
- Meng, D.; Shao, X.; Luo, S.P.; Tian, Q.P.; Liao, X.R. Pigment Production by a Newly Isolated Strain Pycnoporus Sanguineus SYBC-L7 in Solid-State Fermentation. Front. Microbiol. 2022, 13, 1015913. [Google Scholar] [CrossRef] [Scilit] [PubMed]
- Karunarathna, S.C.; Tibpromma, S.; Lu, W.; Perera, H.; Tarafder, E.; Karunarathna, B.S.; Dai, D.Q.; Kumla, J.; Karunanayake, C.; Hapuarachchi, K.K.; et al. Basidiomycete Pigments as Sustainable Food Colorants and Stabilizers: From Fungal Biology to Industrial Potential. Front. Microbiol. 2025, 16, 1725536. [Google Scholar] [CrossRef] [Scilit] [PubMed]
- Dias, D.A.; Urban, S. HPLC and NMR Studies of Phenoxazone Alkaloids from Pycnoporus cinnabarinus. Nat. Prod. Commun. 2009, 4, 489–498. [Google Scholar] [CrossRef] [Scilit]
- Romero-Arenas, O.; Jara Y Rivera, A.P.; Valencia de Ita, M.A.; Lezama, C.P.; Villa-Ruano, N.; Rivera, A. In Vitro Antimicrobial Activity of Cinnabarin on Xanthomonas Campestris Isolated from Bean Crops of Puebla, Mexico. Appl. Sci. 2021, 11, 5391. [Google Scholar] [CrossRef] [Scilit]
- Zhao, X.; Chai, J.; Wang, F.; Jia, Y. Optimization of Submerged Culture Parameters of the Aphid Pathogenic Fungus Fusarium Equiseti Based on Sporulation and Mycelial Biomass. Microorganisms 2023, 11, 190. [Google Scholar] [CrossRef] [Scilit] [PubMed]
- Waldherr, P.; Bliatsiou, C.; Böhm, L.; Kraume, M. Fragmentation of Aspergillus Niger Pellets in Stirred Tank Bioreactors Due to Hydrodynamic Stress. Chem. Eng. Res. Des. 2023, 195, 116–131. [Google Scholar] [CrossRef] [Scilit]
- Cheng, C.Y.; Wang, Y.S.; Wang, Z.L.; Bibi, S. Innovative Approaches to Fungal Food Production: Mycelial Pellet Morphology Insights. Foods 2023, 12, 3477. [Google Scholar] [CrossRef] [Scilit] [PubMed]
- Deshmukh, A.; Sattikar, P.; Sukhatankar, A.; Wakade, G.; Kumbhar, P.; Kommoju, P.R. Optimized Laccase Production from the White Rot Fungi Pleurotus Ostreatus and Trametes Versicolor. Protein Expr. Purif. 2026, 237, 106813. [Google Scholar] [CrossRef] [Scilit] [PubMed]
- Cheute, V.M.S.; Backes, E.; Pateis, V.d.O.; de Oliveira Junior, V.A.; Uber, T.M.; dos Santos Filho, J.R.; dos Santos, L.F.O.; Castoldi, R.; de Souza, C.G.M.; Polonio, J.C. Optimization of Immobilization, Characterization, and Environmental Applications of Laccases from Pycnoporus Sanguineus UEM-20. Processes 2025, 13, 1800. [Google Scholar] [CrossRef] [Scilit]
- Téllez-Téllez, M.; Fernández, F.J.; Montiel-González, A.M.; Sánchez, C.; Díaz-Godínez, G. Growth and Laccase Production by Pleurotus ostreatus in Submerged and Solid-State Fermentation. Appl. Microbiol. Biotechnol. 2008, 81, 675–679. [Google Scholar] [CrossRef] [Scilit] [PubMed]
- Tlecuitl-Beristain, S.; Sánchez, C.; Loera, O.; Robson, G.D.; Díaz-Godínez, G. Laccases of Pleurotus Ostreatus Observed at Different Phases of Its Growth in Submerged Fermentation: Production of a Novel Laccase Isoform. Mycol. Res. 2008, 112, 1080–1084. [Google Scholar] [CrossRef] [Scilit] [PubMed]
- Miller, G.L. Use of Dinitrosalicylic Acid Reagent for Determination of Reducing Sugar. Anal. Chem. 1959, 31, 426–428. [Google Scholar] [CrossRef] [Scilit]
- Gross, B.; Yonnet, G.; Picque, D.; Brunerie, P.; Corrieu, G.; Asther, M. Production of Methylanthranilate by the Basidiomycete Pycnoporus cinnabarinus (Karst.). Appl. Microbiol. Biotechnol. 1990, 34, 387–391. [Google Scholar] [CrossRef] [Scilit]
- Téllez-Téllez, M.; Villegas, E.; Rodríguez, A.; O’Donovan, A.; Díaz-Godínez, G. Fungi of Pycnoporus: Morphological and Molecular Identification, Worldwide Distribution and Biotechnological Potential. Mycosphere 2016, 7, 1500–1525. [Google Scholar] [CrossRef] [Scilit]
- Li, K.; Horanyi, P.S.; Collins, R.; Phillips, R.S.; Eriksson, K.E.L. Investigation of the Role of 3-Hydroxyanthranilic Acid in the Degradation of Lignin by White-Rot Fungus Pycnoporus cinnabarinus. Enzym. Microb. Technol. 2001, 28, 301–307. [Google Scholar] [CrossRef] [Scilit] [PubMed]
- Göçenoğlu, A.; Pazarlioglu, N. Cinnabarinic Acid: Enhanced Production from Pycnoporus cinnabarinus, Characterization, Structural and Functional Properties. Hacet. J. Biol. Chem. 2014, 42, 281–290. [Google Scholar] [CrossRef] [Scilit]
- Takur, K.R.; Kohli, M.; Pande, K.; Malik, A.; Deshmukh, A.; Kayal, A.; Kommoju, P.R.; Kulkarni, N. In Silico Studies Disclose the Underlying Link between Binding Affinity and Redox Potential in Laccase Isoforms. J. Biomol. Struct. Dyn. 2023, 41, 7265–7276. [Google Scholar] [CrossRef] [Scilit] [PubMed]
- Yue, S.J.; Song, C.; Li, S.; Huang, P.; Guo, S.Q.; Hu, H.B.; Wang, W.; Zhang, X.H. Synthesis of Cinnabarinic Acid by Metabolically Engineered Pseudomonas Chlororaphis GP72. Biotechnol. Bioeng. 2019, 116, 3072–3083. [Google Scholar] [CrossRef] [Scilit] [PubMed]
- Othman, A.M.; Elsayed, M.A.; Elshafei, A.M.; Hassan, M.M. Purification and Biochemical Characterization of Two Isolated Laccase Isoforms from Agaricus Bisporus CU13 and Their Potency in Dye Decolorization. Int. J. Biol. Macromol. 2018, 113, 1142–1148. [Google Scholar] [CrossRef] [Scilit] [PubMed]
- Yuan, X.; Tian, G.; Zhao, Y.; Zhao, L.; Wang, H.; Ng, T.B. Biochemical Characteristics of Three Laccase Isoforms from the Basidiomycete Pleurotus nebrodensis. Molecules 2016, 21, 203. [Google Scholar] [CrossRef] [Scilit] [PubMed]
- Schinagl, C.W.; Siewert, B.; Hammerle, F.; Spes, G.; Peintner, U.; Schlierenzauer, M.; Vrabl, P. Growth, Morphology, and Formation of Cinnabarin in Pycnoporus cinnabarinus in Relation to Different Irradiation Spectra. Photochem. Photobiol. Sci. 2023, 22, 2861–2875. [Google Scholar] [CrossRef] [Scilit] [PubMed]
- Kakoti, M.; Dullah, S.; Hazarika, D.J.; Barooah, M.; Boro, R.C. Cinnabarinic Acid from Trametes coccinea Fruiting Bodies Exhibits Antibacterial Activity through Inhibiting the Biofilm Formation. Arch. Microbiol. 2022, 204, 173. [Google Scholar] [CrossRef] [Scilit] [PubMed]
Disclaimer/Publisher’s Note: The statements, opinions and data contained in all publications are solely those of the individual author(s) and contributor(s) and not of MDPI and/or the editor(s). MDPI and/or the editor(s) disclaim responsibility for any injury to people or property resulting from any ideas, methods, instructions or products referred to in the content. |
© 2026 by the authors. Licensee MDPI, Basel, Switzerland. This article is an open access article distributed under the terms and conditions of the Creative Commons Attribution (CC BY) license.