


Abstract
The amount of time office workers spend seated poses multiple health risks and has been associated with increased musculoskeletal pain. To evaluate the potential association of discomfort and computer utilization with workstation type, we conducted a retrospective analysis of data collected at a large US company as part of their corporate wellness initiative. Workers had either an electric height-adjustable or a traditional desk for more than a year prior to the data collection phase. Data collected included participants’ discomfort levels and multiple objective measures of computer utilization as captured by the office ergonomic software package, RSI Guard. Data were collected over a year-long period and reported for each participant (n ≈ 10,145). After a year, the percentage of participants reporting no discomfort increased by 2.4%. Active computing time was reviewed for the two categories, with traditional users having 2.95 h per day while the height-adjustable desk users had 3.66 h per day (p < 0.001). This difference in active computing time equates to 43 additional active minutes per day for individuals with access to height-adjustable workstations. Findings suggest that individuals with access to height-adjustable workstations may be associated with increased computer use and negligible changes in discomfort over a one-year period.
1. Introduction
Workplace wellness programs have become more common at large companies collecting data that can be included as part of a total worker health initiative. According to the National Institute for Occupational Safety and Health (NIOSH), “Total Worker Health® (TWH) is defined as policies, programs and practices that integrate protection from work-related safety and health hazards with promotion of injury and illness prevention efforts to advance worker well-being” [1]. As a result of this focus, the integration of corporate wellness programs and employee health is becoming a routine occurrence. In 2004, NIOSH advocated for the integration of occupational health and safety efforts within the workplace at the Total Worker Health (TWH) Symposium in Washington, DC [2], which was based on priorities outlined by NIOSH for the future program advances needed in workplace health promotion [3]. More recently, NIOSH focused its efforts on “Productive Aging and Work” to offer employers the needed resources to create a productive and safe workplace for all employees during all phases of their career [4]. While these efforts are not exclusively limited to office workers, this initiative can be applied to a variety of jobs that are sedentary in nature and individuals who may have predisposing risk factors.
Researchers have identified several health risks associated with increased sedentary activity [5,6,7,8], and many studies have recognized that musculoskeletal pain is often linked to increased occupational seated time and the resulting sedentary activity at work [9,10,11]. Healey and colleagues (2012) suggest that musculoskeletal symptoms among individuals using computers could be as high as 50%. Additionally, some researchers have suggested that environmental conditions and poor workplace design could play a large role in the increase in reported musculoskeletal discomfort and pain at work [12]. In many cases, the workstation design directly impacts an employee’s choice to sit or stand, which will often translate into the amount of seated time. As more information about the risks of occupational sedentary time is identified, many researchers are investigating potential interventions to reduce occupational seated time and the associated health hazards [13,14,15,16,17].
Many studies have assessed the use of sit-stand workstations, commonly referred to as height-adjustable workstations, in the hopes of modifying health risks [18,19,20,21,22]. Workers who have height-adjustable workstations can vary their work postures over the course of the workday, which may reduce sedentary time at work. Results often depend on the specific study design, which can include type of work, location, as well as the variables selected for assessment. While there are several publications that address workplace interventions and sedentary time, most of these studies do not review long-term use of potential interventions. Those that do evaluate workstation interventions, including the in-situ study by Sharma et al., reviewed sit-stand interventions for three months [23], and the natural experiment by Zhu et al. on long-term effects of sit-stand workstations considered 4 months to be long-term [24]. The purposes of this analysis were to: (1) examine computer use characteristics and physical discomfort among a large census of employees for one year; and (2) compare changes in computer use and discomfort based on the employees’ workstation configuration. Like many recently published studies, the current analysis groups workstations that allow the user to work in a standing posture together, referring to them as height-adjustable workstations, and compares them to individuals who use a traditional workstation. The research team reviewed computer use and associated discomfort for a large part of the organization’s office employees. With NIOSH’s TWH efforts, many companies have a genuine interest in employee health as well as workforce productivity. While most sedentary behavior interventions are unlikely to produce measurable short-term results, potential increases in computer use might be able to show return on investment (ROI) in weeks and months rather than years.
2. Materials and Methods
A California company employing 24,000 individuals in the energy sector organized data collection for this project. Employees occupied various job types, many of which required the use of a computer as part of their daily work duties. Employees who participated in the data collection identified the type of work that they engaged in rather than their job title. Individuals were asked to choose one of the following options: “(1) Moderate levels of both keyboard and mouse work; (2) Precision mouse work (Graphic Design, Computer-aided Design (CAD), etc.); or (3) Keyboard intensive work (data entry, spreadsheet work, etc.)” [25]. The organization employs professionals from several sectors, including Business Analysts and Specialists, Information Technology Experts, Call Routing Analysts, Customer Service Specialists, Human Resources, Employee Relations, Accounting Managers, Utility Workers, Safety Specialists, Electricians, Mechanics, Engineers, and Scientists and Metallurgists—among many other job titles.
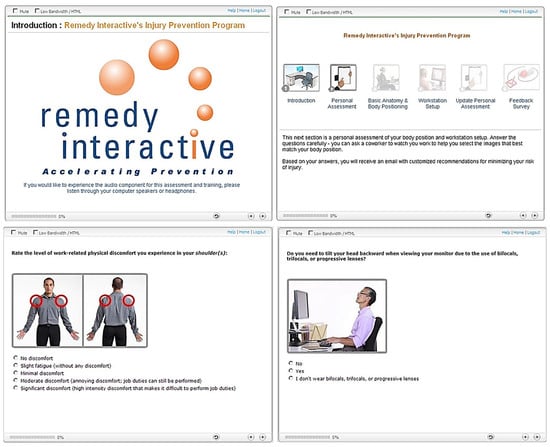
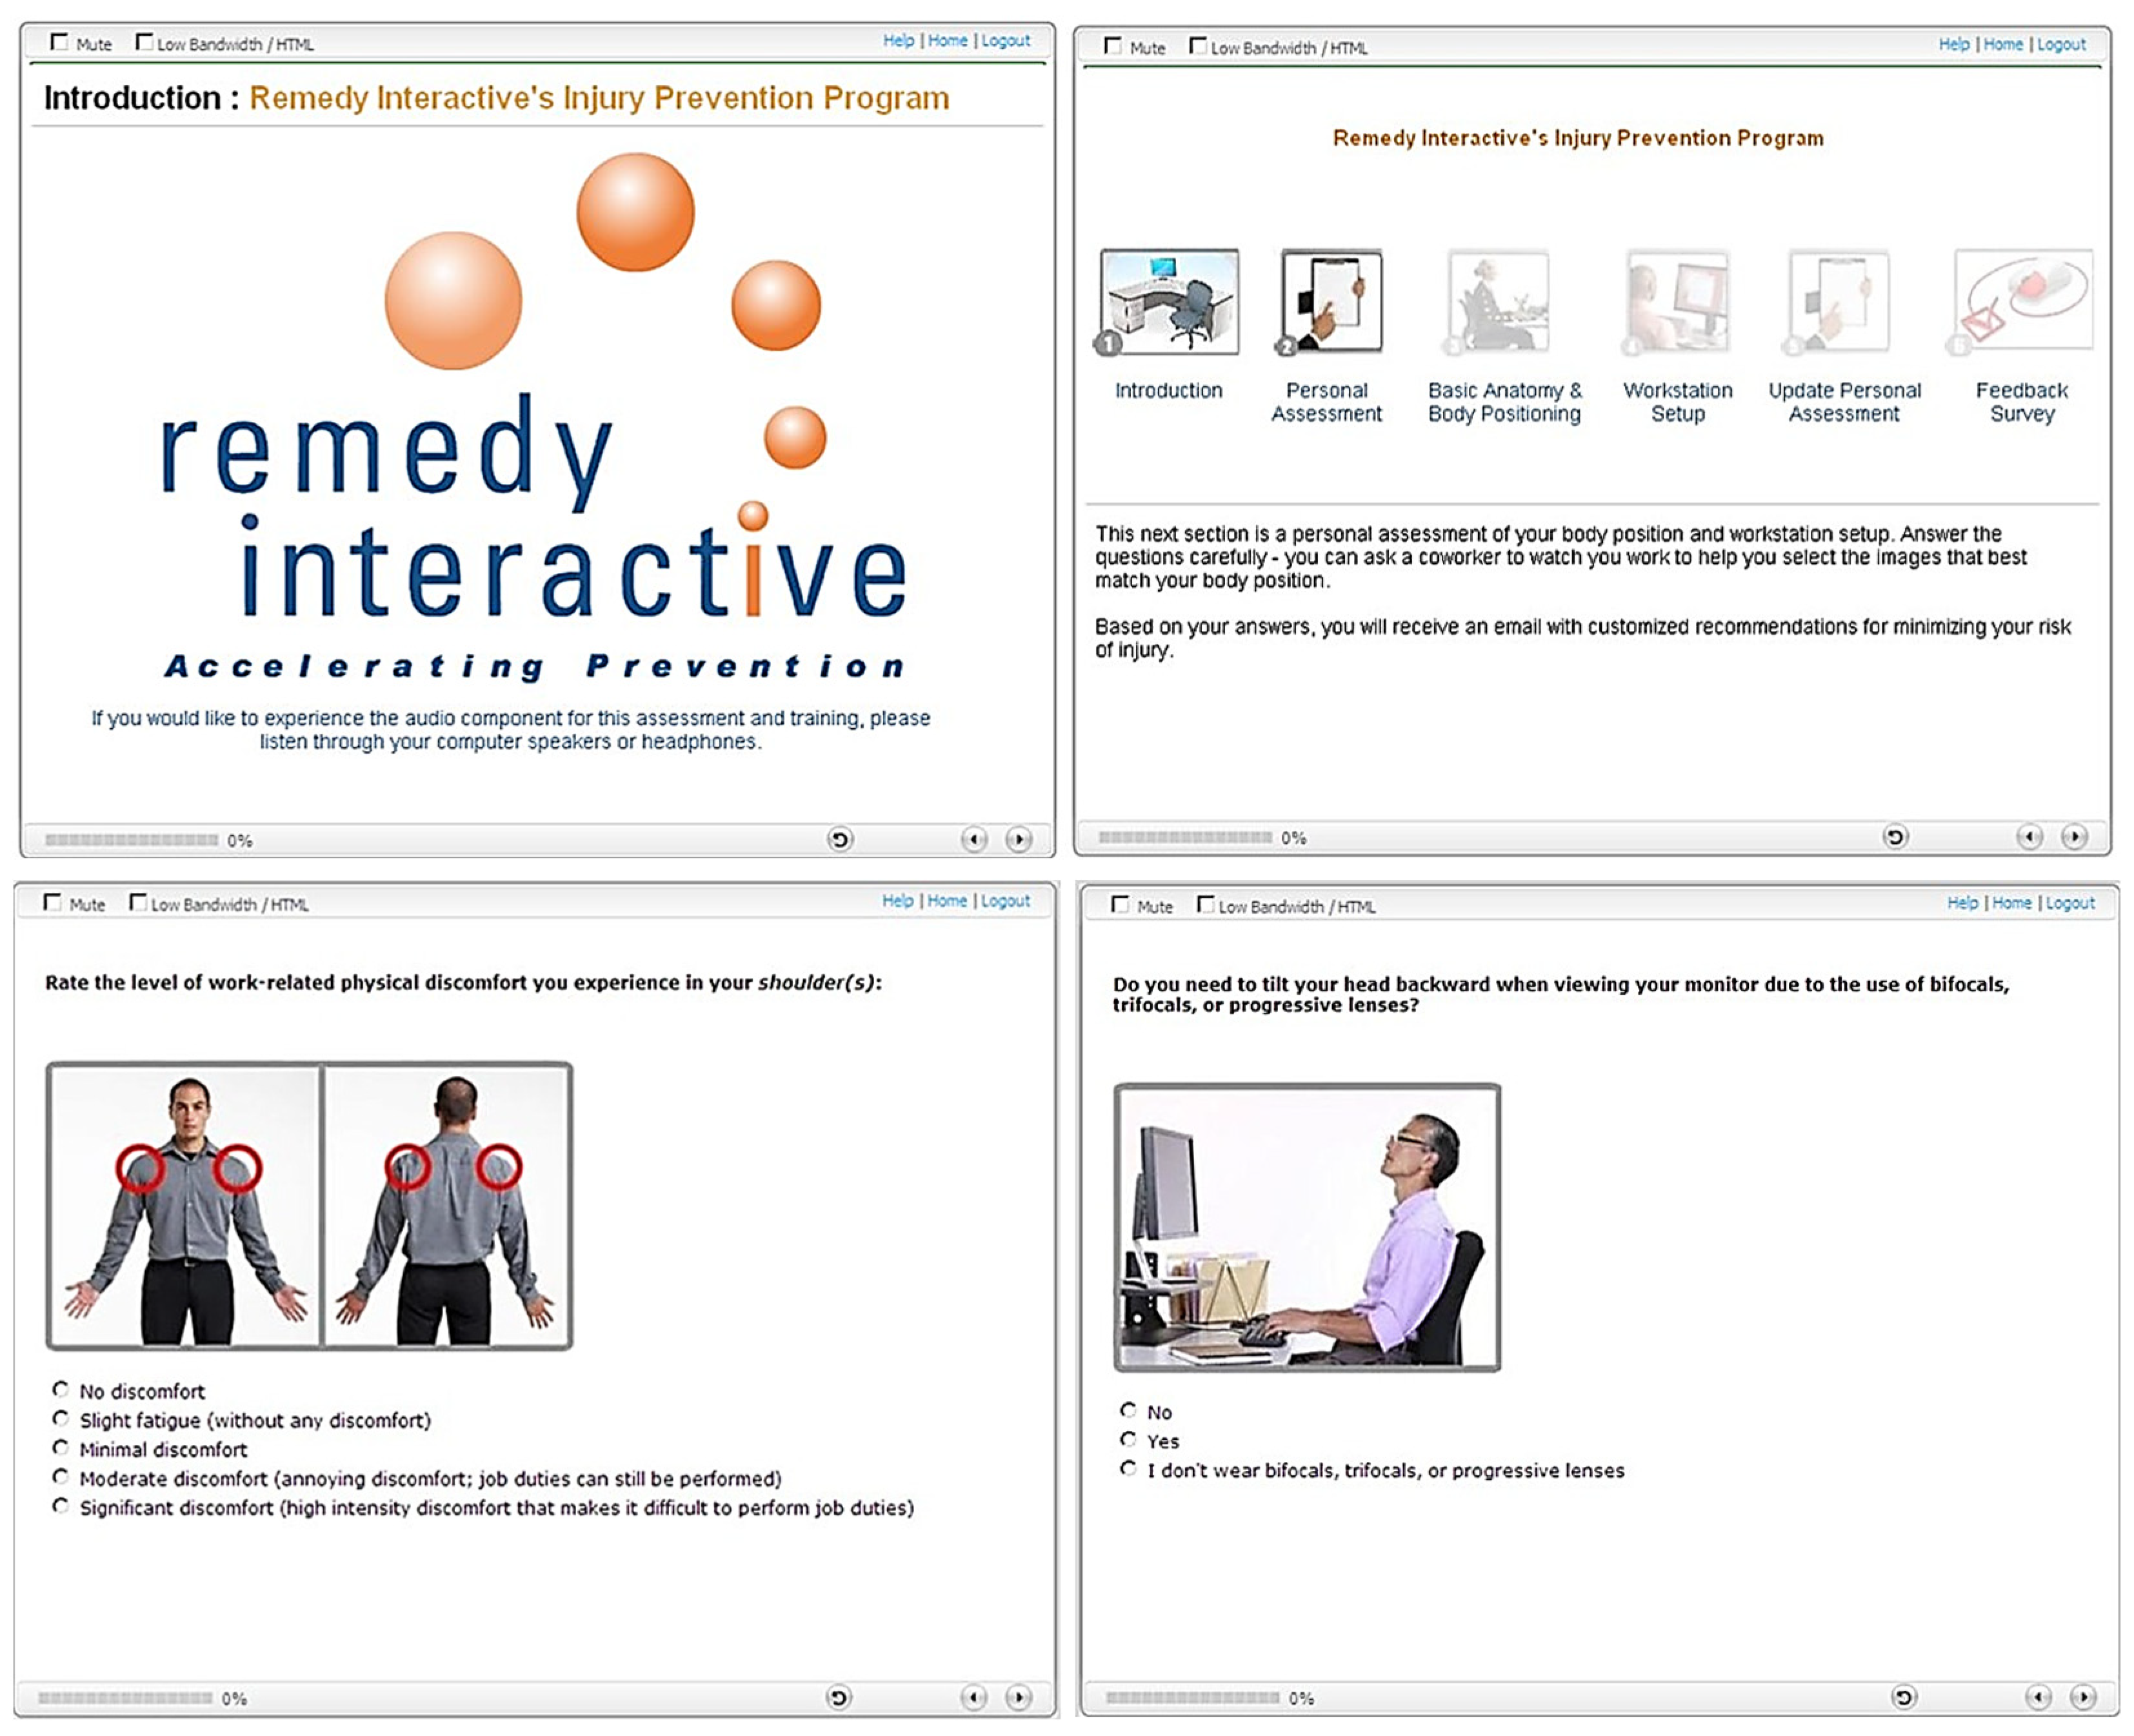
The company sponsored a workplace wellness program between August 2003 and November 2015 that utilized the Remedy Interactive Workplace Injury Prevention Program (part of the Cority software suite). Employees began the program with an introduction to the Office Ergonomic Solution (OES) software [25], followed by a guided session that included a personalized assessment of their body posture and workstation arrangement. Based on the answers provided, a personalized email was sent to each participant with recommendations on minimizing occupational injury risk. OES questions focused on discomfort included general bodily discomfort as well as questions about upper arms, the neck, upper back, shoulders, the low back, and headaches (Figure 1).
Figure 1.
Remedy Interactive Injury Prevention Program Slides, Reprinted from Interactive Office Ergonomic Solution software, 2019 [23] Product Imagery © Cority. Used with permission.
Employees were asked how many hours they used a computer and how often they completed tasks that did not require the use of a computer at work. The OES survey also asked employees to select a work posture that best represented their workstation set-up. Employees were specifically asked if they had been provided with a height-adjustable workstation. At the conclusion of the workstation assessment, employees were provided with information on basic anatomy and ideal body postures based on their workstation type. Data collected from the personalized workstation assessment was aggregated and de-identified over the 12-year period. Data was then shared with Texas A&M University for assessment. The company also utilized RSI GuardTM [26], which is a data logging software that is part of the Cority suite of products, to collect computer utilization measures for each participant over a year-long period of time in a separate database. Data were reported as an average for one month, a three-month average, and a year average. Datasets were connected by the unique individual identifier that was included in both databases rather than a username to ensure anonymity.
2.1. Eligibility
Individuals who answered the height-adjustable question at one month and at 12 months were considered for inclusion in the analysis. To narrow down the data collection period, analysis was limited to individuals who completed the penultimate questionnaire between 2012 and 2014. To minimize potential bias resulting from individuals choosing to modify their workstation during the assessment period, only individuals who maintained their workstation throughout the study period were included in the analysis. Additionally, only those individuals who had viable computer utilization data at both time points were included.
2.2. Instrumentation and Variables
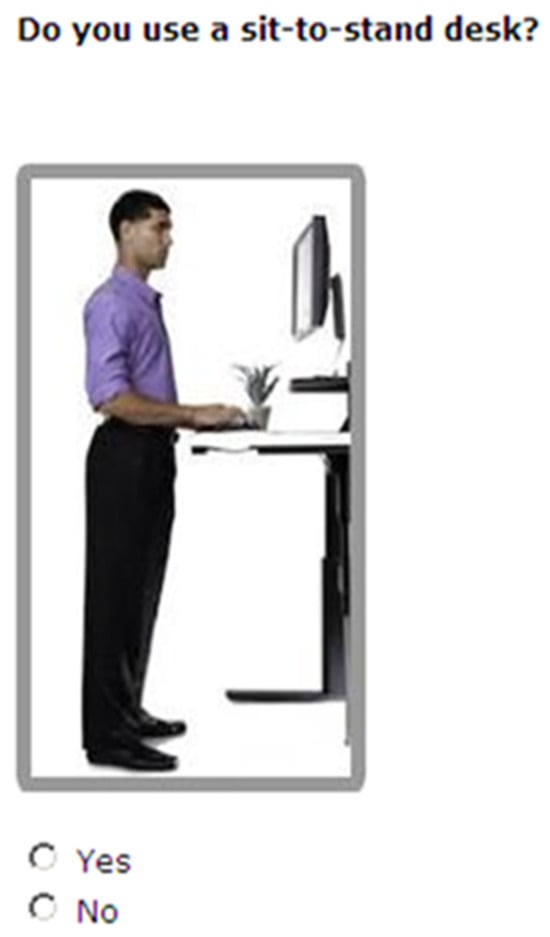
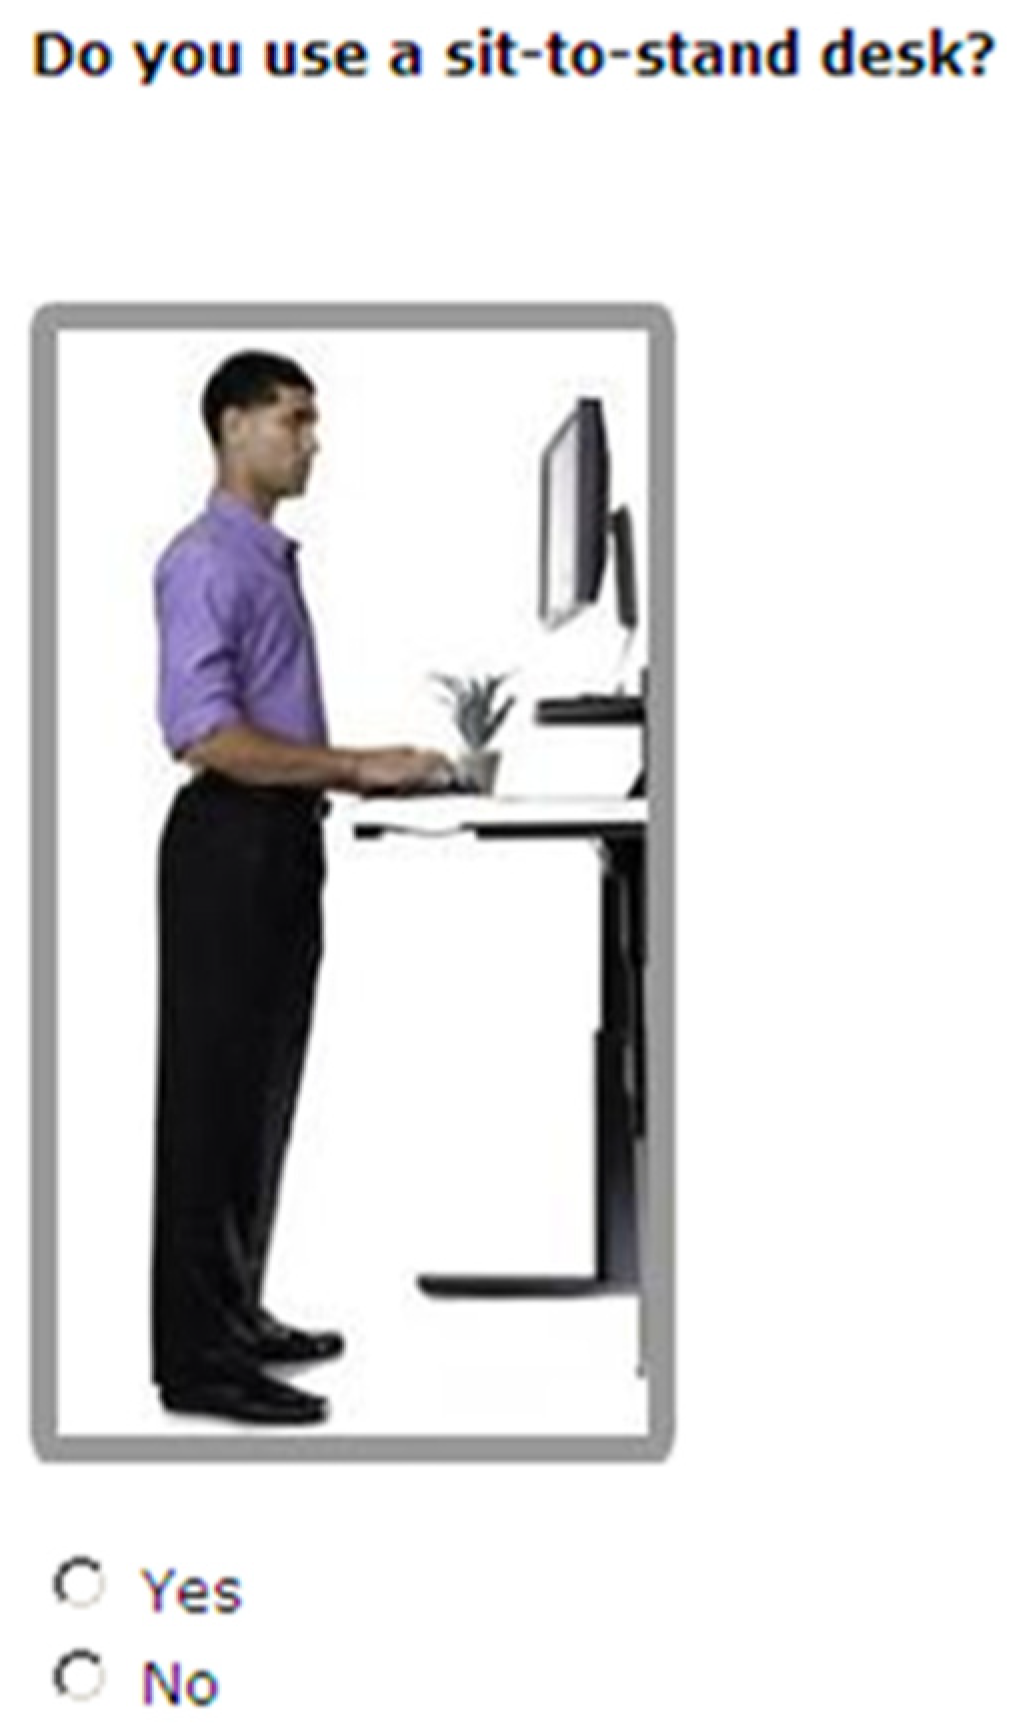
Subjective data were collected from individuals about their occupational environment, including lighting levels and glare, hours at the computer, breaks, musculoskeletal discomfort, and personal factors to include wearing glasses at work. Individuals were also asked if they had an office workstation at home, or if they used a shared workstation. Additionally, individuals were asked if they had the necessary space required for their peripherals and how much stress they experienced at work. Most of these variables were excluded from analysis due to the subjective nature of the question. The only subjective variables included were the workstation type and levels of discomfort. The question addressing workstation type seen in Figure 2 was used to categorize participants into the appropriate group, along with a review of the frequency of discomfort.
Figure 2.
Height adjustable question used to identify workstation type from Interactive Injury Prevention Program Slides, [25] Product Imagery © Cority. Used with permission.
Computer use measures were collected with the companion data logging software RSIGuard® and provided as a 1-month average, a 3-month average, and the average for one year. Data collected by the software included total computer hours (including keyboard and mouse hours), number of keypresses, words typed per day, total mouse clicks, left mouse clicks, mouse scroll, cursor travel, number of typos, and a calculated typo rate per 500 words typed. (Table 1).
Table 1.
RSI GuardTM Variables collected.
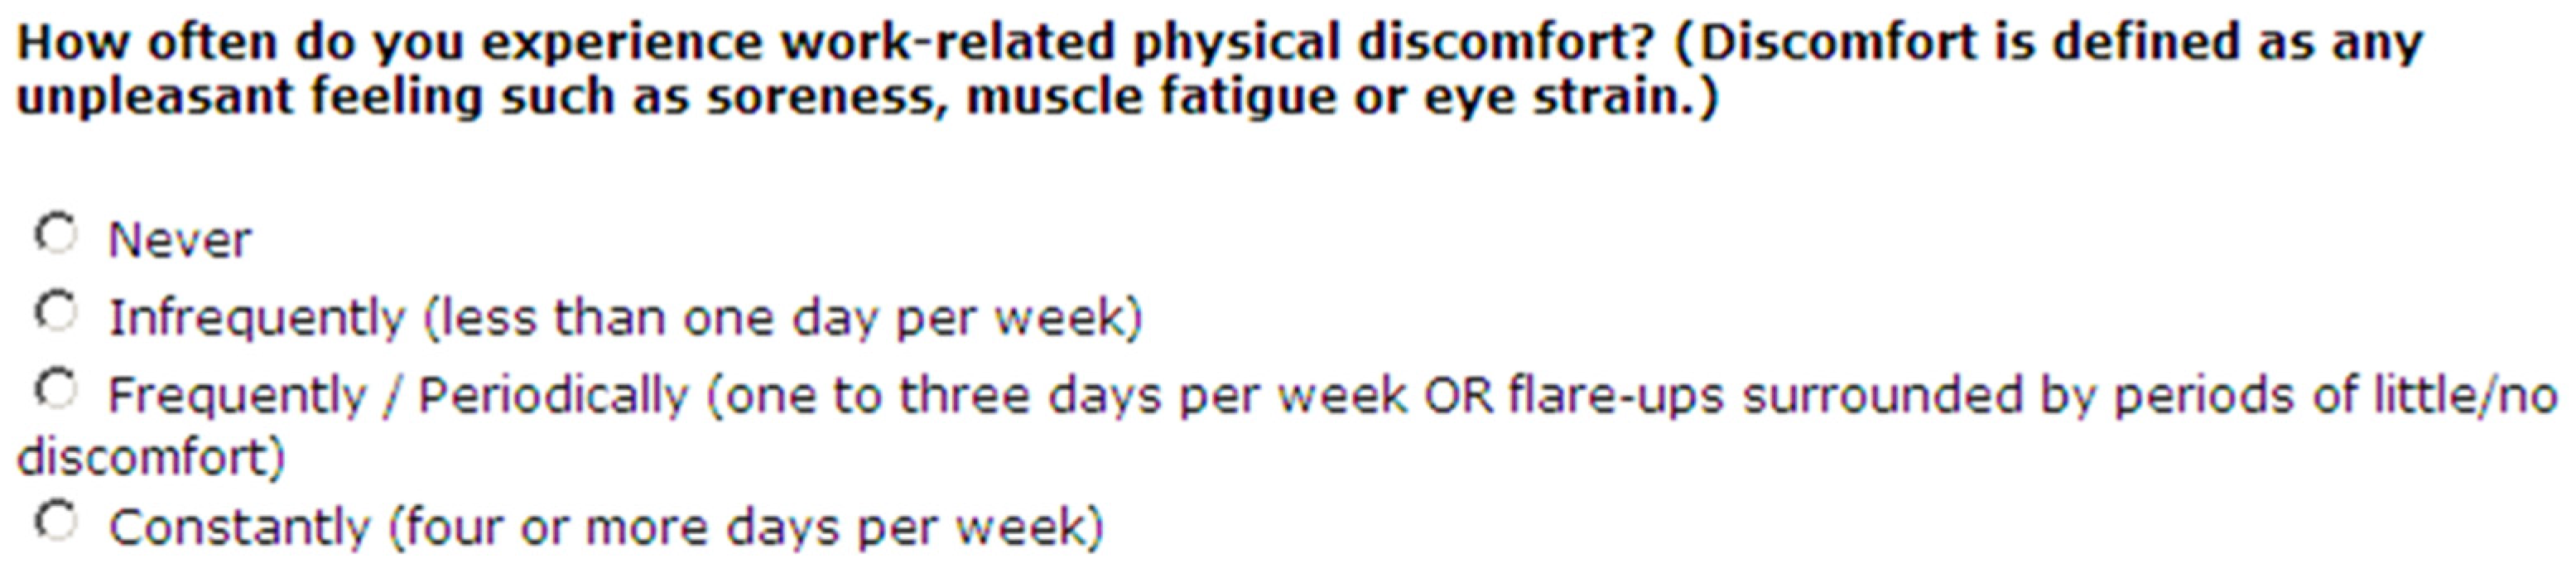
The Interactive Injury Prevention Program sponsored by the company included several OES questions on discomfort level. Participants were asked if they experienced “work-related physical discomfort with discomfort being defined as any unpleasant feeling such as soreness, muscle fatigue, or eye strain. [25]” The levels of discomfort included: “never, infrequently (less than one day per week), frequently/periodically (one to three days per week or flare-ups surrounded by periods of little/no discomfort), and constant (four or more days per week),” which can be seen in the screen capture from the OES [25] (Figure 3). However, the research team did not receive any information on the particular body region affected.
Figure 3.
OES Discomfort question, Interactive Office Ergonomic Solution software, 2019 [25] Product Imagery © Cority. Used with permission.
2.3. Study Protocol
A retrospective data analysis was completed for the data collected by the company as part of their wellness program. The company collected data in two databases: one from the OES survey, including frequency of discomfort and self-selection of workstation status, and one for computer utilization and errors. For this analysis, a height-adjustable workstation is indicated by a workstation that allows the individual to work in either a seated or standing position and is considered the independent variable. Unfortunately, the corporate program did not measure time sitting vs. standing at the workstation, nor did it note the number of posture changes per day, so the classification to the height-adjustable group is completely based on access to a height-adjustable workstation rather than its utilization. Objective measures for computer use, including total computer hours, mouse clicks and distance, keypresses, keyboard errors, typos, and words per day, were collected with RSI GuardTM [24] (Table 1). The software program collected information daily, and the company provided an average for each individual at each of the three time points. Additionally, participants were asked to complete a subjective questionnaire before data collection began and at 364 days. The research team used information collected from this survey to capture the individual’s reported musculoskeletal discomfort and workstation status. The team used workstation status on day 1 and day 364 to create a new field indicating the participant’s workstation for the entire assessment.
Researchers used this field to determine the individual’s group for the data analysis. It was presumed that if the participants had the same workstation type at the beginning and end of a year, they did not change their workstation during the study period (one year). Based on this assumption, four workstation groups were identified: (1) height adjustable; (2) new adopter; (3) revert to seated; and (4) traditional group. Individuals in groups 1 and 4 maintained their workstation selection for the study period. Groups 2 and 3 include individuals who changed their workstation at some point in the year. Unfortunately, since there was no information collected on when or why a workstation change was made, participants in the new adopter and revert-to-seated groups were excluded. Fortunately, these individuals comprised only 15% of the total data, ensuring that the majority (85%) of participants were included in the analysis.
The full objective dataset included 41,286 individual records. The data included an average for each participant at day 28, day 91, and day 364, which we refer to as one month, three months, and 12 months. The subjective dataset used for analysis included records for each participant at two time points, one at day 28 (one month) and another at day 364 (12 months). Unfortunately, the data did not include a response for workstation type on day 91, and as a result, the 3-month values were excluded. The two databases provided by the company were aligned in Microsoft® Excel based on the anonymous ID and time period. This study was reviewed and granted Institutional Review Board approval at Texas A&M University under the study number: TAMU 2018-0874.
2.4. Analysis
SAS 9.4® [27] was used to conduct statistical assessments on the data provided. Descriptive statistics were completed, including mean, standard deviation, and frequency, stratified by workstation type. Categorical variables of discomfort were assessed using Pearson Chi-square, and student’s t-tests were used to compare computer use measures between the two groups. As data were provided as averages at three time points, with the data at one month included in the 3-month average and the average at 3 months in the 1-year data point, the team did not feel repeated measures analysis was ethically appropriate.
3. Results
In total, 13,762 individuals contributed data at a minimum of one time point between 2003 and 2015. While those individuals who changed workstation type during the study period were excluded, 83.1% maintained their workstation type over the course of the collection period and were included in this study. Unfortunately, RSIGuardTM did not collect complete computer utilization data for 1293 employees who were subsequently excluded. The company’s wellness program was in place for over 12 years, with most employees participating between 2012 and 2015. To limit the study window to a manageable time frame, the dataset was limited to those individuals who completed the first questionnaire between 2012 and 2014, which allowed individuals who began the program in 2014 a full year to complete the data collection process. During the designated three-year window, complete data were collected for 10,145 participants [28]. Employees who answered the question about sit-stand desk use with a “yes” (n = 3404) were compared to those who answered “no” (n = 6741) at both 1 month and 12 months.
Participants were asked to describe their discomfort at one month and at the 12-month time points. There was a statistical difference in reported levels of discomfort between the two groups (Table 2). However, the difference in reported discomfort level between groups was no more than 5.6% per month and no more than 2.3% over a year. Additionally, fewer height-adjustable users reported experiencing infrequent or frequent discomfort at 12 months (364 days) when compared to the same groups’ responses at one month (28 days).
Table 2.
Discomfort for participants who completed a subjective survey between 2012–2014.
Fewer height-adjustable users reported “infrequent discomfort” (1.4%) or “frequent discomfort” (1.2%) at 12 months when compared to the 1-month time period. The percentage of traditional users reporting “infrequent discomfort” increased slightly over the year, and the percentage of users reporting “no discomfort” dropped slightly over the year. When researchers reviewed discomfort for the traditional group, fewer individuals reported never experiencing discomfort at 12 months compared to 1 month. Additionally, the number of traditional workstation users reporting some discomfort increased for all three discomfort levels. While the stratified discomfort levels were similar for both groups, more individuals in the height-adjustable group reported never experiencing discomfort, and there were fewer reporting infrequent and frequent discomfort at a year compared to those reporting in the same categories at one month.
To review potential differences that might have been introduced as a result of the year in which the individual began the program, the dataset was divided by the year the individual began the program (Table 3). The goal of this stratification was to evaluate any potential effects due to time of enrollment. Discomfort level stratifications, while not exactly the same, were similar for all three years, with more individuals reporting infrequent discomfort compared to those who indicated they never experienced any discomfort for all three years at both the 1-month and 12-month mark. It should be noted that with over 10,000 participants, statistically different discomfort values between groups, while interesting, may not be practically or clinically different.
Table 3.
Stratified Discomfort levels for individuals who completed the first survey between 2012–2014 by year.
Data collected from RSIGuard were evaluated to determine objective measures of computer use (Table 4). Review of the data identified that all measures, apart from mouse scroll, were statistically significant between groups for the three-year period. When the average for total active computer hours was compared using the students’ t-test, the p-value (<0.001) indicated an increased likelihood that the groups are statistically different. During the first month, the height-adjustable group had an average of 3.59 h of active computing time compared to 2.93 h for traditional workstation users. This translates to a difference in average total computing time between the two groups of 0.66 h, or approximately 39.6 min, for height-adjustable users compared to traditional users, which equates to a 22.5% increase. At a year, this trend continued, with the height-adjustable group having an average of 3.66 h total computing time compared to the traditional group with a mean of 2.95 h. When the student’s t-test was used to compare these groups, the p-value was less than the alpha of 0.05, indicating a likelihood that the groups had statistically different means, with the height-adjustable group experiencing 43.2 more active minutes of computer use per day than their counterparts.
Table 4.
RSI Continuous variables for participants who completed a subjective survey between 2012–2014.
Total keyboard and mouse hours were significantly different between groups at 1 month and 12 months. Traditional workstation users had 0.95 h of keyboard time compared to 1.14 h for the height-adjustable workstation group. While this difference is statistically relevant, the practical difference between groups equates to 11.4 min per day at one month and 12.6 min per day over the entire 12 months. When total computer time is reviewed, mousing accounts for 88–90% of total computer time for both groups for the entire year. Mousing time was slightly different between groups, with the height-adjustable group using the mouse 3.25 h per day at one month and the traditional group using the mouse 2.59 h per day. Average daily mouse time increased marginally for both groups over the year. The difference equates to 43.2 more minutes per day of mousing for height-adjustable users when compared to traditional users over a year.
Computers and computer time are critical to the office worker; however, active computer use in the form of keypresses, average words typed per day, mouse clicks, and typos are even more important measurable metrics. On average, the height-adjustable group had 863.5 more keypresses per day than the traditional group at a month and 864.4 more keypresses in 12 months. The increase in the number of keypresses translated into more words typed per day for the height-adjustable group at both time points. With more key presses and higher average words typed per day, it’s plausible that the height-adjustable group would generate more typos as well. At a month, the traditional group had an average of 162.0 typos, and the height-adjustable group had an average of 199.1 typos. This translated to 37.1 more typos per day for the height-adjustable group at 1 month. The trend was similar at 12 months, with the traditional group generating 167.1 typos and the height-adjustable group producing 36 more typos per day than the traditional group. While the number of typos provides valuable information, it is missing overall context. As a result, the research team generated a typo rate per 500 words typed to allow an equitable comparison of the two groups. Once adjusted for the number of words typed per day, the height-adjustable group still had more errors in the form of typos than the traditional group. At a month, the height-adjustable group had a rate of 172.3 errors per 500 words, while the traditional group had 161.8 errors per 500 words typed. At a year, the typo rate per 500 words dropped slightly to 168.5 for the height-adjustable group, and the traditional group rate was 159.5. When the two groups were compared at each time point, the differences were statistically significant (p < 0.001) at a month and a year; however, the practical difference in the typo rate may be negligible between the two groups.
Computer use data was also stratified by year to determine if there were any significant differences, potentially due to the year in which the participant completed the first survey. Appendix A shows the data broken down by the year the individual completed the first survey. Mouse scroll was the only variable that was not significant between groups in 2014, which is consistent with the overall dataset. Additionally, the typo rate was similar between the two groups in 2013, which is unique. The data collected in 2012 showed no difference in mouse scroll, keypresses, words typed per day, typos per day, or typo rate per 500 words typed between the two groups at a month and at a year, which may be due to loss of power with the lower total number of participants in the height-adjustable group.
4. Discussion
This analysis utilized data collected from employees enrolled in a California corporation’s wellness program. As part of their program, the company collected a number of metrics and was able to provide a summary of the population demographics. Data analysis was completed for individuals who maintained a traditional or height-adjustable workstation for a minimum of 1 year, which constituted 85% of the company’s total employee population. The height-adjustable group was 50.7% male, while the traditional group had a slightly higher male percentage (64.9%). The majority of participants were full-time employees at the company (98%), and while the average age was similar for both groups, the traditional group was slightly older (43.2 years for height-adjustable and 49.1 years for traditional users). While the research team was unable to capture additional demographics, the summary provided confirms that the groups utilized for this study were not overly different in age or gender composition. However, additional studies are warranted to evaluate the potential impact of age and gender composition with respect to the makeup of each group. While the original dataset included more than 10,000 individuals and included objective measures of computer use, it did not include any measures for occupational workstation utilization. Future studies should identify that participants not only have access to a height-adjustable desk but should also quantify how often they use it to help establish a dose-response relationship for the sit vs. stand discussion. Our team established that each user with access to a height-adjustable desk, at a minimum, had the ability to adjust their desk to a desirable seated height rather than the accepted 29–30” work surface height. This could account for benefits seen for individuals with access to height-adjustable workstations even though other studies have identified that few people choose to stand at these workstations (less than 10%) and for the small number that do, they may only use the standing position for 10–20% of the day [23].
Analysis of the combined OES-RSI database showed that almost all of the variables were statistically different between groups over the entire study period. Mouse scroll, which was defined by the data logging software as the “number of pointer scroll clicks,” was the only non-significant measure at a month as well as at a year. Based on the software definition, individuals who utilize laptops with a trackpad or individuals who use “specialty mice” may not register pointer scroll like a typical mouse would. Use of non-traditional peripherals may have severely limited the ability to compare mouse scroll between the two groups over the study period.
One of the most notable outcomes focused on active minutes utilizing the computer. To be considered active by the data logging software, a computer mouse or keyboard must be “in use” within a 30-s window [26]. If that window passes without the mouse or keyboard being used, the clock will stop recording. If mousing or keyboarding occurs within 30 s, the clock keeps recording “active computing.” As such, it is possible (and evident from the data) that active mouse time plus active keyboard time will not equal total computing time. Active computing time was 43 min more per day for the height-adjustable group compared to the traditional group over a year. Individually, mousing and keyboarding time also exhibited a similar trend, with those users who had access to a height-adjustable workstation outperforming their traditional counterparts. Mousing time accounted for 88–90% of all active computing time for both groups, which could be due to the occupations represented at the company, or it could be an adjustment in the type of work required by each job. Unfortunately, since the provided dataset did not include occupation or workload, it is hard to determine if this had a substantial impact on differences that were seen. Ultimately, based on the data collected, the only thing that we can truly determine is that individuals who had access to height-adjustable workstations also had greater computer utilization measures compared to those who utilized a traditional workstation. There are many potential confounders that could not be accounted for in the analysis that could play a major role in this association. For example, individuals who occupy administrative positions might have greater computer time than individuals in technical positions (i.e., Engineers) who might spend time at the computer reviewing documents, reports, and specifications that would not be fully captured in active computer time.
If we could establish a positive association between the workstation type and computer use along with the measures collected by the wellness program, we might be able to establish a return on investment (ROI) to help companies justify providing access to height-adjustable workstations to more employees. If computer utilization was used as a surrogate, this ROI could be used to determine if there was potential cost savings associated with a worker’s access to height-adjustable workstations. This calculation would estimate the potential difference in computer utilization between groups, based on the increase in active computer use that might be realized by providing a height-adjustable workstation to those who did not previously have access to one. Based on the standard number of workdays per year identified by the U.S. Office of Personnel Management (OPM) [29] and the increase in active computer time for the height-adjustable group, it is estimated that each user with access to a height-adjustable workstation achieves, on average, 171.5 more active computer hours per year than those individuals who do not have access to a height-adjustable workstation. Combined with an average hourly pay rate of $52.04 per hour, the potential cost savings are $ 8,924.86 per individual per year. This could potentially fund a fully adjustable workstation, with setup and delivery (approximately $2200) in less than 3 months. This means that providing a height-adjustable workstation might be worthwhile for those individuals who are interested, at minimal cost to the company.
The percentage of individuals indicating that they did not experience any discomfort was approximately 5% higher in the traditional group compared to the height-adjustable group at 1 month. This difference between the groups dropped to less than 2% over the course of the year. Additionally, the difference in all the discomfort sub-categories did not differ by more than 3% between the height-adjustable and traditional groups. As a result, the practical difference in discomfort may be negligible by industry standards even though they were statistically different. Differences in reported discomfort could be from issues with poor workstation design prior to entry into the wellness program or as a result of a medical issue that might not have been resolved. Additionally, some of these individuals may have requested a change of workstation as part of a medical accommodation to modify discomfort. There could also be confusion about the levels of discomfort or recall issues when estimating weekly discomfort for the entire year. Since the survey defined discomfort as “any unpleasant feeling such as soreness, muscle fatigue or eye strain” [25] and each discomfort category by the number of days per week individuals experienced symptoms, it would be more appropriate to collect weekly discomfort and report the number of weeks in each discomfort level. This way, the company could address any potential occupational reasons for increased discomfort in three consecutive periods rather than wait until a year. It should be noted here that another term for height-adjustable desks is a sit-to-stand desk. By making both the seated and standing positions adjustable to the user’s specific anthropometrics and work needs, the height-adjustable performance differences we noted may be more connected to this value than the seated vs. standing impact.
4.1. Limitations
The principal limitation of this study is that the data provided were reported as averages for each individual rather than 364 daily values. This severely limits the ability to assess seasonality or extended periods where the individual might not have been in the office. This also limits the type of analysis that can be ethically run, as all of the data from one month is included in the 1-year average. With more than 10,000 participants and a data point for each variable for every participant, this would have been an enormous dataset. To address the volume of information, the research team could have segmented the data to account for potential differences, which would also have opened up the type of analysis that could have been conducted.
Unfortunately, neither of the original datasets includes any demographics, which made characterizing the two groups nearly impossible. At the request of the research team, the company provided a demographic summary that was used to characterize the make-up of the study participants; however, these data were not available outside of aggregate counts for each subgroup (thus limiting the types of analyses and subgroup analyses that could be performed). The average age of individuals in the height-adjustable group was 43.2 years compared to the slightly older average for the traditional group at 49.1 years. The height-adjustable group included slightly more males than females, with 50.7% male, while the traditional group was 64.9% male. Additionally, both of the groups were predominantly full-time employees (97% for the height-adjustable and 99.5% for the traditional group). While the groups’ age and gender composition were similar, we did not collect any additional demographic information about the participants. This eliminated the opportunity to evaluate potential confounders. Without data on gender, age, occupation, reason for workstation selection, or the existence of pre-existing injury or illnesses, it is difficult to conclude whether these factors impacted the values collected with respect to both computer use and discomfort.
The data provided by the company did not indicate if there was a particular reason individuals selected a height-adjustable workstation or when the individuals received the unit. Additionally, there was no indication of exactly what type of adjustable workstation each participant had access to. Participant recall indicated that many used an electric height-adjustable desk, but the corporate program did not identify the specific unit or provide a list of the options available as part of the program. Figure 2 comes directly from the company’s wellness program slides and depicts a fully height-adjustable workstation, but the slides do not define what is considered a height-adjustable workstation, and there is no indication in the database of the workstation type participants had access to at the office. As a result, the group may be a conglomeration of users that had pneumatic or electric height adjustable workstations, or users with desktop height adjustable workstations. While participants were specifically asked, “Do you use a height-adjustable desk?” there is no information on how much time was spent in different working postures, including time sitting or time standing, or how many sit-to-stand transitions were completed throughout the workday. This limits the researcher’s ability to determine if there is a dose-response of seated vs. standing workstation use associated with computer usability measures. Quantitative data for number of posture changes per day and time standing and sitting at work should be collected in the future to allow a true assessment of workstation utilization.
Lack of detailed demographics, specifically occupation, made it difficult to group the study population by work type, which may impact the user’s choice to sit or stand at work, the number of transitions, as well as the duration of each episode. While all participants used a computer as part of their job at work, there are a variety of different occupations that are employed by the company. Individuals in Human Resources or the IT field might have different workstation needs that could ultimately impact their choice to sit or stand and the resulting amount of time in each posture. There are also some occupations that travel and are away from the office for a period of time, or possibly those that work collaboratively on a project, which could impact the resulting data. Additionally, there is no mention of footrest or anti-fatigue mat use in the Interactive OES application, which reduces the ability of the research team to consider potential confounding factors when reviewing reported discomfort levels.
4.2. Strengths
The biggest strength is that this is a real-world analysis of over 10,000 individuals in an office setting, which includes both subjective and objective measures. The data were collected for each participant over a one-year period of time, no matter when the individual entered the study. Consequently, the team did not have to consider employee work schedules, seasonal workload, or holiday leave, as every individual contributed the same amount of data. Additionally, with the population that originally included all the company’s office employees, it is expected that the final sample, which included 85% of all employees, is truly representative of the company population and maybe a representative population for office workers. It is extremely rare in our field to collect data from nearly all the office workers of an organization at all their locations rather than the more common small sample at a few selected locations.
Objective measures of computer utilization were collected from RSIGuard® to quantify computer time rather than relying on the participants to accurately remember the amount of active time spent at the computer over a year. As a result, comparison of actual time using the computer and peripherals between groups was able to be determined at a month and at a year. Consequently, this study is the first to utilize both objective and subjective data to compare traditional workstation users and those who had access to a height-adjustable unit at their primary workstation for a 1-year period for the majority of the company’s office workers.
5. Conclusions
This study provides a real-world analysis of work impacts from office interventions. Results from this analysis support providing height-adjustable workstations in the office, given that workers achieved 43 more active computing minutes than their seated workstation counterparts over a year. Combined with negligible changes in reported discomfort, this suggests that provision of a height-adjustable workstation may result in minimal personal impacts and an increase in organizational benefits. Researchers could not account for confounders including age, occupation, and true sitting and standing time; however, the association between workstation type and increased computer use with minimal changes in discomfort is based on data collected from over 10,000 individuals, and as such it presents valuable information to the field of occupational ergonomics.
Author Contributions
Conceptualization, T.L.S. and M.E.B.; methodology, M.E.B., M.L.S., and A.P.; validation, M.E.B. and G.H.; formal analysis, T.L.S.; resources, M.E.B.; data curation, T.L.S.; writing—original draft preparation, T.L.S.; writing—review and editing, M.L.S., A.P., and M.E.B.; visualization, T.L.S.; supervision, M.E.B.; project administration, T.L.S. and M.E.B.; funding acquisition, M.E.B. All authors have read and agreed to the published version of the manuscript.
Funding
This research received no external funding.
Institutional Review Board Statement
The study was conducted in accordance with the Declaration of Helsinki and approved by the Institutional Review Board of Texas A&M University (protocol code TAMU 2018-0874).
Informed Consent Statement
Consent for data collection was obtained by the corporation at program enrollment. Data was de-identified and sanitized of any corporate or personal identifiers prior to researchers’ use.
Data Availability Statement
Data used in this analysis can be downloaded from FigShare at https://doi.org/10.6084/m9.figshare.12753545.
Conflicts of Interest
The authors declare no conflicts of interest.
Abbreviations
The following abbreviations are used in this manuscript:
| RSI | Repetitive Strain Injury |
| NIOSH | National Institute of Occupational Safety and Health |
| TWH | Total Worker Health |
| CAD | Computer-aided Design |
| IT | Information Technology |
| HR | Human Resources |
| OES | Office Ergonomic Solution |
| TAMU | Texas A&M University |
| SAS | Statistical Analysis Software |
| OES-RSI | Office Ergonomic solution/ Repetitive Strain Injury combined database |
| OPM | US Office of Personnel Management |
| ROI | Return on Investment |
Appendix A
Table A1.
RSI Continuous variables for participants that completed a subjective survey between 2012–2014 (by 1-year time periods).
References
- Lee, M.P.; Hudson, H.; Richards, R.; Chang, C.C.; Chosewood, L.C.; Schill, A.L. Fundamentals of Total Worker Health Approaches: Essential Elements for Advancing Worker Safety, Health, and Well-Being; DHHS Publication No. 2017-112 2016; U.S. Department of Health and Human Services, Centers for Disease Control and Prevention, National Institute for Occupational Safety and Health, Office for Total Worker Health: Cincinnati, OH, USA, 2016. Available online: https://www.cdc.gov/niosh/docs/2017-112/pdfs/2017_112.pdf?id=10.26616/NIOSHPUB2017112&id=10.26616/NIOSHPUB2017112 (accessed on 22 October 2019).
- Sorensen, G.; Barbeau, E. Steps to a Healthier US Workforce: Integrating Occupational Health and Safety and Worksite Health Promotion: State of the Science. In Steps to a Healthier US Workforce Symposium; The National Institute of Occupational Safety and Health: Washington, DC, USA, 2004. Available online: https://stacks.cdc.gov/view/cdc/249195 (accessed on 18 July 2019).
- National Institute for Occupational Safety and Health. NIOSH Program Plan by Program Areas for Fiscal Years 1984-89; U.S. Department of Health and Human Services, Public Health Service, Centers for Disease Control, National Institute for Occupational Safety and Health: Rockville, MD, USA, 1984. Available online: https://stacks.cdc.gov/view/cdc/209533 (accessed on 15 March 2019).
- Schulte, P.A.; Grosch, J.; Scholl, J.C.; Tamers, S.L. Framework for Considering Productive Aging and Work. J. Occup. Environ. Med. 2018, 60, 440–448. [Google Scholar] [CrossRef] [Scilit] [PubMed]
- Katzmarzyk, P.T.; Church, T.S.; Craig, C.L.; Bouchard, C. Sitting Time and Mortality from All Causes, Cardiovascular Disease and Cancer. Med. Sci. Sports Exerc. 2009, 41, 998–1005. [Google Scholar] [CrossRef] [Scilit] [PubMed]
- Biswas, A.; Oh, P.; Faulkner, G.; Bajaj, R.; Silver, M.; Mitchell, M.; Alter, D. Sedentary time and its association with risk of disease incidence, mortality and hospitalization in adults. Ann. Intern. Med. 2015, 162, 123–132. [Google Scholar] [CrossRef] [Scilit] [PubMed]
- Dutta, N.; Walton, T.; Pereira, M.A. Experience of switching from a traditional sitting workstation to a sit-stand workstation in sedentary office workers. Work 2015, 52, 83. [Google Scholar] [CrossRef] [Scilit] [PubMed]
- Neuhaus, M.; Eakin, E.G.; Straker, L.; Owen, N.; Dunstan, D.W.; Reid, N.; Healy, G.N. Reducing occupational sedentary time: A systematic review and meta-analysis of evidence on activity-permissive workstations. World Obes. 2014, 215, 822–838. [Google Scholar] [CrossRef] [Scilit] [PubMed]
- Healy, G.N.; Lawler, S.P.; Thorp, A.; Neuhaus, M.; Robson, E.L.; Owen, N.; Dunstan, D.W. Reducing Prolonged Sitting in the Workplace (An Evidence Review: Full Report); Victorian Health Promotion Foundation: Melbourne, Australia, 2012.
- Foley, B.; Engelen, L.; Gale, J.; Bauman, A.; Mackey, M. Sedentary Behavior and Musculoskeletal Discomfort Are Reduced when office workers trial an activity based work environment. J. Occup. Env. Med. 2016, 58, 924–931. [Google Scholar] [CrossRef] [Scilit] [PubMed]
- Wilks, S.; Mortimer, M.; Nylen, P. The introduction of sit-stand worktables; aspects of attitudes, compliance and satisfaction. Appl. Ergon. 2006, 37, 359–365. [Google Scholar] [CrossRef] [Scilit] [PubMed]
- Marshall, S.; Gyi, D. Evidence of Health Risks from Occupational Sitting: Where Do We Stand? J. Prev. Med. 2010, 39, 389–391. [Google Scholar] [CrossRef] [Scilit] [PubMed]
- Parry, S.; Straker, L.; Gilson, N.D.; Smith, A.J. Participatory workplace interventions can reduce sedentary time for office workers—A randomized controlled trial. PLoS ONE 2013, 8, e78957. [Google Scholar] [CrossRef] [Scilit] [PubMed]
- Parry, S.; Straker, L. The contribution of office work to sedentary behavior associated risk. BMC Public Health 2013, 13, 296. [Google Scholar] [CrossRef] [Scilit] [PubMed]
- Thorp, A.A.; Healy, G.N.; Winkler, E.; Clark, B.K.; Gardiner, P.A.; Owen, N.; Dunstan, D.W. Prolonged sedentary time and physical activity in workplace and non-work contexts: A cross-sectional study of office, customer service and call center employees. Int. J. Behav. Nutr. Phys. Act. 2012, 9, 128. [Google Scholar] [CrossRef] [Scilit] [PubMed]
- Buckley, J.P.; Hedge, A.; Yates, T.; Copeland, R.J.; Loosemore, M.; Hamer, M.; Bradley, G.; Dunstan, D.W. The sedentary office: An expert statement on the growing case for change towards better health and Productivity. Br. J. Sports Med. 2015, 49, 1357–1362. [Google Scholar] [CrossRef] [Scilit] [PubMed]
- Manini, T.M.; Carr, L.J.; King, A.C.; Marshall, S.; Robinson, T.N.; Rejeski, W.J. Interventions to reduce sedentary behavior. Med. Sci. Sports Exerc. 2015, 47, 1306. [Google Scholar] [CrossRef] [Scilit] [PubMed]
- Graves, L.E.F.; Murphy, R.C.; Shepherd, S.O.; Cabot, J.; Hopkins, N.D. Evaluation of sit-stand workstations in an office setting: A randomized controlled trial. BMC Public Health 2015, 15, 1145. [Google Scholar] [CrossRef] [Scilit] [PubMed]
- Chau, J.Y.; Daley, M.; Dunn, S.; Srinivasan, A.; Do, A.; Bauman, A.E.; van der Ploeg, H.P. The effectiveness of sit-stand workstations for changing office workers’ sitting time: Results from the Stand@ Work randomized controlled trial pilot. Int. J. Behav. Nutr. Phys. Act. 2014, 11, 127. [Google Scholar] [CrossRef] [Scilit] [PubMed]
- Chau, J.Y.; Sukala, W.; Fedel, K.; Do, A.; Engelen, L.; Kingham, M.; Sainsbury, A.; Bauman, A.E. More standing and just as productive: Effects of a sit-stand desk intervention on call center workers’ sitting, standing, and productivity at work in the Opt to Stand pilot study. Prev. Med. Rep. 2016, 3, 68–74. [Google Scholar] [CrossRef] [Scilit] [PubMed]
- Alkhajah, T.A.; Reeves, M.M.; Eakin, E.G.; Winkler, E.A.; Owen, N.; Healy, G.N. Sit–stand workstations: A pilot intervention to reduce office sitting time. Am. J. Prev. Med. 2012, 43, 298–303. [Google Scholar] [PubMed]
- van Nassau, F.; Chau, J.Y.; Lakerveld, J.; Bauman, A.E.; van der Ploeg, H.P. Validity and responsiveness of four measures of occupational sitting and standing. Int. J. Behav. Nutr. Phys. Act. 2015, 12, 144. [Google Scholar] [CrossRef] [Scilit] [PubMed]
- Sharma, P.; Benden, M.E.; Mehta, R.K.; Pickens, A.; Han, G. A Quantitative Evaluation of Electric Sit-Stand Desk Usage: 3-Month In-Situ Workplace Study. ISSE Trans. Occup. Ergon. Hum. Factors 2018, 6, 76–83. [Google Scholar] [CrossRef] [Scilit]
- Zhu, W.; Gutierrez, M.; Toledo, M.J.; Mullane, S.; Park, A.; Diemar, R.; Buman, K.F.; Buman, M.P. Long-term effects of sit-stand workstations on workplace sitting: A natural experiment. J. Sci. Med. Sport 2018, 21, 811–816. [Google Scholar] [CrossRef] [Scilit] [PubMed]
- Cority. Office Ergonomic Solutions (OES) Software. 2019. Available online: https://www.cority.com/safety-cloud/office-ergonomics-software/ (accessed on 1 March 2019).
- Cority. RSIGuard Software. 2019. Available online: https://rsiguard.com/index.php/ (accessed on 1 March 2019).
- SAS Institute Inc. SAS Software, Version 9.4; SAS Institute Inc.: Cary, NC, USA, 2019. [Google Scholar]
- Salzar, T.; Benden, M. OES_RSI Dataset; figshare: London, UK, 2020. [Google Scholar] [CrossRef]
- U.S. Office of Personnel Management (OPM). Factsheet: Computing Hourly Rates of Pay Using the 2087-Hour Divisor. Available online: https://www.opm.gov/policy-data-oversight/pay-leave/pay-administration/fact-sheets/computing-hourly-rates-of-pay-using-the-2087-hour-divisor (accessed on 1 November 2019).

Disclaimer/Publisher’s Note: The statements, opinions and data contained in all publications are solely those of the individual author(s) and contributor(s) and not of MDPI and/or the editor(s). MDPI and/or the editor(s) disclaim responsibility for any injury to people or property resulting from any ideas, methods, instructions or products referred to in the content. |
© 2026 by the authors. Licensee MDPI, Basel, Switzerland. This article is an open access article distributed under the terms and conditions of the Creative Commons Attribution (CC BY) license.