


Abstract
This study investigates the impact of climate-driven Sea Level Rise (SLR) and extreme storm tides on coastal flooding in the urbanised littoral zone of Kalamaria (Thermaikos Gulf, Northern Aegean Sea). High-resolution hydraulic simulations using the CoastFLOOD model are driven by coastal Sea Level Elevation (SLE) extremes derived from simulated results based on the Med-CORDEX regional climate projections to assess historical (1971–2005) and future periods’ (2021–2055, 2066–2100) 50- and 100-year return levels under RCP4.5 and RCP8.5. SLEs are derived from storm surges, the highest tidal ranges, and mean/max SLR scenarios for the 21st century. Results indicate substantial increases in inundation extent and exposure of critical infrastructure, coastal assets, and population clusters, highlighting the need for locally tailored adaptation strategies under climate uncertainty.
1. Introduction
Coastal zones across the Mediterranean are increasingly exposed to the compounded effects of climate-driven Sea Level Rise (SLR) and extreme Sea Level Elevation (SLE) events, posing growing risks to densely populated and highly urbanised littoral areas. The deceptively low tidal ranges, limited coastal accommodation space, intense urbanisation, and long-term shoreline modification render many Mediterranean littoral cities particularly vulnerable to episodic coastal flooding from storm surges. In this context, understanding how Mean Sea Level (MSL) trends interact with extreme storm surges and astronomical tides is essential for robust coastal risk assessment and climate adaptation planning.
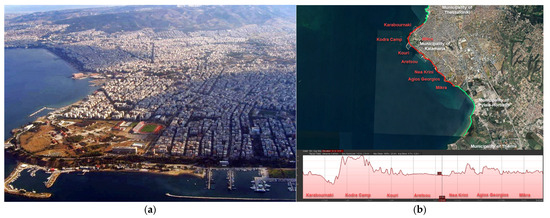
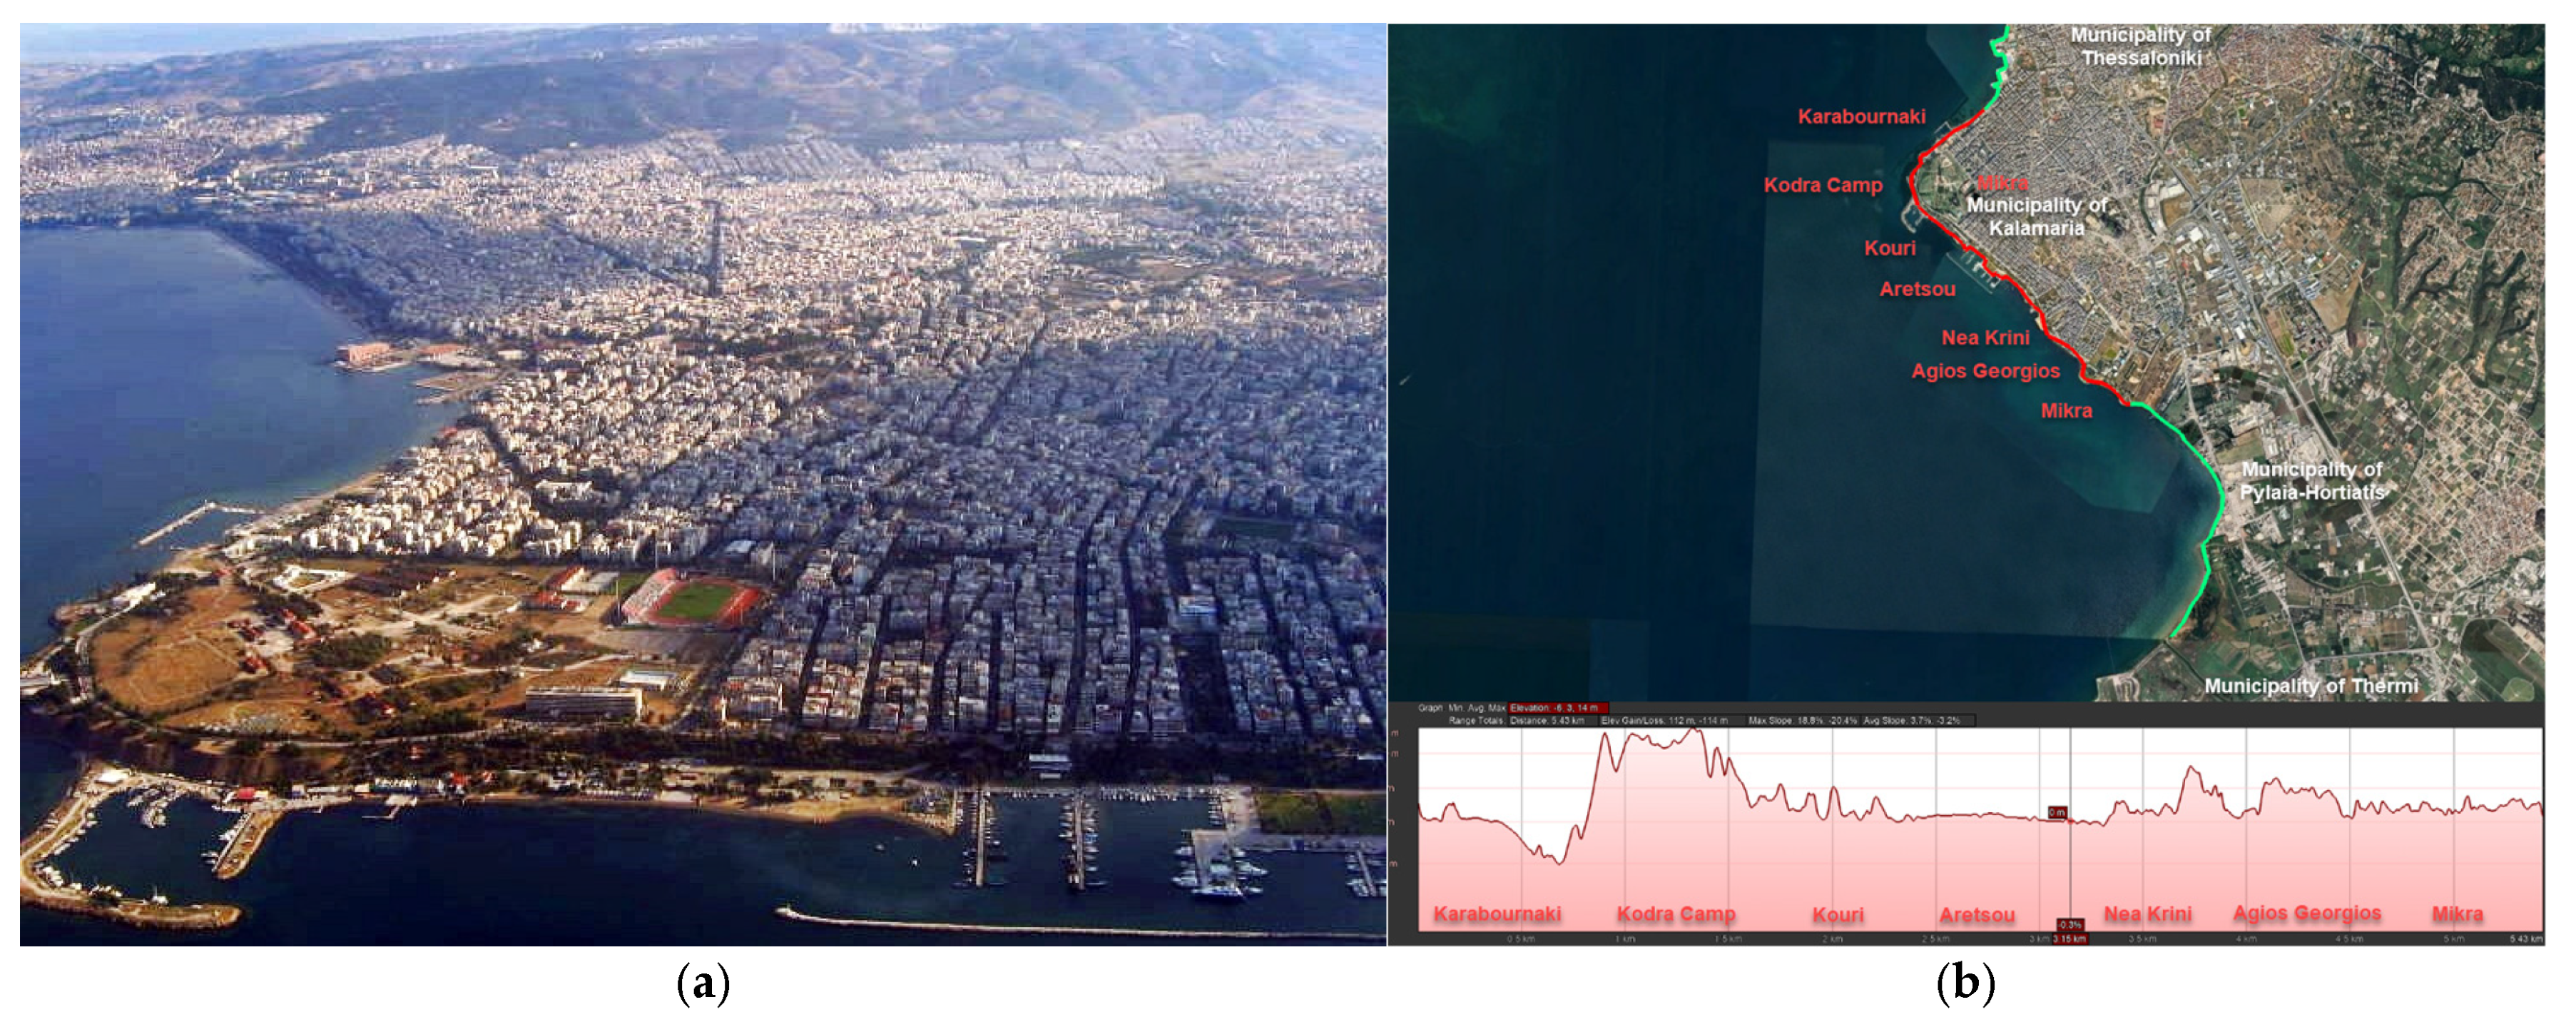
The present study focuses on the coastal zone of Kalamaria, located along the northeastern littoral of the Thermaikos Gulf (Northern Greece). Kalamaria is part of the eastern metropolitan area of Thessaloniki, the second-largest city in Greece, and hosts a dense concentration of residential neighbourhoods, tourist attractions, public spaces, marinas, port-related infrastructure, and critical utilities. Stakeholder consultations with local and regional authorities responsible for spatial planning, civil protection, and infrastructure management have consistently identified the waterfront areas of Karabournaki, Kodra Camp, Kouri, Aretsou, Nea Krini, and Mikra as highly sensitive to coastal flooding (Figure 1). These areas combine low land elevation, intense anthropogenic pressure, and limited natural buffering capacity, while parts of the waterfront are founded on reclaimed or compacted backfill soils, potentially amplifying flood susceptibility.
Figure 1.
Study area: (a) Aerial view of Eastern Thessaloniki and the Kalamaria coastline comprising urban waterfronts, the rocky cliffs of the Cape Karabournaki, the harbour of the Nautical Club (southern Thessaloniki), Greece (photo taken 2006). Image by Salonica84, released into the public domain on Wikimedia Commons; (b) Kalamaria Municipality’s coastal waterfront (red line) elevation comprising parts of the northeastern Thermaikos Gulf littorals: neighbourhoods Karabournaki, Kodra, Kouri, Aretsou, Nea Krini, Ag. Georgios, and Mikra; adjacent municipalities (green line).
Coastal flooding impacts are not confined to the administrative boundaries of Kalamaria. Hydraulic connectivity through low-lying urban corridors allows storm-driven inundation to propagate toward adjacent coastal zones of the Municipalities of Thessaloniki, Pylaia-Hortiatis, and Thermi, affecting critical assets such as coastal roads, commercial areas, and the Macedonia Airport zone. Consequently, coastal flood hazard assessment requires an integrated framework that captures both the spatial continuity of inundation and the probabilistic nature of extreme sea level forcing. We apply the MedSeaRise [1] methodological approach, which links climate change scenarios to a roadmap for impact-oriented coastal risk assessment by systematically using exposure indicators and hazard curves. Extreme SLE is defined by the combined contributions of storm surge (Sea Surface Height; SSH), astronomical tides, and long-term mean SLR, which together form the boundary forcing of coastal inundation simulations. Extreme storm surges are characterised probabilistically using Generalised Extreme Value (GEV) analysis, while future climatic forcing is derived from the Med-CORDEX Regional Climate Models (RCM) under Representative Concentration Pathways (RCP) 4.5 and 8.5 scenarios [2], which currently constitute the only complete and validated multi-model ensemble available for high-resolution atmospheric forcing over the Mediterranean basin. To maintain consistency with IPCC AR6, SLR projections are based on the Shared Socioeconomic Pathways SSP2-4.5 and SSP5-8.5. The correspondence between RCPs, SSPs, and associated Global Warming Levels (GWLs) is adopted to enable climate-consistent interpretation of results across scenarios.
High-resolution dynamic coastal inundation simulations are performed using the CoastFLOOD model [3], enabling the explicit representation of flood extent, depth, velocity, and intensity over complex urban terrain. The resulting flood fields are coupled with exposure datasets to quantify impacts on buildings, businesses, transportation networks, public utilities, and nature-based coastal assets. Rather than focusing solely on physical hazard metrics, the study introduces impact-relevant indicators that reflect disruption to urban functionality, public safety, and socio-economic continuity.
By combining stakeholder-informed sensitivity analysis, probabilistic extreme sea level estimation, and high-resolution hydraulic modelling, this contribution provides a robust and transferable assessment of future coastal flooding impacts in Kalamaria under 21st century climate change projections. The proposed approach supports evidence-based coastal adaptation planning and underscores the urgency of locally tailored resilience strategies for Mediterranean urban waterfronts in the face of rising sea levels.
2. Methods and Data
The applied methodology combines outputs from climate projections and storm surge modelling with extreme-value statistics, in situ tide-gauge records, and reduced-complexity coastal inundation simulations within an integrated impact-assessment framework developed under the MedSeaRise initiative [1].
First, climate-driven storm surge simulations are performed for the Mediterranean Sea using the Mediterranean Climatic Storm Surge (MeCSS) hydrodynamic model [4], forced by atmospheric fields derived from RCMs of the Med-CORDEX database. These simulations provide spatially consistent time series of storm-induced SLE along the Greek coastline, with particular emphasis on the northeastern Thermaikos Gulf. Second, annual maxima of storm-induced SSH are extracted at coastal grid points representative of the Kalamaria littoral zone. Extreme Value Analysis (EVA) is then applied using the GEV distribution to estimate return levels for rare storm surge events (e.g., 50- and 100-year return periods) under historical and future climate conditions. Third, location-specific SLE scenarios are constructed by combining probabilistic storm surge extremes with deterministic astronomical tides (derived from in situ observations and global tidal models) and projected SLR obtained from satellite altimetry and IPCC-consistent climate scenarios (RCP/SSP5 4.5 and 8.5) for short- and long-term future horizons [1,2,4].
Finally, the derived SLE values are used as dynamic boundary conditions for high-resolution coastal inundation simulations using the CoastFLOOD model [3], which implements a reduced-complexity, raster-based hydraulic formulation to simulate flood extent, water depth, velocity, and flood intensity over complex urban terrain. High-resolution Digital Elevation Models (DEMs) are combined with land-use-dependent roughness fields to represent urban and natural surface characteristics with grid resolutions of 2–5 m. The resulting flood hazard outputs are spatially overlaid with cadastral, infrastructure, land-use, and population datasets to quantify exposure and compute impact indicators. These indicators underpin impact and hazard curves, linking flood severity to event probability across climate scenarios and GWLs.
2.1. Coastal Sea Level Data
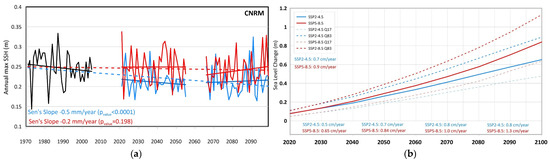
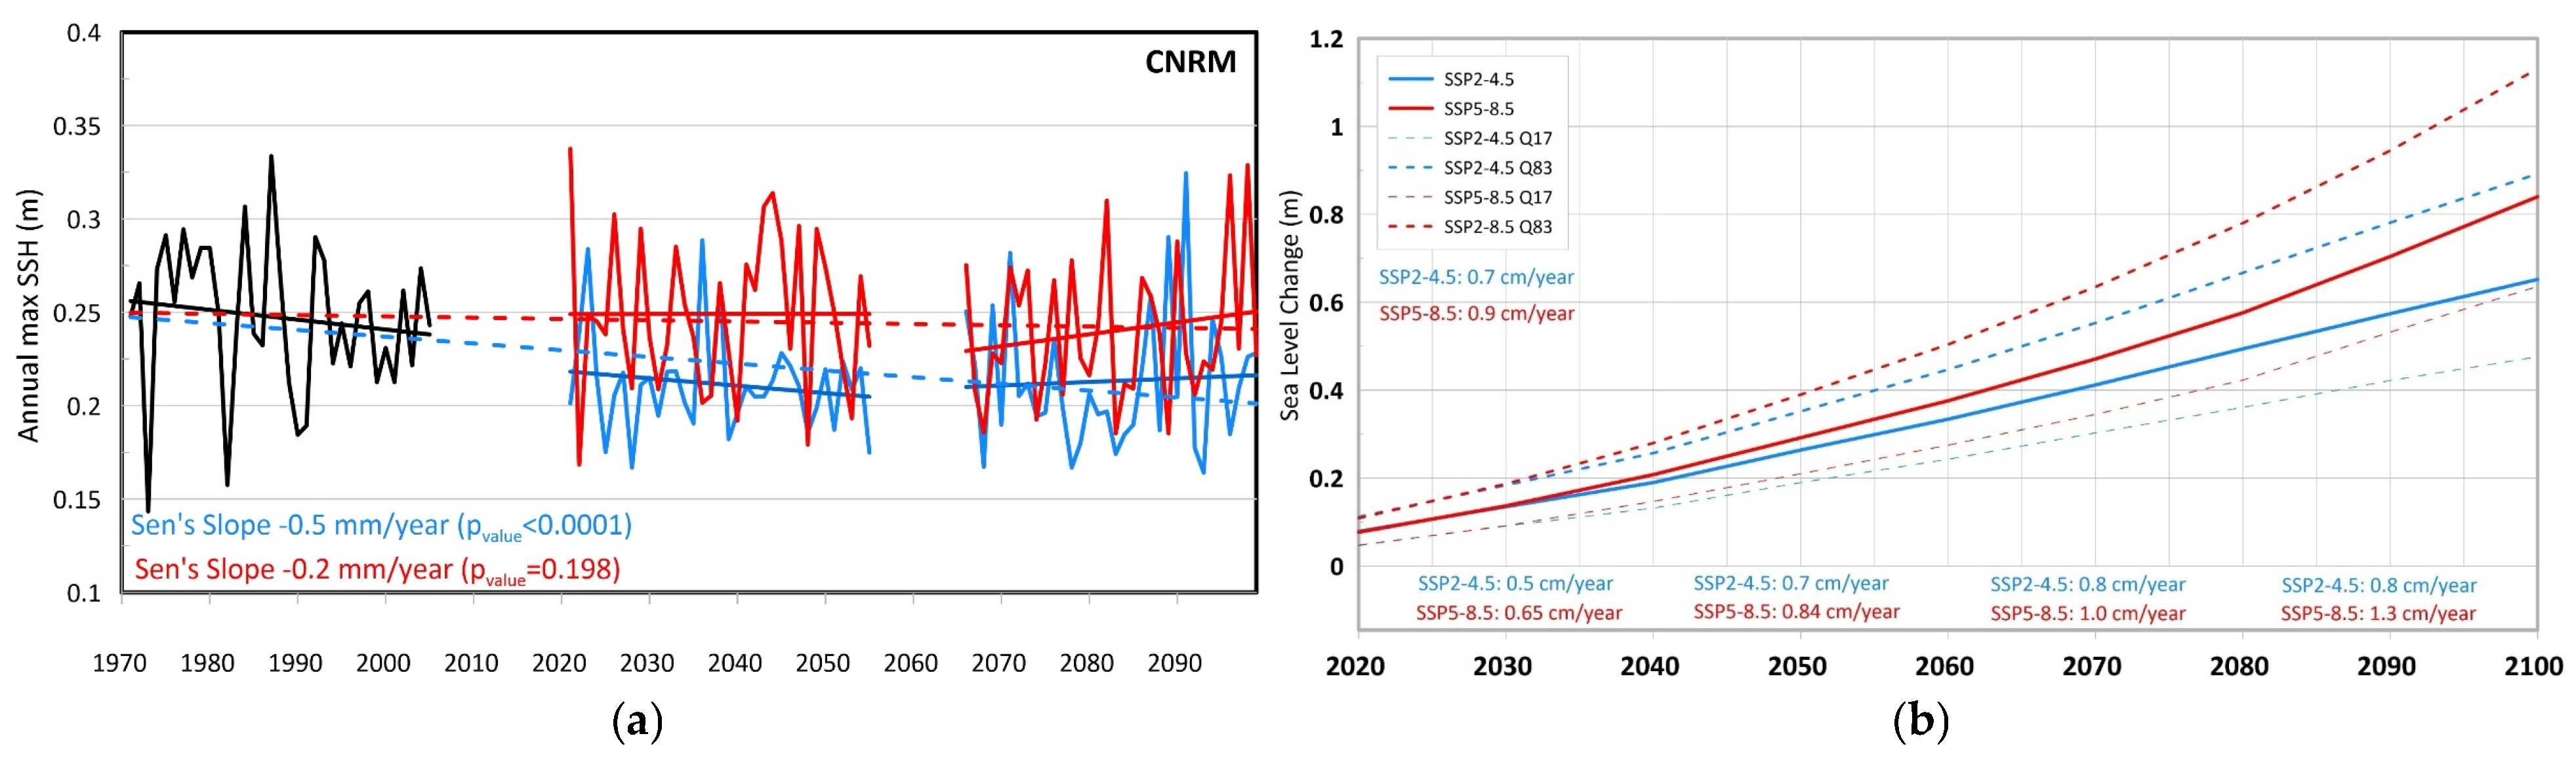
To define extreme sea level conditions relevant to coastal flooding, storm surge extremes are combined with astronomical tides and projected SLR to yield the SLE = SSH + Tide + SLR condition along the coastline. Wave action is not included due to limited data availability and the relatively sheltered geomorphological setting of the northeastern Thermaikos Gulf, where wave-induced contributions are considered secondary. Storm-induced SSH is quantified using MeCSS model outputs, based on atmospheric input from three high-resolution RCMs of the Med-CORDEX database: CMCC-CCLM, CNRM-ALADIN, and GUF-CCLM-NEMO. Model simulations are performed for a historical reference period (1971–2005) and two future 35-year periods representing short-term (STF: 2021–2055) and long-term (LTF: 2066–2100) climate conditions under RCP4.5 and RCP8.5 emission scenarios (Figure 2a). For each coastal grid cell representative of the Kalamaria littoral zone, storm-induced SSH time series are extracted and high-pass filtered to remove low-frequency variability unrelated to meteorological forcing.
Figure 2.
(a) Historical (black line), STF, and LTF estimations and projections of storm surge-induced sea level (SSH) during the periods of analysis: 1971–2005, 2021–2055, and 2066–2100, based on two future scenarios (RCP4.5 and RCP8.5; blue and red lines, respectively) and three RCMs of the MED-CORDEX datasets (only CNRM shown here). Linear trends (solid lines) and the respective Sen’s slopes (mm/year) [5] and their statistically significant p-values are also shown. Dashed lines indicate the overall linear trend over all periods. (b) Future estimative projections of MSL change (m) during the 21st century as derived from two future scenarios (SSP2-4.5 and SSP5-8.5) [6] for Thermaikos Gulf. Projections are relative to a 1995–2014 baseline. The respective 17th and 83rd quantiles for each case are marked (dashed lines). The Sen’s slope trends for the entire century and every 20 years are also shown.
For the EVA, GEV parameters are estimated via the L-moments method, which is well suited for relatively short samples such as the 35-year annual maxima series considered herein. Return levels corresponding to 50- and 100-year return periods are derived for each climate period and scenario. Uncertainty bounds are quantified using a parametric bootstrap approach, in which synthetic samples are generated from the fitted GEV distributions, re-analysed, and used to construct confidence intervals. The statistical assumptions of independence and stationarity of the annual maxima are evaluated using the Mann–Kendall trend test and the Wald–Wolfowitz runs test.
Astronomical tides are characterised using long-term observations from the Hellenic Navy Hydrographic Service (HNHS) tide gauge at Thessaloniki port, ensuring robust representation of tidal variability, including multi-decadal nodal and metonic cycles, and enabling the construction of conservative storm-tide scenarios. HNHS samples digital recordings of sea level (at 10- to 15-min intervals) and archives them as hourly values, with raw analogue charts also retained (23 years of data from 1990 to 2012) [7]. The employed tidal range, i.e., Highest High Water–Mean Low Water (HHW-MLW), is 0.75 m for the worst-case scenario simulations, since the used Still Water Level (SWL) for the MeCSS model coastal bathymetry is based on MLW. The Epallaxis value (i.e., HHW—Lowest Low Water LLW) is 1.55 m, which also approximates potential storm tide amplitudes based on historical extreme surge conditions.
SLR is estimated by a combination of satellite altimetry observations from the Copernicus Marine Service for the recent historical period and future projections from NASA’s IPCC AR6 sea level projection tool for the 21st century [6]. Projections corresponding to the SSP2-4.5 and SSP5-8.5 scenarios are adopted, consistent with the RCP4.5 and RCP8.5 forcings used in the storm surge simulations. Long-term trends are quantified using Sen’s slope estimator [5], while statistical significance and potential regime shifts are assessed through non-parametric trend and homogeneity tests (Figure 2b). The uncertainty bands widen after 2060, with SSP5-8.5 showing a rapid acceleration. This has substantial implications for planning long-term adaptation in Kalamaria. Based on SSP2-4.5 and SSP5-8.5 for the 21st century, the overall MSL change at the Kalamaria coastline is 0.7 cm/year and 0.9 cm/year, respectively. The trend differences between the 2020–2040 and 2080–2100 periods are 0.3 cm/year for SSP2-4.5 and 0.65 cm/year for SSP5-8.5. The resulting SLE scenarios are subsequently imposed as offshore boundary conditions in high-resolution coastal inundation simulations, thereby establishing a physical link between large-scale climate forcing and local-scale flood impacts in the Kalamaria littoral zone.
2.2. Coastal Flooding Model–Inundation Hazard/Exposure Assessment
CoastFLOOD is a reduced-physics two-dimensional hydraulic model designed for high-resolution floodplain applications in low-lying coastal environments. The model solves the depth-averaged mass-balance equations on an ortho-regular Cartesian raster grid, in which floodwater storage and intercell exchanges govern the temporal evolution of water depth in each computational cell. Hydraulic fluxes between neighbouring cells are computed through a decomposed Manning-type formulation, driven by local gradients in water surface elevation [3]. For the Kalamaria case study, the computational domain spans coastal floodplains of approximately 11 km in alongshore extent and comparable cross-shore widths, discretised at spatial resolutions of 2–5 m. This configuration yields simulation grids of up to ~16 × 106 cells, enabling detailed representation of urban infrastructure, coastal morphology, and low-elevation corridors that govern flood connectivity. Topographic inputs are derived from high-resolution DEM provided by the Hellenic Cadastre, referenced to the Greek Geodetic Reference System 1987 (GGRS87) [8]. Floodplain roughness is parameterised using a spatially distributed set of Manning’s roughness coefficients, discretised at 43 Manning-n values, representative of natural and artificial coastal surfaces. Land-use information from the CORINE Land Cover (CLC) inventory [9] is mapped to these roughness classes through lookup tables [3].
Exposure assessment constitutes a core component of the applied coastal flood risk methodology and refers to the presence and spatial concentration of people, infrastructure, economic activities, and environmental assets within areas potentially affected by littoral inundation (viz., exposure reflects both direct overlap of assets with flooded areas and functional proximity to flood-prone zones). In this study, exposure is quantified through a spatially explicit analysis that links simulated coastal flood extents to the distribution of at-risk elements. High-resolution inundation outputs are intersected with geospatial datasets describing the built environment, critical infrastructure, transportation networks, public utilities, economic activities, public open spaces, and population patterns. Elements located fully or partially within simulated flood polygons are classified as directly exposed, while assets located immediately adjacent to flooded areas are also considered potentially affected due to access disruption, service interruption, or cascading impacts. A key metric for expressing exposure is the Flooded Fraction (FF), defined as the ratio of the flooded portion of a given asset class to its total potentially susceptible extent within the study area. For the built environment, FF is computed as the ratio of flooded built-up area to the total built-up area lying within low-elevation coastal zones. This dimensionless indicator provides a normalised measure of exposure that is directly comparable across scenarios, return periods, and climate horizons. By construction, FF captures not only absolute flood extent but also the relative severity of inundation impacts on urbanised coastal systems.
The adopted methodology is consistent with the best international practices for coastal flood risk assessment, as outlined by the IPCC and UNDRR [10], while prioritising high-resolution, site-specific analysis over coarse global indicators. Finally, the mapping of elements at risk is informed by complementary sources of local knowledge, including in situ inspections of the Kalamaria waterfront, expert judgement, and a focused literature review of the study area. Flood hazard–exposure curves are constructed by pairing FF values obtained from dynamic inundation simulations with corresponding exceedance probabilities of SLE extremes. The resulting curves visualise how exposure escalates as event probability decreases and climatic forcing increases. Proxy indicators—such as commercial unit density, land-use value classes, or infrastructure criticality—may be incorporated to refine exposure interpretation as a precursor to flood risk assessment.
3. Results
Coastal Inundation Maps
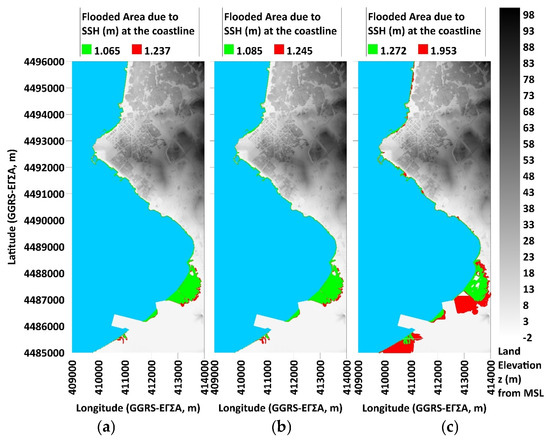
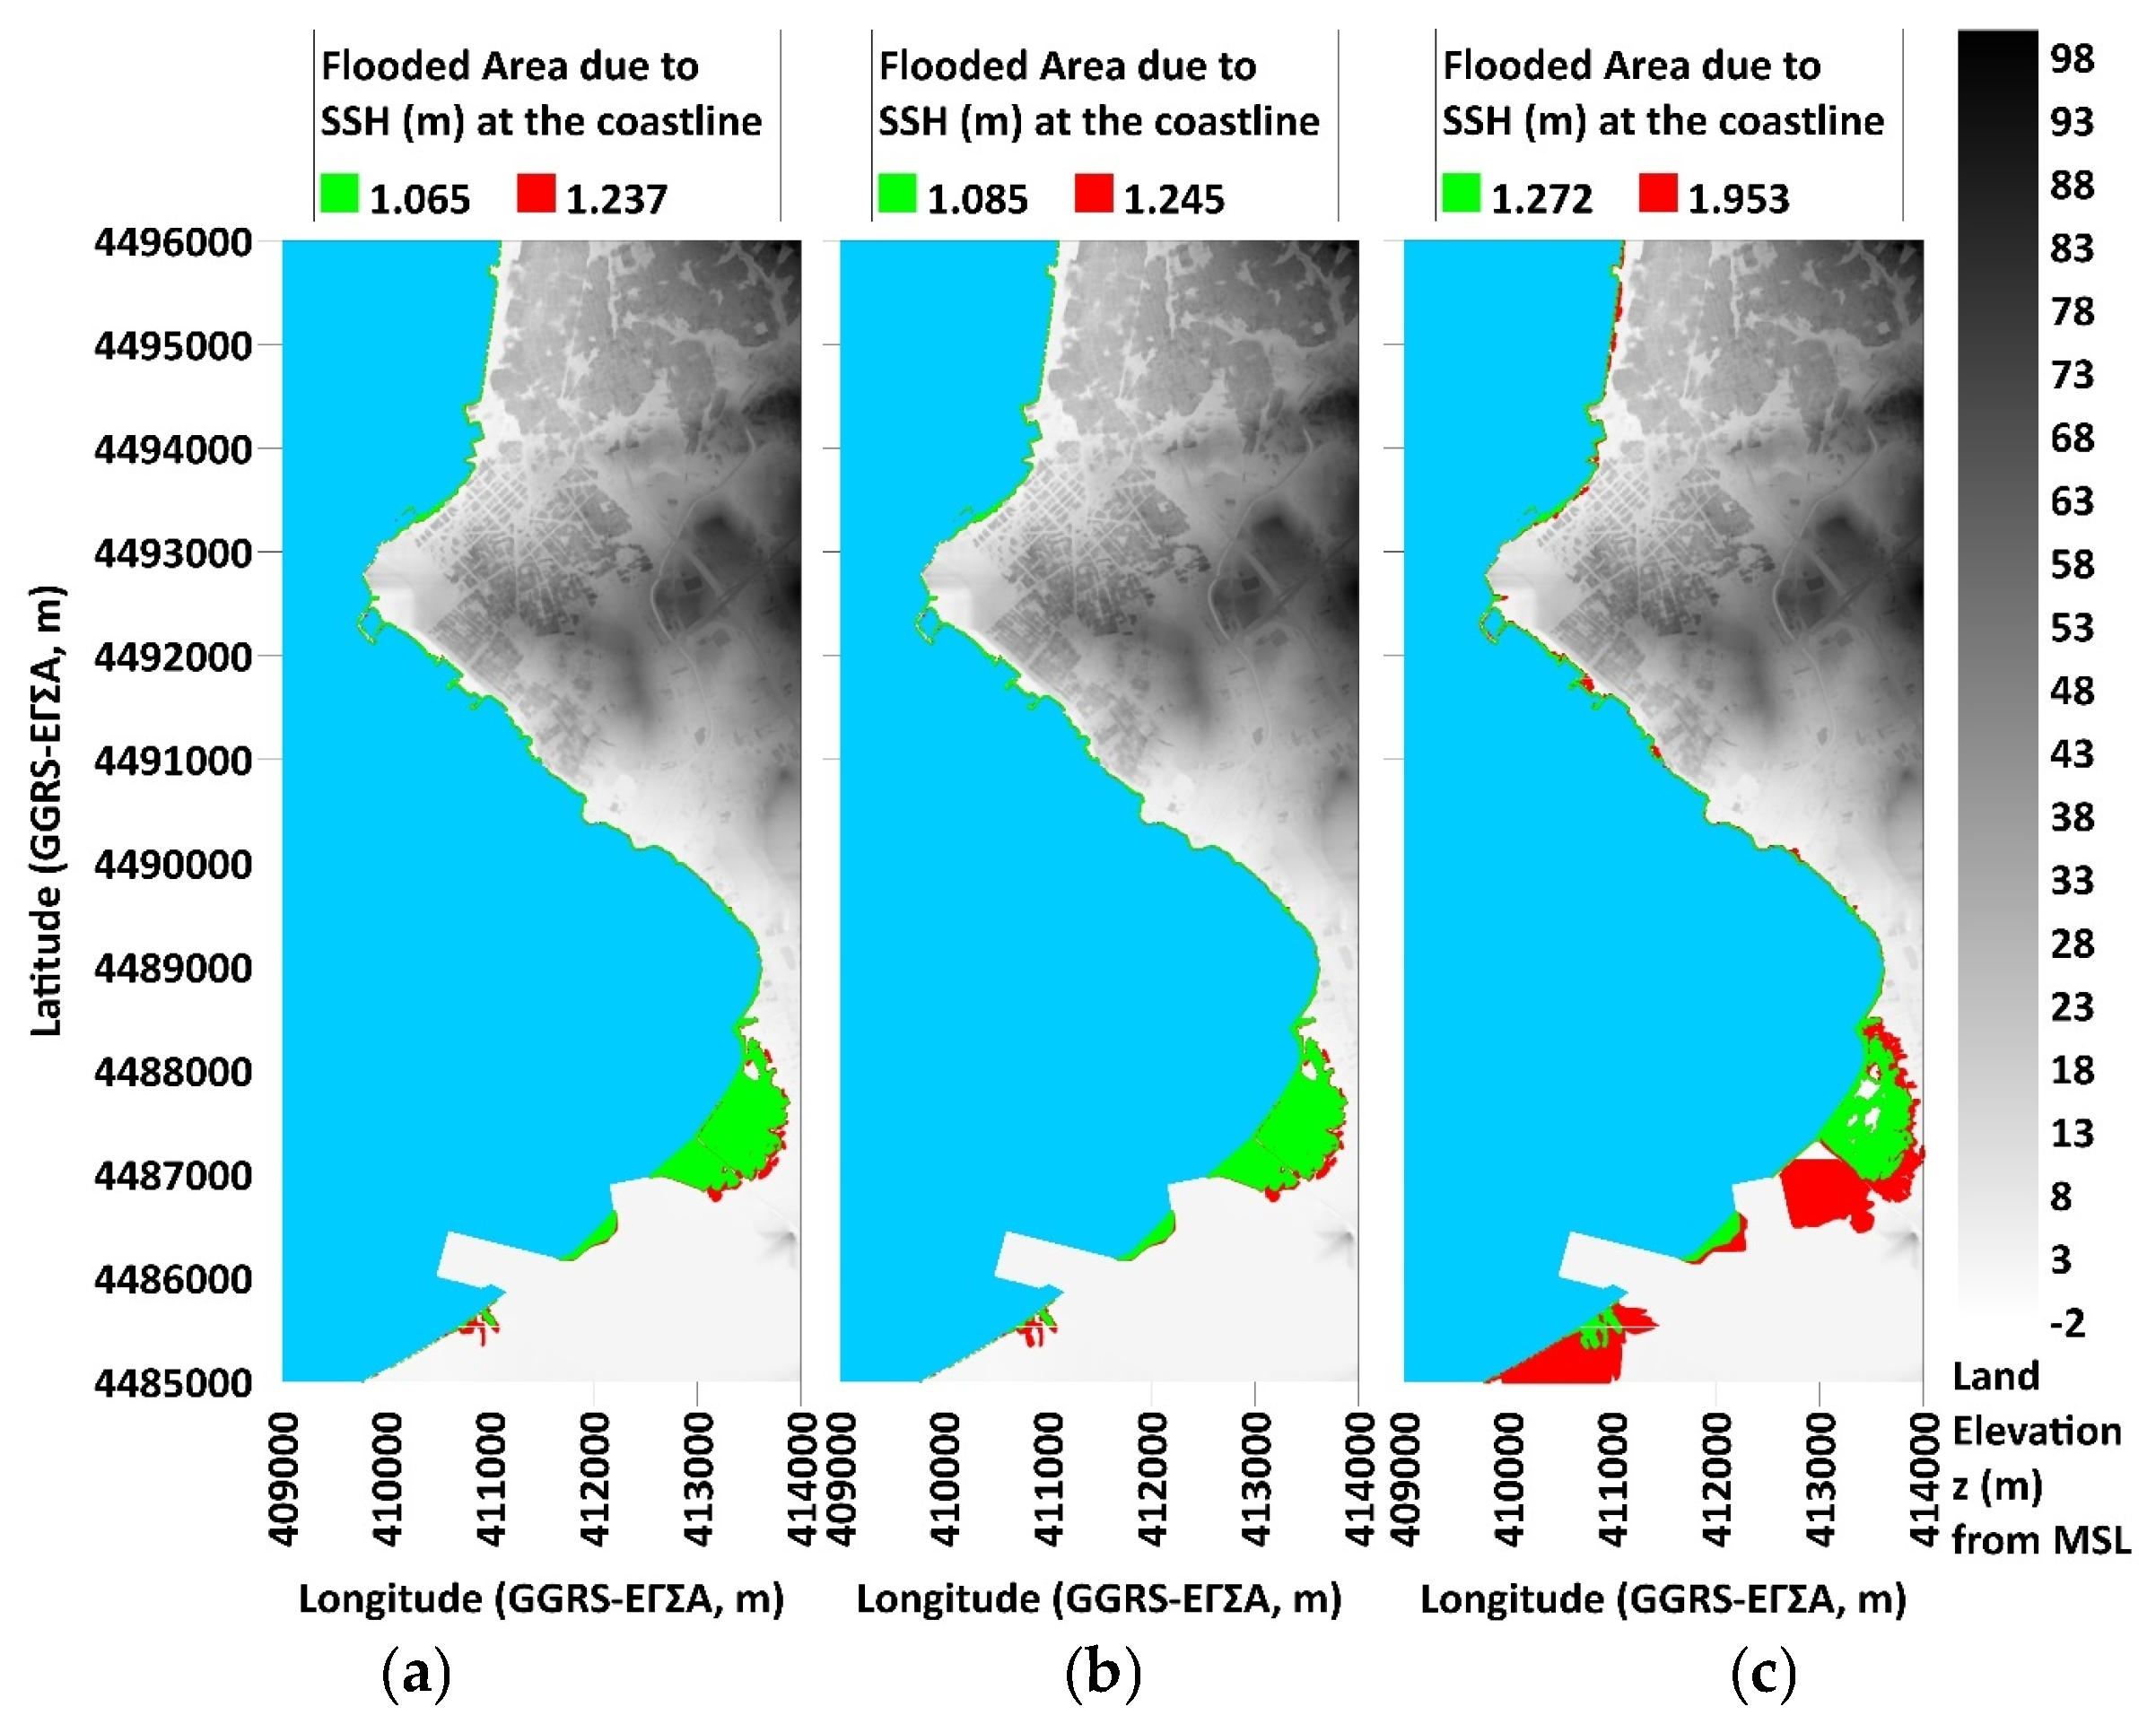
Figure 3 portrays Flooded Areas (FAs) simulated using CoastFLOOD under historical and future scenarios combining SSHext, SLRmean/max, and tidal range. Differences between panels show the compounding nature of future SLEext hazards. The expansion of inundation under LTF RCP8.5 scenarios is stark. Urban areas previously unaffected under historical conditions are becoming increasingly at risk.
Figure 3.
Simulated results of FAext extents by CoastFLOOD model due to coastal SLE values, based on: (a) combination of Maximum Tidal Range of 0.75 m in the Kalamaria area with extreme storm surges SSHext of 50-/100-year (RCP4.5/8.5 scenarios for STF and LTF periods from a 3 RCM-ensemble) without SLR; (b) including SLRmean; (c) including SLRmax. Green and red hatches represent flooded areas corresponding to the minimum and maximum SLEext along the coastline, respectively.
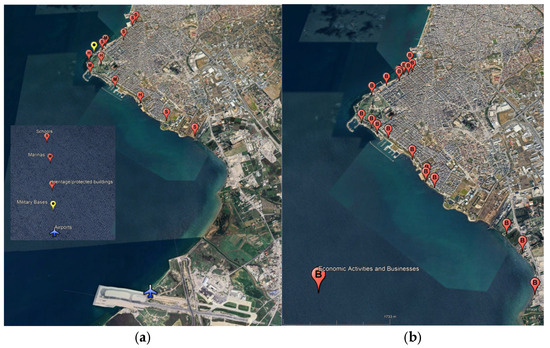
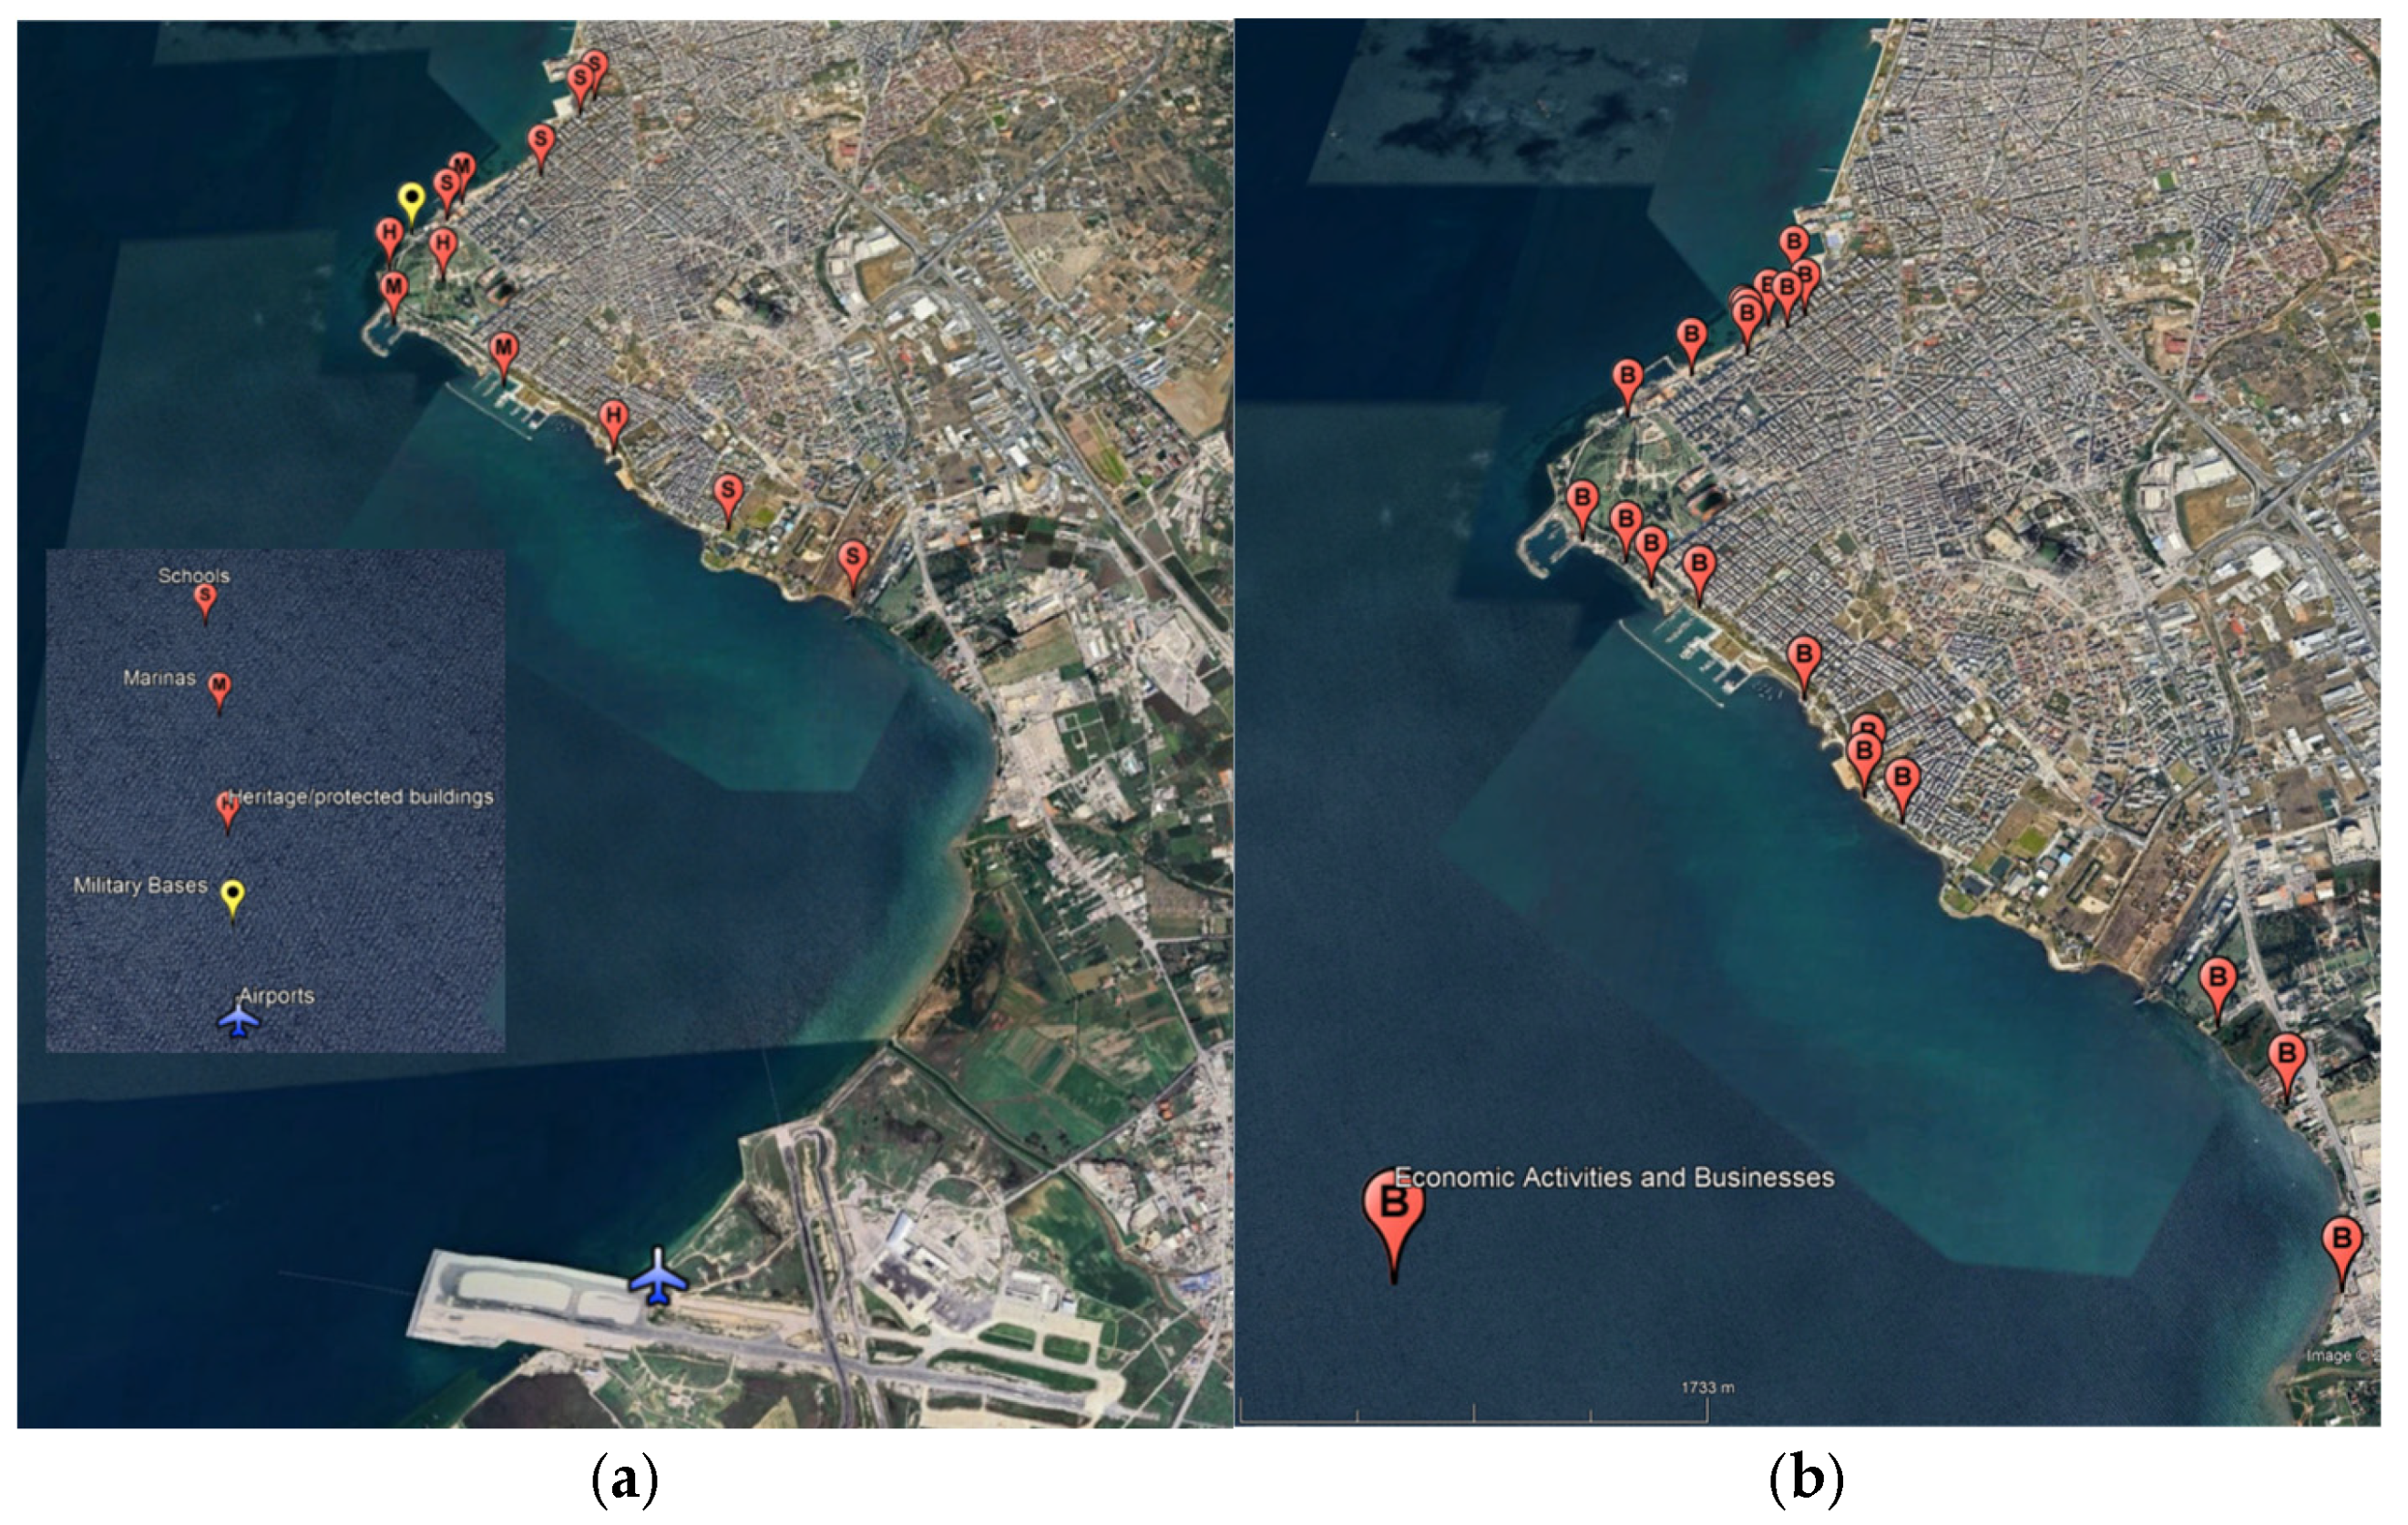
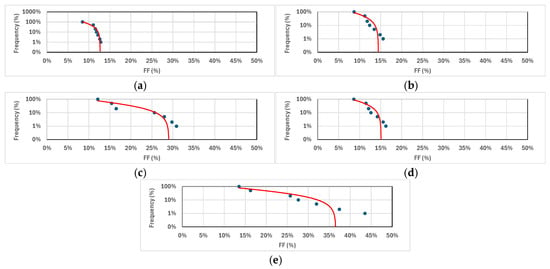
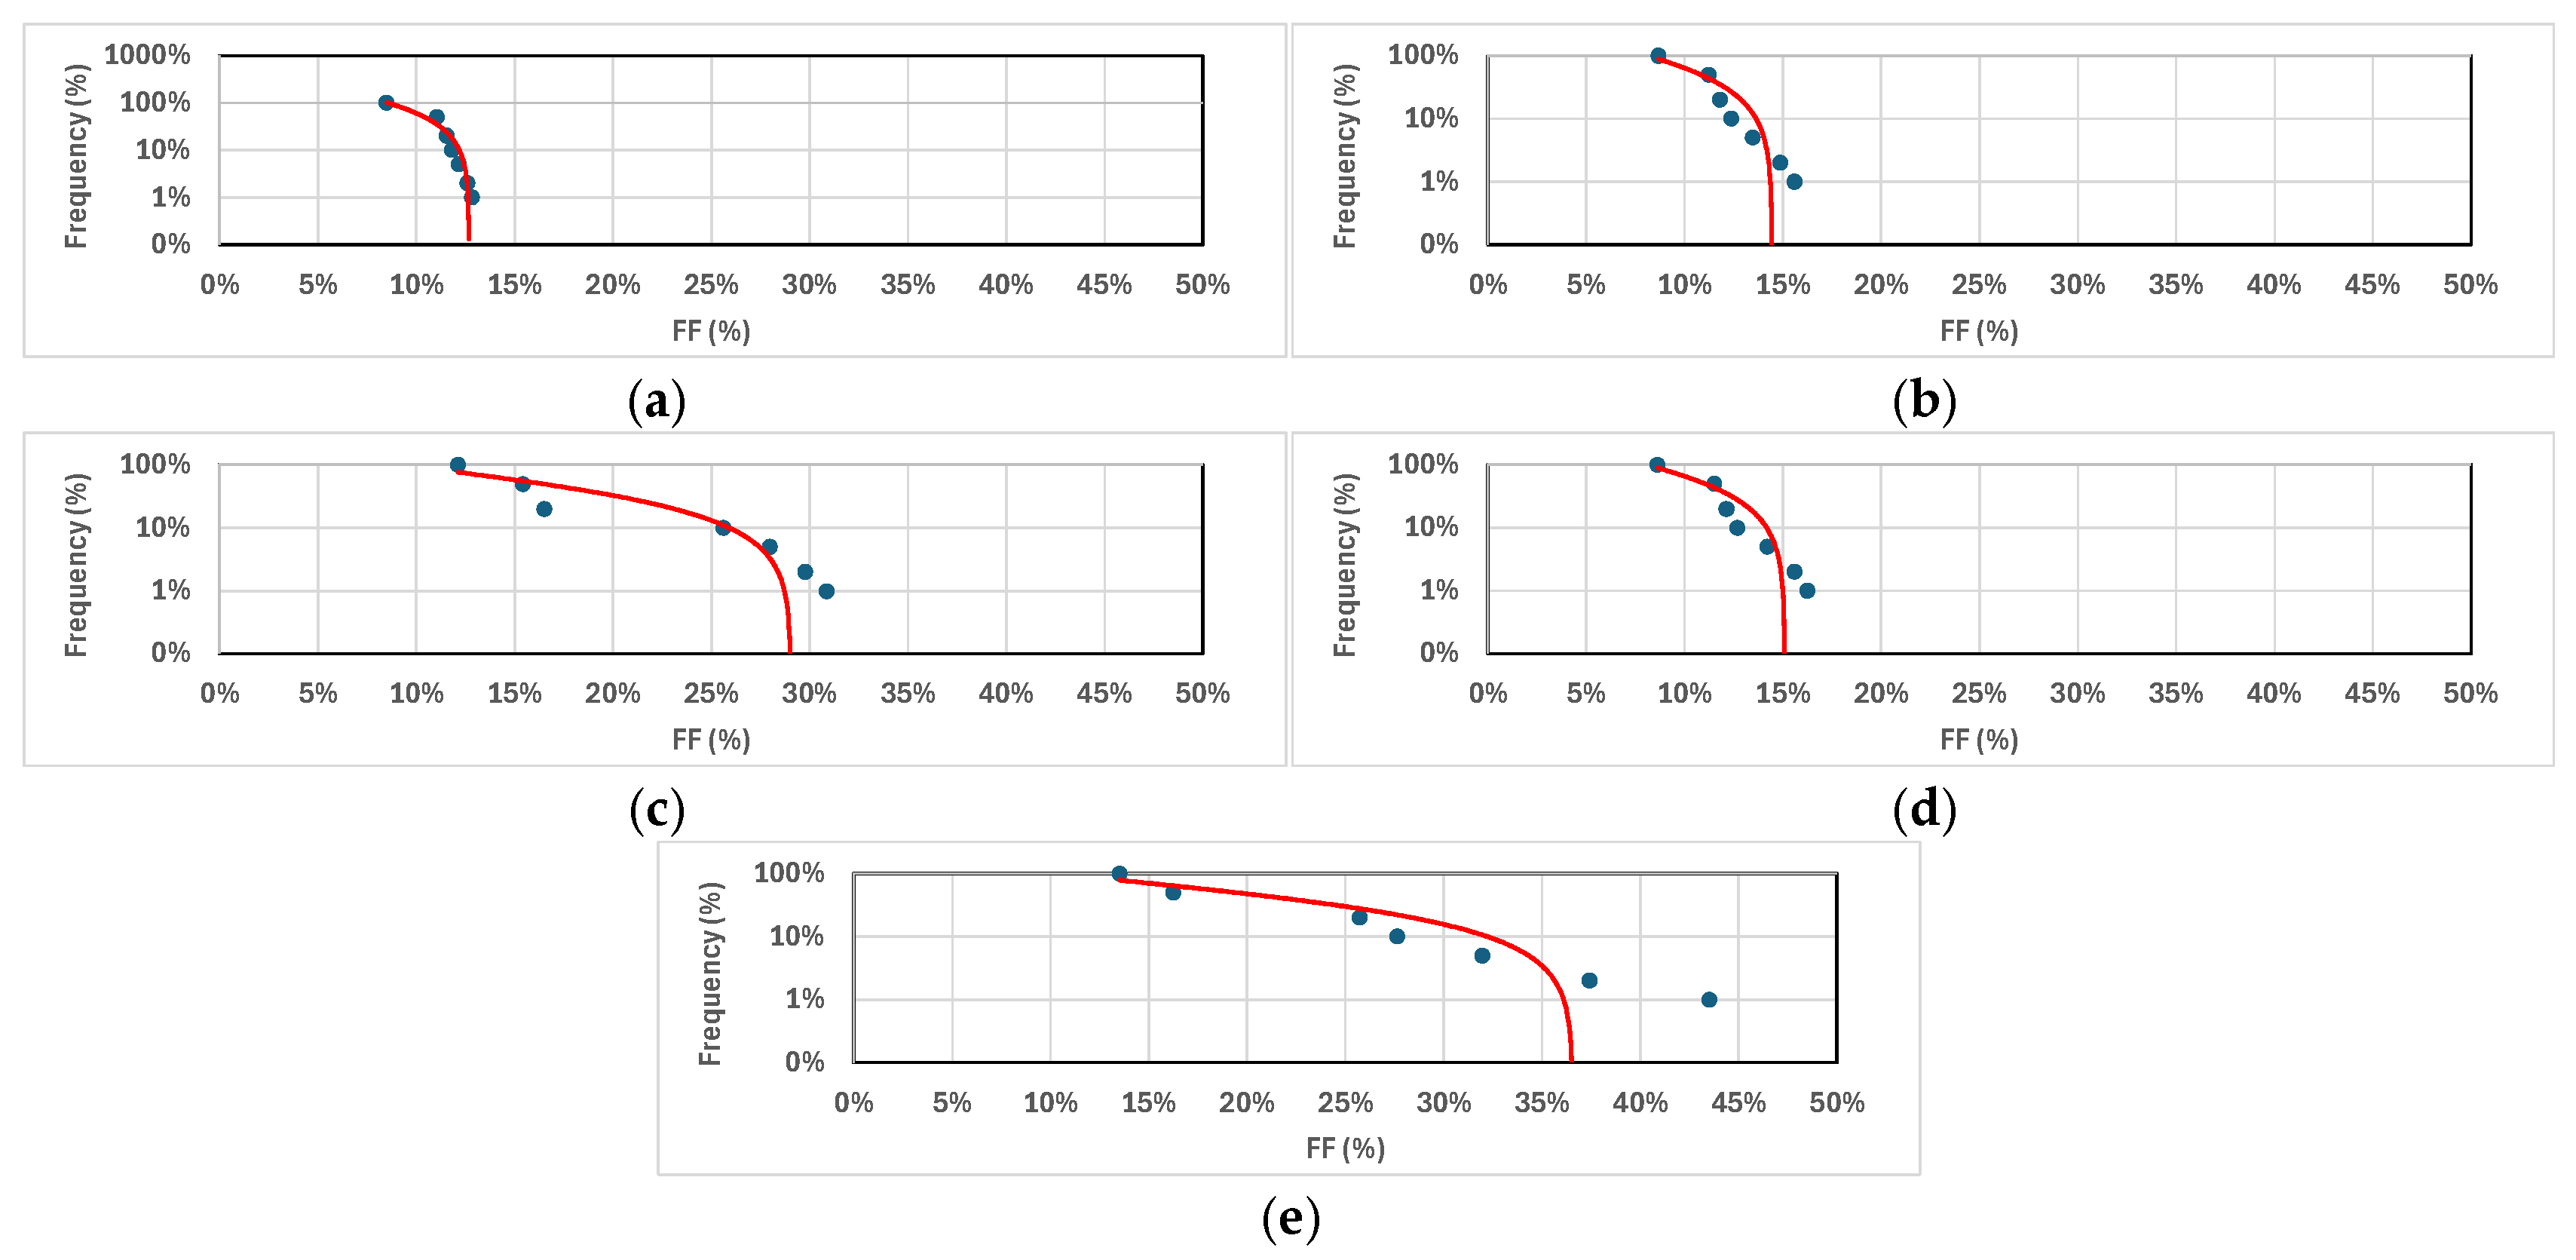
The scenario values in Table 1 indicate that SLR has a significant impact, particularly in the LTF and RCP8.5 cases. For instance, CNRM projects a +233.73% increase in FAext for 100-yr LTF-RCP8.5 under SLRmax. This illustrates an exponential growth of flood hazards under high-emission futures. Figure 4a shows the elements at risk, focusing only on infrastructure and public buildings of special interest, i.e., schools, heritage buildings, and health facilities in low-lying areas, which elevate vulnerability beyond economic loss to include safety and the continuity of public services. Figure 4b shows the pinpointed elements at risk, including important local economic activities and businesses. Spatial clustering of commercial assets’ exposure (e.g., numerous cafés, restaurants/taverns, marinas, retail establishments) along the Sofouli corridor and the Aretsou shoreline suggests a potential for high-value disruption. The prominence of open-air venues further complicates flood-resilience efforts. Figure 5 shows the coastal flood risk curves for FA based on the CoastFLOOD model due to coastal SLE values, across Historical, STF, and LTF periods’ 1- to 100-year Return Periods. The flood hazard/exposure curves exhibit a sharp upward curvature under the LTF-8.5 scenario, such that even the 10-year event exceeds 1300 stremmas FA. The historical trend remains relatively linear, but future scenarios indicate a convex escalation, suggesting that infrastructure designed under historical assumptions will become substantially inadequate.
Table 1.
Twelve (6 vs. 6; GWL 2 °C vs. 4 °C, respectively) selected RCP8.5 scenario values of SLR (mean and max) impact on projections and climate change signals of FAext (Difference of Future-Historical Period, Diff, in %) for STF and LTF periods’ 50-/100-year Return Period (RP) extreme SLEs, based on 3 RCMs of the MED-CORDEX datasets (CMCC, CNRM, GUF) [2].
Figure 4.
Examples of identified elements at risk of littoral flooding phenomena along the Kalmaria. coastal zone, comprising: (a) infrastructure and public buildings (schools, marinas, protected heritage, airports); (b) economic activities and businesses (bars/restaurants, boatyards, open-air cinema).
Figure 5.
Coastal Flood hazard/exposure curves for FF (%) based on CoastFLOOD model due to coastal SLE values, based on a combination of Historical, STF, and LTF periods’ 1-, 2-, 5-, 10-, 20-, 50-, and 100-year Return Periods (RP) and respective Frequencies of extreme SLE based on one RCM (i.e., GUF) of Med-CORDEX, (a) GWL 1 °C; (b) GWL 1.5 °C; (c) GWL 2.5 °C; (d) GWL 2 °C; (e) GWL 4 °C.
4. Conclusions
This study demonstrates a strong, nonlinear escalation of coastal flooding in the Kalamaria littoral zone under projected Sea Level Rise (SLR) and extreme storm-tide conditions during the 21st century. Results indicate that long-term high-emission scenarios (RCP8.5/GWL ≈ 4 °C) lead to disproportionate increases in flooded area and exposure, rendering infrastructure designed under historical conditions increasingly inadequate. The Flooded Fraction-based hazard–exposure curves highlight a regime shift toward high-impact events even at moderate return period conditions. These findings underscore the urgency of locally tailored, climate-informed coastal adaptation and resilience strategies for microtidal Mediterranean urban waterfronts towards 2100.
Author Contributions
Conceptualisation, resources, writing—original draft preparation, project administration, funding acquisition, C.M.; methodology, software, formal analysis, investigation, data curation, writing—review and editing, visualisation, C.M. and Y.A. All authors have read and agreed to the published version of the manuscript.
Funding
This research was funded by ANATOLIKI S.A., via a direct assignment subcontract under the MedSeaRise Project (Euro-MED0200434) within the Interreg Euro-MED Programme.
Institutional Review Board Statement
Not applicable.
Informed Consent Statement
Not applicable.
Data Availability Statement
Data available upon request from MedSeaRise project consortium [1].
Conflicts of Interest
The authors declare no conflicts of interest.
References
- MedSeaRise Interreg Euro-MED Project. Available online: https://medsearise.interreg-euro-med.eu/ (accessed on 20 January 2026).
- Reale, M.; Cabos Narvaez, W.D.; Cavicchia, L.; Conte, D.; Coppola, E.; Flaounas, E.; Giorgi, F.; Gualdi, S.; Hochman, A.; Li, L.; et al. Future projections of Mediterranean cyclone characteristics using the Med-CORDEX ensemble of coupled regional climate system models. Clim. Dyn. 2021, 58, 2501–2524. [Google Scholar] [CrossRef] [Scilit]
- Makris, C.; Mallios, Z.; Androulidakis, Y.; Krestenitis, Y. CoastFLOOD: A High-Resolution Model for the Simulation of Coastal Inundation Due to Storm Surges. Hydrology 2023, 10, 103. [Google Scholar] [CrossRef] [Scilit]
- Makris, C.; Tolika, K.; Baltikas, V.; Baltikas, V.; Velikou, K.; Krestenitis, Y. The impact of climate change on the storm surges of the Mediterranean Sea: Coastal sea level responses to deep depression atmospheric systems. Ocean. Model. 2023, 181, 102149. [Google Scholar] [CrossRef] [Scilit]
- Sen, P.K. Estimates of the regression coefficient based on Kendall’s tau. J. Am. Stat. Assoc. 1968, 63, 1379–1389. [Google Scholar] [CrossRef]
- NASA Projection Tool. Available online: https://sealevel.nasa.gov/ipcc-ar6-sea-level-projection-tool (accessed on 20 January 2026).
- HNHS (Hellenic Navy Hydrographic Service). Statistical Data of Sea Level in Hellenic Ports, 2nd ed.; HNHS: Athens, Greece, 2015. [Google Scholar]
- Greek Geodetic Reference System 1987 (GGRS87). Available online: https://epsg.io/2100 (accessed on 20 January 2026).
- CORINE Land Cover. Available online: https://land.copernicus.eu/en/products/corine-land-cover (accessed on 20 January 2026).
- UN Office for Disaster Risk Reduction. Available online: https://www.undrr.org/drr-glossary/terminology (accessed on 20 January 2026).

Disclaimer/Publisher’s Note: The statements, opinions and data contained in all publications are solely those of the individual author(s) and contributor(s) and not of MDPI and/or the editor(s). MDPI and/or the editor(s) disclaim responsibility for any injury to people or property resulting from any ideas, methods, instructions or products referred to in the content. |
© 2026 by the authors. Licensee MDPI, Basel, Switzerland. This article is an open access article distributed under the terms and conditions of the Creative Commons Attribution (CC BY) license.