


Abstract
Urban Park vegetation plays a crucial role in mitigating air pollution by serving as a natural sink for gaseous and particulate pollutants, thereby enhancing the ecological sustainability of cities. Identifying tree species with high tolerance to air pollution is therefore essential for effective urban park planning and management in highly polluted urban environments. This study evaluated the air pollution tolerance of selected tree species commonly found in urban parks of Kandy City, Sri Lanka, using the Air Pollution Tolerance Index (APTI). Five tree species—Terminalia catappa (Indian almond), Cassia fistula (golden shower tree), Pongamia pinnata (Indian beech), Madhuca longifolia (butter tree), and Tabebuia rosea (pink poui)—were assessed at two urban park locations representing contrasting pollution levels, identified based on ambient SO2, NO2, and PM2.5 concentrations. APTI was calculated using four leaf biochemical parameters: pH, ascorbic acid content, relative water content, and total chlorophyll content. Leaf samples were collected from ten replicates of each species at both sites. Madhuca longifolia exhibited the highest APTI values (17.06 at the HP site and 25.17 at the LP site), followed by Cassia fistula, Terminalia catappa, Tabebuia rosea, and Pongamia pinnata. These findings suggest that the identified species, particularly Madhuca longifolia and Cassia fistula, are well-suited for urban greening and can contribute to mitigating air pollution impacts. However, these findings are constrained by a single cross-sectional sampling term, limited species screening, sequential data collection variances, and fixed mathematical equations. Consequently, future research should implement continuous multi-station monitoring arrays, expand species diversity, establish localized biochemical weightings, and initiate long-term multi-seasonal tracking to resolve temporal dynamics in tropical urban ecosystems.
Keywords:
urban air pollution; air pollution tolerance index (APTI); sulfur dioxide (SO2); nitrogen dioxide (NO2); particulate matter with an aerodynamic diameter ≤ 2.5 μm (PM2.5); urban park trees; Kandy city; ascorbic acid (AA); chlorophyll; leaf extract pH; relative water content (RWC); high pollution (HP); low pollution (LP); Pongamia pinnata; Terminalia catappa; Madhuca longifolia; Cassia fistula; Tabebuia rosea 1. Introduction
Urban air pollution has emerged as a major environmental challenge worldwide, largely driven by accelerated urban growth in many developing nations. This phenomenon contributes to the formation of smog, deterioration of atmospheric visibility, and a wide range of negative health outcomes. In Sri Lanka, Kandy City has been identified as one of the urban centres experiencing relatively high levels of air pollution, particularly in terms of air quality degradation [1,2]. The city’s surrounding mountainous terrain, together with restricted wind circulation, limits the effective dispersion of airborne contaminants, resulting in localized pollution hotspots, especially in areas with intense vehicular activity.
Conventional air quality monitoring approaches, including instrumental measurements and satellite-based assessments, provide valuable quantitative information on pollutant concentrations. However, these methods are often limited by high operational costs, restricted spatial coverage, and limited accessibility in resource-constrained settings. Moreover, such approaches may not fully capture the cumulative biological impacts of air pollutants on living systems. In this context, biological monitoring using plant-based indicators has gained increasing attention as a complementary and cost-effective approach for assessing environmental pollution [3,4,5].
Plant species differ considerably in their sensitivity and tolerance to atmospheric contaminants and their ambient concentrations, making vegetation a useful biological indicator of air pollution [6,7]. Exposure to common urban air pollutants, including carbon monoxide (CO), sulfur dioxide (SO2), ozone (O3), particulate matter (PM), and nitrogen dioxide (NO2), can disrupt normal physiological functions and impair plant growth and development [6]. Observable morphological symptoms—such as changes in leaf area and number, reduced stem and root length, and the development of chlorosis or necrosis—generally occur only after prolonged exposure or when pollutant levels exceed critical thresholds [5]. Prior to the appearance of these visible injuries, plants often undergo subtle physiological and biochemical alterations [8,9]. Consequently, the assessment of plant biochemical parameters offers an effective means for the early detection of pollution-induced abiotic stress [10,11,12].
The Air Pollution Tolerance Index (APTI) integrates key biochemical and physiological parameters of plants—namely, leaf pH, ascorbic acid content, relative water content, and total chlorophyll content—into a single composite index. Unlike conventional monitoring techniques that quantify pollutant concentrations alone, APTI reflects the cumulative biological response of plants to air pollution stress. This makes it a valuable proxy for assessing pollution impacts at a localized and potentially regional scale, particularly in areas where continuous instrumental monitoring is limited. Furthermore, APTI enables the identification of pollution-tolerant species suitable for urban greening, thereby linking environmental assessment with practical urban planning applications [13,14,15].
This study evaluated the air pollution tolerance of selected plant species across different pollution zones within Kandy City using the APTI approach. It was hypothesized that (i) APTI values would differ significantly between high-pollution (HP) and low-pollution (LP) sites due to varying levels of environmental stress, (ii) plant species would exhibit distinct tolerance levels based on their physiological and biochemical characteristics, and (iii) certain species, particularly evergreen species such as Madhuca longifolia, would demonstrate higher tolerance due to their inherent adaptive mechanisms.
2. Materials and Methods
2.1. Study Area
This study was conducted in Kandy City, Sri Lanka, which experiences an average annual temperature of 23.5 °C and an average annual precipitation of 1773 mm (Climate-data.org, 2020). The city’s complex topography, characterized by surrounding mountainous terrain and limited wind circulation, contributes to the accumulation and uneven spatial distribution of air pollutants.
In this study, regional air pollution level was considered the primary driving factor influencing plant physiological responses. Accordingly, study locations were classified into two environmental categories—high-pollution (HP) and low-pollution (LP) zones—to represent spatial variation in air quality across Kandy City [16].
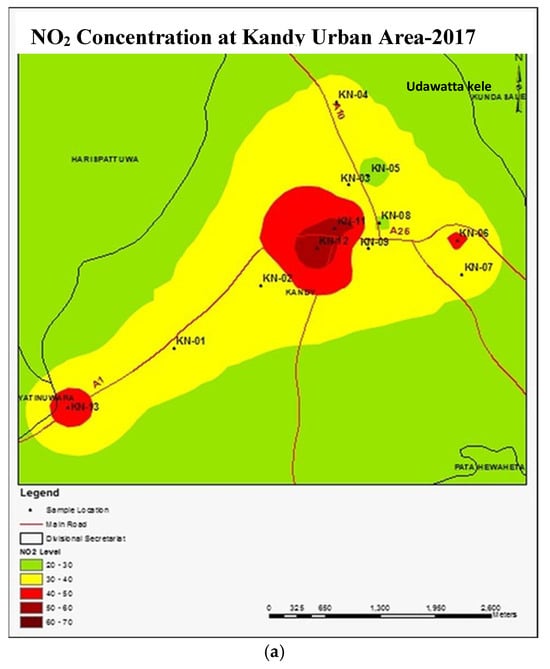
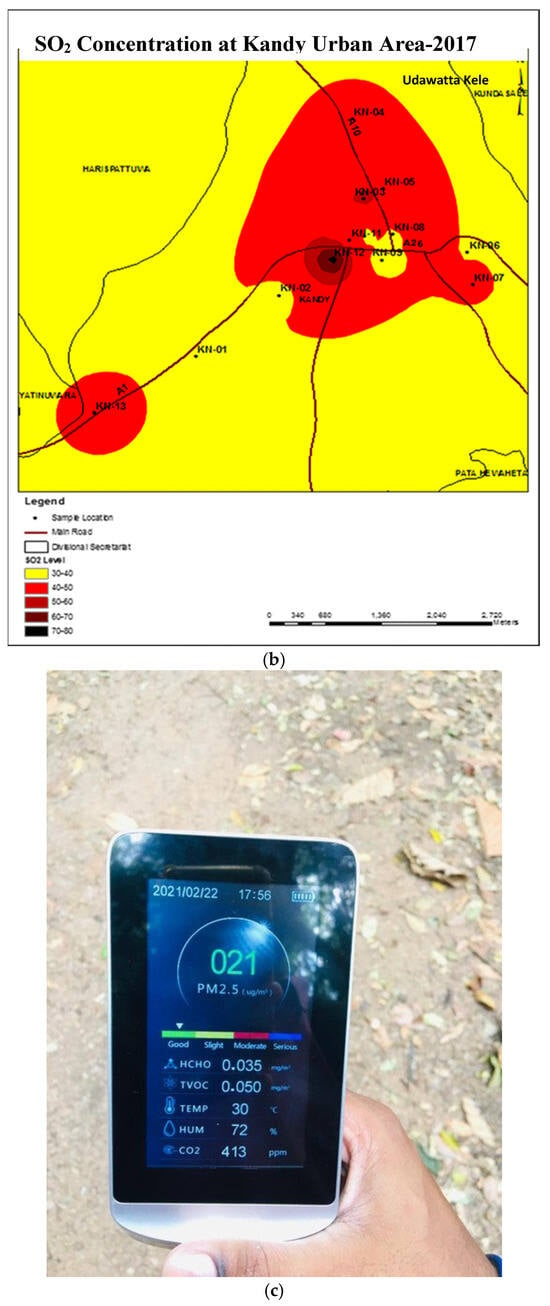
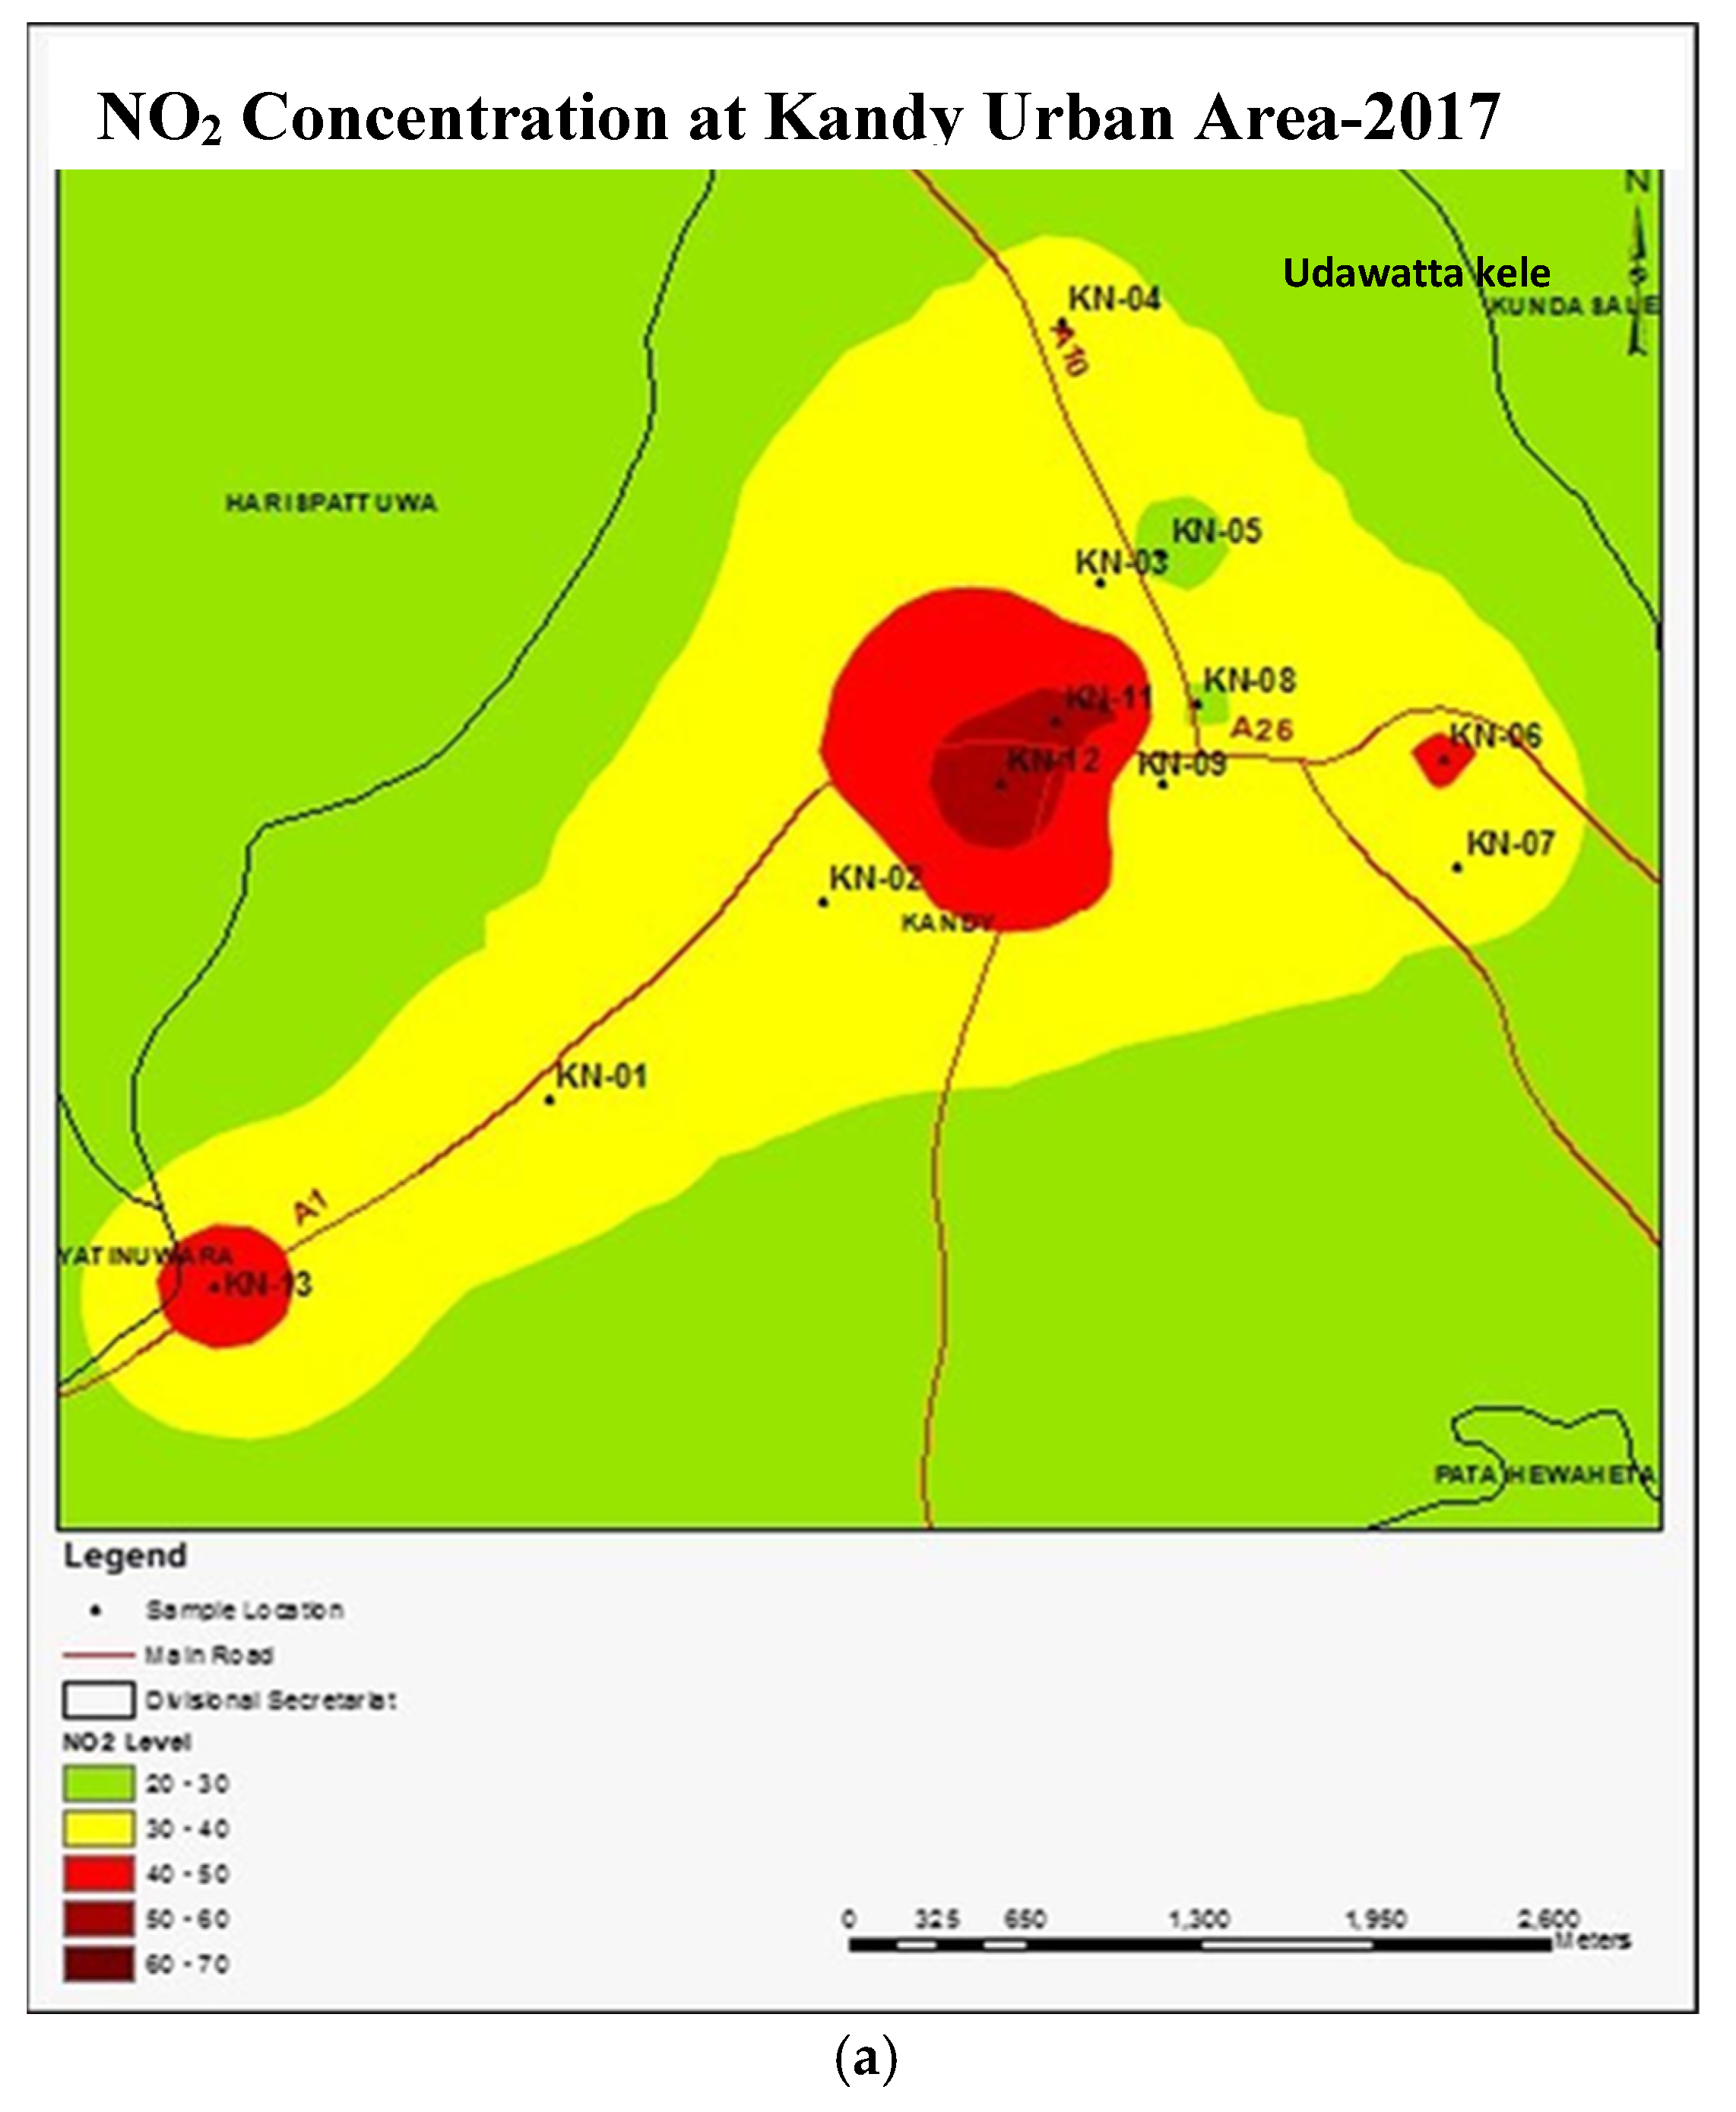
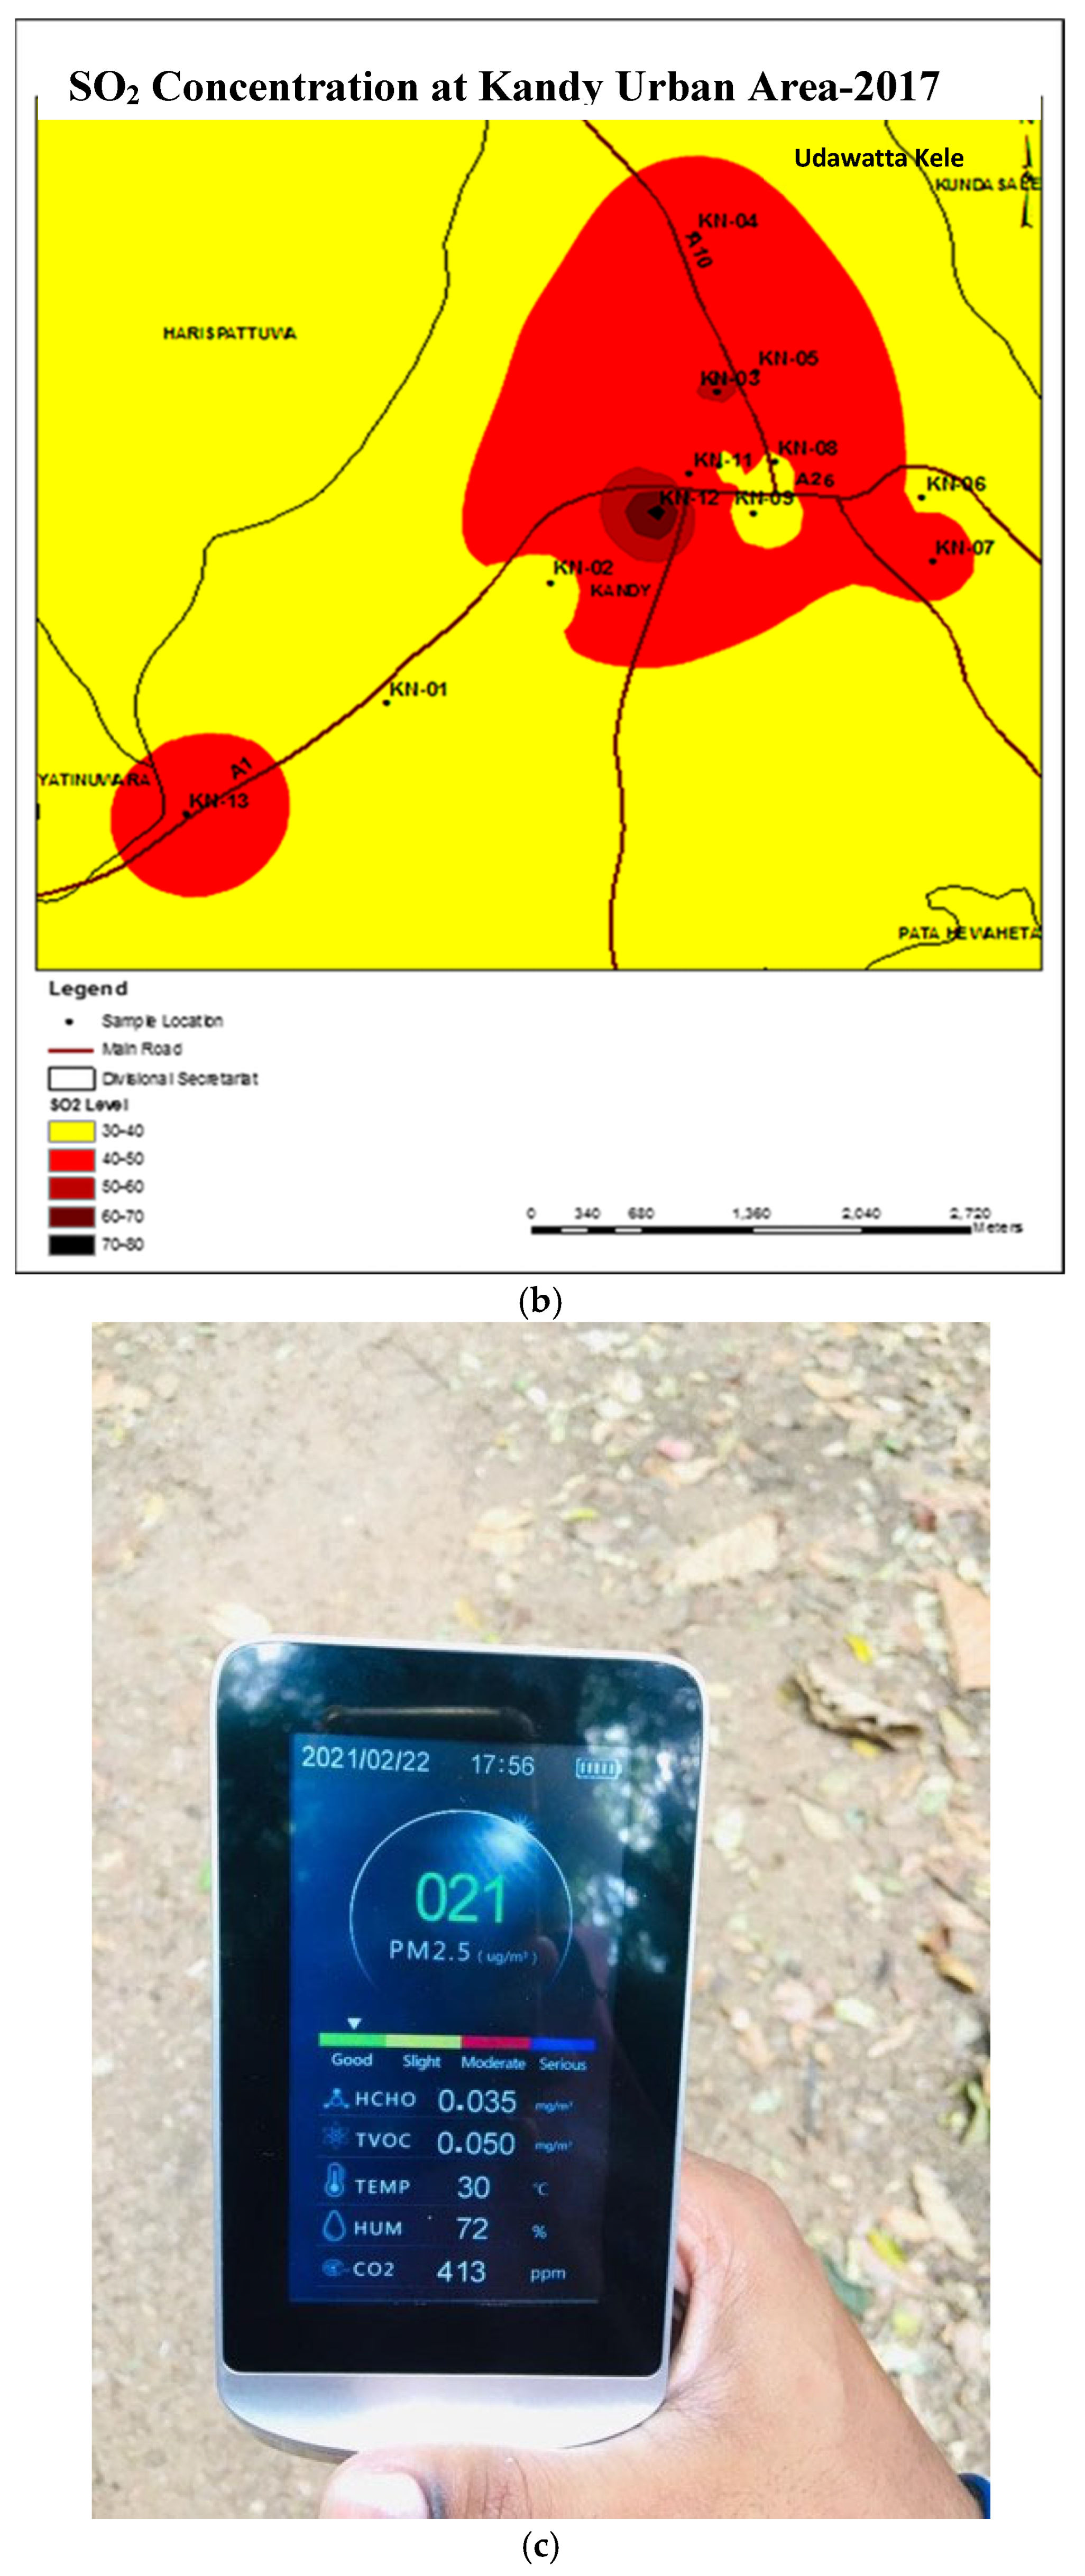
This classification was primarily based on spatial distribution data of ambient air pollutants obtained from the National Building Research Organization (NBRO), which reflect regional-scale pollution patterns influenced by urban activities and topographical conditions. Figure 1a,b illustrate the distribution of NO2 and SO2 concentrations across the study area based on NBRO data.
Figure 1.
(a) NO2 concentration map of Kandy Urban Area, (b) SO2 concentration map of Kandy Urban Area, (c) Portable Air Quality Monitoring Device (DM72B, Dienmern, Shenzhen, China).
To complement and support this regional classification, real-time measurements of CO2 and PM2.5 were conducted using a portable air quality monitoring device (DM72B, Dienmern, China) at selected locations. Therefore, measurements were conducted sequentially under comparable environmental conditions, and multiple readings at each site were averaged to improve reliability. These measurements were used only to support and validate the classification of high- and low-pollution sites, while primary site classification was based on NBRO data.
The average concentrations of NO2, SO2, PM2.5, and CO2 at the HP site ranged from 25–60 µg/m3, 33–75 µg/m3, 48 µg/m3, and 630 ppm, respectively, whereas the corresponding values at the LP site were 15–30 µg/m3, 20–30 µg/m3, 20 µg/m3, and 405 ppm, respectively. These differences confirm the presence of a clear pollution gradient between the selected sites.
Within this framework, plant species were assessed as biological indicators to evaluate physiological and biochemical responses to the defined pollution gradient. Therefore, variations in plant responses and Air Pollution Tolerance Index (APTI) values are interpreted as the combined effect of regional air pollution levels (primary factor) and species-specific tolerance mechanisms.
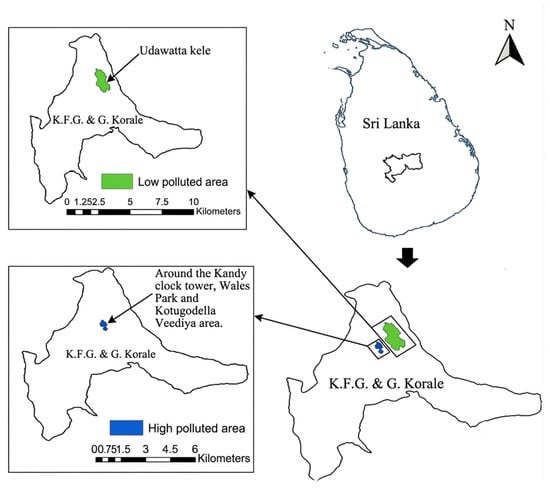
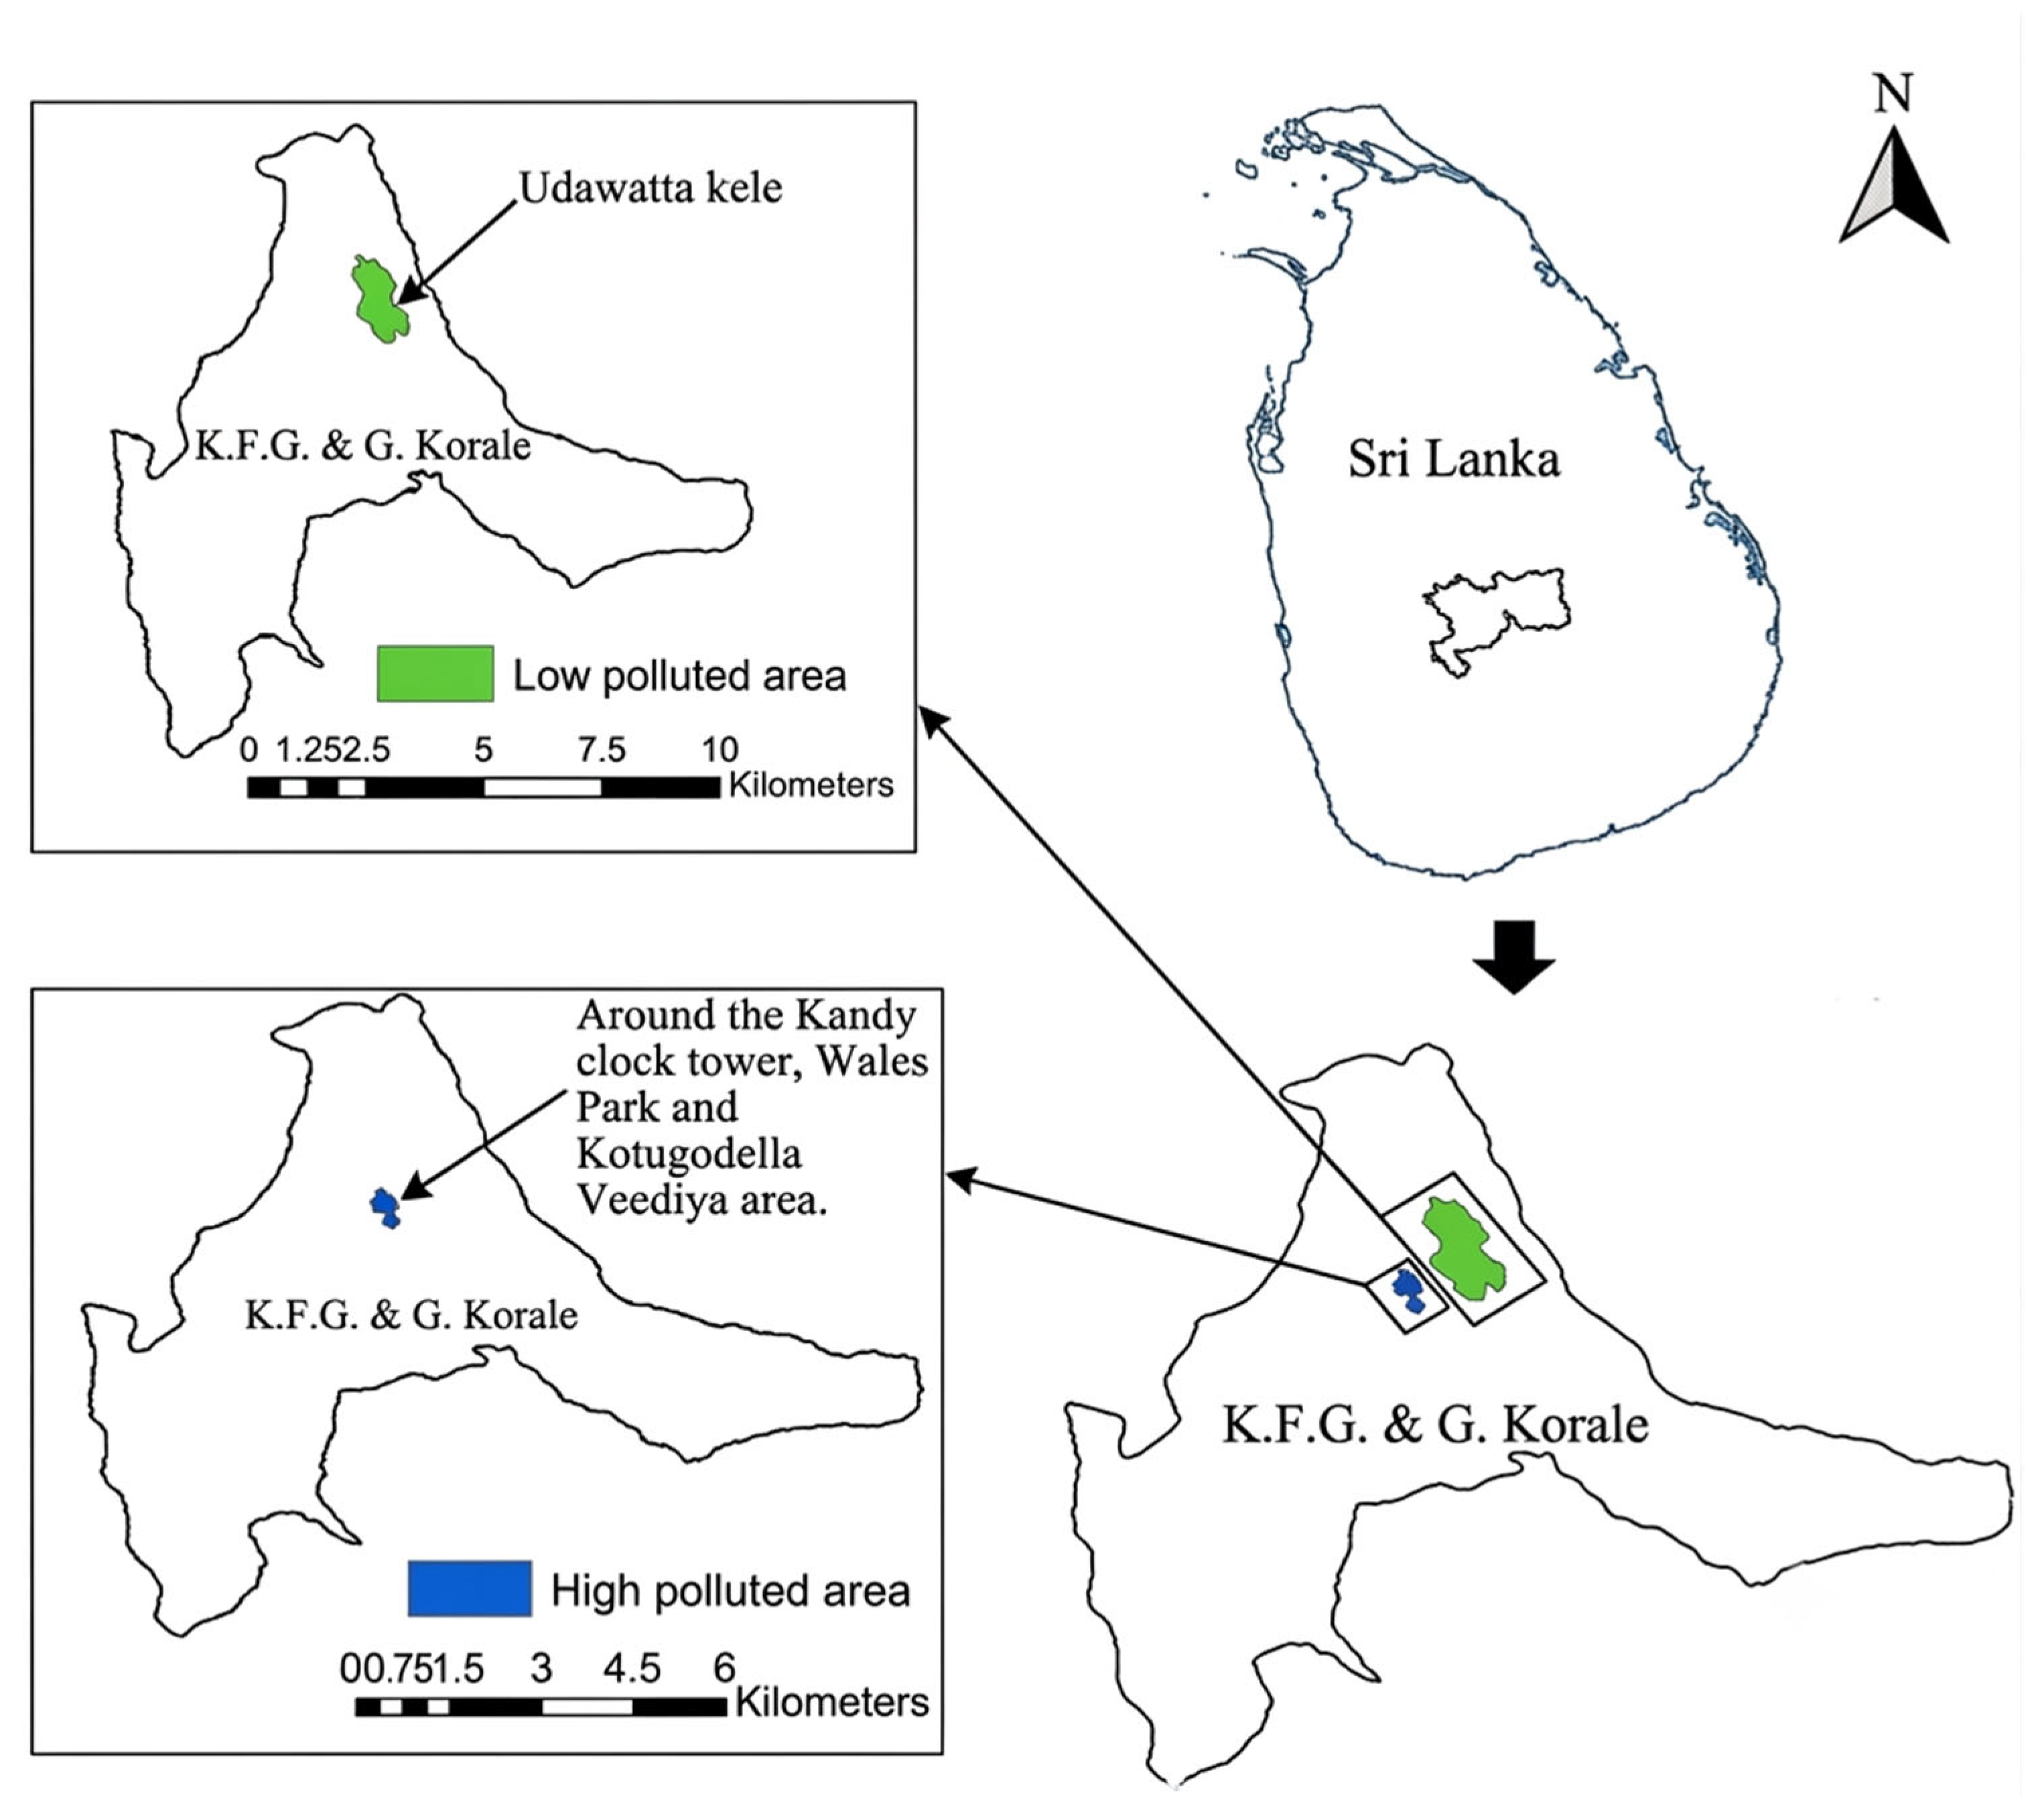
According to the distribution of air pollutants, Udawatta Kale sanctuary (7.298878° N and 80.642403° E) was identified as the least polluted site of Kandy city. The Kandy clock tower (7.293186° N, 80.634762° E), Wales Park (7.290271° N, 80.637374° E), and Kotugodella Road (7.293233° N, 80.636010° E) were identified as the most polluted sites of the area. These sites are shown in Figure 2.
Figure 2.
The Map of Low-Pollution and High-Pollution Sites in Kandy, Sri Lanka.
2.2. Field Sampling
Based on a preliminary field survey, five commonly occurring tree species within urban parks—Pongamia pinnata, Terminalia catappa, Madhuca longifolia, Cassia fistula, and Tabebuia rosea—were selected for investigation due to their widespread presence in both high-pollution (HP) and low-pollution (LP) zones of Kandy City. For biochemical analysis, ten individual trees of each species were initially identified, and the geographic coordinates of each tree were recorded using a Global Positioning System (GPS). All selected trees were within a comparable age class of approximately 10–15 years.
From the identified individuals, five trees per species were chosen for leaf sampling using a random selection approach. For each selected tree, fifteen fully expanded and healthy and undamaged leaves were collected, comprising five leaves each from the upper, middle, and lower canopy layers to account for vertical variation. Sampling was conducted from all directions of the canopy to minimize directional bias, and both sun-exposed and shaded leaves were proportionally included. All sampled trees had comparable diameter at breast height (DBH) to ensure consistency. Leaf collection was carried out during the early morning hours (06:00–08:00 h) to minimize diurnal variation in biochemical properties. Sampling was performed during the dry season, selected to represent stable environmental conditions with minimal rain. The collected leaves were immediately sealed in polyethylene bags and transported to the laboratory. Fresh leaf weight was measured upon arrival, after which the samples were refrigerated until further biochemical analyses were performed.
2.3. Estimation of APTI
2.3.1. Measurement of AA Content
Ascorbic acid (AA) concentration was determined using a spectrophotometric technique. Approximately 1 g of fresh leaf tissue was transferred into a test tube and treated with 1 mL of orthophosphoric acid (India), 1 mL of 5% (v/v) sulfuric acid (India), and 4 mL of an oxalic acid–EDTA extraction mixture (India). Subsequently, 2 mL of 5% (m/v) ammonium molybdate (India) and 3 mL of distilled water were added to the extract. The reaction mixture was allowed to incubate at room temperature for 15 min to facilitate color development. Absorbance was then recorded at a wavelength of 760 nm using a spectrophotometer (Orion AquaMate 8000 UV-Vis Spectrophotometer, ThermoFisher Scientific, Shanghai, China), and AA content was quantified by comparison with a standard calibration curve [3,17,18,19].
2.3.2. Estimation of Total Chlorophyll
Three grams of fresh leaves was blended and extracted with 10 mL of 80% acetone (India) and the extract was allowed to settle for 15 min. The liquid portion was decanted into another test tube and was centrifuged (Sorvall ST 16R, ThermoFisher Scientific, Braunschweig, Germany) for three minutes at 2500 rpm for further separation. The absorbance of the supernatant was measured at 645 and 663 nm using a UV spectrophotometer. Calculations were performed using Equations (1)–(3) to estimate the Total Chlorophyll content [20,21,22].
Chlorophyll a = 12.7 D663 − 2.69 D645 × V/1000 W mg g−1
Chlorophyll b = 22.9 D645 − 4.68 D663 × V/1000 W mg g−1
Total Chlorophyll = Chlorophyll a + Chlorophyll b mg g−1
Dx = Absorbance of the extract at the wavelength X nm
V = Total volume of the chlorophyll solution (mL)
W = weight of the tissue extract (g)
2.3.3. Measurement of Leaf Extract pH
A leaf sample of 0.5 g was crushed and homogenized in 50 mL of deionized water. The mixture was centrifuged, and the supernatant was collected for the detection of pH using a pH meter [23,24].
2.3.4. Measurement of Relative Water Content (RWC)
Fresh leaves were weighed soon after picking and then immersed in water overnight, blotted dry, and weighed again to get the turgid weight (TW) [18]. The leaves were kept in an oven at 70 °C to dry overnight and reweighed to obtain the dry weight. RWC was calculated with Equation (4) [25,26].
RWC = (FW − DW)/(TW − DW) ∗ 100
RWC = Relative water content (%)
FW = Fresh weight (g)
DW = Dry weight (g)
TW = Turgid weight (g)
2.3.5. Calculation of the APTI
AA content, leaf extract pH, RWC and total chlorophyll content were used in Equation (5) as suggested by [9] for the calculation of APTI [27,28].
APTI = A (T + P) + R/10
A = Ascorbic acid content (mg g−1)
T = Total chlorophyll content (mg g−1)
P = pH of leaf extract
R = Relative water content (%)
2.3.6. Gradation of APTI
The APTI values of each tree species were categorized into different tolerance levels using the criteria established by the previous workers [3,29,30]. This categorization was based on a comparison of each tree species’ APTI value with the mean APTI value of all tree species studied at a particular site, added to the standard deviation (SD) value. The classification system is presented in Table 1.
Table 1.
Gradation of APTI Values in Tree Species into Distinct Tolerance Levels.
2.3.7. Statistical Analysis
The Anderson–Darling test was applied to confirm whether the data are normally distributed or not. Two-factor factorial Analysis of Variance (ANOVA) followed by Turkey’s pairwise mean comparison was performed using the R statistical package (R 4.1.3) to determine whether there is a significant difference in multiple criteria values between five selected urban park tree species in the least and most polluted sites separately. Linear regression was carried out to observe the relationship between individual variables and APTI. All graphical illustrations and linear regression were conducted using the Minitab (20) statistical package.
Although the Air Pollution Tolerance Index is widely used, it may not fully capture the complexity of plant responses to air pollution. Future studies should incorporate additional physiological and biochemical indicators, such as gas exchange and antioxidant activity, for a more comprehensive assessment, particularly in Kandy.
3. Results and Discussion
3.1. Leaf Ascorbic Acid Content
Ascorbic acid (AA) is a low-molecular-weight, non-enzymatic antioxidant that plays a critical role in plant defense mechanisms under stress conditions. Its concentration can increase in response to environmental stress, where it functions to neutralize reactive oxygen species (ROS) generated during adverse conditions [31].
The AA concentrations measured in the leaves of the selected tree species at high-pollution (HP) and low-pollution (LP) sites are summarized in Table 2. Because the formal two-way evaluation revealed a highly significant interaction between regional air pollution conditions and tree species variations on leaf traits, a rigorous post-hoc comparison was conducted explicitly within each species row. Distinct lowercase superscript letters are used across the column treatments to show significant direct differences between the highly polluted and minimally polluted environments. At the LP site, mean AA content ranged from 3.27 ± 0.21 to 22.45 ± 4.14 mg g−1, whereas values at the HP site varied between 3.05 ± 1.54 and 15.97 ± 5.82 mg g−1. Among the studied species, Madhuca longifolia exhibited the highest AA levels at both sites (LP: 22.45 ± 4.14 mg g−1; HP: 15.97 ± 5.82 mg g−1), while Pongamia pinnata recorded the lowest concentrations under both environmental conditions (LP: 3.27 ± 0.21 mg g−1; HP: 3.05 ± 1.54 mg g−1).
Table 2.
Ascorbic Acid Content (mg/g), Relative Water Content (%), Total Chlorophyll (mg/g), Leaf extracted pH, Air Pollution Tolerance Index of Plants in Low-pollution (LP) and High-pollution (HP) sites.
All species showed reduced ascorbic acid (AA) content at the high-pollution (HP) site compared to the low-pollution (LP) site. Although AA typically increases under stress, the decline suggests that prolonged pollution exposure may have exceeded the plants’ antioxidant capacity, leading to AA depletion under sustained oxidative stress. Variations in the magnitude of reduction among species indicate differences in their ability to cope with pollution, reflecting both exposure intensity and species-specific antioxidant efficiency.
3.2. Relative Water Content
The relative water content (RWC) of the selected tree species at the LP site ranged from 69.21 ± 6.47% to 90.14 ± 3.18%, whereas values recorded at the high-pollution (HP) site varied between 64.02 ± 2.60% and 88.63 ± 7.09%. Across all species, RWC was consistently lower at HP locations than at LP locations. Madhuca longifolia exhibited the highest mean RWC at both sites, with values of 90.14 ± 3.18% at the LP site and 88.63 ± 7.09% at the HP site. In contrast, Terminalia catappa recorded the lowest RWC, decreasing from 69.21 ± 6.47% at the LP site to 64.02 ± 2.60% under HP conditions.
RWC represents the amount of water retained in leaf tissue relative to its maximum turgidity and is a key indicator of plant water status. Maintaining high RWC is essential for physiological stability, particularly under environmental stressors such as air pollution, which can alter transpiration dynamics [32]. Moreover, RWC is widely used as a proxy for drought tolerance in plants [33]. Exposure to atmospheric pollutants can disrupt normal leaf water relations by impairing transpiration processes and damaging the vascular system responsible for water transport from roots to leaves. These impacts limit the uptake of essential nutrients and compromise leaf temperature regulation. Consequently, the observed reduction in RWC under polluted conditions is largely attributed to pollutant-induced disturbances in leaf transpiration and water balance [34].
3.3. Total Chlorophyll Content
In the present study, the total chlorophyll content of trees at the low-pollution (LP) site averaged approximately 0.32 ± 0.00. At the high-pollution (HP) site, all species exhibited lower chlorophyll concentrations compared to their LP counterparts. Among the sampled species, Tabebuia rosea recorded the highest total chlorophyll content (0.31 ± 0.00), followed by Madhuca longifolia and Cassia fistula (≈0.30 ± 0.01), Pongamia pinnata (0.27 ± 0.01), and Terminalia catappa (0.23 ± 0.06) (Table 2).
Chlorophyll content is a key indicator of a plant’s photosynthetic capacity and overall potential for biomass accumulation [35]. Variations in chlorophyll levels are influenced by species-specific traits, leaf age, and exposure to environmental stressors, including air pollutants. While certain pollutants may stimulate chlorophyll synthesis, many others reduce chlorophyll content, thereby impairing photosynthetic efficiency and plant growth [36]. These findings suggest that the observed decrease in chlorophyll at HP sites reflects the adverse impact of air pollution on the photosynthetic machinery of urban park trees.
3.4. Leaf Extract pH
Leaf extract pH is an important determinant of plant sensitivity to air pollution. Acidic gaseous pollutants, such as NO2, CO2, and SO2, can diffuse into the cell sap and generate acidic radicals, leading to a decrease in pH. Conversely, higher (alkaline) pH conditions enhance ascorbic acid (AA) activity, thereby increasing the plant’s capacity to tolerate air pollution, whereas lower pH levels can impede the conversion of hexose sugars to AA [37]. Previous studies have also shown a strong relationship between leaf pH and photosynthetic efficiency, as reduced pH can negatively influence stomatal sensitivity to pollutants, while higher pH values support improved resistance to air pollution [3]. In the current study, leaf extract pH at the low-pollution (LP) site ranged from 5.75 ± 0.13 to 7.03 ± 0.02, whereas values at the high-pollution (HP) site varied between 4.73 ± 0.97 and 6.75 ± 0.08. Among the examined species, Tabebuia rosea consistently exhibited the highest pH values at both sites. In contrast, Terminalia catappa recorded the lowest pH at the LP site, and Madhuca longifolia showed the lowest pH at the HP site.
3.5. APTI
Table 3 shows the APTI values of urban park tree species in tropical urban settings.
Table 3.
APTI Values of Urban Park Tree Species in Tropical Urban Settings.
A higher Air Pollution Tolerance Index (APTI) reflects a greater capacity of plant species to tolerate atmospheric contaminants [24]. In urban park trees at the low-pollution (LP) site in Kandy city, APTI values ranged from 10.35 ± 0.53 to 25.17 ± 2.96. In contrast, trees growing at the high-pollution (HP) site exhibited lower APTI values, varying between 9.46 ± 1.14 and 17.06 ± 4.53. For all five investigated species, APTI values were consistently reduced at the HP site compared with the LP site. This decline can be attributed to reductions in all biochemical parameters incorporated into the APTI calculation under higher pollution conditions.
The results of the present study are broadly consistent with previous findings reported in the literature [3,27,28,29]. In agreement with [3], Madhuca longifolia exhibited comparable APTI values at the LP (control) site. However, at the HP site, the APTI values obtained in this study were slightly lower than those reported for other urban settings. For instance, Ref. [3] documented an APTI value of 19.26 for Madhuca longifolia in Colombo city, whereas the corresponding value recorded in the urban area of Kandy was 17.06, suggesting a reduced tolerance to air pollution in Kandy relative to Colombo.
Furthermore, Ref. [30] reported a pronounced difference in APTI values between polluted and control sites for Pongamia pinnata in Bengaluru city. Although a statistically significant difference between HP and LP sites was also observed in the present study, the magnitude of this difference was comparatively smaller. This observation suggests that air pollution levels in Kandy city may be lower than those reported for Bengaluru, India. In Lucknow, India, Ref. [26] reported higher APTI values for Cassia fistula at polluted sites, whereas the present study observed lower values at the HP site. This contrasting trend indicates that APTI responses are context-dependent and may vary due to differences in pollutant composition, climatic conditions, and species-specific characteristics.
The (ANOVA) results presented in Table 4 revealed highly significant effects (P < 2.2 × 10⁻¹⁶) of both pollution level (factor A) and tree species (factor B) on all biochemical parameters and APTI values. The interaction between pollution level and species was also significant for all parameters except relative water content (RWC). Mean comparison analysis indicated that LP sites exhibited significantly higher biochemical parameter values and APTI scores than HP sites, highlighting the influence of air pollution on plant physiological responses. Among the studied species, Madhuca longifolia demonstrated significantly higher APTI values and ascorbic acid content compared to the other tree species. This study only evaluates the physiological pollution tolerance of tree species via APTI and did not measure their actual accumulation/absorption capacity for atmospheric pollutants; future studies should combine APTI with pollutant accumulation capacity to screen for species that possess both high tolerance and high remediation capabilities.
Table 4.
Assessment of APTI of Selected Tree Species at the Low-Pollution (LP) and High-Pollution Sites.
3.6. Variation of APTI with Biochemical Parameters
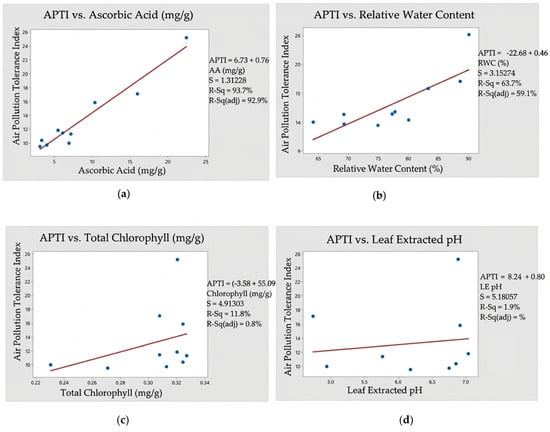
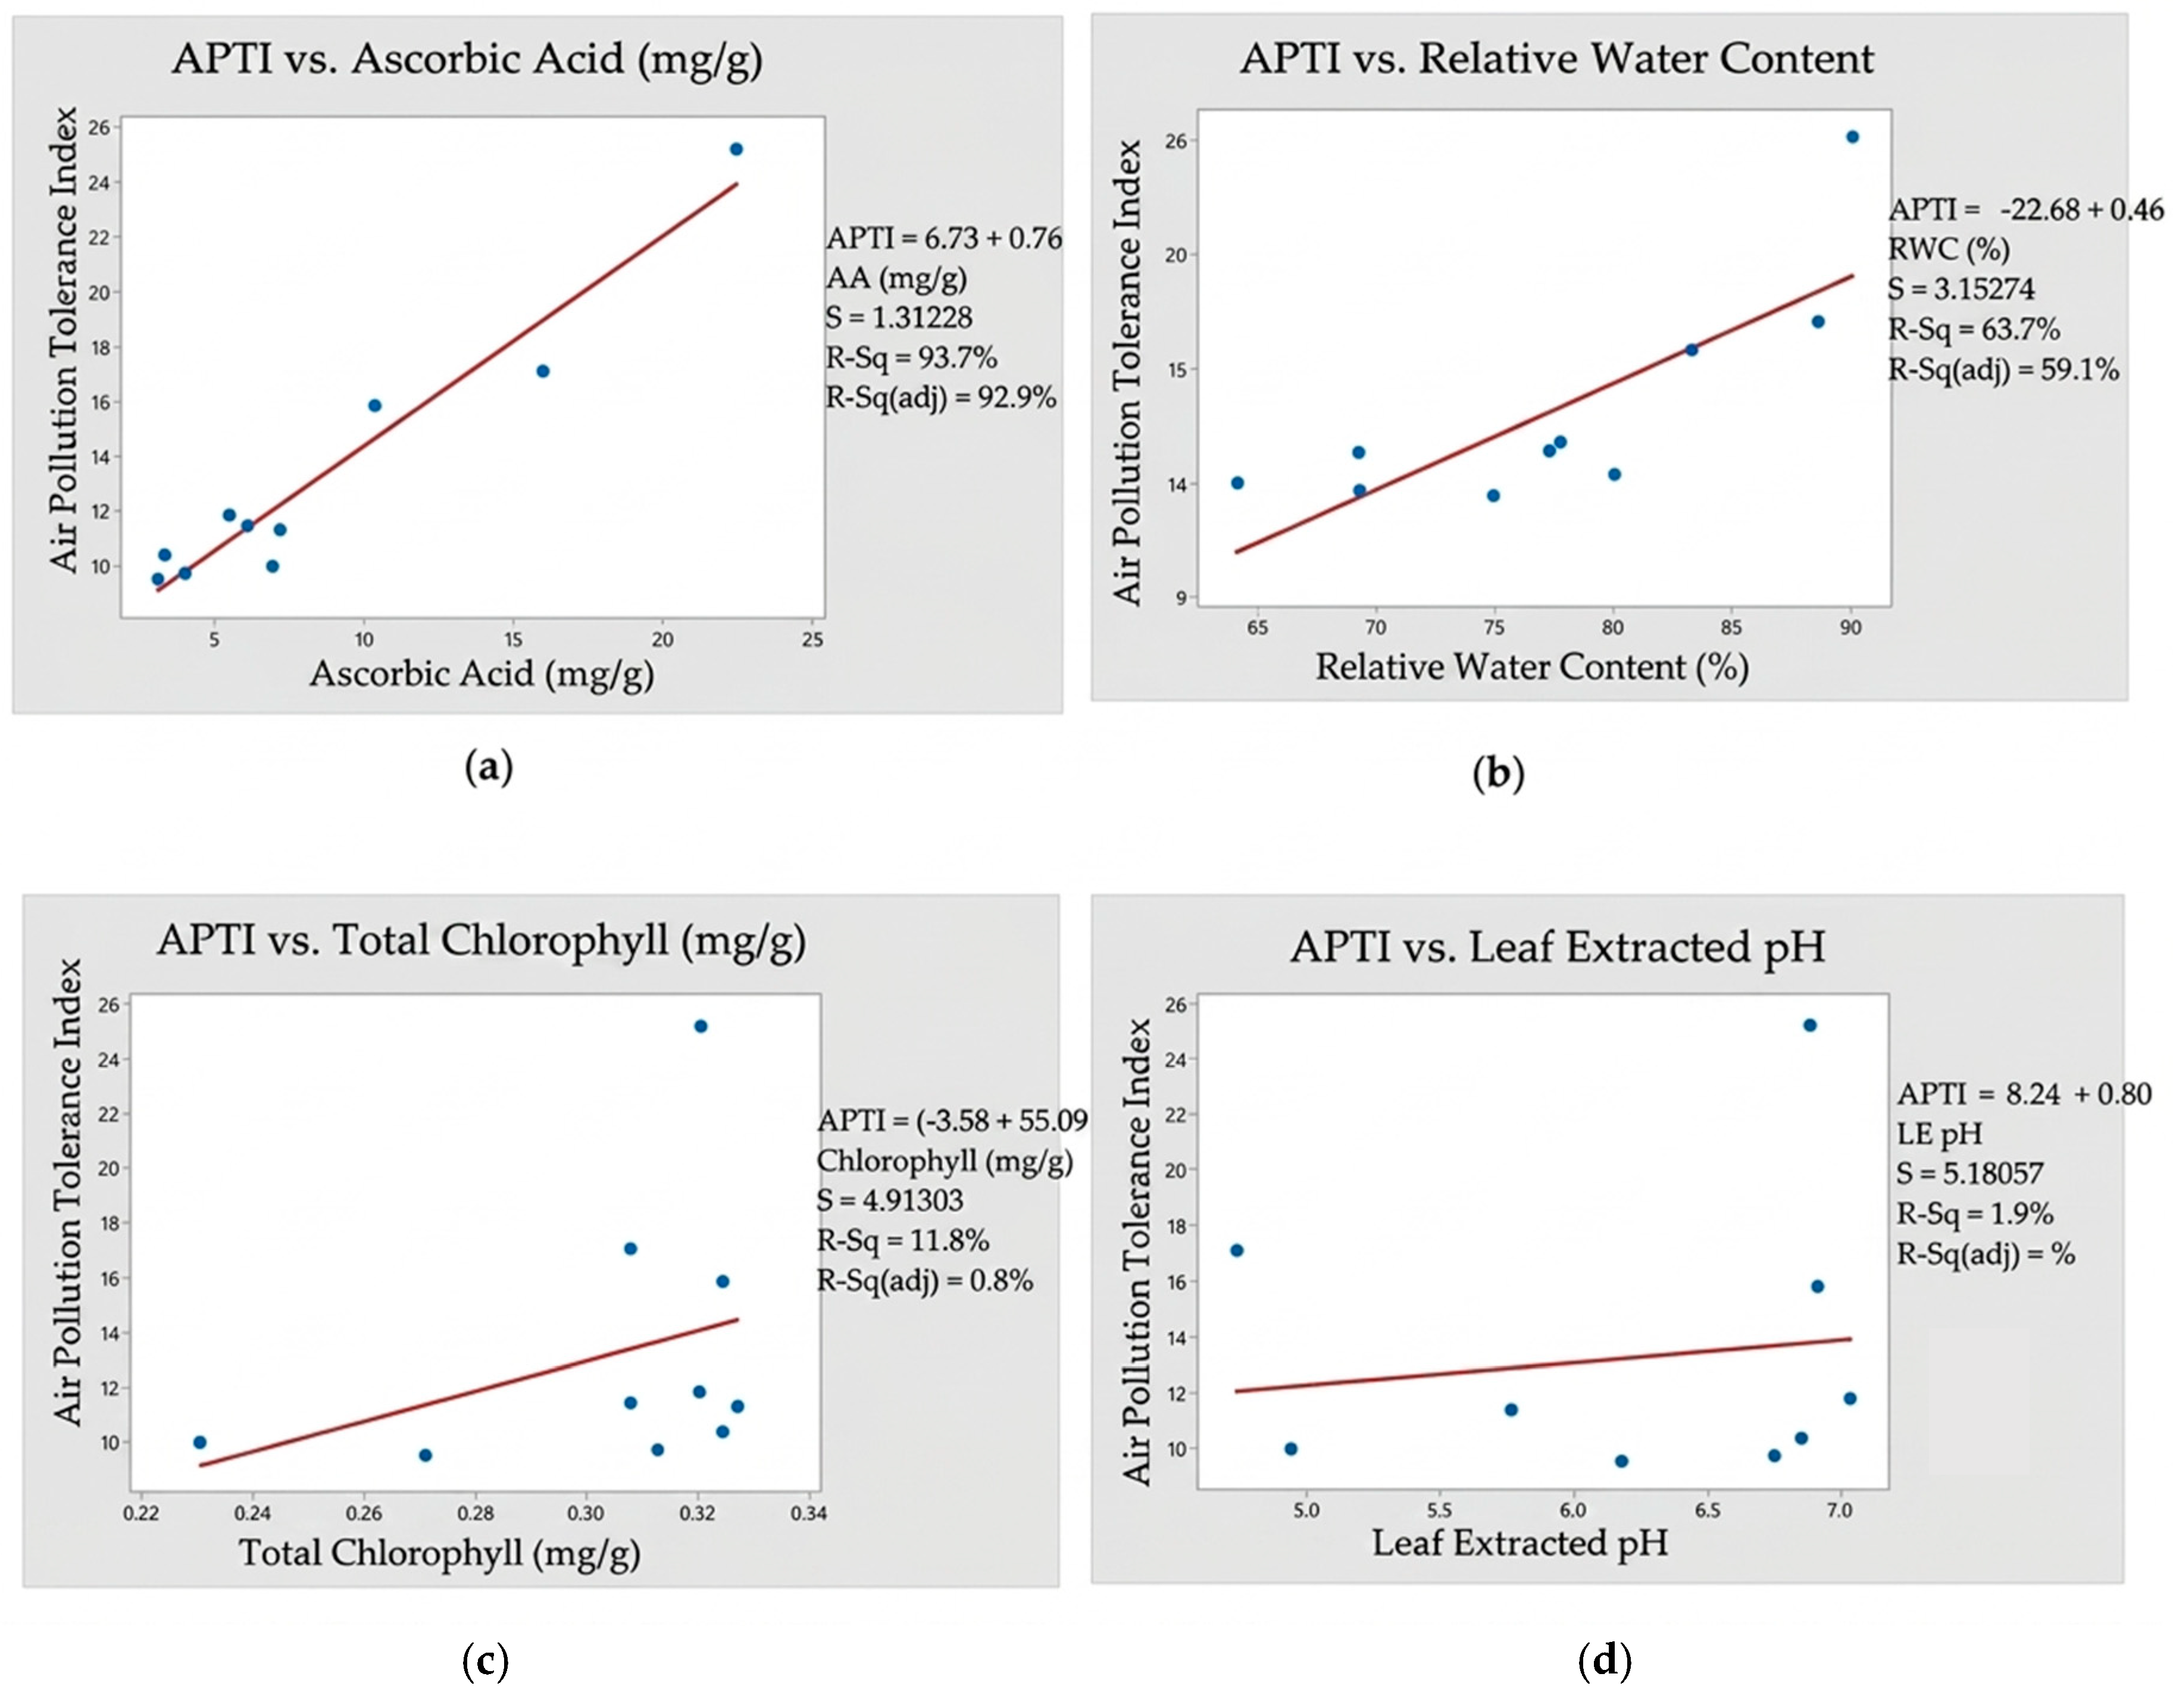
Figure 3 illustrates the linear regression relationships between APTI and individual biochemical parameters. The strength of each relationship was evaluated using the coefficient of determination (R2), which reflects the goodness of fit between APTI and the respective biochemical variables. Weak-to-moderate associations were observed between APTI and leaf pH (R2 = 0.19), relative water content (RWC; R2 = 0.63), and total chlorophyll content (R2 = 0.118), indicating a limited predictive capacity of these parameters for APTI.
Figure 3.
Variation of APTI with (a) AA (mg/g), (b) RWC (%), (c) Total Chlorophyll Content (mg/g) and (d) Leaf Extracted pH.
In contrast, a very strong positive relationship was identified between leaf ascorbic acid (AA) concentration and APTI (R2 = 0.93), demonstrating that AA makes a substantial contribution to air pollution tolerance in plants. This strong association highlights the critical role of ascorbic acid in enhancing the physiological resilience of plant leaves against air pollutant stress.
3.7. Gradation of APTI
APTI gradation results are presented in Table 5. The mean APTI at the high-pollution (HP) site was 11.51 ± 1.91, while a higher mean value of 14.88 ± 1.19 was recorded at the low-pollution (LP) site. Madhuca longifolia exhibited APTI values above the tolerance threshold at both sites and was classified as tolerant. Terminalia catappa, Cassia fistula, and Tabebuia rosea were categorized as intermediate at the HP site, with APTI values between the mean minus standard deviation and the mean APTI. Pongamia pinnata was classified as sensitive at both sites. The tolerance classification of Terminalia catappa, Cassia fistula, and Tabebuia rosea differed between the LP and HP sites.
Table 5.
Tree Species Gradation into Distinct Tolerance Levels based on APTI Value.
3.8. Study Limitations
This study is based on a single cross-sectional survey without seasonal dynamic monitoring (e.g., dry vs. wet seasons); therefore, it cannot capture the temporal variation in tree species’ pollution tolerance under tropical climatic conditions. This restricted observational term introduces seasonal uncertainties, as biochemical parameters fluctuate under shifting precipitation and temperature regimes. Additionally, the study evaluated only five park tree species and did not include other commonly used urban greening species in Kandy City, which limits the generalizability of the findings across wider municipal zones. This narrow species screening circumvents a comprehensive municipal mapping of native and exotic urban flora that might offer different tolerance profiles.
Furthermore, an important instrumental and monitoring limitation stems from the reliance on a single portable air quality monitoring device for localized site field validations. While this approach provides valuable real-time local checks, a single unit prevents simultaneous large-scale continuous tracking across multiple distant coordinates. Consequently, the field data collection relied on a sequential measurement routine, which can introduce minor variances from localized traffic spikes or fleeting macro-climatic shifts. This instrumental constraint influenced the precise selection of tree sampling points, requiring them to be concentrated around key accessible urban park pockets.
Therefore, these specific sampling coordinates cannot represent a complete geographical landscape mapping of the region, but rather represent designated high- and low-pollution micro-environments. To ensure validity, the initial and primary site classification was anchored strictly to macroscopic distribution maps from the National Building Research Organization (NBRO). However, readers must account for the spatial limitations of sequential portable testing when interpreting location-dependent species performance or overall urban pollution adaptation thresholds. This instrumentation context defines the scope of our findings and should be expanded in future work using continuous multi-station stationary arrays.
Finally, a core structural limitation resides in the mathematical equation establishment of the APTI itself. The generic formula assigns fixed arithmetic weightings to pH, ascorbic acid, relative water content, and total chlorophyll without accounting for species-specific anatomical adaptations—such as trichome density or stomatal structural variances—which can alter actual pollutant absorption rates independently of leaf biochemistry.
Future research should incorporate multi-seasonal or long-term monitoring to assess temporal dynamics in pollution tolerance. Expanding the range of species studied, including a broader diversity of urban trees, and integrating additional physiological and biochemical indicators would provide a more comprehensive evaluation of species suitability for urban air pollution mitigation [38,39,40,41,42,43].
4. Conclusions
This study provides a comprehensive evaluation of the air pollution tolerance of five urban park tree species (Madhuca longifolia, Cassia fistula, Terminalia catappa, Tabebuia rosea, and Pongamia pinnata) across contrasting pollution gradients in Kandy City. Our collective findings demonstrate that elevated ambient urban air pollution significantly modifies plant leaf biochemistry, causing a synchronized reduction in leaf extract pH, ascorbic acid content, relative water content, and total chlorophyll content at the high-pollution site. When integrated into the Air Pollution Tolerance Index (APTI), these changes culminated in an overall reduction in tolerance scores across all investigated species under elevated environmental stress, moving mean APTI values down from 14.88 at the low-pollution site to 11.51 at the high-pollution site.
The empirical interpretations established herein belong strictly to the authors of this study based on the direct evidence gathered. Madhuca longifolia maintained the highest biochemical index stability and highest absolute APTI values (25.17 LP/17.06 HP) across both monitored environments, indicating high physiological resilience and proving its capability to sustain structural cell integrity under sustained oxidative stress. Based on these findings, Madhuca longifolia is recommended as a highly suitable candidate for urban forestry programs, green belts, and landscape design intended to maximize ambient resilience in congested tropical settings like Kandy City. Similarly, Cassia fistula demonstrated robust adaptive potential, making it a viable secondary option for urban greening.
Conversely, Pongamia pinnata demonstrated high sensitivity to air quality degradation, indicating its potential utility as a localized biological indicator for air pollution monitoring. These findings provide an empirical selection matrix for urban planning, enabling the strategic use of tolerant or sensitive tree species based on verified physiological tolerance traits. Collectively, these outcomes establish a clear, data-driven framework for urban planning, enabling developers to strategically deploy tolerant species for environmental remediation and sensitive species for bio-monitoring without relying on external literature assumptions.
Author Contributions
Conceptualization, N.L.U.; methodology, N.L.U. and N.D.S.; formal analysis, N.L.U.; investigation, N.W.; resources, N.L.U. and N.D.S.; data curation, N.D.S.; writing—original draft preparation, N.W. and N.L.U.; writing—review and editing, N.L.U.; visualization, N.D.S.; supervision, N.L.U. and N.D.S. All authors have read and agreed to the published version of the manuscript.
Funding
This research received no external funding.
Data Availability Statement
The original contributions presented in this study are included in the article. Further inquiries can be directed to the corresponding author.
Conflicts of Interest
The authors declare no conflicts of interest.
Abbreviations
The following abbreviations are used in this manuscript:
| APTI | Air Pollution Tolerance Index |
| NBRO | National Building Research Organization |
| GPS | Global Positioning System |
| DBH | Diameter at Breast Height |
| HP | High Pollution |
| LP | Low Pollution |
| RWC | Relative Water Content |
| ANOVA | Analysis of Variance |
| SD | Standard Deviation |
| AA | Ascorbic Acid |
References
- NBRO (National Building Research Organization). Air Quality Level in Sri Lanka; National Building Research Organisation: Colombo, Sri Lanka, 2016. Available online: https://www.nbro.gov.lk/index.php?option=com_content&view=article&id=85&Itemid=378&lang=en&lang=en#research-outcomes (accessed on 23 March 2023).
- Bala, N.; Pakade, Y.B.; Katnoria, J.K. Assessment of air pollution tolerance index and anticipated performance index of a few local plant species available at the roadside for mitigation of air pollution and green belt development. Air Qual. Atmos. Health 2022, 15, 2269–2281. [Google Scholar] [CrossRef] [Scilit]
- Enitan, I.T.; Durowoju, O.S.; Edokpayi, J.N.; Odiyo, J.O. A review of air pollution mitigation approach using air pollution tolerance index (APTI) and anticipated performance index (API). Atmosphere 2022, 13, 374. [Google Scholar] [CrossRef] [Scilit]
- Anju, P.S.; Jaya, D.S. Air Pollution Tolerance Index Assessment of Quisqualis indica Linn in Pollution Prone Areas of Thiruvananthapuram District in Kerala State, India. World J. Environ. Biosci. 2014, 3, 116–120. [Google Scholar]
- Bandara, W.A.R.T.W.; Dissanayake, C.T.M. Most tolerant roadside tree species for urban settings in humid tropics based on Air Pollution Tolerance Index. Urban Clim. 2021, 37, 100848. [Google Scholar] [CrossRef] [Scilit]
- Durani, A.; Durrani, H. Assessment of air pollution tolerance index and anticipated performance index of common roadsides trees. Int. J. Multidiscip. Res. Dev. 2018, 5, 45–54. [Google Scholar]
- Joshi, P.; Swami, A. Air pollution induced changes in the photosynthetic pigments of selected plant species. J. Environ. Biol. Acad. Environ. Biol. 2009, 30, 295–298. [Google Scholar]
- Molnár, E.V.; Simon, E.; Tóthmérész, B.; Ninsawat, S.; Szabó, S. Air pollution induced vegetation stress—The Air Pollution Tolerance Index as a quick tool for city health evaluation. Ecol. Indic. 2020, 113, 106234. [Google Scholar] [CrossRef] [Scilit]
- Olszyk, D.M.; Tibbitts, T.W. Stomatal response and leaf injury of Pisum sativum L. with SO2 and O3 exposures. Plant Physiol. 1981, 67, 539–544. [Google Scholar] [CrossRef] [Scilit] [PubMed]
- Malav, L.C.; Kumar, S.; Islam, S.; Chaudhary, P.; Khan, S.A. Assessing the environmental impact of air pollution on crops by monitoring air pollution tolerance index (APTI) and anticipated performance index (API). Environ. Sci. Pollut. Res. 2022, 29, 50427–50442. [Google Scholar] [CrossRef] [Scilit] [PubMed]
- Singh, S.K.; Rao, D.N. Evaluation of plants for their tolerance to air pollution. In Proceedings of Symposium on Air Pollution Control; Indian Association for Air Pollution Control: Greater Noida, India, 1983; pp. 218–224. [Google Scholar]
- Tanee, F.B.G.; Albert, E. Air pollution tolerance indices of plants growing around Umuebulu Gas Flare Station in Rivers State, Nigeria. Afr. J. Environ. Sci. Technol. 2013, 7, 1–8. [Google Scholar]
- Nasrullah, N.; Tatsumoto, H.; Misawa, A. Effect of roadside planting and road structure on NO2 concentration near road. Jpn. J. Toxicol. Environ. Health 1994, 40, 328–337. [Google Scholar] [CrossRef] [Scilit]
- Das, M.; Das, M.; Mukherjee, A. Air pollution tolerance index (APTI) used for assessing air quality to alleviate climate change: A review. Res. J. Pharm. Biol. Chem. Sci. 2018, 9, 45–54. [Google Scholar]
- Govindaraju, M. Air Pollution Tolerance Index of Plants Living in High Traffic Areas of Tiruchirappalli City. Indian J. Nat. Sci. 2022, 13, 48161–48168. [Google Scholar] [CrossRef] [Scilit] [PubMed]
- Seneviratne, S.; Handagiripathira, L.; Sanjeevani, S.; Madusha, D.; Waduge, V.A.A.; Attanayake, T.; Bandara, D.; Hopke, P.K. Identification of sources of fine particulate matter in Kandy, Sri Lanka. Aerosol Air Qual. Res. 2017, 17, 476–484. [Google Scholar] [CrossRef] [Scilit]
- Rai, P.K.; Panda, L.L.S. Dust capturing potential and air pollution tolerance index (APTI) of some road side tree vegetation in Aizawl, Mizoram, India: An Indo-Burma hot spot region. Air Qual. Atmos. Health 2014, 7, 93–101. [Google Scholar]
- Rai, P.K.; Panda, L.L.S.; Chutia, B.M.; Singh, M.M. Comparative assessment of air pollution tolerance index (APTI) in the industrial (Rourkela) and non industrial area (Aizawl) of India: An eco-management approach. Afr. J. Environ. Sci. Technol. 2013, 7, 944–948. [Google Scholar] [CrossRef] [Scilit]
- Davey, M.W.; Montagu, M.V.; Inze, D.; Sanmartin, M.; Kanellis, A.; Smirnoff, N.; Benzie, I.J.J.; Strain, J.J.; Favell, D.; Fletcher, J. Plant L-ascorbic acid: Chemistry, function, metabolism, bioavailability and effects of processing. J. Sci. Food Agric. 2000, 80, 825–860. [Google Scholar] [CrossRef]
- Bajaj, K.L.; Kaur, G. Spectrophotometric determination of l-ascorbic acid in vegetables and fruits. Analyst 1981, 106, 117–120. [Google Scholar] [CrossRef] [Scilit] [PubMed]
- Tak, A.A.; Kakde, U.B. Evaluation of air pollution tolerance and performance index of plants growing in industrial areas. Int. J. Ecol. Environ. Sci. 2020, 2, 1–5. [Google Scholar] [CrossRef] [Scilit]
- Smirnoff, N.; Wheeler, G.L. Ascorbic acid in plants: Biosynthesis and function. Crit. Rev. Plant Sci. 2000, 19, 267–290. [Google Scholar] [CrossRef]
- Anake, W.U.; Bayode, F.O.; Omonhinmin, C.A.; Williams, A.B. Ambient air pollution control using air pollution tolerance index and anticipated performance index of trees. Int. J. Civ. Eng. Technol. 2018, 9, 417–425. [Google Scholar]
- Chen, J.; Liu, S.; Hou, Y.; Luo, Y.; Han, W. Determination of leaf pH without grinding the sample: Is it closer to the reality? Forests 2022, 13, 1640. [Google Scholar] [CrossRef] [Scilit]
- Tsega, Y.; Prasad, A.G.D. Variation in air pollution tolerance index and anticipated performance index of roadside plants in Mysore, India. J. Environ. Biol. 2014, 35, 185–190. [Google Scholar]
- Al-Obaidy, W.A.; Rabee, A.M. Calculation the air pollution tolerance index of eucalyptus plant in Baghdad city. Int. J. Adv. Biol. Res. 2018, 8, 250–254. [Google Scholar] [CrossRef] [Scilit]
- Kumar, A.; Alezono; Nandini, N. Comparative Assessment of Air Pollution Tolerance Index of selected Tree Species of Bengaluru, India. Int. J. Sci. Res. Multidiscip. Stud. 2018, 4, 25–29. [Google Scholar]
- Liu, Y.J.; Ding, H. Variation in air pollution tolerance index of plants near a steel factory: Implications for landscape-plant species selection for industrial areas. WSEAS Trans. Environ. Dev. 2008, 4, 24–32. [Google Scholar]
- Banerjee, S.; Palit, D.; Banerjee, A. Variation of tree biochemical and physiological characters under different air pollution stresses. Environ. Sci. Pollut. Res. 2021, 28, 17960–17980. [Google Scholar] [CrossRef] [Scilit] [PubMed]
- Pillai, P. Evaluating Air Pollution Tolerance Index (APTI) of Some Plants Species in Bengaluru City. Adv. Zool. Bot. 2023, 11, 139–149. [Google Scholar] [CrossRef] [Scilit]
- Lohe, R.N.; Tyagi, B.; Singh, V.; Kumar Tyagi, P.; Khanna, D.R.; Bhutiani, R. A comparative study for air pollution tolerance index of some terrestrial plant species. Glob. J. Environ. Sci. Manag. 2015, 1, 315–324. [Google Scholar]
- Nwaogwugwu, C.J.; Nosiri, C.; Uhegbu, F.O.; Okereke, S.C.; Atasie, O.C. Air Pollution Tolerance Index of some selected medicinal plants around oil- producing Community of Asah, Abia State, Nigeria. Int. J. Sci. Eng. Res. 2022, 8, 747–754. [Google Scholar]
- Kaur, M.; Nagpal, A.K. Evaluation of air pollution tolerance index and anticipated performance index of plants and their application in development of green space along the urban areas. Environ. Sci. Pollut. Res. 2017, 24, 18881–18895. [Google Scholar] [CrossRef] [Scilit] [PubMed]
- Nawaz, R.; Aslam, M.; Nasim, I.; Irshad, M.A.; Ahmad, S.; Latif, M.; Hussain, F. Air Pollution Tolerance Index and Heavy Metals Accumulation of Tree Species for Sustainable Environmental Management in Megacity of Lahore. Air 2023, 1, 55–68. [Google Scholar]
- Bharti, S.K.; Trivedi, A.; Kumar, N. Air pollution tolerance index of plants growing near an industrial site. Urban Clim. 2018, 24, 820–829. [Google Scholar] [CrossRef] [Scilit]
- Gitelson, A.A.; Gritz, Y.; Merzlyak, M.N. Relationships between leaf chlorophyll content and spectral reflectance and algorithms for non-destructive chlorophyll assessment in higher plant leaves. J. Plant Physiol. 2003, 160, 271–282. [Google Scholar] [CrossRef] [Scilit] [PubMed]
- Khaleghi, E.; Arzani, K.; Moallemi, N.; Barzegar, M. Evaluation of chlorophyll content and chlorophyll fluorescence parameters and relationships between chlorophyll a, b and chlorophyll content index under water stress in Olea europaea cv. Dezful. World Acad. Sci. Eng. Technol. 2012, 68, 1154–1157. [Google Scholar]
- Shrestha, U. Air Pollution Tolerance Index and Anticipated Performance Index of Some Plant Species in Morang District. Doctoral Dissertation, Amrit Campus, Kathmandu, Nepal, 2024. [Google Scholar]
- Balasubramanian, A.; Prasath, C.H.; Gobalakrishnan, K.; Radhakrishnan, S. Air pollution tolerance index (APTI) assessment in tree species of Coimbatore urban city, Tamil Nadu, India. Int. J. Environ. Clim. Change 2018, 8, 27–38. [Google Scholar] [CrossRef] [Scilit]
- Sharma, B.; Bhardwaj, S.K.; Kaur, L.; Sharma, A. Evaluation of air pollution tolerance index (APTI) as a tool to monitor pollution and green belt development: A review. J. Appl. Nat. Sci. 2017, 9, 1637. [Google Scholar] [CrossRef] [Scilit]
- Molnár, V.É.; Tőzsér, D.; Szabó, S.; Tóthmérész, B.; Simon, E. Use of leaves as bioindicator to assess air pollution based on composite proxy measure (APTI), dust amount and elemental concentration of metals. Plants 2020, 9, 1743. [Google Scholar] [CrossRef] [Scilit] [PubMed]
- Simon, E.; Molnár, V.É.; Lajtos, D.; Bibi, D.; Tóthmérész, B.; Szabó, S. Usefulness of tree species as urban health indicators. Plants 2021, 10, 2797. [Google Scholar] [CrossRef] [Scilit] [PubMed]
- Karmakar, D.; Deb, K.; Padhy, P.K. Ecophysiological responses of tree species due to air pollution for biomonitoring of environmental health in urban area. Urban Clim. 2021, 35, 100741. [Google Scholar] [CrossRef] [Scilit]

Disclaimer/Publisher’s Note: The statements, opinions and data contained in all publications are solely those of the individual author(s) and contributor(s) and not of MDPI and/or the editor(s). MDPI and/or the editor(s) disclaim responsibility for any injury to people or property resulting from any ideas, methods, instructions or products referred to in the content. |
© 2026 by the authors. Licensee MDPI, Basel, Switzerland. This article is an open access article distributed under the terms and conditions of the Creative Commons Attribution (CC BY) license.