


Abstract
This paper focuses on the coordinated development and barrier factors of green logistics (GL) and regional economy (RE) in the Yellow River Basin (YRB). Based on data from 2014 to 2023, it constructs an index system covering the development foundation, benefits, potential and sustainability of GL, as well as regional economic structure, scale and potential. Using methods such as the entropy method, coupling coordination degree (CCD) model, kernel density estimation, Moran’s index and Obstacle degree model, it reveals that the average comprehensive CCD improved from 0.38 to 0.65 over the decade, but with significant regional differences. Eastern provinces like Shandong and Henan are ahead, while central and western provinces lag. The coupling coordination degree shows an overall upward trend, moving toward coordinated development with an expanding spatial pattern from east to west and narrowing regional gaps. Global Moran’s index (ranging from 0.356 to 0.524) indicates a spatial positive correlation, and local spatial autocorrelation analysis shows coexistence of high–high and low–low clusters. For Obstacle factors, GL is primarily constrained by low labor productivity (indicator B3, accounting for 23.1% to 44.7% of the total obstacle degree) and shortcomings in logistics industry benefits and scale, while RE is hindered by lagging economic structure optimization, weak foreign trade, and insufficient economic scale and vitality. This study provides a theoretical basis and decision-making reference for the high-quality coordinated development of GL and RE in the YRB, promoting regional coordination and sustainable development.
1. Introduction
The YRB, a vital ecological barrier and economic zone in China, is of great significance in the national strategy of regional coordinated development. In the context of rapid global economic growth and increasing resource and environmental pressure, GL, as a crucial link for balanced economic, social, and environmental development, has gained widespread attention from both theoretical and practical circles. The provinces and regions along the YRB exhibit significant differences in resource endowments, economic development levels, and logistics infrastructure. This makes the coordinated development of GL and RE a key factor affecting the high-quality development of the YRB. Numerous prior studies have centered on gauging and assessing the development levels of GL and RE separately. However, there is a lack of research on the coordinated development mechanism and influencing factors of these two systems. Moreover, existing studies are mostly concentrated on specific regions or industries, with few systematic and comprehensive studies on the YRB. Spanning multiple provinces in China, the YRB is characterized by diverse natural conditions, economic development levels, and cultural backgrounds, which endow the coordinated development of GL and RE with unique features and patterns.
Firstly, the natural geographical dimension includes ecological fragility and the rigid constraint of water resources. The YRB is a vital ecological barrier in China but also an ecologically fragile area, with serious problems like soil erosion and land desertification. Compared to the Yangtze River Basin with abundant water resources and the eastern coast with convenient shipping, the YRB faces more severe water resource shortages. This rigid constraint of water resources not only profoundly impacts regional economic activities such as agriculture and industrial layout but also fundamentally limits the development space for traditional high-water-consumption and high-environmental-impact logistics models. Thus, the development of GL in the YRB pursues not only efficiency and economic benefits but also aims to balance logistics activities with environmental protection within the ecological carrying capacity. Its coordination mechanism must strongly respond to ecological constraints.
Secondly, the economic structure dimension demonstrates significant east–central-west industrial gradient differences. The YRB spans the three major regions of East, Central, and West China. It ranges from the eastern provinces of Shandong and Henan, where manufacturing and modern services are relatively advanced, to the midstream provinces of Shanxi and Shaanxi, which are dominated by energy-intensive heavy chemical industries. Then, it extends to the western provinces of Qinghai, Gansu, and Ningxia, which primarily focus on agriculture, animal husbandry, and the development of primary resources. This industrial gradient is much more pronounced than in the relatively balanced downstream areas of the Yangtze River Economic Belt or in some eastern coastal regions with high industrial homogenization. Such gradient differences lead to significant spatial disparities in logistics demand structure, logistics infrastructure, and the interaction modes between logistics and industries. To study the coordinated development in this context, it is essential to fully recognize and analyze the complexity and uniqueness of logistics–economy interactions against the background of high heterogeneity.
Finally, from the policy background perspective, national strategy-oriented ecological priorities are central. At the national level, the “YRB Ecological Protection and High-Quality Development” has been elevated to a major strategy whose core is “ecological priority and green development”. This sets more stringent ecological conservation goals and path dependencies for the provinces in the YRB than the “jointly strengthening protection without large-scale development” in the Yangtze River Economic Belt and the “innovation-led and high-quality development” pursued by the eastern coastal regions. The policy strongly guides the transformation of regional economic development models and directly regulates the greening of the logistics industry (such as restrictions on high-emission transportation and encouragement of circular logistics). This unique policy context profoundly shapes the objective function, constraints, and pathways for the coordinated development of GL and RE.
Thus, it is imperative to deeply explore the internal mechanisms of the coordinated development of GL and RE in the YRB, reveal their spatiotemporal evolution characteristics, and analyze the barrier factors affecting their coordinated development so as to provide a theoretical basis and decision-making references for formulating scientific and rational regional development policies.
Unlike previous studies that merely apply standard evaluation toolboxes to new regional contexts, the core value-added of this study lies in conceptualizing a “resource-constrained collaboration” paradigm. By mapping the GL-RE nexus against the YRB’s rigid ecological thresholds and significant east–west industrial gradients, we provide a structured diagnostic framework. This framework evaluates how spatial reorganization and targeted micro-policies can navigate natural constraints, offering a replicable analytical model for other ecologically fragile, highly heterogeneous river basins globally.
2. Theoretical Framework
2.1. Literature Review
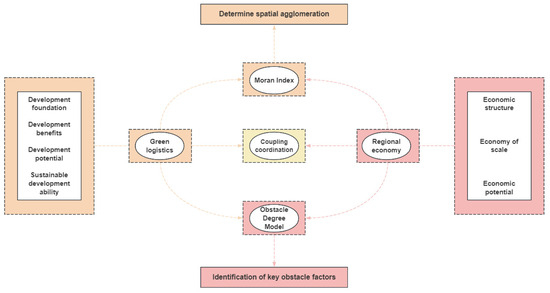
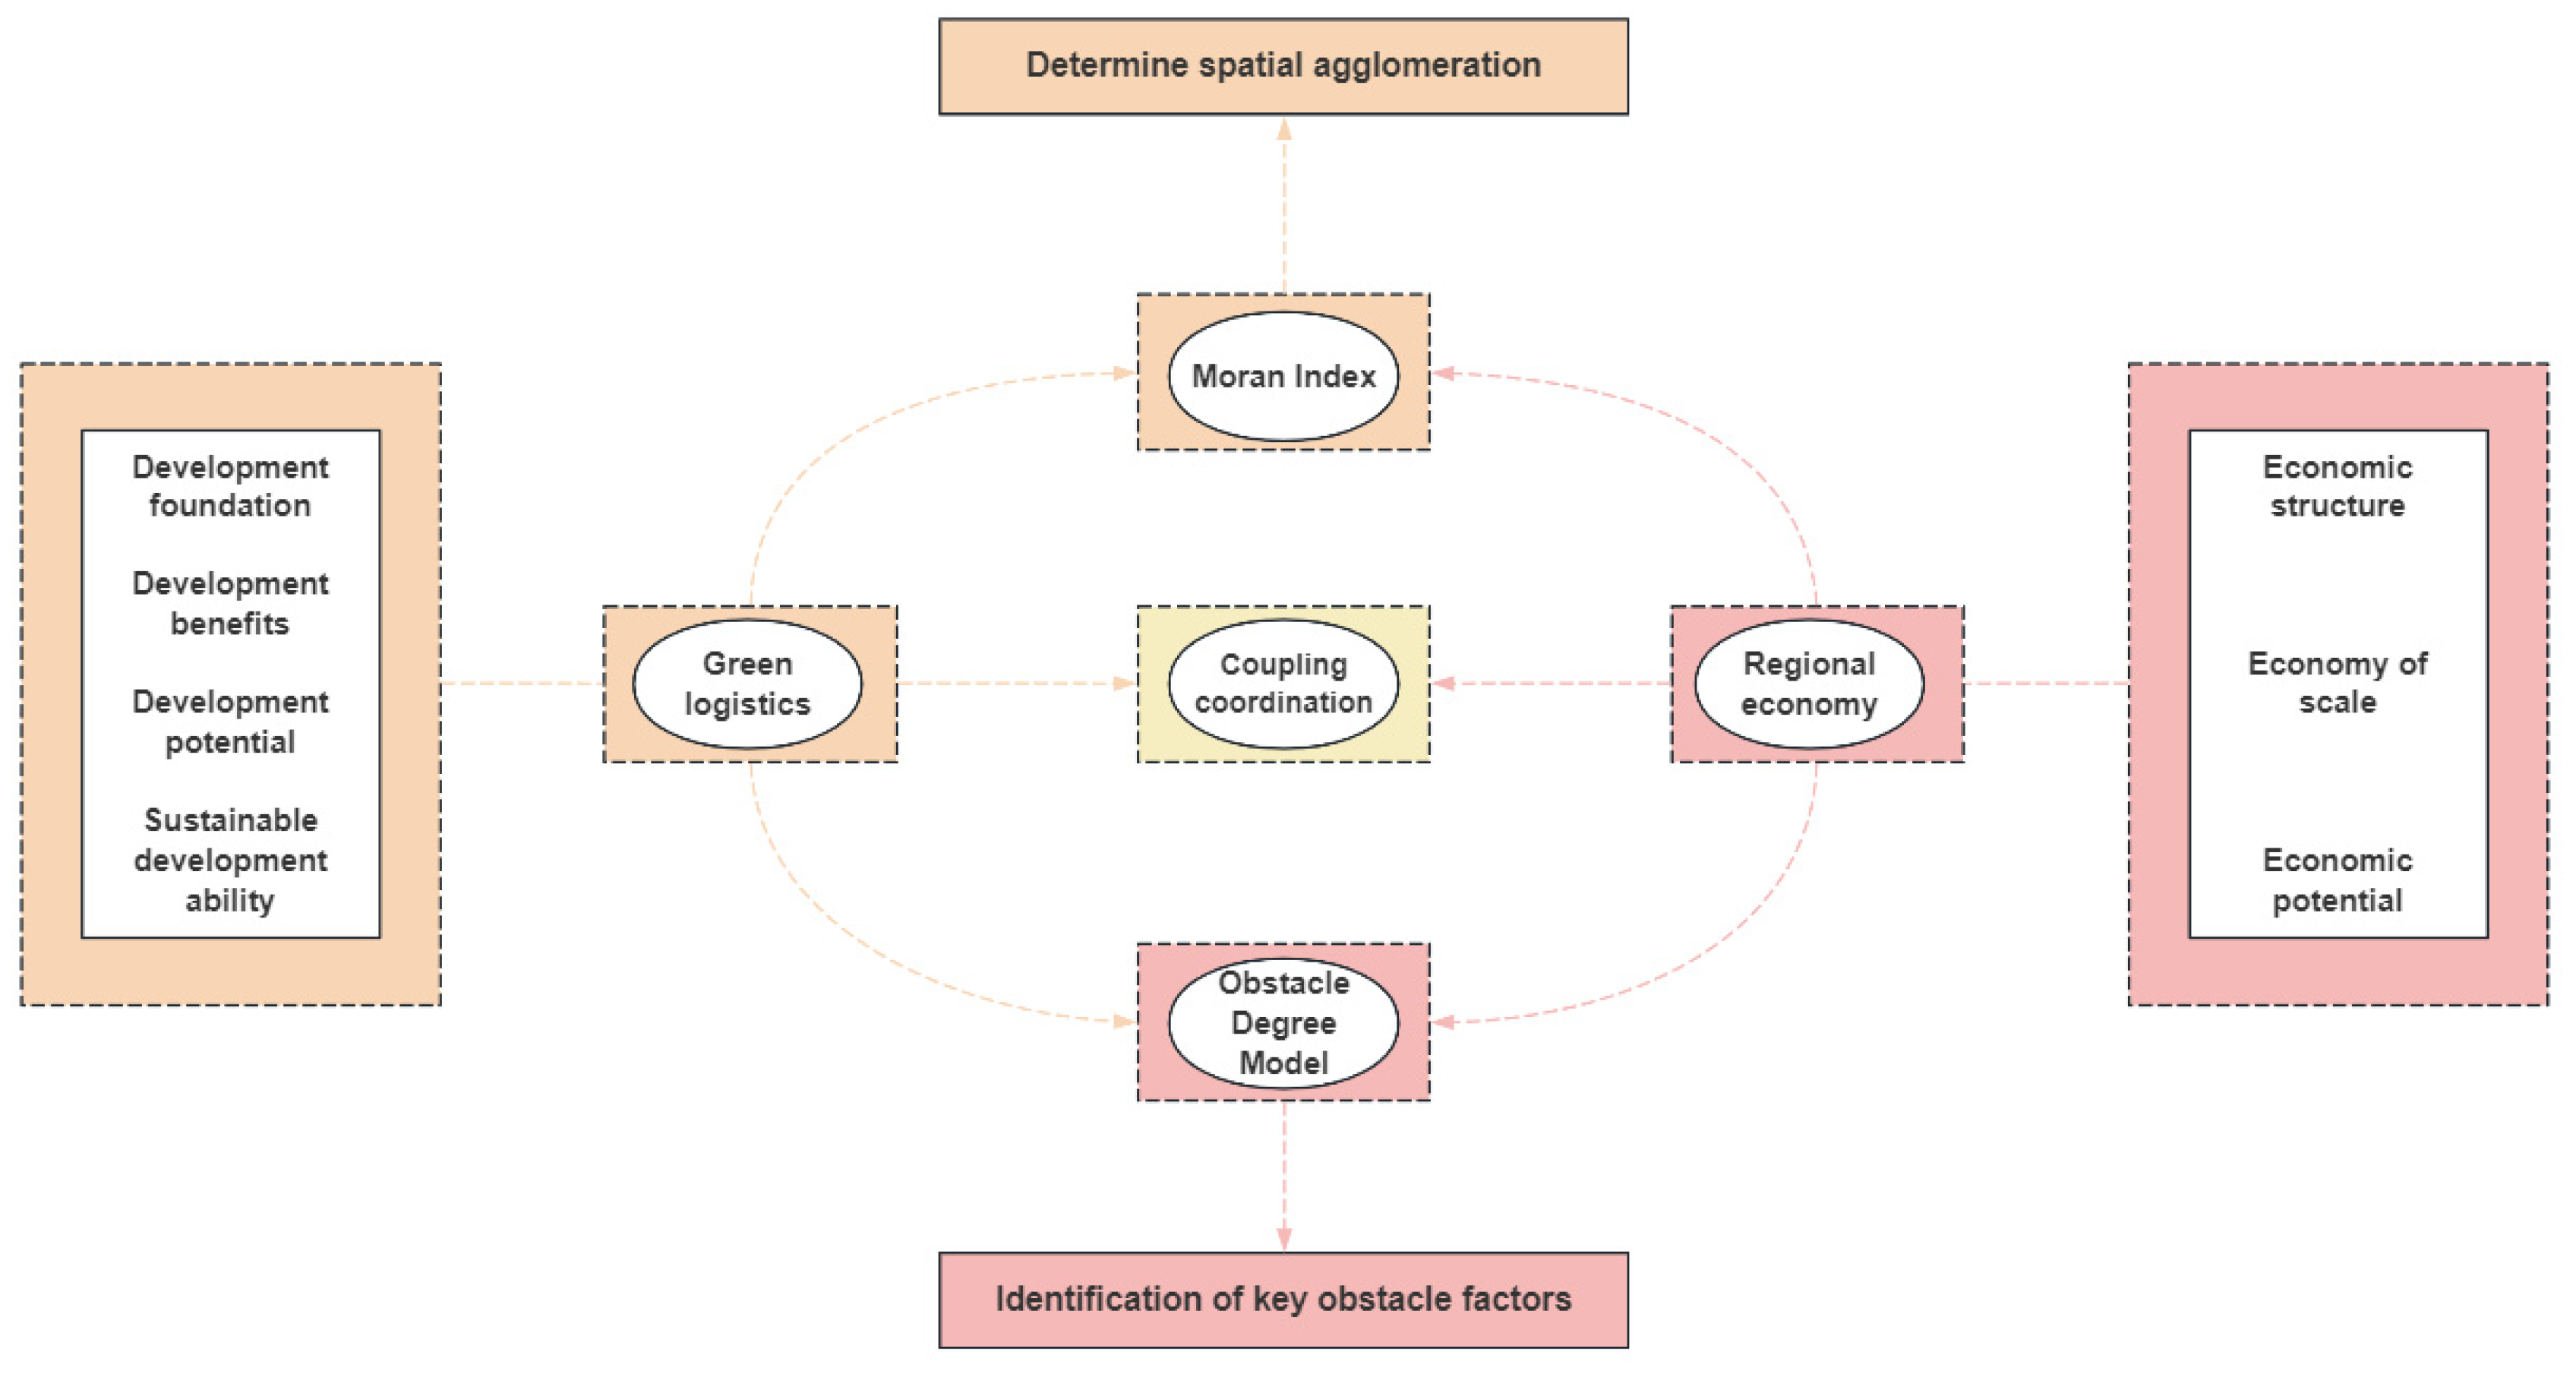
In the pursuit of sustainable and low-carbon development, GL and RE concepts have become crucial. In this pressing environment, there has been a significant shift in the paradigm of sustainable development [1,2,3,4,5]. There is also a hope to promote economic growth through eco-friendly means [6,7]. Governments aim to conserve resources to reduce environmental impact and enhance the overall environmental performance of the economy [8,9]. The purpose of GL is also to reduce greenhouse gas emissions and fossil fuel use while recycling used materials [10,11]. Countries are also eager to decouple economic growth from rising carbon emissions [12,13,14]. Many developed countries are paying great attention to the development of GL and the economy [15,16]. The European Commission has designed environmental programs to reduce urban waste and emissions [17]. The above points clearly illustrate the role of the concept of “GL” in environmental sustainability and economic growth [18,19,20]. In recent years, the literature has increasingly focused on the intersection of green logistics (GL) and regional economy (RE), which can be broadly categorized into two main themes: environmental sustainability paradigms and methodological evaluations. Regarding the first theme, numerous studies underscore the necessity of decoupling economic growth from carbon emissions, highlighting GL’s role in promoting the circular economy and reducing greenhouse gas emissions [21,22,23]. On the methodological front, scholars have utilized various models—such as the Haken model [24], Bayesian networks [25], and the entropy weight method [26]—to measure collaborative development. Despite these advancements, a critical discrepancy remains: existing collaboration theories predominantly address economically homogeneous or resource-abundant areas (like the Yangtze River Economic Belt) [27,28,29]. This reveals a distinct research gap: there is a lack of systematic studies on the synergistic mechanisms in highly heterogeneous, ecologically constrained environments like the YRB [30,31,32,33]. Against this backdrop, this study focuses on GL and RE in the YRB. It uses the entropy method for objective weighting and calculating a composite index [34]. The CCD model analyzes the interaction and coordination between the GL and RE subsystems [35,36]. Kernel density estimation examines the overall distribution and dynamic trends of GL and RE [37,38]. Combined global and local Moran’s index reveals the spatial clustering and evolution of GL [39,40]. Additionally, the barrier degree model identifies key factors hindering the development of GL and RE in the YRB, as well as their spatial-temporal differences [41], as shown in Figure 1.
Figure 1.
Theoretical framework diagram.
Existing collaboration theories often focus on economic efficiency and scale interaction but fall short in studying the coupling rules of logistics and economic systems under strong ecological constraints, especially water resource rigidity. This study builds a GL system with ecological sustainability indicators, applied to the ecologically fragile YRB. It first systematically reveals how the “GL-RE” system achieves coupling coordination via internal adjustment and efficiency improvement under strict ecological thresholds. This enriches the theoretical understanding of regional collaboration under ecological constraints. While spatial differences are commonly recognized in regional studies, existing theories struggle to explain the dynamic evolution of internal collaboration mechanisms and spatial interaction rules in highly heterogeneous regions, such as the significant gradient differences in the YRB. This research combines the CCD model, kernel density estimation, and global/local Moran’s index. It not only depicts the spatial pattern of collaboration levels but also reveals how spatial heterogeneity, such as high–high and low–low clusters and their evolution, dynamically impacts the entire basin’s collaborative development through spatial spillover and gradient shift effects. This applies a “spatial heterogeneity–collaborative evolution” perspective for understanding collaboration in complex heterogeneous regions. Under the national strategy of YRB ecological protection, its collaborative development path differs from market-driven evolution or protection–development balance. Through barrier factor analysis and spatial-temporal evolution studies, this research shows how policy intervention overcomes specific barriers (such as infrastructure deficits and lagging structural transformation), reshapes regional links, and guides collaboration from “policy-driven” to “endogenous-coordinated”. This supplements the theoretical understanding of collaborative paths under policy scenarios. In summary, this study focuses on the YRB due to its national developmental importance and unique natural, economic, and policy characteristics. It offers an irreplaceable research setting and empirical application context for testing and developing the “GL-RE” collaboration theory, particularly the collaboration mechanisms under ecological constraints and high spatial heterogeneity.
2.2. Theoretical Framework of Two-Way Action Mechanism
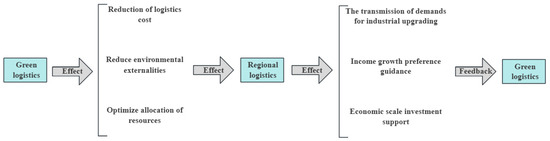
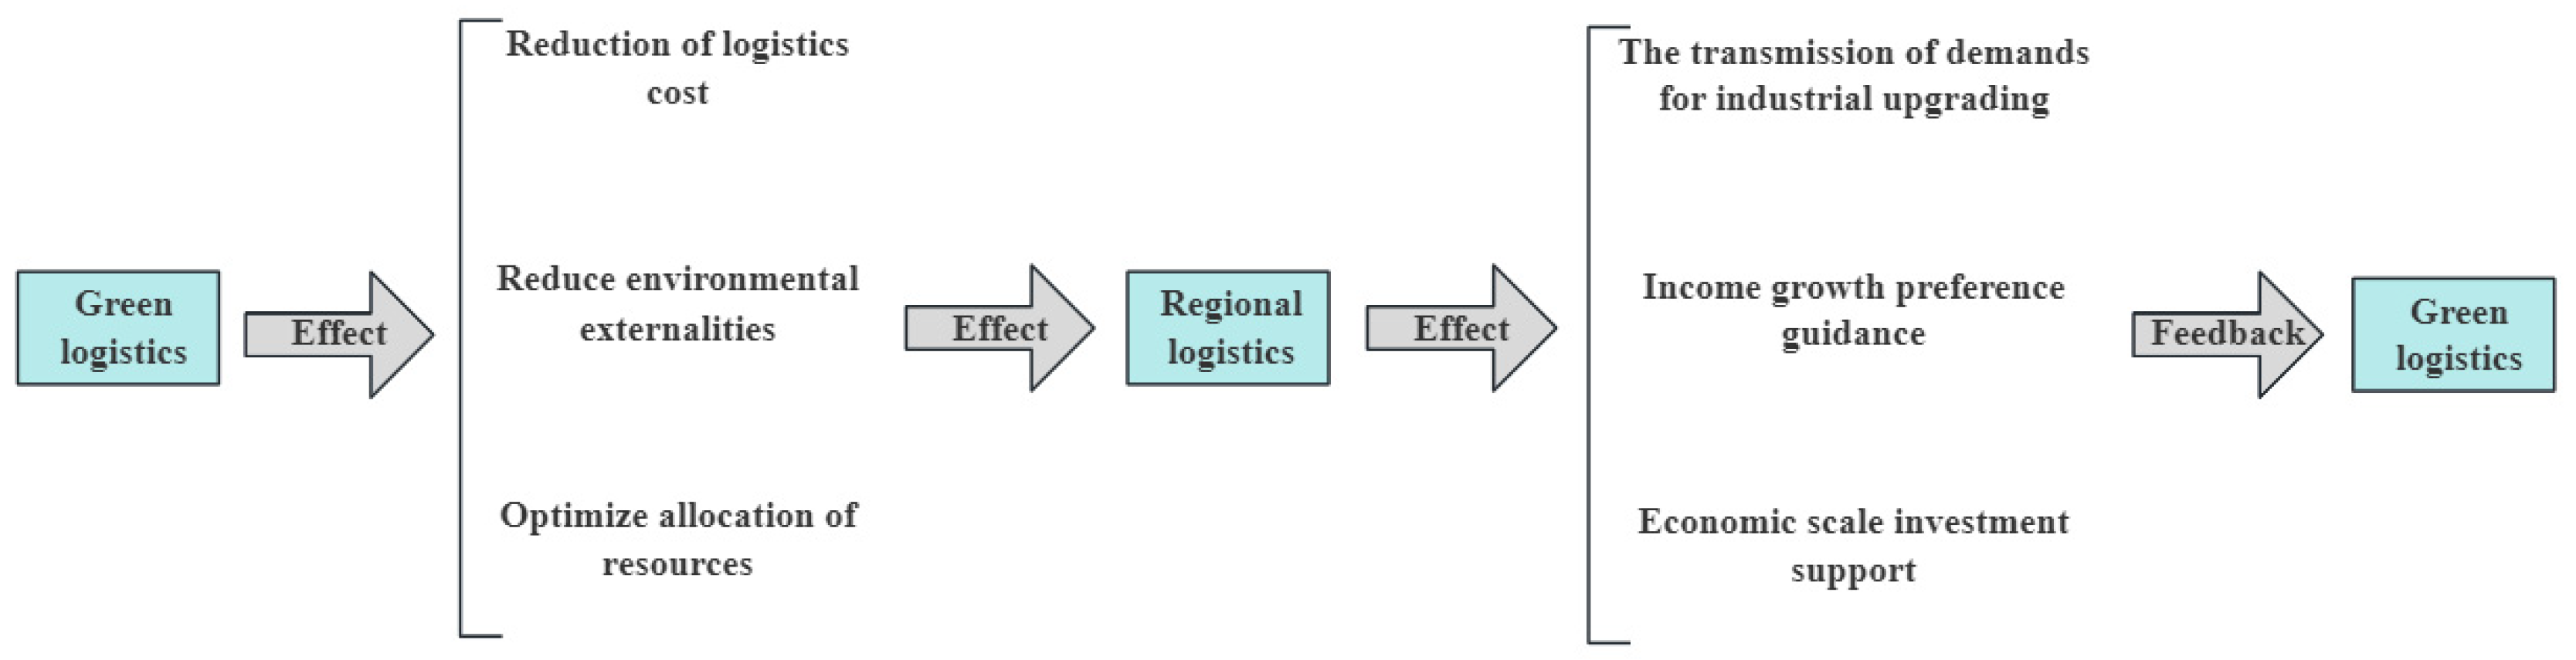
The collaborative development of GL and RE is not a one-way influence but a complex system process of multi-path two-way interaction. Based on the ecological constraints, industrial gradients, and policy peculiarities of the YRB, this study constructs the following theoretical framework (Figure 2).
Figure 2.
Framework diagram of two-way interaction mechanism between GL and RE.
- (1)
- Pathways for GL to Boost RE
GL cuts logistics costs and boosts circulation efficiency. It uses intelligent technologies like big data-driven route optimization and joint distribution. These reduce empty vehicle rates and warehouse redundancy, lowering transport costs. For example, Suzhou’s “Suzhou-style Distribution” model cuts freight costs by about 40%. It also speeds up regional industrial chain response. It cuts environmental externality costs. Using new energy vehicles and eco-friendly packaging reduces carbon intensity and pollution. For instance, JD Logistics reduces carbon emissions by 400,000 tons yearly. This lessens the regional environmental governance burden and indirectly frees up economic resources. It optimizes regional resource allocation. GL parks and multimodal transport hubs like “railway + waterway” for medium- and long-distance transport promote the efficient cross-regional flow of production factors. This supports industrial gradient transfer and clustering.
- (2)
- Feedback Effects of RE on GL
Industrial upgrading changes logistics demand. An optimized regional economic structure, marked by a higher tertiary industry share, creates high-value, small-batch, and frequent logistics needs. This forces logistics services to go green and become more customized. For example, there is growing demand for cold chain and reverse logistics. Income growth strengthens green preferences. As consumption ability rises and per capita consumption expenditure increases, the green consumption market expands. To meet consumer environmental demands, firms adopt green supply chain management, such as eco-friendly packaging and low-carbon delivery. Economic scale supports green investment. With stronger regional fiscal resources and higher corporate profits, there is more funding for green technology R&D (e.g., AGV robots, new energy vehicles) and infrastructure upgrades (e.g., smart ports, photovoltaic warehouses).
3. Research Design
3.1. Research Methods
- (1)
- Entropy method
This study uses the entropy method to determine weights of indicators for GL and RE in the YRB. As an objective weighting approach, it minimizes subjective influence, enabling a more objective evaluation of the indicator system.
- ①
- Indicator normalization.
Positive indicator formula:
Negative indicator formula:
- ②
- Calculate the proportion of the index of the i-th province under the j-th index.
- ③
- Calculate the information entropy value under the j-th index.
When Pij = 0, let PijlnPij = 0.
- ④
- Calculate the weight of each index.
Among them, 1 − ej is the redundancy degree of information entropy.
- ⑤
- Calculate the comprehensive evaluation index of each evaluation object:
- (2)
- CCD model
To better reflect the overall effects and synergy of the GL and RE systems in the YRB, this study introduces the CCD model.
In the model, L indicates the comprehensive development index of GL, and E represents the comprehensive development index of the RE. C is the coupling degree, T is the overall coordination index of GL and the RE, and D is their CCD. α and β are the weights for GL and the RE, respectively. Since both are key research focuses, their weights are set at 0.5 each. The classification criteria are shown in Table 1.
Table 1.
Classification criteria of CCD model.
- (3)
- Kernel density estimation
This study uses kernel density estimation, a non-parametric method, to analyze the overall distribution and dynamic trends of the CCD of GL and RE in the YRB.
In the formula, n is the number of observations, Xi represents independently distributed observations, is the mean of the observations, K( ) denotes the kernel function, and h represents the bandwidth. To ensure the optimal balance between bias and variance, the bandwidth (h) is determined using Silverman’s rule of thumb, which automatically adapts to the sample variance and data distribution.
- (4)
- Moran’s index
This study applies the Global Moran’s Index to test whether the CCD of GL and RE exhibits spatial clustering.
In the formula, I represents the Global Moran’s Index, S2 is the sample variance, n is the number of regions, and wij denotes the spatial weight matrix. In this study, wij employs a strictly row-standardized binary contiguity matrix (Queen contiguity), where wij = 1 if provinces i and j share a common border, and 0 otherwise. The statistical significance of both Global and Local Moran’s I is tested using a permutation approach (999 random permutations) with a pseudo p-value threshold of 0.05. The Moran’s Index ranges between [−1, 1]. A positive Moran’s I indicates spatial positive correlation, zero implies no spatial correlation, and a negative value suggests spatial negative correlation.
The Local Moran’s Index helps identify spatial association patterns caused by locational differences within a region. These patterns are categorized into four types: high–high, high–low, low–high, and low–low clusters. The formula is as follows:
- (5)
- Obstacle degree model
To better identify the main factors hindering the coupling coordination of GL and regional economic development and assess their impact levels, this study introduces the obstacle degree model, as shown in the formula below:
- ①
- Calculation of indicator deviation value.
- ②
- Calculation of index difficulty.
- ③
- System difficulty calculation.
In Formulas (11)–(13), Fij is the deviation degree of the indicator, Xij is the standardized matrix, Wj is the of contribution the obstacle factor, Vj is the obstacle degree of the j-th indicator to the coupling coordination of GL and RE, and Mj is the obstacle degree of the subsystem to the coupling coordination.
It is important to clarify that the “obstacle degree” calculated here does not imply definitive causal bottlenecks; rather, it serves as a diagnostic ranking metric driven by the relative weights and standardized deviations of the performance indicators.
3.2. System Construction
In building a comprehensive evaluation indicator system for the co-development of GL and RE in the YRB, this study considers their multi-dimensional characteristics and draws on existing studies [42,43,44]. The goal is to fully and objectively reflect their development levels and interaction, as shown in Table 2. Here is a further explanation of the system:
Table 2.
GL and regional economic index system.
The GL indicator system consists of four primary indicators: development foundation, benefits, potential, and sustainable development ability. It includes 12 secondary indicators, such as road network density, cargo vehicle ownership, and the ratio of urban–rural delivery routes. These reflect the comprehensive development level of GL. Road network density and cargo vehicle ownership show the completeness of logistics infrastructure. Freight turnover and total freight volume reflect the scale and efficiency of logistics activities. Added value and fixed asset investment in the logistics industry measure the economic benefits and development potential of GL. Also, energy consumption intensity and carbon emission intensity of the logistics industry highlight the sustainable development ability of GL and help evaluate its environmental impact.
The regional economic indicator system includes three primary indicators: economic structure, scale, and potential. It comprises 12 secondary indicators, such as the proportion of the added value of the primary and tertiary industries and the proportion of industrial added value. Economic structure indicators show the industrial composition and rationality of the RE, like the proportions of the three industries. Economic scale indicators reflect the overall regional economic strength, including regional GDP, total retail sales of consumer goods, and total imports and exports of goods. Economic potential indicators focus on future development trends and growth drivers, such as per capita consumer expenditure and per capita regional GDP growth rate.
The construction of the GL and RE indicator systems aims to precisely evaluate the development status and trends of GL and RE in each province through specific indicators. This facilitates a deeper understanding of the internal relationship between them. It also offers a solid theoretical foundation and quantitative basis for subsequent empirical analysis. Consequently, it strongly supports the formulation of targeted development strategies, promoting the high-quality co-development of GL and RE in the YRB. The specific values can be found in the Supplementary Material File S1 “Data”.
3.3. Data Sources
This study conducts empirical analysis on samples from nine provinces in the YRB for 2014–2023. Data are from China Statistical Yearbook, China Energy Statistical Yearbook, China Basic Unit Statistical Yearbook, and provincial statistical yearbooks. To eliminate price fluctuations, data are adjusted using 2014 as the base period. Missing data are completed via interpolation.
4. Empirical Analysis
4.1. Analysis of the Trend of GL and Comprehensive Development Level of RE
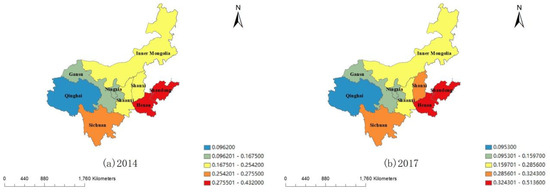
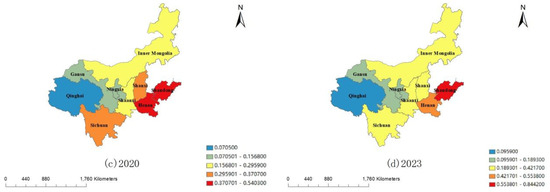
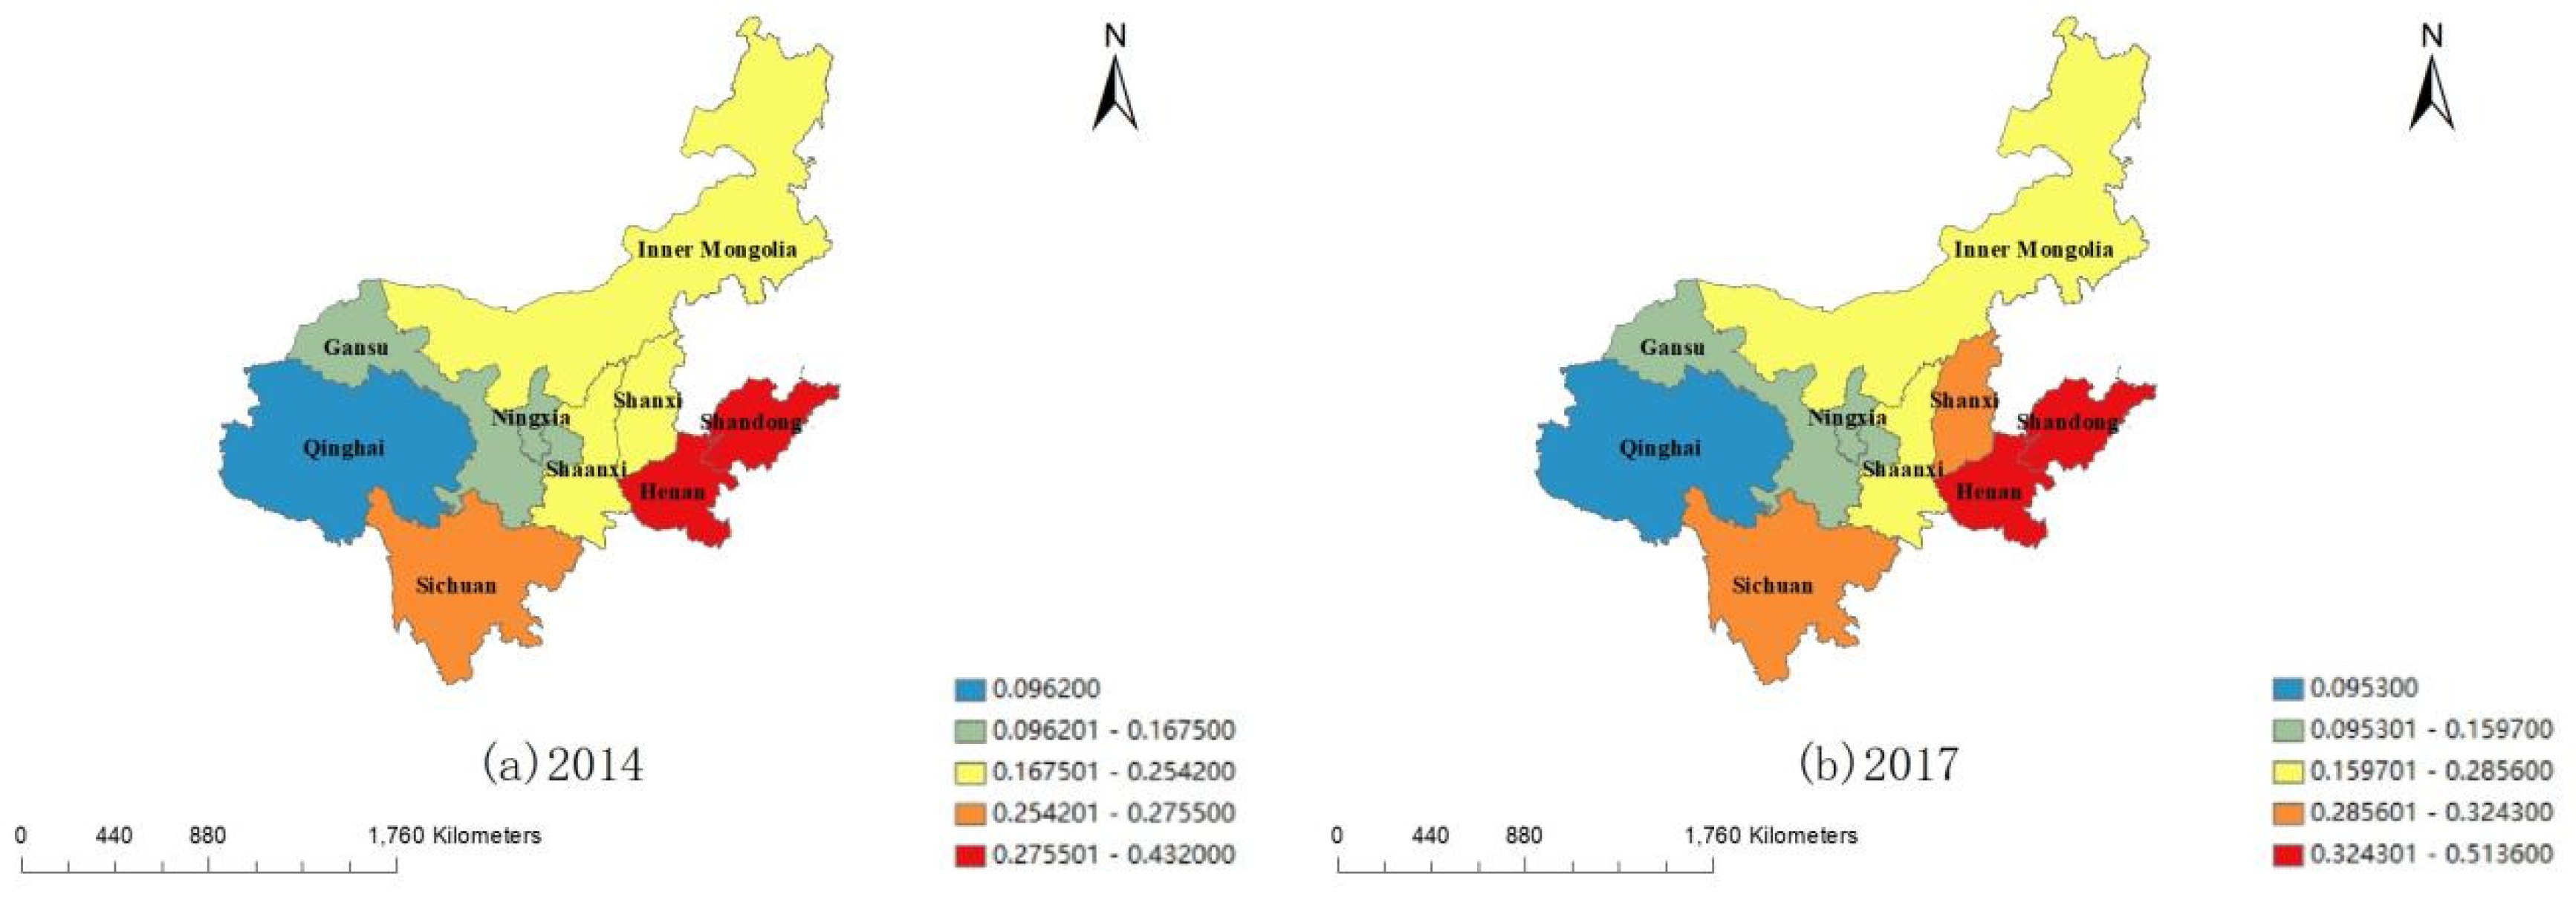
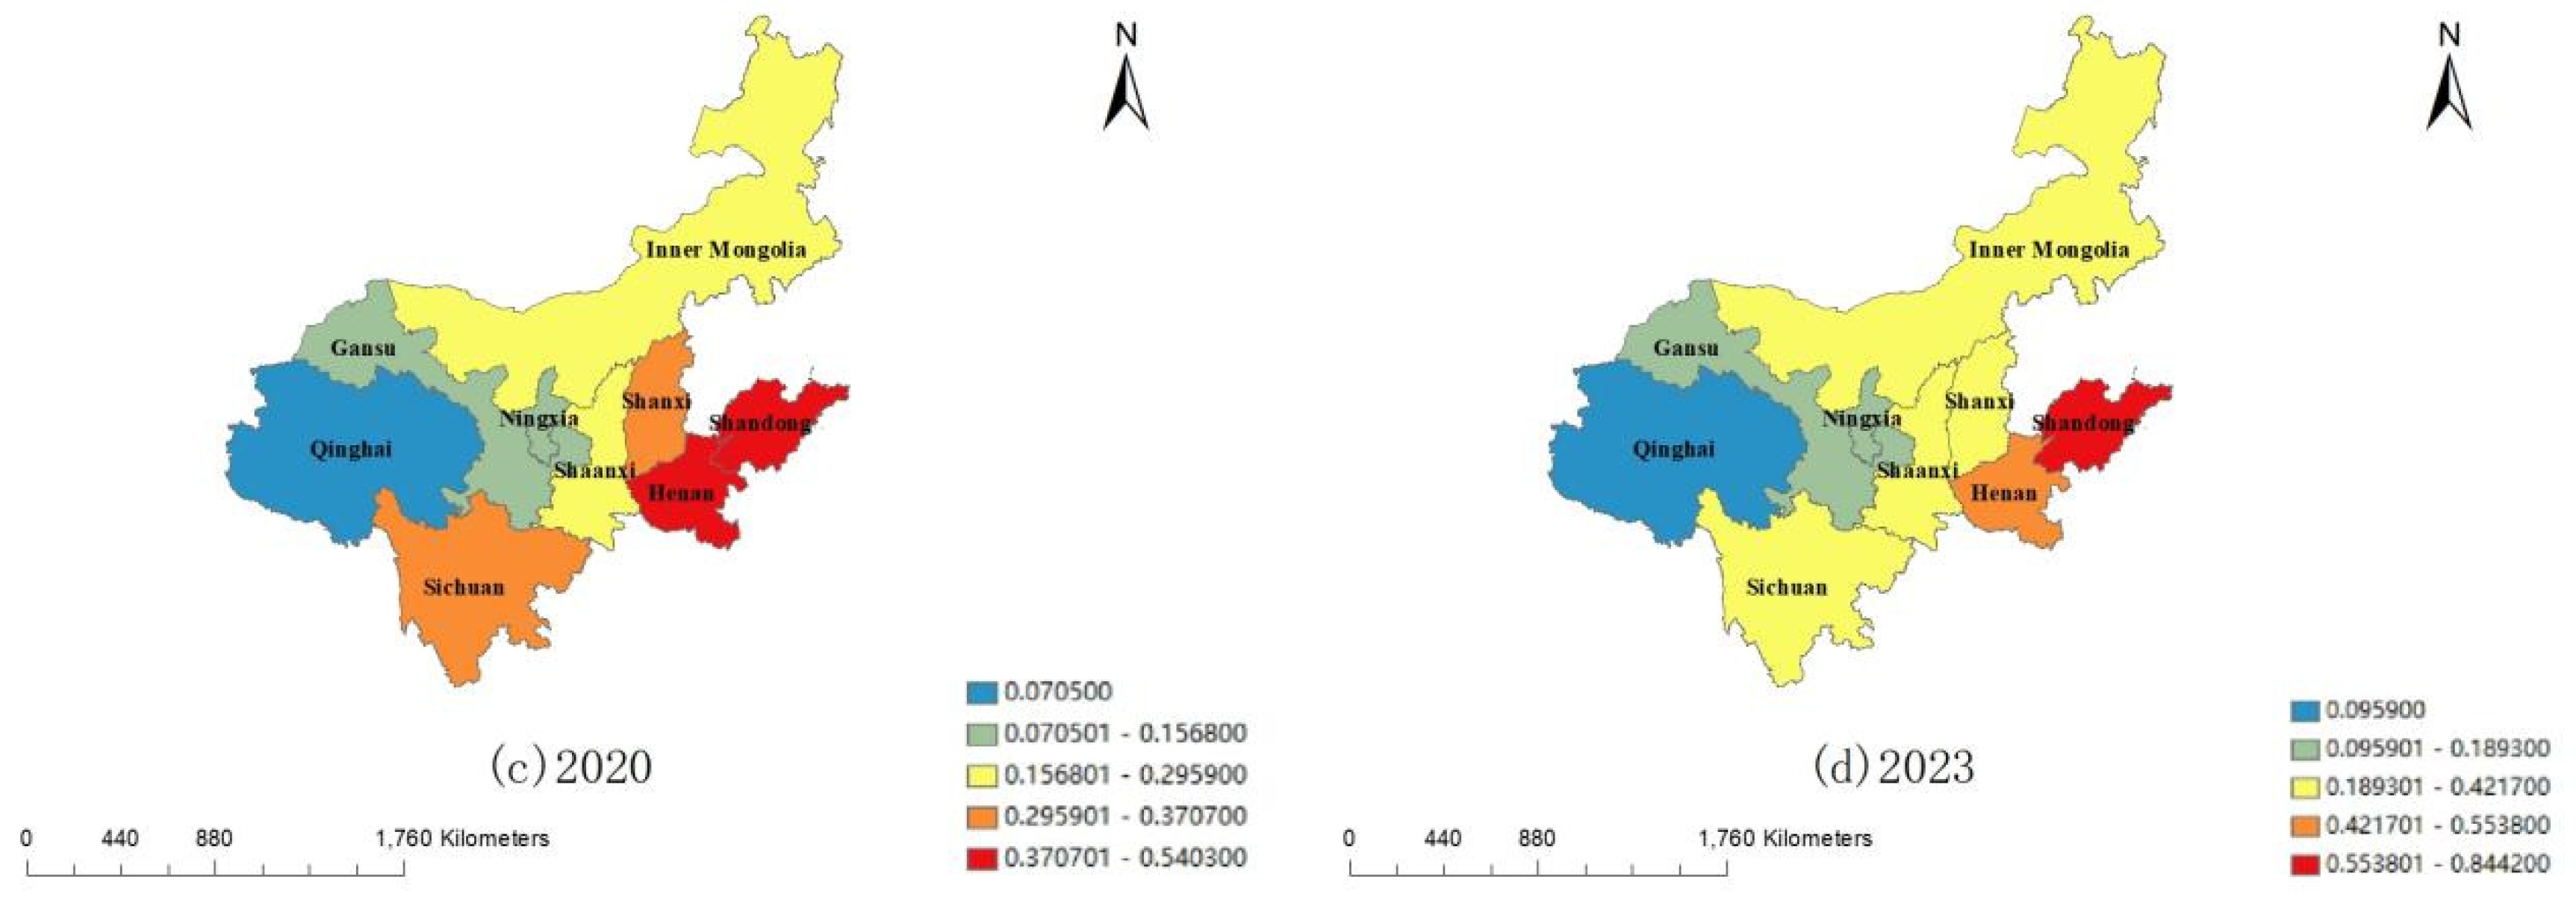
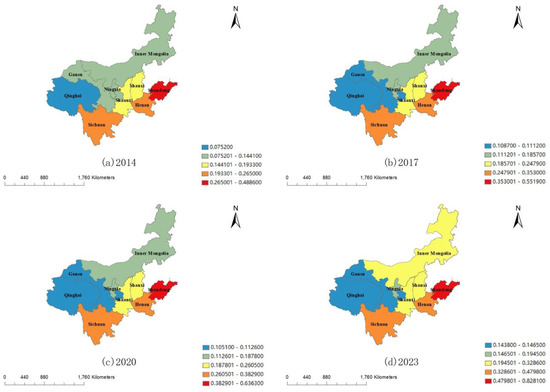
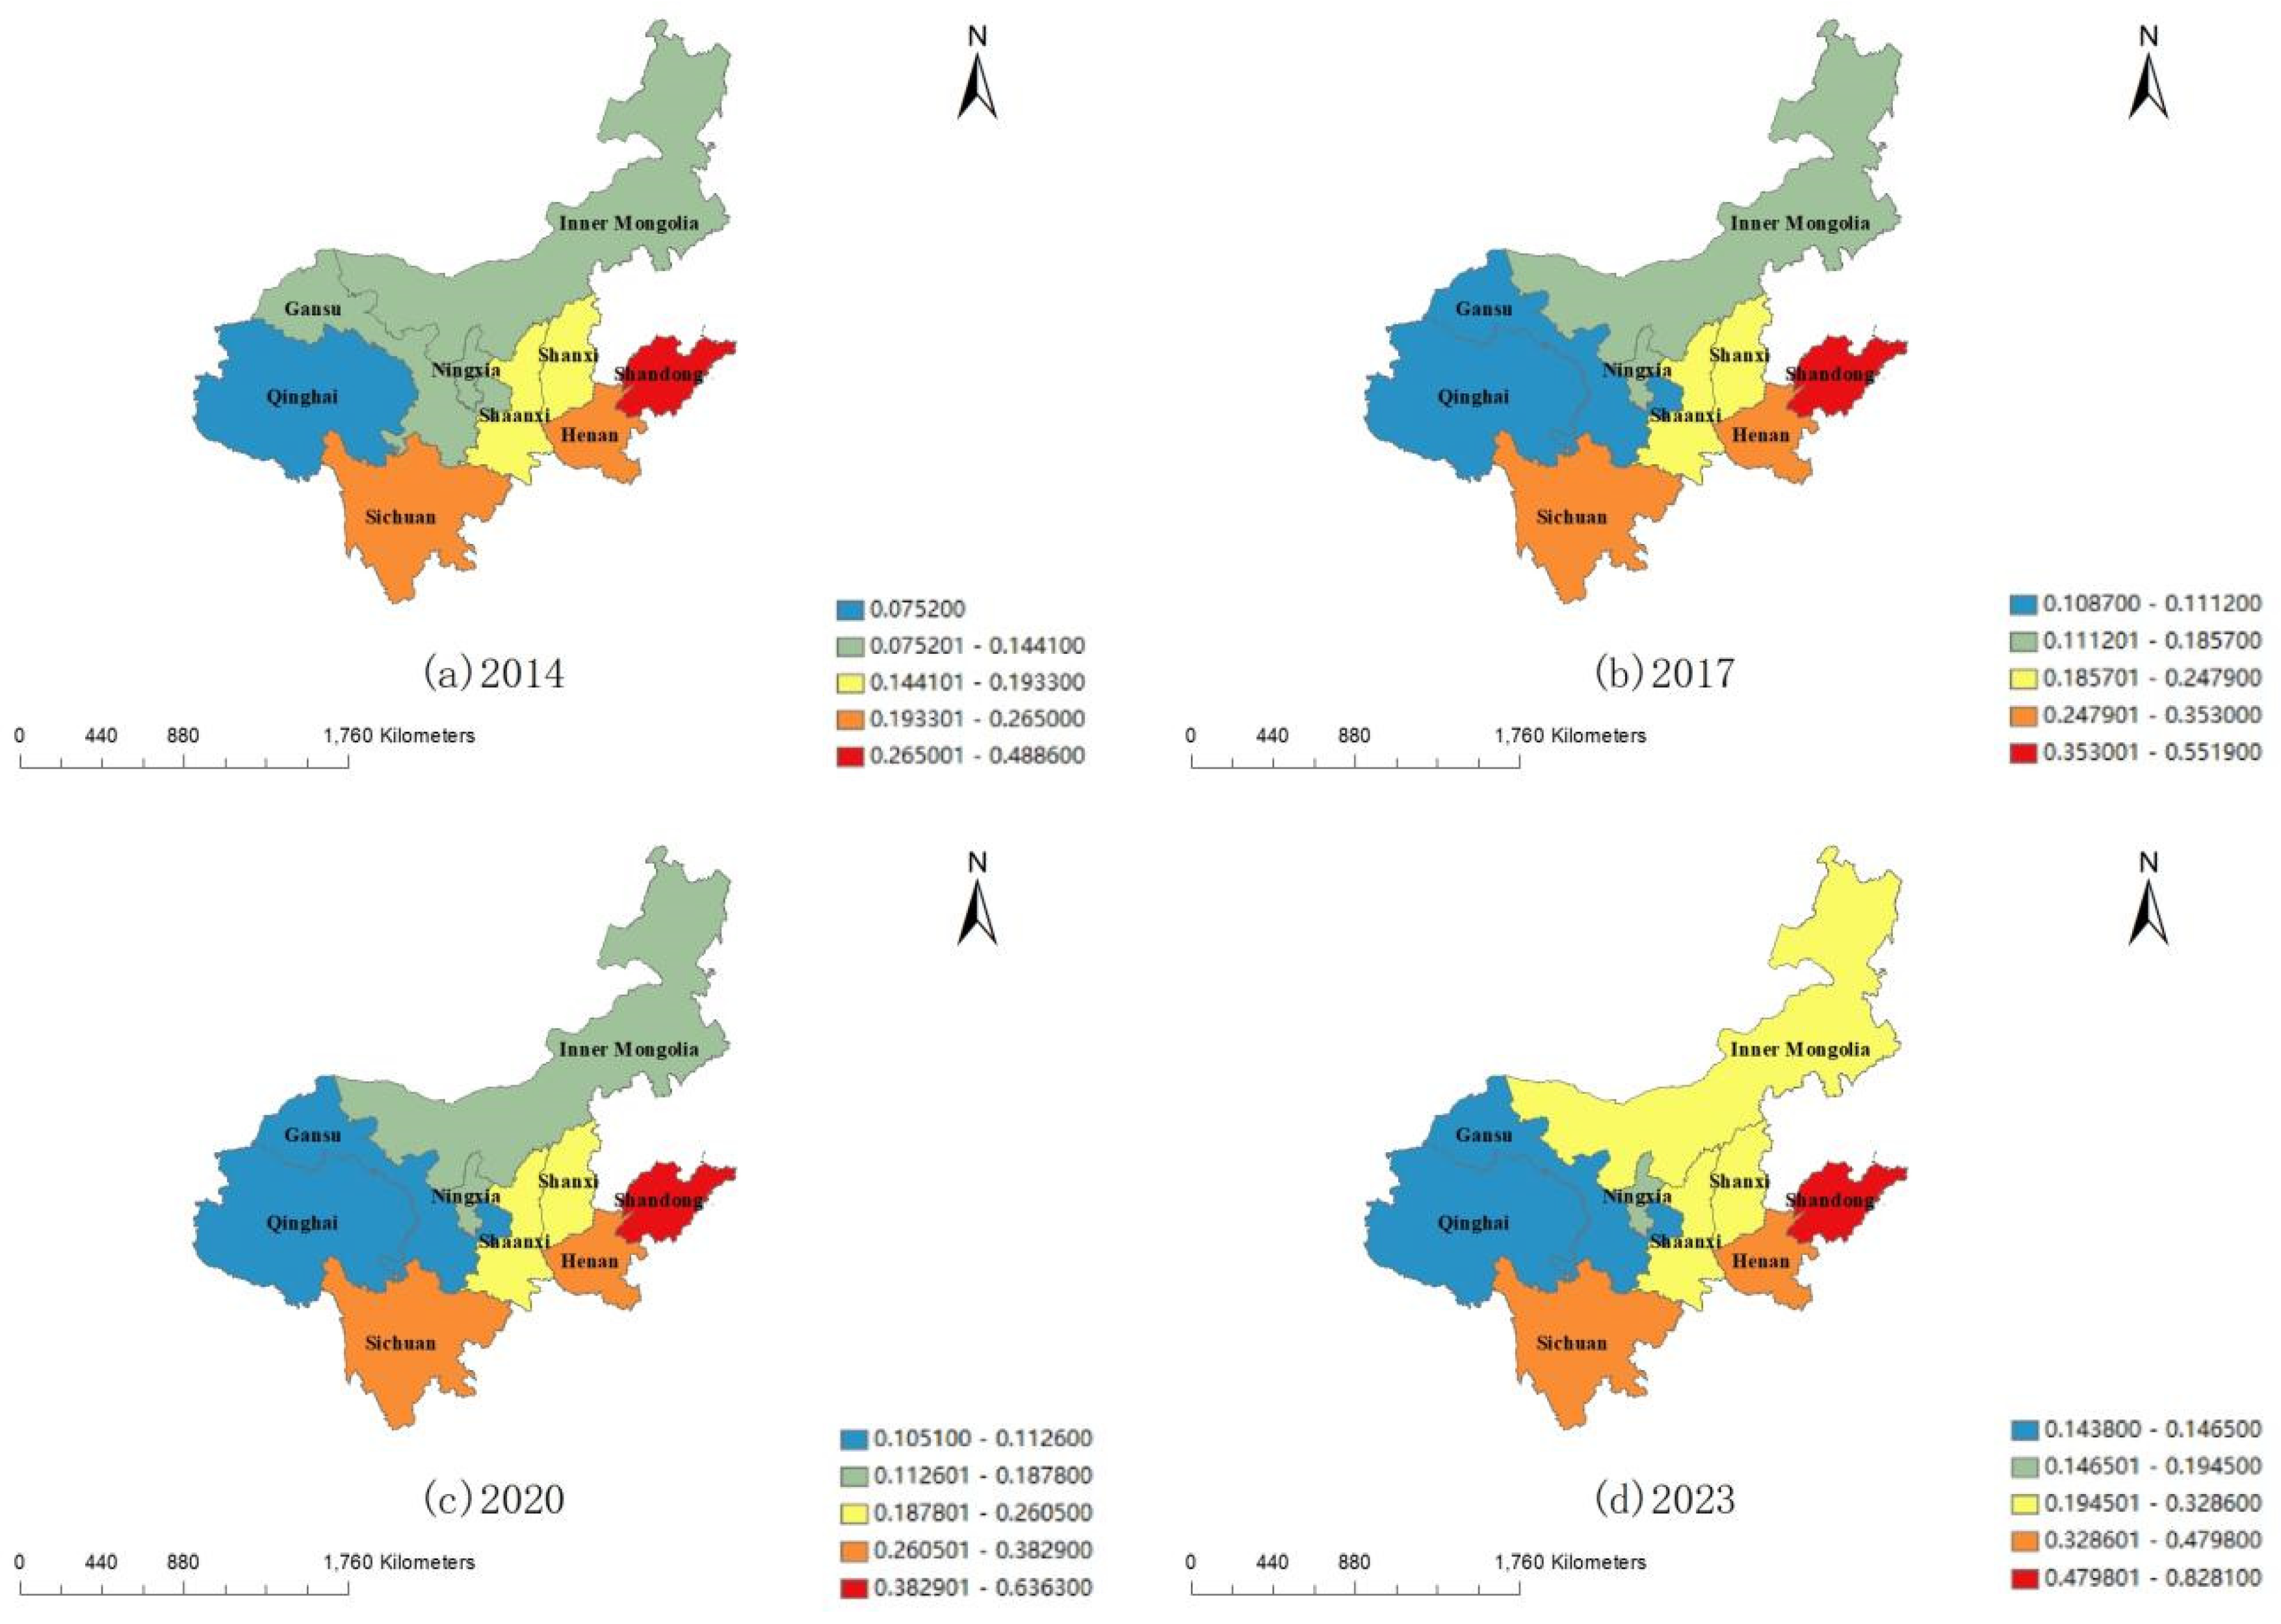
From 2014 to 2023, as shown in Figure 3, the overall GL development level in the YRB showed a steady upward trend, with significant provincial differences. Shandong, the coastal economic leader, led in GL due to its strong economy (F1, F2), geographical advantages, and radiation effect as a regional ‘growth pole’. The intelligent upgrade of ports like Qingdao and Yantai generated green technology spillover effects, driving the adoption of technologies such as new energy vehicles and smart warehousing systems by logistics enterprises within the province. The booming cross-border e-commerce industry (F3) also improved the informatization level and joint distribution efficiency of logistics enterprises (e.g., Cainiao Network Jinan hub), thereby reducing unit logistics energy consumption (D1, D2). This ‘port + industry’ dual-driver model was the core mechanism behind Shandong’s sustained GL leadership. The continuous leadership of eastern provinces is not solely a byproduct of the national macro-strategy but is heavily anchored by targeted provincial legislation. For instance, Shandong’s implementation of the “Action Plan for the High-Quality Development of Modern Logistics” provided direct fiscal subsidies for green transit and established strict carbon emission standards for commercial fleets, accelerating its transition to an intermediate and high-quality coordination stage. Henan also performed well. Its central plains location and large economy contributed to significant GL benefits, with freight volume and turnover increasing and development potential being unleashed through growing logistics industry added value and fixed asset investment. However, western provinces like Qinghai, Gansu, and Ningxia started late in GL and had relatively low initial development levels. From 2017, policy guidance and regional cooperation accelerated their GL development. Qinghai improved urban–rural delivery routes and postal outlets. Gansu made progress in controlling logistics energy consumption and carbon emission intensity, with increased environmental expenditure. Ningxia stood out in improving logistics personnel quality and average wages, laying a talent foundation for long-term GL development.
Figure 3.
Distribution of comprehensive development level of GL.
Regarding spatial-temporal evolution, the spatial pattern of GL development has gradually shifted westward from the east. In 2014, Shandong had a clear lead in GL over other provinces, while western provinces like Qinghai, Gansu, and Ningxia had relatively low GL levels. By 2023, Shanxi and Shaanxi had GL development close to Henan’s level, becoming new highlights in the midstream region. Meanwhile, the GL development gap between Qinghai, Gansu, Ningxia and surrounding areas narrowed, and regional coordinated development gradually emerged.
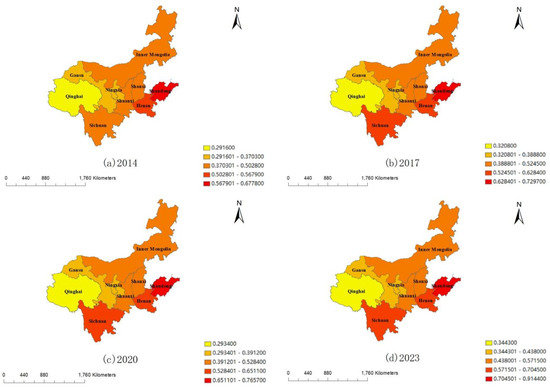
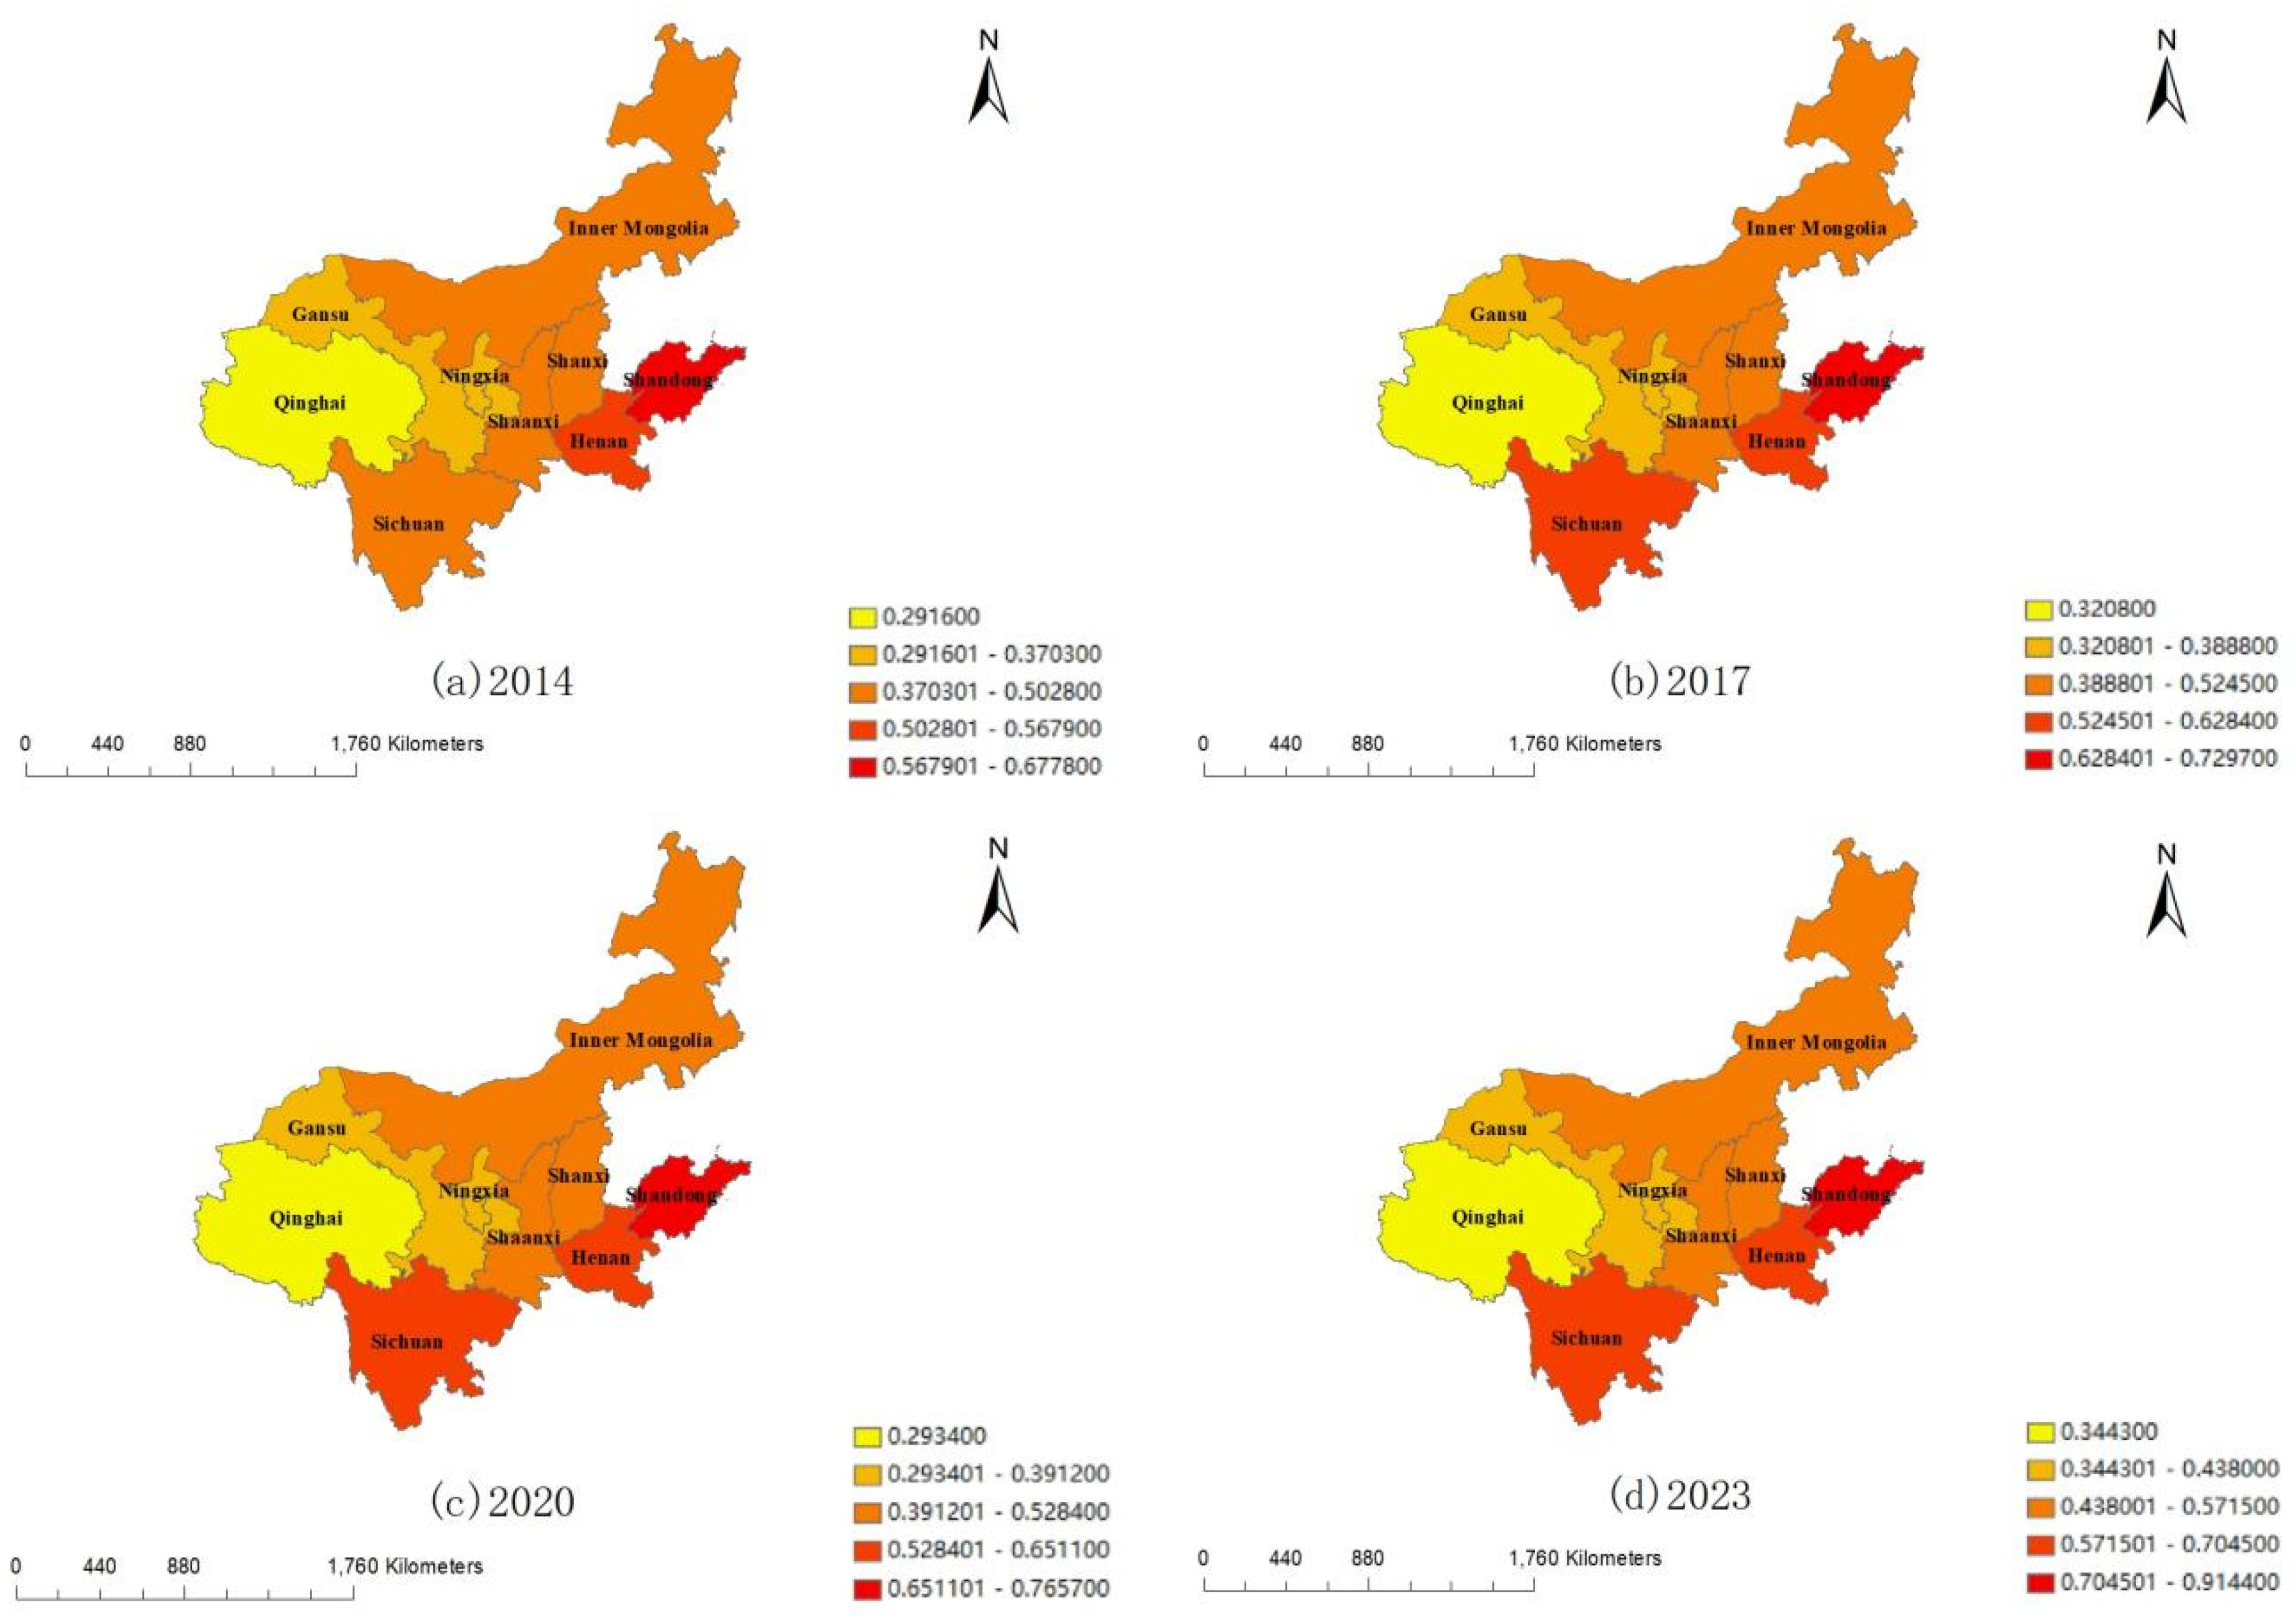
As per Figure 4, from 2014 to 2023, the YRB’s RE showed sustained growth. Yet, provincial-level development speed and paths varied significantly, highlighting the complexity and diversity of regional economic development.
Figure 4.
Analysis of comprehensive development level of RE.
From 2014 to 2023, the YRB’s RE showed steady growth, with Shandong leading in economic scale. Its regional GDP, retail sales, and goods imports and exports were consistently top-ranked. Shandong’s economic structure improved as the tertiary industry’s value-added proportion rose from 44.4% in 2014 to 53.8% in 2023, indicating a stronger service sector and more stable economic development. At the same time, Shandong’s per capita consumer expenditure and per capita regional GDP growth rate remained high, reflecting enhanced consumer spending power and a virtuous economic cycle. Henan, populous and agricultural, also had a large economy and maintained relatively fast growth. Its economic structure adjusted gradually with a decline in industrial value-added proportion and a corresponding rise in the tertiary industry’s proportion. From 2014 to 2023, Henan’s regional GDP grew by an average of 7.3% annually, above the YRB’s average, showing strong economic momentum. Its per capita consumer expenditure increased steadily from 11,000.44 yuan in 2014 to 21,010.95 yuan in 2023, indicating a significant improvement in living standards. Shanxi and Shaanxi, midstream provinces, achieved remarkable economic progress during this period. Shanxi, rich in coal resources, saw a decline in industrial value-added proportion and a gradual rise in the tertiary industry’s proportion, moving toward diversified economic development. Shaanxi, leveraging its technological and educational advantages, boosted its high-tech industry, increasing its economic scale and potential. Its regional GDP grew nearly 90% over the decade, reflecting strong economic vitality. Qinghai, Gansu, and Ningxia, with relatively weak economic foundations, also showed positive development trends. Qinghai achieved some success in ecological protection and featured industrial development, with an increase in the tertiary industry’s value-added proportion. Gansu’s economic structure adjusted gradually, with a decline in industrial value-added proportion and a rise in the tertiary industry’s proportion. Its per capita consumer expenditure grew rapidly from 9874.57 yuan in 2014 to 19,012.6 yuan in 2023. Ningxia, driven by featured agriculture and tourism, expanded its economic scale and enhanced residents’ spending power.
Regarding the spatiotemporal evolution of regional economic development, the economic pattern of the YRB has gradually expanded from the east to the west. In 2014, Shandong and Henan were ahead of other provinces in economic development, while western provinces like Qinghai, Gansu, and Ningxia lagged. However, with the advancement of the western development strategy and the YRB’s ecological protection and high-quality development strategy, the economic growth of midstream provinces like Shanxi and Shaanxi accelerated, reducing the gap with Shandong and Henan. By 2023, Shanxi and Shaanxi had approached Henan in economic development, becoming new highlights in the midstream region. Meanwhile, Qinghai, Gansu, Ningxia, and other provinces made active progress in economic structure optimization and consumption upgrades. Their economic gap with the east narrowed, and regional coordinated development gradually emerged.
Overall, in the past decade, the YRB has seen significant progress in the integrated development of GL and the RE, with continuous optimization of the economic structure and strengthening of growth drivers. However, imbalances in regional development persist. Future efforts need to focus on strengthening regional cooperation, optimizing industrial layouts, and promoting balanced and high-quality development of GL and the RE in the basin. This will better serve the national strategy of regional coordinated development.
4.2. Analysis on Spatio-Temporal Evolution of Coupling Coordination Between GL and RE
4.2.1. Overall Analysis of CCD
From 2014 to 2023, the CCD of GL and RE in the YRB generally rose steadily. But there were marked differences in the level and growth rate of coupling coordination among provinces.
As shown in Table 3, in 2014, most provinces in the YRB had a CCD in the disordered decline range. Western provinces such as Qinghai, Gansu, and Ningxia had low CCD, indicating that the synergistic development potential of GL and the RE had not been fully utilized. By 2017, some provinces, such as Shanxi and Shaanxi, began to move towards barely coordinated status, shedding their near-disorder state. This reflected progress in GL infrastructure, logistics industry optimization, and regional economic structure adjustment, gradually improving the synergistic relationship. In 2020, the CCD improved further, with Henan and Sichuan entering the initial coordination stage and Shandong reaching the intermediate coordination stage. This showed significant progress in synergistic development, with GL increasingly contributing to regional economic growth and vice versa. By 2023, Shandong reached the high-quality coordination stage, Henan moved towards intermediate coordination, and Gansu and Ningxia, though improved, remained in the near-disorder stage. This indicates persisting regional differences in coupling coordination development, with eastern provinces leading and central and western provinces lagging, but all moving towards higher-level coordination. Conversely, while western provinces like Gansu and Ningxia remain in a “near disorder” stage, their recent improvements are driven by localized defensive regulations. Ningxia’s specific laws restricting high-pollution transport in ecologically sensitive zones, combined with Gansu’s localized subsidies for agricultural cold-chain logistics, have mitigated the backwash effects, showcasing how regional micro-policies are essential to operationalizing national macro-strategies.
Table 3.
Classification of CCD of provinces along the YRB in 2014, 2017, 2020 and 2023.
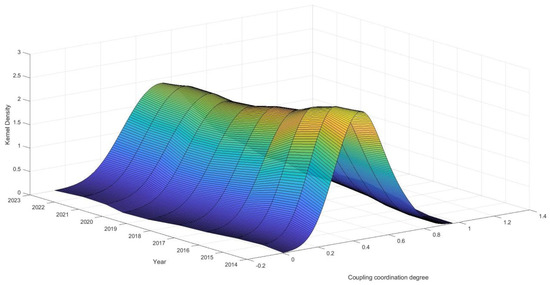
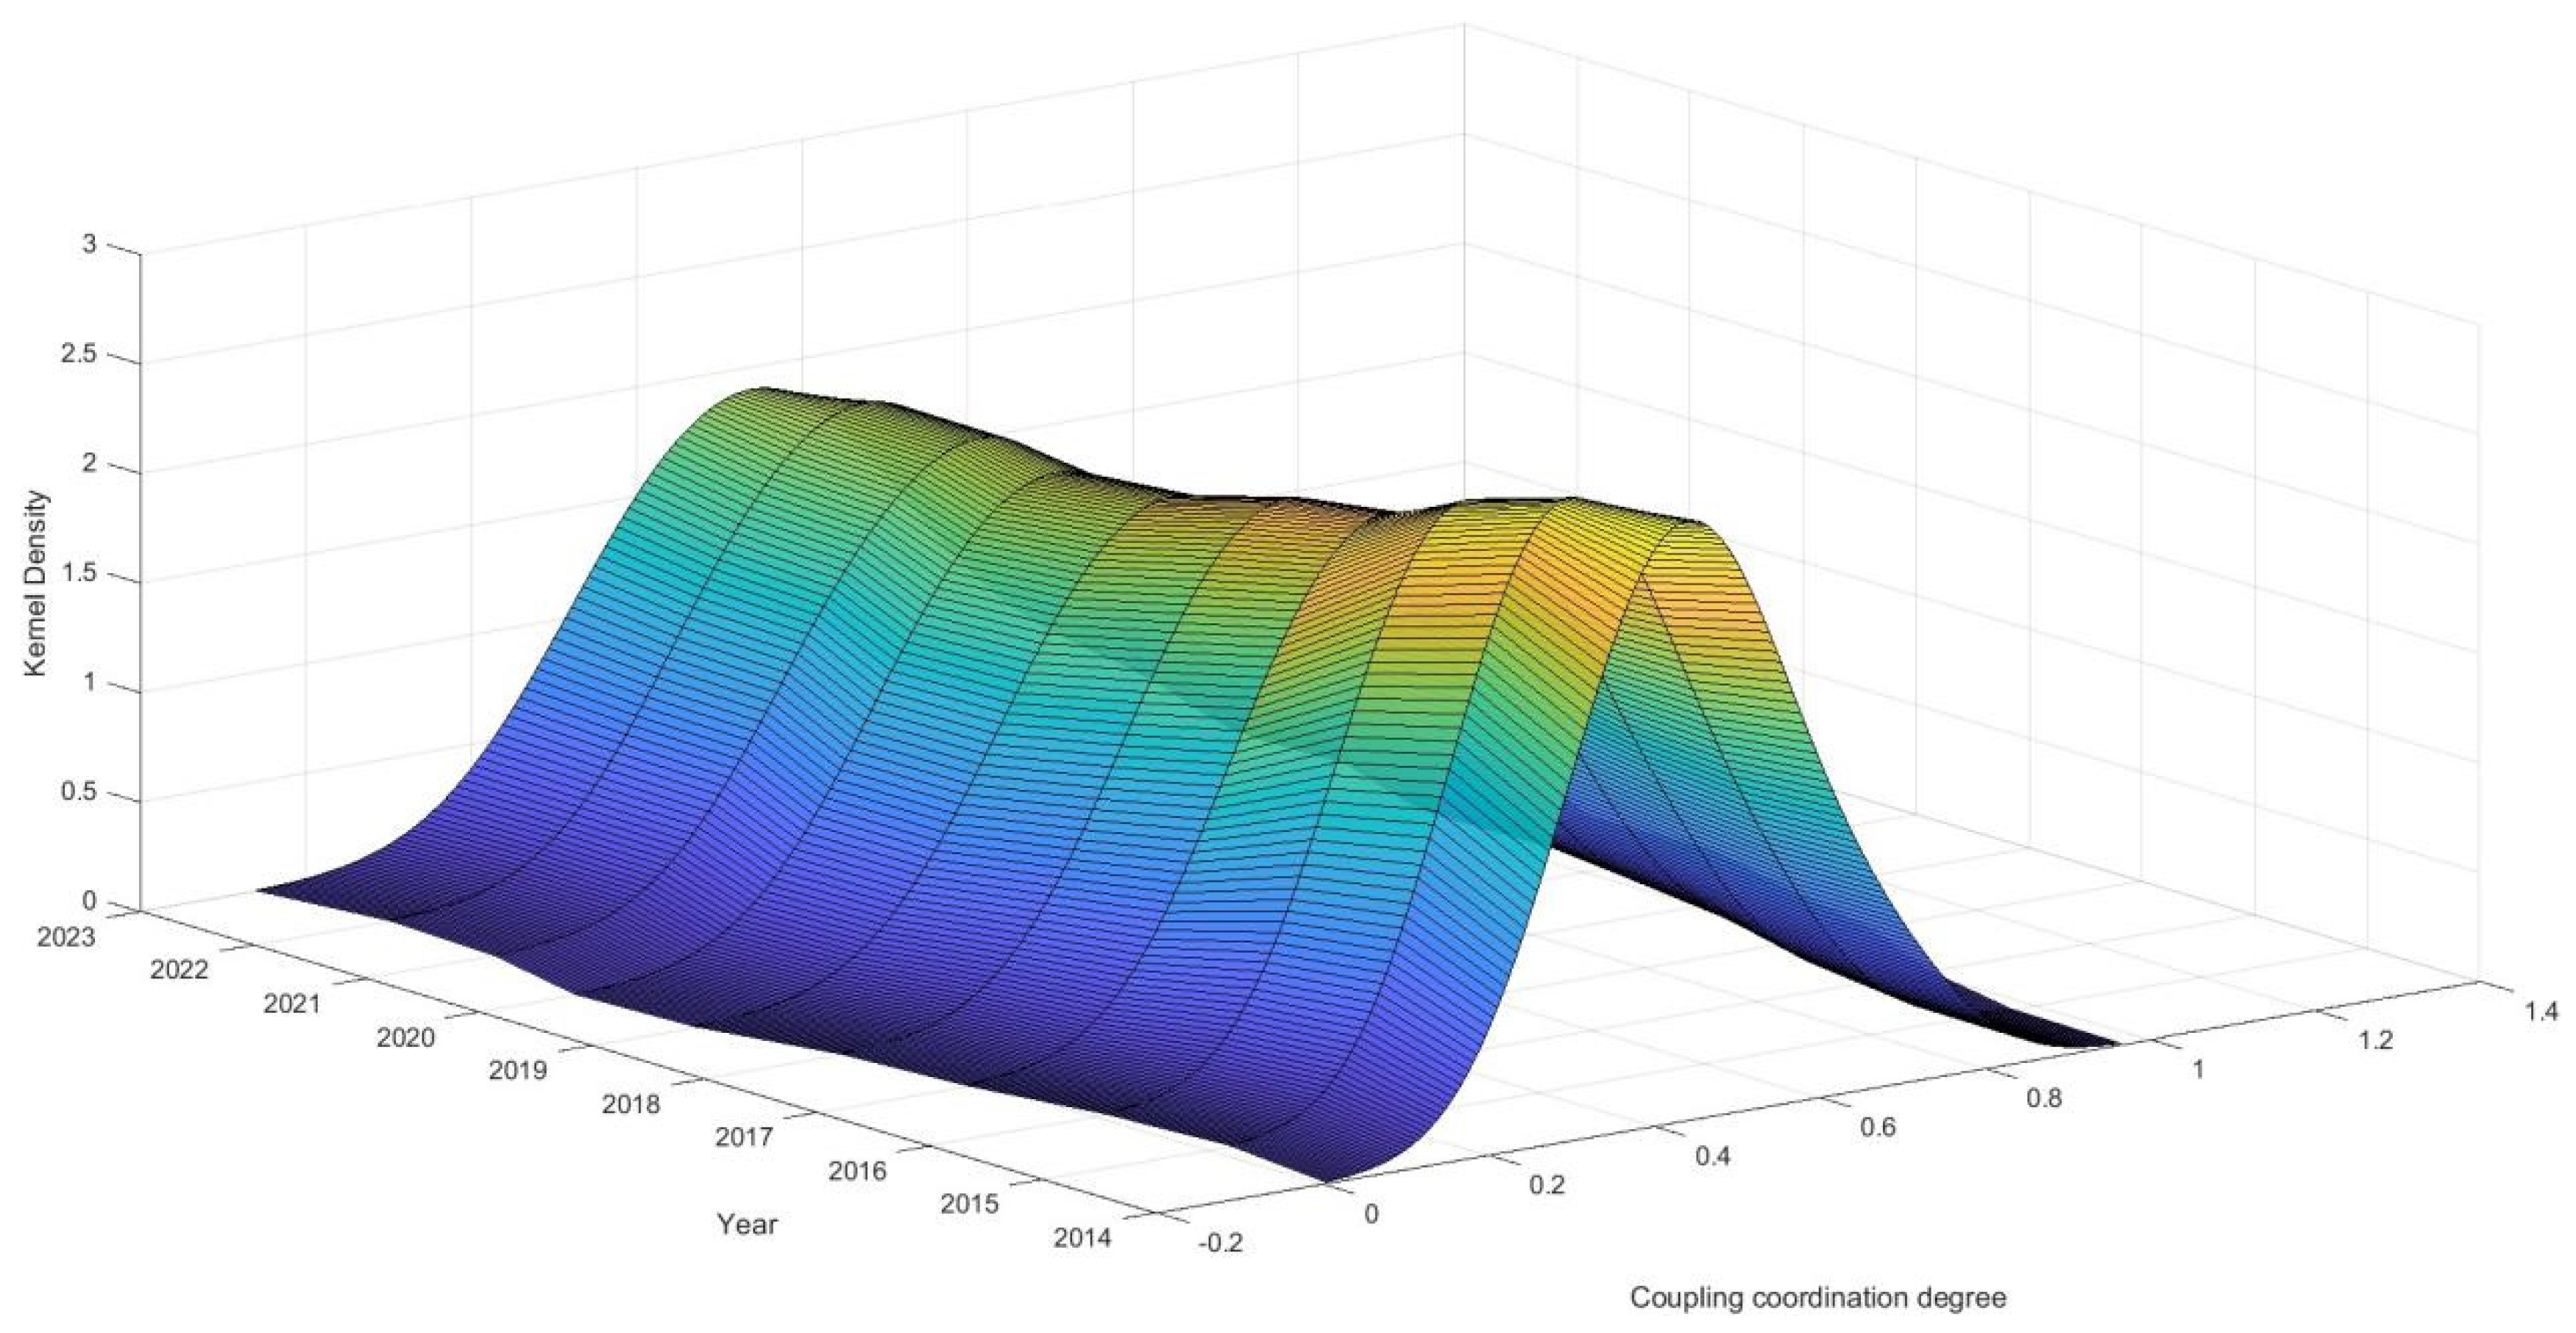
From 2014 to 2023, the YRB’s CCD jumped from “disordered decline” to “coordinated development.” This was not a linear process but showed clear phase characters, closely tied to key policy nodes. Before 2019, the promotion of coupling coordination was relatively slow, with distinct regional differences (see Figure 5 and Figure 6). In 2021, the launch of the “YRB Ecological Protection and High-Quality Development Plan” marked the comprehensive implementation of the national strategy. This became a crucial turning point for the basin’s coordination development.
Figure 5.
Analysis of CCD between GL and RE.
Figure 6.
Kernel density estimation of CCD between GL and RE.
From 2014 to 2023, the CCD of GL and RE in the YRB showed a spatial pattern of gradual improvement from the east to the west. Shandong, as an economically advanced coastal province in the east, has always led the co-development direction of GL and RE in the YRB. With the implementation of the ecological protection and high-quality development strategy of the YRB, the midstream provinces of Shanxi and Shaanxi have accelerated their development and gradually narrowed the gap with Shandong. Under policy support and regional cooperation, the upstream provinces of Qinghai, Gansu, and Ningxia have also sped up their coupling coordination development, and a trend of regional coordinated development has gradually emerged.
The improvement in coupling coordination is closely linked to provincial efforts in GL infrastructure, regional economic structural readjustment, and energy-saving investments. For instance, Inner Mongolia has made great progress in reducing the energy consumption and carbon emission intensity of its logistics industry, strongly supporting the improvement of its coupling coordination. Shanxi and Shaanxi stand out in industrial structure optimization and increasing the proportion of tertiary industry value-added, promoting the co-development of RE and GL. Qinghai, Gansu, and Ningxia have achieved breakthroughs in GL infrastructure, such as improving road network density and increasing postal outlets, laying a foundation for enhanced coupling coordination.
From 2014 to 2023, the YRB’s CCD of GL and RE shifted from disordered decline to coordinated development. Despite regional gaps, an overall positive trend is evident. Looking ahead, provinces in the YRB should strengthen cooperation, share experiences, and increase investment in the co-development of GL and the RE. This will drive higher-quality and more sustainable regional coordinated development.
4.2.2. Analysis of Time Variation in CCD
As shown in the kernel density estimation of the CCD of GL and RE in Figure 6, the CCD of GL and RE in the YRB from 2014 to 2023 presents obvious dynamic evolution characteristics in the time dimension, which can be divided into the following stages:
In 2014, the kernel density curve of the CCD of GL and RE in the YRB had a bimodal distribution. There were two main clusters: high values in economically advanced provinces like Shandong and Henan (0.6778 and 0.5679), and low values in western provinces like Qinghai, Gansu, and Ningxia (around 0.30). This reflected significant regional disparities and low, dispersed coordination levels. At this stage, GL concepts were not widely adopted, infrastructure lagged, and synergy between logistics and the economy was limited. From 2017, the kernel density curve shifted right and became steeper, with the bimodal feature weakening. This indicated improving coordination and narrowing regional gaps. By 2019, Shandong’s coordination index rose to 0.7621, Henan’s to 0.6572, and western provinces also improved, with most provinces entering the 0.4–0.6 transition zone. During this period, the “Thirteenth Five-Year Plan” and YRB strategies drove GL infrastructure and economic restructuring, unlocking synergy potential. After 2020, the curve continued its rightward shift and steepened further, peaking in the 0.6–0.7 initial coordination range. By 2023, Shandong reached 0.9144, Henan 0.7045, and Sichuan neared 0.6707. Gansu and Ningxia also improved significantly. This showed a positive trend towards regional coordination. During this phase, global green development trends and China’s “dual-carbon” strategy spurred provincial efforts in GL innovation and policy support. Logistics companies accelerated their green transition, enhancing the synergy between GL and the RE and steadily increasing the CCD.
Between 2014 and 2023, the kernel density curve transitioned from a bimodal to a unimodal distribution, with its peak gradually shifting to the right. This suggests that the coupling coordination between GL and RE in the YRB has grown increasingly balanced and stable, accompanied by a reduction in regional disparities. The increasing height of the curve suggests greater concentration in the coupling coordination data, reflecting strengthened synergy and interaction between GL and RE. Overall, the YRB is progressing toward coordinated GL and RE development.
From 2014 to 2023, the CCD of GL and RE in the YRB showed a dynamic evolution from slow to rapid and then to stable growth, indicating deepening synergy and a foundation for high-quality development. Future efforts should focus on further enhancing this synergy, reducing regional disparities, and elevating the CCD to higher levels.
4.3. CCD Spatial Autocorrelation Analysis
4.3.1. Global Autocorrelation Analysis
As can be seen from Table 4, during the period of 2014–2023, the global Moran’s index (I value) of the CCD of GL and RE in the YRB were positive, indicating a certain spatial positive correlation. That is, high and low values tend to cluster spatially. For each year, the Z-value exceeds 1.96, and the p-value is below 0.05. This shows that the results significantly deviate from a random distribution, further confirming the spatial positive correlation.
Table 4.
Global Moran index of CCD between GL and RE.
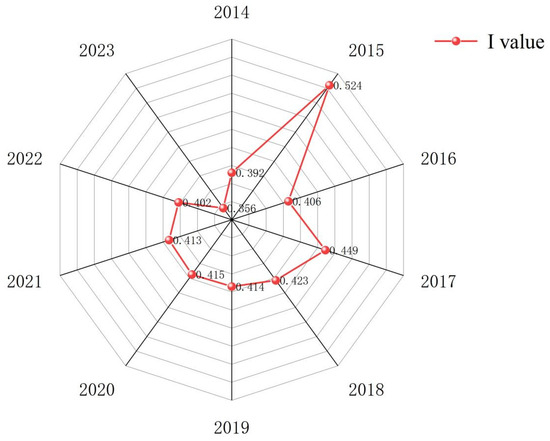
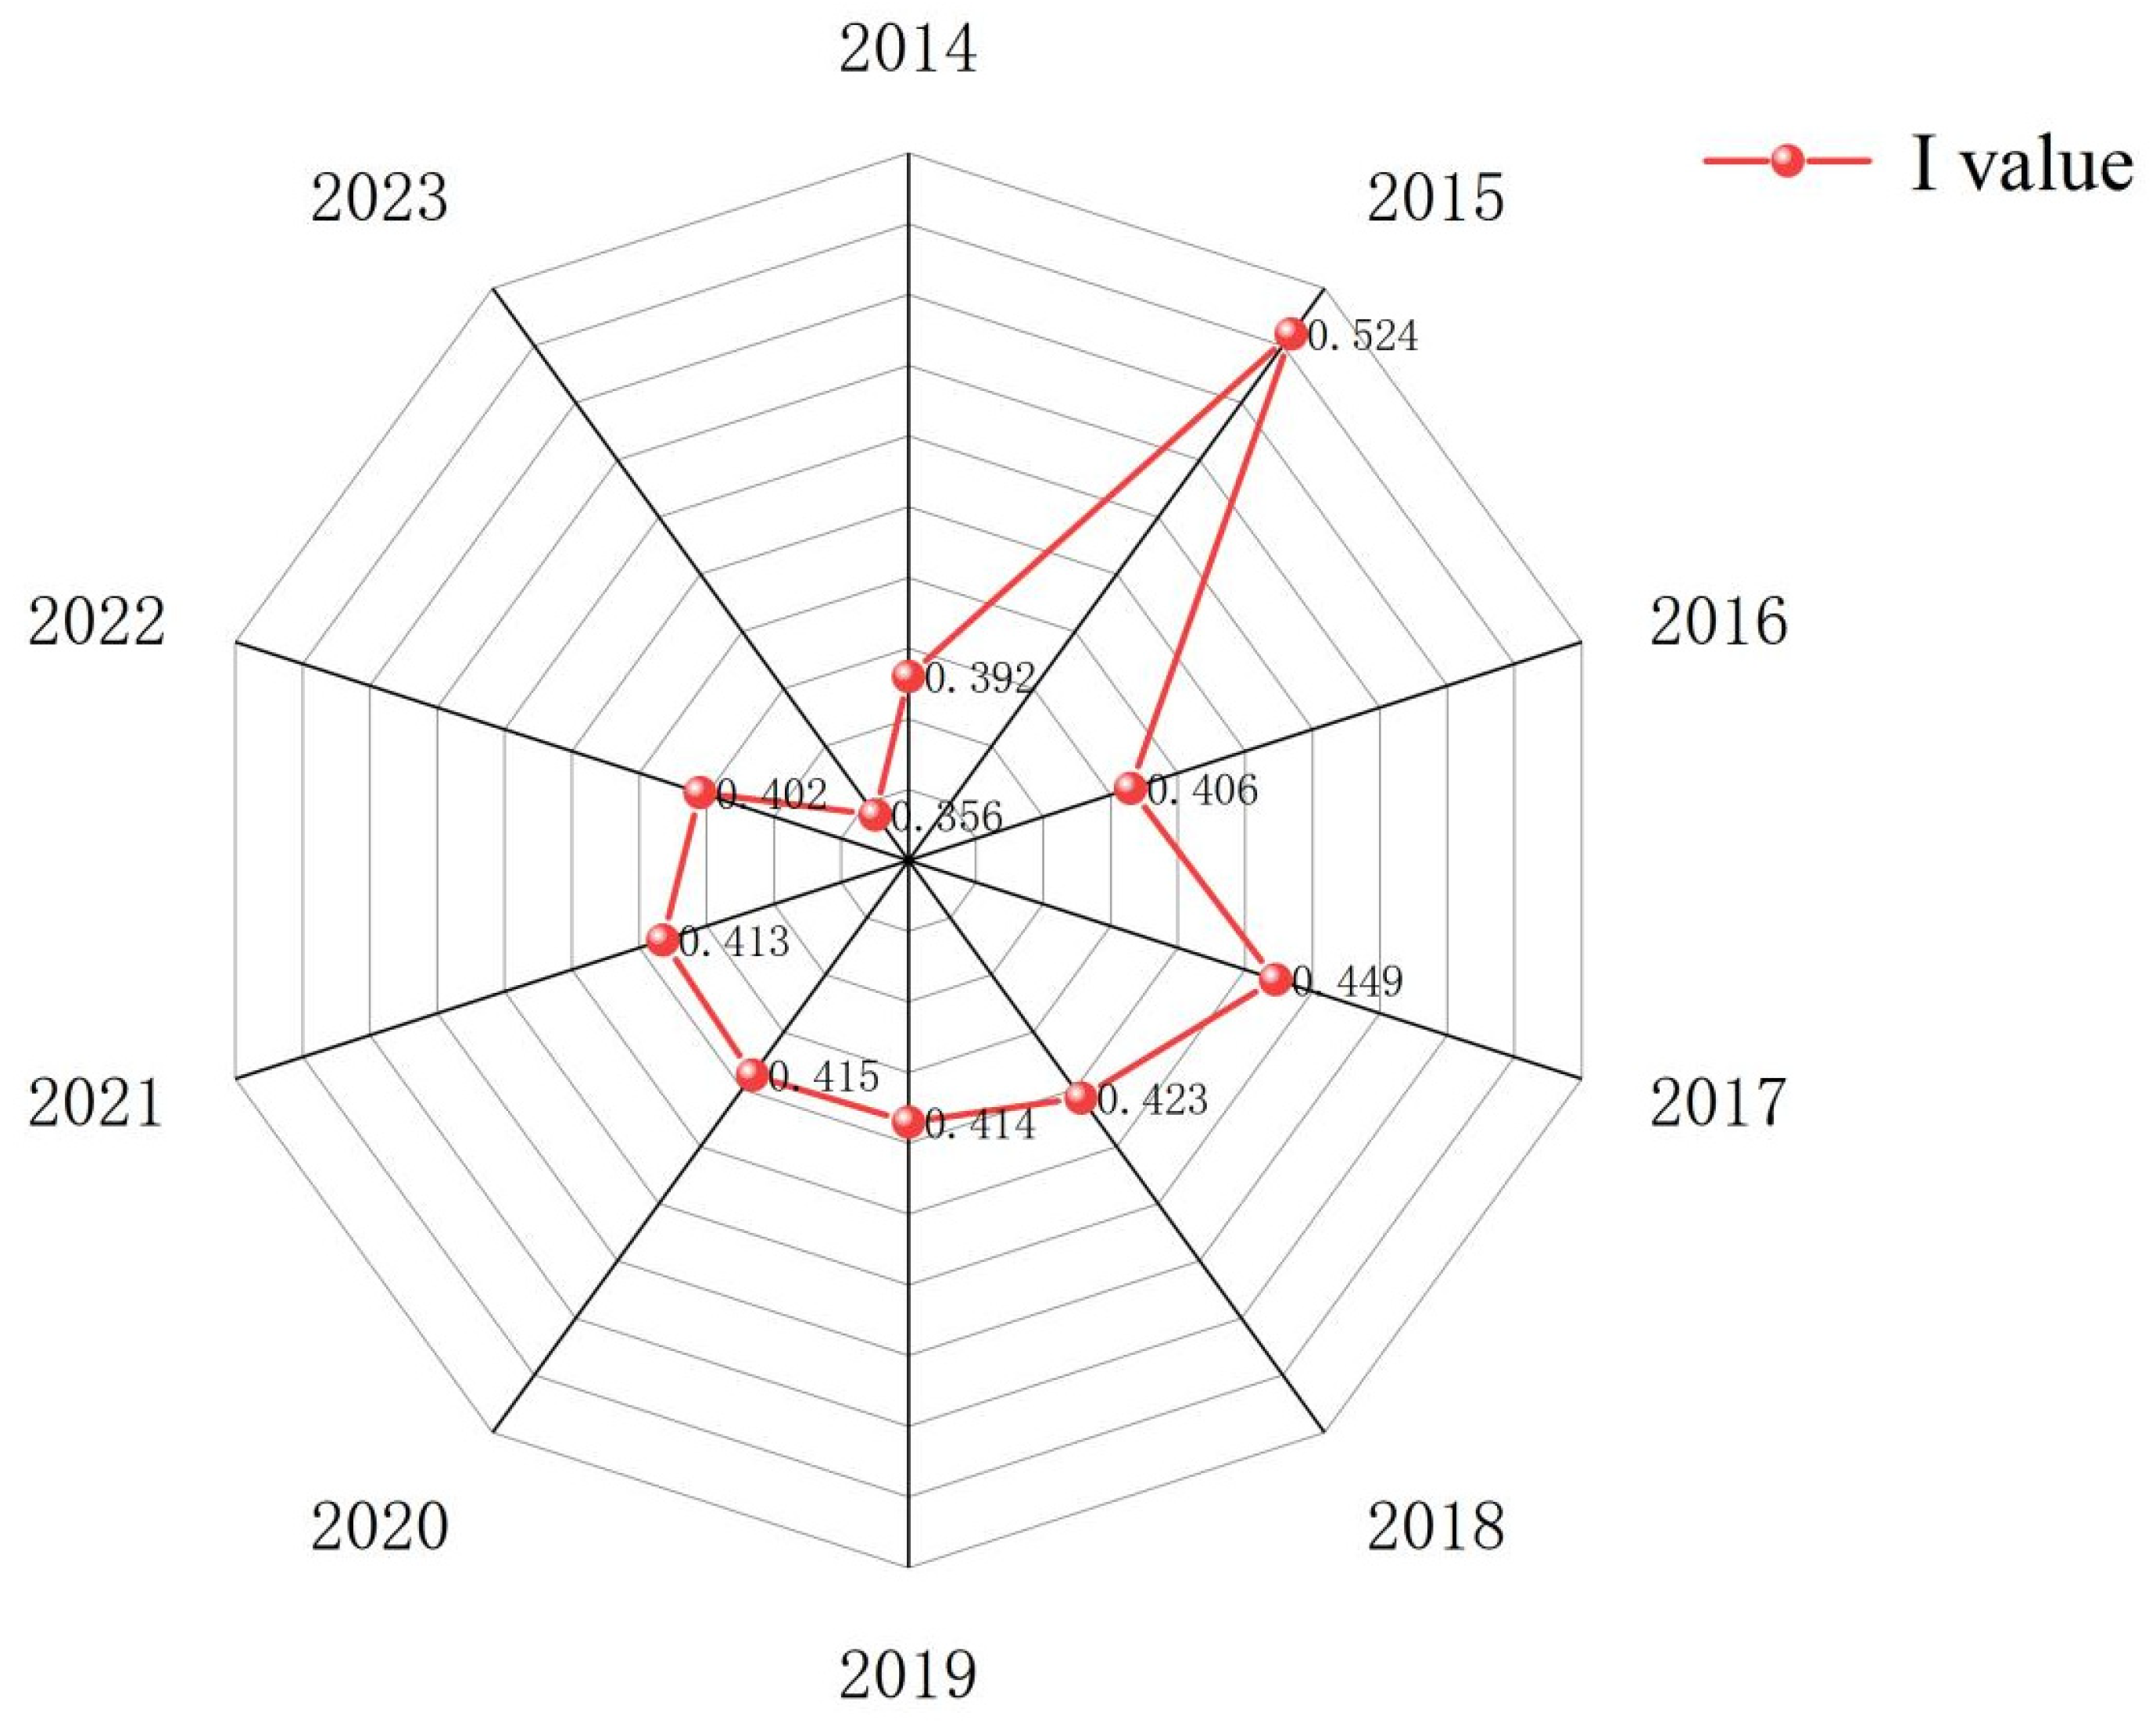
In 2014, the global Moran’s I was 0.392 and rose to 0.524 in 2015, showing stronger spatial positive correlation. This might be due to growing national policy support for GL, boosting regional coordination development and clustering. In 2016, the I-value slightly dropped to 0.406 due to uneven regional development and temporary fluctuations in clustering. In 2017, it rose again to 0.449 as the YRB’s ecological protection strategy enhanced regional collaboration and clustering. Between 2018 and 2019, the I-values were 0.423 and 0.414, showing minor fluctuations but remaining high, indicating persistent spatial clustering of coupling coordination. From 2020 to 2023, the I-value declined yearly from 0.415 to 0.356. This could be as regional differences narrowed and factors like economic restructuring and policy changes made the spatial distribution of coupling coordination more scattered.
As shown in Figure 7, the global Moran’s I time-distribution diagram visually presents the dynamic changes from 2014 to 2023. Overall, the global Moran’s I showed an upward trend from 2014 to 2017, indicating enhanced spatial clustering of the CCD. This was closely related to national policy guidance and strengthened regional cooperation, which fostered synergies in GL infrastructure and industrial co-development, making high-and low-value areas more spatially clustered. After 2017, the global Moran’s I entered a fluctuating downward phase. This suggests that as GL and the RE developed, coupling coordination improved across regions, reducing regional disparities and weakening spatial clustering. This is because GL and regional economic growth gradually improved infrastructure and industrial synergies. Supported by policies, the central and western regions accelerated their development, lessening the original clustering features and making the distribution of coupling coordination more balanced.
Figure 7.
Global Moran index time distribution.
From 2014 to 2023, the global Moran’s I index of the CCD of GL and RE in the YRB showed a gradual decline, indicating a reduction in spatial positive correlation. This means that the coupling coordination of GL and RE is shifting from a clustered distribution towards more balanced development. This reflects that the YRB is progressing towards greater regional balance and coordination in the co-development of GL and the RE. In the future, it will be necessary to enhance inter-regional cooperation and resource allocation to achieve higher-level equilibrium in coupling coordination within a broader area.
4.3.2. Local Autocorrelation Analysis
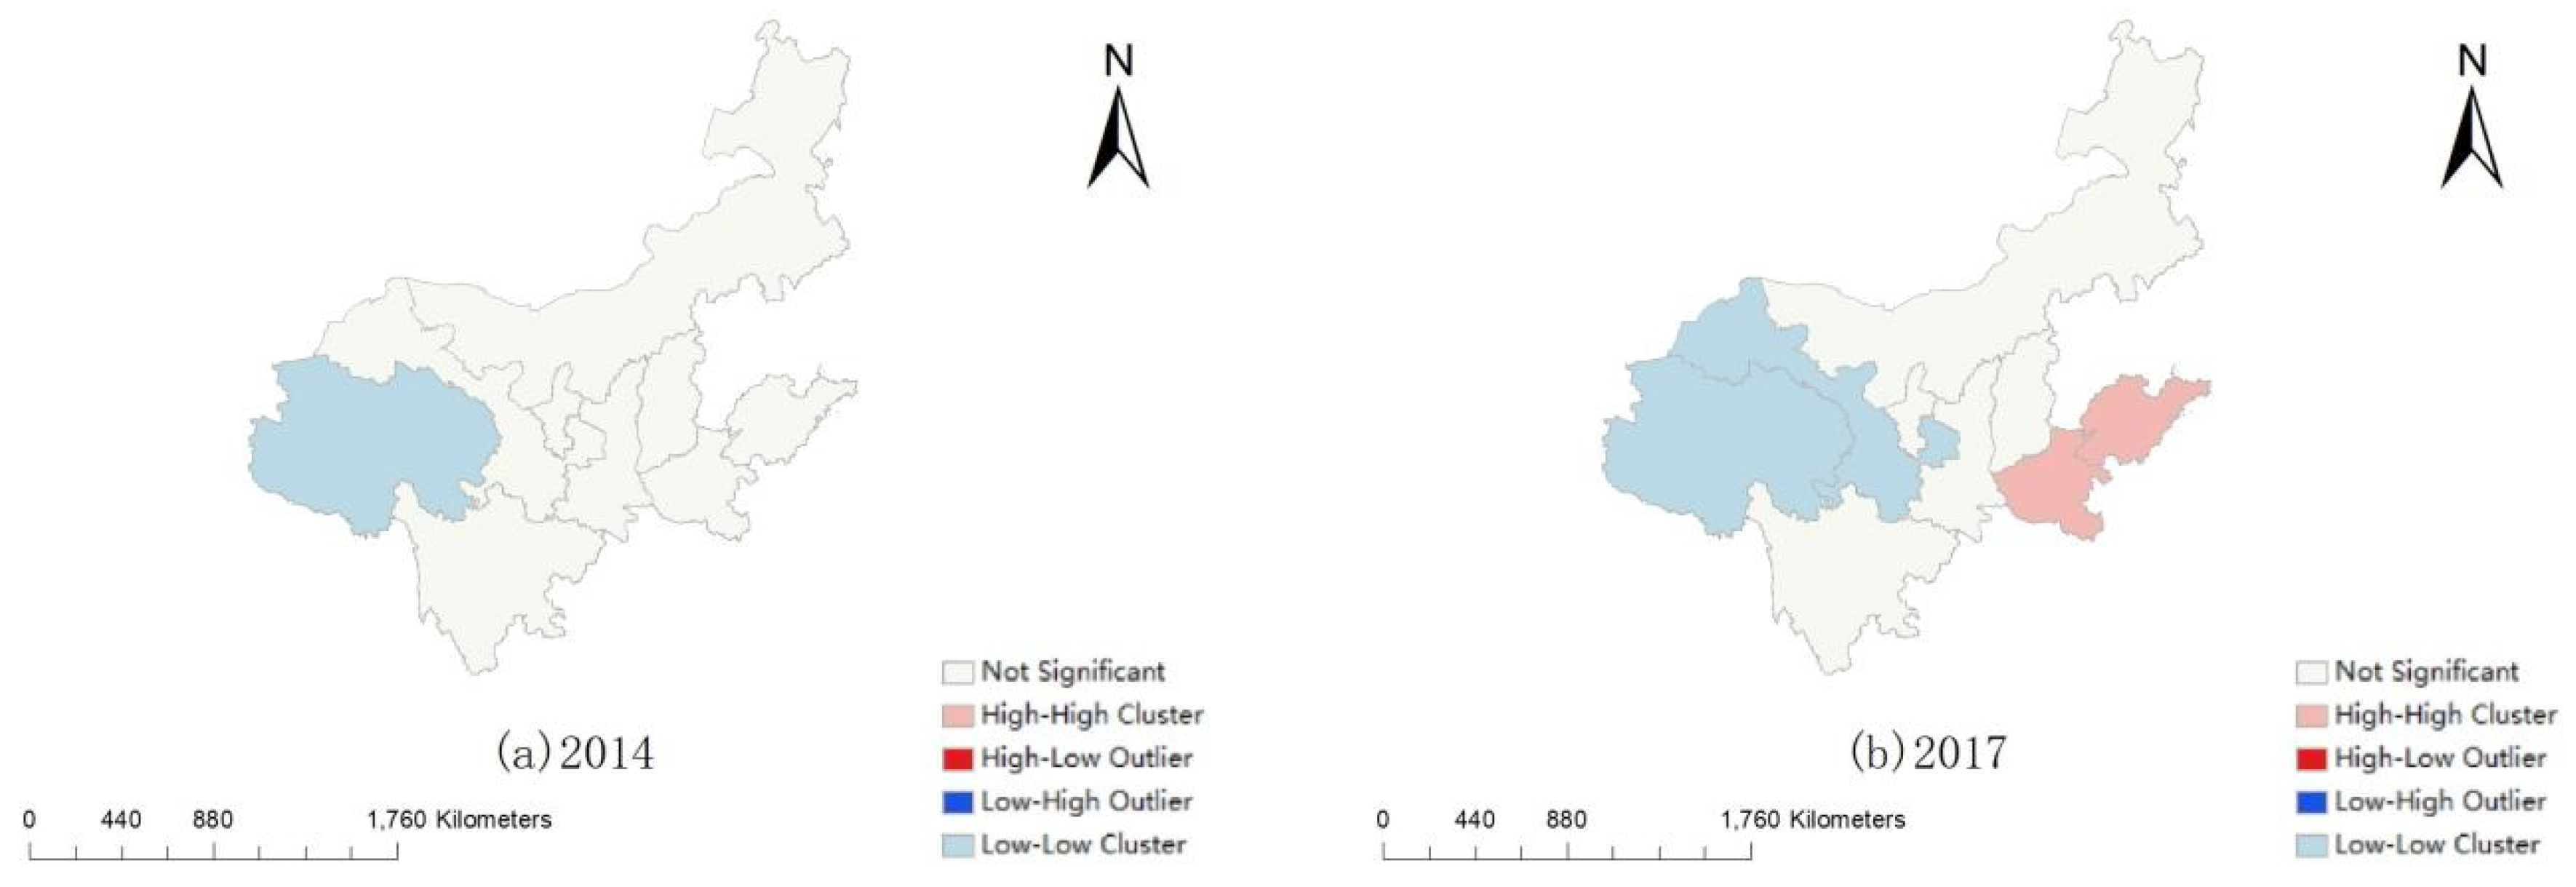
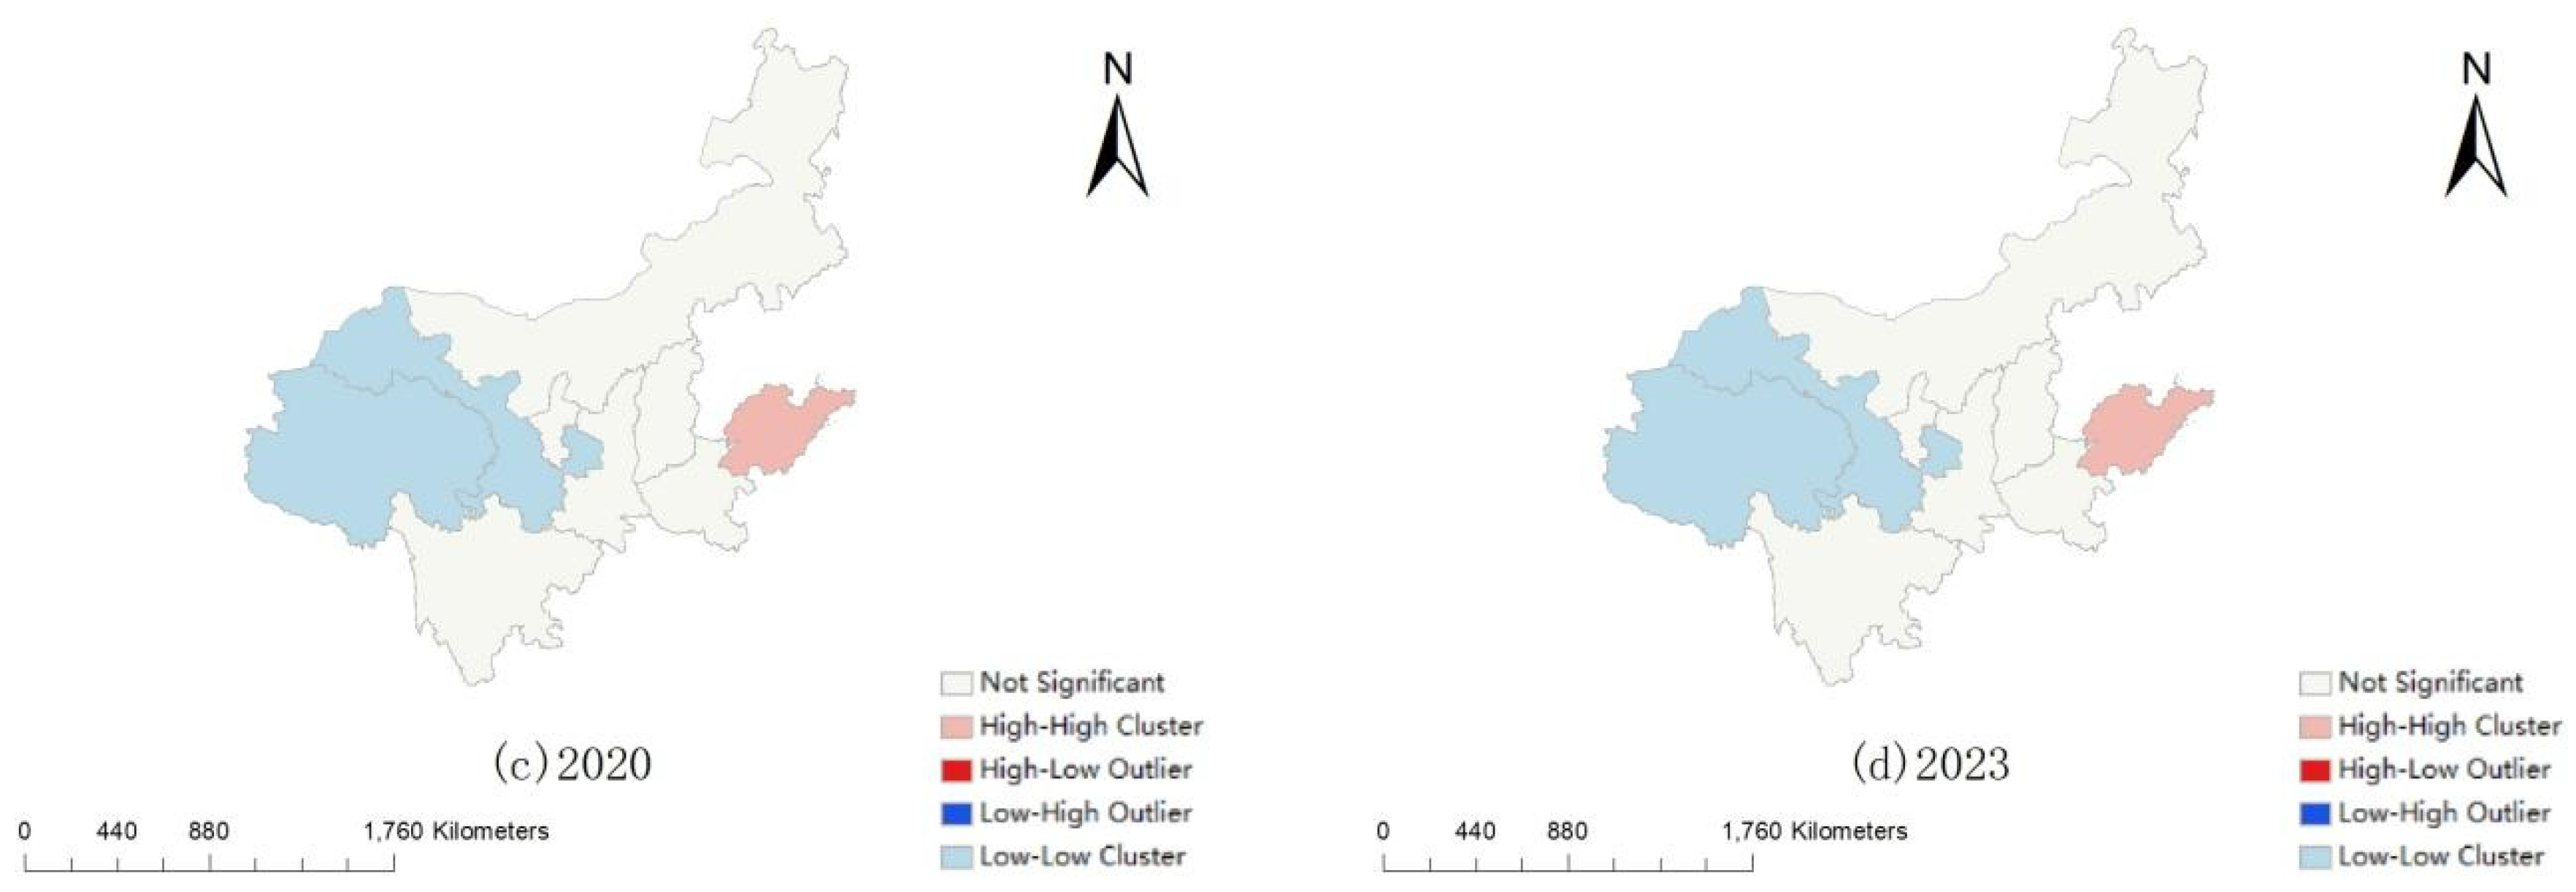
As shown in Figure 8, the evolution of local spatial association patterns reflects shifts in regional interaction mechanisms under policy guidance. In the early phase (2014–2017), significant “high–high” (Shandong-Henan) and “low–low” (Qinghai, Gansu, Ningxia) clusters coexisted, reflecting a core–periphery spatial differentiation. After the implementation of the “YRB Ecological Protection and High-Quality Development Plan,” there was a marked increase in “low–high” (e.g., Inner Mongolia adjacent to Shanxi/Shaanxi) and “high–low” (e.g., Shaanxi adjacent to Gansu) patterns. This change confirms the effectiveness of policy interventions. National strategies, through improved transport networks (e.g., the Xi’an–Yan’an high-speed railway, Yellow River-side highways), industrial gradient-shift policies (e.g., eastern-enterprise westward-shift with green logistics requirements), and ecological compensation mechanisms, have reformed regional spatial linkages. They have strengthened the diffusion effect of growth poles and weakened the backwash effect. This has enabled peripheral regions (e.g., Inner Mongolia, Gansu) to more effectively receive development spillovers from core areas (e.g., Shanxi, Shaanxi), promoting a more balanced and coordinated evolution of spatial association patterns.
Figure 8.
Local autocorrelation analysis of CCD.
From 2014 to 2023, the local spatial association patterns of the CCD of GL and RE in the YRB were marked by coexisting “high–high” and “low–low” clusters. Over time, “low–high” and “high–low” patterns increased, indicating tighter regional links and narrowing development gaps. This shift towards more balanced and coordinated spatial patterns has laid a solid foundation for achieving high-quality co-development of GL and the RE in the YRB.
4.4. Obstacle Factor Research
4.4.1. Study and Analysis of Obstacles
From Table 5 and Table 6, there are obvious inter-provincial differences in the obstacle factors of GL and RE. These reflect the local characteristics and problems in their development. The following is a detailed analysis of these obstacle factors.
Table 5.
Top 3 obstacle factors and their degree of obstacles in GL in each province.
Table 6.
Top 3 obstacle factors and their degree of obstacles in GL in each province.
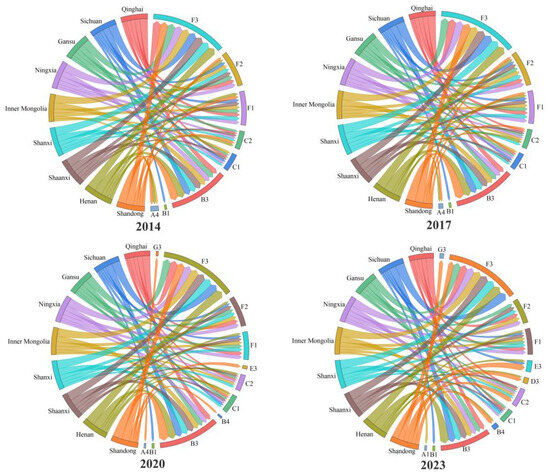
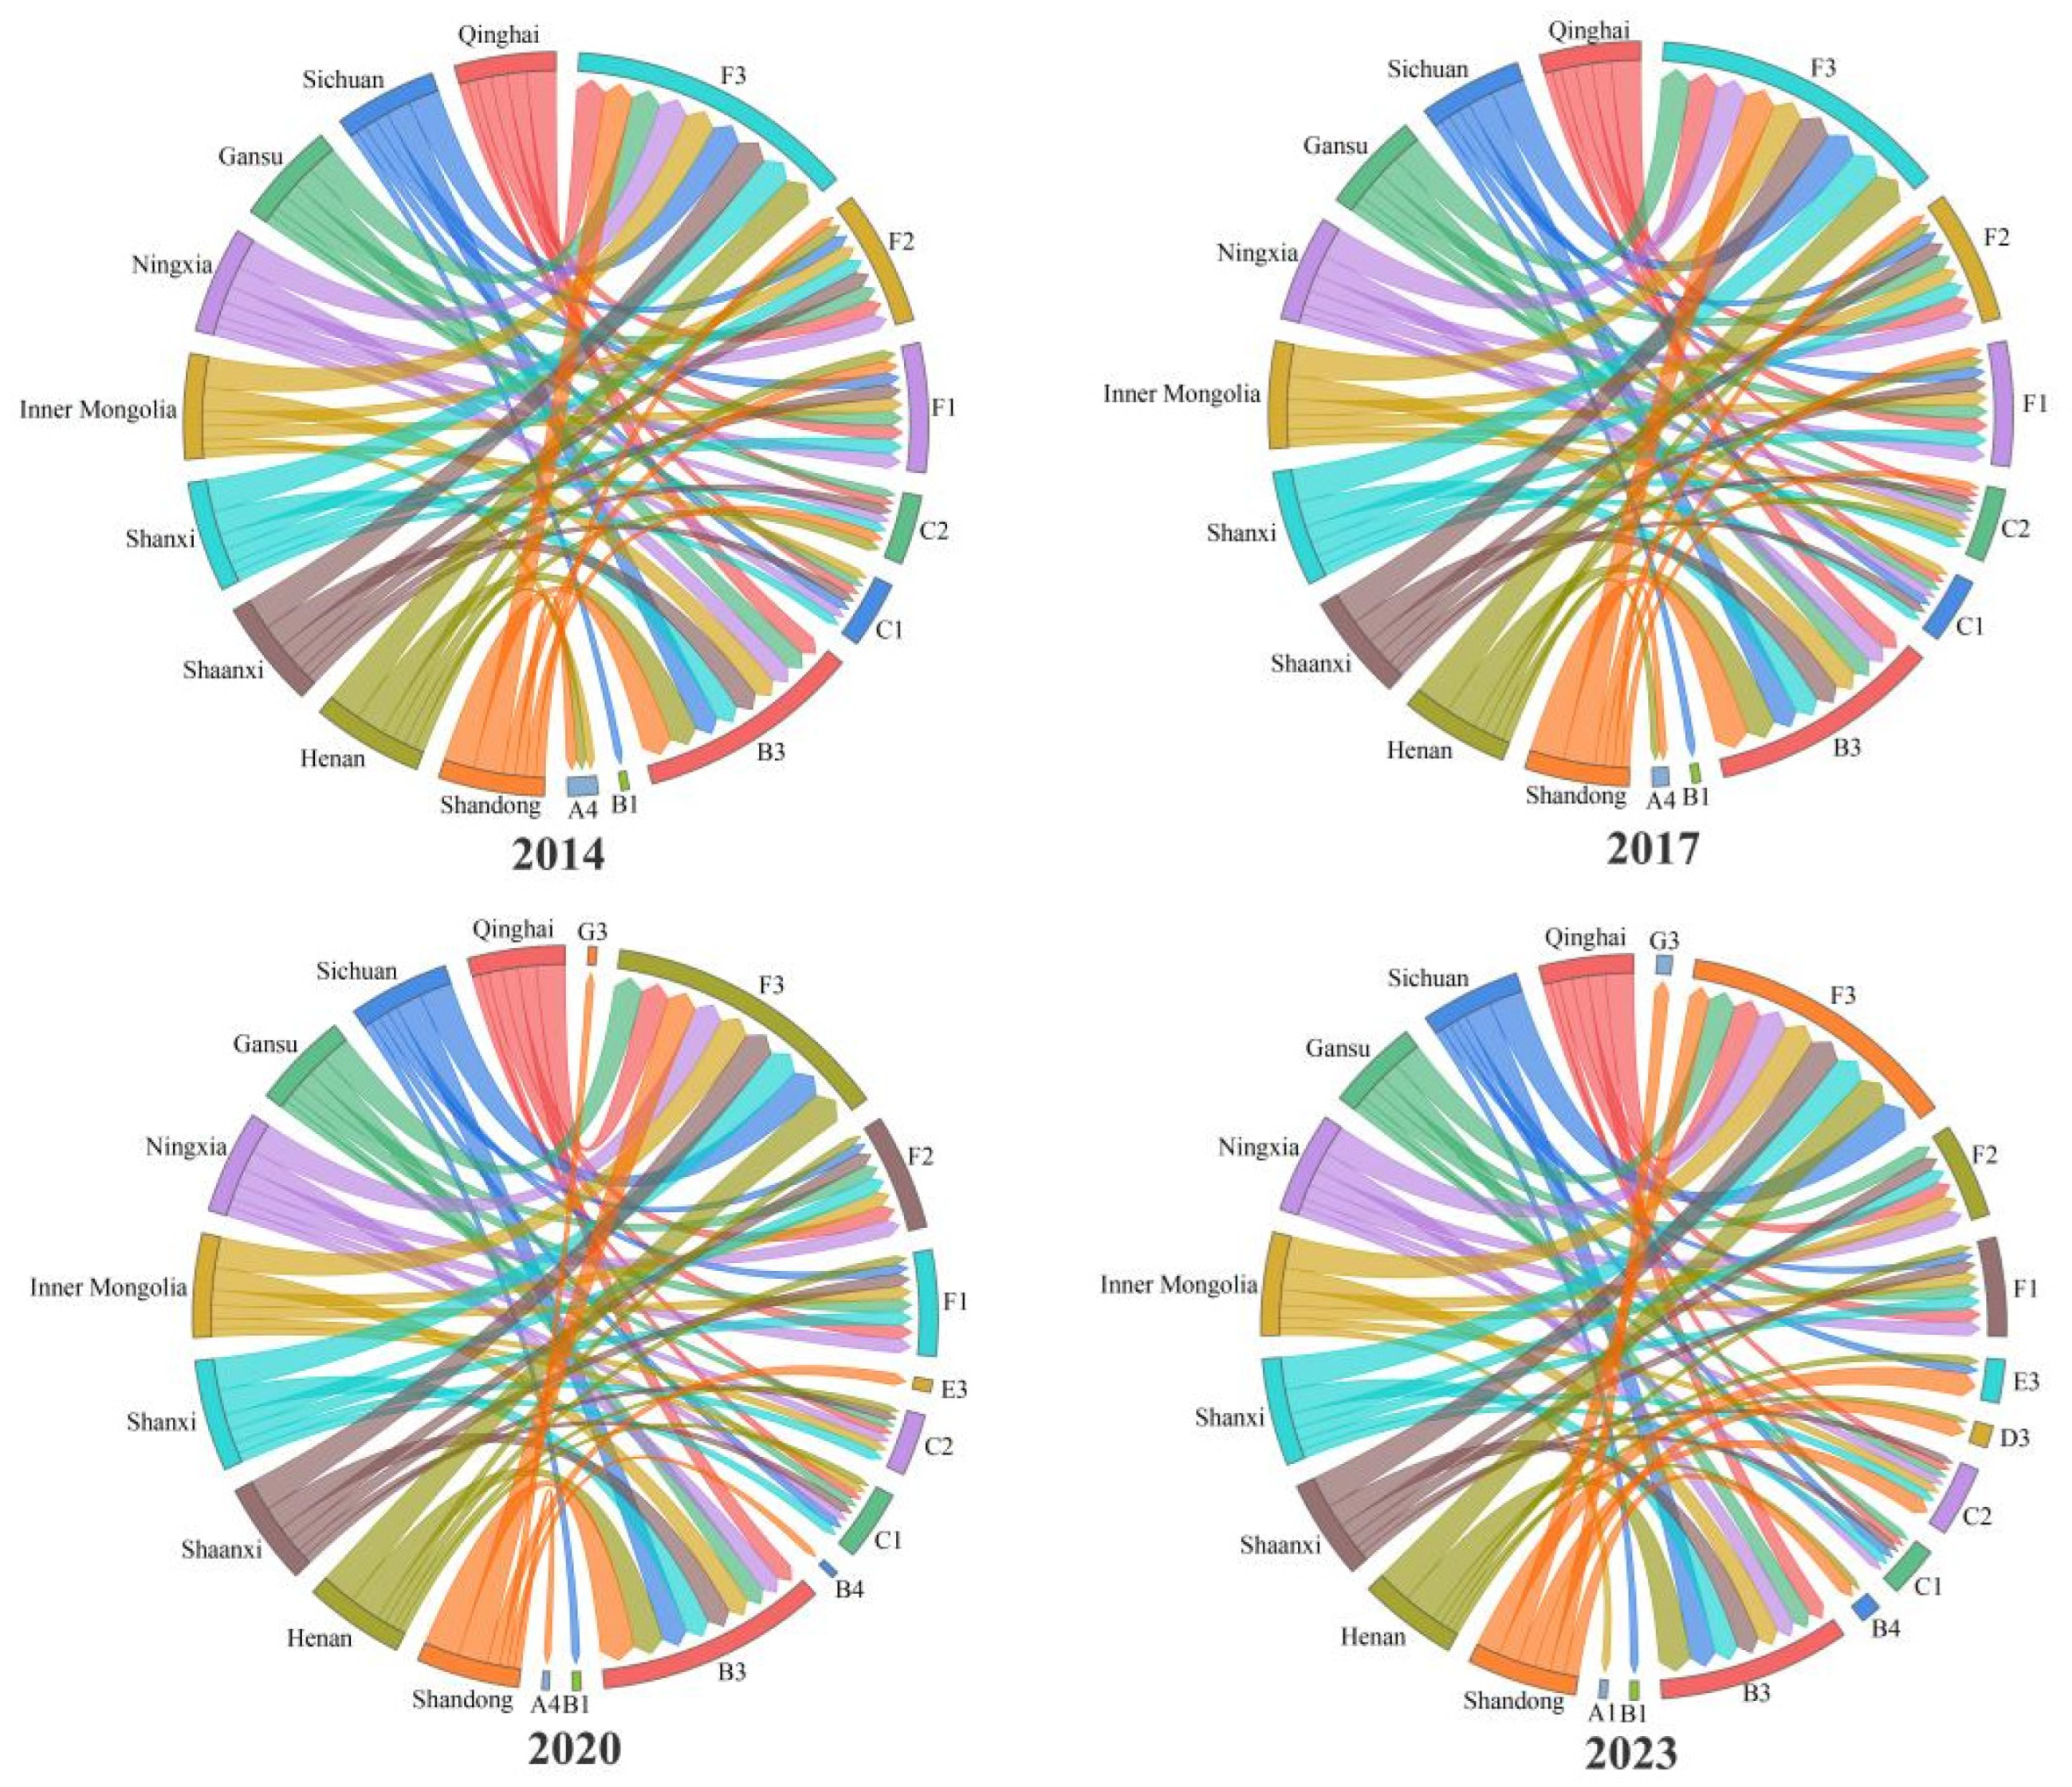
The barrier-factor analysis pinpoints key areas for policy intervention. In GL, the core barriers are B3 deficiencies and shortfalls in C1 and C2, restricting its boost to the RE. For the RE, bottlenecks lie in slow E optimization (especially industrial greening), weak foreign trade (F3), and insufficient F and vitality (F1, F2, G), reducing its support for GL. Notably, the “Planning Outline”’s key areas, such as “strengthening water resource constraints” to reduce logistics energy consumption (D1, D2) and “fostering new growth drivers” to enhance E2 and consumer potential (G1), align closely with the main barrier factors. After 2021, significant improvements in D (energy-saving technology adoption) and E (service-sector share) in Shandong and Henan, and the central and western regions’ catch-up efforts in C (logistics investment) and F3 (foreign-trade platform development), confirm policy interventions’ effectiveness in overcoming barriers and enhancing the two-way logistics–economy interaction.
From Figure 9, from 2014 to 2023, the main obstacle factors and their degrees of obstacles in GL and RE showed certain dynamic changes.
Figure 9.
Major obstacle factors and their degrees of GL and RE in 2014, 2017, 2020 and 2023 (A1, A4, B1, B3, B4, C1, C2, D3, E3, F1, F2, F3, G3. The meanings are detailed in Table 2).
Changes in GL obstacle factors: B3 has always been the main obstacle factor, with its obstruction degree fluctuating slightly in different years. The obstruction degree of C1 and C2 has been gradually increasing, indicating that the economic benefits and investment scale of GL are becoming more prominent. Additionally, the obstruction degree of indicators such as A4 and D4 has also increased, showing that the infrastructure construction and sustainable development ability of GL still need to be enhanced.
Changes in regional economic obstacle factors: The obstruction degree of F3 has been relatively high over the years, yet its changing trend has been quite stable. The obstruction degree of F2 and F1 has declined after 2017, signaling some progress in regional economic development in consumption and industry. However, the obstruction degree of E3 has gradually increased, suggesting that economic structure optimization still needs to be further advanced.
Overall, the obstacle factors mainly focus on the following aspects:
- (1)
- The high obstacle degree of indicators B2, C1, and C2 reflects insufficient economic benefits and investment in GL. To address this, it is essential to strengthen technological innovation, optimize management processes, and increase investment.
- (2)
- The high obstacle degree of F3, F2, and E3 indicates that the RE needs improvement in openness, consumer markets, and industrial development. Promoting economic structure optimization and enhancing economic openness are crucial for high-quality regional economic development.
- (3)
- There is a development gap between the eastern coastal provinces (e.g., Shandong and Henan) and the western provinces (e.g., Qinghai, Gansu, and Ningxia) in GL and regional economic development. Enhancing regional cooperation, sharing experiences, and optimizing resource allocation are important ways to reduce this gap.
4.4.2. Analysis of Obstacle and Characteristics
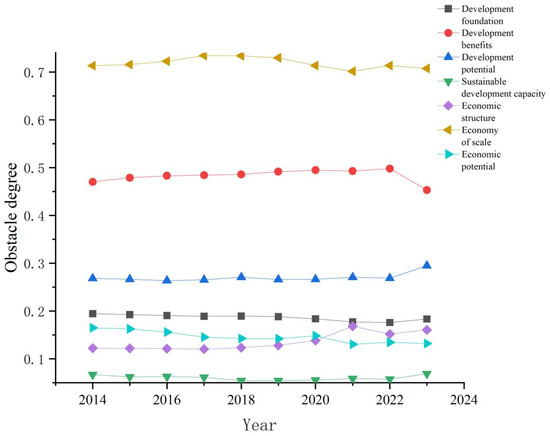
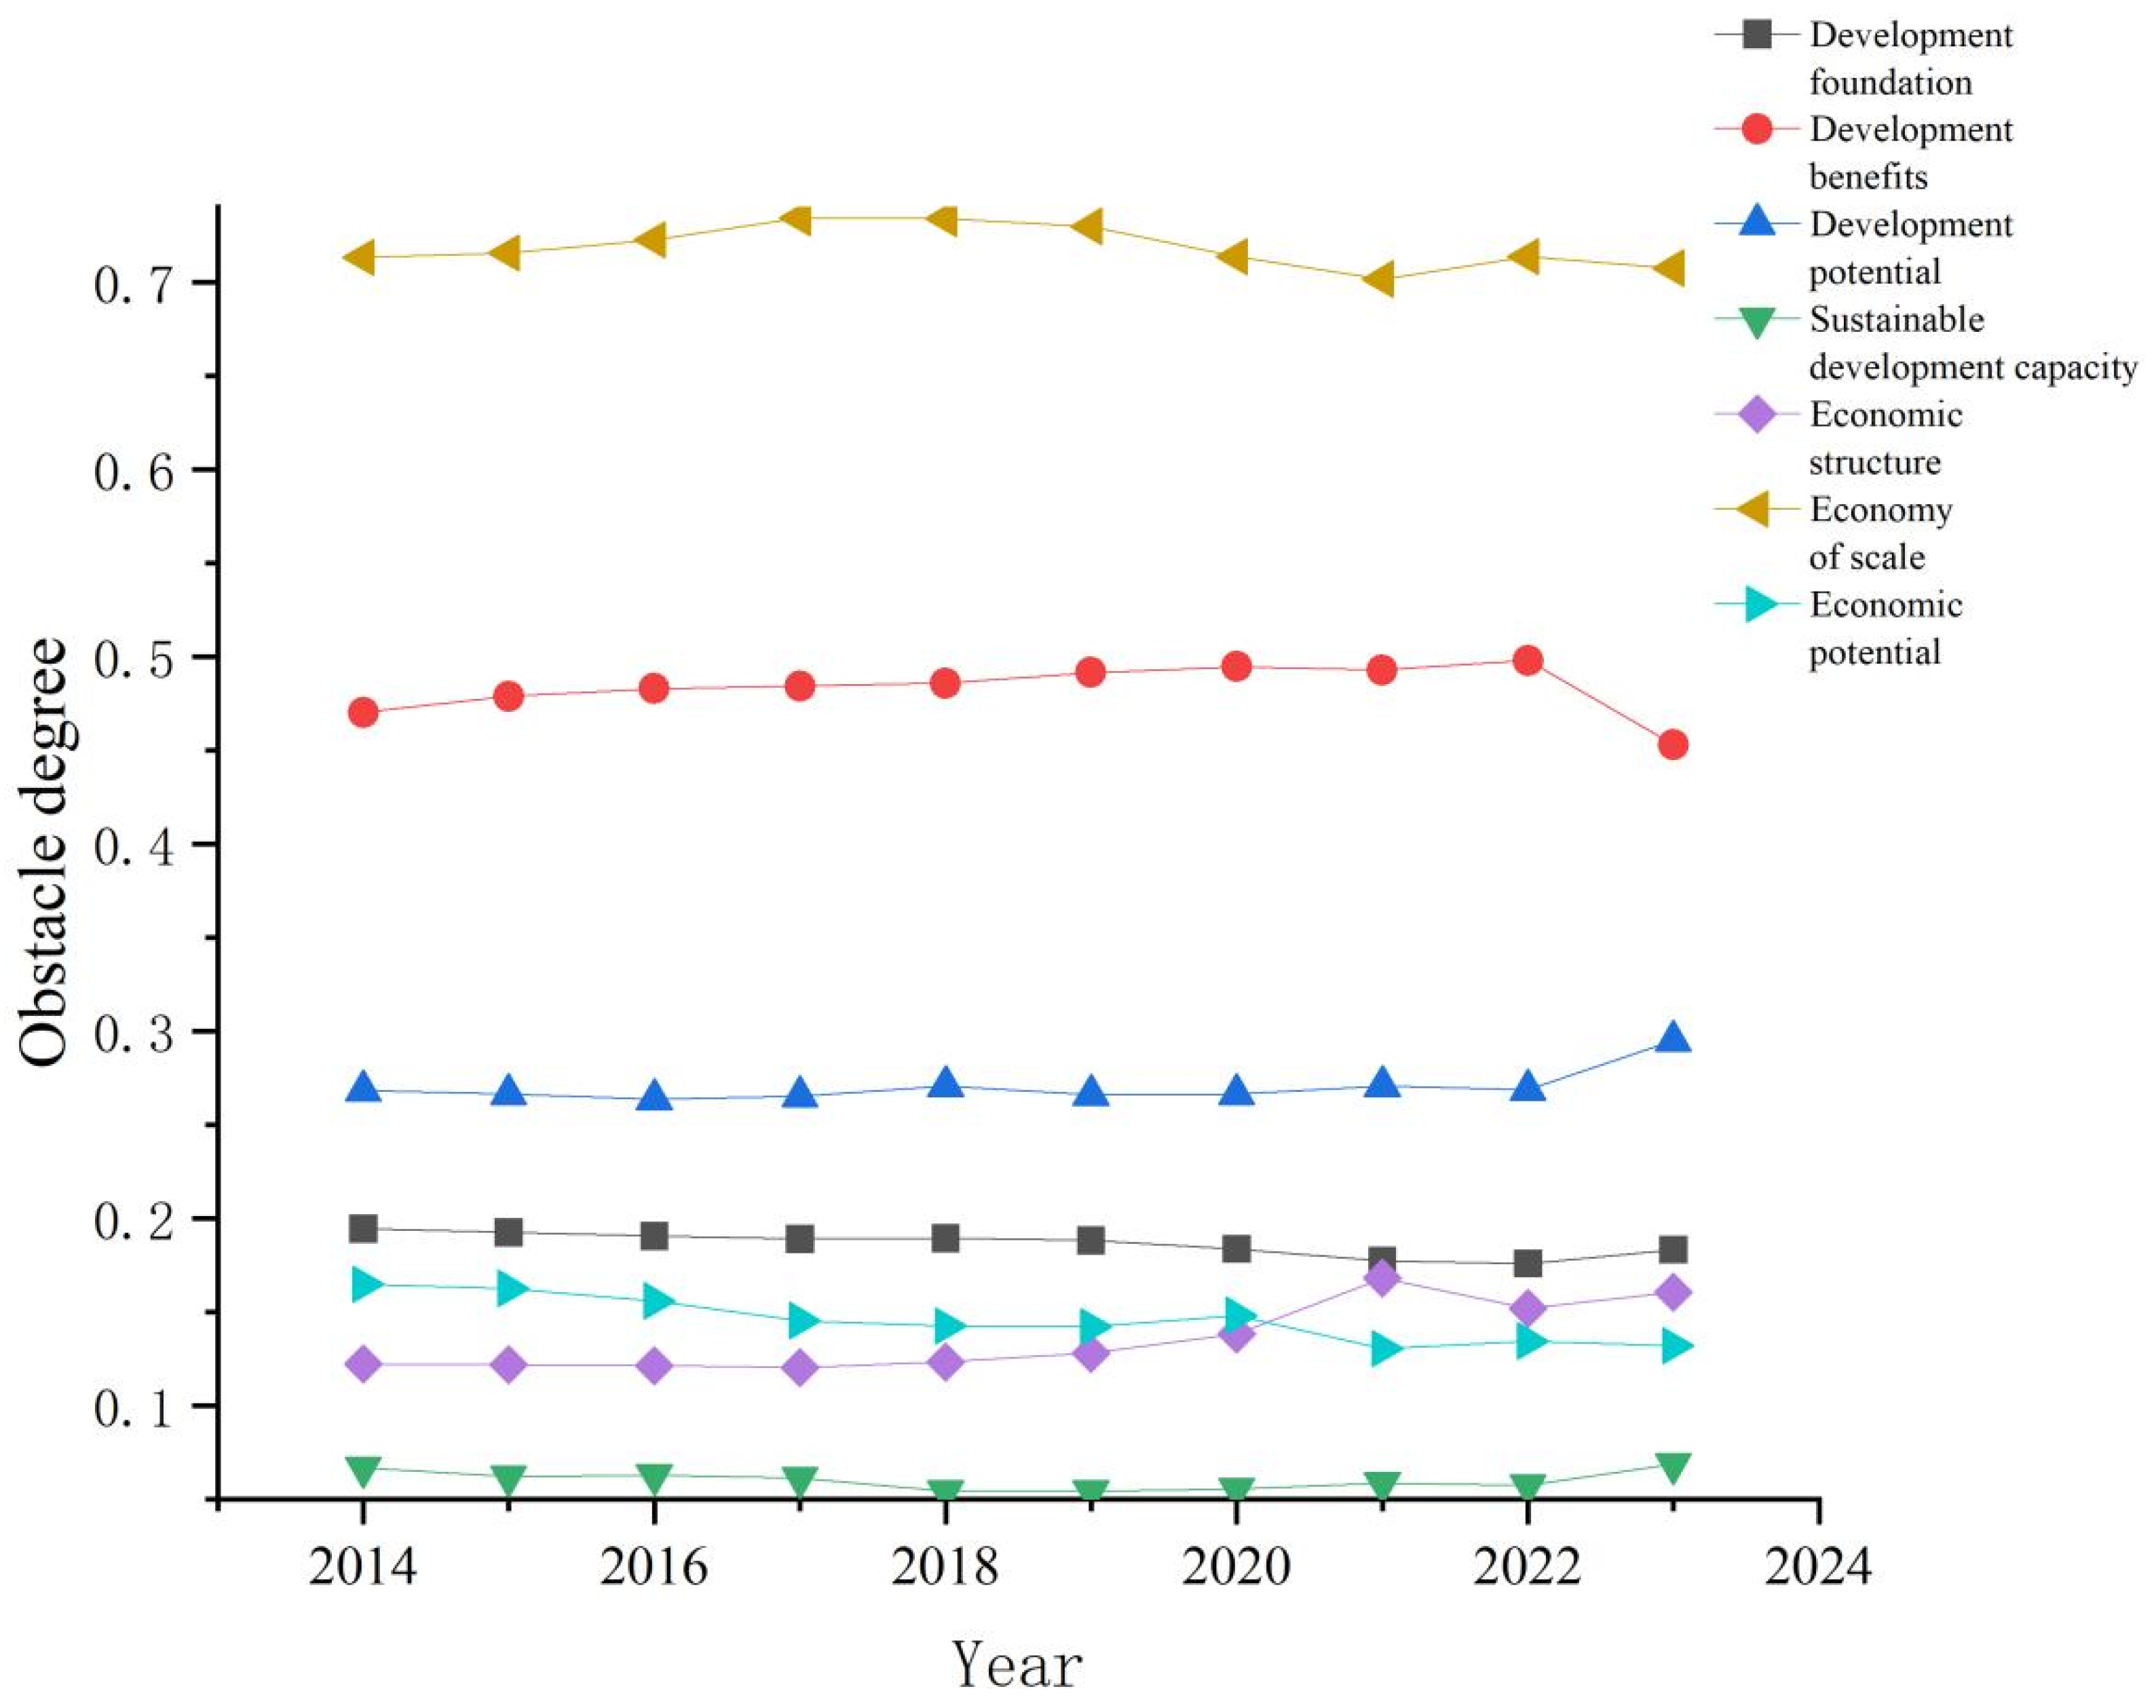
From Figure 10, between 2014 and 2023, the primary indicators showed significant characteristics in the obstacle degree of GL and RE.
Figure 10.
Obstacles of GL and RE by first-level indicators.
- (1)
- From 2014 to 2023, the obstacle degree of development benefit (B) to GL was generally high, especially for B3 in multiple provinces. Take Gansu as an example. Its B3 obstacle degree rose steadily from 24.9% in 2014 to 25.5% in 2023. This reveals significant challenges in improving logistics workers’ efficiency there, linked to low labor quality, poor technology application, and sub-par logistics process optimization. It shows that enhancing development benefits is a key link to break in GL development. This aspect directly concerns GL’ operational efficiency and cost control, impacting its co-development with the RE.
- (2)
- The obstacle degree of the development foundation (A) fluctuated but remained significant. In Qinghai, A3 showed remarkable volatility from 2014 to 2023, and the overall obstacle degree of A in the province also varied across years. This indicates that the foundational construction of GL in Qinghai faced challenges in urban–rural layout coordination. Weak logistics infrastructure and irrational route planning in rural areas not only constrained the coverage and service quality of GL but also negatively impacted regional economic balance. Consequently, the role of GL in promoting urban–rural economic integration could not be fully realized.
- (3)
- The obstacle degree of development potential (C) and sustainable development ability (D) was relatively low but showed an upward trend. In Ningxia, the obstacle degree of C gradually increased from 25.3% in 2014 to 25.8% in 2023, and D also rose. Despite improvements in indicators like logistics industry added value and energy consumption intensity, there is still room for enhancement. Challenges such as insufficient energy-technology innovation and weak environmental awareness are increasingly hindering the sustainable co-development of GL and the RE.
- (4)
- The obstacle degree of economic potential (G) has been persistently high across most provinces. In Qinghai, G3’s obstacle degree rose from 35.1% in 2014 to 38.1% in 2023. This indicates insufficient endogenous growth momentum and lack of vitality in the local economy, likely due to a single-industry structure, weak innovation, and limited market openness. This not only affects the quality and speed of regional economic development but also weakens its synergy with GL, making it hard to form a mutually reinforcing and virtuous-cycle development pattern. As a result, GL lacks strong economic support for market expansion and service improvement.
- (5)
- The obstacle degree of economic scale (F) showed significant provincial differences. In Shandong, despite a low and slowly declining obstacle degree, indicators like retail sales and goods imports/exports faced growing pressure from external factors such as international trade frictions and a saturated domestic market. In contrast, the obstacle degree of F was high and volatile in western provinces like Gansu and Ningxia. Their small economic scale and weak overall strength limited scale and industrial-cluster effects, restricting green logistics development and its economic benefit generation, and thus hindered the scaled co-development of GL and the RE.
- (6)
- The obstacle degree of economic structure (E) was relatively low overall but had local issues. In Henan, the obstacle degree of E3 rose from 2014 to 2023. This signals challenges in green industrial transformation and upgrading during local industrial-structure adjustment. Traditional industries dominate, and high-value-added industries develop slowly. These factors adversely affect the sustainable development of the RE and indirectly restrict in-depth synergy between GL and the RE. When the industrial structure is unreasonable, GL faces impediments in resource allocation and business expansion.
The obstacle-degree characteristics show that GL and regional-economy co-development in the YRB faces many challenges. In GL, labor productivity, industrial benefits, and scale are the main restrictions. In the RE, economic structure optimization, foreign trade, and economic scale and vitality greatly affect co-development. To achieve high-quality co-development, it is necessary to take effective measures against these obstacle factors. This includes strengthening regional cooperation, optimizing resource allocation, and promoting the deep integration and coordinated development of GL and the RE.
4.5. Robustness Check and Sensitivity Analysis
To address potential biases introduced by missing data interpolation and the adjustment of all economic data based on the 2014 constant prices, this study conducted a sensitivity analysis and cross-validation. First, a K-fold cross-validation approach was simulated by systematically omitting specific years of interpolated data (e.g., excluding the highly volatile pandemic year of 2020) and recalculating the entropy weights and CCD values. The results demonstrated that the core trajectory of the coupling coordination—shifting from a disordered state to coordinated development—remains statistically significant (p < 0.05). Second, to verify the impact of price fluctuations in regions with high economic volatility, a sensitivity test was performed by shifting the base year from 2014 to 2019. The recalibrated kernel density estimations and global Moran’s I indices exhibited minimal deviation from the original findings, confirming that the long-term trend analysis is robust and not distorted by specific political or temporal anomalies.
5. Conclusions and Recommendations
5.1. Conclusions
Through an in-depth study on the coupling and coordinated development of GL and RE in the YRB from 2014 to 2023, the following key conclusions are drawn:
- (1)
- Integrated development has improved but regional gaps remain significant. In the past decade, the YRB has seen a notable promotion in the integrated development level of GL and the RE. Eastern provinces like Shandong and Henan, with strong economic foundations and geographical advantages, have consistently led. Western provinces such as Qinghai, Gansu, and Ningxia, despite late starts and weaker bases, have accelerated development under policy support but still trail the east. While regional coordination is emerging, imbalances persist.
- (2)
- The CCD in the YRB has generally improved, but regional differences persist. In 2014, most provinces were in the disorderly decline range. By 2023, Shandong achieved high-quality coordination, and Henan moved towards intermediate coordination. However, Gansu and Ningxia remained in the near-disorder stage. The CCD shows a spatial pattern of gradual improvement from the east to the west. The east leads, while the central and western regions lag. Regional differences are still significant. The improvement in coupling coordination is closely linked to factors such as GL infrastructure construction and regional economic structure adjustment.
- (3)
- Spatial agglomeration characteristics have evolved. The global Moran’s I index indicates a positive spatial correlation of coupling coordination. Agglomeration strengthened from 2014 to 2017 but weakened after 2017, suggesting reduced regional disparities and a more balanced distribution of coupling coordination. Local spatial autocorrelation analysis shows that while high–high and low–low agglomeration patterns coexist, low–high and high–low patterns have increased over time, indicating a shift towards more balanced and coordinated spatial associations.
- (4)
- Key obstacle factors are evident. For GL, the main obstacles are insufficient B3, and low C1 and C2; for the RE, they are low F3, the need to enhance F2, and the proportion of E3. These factors vary significantly across provinces.
- (5)
- Empirical contributions are significant. This study, focusing on the YRB’s unique context, has advanced theory in important ways. First, it reveals how, under strong ecological constraints, the “GL-RE” system achieves coupling coordination through efficiency gains and structural adjustments. Second, it applies a “spatial heterogeneity-co-evolution” perspective, clarifying how economic gradients drive collaborative-development-pattern evolution via policy-guided spatial reorganization, such as enhanced diffusion effects. Finally, rather than proving direct causality, this study empirically highlights strong association patterns where national-strategy interventions align with the mitigation of specific diagnostic obstacles (such as infrastructure deficits and structural transformation challenges). This demonstrates a unique path for guiding co-development from “policy-driven” to “endogenous coordination,” enriching the theoretical understanding of regional collaboration under policy scenarios and deepening the interplay between policy, practice, and academia. Furthermore, the findings of this study offer theoretical robustness that transcends China’s borders. By comparing the YRB with the Yangtze River Economic Belt (YREB) and coastal economic zones, this research highlights a distinct divergence: while the YREB relies on abundant water resources and inherent shipping advantages to drive traditional scale coordination, the YRB paradigm represents a “resource-constrained collaboration model.” This model proves that even under rigid water constraints and ecological fragility, coupling coordination can be achieved through efficiency gains rather than mere scale expansion. This provides a replicable framework for other international river basins facing severe ecological thresholds (e.g., the Colorado River Basin or the Rhine), demonstrating that state intervention combined with strict ecological redlines can effectively guide the transition of regional logistics from a high-emission model to sustainable synergy.
Compared to existing studies focused on the Yangtze River Economic Belt, which benefits from abundant water resources and inherent shipping advantages, our findings in the YRB highlight a distinct “resource-constrained collaboration” paradigm. Furthermore, while the CCD model effectively captures the contemporaneous synergy and structural alignment between GL and RE, it evaluates coordinated occurrence rather than definitive directional causality. A limitation of this study is the reliance on static and cross-sectional coordination measurements. Future research could incorporate dynamic panel data models or cross-lagged panel analyses to further disentangle the distinct causal mechanisms driving these regional interactions.
5.2. Recommendations
In view of the above conclusions, in order to better improve the development of GL and RE in the YRB and respond to the national call for low-carbon and green development, this study puts forward the following suggestions:
- (1)
- Enhance regional cooperation and coordination. Promote inter-provincial cooperation in the Yellow River Basin and establish regular collaborative mechanisms. This can facilitate information sharing and resource complementarity in GL and RE. For instance, Shandong can export advanced GL technology and management experience to central and western provinces, while these provinces can provide Shandong with agricultural products. This mutual support achieves complementary advantages and narrows the gap in coupling coordination. Additionally, strengthen interconnected transport infrastructure within the basin, optimize logistics network layouts, improve efficiency and reduce costs. Boost logistics channel construction in central and western provinces to link with the eastern coast and international markets. This enhances material circulation and economic ties across regions.
- (2)
- Enhance GL development. Increase investment in GL technology R&D and application. Promote new energy vehicles and smart warehouse systems to boost efficiency and reduce energy use and emissions. For instance, offer subsidies to logistics firms in Qinghai and Gansu for green upgrades and energy-saving devices. Strengthen logistics worker training. Launch vocational skills programs for provinces with low labor productivity, cultivate green logistics professionals, and optimize the logistics workforce. Accelerate the deployment of Logistics 4.0 as an immediate solution for lagging regions. The prolonged “near disorder” state in western provinces reveals that traditional incremental investments are insufficient. To break this bottleneck, western regions must leapfrog traditional logistics stages by directly integrating Logistics 4.0 technologies. Provincial governments should issue immediate financial mandates to subsidize the adoption of the Internet of Things (IoT), automated guided vehicles (AGVs), and big data-driven route optimization. Specifically, deploying smart warehousing clusters in Gansu and Ningxia can directly counteract their severe labor productivity obstacles (Obstacle B3), transforming their geographical disadvantages into digitally optimized transit hubs. Incorporating specific Logistics 4.0 adoption rates into future local governance assessments will provide a definitive pathway out of structural imbalance.
- (3)
- Optimize the regional economic structure. Promote industrial structure upgrades and accelerate the green transformation of traditional industries. Develop emerging and tertiary industries to enhance regional economy vitality. For example, guide the industrial development of Shanxi and Shaanxi towards high-end, intelligent, and green goals, and boost modern service industry growth. Expand foreign trade channels. Build international trade platforms for inland provinces like Qinghai, Gansu, and Ningxia to strengthen economic cooperation with the “Belt and Road” regions, elevate their level of open-economy development, and increase the total value of goods imports and exports.
- (4)
- Targeted policies should be tailored to each province’s obstacle factors. For example, Shandong must enhance its GL sustainable development by investing more in energy-saving and environmental protection technologies. Henan needs to boost logistics-industry fixed asset investment to expand the industry’s scale. Targeted policies must be directly linked to regional spatial clusters and their primary diagnostic obstacle factors. For example, provinces entrenched in low–low (LL) clusters, such as Qinghai and Gansu, should focus on deploying automated logistics technologies to directly alleviate their critical labor productivity constraints (Obstacle B3), in addition to optimizing urban–rural delivery routes. Additionally, a dynamic monitoring and early-warning mechanism for obstacle factors should be established. This mechanism would track issues in GL and regional economic development in real-time, enabling governments and enterprises to adjust strategies promptly and effectively respond to changes in obstacle factors. Consequently, this would guarantee the sustained co-development of GL and the RE.
- (5)
- We need to strengthen policy support for the development of GL and regional collaboration in the YRB. Governments at all levels should establish and refine relevant policies and regulations and further implement the “Master Plan”. We should increase financial support for GL infrastructure, energy-saving and environmental protection projects, and the development of logistics enterprises. Policy measures could include setting up special funds to support GL demonstration projects and offering tax incentives. Financial institutions should be encouraged to innovate their products and services to provide diverse financing channels for GL and regional economic development.
Supplementary Materials
The following supporting information can be downloaded at https://www.mdpi.com/article/10.3390/rsee3010006/s1, File S1 Data.
Author Contributions
Conceptualization, H.W.; methodology, H.W. and X.W.; writing—original draft preparation, X.W.; writing—review and editing, H.W. All authors have read and agreed to the published version of the manuscript.
Funding
Fujian Provincial Social Science Fund, Project No. FJ2025C038: Research on the Optimization Mechanism of the Decoupling Effect in Green Transformation of Energy Consumption in Fujian Province.
Institutional Review Board Statement
Not applicable.
Informed Consent Statement
Not applicable.
Data Availability Statement
The data presented in this study are available in the Supplementary Materials.
Conflicts of Interest
The authors declare no conflicts of interest.
References
- Sikder, M.; Wang, C.; Yao, X.; Huai, X.; Wu, L.; KwameYeboah, F.; Wood, J.; Zhao, Y.; Dou, X. The integrated impact of GDP growth, industrialization, energy use, and urbanization on CO2 emissions in developing countries: Evidence from the panel ARDL approach. Sci. Total Environ. 2022, 837, 155795. [Google Scholar] [CrossRef] [Scilit] [PubMed]
- Wang, C.; Zhao, Y.; Wang, Y.; Wood, J.; Kim, C.Y.; Li, Y. Transportation CO2 emission decoupling: An assessment of the Eurasian logistics corridor. Transp. Res. Part D Transp. Environ. 2020, 86, 102486. [Google Scholar] [CrossRef] [Scilit]
- Wang, C.; Feng, X.; Woo, S.; Wood, J.; Yu, S. The optimization of an EV decommissioned battery recycling network: A third-party approach. J. Environ. Manag. 2023, 348, 119299. [Google Scholar] [CrossRef] [Scilit] [PubMed]
- Kang, X.; Chen, L.; Zhao, Y.; Jiang, L. Green development level on provincial-level air logistics: Evidence for spatial network evolution and impact mechanisms from China. J. Environ. Manag. 2025, 386, 125657. [Google Scholar] [CrossRef] [Scilit]
- Fan, X.; Zhang, Y.; Xue, J.; Cao, Y. Exploring the path to the sustainable development of cold chain logistics for fresh agricultural products in China. Environ. Impact Assess. Rev. 2024, 108, 107610. [Google Scholar] [CrossRef] [Scilit]
- Chen, Z.; Chen, S.; Liu, C.; Nguyen, L.T.; Hasan, A. The effects of circular economy on economic growth: A quasi-natural experiment in China. J. Clean. Prod. 2020, 271, 122558. [Google Scholar] [CrossRef] [Scilit]
- Wang, C.; Sinha, P.N.; Zhang, X.; Wang, S.; Lee, Y.-K. The impact of NEV users’ perceived benefits on purchase intention. Travel Behav. Soc. 2024, 34, 100681. [Google Scholar] [CrossRef] [Scilit]
- Robaina, M.; Murillo, K.; Rocha, E.; Villar, J. Circular economy in plastic waste—Efficiency analysis of European countries. Sci. Total Environ. 2020, 730, 139038. [Google Scholar] [CrossRef] [Scilit]
- Giannakitsidou, O.; Giannikos, I.; Chondrou, A. Ranking European countries on the basis of their environmental and circular economy performance: A DEA application in MSW. Waste Manag. 2020, 109, 181–191. [Google Scholar] [CrossRef] [Scilit]
- Rehman Khan, S.A.; Zhang, Y.; Anees, M.; Golpîra, H.; Lahmar, A.; Qianli, D. Green supply chain management, economic growth and environment: A GMM based evidence. J. Clean. Prod. 2018, 185, 588–599. [Google Scholar] [CrossRef] [Scilit]
- Mumtaz, U.; Ali, Y.; Petrillo, A.; De Felice, F. Identifying the critical factors of green supply chain management: Environmental benefits in Pakistan. Sci. Total Environ. 2018, 640–641, 144–152. [Google Scholar] [CrossRef] [Scilit] [PubMed]
- Sikder, M.; Wang, C.; Yeboah, F.K.; Wood, J. Driving factors of CO2 emission reduction in the logistics industry: An assessment of the RCEP and SAARC economies. Environ. Dev. Sustain. 2024, 26, 2557–2587. [Google Scholar] [CrossRef] [Scilit]
- Wang, C.; Yao, X.; Sinha, P.N.; Su, H.; Lee, Y.-K. Why do government policy and environmental awareness matter in predicting NEVs purchase intention? Moderating role of education level. Cities 2022, 131, 103904. [Google Scholar] [CrossRef] [Scilit]
- Kim, M.-K.; Oh, J.; Park, J.-H.; Joo, C. Perceived value and adoption intention for electric vehicles in Korea: Moderating effects of environmental traits and government supports. Energy 2018, 159, 799–809. [Google Scholar] [CrossRef] [Scilit]
- Zhao, X.; Korey, M.; Li, K.; Copenhaver, K.; Tekinalp, H.; Celik, S.; Kalaitzidou, K.; Ruan, R.; Ragauskas, A.J.; Ozcan, S. Plastic waste upcycling toward a circular economy. Chem. Eng. J. 2022, 428, 131928. [Google Scholar] [CrossRef] [Scilit]
- Gong, Y.; Putnam, E.; You, W.; Zhao, C. Investigation into circular economy of plastics: The case of the UK fast moving consumer goods industry. J. Clean. Prod. 2020, 244, 118941. [Google Scholar] [CrossRef] [Scilit]
- Chen, C.C.; Pao, H.T. The causal link between circular economy and economic growth in EU-25. Environ. Sci. Pollut. Res. 2022, 29, 76352–76364. [Google Scholar] [CrossRef] [Scilit]
- Chen, J.; Rojniruttikul, N.; Kun, L.Y.; Ullah, S. Management of Green Economic Infrastructure and Environmental Sustainability in One Belt and Road Enitiative Economies. Environ. Sci. Pollut. Res. 2022, 29, 36326–36336. [Google Scholar] [CrossRef] [Scilit]
- Nelson, E.; Warren, P. UK transport decoupling: On track for clean growth in transport? Transp. Policy 2020, 90, 39–51. [Google Scholar] [CrossRef] [Scilit]
- Ning, J.; Liu, B.; Xu, Y.; Yu, L. Does green supply chain management improve corporate sustainability performance? Evidence from China. Environ. Impact Assess. Rev. 2025, 112, 107828. [Google Scholar] [CrossRef] [Scilit]
- Seroka-Stolka, O.; Ociepa-Kubicka, A. Green logistics and circular economy. Transp. Res. Procedia 2019, 39, 471–479. [Google Scholar] [CrossRef] [Scilit]
- Govindan, K.; Nosrati-Abarghooee, S.; Nasiri, M.M.; Jolai, F. Green reverse logistics network design for medical waste management: A circular economy transition through case approach. J. Environ. Manag. 2022, 322, 115888. [Google Scholar] [CrossRef] [Scilit]
- Sikder, M.; Wang, C.; Rahman, M.M.; Yeboah, F.K.; Alola, A.A.; Wood, J. Green logistics and circular economy in alleviating CO2 emissions: Does waste generation and GDP growth matter in EU countries? J. Clean. Prod. 2024, 449, 141708. [Google Scholar] [CrossRef] [Scilit]
- Yang, C.; Lan, S.L.; Wang, L.H. Research on coordinated development between metropolitan economy and logistics using big data and Haken model. Int. J. Prod. Res. 2019, 57, 1176–1189. [Google Scholar] [CrossRef] [Scilit]
- Lan, S.L.; Zhong, R.Y. Coordinated development between metropolitan economy and logistics for sustainability. Resour. Conserv. Recycl. 2018, 128, 345–354. [Google Scholar] [CrossRef] [Scilit]
- Li, M.; Huang, K.; Xie, X.; Chen, Y. Dynamic evolution, regional differences and influencing factors of high-quality development of China’s logistics industry. Ecol. Indic. 2024, 159, 111728. [Google Scholar] [CrossRef] [Scilit]
- Yuan, B.; Tao, F.; Guo, Z.; Ren, J.; Zhu, Z.; Zhou, C. Top-down versus bottom-up: How green finance drives sustainable development in cold chain logistics? Transp. Policy 2025, 173, 103749. [Google Scholar] [CrossRef] [Scilit]
- Bukhari, H.; Basingab, M.S.; Rizwan, A.; Sánchez-Chero, M.; Pavlatos, C.; More, L.A.V.; Fotis, G. Sustainable green supply chain and logistics management using adaptive fuzzy-based particle swarm optimization. Sustain. Comput. Inform. Syst. 2025, 46, 101119. [Google Scholar] [CrossRef] [Scilit]
- Hanif, S.; Mu, D.; Baig, S.; Alam, K.M. A Correlative Analysis of Modern Logistics Industry to Developing Economy Using the VAR Model: A Case of Pakistan. J. Adv. Transp. 2020, 2020, 8861914. [Google Scholar] [CrossRef] [Scilit]
- Song, Y.; Yeung, G.; Zhu, D.; Zhang, L.; Xu, Y.; Zhang, L. Efficiency of logistics land use: The case of Yangtze River Economic Belt in China, 2000–2017. J. Transp. Geogr. 2020, 88, 102851. [Google Scholar] [CrossRef] [Scilit]
- Kang, X.; Chen, L.; Wang, Y.; Liu, W. Analysis on the spatial correlation network and driving factors of carbon emissions in China’s logistics industry. J. Environ. Manag. 2024, 366, 121916. [Google Scholar]
- Lu, S.; Jiang, H.; Liu, Y.; Huang, S. Regional disparities and influencing factors of Average CO2 Emissions from transportation industry in Yangtze River Economic Belt. Transp. Res. Part D Transp. Environ. 2017, 57, 112–123. [Google Scholar]
- Yang, Z.; Chen, X.; Pan, R.; Yuan, Q. Exploring location factors of logistics facilities from a spatiotemporal perspective: A case study from Shanghai. J. Transp. Geogr. 2022, 100, 103318. [Google Scholar] [CrossRef] [Scilit]
- Cuiyun, C.; Chazhong, G. Green development assessment for countries along the belt and road. J. Environ. Manag. 2020, 263, 110344. [Google Scholar] [CrossRef] [Scilit] [PubMed]
- Tang, Z. An integrated approach to evaluating the coupling coordination between tourism and the environment. Tour. Manag. 2015, 46, 11–19. [Google Scholar] [CrossRef] [Scilit]
- Wang, X.; Song, J.; Xing, J.; Duan, H.; Wang, X.E. System nexus consolidates coupling of regional water and energy efficiencies. Energy 2022, 256, 124631. [Google Scholar] [CrossRef] [Scilit]
- Torres, M.; Srubar, W.V. Characterizing statistical uncertainty and variability of building material emissions in probabilistic whole-building life cycle assessment using kernel density estimation. Build. Environ. 2025, 284, 113442. [Google Scholar] [CrossRef] [Scilit]
- Mi, X.; Yu, L.; Zhang, J.; Liu, R.; Hu, B.; Qiu, S. Analysis of fracture spatial distributions and fast reconstruction of discrete fracture networks model based on non-parametric kernel density estimation method. Eng. Geol. 2025, 351, 108034. [Google Scholar] [CrossRef] [Scilit]
- Tillé, Y.; Dickson, M.M.; Espa, G.; Giuliani, D. Measuring the spatial balance of a sample: A new measure based on Moran’s I index. Spat. Stat. 2018, 23, 182–192. [Google Scholar] [CrossRef] [Scilit]
- Gedamu, W.T.; Plank-Wiedenbeck, U.; Wodajo, B.T. A spatial autocorrelation analysis of road traffic crash by severity using Moran’s I spatial statistics: A comparative study of Addis Ababa and Berlin cities. Accid. Anal. Prev. 2024, 200, 107535. [Google Scholar] [CrossRef] [Scilit] [PubMed]
- Fan, Y.; Fang, C. Evolution process and obstacle factors of ecological security in western China, a case study of Qinghai province. Ecol. Indic. 2020, 117, 106659. [Google Scholar] [CrossRef] [Scilit]
- Salman, M.; Long, X.; Dauda, L.; Mensah, C.N. The impact of institutional quality on economic growth and carbon emissions: Evidence from Indonesia, South Korea and Thailand. J. Clean. Prod. 2019, 241, 118331. [Google Scholar] [CrossRef] [Scilit]
- Tan, Y.; Chen, Z.; Antunes, J.; Wanke, P. Environmental impacts and energy transition in Chinese logistics: An N-Spheres multi-criteria decision-making. Energy Econ. 2025, 148, 108668. [Google Scholar] [CrossRef] [Scilit]
- Li, C.; Wang, Y.; Li, Z.; Wang, L. Study on calculation and optimization path of energy utilization efficiency of provincial logistics industry in China. Renew. Energy 2025, 243, 122594. [Google Scholar] [CrossRef] [Scilit]

Disclaimer/Publisher’s Note: The statements, opinions and data contained in all publications are solely those of the individual author(s) and contributor(s) and not of MDPI and/or the editor(s). MDPI and/or the editor(s) disclaim responsibility for any injury to people or property resulting from any ideas, methods, instructions or products referred to in the content. |
© 2026 by the authors. Licensee MDPI, Basel, Switzerland. This article is an open access article distributed under the terms and conditions of the Creative Commons Attribution (CC BY) license.