


Abstract
Cats are among the most popular pets globa lly, yet little is known about how the home environment influences their behaviour. Most studies have focused on cats in shelters or research facilities, potentially limiting applicability to pet cats. This study combined behavioural data from cats in three housing conditions: indoor pet (n = 10), free-roaming pet (n = 18), and research (n = 8), collected in summer and winter. Eight behaviours were classified from collar-mounted accelerometer data using a validated machine learning model and analysed using generalised linear mixed models. Free-roaming pet cats were more active in summer than winter (3.9 ± 0.39% vs. 2.7 ± 0.33%; p < 0.001) and more active than both research (2.0 ± 0.36%; p = 0.004) and indoor pet cats (2.0 ± 0.36%; p < 0.001) in summer. Research cats spent more time lying (52.9 ± 2.03% vs. 36.9 ± 2.89%; p = 0.009) and eating (7.8 ± 0.41% vs. 2.4 ± 0.39%; p = 0.003) in winter than summer, whereas no seasonal differences in these behaviours were observed for pet cats. A bimodal daily activity pattern, with peaks around sunrise and sunset, was observed across housing conditions and seasons. These findings demonstrate that both housing and seasonal conditions influence domestic cat behaviour and should be considered when interpreting behavioural studies.
1. Introduction
Cats (Felis catus) are one of the most popular pets worldwide with an estimated 445 million animals [1]. Despite these numbers, surprisingly little is known about how the home environment affects their behaviour. Understanding feline behaviour is not only essential for monitoring health and welfare but can also be used to strengthen the human–animal bond. Given that behavioural changes can be important indicators of pain, illness, or distress, a comprehensive understanding of behavioural drivers is crucial for owners, veterinarians, and welfare scientists [2].
Studies have shown that domestic cat behaviour is influenced by a combination of natural rhythms, environmental factors, and human interaction [3,4,5,6]. Feral cats typically exhibit a bimodal, crepuscular/nocturnal activity pattern, with peaks around dawn and dusk [3,4]. However, this pattern is flexible in pet cats, which often shift their activity to be more diurnal, aligning their active periods with the routines of their owners or caretakers [5,6]. Environmental seasonal weather variables are another important driver of feline behaviour patterns. Studies have quantified the impact of weather, finding that variables such as temperature, humidity, precipitation, and day length can account for a substantial portion of the variance in activity levels [7,8,9,10]. Physiologically, cats exhibit clear seasonal cycles, such as changes in coat growth and shedding, which are primarily driven by photoperiod [11,12,13,14] and are linked to maintenance behaviours, such as grooming [15].
A recent review by Foreman-Worsley and others [16] showed that most behavioural studies were conducted outside the home environment (e.g., in a shelter, cattery, or research facility), with the majority focused on enrichment and adaptation to barren environments. Results from these studies, especially regarding enrichment, have been applied to pet cats. A recent study by our group [17] showed that different environmental factors in a home environment are associated with changes in pet cat behaviour. Interventions that have a positive effect in barren environments, however, might not have the same effect in an already enriched environment, such as a home. This study, therefore, aimed to compare the behaviour of domestic pet cats and research cats, by combining data from two previously published studies on research [15] and pet cats [17].
2. Materials and Methods
Existing behavioural data from pet [17] and research [15] cats were merged into a single dataset, with three different housing conditions: indoor pet cats (n = 10), free-roaming pet cats (n = 18), and semi-outdoor colony research cats (n = 8). Both studies were approved by the Massey University Animal Ethics Committee (MUAEC 22/23 and 22/24) and the study involving pet cats was also approved by the Massey University Human Ethics Committee (MHEC400025773).
Data were collected over the summer of 2022/2023 and winter of 2023, and behaviours were classified from data collected from collar-mounted accelerometers (wGT3X-BT, ActiGraph, Pensacola, FL, USA) and a previously validated machine learning model [18]. Eight behavioural categories were identified: active (walking and trotting), eating, grooming, littering, lying, scratching, sitting, and standing (Table 1). Scratching and grooming data for one research cat were removed due to allergies, resulting in a sample size of n = 7 for these two behaviours. Details on data collection and processing have been published previously [15,17]. Seasonal proportions were determined for each behaviour to allow for comparisons between housing conditions.
Table 1.
Definitions of the eight behaviours classified by the machine learning model. As defined by [19], unless stated otherwise.
All statistical analyses were done with RStudio (version 4.1.1 [22]). A generalised linear mixed model (GLMM; R package ‘glmmTMB’ version 1.1.12 [23]) was used to evaluate the associations between ‘season × housing’ and the proportion of time spent in each of the eight behaviours, accounting for repeated measures within cats. Three GLMMs were performed for each behaviour: (1) a simple model with no predictors, (2) an intermediate model with cat as a random effect, and (3) a full model that included cat as a random effect and the interaction of season × housing as a fixed effect (Equation (1)). Behavioural proportions were modelled using a binomial error distribution with a logit link function:
where μj is the expected seasonal proportion of time cat j spends on the behaviour, β0 is the overall intercept, β1 represents the fixed effect of season for cat j, β2 represents the fixed effect of housing for cat j, β3 represents the interaction between season and housing for cat j, and bj ~ N(0, σb2) is the random intercept for cat j to account for individual-level variation.
Logit(μj) = β0 + β1Seasonj + β2Housingj + β3(Seasonj × Housingj) + bj,
The three models were compared with an ANOVA to determine which factors improved the model, and the marginal and conditional R of the full models were determined. The marginal R2 value is the variance explained by only the fixed effect, whereas the conditional R2 value is the variance explained by both the random and fixed effects. To determine differences between seasons × housing, pairwise comparisons of estimated marginal means were conducted for each behaviour, using the R package ‘emmeans’ version 1.1.2-8 [24]. A Tukey adjustment was used to correct for multiple pairwise comparisons. Results are presented as the seasonal mean ± standard error (SE) of time spent on behaviour, as determined with the classification model, and were considered significant if p ≤ 0.05, and a trend if 0.05 < p ≤ 0.10.
Hourly behaviour proportions were calculated per season and housing condition to visualise patterns in behaviour throughout the day. Hourly data were not statistically analysed.
3. Results
Behavioural observations were collected from research cats, indoor pet cats, and free-roaming pet cats during summer and winter periods. Behaviours were classified using an automated model, and generalized linear mixed models were used to evaluate associations between housing, season, and their interaction with the proportion of time cats spent in each behaviour. Daily activity patterns were also examined to describe the distribution of behaviours across the 24 h cycle.
3.1. Seasonal Behaviour
Seasonal associations were evaluated for all eight behaviours. Mixed models incorporated cat identity as a random effect and the interaction of season × housing as a fixed effect to determine the proportion of variance in behaviours associated with these factors.
3.1.1. Active Behaviours
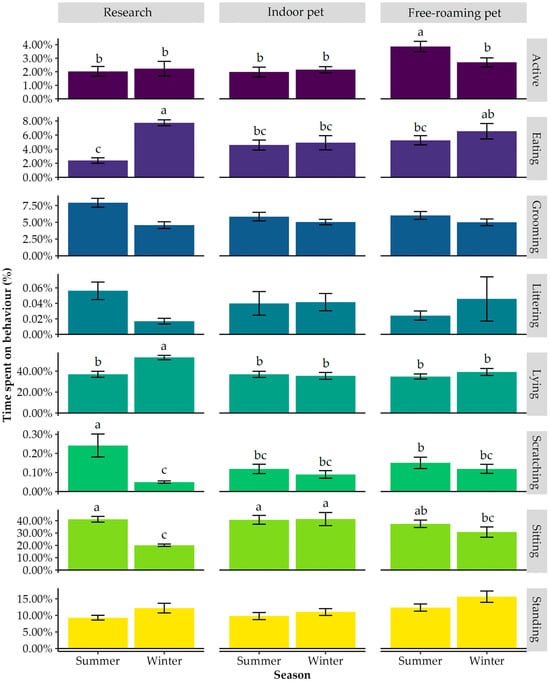
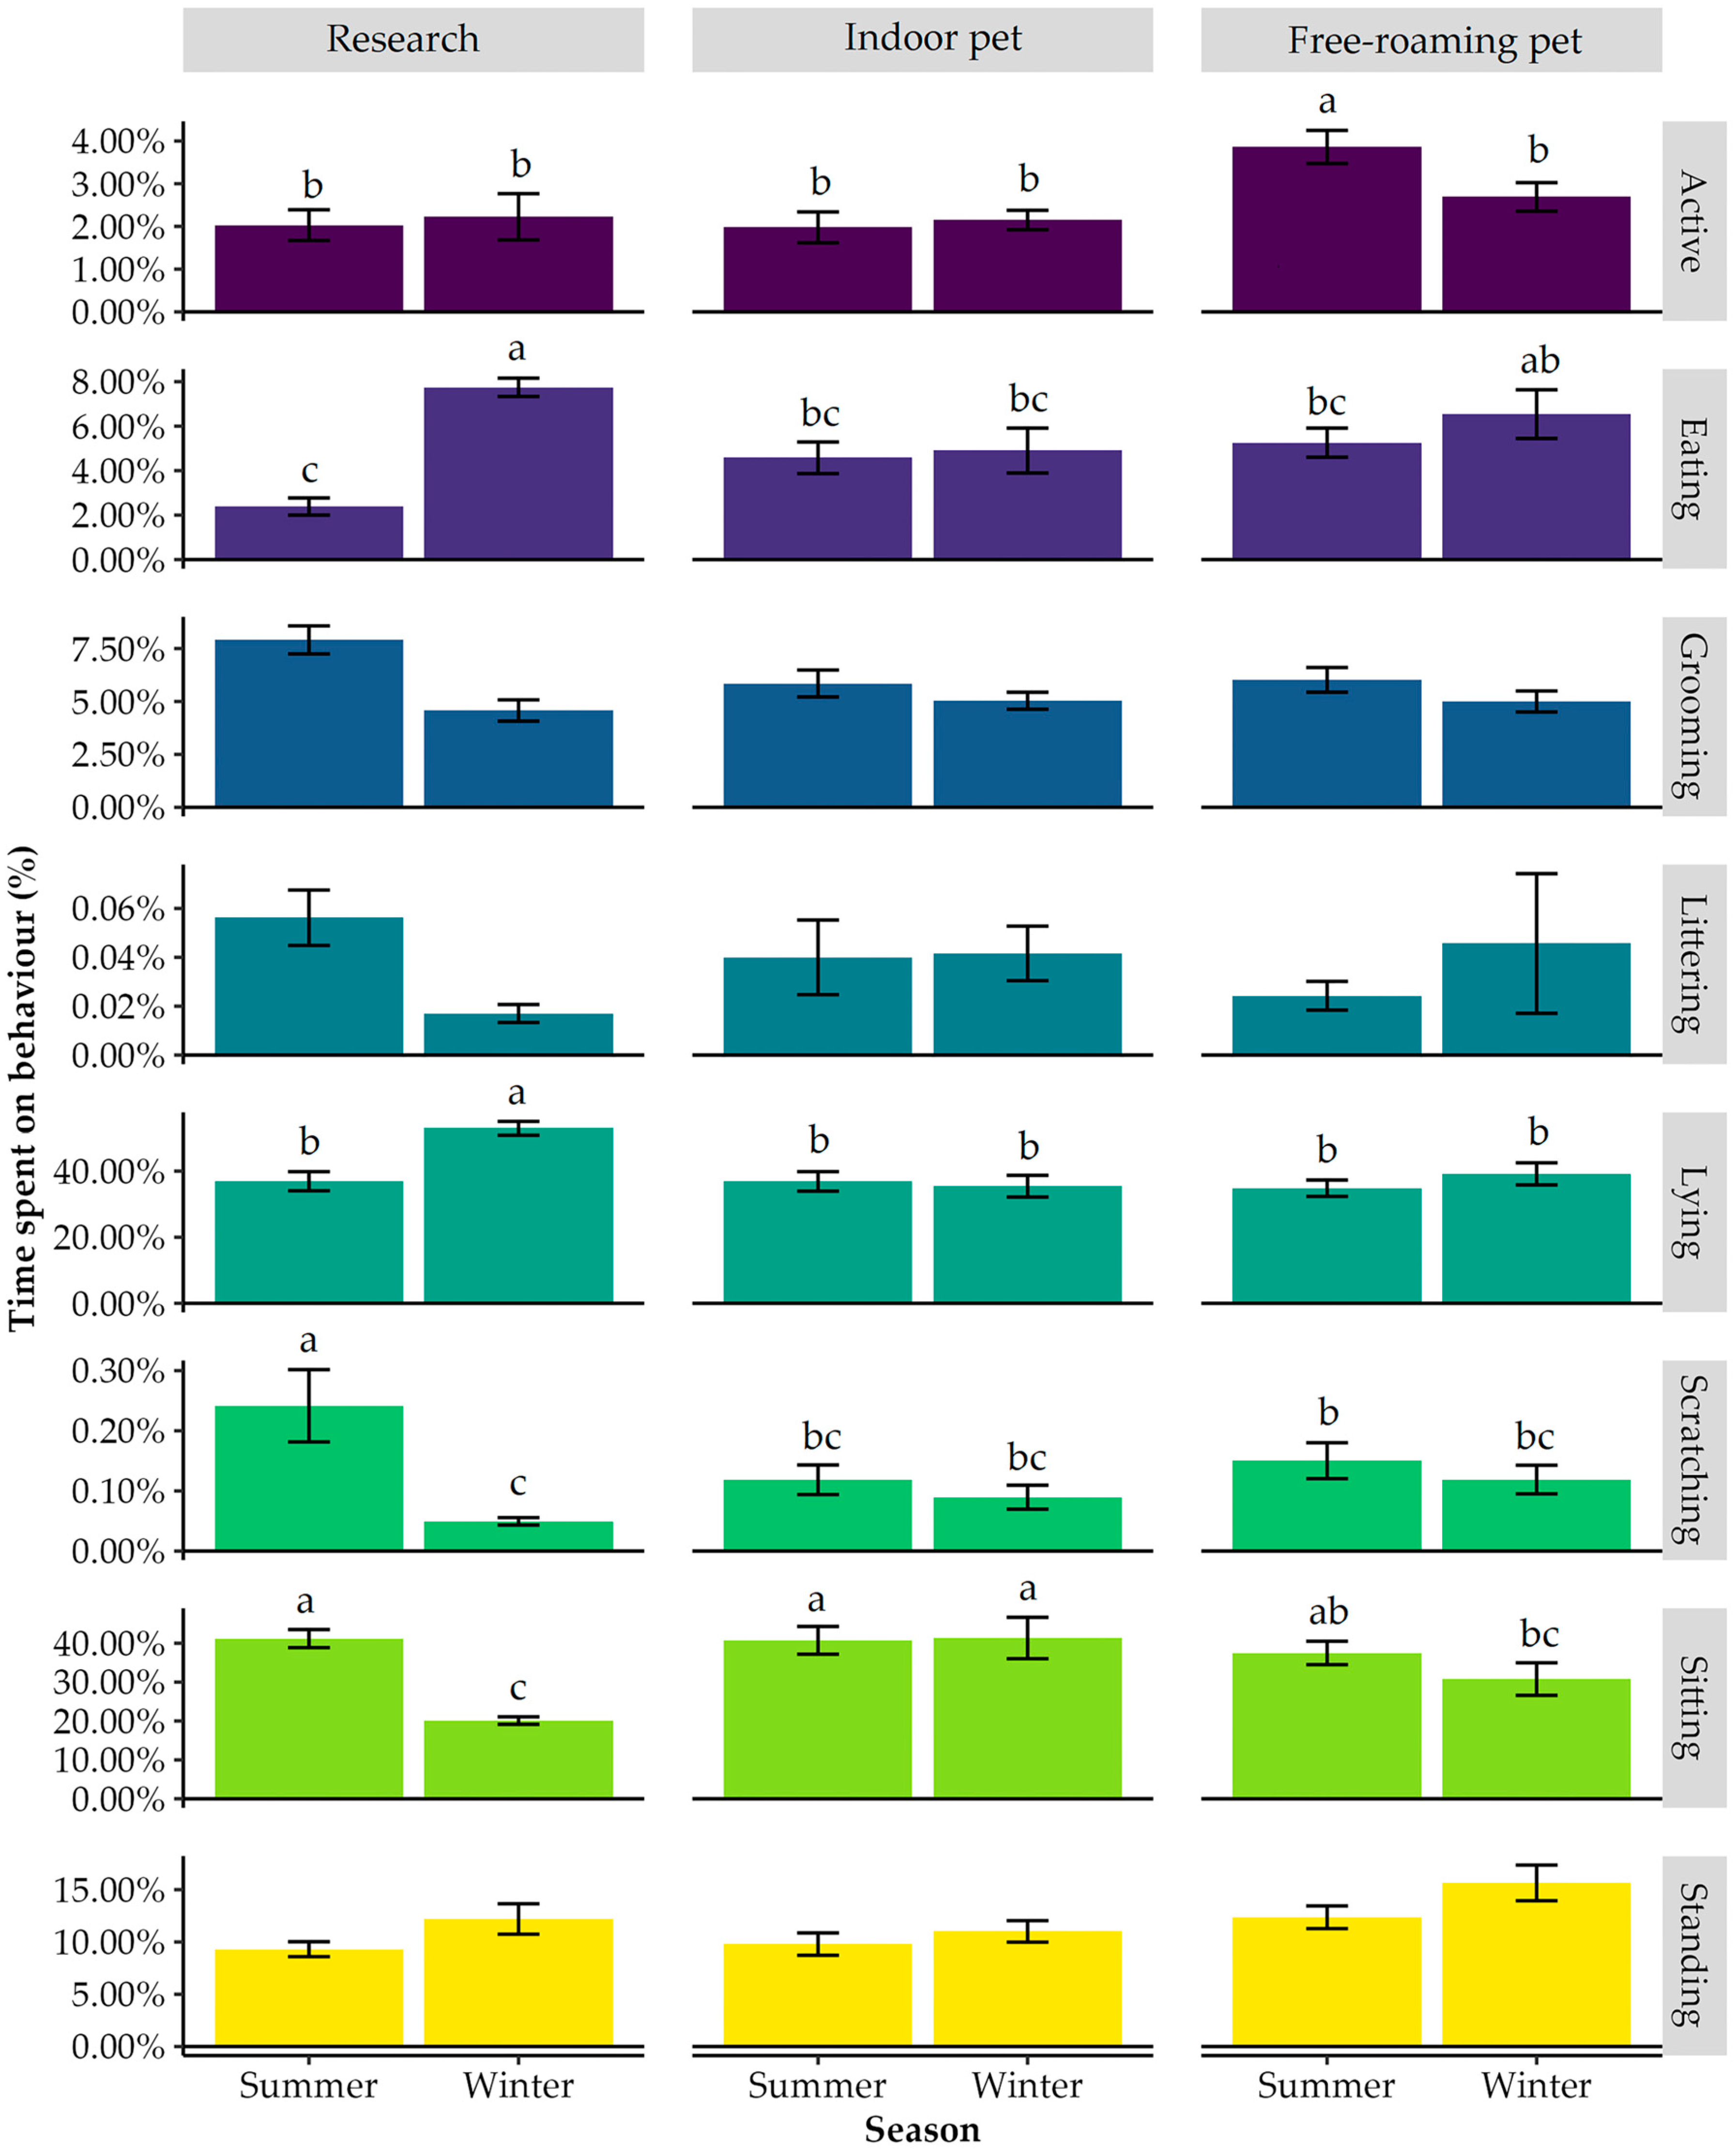
There was a significant interaction between season and housing on the proportion of time spent in active behaviours (p = 0.021). Free-roaming pet cats spent more time active in summer (3.9 ± 0.39%) than in winter (2.7 ± 0.33%; p < 0.001; Figure 1). During summer, free-roaming pet cats also spent more time active than both research (p = 0.004) and indoor pet cats (p < 0.001). In winter, however, no differences in active behaviours (p > 0.05) were observed between housing conditions. No difference or trend was seen in time spent showing active behaviours between summer and winter among either the research (2.0 ± 0.36% and 2.2 ± 0.54%, respectively; p > 0.10) or indoor pet cats (2.0 ± 0.36% and 2.2 ± 0.23%, respectively; p > 0.10; Figure 1). In addition, there were no differences or trends in active behaviours between the research and indoor pet cats in either season (p > 0.10).
Figure 1.
Average time spent showing each behaviour (classified with the model) across two periods within a year (summer and winter) of research cats (n = 8 cats × 3 weeks per period), indoor pet cats (n = 10 cats × 1 week per period), and free-roaming (n = 18 cats × 1 week per period) pet cats. a–c Within a behaviour, bars with different superscripts differ significantly (p < 0.05).
The variance in time spent exhibiting active behaviours explained by the model improved when including both cat as the random effect (p = 0.006) and the interaction of season × housing as a fixed effect (p = 0.002). The fixed effect of season × housing alone explained 22.9% of the variance, and the combination of the fixed and random effects explained 59.8%.
3.1.2. Eating
There was a significant interaction between season and housing on the proportion of time spent eating (p = 0.037). Research cats spent more time eating in winter (7.8 ± 0.41%) than in summer (2.4 ± 0.39%; p = 0.003; Figure 1). During winter, research cats spent more time eating than indoor pet cats (4.9 ± 1.01%; p = 0.050) and tended to spend more time eating than free-roaming pet cats (6.5 ± 1.10%; p = 0.084). During summer, research cats tended to spend less time eating than free-roaming pet cats (5.3 ± 0.66; p = 0.097). No significant seasonal differences or trends (p > 0.10) in time spent eating were observed for indoor pet cats (winter: 4.9 ± 1.01%), nor were there significant differences or trends between indoor and free-roaming pet cats during either season (p > 0.10).
The variance in time spent eating explained by the model did not improve when either cat was included as a random effect or the interaction of season × housing was included as a fixed effect (p > 0.05). The model with the random effect of cat and interaction explained 21.2% of the variance.
3.1.3. Grooming
Research cats spent 7.9 ± 0.66% and 4.6 ± 0.50% of their time grooming during summer and winter, respectively (Figure 1). In comparison, indoor pet cats spent 5.9 ± 0.64% in summer and 5.0 ± 0.40% in winter, while free-roaming pet cats spent 6.0 ± 0.50% and 5.0 ± 0.50%, respectively (Figure 1). There was no significant interaction or trend between season and housing on the proportion of time spent grooming (p > 0.10). Time spent grooming differed between seasons, with more grooming during summer (6.3 ± 0.39%) than winter (4.9 ± 0.30%; p < 0.001), while housing showed no effect or trend (p > 0.10).
The variance in time spent grooming explained by the model improved with the inclusion of season as a fixed effect (p = 0.002), but not when cat was included as a random effect (p > 0.05). The fixed effect explained 12.5% of the variance in time spent grooming, and both the random and fixed effects explained 32.0%.
3.1.4. Littering
Research cats spent 0.06 ± 0.011% and 0.02 ± 0.004% of their time littering during summer and winter, respectively (Figure 1), whereas indoor pet cats spent 0.04 ± 0.015% and 0.04 ± 0.011% and free-roaming pet cats spent 0.02 ± 0.006% and 0.05 ± 0.029%, respectively (Figure 1). No trends or significant effects were found for the interaction between season and housing, and the main effects of either season or housing on time spent littering (p > 0.10).
The variance in time spent littering explained by the model did not improve when including either cat as the random effect or the interaction of season × housing as the fixed effect (p > 0.05). The model with the random cat effect and fixed interaction effect explained 65.6% of the variance.
3.1.5. Lying
There was a trend for an interaction between season and housing on the proportion of time spent lying (p = 0.080). Research cats spent more time lying in winter (52.9 ± 2.03%) than summer (36.9 ± 2.89%; p = 0.009; Figure 1). No differences in time spent lying between summer and winter were found for either the indoor (36.9 ± 2.95% and 35.4 ± 3.29%, respectively; p > 0.05) or free-roaming pet cats (34.8 ± 2.48% and 39.2 ± 3.34%, respectively; p > 0.05). In winter, research cats spent more time lying than both indoor (p = 0.001) and free-roaming pet cats (p = 0.004).
The variance in time spent lying explained by the model improved with the inclusion of the interaction of season × housing as a fixed effect (p = 0.019) but not when including cat as a random effect (p > 0.05). The model with the random cat effect and fixed interaction effect explained 36.6% of the variance.
3.1.6. Scratching
There was a significant interaction between season and housing on the proportion of time spent scratching (p = 0.002). Research cats spent more time scratching during summer (0.24 ± 0.060%) than during winter (0.05 ± 0.006%; p < 0.001; Figure 1). No differences in time spent scratching were found between summer and winter for both indoor (0.12 ± 0.025% and 0.09 ± 0.020%, respectively; p > 0.05) and free-roaming pet cats (0.15 ± 0.030% and 0.12 ± 0.024%, respectively; p > 0.05). No differences in time spent scratching between housing conditions were found during winter (p > 0.05).
The variance in time spent scratching explained by the model improved with the inclusion of the interaction of season × housing as a fixed effect (p = 0.002) but not when including cat as a random effect (p > 0.05) in the model. The model with the random cat effect and fixed interaction effect explained 45.9% of the variance.
3.1.7. Sitting
There was a trend for an interaction between season and housing on the proportion of time spent sitting (p = 0.067). Research cats spent more time sitting in summer (41.4 ± 2.33%) than in winter (20.1 ± 0.097%; p = 0.004; Figure 1). For free-roaming pet cats, a trend was found for the difference in time spent sitting during summer (37.5 ± 3.01%) and winter (30.8 ± 4.19%; p = 0.061). For indoor pet cats, no differences in time spent sitting were found between summer (40.7 ± 3.57%) and winter (41.3 ± 5.32%; p > 0.05). During winter, indoor pet cats spent more time sitting than both research (p = 0.002) and free-roaming pet cats (p = 0.021). Time spent sitting did not differ between the research free-roaming pet cats in winter (p > 0.05), and no differences in time spent sitting between housing conditions were found during summer (p > 0.05).
The variance in time spent sitting explained by the model was improved by the inclusion of the interaction of season × housing as a fixed effect (p = 0.006) but not the random effect of cat (p > 0.05). The model with the random cat effect and fixed interaction effect explained 40.7% of the variance.
3.1.8. Standing
Research cats spent 9.3 ± 0.71% and 12.2 ± 1.46% of their time standing during summer and winter, respectively (Figure 1). In comparison, indoor pet cats spent 9.8 ± 1.07% in summer and 11.0 ± 1.03% in winter, while free-roaming pet cats spent 12.4 ± 1.08% and 15.6 ± 1.70%, respectively (Figure 1). There was no significant interaction or trend between season and housing on the proportion of time spent standing (p > 0.10). Time spent standing differed between seasons, with less standing during summer (11.0 ± 0.68%) than winter (13.6 ± 1.02%; p = 0.026). Time spent standing differed significantly between housing conditions (p = 0.012), with free-roaming pet cats spending more time standing (14.0 ± 1.03%) than indoor pet cats (10.4 ± 0.73%; p = 0.022). No significant differences or trends were found between research cats (10.8 ± 0.88%) and either indoor or free-roaming pet cats (p > 0.10).
The variance in time spent standing explained by the model was improved by the inclusion of season and housing as the fixed (main) effects (p = 0.006), but not when including cat as the random effect (p > 0.05) in the model. The model with the random cat effect and fixed effects explained 21.2% of the variance.
3.2. Daily Behaviour Patterns
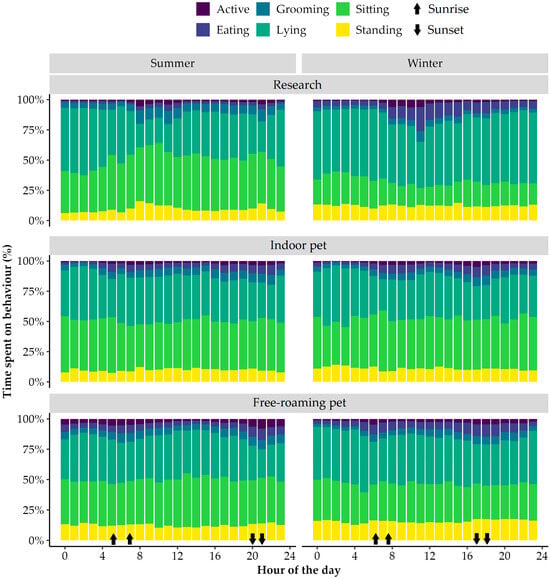
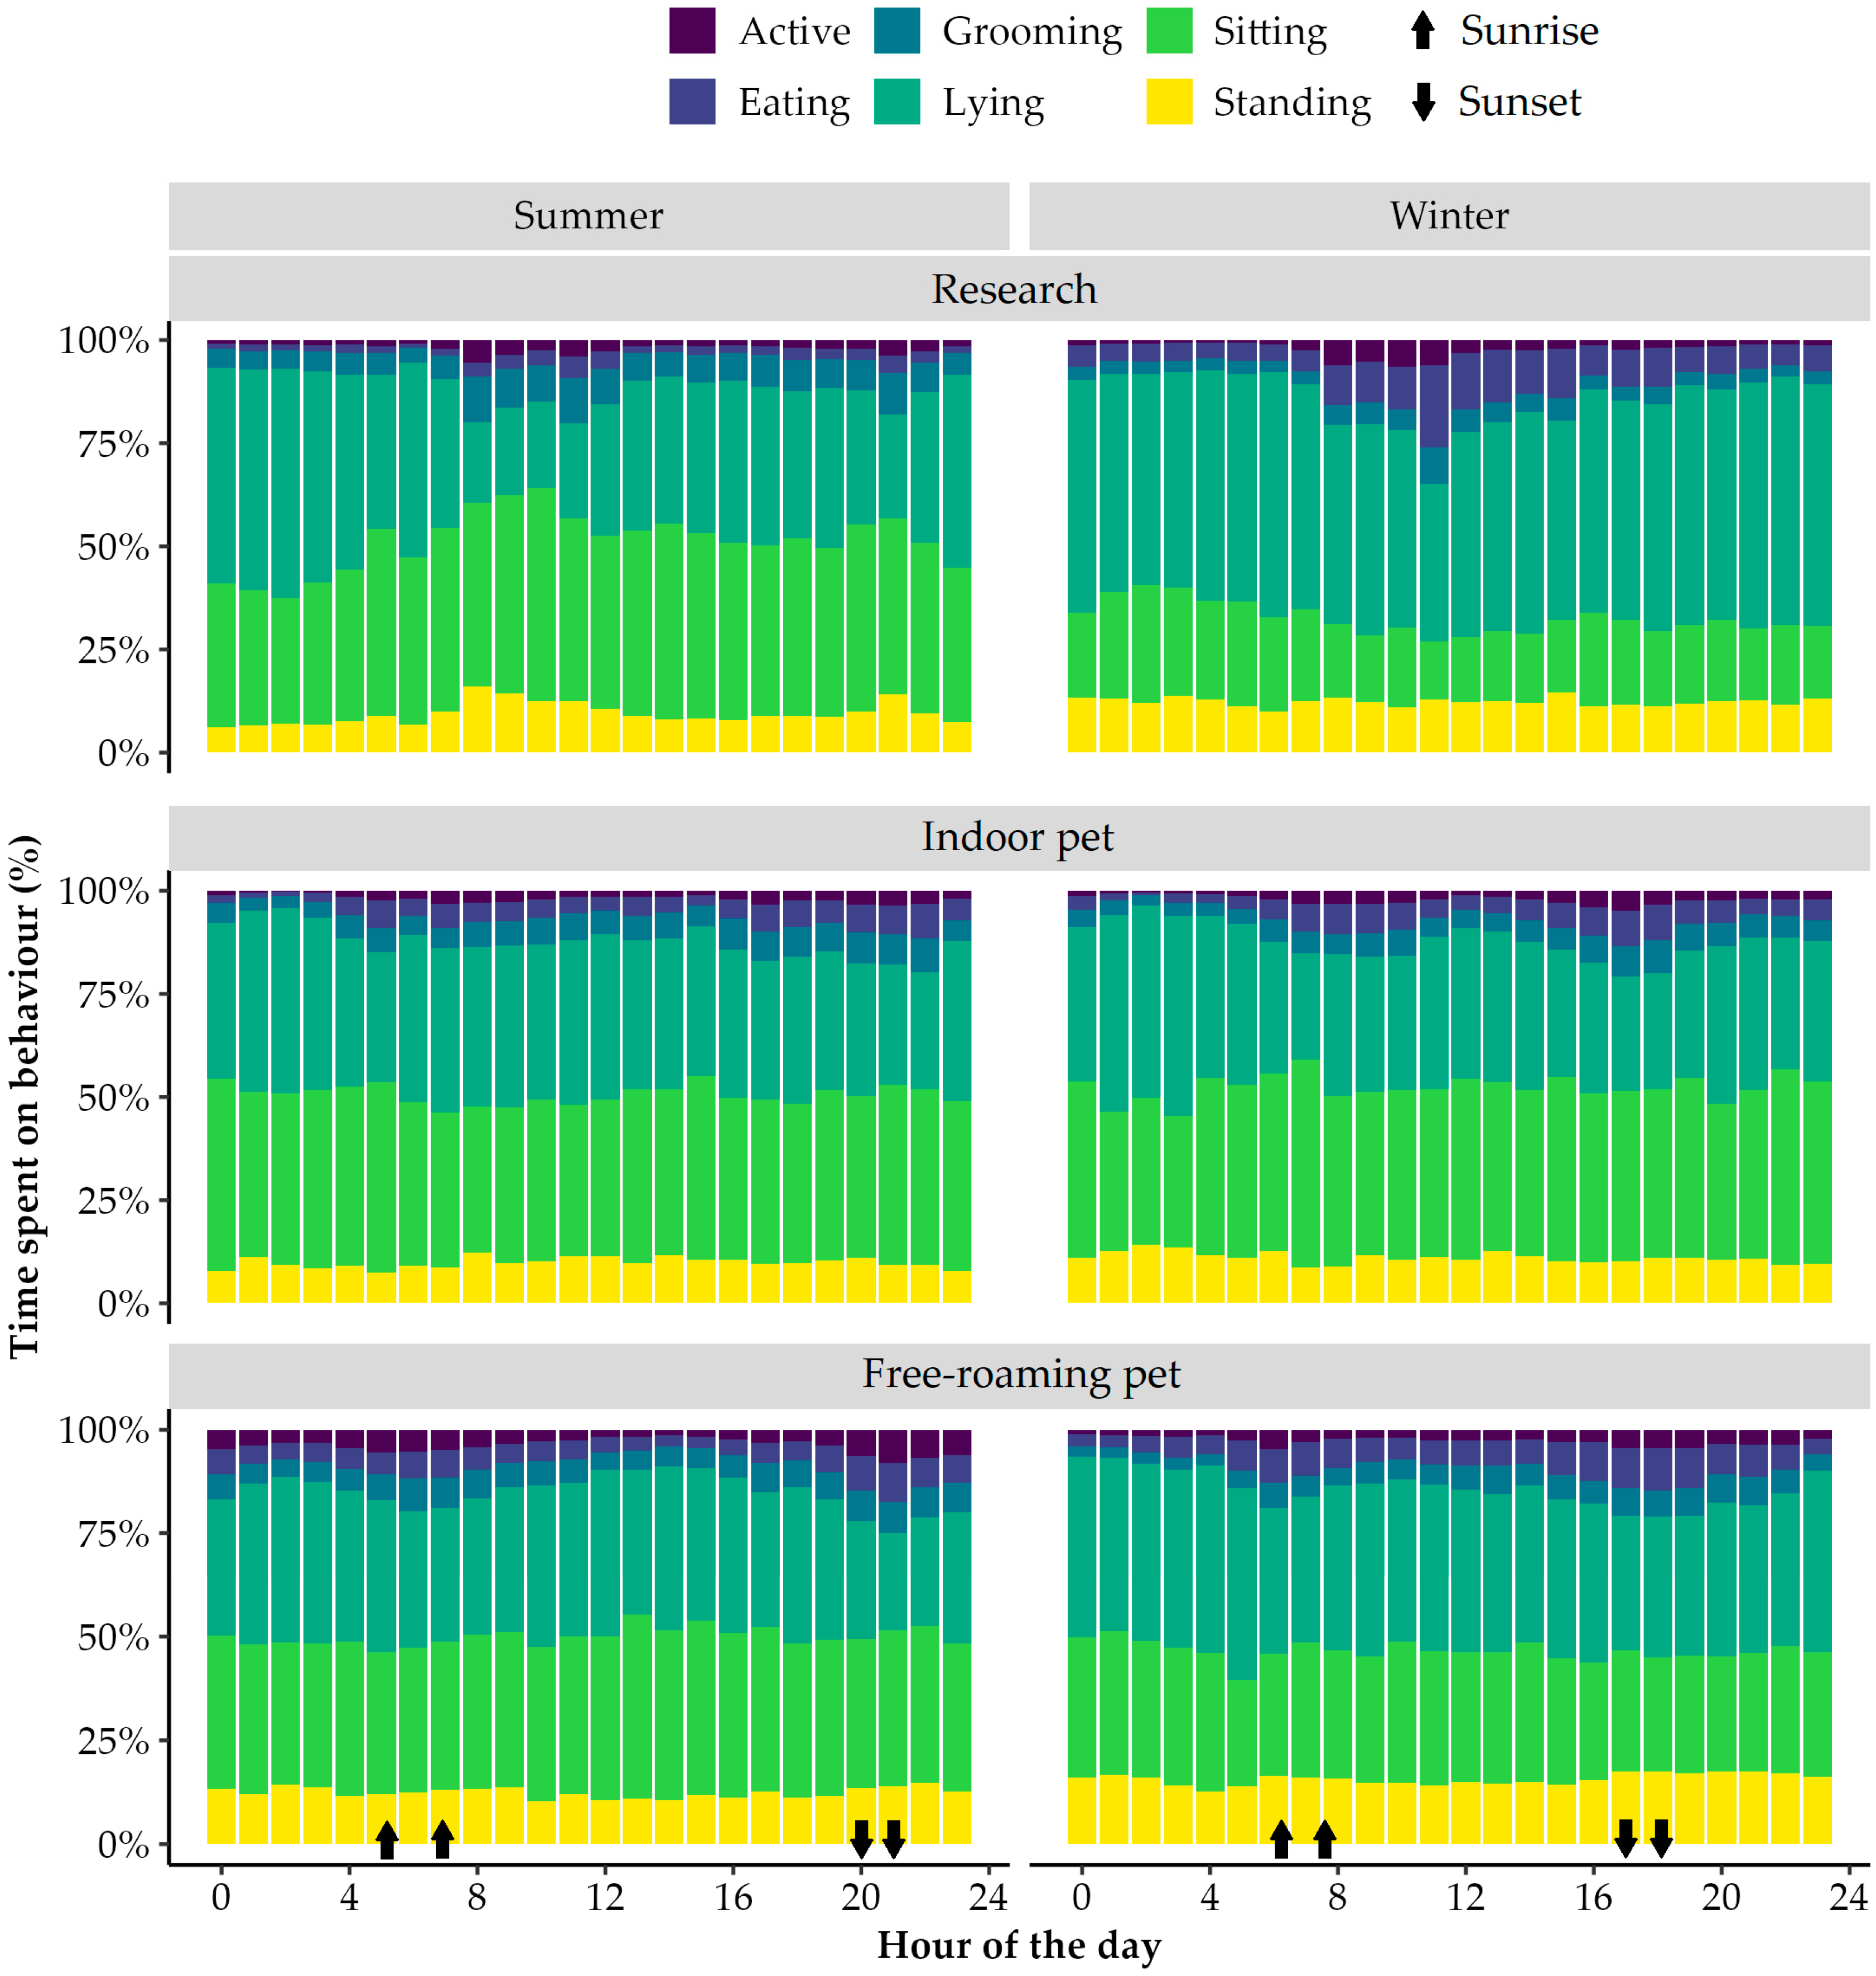
A bimodal pattern of behaviour was observed in both summer and winter, regardless of housing condition, which was primarily driven by active behaviours and eating (Figure 2). Free-roaming pet cats showed a clear bimodal pattern during both summer and winter; however, it was less prominent during summer for indoor pet cats. Among research cats, the bimodal pattern was less prominent during winter than during summer.
Figure 2.
Daily behaviour patterns (classified with the model), expressed per hour of the day, across two periods (summer and winter) of research cats (n = 7 × 21 days), indoor pet cats (n = 10 × 7 days), and free-roaming (n = 18 × 7 days) pet cats. Earliest and latest sunrise and sunset times for each period are indicated with arrows. Littering and scratching behaviours were removed from the plot due to their low proportion.
Regardless of season, research cats were most active between 07:00 and 12:00, which was when daily cleaning and feeding routines took place. A second peak was observed around the time of sunset in both summer and winter, though the peak was slightly more pronounced in summer than winter. For the pet cats, the peaks occurred around sunrise and sunset in both summer and winter. Free-roaming pet cats remained more active between sunset and sunrise in summer than in winter. This nightly activity was not observed in research cats and indoor pet cats.
4. Discussion
Combining the datasets of two studies that were carried out at the same time allowed a comparison of the activity budgets of research and pet cats. A foundational similarity observed across all populations, from feral cats to research cats in colonies and pet cats in homes, is the presence of a crepuscular, or bimodal, pattern in activity. Studies of feral cats consistently report activity peaks near dawn and dusk, a rhythm believed to be inherited from their wild ancestors and synchronised with prey availability [3,4]. In line with this, the current study confirms that this fundamental biological rhythm persists through domestication: the bimodal pattern observed in both research and pet populations appears to be primarily driven by behaviours associated with physical activity and feeding, reflecting the inherited nature of these peaks. Previous studies on indoor-housed research cats also reported a bimodal pattern driven by physical activity and eating [25,26,27]. However, while the underlying rhythm is shared, its expression is strongly influenced by the environment, particularly human influence.
The activity of research cats was strongly synchronised with the schedules of their caretakers, showing a prominent peak between 07:00 and 12:00 that coincided with daily cleaning and feeding regimes. A similar prolonged morning peak and second less pronounced peak around sunset have previously been observed in the same population of research cats [6]. A study with pet cats found that indoor-housed cats with one hour of garden access per day were more active when their owners were at home, whereas the cats with more extensive and unrestricted outdoor access were primarily nocturnal and maintained a robust daily activity independent of the schedule of the owner [5]. In the current study, the free-roaming pet cats showed a clear bimodal pattern aligning with dusk and dawn in both summer and winter. Indoor cats also displayed a bimodal rhythm, which was more pronounced in winter than in summer. In summer, two evening peaks were visible: one aligned closely with sunset, and one earlier, around 17:00. It is hypothesized that this earlier peak may correspond to owners returning home from work. In winter, activity peaks occurred around sunrise and sunset, and these peaks may have been reinforced by the temporal overlap between sunrise/sunset and typical owner work schedules, suggesting that natural crepuscular tendencies and human routines acted in combination. The weaker overall bimodality observed in summer may further reflect seasonal variation in household routines, such as school holidays, when human activity is more evenly distributed throughout the day and cats are exposed to less temporally concentrated social stimulation. As owner schedules were not directly recorded, this interpretation remains speculative.
The time allocated to maintenance behaviours, specifically grooming and scratching, also revealed a clear contrast based on environmental exposure, directly linking behaviour to underlying physiological cycles. A clear seasonal pattern was observed for scratching, with research cats spending significantly more time scratching in summer than in winter, while no seasonal differences were observed in indoor or free-roaming pet cats. Grooming behaviour also varied with season, with cats generally spending more time grooming in summer than in winter. However, this effect was not influenced by housing, indicating a more uniform seasonal response across groups. This pattern correlates with the natural hair growth and shedding cycle in domestic cats, which is primarily driven by photoperiod [11,12,14]. As cats shed their denser winter coat in response to increasing daylight hours and temperatures, grooming activity logically increases to manage the moult. In contrast, indoor-only pet cats did not show this seasonal pattern. Their lower exposure to natural, fluctuating light cycles and temperatures, coupled with their exposure to artificial lighting in winter, likely disrupts the environmental cues that trigger a pronounced seasonal moult. As a result, they do not have the same physiological need to grow a thick winter coat, and their grooming behaviour remains relatively constant throughout the year. It is also possible that owners aided the moult of their indoor-housed cats by means of brushing, lowering the increased need for self-grooming during the moult. Interestingly, the research cats also spent significantly more time grooming than pet cats overall, which may be explained by their housing conditions. Unlike free-roaming pet cats that can retreat indoors during inclement weather, the research cats were exposed to the outdoors year-round. This constant exposure may necessitate a thicker, denser coat for insulation, which in turn requires more intensive grooming to maintain during the moult.
These changes in active and maintenance behaviours are intrinsically linked to the time allocated for rest, governed by the principle of a finite time budget. When a cat spends less time on one behaviour, it must spend more time on another. This was clearly demonstrated in the free-roaming cats, whose reduced winter activity corresponded with a marked increase in lying behaviour, likely representing an energy conservation strategy to cope with the thermal challenges of winter. It is hypothesised that the reduction in active behaviour is the result of cats spending more time indoors, prioritising thermal comfort, as has been previously reported in free-roaming pet cats [28]. The research cats showed a similar pattern, spending more time lying down in winter, most likely within their sleeping boxes, which provided shelter and insulation.
Feeding behaviour also showed clear seasonal and housing-related differences. Research cats spent more time eating in winter than in summer and tended to spend more time eating than other groups during winter. In contrast, no seasonal differences were observed in indoor or free-roaming pet cats. The increased time spent eating in research cats during winter may reflect elevated energetic demands associated with continuous exposure to outdoor conditions and the need for thermoregulation. However, it is important to note that time spent eating does not necessarily correspond to food intake or energy consumption, as feeding rate and intake per bout may vary between individuals. Therefore, while these findings suggest behavioural adjustments consistent with increased energy demands, direct measures of energy intake would be required to confirm this relationship. Evidence for seasonal changes in energy requirements in domestic cats remains limited and inconsistent. Some studies have reported reduced energy requirements during winter under controlled conditions [29,30], whereas others have observed increased energy intake during colder months without corresponding changes in body weight [31]. This suggests that seasonal changes in energy balance may be influenced by a combination of thermoregulatory demands and activity patterns, rather than changes in maintenance requirements alone. The increased time spent eating observed in research cats during winter may, therefore, reflect behavioural compensation for higher energetic costs, rather than a direct increase in energy intake per se.
Several limitations should be considered when interpreting the findings of the current study. First, the study was conducted on a relatively small sample of cats (n = 36), including only eight research cats, which limits statistical power and the generalisability of the results to broader populations, particularly across different housing conditions and climatic regions. Second, behavioural classification relied on a machine learning model with an overall accuracy of approximately 73%, introducing inherent uncertainty in the behavioural estimates. This is particularly relevant for low-frequency behaviours such as littering, where observed proportions were very small. Inspection of the confusion matrix of the model indicated that littering was frequently misclassified as sitting or standing, likely leading to an underestimation of its true occurrence. Additionally, the study design cannot fully distinguish between direct environmental associations from indirect influences mediated by human behaviour, such as differences in owner routines, interaction patterns, or household structure. Together, these limitations highlight the need for caution when extrapolating these findings and the importance of validating results in larger and more diverse populations.
5. Conclusions
This study highlights the association of housing conditions and seasonality with the behaviour of domestic cats. Free-roaming pet cats adapted their activity levels to seasonal weather, whereas confined cats adapted their resting behaviours. While research and pet cats share fundamental biological rhythms, including a bimodal activity pattern, their behavioural expression differs according to housing and environmental exposure. These differences indicate that behavioural findings in research cats do not necessarily generalise to pet cats, and that the effects of behavioural interventions or enrichment may not transfer across settings. Overall, these findings emphasise the role of environmental context in shaping domestic cat behaviour and the need for a more individualised approach when assessing behaviour.
Author Contributions
Conceptualisation, M.S., R.A.C.-T., I.D., C.J.A., and D.G.T.; methodology, M.S.; software, M.S.; validation, M.S.; formal analysis, M.S.; investigation, M.S.; data curation, M.S.; writing—original draft, M.S.; writing—review and editing, R.A.C.-T., I.D., C.J.A., and D.G.T.; visualisation, M.S.; supervision, R.A.C.-T., I.D., C.J.A., and D.G.T.; project administration, M.S., R.A.C.-T., I.D., C.J.A., and D.G.T.; funding acquisition, D.G.T. All authors have read and agreed to the published version of the manuscript.
Funding
This research received no external funding.
Institutional Review Board Statement
The studies of which the data were used for this study were approved by the Massey University Animal Ethics Committee (MUAEC 22/23 and 22/24, approved on 20 May 2022), and the study involving pet cats was also approved by the Massey University Human Ethics Committee (MHEC400025773, approved on 22 July 2022).
Informed Consent Statement
Owner informed consent was obtained electronically at enrolment, with all participating cat owners required to confirm, via a mandatory checkbox in an online questionnaire, that they had read the study information and agreed to the use and publication of anonymised research data without inclusion of personally identifying information.
Data Availability Statement
The raw datasets for the results presented in this article are not readily available because they are too large. Requests to access the datasets should be directed to m.smit@massey.ac.nz.
Conflicts of Interest
The authors declare no conflicts of interest.
References
- Euromonitor International. Pet Population [Data Set]. Passport. 2024. Available online: https://www.euromonitor.com/passport (accessed on 14 August 2024).
- Horwitz, D.F.; Rodan, I. Behavioral awareness in the feline consultation: Understanding physical and emotional health. J. Feline Med. Surg. 2018, 20, 423–436. [Google Scholar] [CrossRef] [Scilit] [PubMed]
- Konecny, M.J. Home Range and Activity Patterns of Feral House Cats in the Galápagos Islands. Oikos 1987, 50, 17–23. [Google Scholar] [CrossRef] [Scilit]
- Lavery, T.; Alabai, M.; Holland, P.; Qaqara, C.; Vatohi, N. Feral cat abundance, density and activity in tropical island rainforests. Wildl. Res. 2020, 47, 660–668. [Google Scholar] [CrossRef] [Scilit]
- Piccione, G.; Marafioti, S.; Giannetto, C.; Panzera, M.; Fazio, F. Daily rhythm of total activity pattern in domestic cats (Felis silvestris catus) maintained in two different housing conditions. J. Vet. Behav. Clin. Appl. Res. 2013, 8, 189–194. [Google Scholar] [CrossRef] [Scilit]
- Smit, M.; Corner-Thomas, R.A.; Weidgraaf, K.; Thomas, D.G. Association of age and body condition with physical activity of domestic cats (Felis catus). Appl. Anim. Behav. Sci. 2022, 248, 105584. [Google Scholar] [CrossRef] [Scilit]
- Goszczyński, J.; Krauze-Gryz, D.; Gryz, J. Activity and exploration range of house cats in rural areas of central Poland. Folia Zool 2009, 58, 363–371. [Google Scholar]
- Haspel, C.; Calhoon, R.E. Activity Patterns of Free-Ranging Cats in Brooklyn, New York. J. Mammal. 1993, 74, 1–8. [Google Scholar] [CrossRef] [Scilit]
- Dunford, C.E.; Loca, S.; Marks, N.J.; Scantlebury, M. Seasonal habitat selection and ranging of domestic cats (Felis catus) in rural and urban environments. Anim. Biotelemetry 2024, 12, 13. [Google Scholar] [CrossRef] [Scilit]
- Izawa, M. Daily activities of the feral cat Felis catus Linn. J. Mammal. Soc. Jpn. 1983, 9, 219–228. [Google Scholar]
- Baker, K.P. Hair Growth and Replacement in the Cat. Br. Vet. J. 1974, 130, 327–335. [Google Scholar] [CrossRef] [Scilit] [PubMed]
- Hendriks, W.H.; Tarttelin, M.F.; Moughan, P.J. Seasonal Hair Growth in the Adult Domestic Cat (Felis catus). Comp. Biochem. Physiol. Part A 1997, 116, 29–35. [Google Scholar] [CrossRef] [Scilit]
- Hendriks, W.H.; Tarttelin, M.F.; Moughan, P.J. Seasonal hair loss in adult domestic cats (Felis catus). J. Anim. Physiol. Anim. Nutr. 1998, 79, 92–101. [Google Scholar] [CrossRef] [Scilit]
- Ryder, M.L. Seasonal changes in the coat of the cat. Res. Vet. Sci. 1976, 21, 280–283. [Google Scholar] [CrossRef] [Scilit]
- Smit, M.; Andrews, C.J.; Draganova, I.; Corner-Thomas, R.A.; Thomas, D.G. Longitudinal Study on the Effect of Season and Weather on the Behaviour of Domestic Cats (Felis catus). Animals 2025, 15, 637. [Google Scholar] [CrossRef] [Scilit]
- Foreman-Worsley, R.; Farnworth, M.J. A systematic review of social and environmental factors and their implications for indoor cat welfare. Appl. Anim. Behav. Sci. 2019, 220, 104841. [Google Scholar] [CrossRef] [Scilit]
- Smit, M.; Corner-Thomas, R.A.; Draganova, I.; Andrews, C.J.; Thomas, D.G. How Lazy Are Pet Cats Really? Using Machine Learning and Accelerometry to Get a Glimpse into the Behaviour of Privately Owned Cats in Different Households. Sensors 2024, 24, 2623. [Google Scholar] [CrossRef] [Scilit]
- Smit, M.; Ikurior, S.J.; Corner-Thomas, R.A.; Andrews, C.J.; Thomas, D.G. The Use of Triaxial Accelerometers and Machine Learning Algorithms for Behavioural Identification in Domestic Cats (Felis catus): A Validation Study. Sensors 2023, 23, 7165. [Google Scholar] [CrossRef] [Scilit]
- Stanton, L.A.; Sullivan, M.S.; Fazio, J.M. A standardized ethogram for the felidae: A tool for behavioral researchers. Appl. Anim. Behav. Sci. 2015, 173, 3–16. [Google Scholar] [CrossRef] [Scilit]
- Beaver, B.V.G. Feline Behavior: A Guide for Veterinarians, 2nd ed.; Elsevier Health Sciences: St. Louis, MO, USA, 2003. [Google Scholar]
- McGowan, N.E.; Marks, N.J.; Maule, A.G.; Scantlebury, D.M.; Schmidt-Küntzel, A.; Marker, L.L. Categorising cheetah behaviour using tri-axial accelerometer data loggers: A comparison of model resolution and data logger performance. Mov. Ecol. 2022, 10, 7. [Google Scholar] [CrossRef] [Scilit] [PubMed]
- RStudio Team. RStudio: Integrated Development for R, 4.1.1; RStudio, PBC: Boston, MA, USA, 2021. [Google Scholar]
- Brooks, M.; Bolker, B.; Kristensen, K.; Maechler, M.; Magnusson, A.; McGillycuddy, M.; Skaug, H.; Nielsen, A.; Berg, C.; van Bentham, K.; et al. Generalized Linear Mixed Models Using Template Model Builder. Available online: https://github.com/glmmTMB/glmmTMB (accessed on 1 October 2024).
- Lenth, R.V.; Banfai, B.; Bolker, B.; Buerkner, P.; Giné-Vázquez, I.; Herve, M.; Jung, M.; Love, J.; Miguez, F.; Piaskowski, J.; et al. Emmeans: Estimated Marginal Means, aka Least-Squares Means. Available online: https://github.com/rvlenth/emmeans/ (accessed on 1 October 2024).
- Parker, M.; Challet, E.; Deputte, B.; Ract-Madoux, B.; Faustin, M.; Serra, J. Seasonal effects on locomotor and feeding rhythms in indoor cats. J. Vet. Behav. 2022, 48, 56–67. [Google Scholar] [CrossRef] [Scilit]
- Parker, M.; Lamoureux, S.; Challet, E.; Deputte, B.; Biourge, V.; Serra, J. Daily rhythms in food intake and locomotor activity in a colony of domestic cats. Anim. Biotelemetry 2019, 7, 1–14. [Google Scholar] [CrossRef] [Scilit]
- Parker, M.; Serra, J.; Deputte, B.L.; Ract-Madoux, B.; Faustin, M.; Challet, E. Comparison of Locomotor and Feeding Rhythms between Indoor and Outdoor Cats Living in Captivity. Animals 2022, 12, 2440. [Google Scholar] [CrossRef] [Scilit] [PubMed]
- Horn, J.A.; Mateus-Pinilla, N.; Warner, R.E.; Heske, E.J. Home range, habitat use, and activity patterns of free-roaming domestic cats. J. Wildl. Manag. 2011, 75, 1177–1185. [Google Scholar] [CrossRef] [Scilit]
- Bermingham, E.N.; Roy, N.C.; Weidgraaf, K.; Hekman, M.; Thomas, D.G.; Tavendale, M.H. Seasonal and age effects on energy requirements in domestic short-hair cats (Felis catus) in a temperate environment. J. Anim. Physiol. Anim. Nutr. 2013, 97, 522–530. [Google Scholar] [CrossRef] [Scilit]
- Kappen, K.L.; Garner, L.M.; Kerr, K.R.; Swanson, K.S. Effects of photoperiod on food intake, activity and metabolic rate in adult neutered male cats. J. Anim. Physiol. Anim. Nutr. 2014, 98, 958–967. [Google Scholar] [CrossRef] [Scilit] [PubMed]
- Serisier, S.; Feugier, A.; Delmotte, S.; Biourge, V.; German, A.J. Seasonal variation in the voluntary food intake of domesticated cats (Felis catus). PLoS ONE 2014, 9, e96071. [Google Scholar] [CrossRef] [Scilit]

Disclaimer/Publisher’s Note: The statements, opinions and data contained in all publications are solely those of the individual author(s) and contributor(s) and not of MDPI and/or the editor(s). MDPI and/or the editor(s) disclaim responsibility for any injury to people or property resulting from any ideas, methods, instructions or products referred to in the content. |
© 2026 by the authors. Licensee MDPI, Basel, Switzerland. This article is an open access article distributed under the terms and conditions of the Creative Commons Attribution (CC BY) license.