


Abstract
Background. Blood gas analysis (BGA) is a decision-critical test with low biological variation, and it is increasingly performed outside the central laboratory. We synthesised the evidence on pre-analytical and analytical factors that affect its accuracy. Methods. Six databases were searched from inception to July 2026 for studies of a defined pre-analytical or analytical factor affecting blood gas parameters. The effect measure was the within-specimen paired change from immediate analysis. No stratum held more than two comparable studies, so the synthesis follows SWiM and reports no pooled magnitude. Changes were compared with published analytical specifications and with exploratory pragmatic limits. Results. Fourteen studies were included, four with extractable change data. Among pre-analytical factors, 60 min of undisturbed room-temperature storage in plastic syringes lowered pH in both contributing studies (−0.020, −0.021) and raised pCO2 in both (+2.10, +1.43 mmHg), without a consistent pO2 change. Lactate rose in all three studies with extractable lactate data (+0.55 to +1.37 mmol/L). Within patients, chilling raised pO2 by +18.0 and +4.5 mmHg, a four-fold difference confounded with temperature, baseline pO2 and study. Delay combined with mechanical stress raised pO2 by +33.7 mmHg, and air bubbles, plastic syringe walls and haemolysis also biased pO2, with haemolysis further biasing pH and electrolytes. Among analytical factors, within-run imprecision met desirable specifications, whereas the only point-of-care versus central-laboratory comparison (pO2 bias −10.1 mmHg) could not separate method bias from a median 56 min delay. Three of 14 threshold classifications changed with the limit applied, and only the 4 °C pO2 artefact exceeded every limit. Conclusions. In this limited evidence base, delay and temperature affected oxygenation and metabolic analytes in opposite directions. When pO2 is required, prompt analysis at room temperature with air expelled appears preferable. When lactate, glucose or acid–base status is the priority and delay is unavoidable, chilling may limit metabolic drift. The analytical interchangeability of point-of-care and laboratory analysers cannot be judged from the available data.
1. Introduction
Arterial and venous blood gas analysis is among the most clinically urgent measurements in laboratory medicine and, at the same time, among the most pre-analytically fragile. Its analytes carry low within-subject biological variation, so even a small handling-induced shift can cross a clinical decision limit and change ventilation, resuscitation or acid–base management [1]. The test is also increasingly performed at the point of care by operators working outside laboratory quality-management systems, so the safeguards a central laboratory provides against pre-analytical and analytical error are frequently absent [2,3].
The mechanisms are well understood. Whole blood remains metabolically active in vitro. Leukocytes and erythrocytes go on consuming oxygen and glucose and generating carbon dioxide and lactate, so the partial pressure of oxygen (pO2) and pH fall while the partial pressure of carbon dioxide (pCO2) and lactate rise during any delay. Superimposed on that metabolism are physicochemical processes that can act in the opposite direction, among them gas diffusion across the permeable wall of plastic syringes, equilibration with air bubbles, and temperature-dependent shifts in gas solubility and in the affinity of haemoglobin for oxygen. The most striking of these is the paradoxical rise in pO2 that follows chilling of specimens held in plastic syringes [1,4]. Haemolysis, an inappropriate anticoagulant and dilution add further bias that differs from one analyte to another [4].
Despite a primary literature spanning five decades, guidance remains inconsistent. Recommendations still oscillate between “analyse within 15 min”, “ice everything” and “never ice plastic”, and the reported effects have not been synthesised quantitatively or benchmarked against objective analytical-quality specifications. We synthesise the evidence on the pre-analytical determinants (analysis delay, storage temperature, syringe material, air, anticoagulant, haemolysis and specimen source) and on the analytical determinants (analyser imprecision, point-of-care versus central-laboratory agreement, co-oximetry and interferences), and we compare the observed effects with analytical-quality specifications and with exploratory clinical-significance limits. Pre-analytical and analytical sources of error are reported separately, and comparisons in which the two cannot be separated are identified as such.
2. Methods
2.1. Protocol, Registration and Reporting
The review was registered prospectively (PROSPERO CRD420261407539) and is reported in accordance with the PRISMA 2020 statement [5]. Because no exposure stratum yielded enough studies to support a conventional meta-analysis, the synthesis is also reported in accordance with the Synthesis Without Meta-analysis (SWiM) guideline [6].
2.2. Eligibility Criteria (PECO)
The eligibility criteria were structured according to the PECO framework (population, exposure, comparator and outcome), together with the eligible study designs, and are summarised in Table 1.
Table 1.
PECO eligibility framework.
2.3. Information Sources and Search Strategy
We searched PubMed/MEDLINE, Embase, Scopus, Web of Science, CINAHL and the Cochrane Library from inception to July 2026, and supplemented the database searches with backward and forward citation chasing. Seven structured strings combined the concept blocks “blood gas analysis” AND (“pre-analytical” OR delay OR storage OR stability OR temperature OR syringe OR point-of-care) AND the target-analyte terms. The full strings and their yields are provided in Table S1.
2.4. Study Selection and Data Extraction
Records were screened against the PECO criteria, and potentially eligible reports were assessed at full-text or full-record level. Extraction was performed by one reviewer and independently checked against the source tables by a second author. Every extracted value carries its source location, meaning the table and the row, in the extraction sheet (Table S1). Values reported in kPa were converted to mmHg (×7.5006).
Two studies report their gas tensions to one decimal in kPa, so a change of 0.1 kPa is the resolution limit, equivalent to ±0.75 mmHg, and both report pH to two decimals, so a change of −0.020 is determined only to within −0.030 and −0.010. Estimates limited by source rounding are identified as such wherever they are reported.
2.5. Effect Measures and the Within-Subject Correlation
The primary effect measure was the within-specimen paired change from immediate analysis, Δ = Mtime − Mbaseline, in native units. Split-sample studies report the standard deviation of the level rather than of the change, so the paired-change SD was reconstructed as SDdiff = √(SDb2 + SDt2 − 2·r·SDb·SDt). The within-subject correlation r was imputed at 0.90, a value that repeated measurement of the same split specimen justifies, and was varied from 0.60 to 0.95 in sensitivity analysis. For agreement studies the effect measure was the reported mean bias with its 95% limits of agreement.
Where a source reports an exact paired p-value for the same comparison, r is recovered from it by inverting the paired t statistic. Doing so shows that r is strongly analyte-dependent, being governed by the ratio of between-patient spread to within-patient change (Table 2).
Table 2.
Within-subject correlations recovered from the sources’ own paired tests.
pO2 has a very large between-patient spread, with an SD of 40.9 mmHg on a mean of 85.7, so its within-subject correlation approaches unity. pH has a narrow spread and a much lower correlation. A single imputed correlation is therefore anti-conservative for pH and over-conservative for pO2, in each case in the direction that distorts the corresponding claim.
Where the source reports only a bound such as p below 0.001, or reports no test at all, r is imputed at 0.90 and the estimate is flagged as assumption-dependent. For those estimates, Table S4 gives the interval across the full grid from r = 0.60 to r = 0.99 rather than a single interval.
The significance verdict for every study is that study’s own. The source analysed the actual paired observations whereas this review has only the marginal summaries; therefore, where a reconstruction and a source test disagree, we defer to the source and say so. Two studies required no reconstruction at all. Gutermuth et al. [7] report the mean difference with its 95% confidence interval and its limits of agreement, and White et al. [8] report the mean change with its standard error.
Table 2 of the original article by Gutermuth et al. [7] labels two columns as confidence intervals of the limits of agreement, but those columns in fact contain the 95% confidence interval of the mean difference, which is established because their midpoint reproduces the reported mean for every analyte. Our reading of that table is an inference and is recorded as such. That paper also prints the pO2 unit as mmol/L in its Table 2, while Table 1 and the text of that article give mmHg. Additionally, it states a mean pO2 rise of 38 mmHg in the text against 33.74 in its Table 2. We use the table value.
2.6. Synthesis Methods
No exposure stratum contained more than two studies reporting a comparable analyte at a matched storage time. The primary synthesis is therefore a structured narrative synthesis reported in accordance with SWiM. Studies are grouped by exposure stratum, and for each one we report the direction of effect, the source’s own significance verdict, and whether the observed magnitude crosses the pre-specified clinical-acceptability limits, which are treated as exploratory (Section 2.7). Study-level estimates are displayed without a pooled diamond (Section 3.4). Direction concordance is reported descriptively and is not treated as a test. With two to four studies a sign test has no useful power, and the direction of the metabolic effects is mechanistically pre-determined, so concordance corroborates the mechanism rather than establishing an effect size.
Pooled estimates are not reported as results. At k = 2 the Hartung–Knapp variance correction is degenerate. Its variance multiplier equals 1 in every stratum, being truncated to 1 where Q falls below its degrees of freedom and being exactly 1 wherever τ2 exceeds zero, as the DerSimonian–Laird τ2 is by definition the value that makes the τ2-weighted Q equal to its degrees of freedom [9]. The Hartung–Knapp standard error is therefore identical to the random-effects standard error, and the interval is simply the estimate plus or minus t(1, 0.975) times that standard error, which is a fixed 6.482758 times the Wald interval in every stratum, whatever the data. An interval constructed this way cannot exclude the null unless the Wald z exceeds 6.48, so reporting that a pooled interval includes the null would present a property of the t distribution as an empirical finding. The calculation is shown in Table S5 as a demonstration of why two-study pools should not be interpreted, and nowhere else.
For the same reason I2 is not used to characterise the evidence [10]. At k = 2, Q has one degree of freedom, so I2 exceeds 50% roughly one time in six under exact homogeneity, and here it would be computed from standard errors that this review reconstructed rather than from reported ones.
Chilling is analysed as a within-patient contrast. Both quantitative studies supply the room-temperature arm and the cold arm from the same patients and the same baseline row, so the effect of chilling is Δcold − Δroom within each study rather than a comparison of two separately pooled numbers. Its standard error is not recoverable from marginal summaries, since that requires the correlation between the two arms and no source reports it, so we give the paired point estimate and no interval.
Three exposure strata were pre-specified and are never combined. The first is undisturbed storage in plastic syringes, stratified by temperature. The second is storage combined with standardised mechanical stress, represented by Gutermuth [7]. The third is umbilical cord blood, represented by White [8].
Factors were also classified by the phase in which the error arises. In vitro specimen stability, comprising analysis delay, storage temperature, syringe material, air contamination and agitation, is pre-analytical and acts on the specimen after it has left the patient. Specimen collection and quality, comprising anticoagulant, haemolysis, line clearance and specimen source, is also pre-analytical but is fixed at the moment of collection. Analyser imprecision, calibration, co-oximetry interference and between-system agreement are analytical. These sources are synthesised separately, in Section 3.4, Section 3.5, Section 3.6 and Section 3.7 and the first two parts of Section 3.8 for specimen stability, in the remainder of Section 3.8 for collection and quality, and in Section 3.9 for analytical factors. A comparison in which a delay and a change of analyser occur together is reported as confounded and is not used to support a conclusion about analytical interchangeability.
Gutermuth [7] is reported whole as its own stratum and is never pooled. Every one of its 240 specimens received a 60 min delay together with a mechanical-stress protocol, the study contains no undisturbed-storage arm, and its authors attribute its pCO2 rise to the Haldane effect consequent on oxygen ingress rather than to metabolism. Because these strata are not interchangeable, studies drawn from them are not counted as replications of the undisturbed-storage estimates. They are reported alongside those estimates as corroborating a mechanism, and the difference in exposure is stated each time.
Analyses were performed in R version 4.4.1 (R Foundation for Statistical Computing, Vienna, Austria). Every reported statistic was recomputed by a second and independent implementation before release.
2.7. Clinical-Acceptability Benchmarking
Study-level Δ values were benchmarked against two sets of limits.
The first set is analytical. It comprises the allowable-total-error limits of the Royal College of Pathologists of Australasia as used by the included studies [11,12], for example pH ± 0.04 and sO2 ± 4%, and, for Gutermuth [7], the German Rili-BAEK limits that its own analysis applied. These are not interchangeable estimands. RCPA limits are consensus external-quality-assessment specifications, Ricos limits derive from biological variation, and Rili-BAEK limits are legally binding German external-quality-assessment limits. Where a source’s verdict is quoted, the scheme it used is named.
The second set comprises pragmatic clinical-significance limits of pO2 ± 5 mmHg, pCO2 ± 2 mmHg, pH ± 0.03 and lactate ± 0.5 mmol/L, which are used for orientation in the figures. These are not derived from a published consensus and are not offered as a standard. Expressed in native units at the baseline concentrations of the contributing studies, they lie close to the analytical specifications that those studies themselves applied. At the baseline pO2 of 105.0 mmHg in Çuhadar, the RCPA pO2 limit of 5% corresponds to 5.25 mmHg. At baseline pCO2 values of 42.0 and 35.8 mmHg, the desirable total error for pCO2 derived from biological variation, 5.7%, corresponds to 2.39 and 2.04 mmHg, and at a baseline lactate of 1.97 mmol/L the corresponding lactate specification of 30.4% corresponds to 0.60 mmol/L [11]. The pH limit of 0.03 is deliberately tighter than the RCPA limit of 0.04. The pragmatic limits nevertheless remain round numbers that have not been validated against clinical decisions or outcomes. Because a substantial part of the interpretation depends on whether an estimate crosses a limit, every threshold-based statement in this review is treated as exploratory, and a sensitivity analysis re-classified each 60 min estimate from the two undisturbed-storage studies against the specifications tabulated by Çuhadar and against the United States CLIA proficiency-testing criteria (Section 3.7). Where the pragmatic limits conflict with a cited analytical limit, as the pragmatic pH band of 0.03 does with the looser RCPA band of 0.04, both are reported and neither is allowed to settle a claim on its own. Section 4.5 states what would be needed to put these limits on a defensible footing.
Neither set is a measurement-uncertainty framework. ISO 15189:2022 [13] requires laboratories to estimate measurement uncertainty for quantitative results, including at the point of care, and under that framework a pre-analytical delay contributes a component to the combined uncertainty rather than a bias to be compared against a total-error band. Section 4.5 returns to this.
2.8. Risk-of-Bias Appraisal
Each study was appraised across five domains adapted to stability and agreement designs. These were standardisation of specimen handling, analyser control and calibration, completeness of time points, statistical appropriateness in terms of paired methods and multiplicity, and risk of selective reporting. Domains were rated low risk, some concerns or high risk. Per-study and per-domain judgements are given in Table S2.
3. Results
3.1. Study Selection
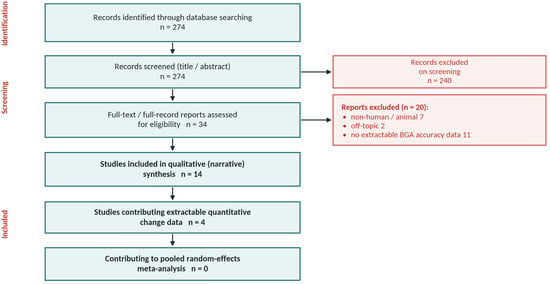
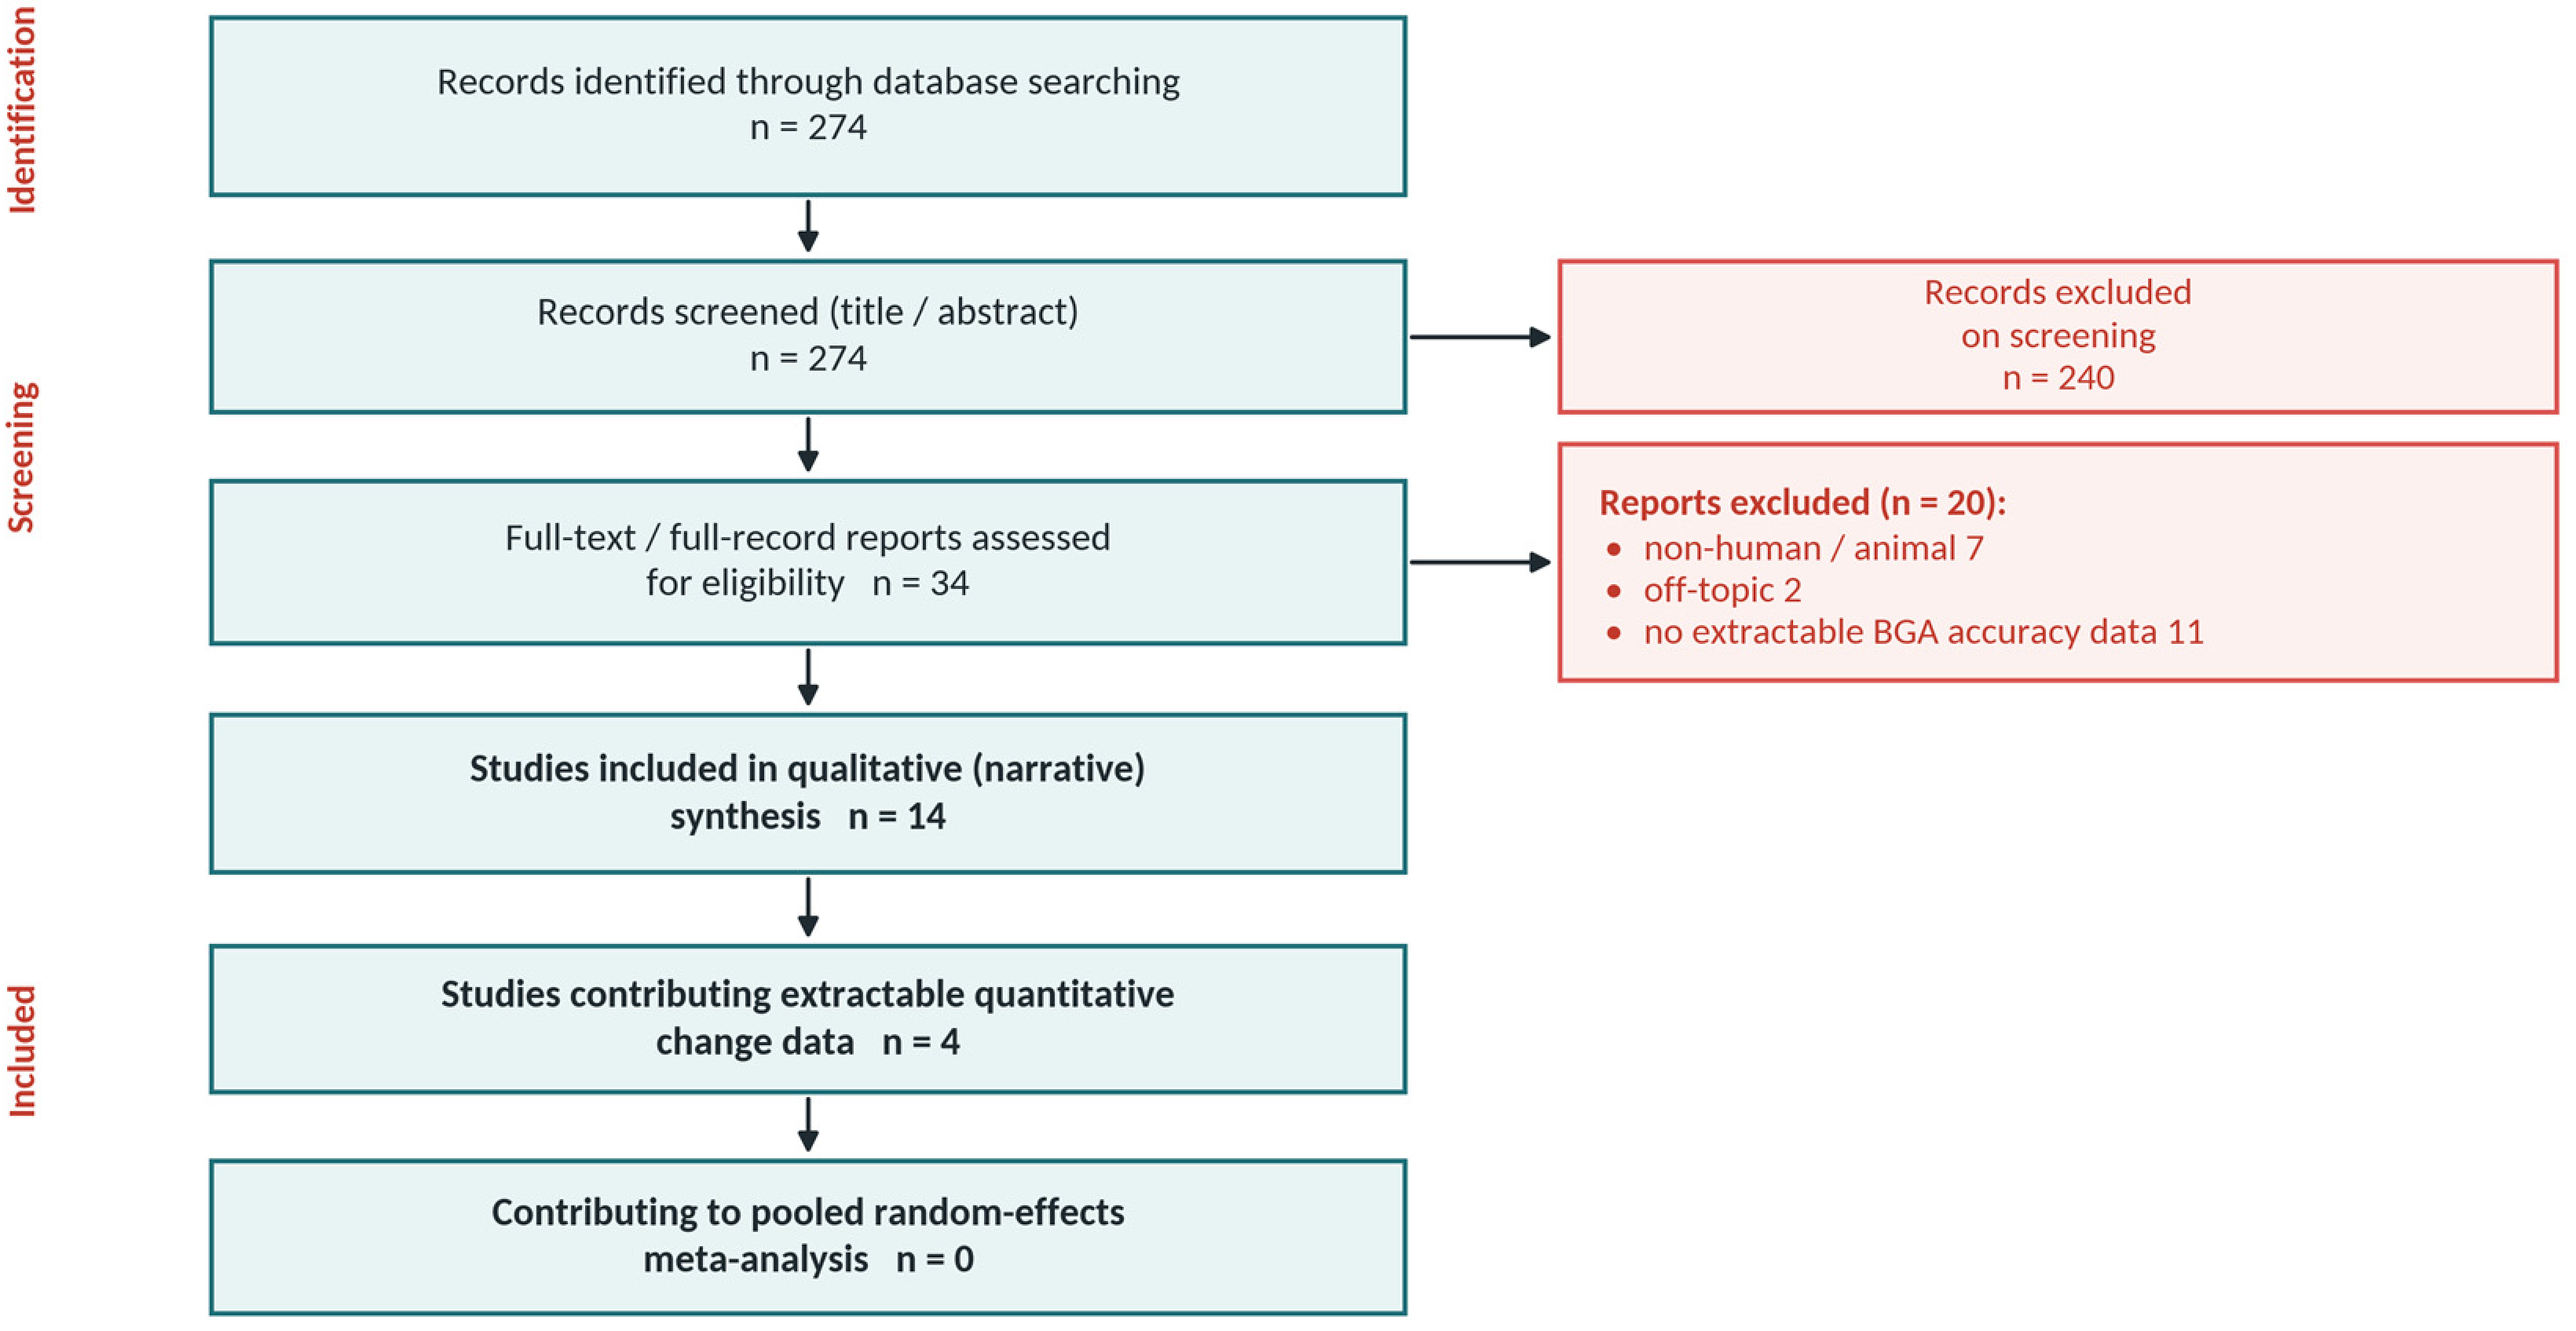
The six databases returned 274 records. After title and abstract screening and full-record assessment of 34 reports, 20 were excluded, comprising 7 animal studies, 2 off-topic reports and 11 that carried no extractable BGA accuracy data. Fourteen studies entered the qualitative synthesis and four of them provided extractable quantitative change data (Figure 1). Those four were two split-sample storage studies (Çuhadar [11] and Mohammadhoseini [14]), one large cohort in which storage was combined with mechanical stress (Gutermuth 2025, n = 240 [7]) and one randomised umbilical-cord trial (White 2012 [8]).
Figure 1.
PRISMA 2020 flow diagram.
3.2. Characteristics of Included Studies
The design, sample size, analyser and principal finding of each of the 14 included studies are summarised in Table 3.
Table 3.
Characteristics of the included studies.
3.3. Risk of Bias
The split-sample stability studies were generally at low to moderate risk. Specimen handling and analyser calibration were well standardised, but time points were sometimes sparse and multiplicity across many analytes and time points was rarely controlled, which raised some concerns about selective reporting. The randomised trial by Knowles [19] was at low risk for the material comparison. The agreement study by Krzych [22] was at low risk for the bias estimate but confounded delay with method. Samples were small, at 20 and 45, in the two studies contributing undisturbed-storage estimates. Per-domain judgements appear in Table S2. Çuhadar’s 20 patients and Mohammadhoseini’s 45 each supply both the room-temperature and the cold estimates from the same specimens and the same baseline row. Those estimates are not independent, which is precisely why the chilling effect is reported as a within-patient contrast in Section 3.5.
3.4. Quantitative Synthesis of Analysis Delay and Storage Temperature
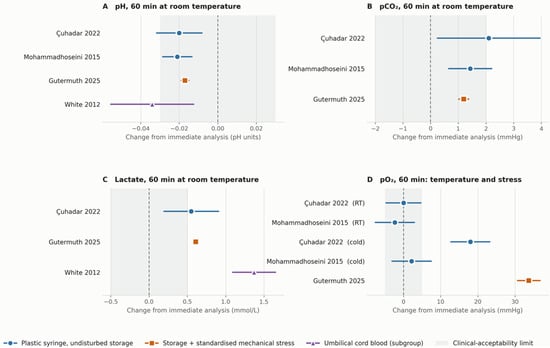
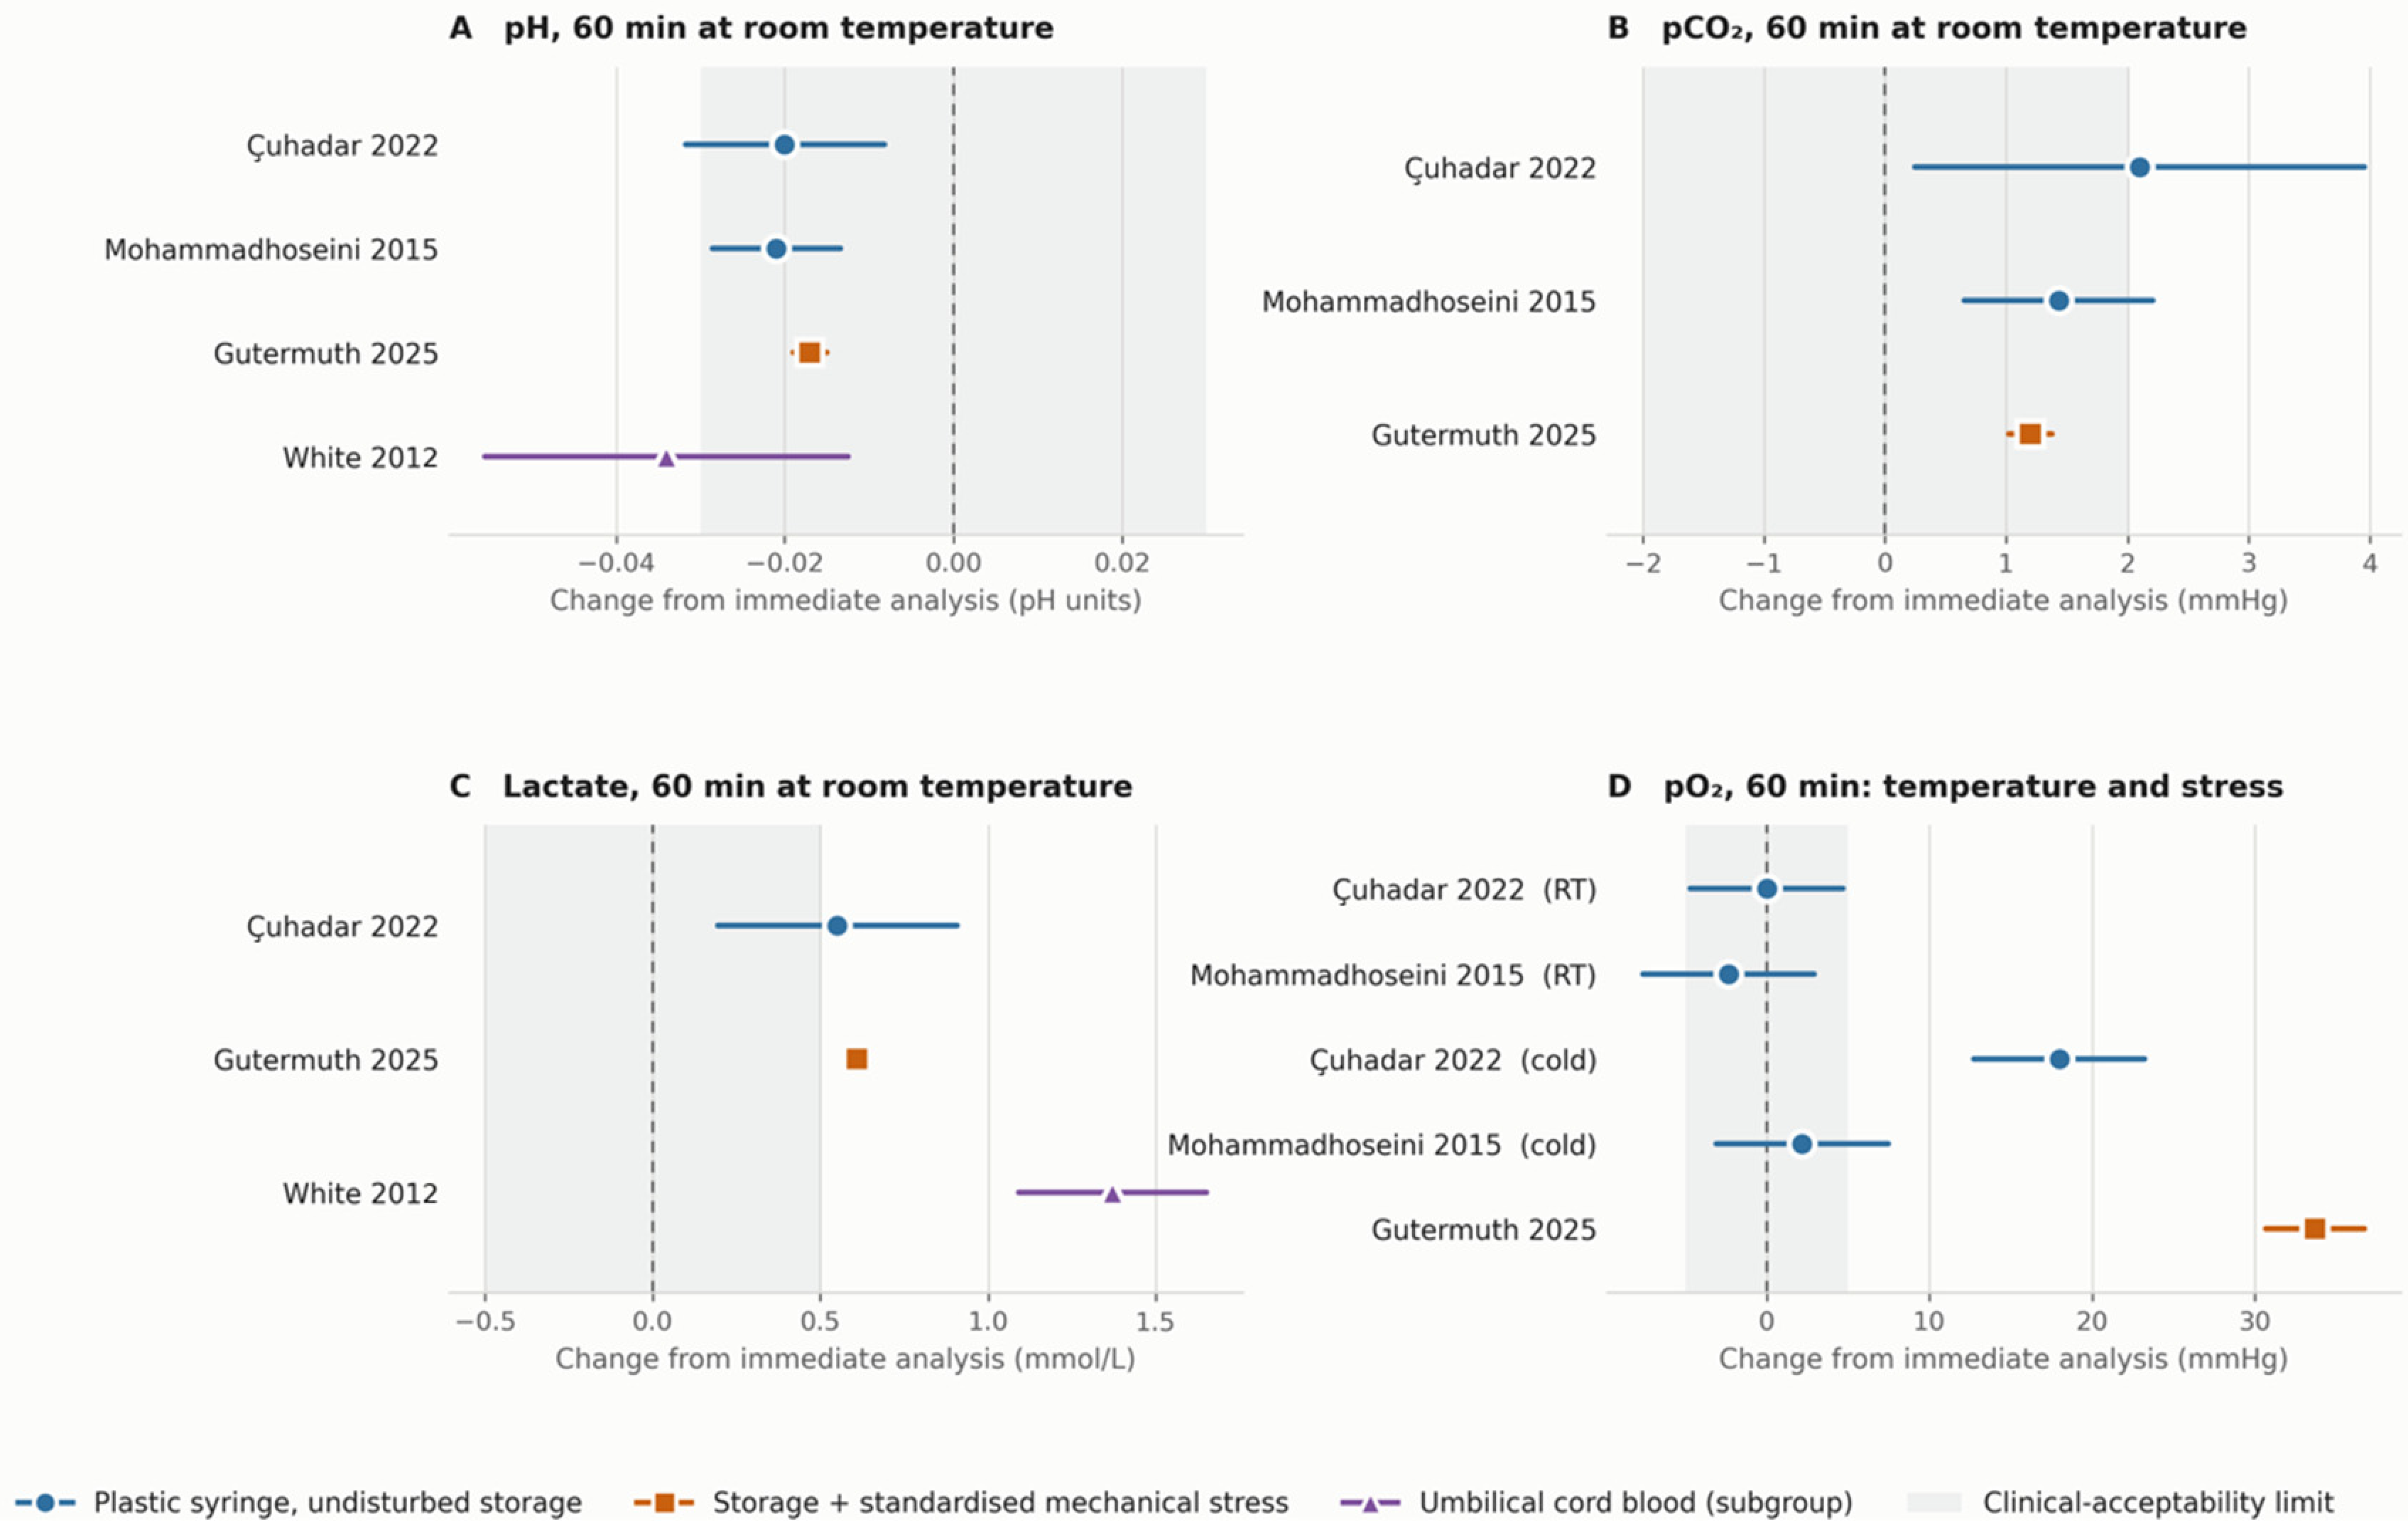
Two studies contributed data to this analysis. Because each study reported its own paired statistical test, the corresponding statistical findings were retained and are presented in Figure 2.
Figure 2.
Study-level 60 min change by exposure stratum. (A) pH, (B) pCO2 and (C) lactate after 60 min at room temperature; (D) pO2 after 60 min at room temperature (RT), after cold storage (cold; 4 °C in Çuhadar and 0 °C in Mohammadhoseini) and after storage with standardised mechanical stress. Data are from Çuhadar 2022 [11], Mohammadhoseini 2015 [14], Gutermuth 2025 [7] and White 2012 [8]. Each row is one study’s own estimate with its 95% confidence interval, and there is deliberately no pooled diamond, because at k = 2 a summary effect is degenerate (Section 2.6 and Table S5). Colour and marker shape jointly encode the exposure stratum, so identity does not rest on colour alone. Shaded bands mark the pragmatic clinical-significance limits of Section 2.7, which are exploratory orientation aids rather than a standard.
pH fell in both, by −0.020 with a 95% confidence interval of −0.033 to −0.007 in Çuhadar, where p was below 0.001, and by −0.021 with an interval of −0.033 to −0.009 in Mohammadhoseini, where p was 0.001. Both magnitudes lie inside the RCPA limit of 0.04 and at the edge of the tighter pragmatic band of 0.03. Çuhadar reports pH to two decimals, so its −0.020 is determined only to within −0.030 and −0.010.
pCO2 rose in both, by +2.10 mmHg with an interval of +0.50 to +3.70 in Çuhadar, where p was 0.013, and by +1.43 mmHg with an interval of +0.63 to +2.23 in Mohammadhoseini, where p was below 0.001. The Çuhadar estimate lies just beyond the pragmatic limit of 2 mmHg but within the biological-variation-derived specification of 2.39 mmHg, and at a resolution of 0.75 mmHg its position relative to either limit is indeterminate (Section 3.7).
pO2 changed in neither, moving 0.00 mmHg with an interval of −5.04 to +5.04 in Çuhadar, where p was 0.843, and −2.34 mmHg with an interval of −5.76 to +1.08 in Mohammadhoseini, where p was 0.175. Çuhadar’s baseline and 60 min means both round to 14.0 kPa, so its zero is a resolution limit rather than a measured null, and the paper’s own reported deviation of 0.7% corresponds to about −0.74 mmHg. White [8] independently found arterial pO2 unchanged in all four of its arms, with p = 0.440. In these two studies, undisturbed room-temperature storage for 60 min did not produce a detectable change in pO2, whereas the studies reviewed in Section 3.5 and Section 3.8 implicate temperature, syringe material and air. This contrast rests on two small studies and does not show that pO2 is stable at room temperature in every setting, as Kristinsdottir [16] found pO2 exceeding its threshold after 45 min.
Lactate rose by +0.55 mmol/L, with an interval of +0.17 to +0.93 in Çuhadar, where p was below 0.001. Only one study supplies an undisturbed-storage lactate series, so this is a single estimate rather than a replicated one. It exceeds the pragmatic limit of 0.5 mmol/L but not the specification of 0.60 mmol/L applied by Çuhadar (Section 3.7). Montero-Salinas [15] independently places lactate’s first significant movement at about 15 min without providing extractable change data.
Two further studies measured the same analytes under different exposures and corroborate the mechanism without replicating these estimates. Gutermuth [7], with mechanical stress added, found pH −0.017 with an interval of −0.019 to −0.015, pCO2 +1.20 mmHg with an interval of +1.02 to +1.37, and lactate +0.61 mmol/L with an interval of +0.58 to +0.64. White [8], in umbilical cord blood, found arterial pH −0.034 with an interval of −0.057 to −0.011, lactate +1.37 mmol/L with an interval of +1.07 to +1.67, and base excess −1.33 mmol/L with an interval of −1.98 to −0.67.
3.5. The Effect of Chilling as a Within-Patient Contrast
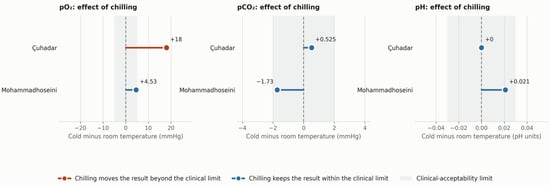
Both quantitative studies chilled and did not chill the same patients’ specimens, so the effect of chilling is the paired difference between the cold change and the room-temperature change (Table 4, Figure 3 and Table S6).
Table 4.
The effect of chilling, computed within patients as the cold change minus the room-temperature change.
Figure 3.
The effect of chilling, computed within patients. Each bar is the cold change minus the room-temperature change in the same specimens. Chilling moves pO2 beyond the exploratory pragmatic band in one study and to its boundary in the other, while leaving pCO2 and pH inside it. No interval is shown because the between-arm correlation is unreported. Data are from Çuhadar 2022 [11] (4 °C) and Mohammadhoseini 2015 [14] (0 °C).
Chilling raised pO2 in both studies, by four times as much at 4 °C as at 0 °C. It left pCO2 and pH within the pragmatic bands in both, and in Mohammadhoseini it moved both towards baseline, as chilled pH did not change at all, at 0.000 and not significant, against −0.021 at room temperature, while chilled pCO2 changed by −0.30 mmHg, again not significant, against +1.43 at room temperature. Çuhadar’s chilled pH change is identical to its room-temperature change, both running from 7.44 to 7.42, which at two-decimal resolution means only that the two cannot be distinguished.
The difference between 4 °C and 0 °C is perfectly confounded with study, analyser, sample size, syringe type and baseline pO2, which was 105 mmHg in one study and 86 in the other, so it cannot be attributed to temperature alone. Beaulieu [20] and Çuhadar [11] both report that the direction and size of the oxygen artefact depend on the blood-to-air gradient, which makes a baseline-dependent effect at least as plausible an explanation as the temperature difference.
The pO2 effect was also heterogeneous within a study. In Mohammadhoseini, pO2 rose in 32 of the 45 chilled specimens and by more than 5 mmHg in 7 of them [14], so a mean contrast within the pragmatic band conceals both specimens that did not change and specimens that changed by a clinically relevant amount.
Three further studies agree on the direction. Zavorsky [12] found slushed ice shortening the pO2 stability window from 40 to 20 min. Beaulieu [20] found iced pO2 rising when baseline values lay between 50 and 250 mmHg. Knowles [19] found plastic syringes raising pO2 by 11.9 to 13.7 mmHg at 30 min at both 22 °C and 0 to 4 °C.
The observation with the clearest practical implication is the discordance between analyte groups. In both studies chilling was associated with a higher pO2, whereas its within-patient effect on pH and pCO2 was small and within the exploratory limits. This does not show that chilling leaves every other analyte unaffected. At 4 °C, the benchmarking in Çuhadar classified the pCO2 deviation at 60 min as exceeding its biological-variation-derived specification [11], and the size of the pO2 effect varied with baseline pO2, temperature and study. For the metabolically driven analytes, chilling was on balance protective or neutral in the available data, which is consistent with suppressed glycolysis and with the threshold synthesis in Section 3.7.
3.6. Storage with Mechanical Stress, and the Individual Specimen
In Gutermuth [7], where every specimen was both delayed and subjected to a standardised drop-and-shake protocol, pO2 rose by +33.7 mmHg with a 95% confidence interval of +30.7 to +36.8. Because storage and stress are confounded within that study, this quantifies their joint effect and attributes none of it to agitation alone.
The mean is not the operative statistic for a clinical decision made on a single specimen. Gutermuth’s limits of agreement, meaning the interval within which 95% of individual specimens fall, run from −13.0 to +80.5 mmHg for pO2 and from +0.15 to +1.07 mmol/L for lactate. A mean that sits inside an acceptability band can conceal individual specimens far outside it, and for pO2 the upper limit here exceeds an entire physiological range. Wherever this review benchmarks a mean against a limit designed for a single result, that comparison is anti-conservative, and the limits of agreement should be read alongside it.
3.7. Threshold Synthesis and Time to First Clinically Significant Change
We also synthesised every included study by the storage time at which each analyte first breached a clinical or quality threshold, stratified by temperature (Table 5). This synthesis uses all 14 studies and does not depend on any pooling. Because no rule for assigning a window was pre-specified, it is a qualitative summary of what the source papers concluded rather than a derived estimate, and the per-study assignments are given in Table S3.
Table 5.
Cross-study threshold synthesis for plastic syringes.
Windows are the approximate storage times to the first clinically significant change reported across the included studies, and the ranges reflect between-study heterogeneity. The cold column combines two conditions that do not agree for the acid–base analytes, namely storage in ice water or slushed ice at about 0 °C [12,14] and refrigeration at 4 °C [11]. pCO2 was nearly stable at about 0 °C, whereas at 4 °C Çuhadar [11] found it rising by about +2.6 mmHg at 60 min, the room-temperature change of +2.10 mmHg plus the chilling contrast of +0.5 mmHg (Table 4), which exceeded the biological-variation-derived specification of 2.39 mmHg that the study applied (Section 3.5). In the same study the chilled pH fell by 0.02, as it did at room temperature, which is within all three sets of limits used in this review. The cold entries for pCO2 and pH therefore describe storage at about 0 °C and should not be generalised to refrigeration at 4 °C. Reading down the two window columns, in the available studies cold storage is the only condition in which pO2 has a shorter usable window than at room temperature, and pO2 is the only analyte for which that is so. For every other analyte the cold window is equal or longer. The pO2 direction at room temperature is bidirectional. Çuhadar [11] and Mohammadhoseini [14] found it stable or slightly falling in undisturbed syringes, whereas Kristinsdottir [16] found it rising past the clinical threshold at 45 min and Knowles [19] found plastic raising it by 11.9 to 13.7 mmHg at 30 min.
Table 6 re-classifies the 60 min estimates from the two undisturbed-storage studies against three sets of limits, namely the exploratory pragmatic limits, the specifications that Çuhadar applied, which are the RCPA limits for pH and pO2 and the desirable total error derived from biological variation for pCO2 and lactate [11], and the United States CLIA proficiency-testing criteria in force since 2024, which are pH ± 0.04, pCO2 ± 5 mmHg or ± 8% and pO2 ± 15 mmHg or ±15%, whichever is greater [23]. Percentage limits were converted to mmHg at each study’s own baseline. Of the 14 estimates, 10 lay within every applicable limit, including all pH changes, and one exceeded every limit, namely the pO2 rise in the chilled arm of Çuhadar. The remaining three changed classification with the limit applied. The room-temperature changes in pCO2 and lactate in Çuhadar exceeded the pragmatic limits but not the specifications that Çuhadar applied, whereas the chilling effect on pO2 in Mohammadhoseini lay within the pragmatic and CLIA limits but exceeded the RCPA limit of 5%. The CLIA limits, which are designed for proficiency testing rather than for clinical decisions, classified every pH, pCO2 and pO2 estimate other than the 4 °C pO2 artefact as acceptable. Statements in this review about whether a change is clinically relevant should therefore be read as conditional on the limit used.
Table 6.
Sensitivity of the threshold classification of the 60 min estimates to the choice of limit.
3.8. Other Pre-Analytical Factors (Narrative Synthesis)
Syringe material. Knowles [19] found that plastic syringes raised pO2 by 11.9 to 13.7 mmHg at 30 min compared with immediate analysis, at both room temperature and 0 to 4 °C, whereas glass preserved the values, and pH and sO2 did not differ across the six groups. Beaulieu [20] reported changes that were about three-fold smaller on ice and identified diffusion through the plastic wall as the dominant mechanism at low temperature. Both support glass with ice, or immediate analysis in plastic, when pO2 is critical.
Air contamination. The air subgroup in Çuhadar [11] showed pO2 deviations rising to between +38% and +55% at 4 °C with a 0.5 mL bubble, far exceeding the effects of time and temperature. The direction of the deviation depends on the gradient between blood and air, so specimens with very low or very high baseline pO2 may behave differently from those studied. Expelling bubbles at once is the highest-yield pre-analytical control for oxygen.
Specimen source and mixing. Ghanpur [21] showed that central-venous specimens held in plastic syringes progressively overestimate venous oxygen saturation (SvO2), which rose from 63% to 78% over 20 min with continuous mixing against 63% to 70% without it. Wan [18] found that ScvO2, lactate and the derived indices all rise with delay, and that body temperature modifies this, as in patients above 38 °C the lactate rise was larger while the ScvO2 rise was smaller than in controls. Wan recommended analysis within 10 min, considerably shorter than the 30 min venous window that some guidelines sanction.
Haemolysis and anticoagulant. Casati [4], in 1244 specimens, found haemolysis in about 5% of BGA samples, where it spuriously raised pH, pO2 and K+ and lowered pCO2, HCO3−, Na+ and ionised calcium, and went undetected by analysers lacking serum-index modules. Excess liquid heparin dilutes the sample, lowers pCO2 and biases the electrolytes, so balanced or dry electrolyte-buffered heparin is preferred.
Adequate line clearance is required before sampling from an indwelling catheter. Mohammadhoseini [14] discarded the first 8 to 10 mL, but that study enrolled adult cardiac-surgery patients and did not evaluate discard volume as a variable. That volume must not be generalised to neonates, infants or small children, in whom it can represent a substantial fraction of circulating volume. Paediatric practice uses a clearance volume scaled to catheter dead space and body weight, and closed-loop sampling systems that return the clearance volume are preferred where available. No study in this review addressed discard volume in children.
3.9. Analytical-Phase Factors (Narrative Synthesis)
Point-of-care versus central laboratory. Krzych [22] compared 208 paired specimens from 54 patients and found statistically detectable differences across all parameters but clinical importance only for pO2, with a mean bias of −10.1 mmHg and limits of agreement from −58.5 to +38.3 mmHg. That interval, nearly a hundred millimetres of mercury wide, describes how far an individual pair of results may differ, although here it combines method and delay effects. Median turnaround time was 56 min, and turnaround time was the principal driver of ΔpH, so the delay and analytical phases are entangled in this estimate, which is neither a pure storage effect nor a pure between-method bias. The clustering of 208 pairs within 54 patients was not accounted for in the original analysis, so the reported precision is optimistic. This comparison therefore cannot establish whether the two systems are analytically interchangeable, and it is not used for that purpose in this review. That question requires the same specimen to be measured on both systems within minutes, and no included study did so. Kristinsdottir [16] measured paired specimens on two analyser types at each time point and found that pO2 was the first variable to exceed its threshold on both, which is a storage effect seen consistently across analysers rather than evidence of a between-analyser bias.
pO2 and pCO2 have no reference measurement procedure and no certified reference material in whole blood, so their calibration scales are effectively manufacturer-specific and between-analyser results are not metrologically traceable to a common reference. This bears asymmetrically on the two questions in this review. It undermines the comparison of levels between systems, but a within-specimen change measured on a single analyser is largely insulated from it, because a stable calibration bias cancels in the difference. That is why the storage estimates here are more transportable than the point-of-care agreement estimate, and it is also the limit of that argument, which holds only while calibration is stable over the storage interval.
Imprecision, co-oximetry and interferences. Within-run imprecision in the included studies met desirable specifications. Çuhadar [11] reported repeatability for pO2 as a CV below 1.4% and for pH as 0.08%, although a coefficient of variation is not a meaningful dispersion measure for pH, which is a logarithmic quantity with an arbitrary zero, and repeatability should be reported as an SD in pH units. Such repeatability data also place a lower bound on the paired-change SD in a split-sample design, and would provide an independent check on the correlations recovered in Section 2.5 if they were reported in pH units for every analyte. The co-oximetry parameters sO2 and OHb were analytically stable during storage but remain vulnerable to dyshaemoglobins. Contextual reviews catalogue interferences such as spurious hyperlactataemia with ethylene glycol and spurious hyperchloraemia with salicylate, and describe how temperature-correction algorithms, alpha-stat against pH-stat, influence the reported pCO2 [2,3].
4. Discussion
4.1. Principal Findings
The central finding, within the limits of a small and heterogeneous evidence base, is that no single handling rule appears to serve every analyte, because the two mechanism families act in opposite directions. Metabolism drives pH down and pCO2 and lactate up, and chilling suppresses it. Diffusion and solubility drive pO2 up in a permeable syringe, and chilling accelerates it. A recommendation to chill or not to chill therefore has an answer only once the clinical question is specified.
Three observations support this, each resting on concordant direction in two or three studies rather than on a pooled estimate. First, drift in pH and pCO2 at room temperature was consistent in direction but small. Both studies measuring pH found it falling and both measuring pCO2 found it rising, each significant in the source’s own paired analysis, with magnitudes at or inside the exploratory limits at 60 min and inside the analytical specifications applied by the sources.
Second, chilling a plastic syringe was associated mainly with an artefactual rise in pO2. Analysed as a within-patient contrast, chilling raised pO2 by +18.0 and +4.5 mmHg while its effect on pH and pCO2 stayed within the exploratory limits, and in one study it moved both towards baseline. The size of the pO2 effect differed four-fold between the two studies and is confounded with temperature, baseline pO2, syringe type and analyser, so it is not a transportable estimate. Table 5 shows a similar asymmetry, as in the available studies cold shortened the usable window for pO2 and lengthened or preserved it for the other analytes. Three further studies [12,19,20] agree on the direction of the oxygen artefact, although not on its size.
Third, lactate and pO2 were among the first analytes to show clinically relevant changes, and they appear to require opposite handling. Lactate rose in every study with extractable lactate data and, in the narrative reports, began to move at room temperature from about 15 min, although the quantitative evidence rests on three heterogeneous estimates, only one of them from undisturbed storage. Chilling limited the lactate rise in Çuhadar, where the 60 min change was +0.23 mmol/L at 4 °C against +0.55 mmol/L at 22 °C. pO2 was the analyte most sensitive to syringe material, temperature and air, and the one that chilling affected most. A specimen sent for lactate and a specimen sent for oxygenation may therefore warrant different handling.
4.2. Comparison with Existing Recommendations
These findings may help to reconcile guidance that has long been contradictory. The classical instruction to ice everything derives from the glass-syringe era, in which chilling usefully suppressed metabolism without any permeability penalty. In the plastic syringes now used routinely, the permeability and solubility effects dominate, and the available evidence favours room-temperature storage with prompt analysis when pO2 is required. That conclusion echoes the primary studies, although the effect sizes that support it come from few and small studies.
4.3. Implications for Laboratory Practice
The differential susceptibility of individual analytes to pre-analytical variation indicates that a single, uniform approach to blood gas specimen handling is unlikely to be optimal. Instead, handling decisions should be guided by the specific analyte intended to inform clinical decision making and by the anticipated time to analysis.
When oxygenation is the primary clinical concern, for example during ventilator titration, shunt assessment, oxygen therapy or the evaluation of suspected hyperoxia, preservation of pO2 should take precedence. Air bubbles should therefore be expelled immediately, and agitation of the filled syringe should be avoided. Under routine conditions, analysis at room temperature within approximately 30 min appears to provide the most appropriate balance between analytical stability and the avoidance of temperature-related artefacts. The specimen should not be routinely stored on ice. However, when a prolonged delay is unavoidable and accurate measurement of pO2 is clinically critical, storage in a glass syringe on ice remains the approach most consistently supported by the available evidence [19,20]. Because the only point-of-care versus central-laboratory comparison confounded delay with method [22], it does not show whether the two systems are analytically interchangeable. It does show that an immediate point-of-care pO2 and a delayed central-laboratory pO2 can differ by clinically relevant amounts in individual patients, which argues against mixing the two sources when following a patient’s trend.
By contrast, when lactate, glucose or acid–base status is the principal clinical objective and analysis is expected to be delayed beyond approximately 15 to 30 min, the balance of pre-analytical risk shifts. In this context, cooling appears to be the more defensible strategy because it suppresses ongoing cellular metabolism and glycolysis, thereby limiting the progressive increase in lactate and decrease in glucose. The evidence for a protective effect on acid–base variables comes from storage in ice water or slushed ice at about 0 °C [12,14], whereas refrigeration at 4 °C did not prevent a rise in pCO2 in Çuhadar [11]. Although cooling may introduce a temperature-related artefact in pO2, this effect is of limited clinical consequence when oxygenation is not the target of interpretation. Taken together, the findings presented in Table 5 support an analyte-specific, rather than universally applied, approach to specimen handling. Such an approach may minimise the pre-analytical error most relevant to the intended clinical use of the result.
In every case, analyse as promptly as the workflow allows, use electrolyte-balanced dry heparin, clear the line with a volume appropriate to the patient’s size rather than a fixed adult volume, deploy serum-index or haemolysis detection on blood gas platforms, and hold handling constant across serial specimens so that observed trends reflect physiology rather than pre-analytics.
A clear distinction should be made between avoiding agitation and ensuring adequate mixing. A syringe must still be gently inverted and rolled immediately before analysis, or haemoglobin and co-oximetry results will be incorrect through sedimentation. What the evidence argues against is the sustained shaking and dropping of a filled syringe [7] and continuous mixing during a delay [21], not the brief remixing that correct operation requires.
Two contextual considerations should also be acknowledged. First, the term room temperature in the reviewed studies generally referred to approximately 22 °C. In settings where ambient temperatures routinely reach 28 to 33 °C, metabolic activity and associated analyte drift may occur more rapidly than reported in the available evidence, and the stability intervals proposed here may need to be shortened. Second, the specimens included in the available studies consisted predominantly of adult arterial samples with baseline pO2 values of approximately 90 to 105 mmHg. Accordingly, the proposed handling intervals should be interpreted cautiously in clinical contexts that differ substantially from these study conditions, including marked leukocytosis, significant hypoxaemia, cyanotic congenital heart disease and oxygen titration following cardiac arrest. This caution is particularly important in significant hypoxaemia, where the icing-related pO2 artefact described by Beaulieu may be clinically consequential and where a given absolute error in pO2 may correspond to a substantially larger error in oxygen saturation on the steep portion of the oxyhaemoglobin dissociation curve.
4.4. Physiological State Before Sampling
The included studies evaluated what happens to a specimen after collection, but the physiological state of the patient immediately before sampling also shapes the reported result. In a split-sample design that state is shared by every aliquot of the same specimen, so it cannot confound the within-specimen change Δ. It can, however, modify the size of Δ, and it can make a correctly handled specimen unrepresentative of the patient’s steady state. Neither mechanism was examined systematically by the included studies, and none was designed to study exercise, acute hypoxia or hyperoxia, or a recent change in inspired oxygen.
Three routes of effect modification are plausible. First, baseline pO2 sets the gradient between the specimen and the surrounding air or syringe wall, and the included studies already show that the oxygen artefact depends on it [11,12,20]. Hypoxaemia, for example during acute hypoxic exposure, places the specimen at a low baseline where a given absolute error in pO2 has a larger consequence for saturation, whereas hyperoxia after supplemental oxygen alters the size and direction of the gradient. Second, the metabolic activity of the specimen depends on the patient. In extreme leukocytosis, pO2 fell by 13 to 72 mmHg within 2 min in vitro, an effect blunted by placing the blood on ice [24], although in the specimens studied by Beaulieu the change in pO2 was not correlated with leukocyte or platelet count [20]. Specimens with a high baseline lactate or recent anaerobic metabolism may also enter storage in a different metabolic state from those studied here. Third, in the study by Wan [18], patients above 38 °C showed a larger in vitro lactate rise and a smaller ScvO2 rise with delay than controls, which shows that a patient-level state can alter in vitro stability.
Physiological transients also change the in vivo value that the specimen is meant to represent. After maximal exertion lasting 30 to 120 s, blood lactate peaks 3 to 8 min after exercise has stopped [25], so a specimen drawn in that window records a value that is still changing, and the accompanying acid–base disturbance is likely to evolve with it. Breathing pattern acts on a similar time scale. In healthy volunteers exposed to normobaric hypoxia at an inspired oxygen fraction of 12.8%, a 5 min bout of voluntary isocapnic hyperpnoea raised capillary pO2 from 46.9 to 51.8 mmHg and pH from 7.41 to 7.44, and lowered pCO2 from 38.3 to 35.8 mmHg (p = 0.068), in specimens analysed immediately, and the accompanying rise in peripheral oxygen saturation was no longer evident at the end of the exposure [26]. These shifts are of the same order as the storage artefacts reviewed here and as the exploratory limits. A laboratory-medicine review recommends sampling at least 15 to 30 min after a change in inspired oxygen or ventilator settings [3], and in patients with acute respiratory distress syndrome, oxygenation reached a new steady state within 5 min after positive end-expiratory pressure was lowered but not within 60 min after it was raised [27].
For laboratory practice, these considerations argue for recording the clinical context of each specimen, including the inspired oxygen fraction, ventilator settings, recent exertion, body temperature and, where relevant, leukocyte count, and for sampling at a physiological steady state when a result will be compared with a previous one. Stability studies would be more transportable if they reported baseline pO2, lactate and leukocyte count and stratified their estimates by them.
4.5. Strengths and Limitations
The strengths of this review include an a priori protocol, verbatim numeric extraction, a transparent paired-change model with sensitivity analysis on the imputed correlation, pre-specified exposure strata covering pure storage, storage with stress and cord blood, and a dual synthesis, study-level and threshold-based, that draws on studies whose reporting is heterogeneous.
The limitations of the available evidence are substantial and materially constrain the interpretation and clinical application of the findings.
Only four studies provided extractable quantitative change data and only two contributed undisturbed-storage estimates, so no pooled magnitude is defensible and none is reported. Publication bias could not be assessed, as funnel-plot methods require about ten studies.
Two of the four studies required reconstruction of the paired-change SD, and r was recovered for four comparisons and imputed for the rest. The within-patient chilling contrast has no interval, because the between-arm correlation is unreported. The difference between 4 °C and 0 °C is perfectly confounded with study. Several source values are rounding-limited. Multiplicity across analytes, conditions and time points is not controlled, no primary analyte was nominated, and the 60 min time point was selected from tables that also report 15, 30, 90 and 120 min, so the quantitative estimates should be read as descriptive rather than as hypothesis tests.
Gutermuth [7] confounds delay with mechanical stress and has no undisturbed arm, White [8] studied umbilical cord blood and its arms differed at baseline, Knowles [19] used aliquots from one blood pool, and Krzych [22] clustered 208 pairs within 54 patients. This review’s own two quantitative studies contribute correlated room-temperature and cold estimates from the same specimens.
The included studies did not record or stratify by the physiological state of the patient before sampling, so the effect-modifying role of hypoxaemia, hyperoxia, exertion, fever and leukocytosis discussed in Section 4.4 could not be examined. The only comparison of point-of-care and central-laboratory analysers confounded method with delay, so this review cannot separate analytical from pre-analytical error for that comparison.
The pragmatic limits used here are orientation aids and not a standard, and Table 6 shows that several classifications change when a published specification is used instead. Putting them on a defensible footing would require deriving them either from within-subject biological variation for each analyte or from outcome data linking a given analytical shift to a change in management, and neither exercise has been carried out for blood gas analytes in this setting. A complementary route is the framework of ISO 15189:2022 [13], under which a pre-analytical delay is treated as a component of the combined measurement uncertainty of the reported result rather than as a bias to be judged against a total-error band, so that the practical target becomes an uncertainty budget a laboratory or point-of-care service can state and monitor.
4.6. Future Work
Contacting authors for unpublished per-timepoint SDs, notably Wan, Montero-Salinas and Kristinsdottir, and running meta-regression on temperature, baseline pO2, syringe type and leukocyte count would materially increase k and would allow dose–response modelling of the time by temperature surface for each analyte. Future stability studies should also report the physiological context of sampling, and method-comparison studies should measure the same specimen on both systems within minutes so that analytical and pre-analytical error can be separated.
5. Conclusions
Within the limits of an evidence base in which four studies provided quantitative change data, this synthesis suggests that the handling of plastic-syringe blood gas specimens should depend on the analyte that matters clinically. When pO2 is required, prompt analysis at room temperature with air expelled appears preferable to chilling. When lactate, glucose or acid–base status is the priority and delay is unavoidable, chilling may limit metabolic drift, although the acid–base evidence comes from storage at about 0 °C rather than at 4 °C. pH and pCO2 appeared to tolerate short delays, whereas lactate and pO2 were among the first analytes to show clinically relevant changes. For several estimates, whether a change was clinically relevant depended on the limit applied, and the available data do not allow conclusions about the analytical interchangeability of point-of-care and central-laboratory analysers. These recommendations should be confirmed in larger studies that separate pre-analytical from analytical error and record the physiological state at sampling.
Supplementary Materials
The following supporting information can be downloaded at https://www.mdpi.com/article/10.3390/laboratories3040026/s1, Table S1: Extraction sheet and search strategies; Table S2: Risk-of-bias judgements, by study and domain; Table S3: Threshold-window assignments, by study; Table S4: Within-subject correlation: recovery and sensitivity; Table S5: Why a two-study pool cannot be interpreted; Table S6: Chilling as a within-patient contrast; Table S7: Verification record.
Author Contributions
F.R.M. conceived and designed the review, developed and ran the search, screened records, extracted the data, performed the analysis and drafted the manuscript. A.A.L.T. screened records, checked the extracted values independently against the source tables and contributed to the interpretation. A.A. supervised the review, adjudicated disagreements over eligibility and critically revised the manuscript for important intellectual content. All authors have read and agreed to the published version of the manuscript.
Funding
This research received no external funding.
Data Availability Statement
All extracted values and the analysis code for the synthesis and the figures are provided in the Supplementary Materials, together with the accompanying data and code package. That package contains the study-level extraction tables, the R scripts (R version 4.4.1) that reproduce every study-level estimate and every figure, and the sensitivity analysis.
Acknowledgments
During the preparation of this manuscript, the authors used Claude (Anthropic PBC, San Francisco, CA, USA), a large language model, to assist with language editing and with checking the internal consistency of the numerical values, tables and reference order. It was not used to search for or select studies, to appraise risk of bias or to extract data. During revision, it was also used to draft revised text in response to the reviewers’ comments and to compute the threshold sensitivity analysis in Table 6 from the published source tables, and that analysis was re-computed by an independent second implementation and checked by the authors against the source tables. The authors reviewed and verified all content and take full responsibility for the integrity and accuracy of the work.
Conflicts of Interest
The authors declare no conflicts of interest.
References
- Baird, G. Preanalytical considerations in blood gas analysis. Biochem. Med. 2013, 23, 19–27. [Google Scholar] [CrossRef] [Scilit] [PubMed]
- Korpi-Steiner, N.; Horowitz, G.; Tesfazghi, M.; Suh-Lailam, B.B. Current issues in blood gas analysis. J. Appl. Lab. Med. 2023, 8, 372–381. [Google Scholar] [CrossRef] [Scilit] [PubMed]
- Carlton, H.; Shipman, K.E. Pitfalls in the diagnosis and management of acid-base disorders in humans: A laboratory medicine perspective. J. Clin. Pathol. 2024, 77, 772–778. [Google Scholar] [CrossRef] [Scilit] [PubMed]
- Casati, M.; Intra, J.; Rossi, W.; Giacobone, C.; Brivio, R. Hemolysis and blood gas analysis: It’s time for a change! Scand. J. Clin. Lab. Investig. 2022, 82, 138–142. [Google Scholar] [CrossRef] [Scilit] [PubMed]
- Page, M.J.; McKenzie, J.E.; Bossuyt, P.M.; Boutron, I.; Hoffmann, T.C.; Mulrow, C.D.; Shamseer, L.; Tetzlaff, J.M.; Akl, E.A.; Brennan, S.E.; et al. The PRISMA 2020 statement: An updated guideline for reporting systematic reviews. BMJ 2021, 372, n71. [Google Scholar] [CrossRef] [Scilit] [PubMed]
- Campbell, M.; McKenzie, J.E.; Sowden, A.; Katikireddi, S.V.; Brennan, S.E.; Ellis, S.; Hartmann-Boyce, J.; Ryan, R.; Shepperd, S.; Thomas, J.; et al. Synthesis without meta-analysis (SWiM) in systematic reviews: Reporting guideline. BMJ 2020, 368, l6890. [Google Scholar] [CrossRef] [Scilit] [PubMed]
- Gutermuth, M.; Ihmsen, H.; Krischke, F.; Moritz, A.; Prottengeier, J. Stability of arterial blood gas samples after delayed analysis and mechanical stress. PLoS ONE 2025, 20, e0334710. [Google Scholar] [CrossRef] [Scilit] [PubMed]
- White, C.R.H.; Mok, T.; Doherty, D.A.; Henderson, J.J.; Newnham, J.P.; Pennell, C.E. The effect of time, temperature and storage device on umbilical cord blood gas and lactate measurement: A randomized controlled trial. J. Matern. Fetal Neonatal Med. 2012, 25, 587–594. [Google Scholar] [CrossRef] [Scilit] [PubMed]
- DerSimonian, R.; Laird, N. Meta-analysis in clinical trials. Control Clin. Trials 1986, 7, 177–188. [Google Scholar] [CrossRef] [Scilit] [PubMed]
- Higgins, J.P.T.; Thompson, S.G.; Deeks, J.J.; Altman, D.G. Measuring inconsistency in meta-analyses. BMJ 2003, 327, 557–560. [Google Scholar] [CrossRef] [Scilit] [PubMed]
- Çuhadar, S.; Özkanay-Yörük, H.; Köseoğlu, M.; Katırcıoğlu, K. Detection of preanalytical errors in arterial blood gas analysis. Biochem Med. 2022, 32, 244–252. [Google Scholar] [CrossRef] [Scilit] [PubMed]
- Zavorsky, G.S.; van Wijk, X.M.R. The stability of blood gases and CO-oximetry under slushed ice and room temperature conditions. Clin. Chem. Lab. Med. 2023, 61, 1750–1759. [Google Scholar] [CrossRef] [Scilit] [PubMed]
- ISO 15189:2022; Medical Laboratories. Requirements for Quality and Competence. ISO: Geneva, Switzerland, 2022.
- Mohammadhoseini, E.; Safavi, E.; Seifi, S.; Seifirad, S.; Firoozbakhsh, S.; Peiman, S. Effect of sample storage temperature and time delay on blood gases, bicarbonate and pH in human arterial blood samples. Iran. Red Crescent Med. J. 2015, 17, e13577. [Google Scholar] [CrossRef] [Scilit] [PubMed]
- Montero-Salinas, A.; Pérez-Ramos, M.; Toba-Alonso, F.; Quintana-DelRío, L.; Suanzes-Hernández, J.; Sobrido-Prieto, M.; Martínez-Isasi, S. Analysis of arterial blood gas values based on storage time since sampling: An observational study. Nurs. Rep. 2021, 11, 517–521. [Google Scholar] [CrossRef] [Scilit] [PubMed]
- Kristinsdottir, E.A.; Statkevicius, S.; Sigurdsson, M.I.; Hansson, F.; Broman, M.E. Effects of analysis delay on pH, pO2, pCO2, bicarbonate, glucose, lactate, electrolytes, and other arterial blood gas variables. Acta Anaesthesiol. Scand. 2025, 69, e70049. [Google Scholar] [CrossRef] [Scilit] [PubMed]
- Srisan, P.; Udomsri, T.; Jetanachai, P.; Lochindarat, S.; Kanjanapattanakul, W. Effects of temperature and time delay on arterial blood gas and electrolyte measurements. J. Med. Assoc. Thai 2011, 94, S9–S14. [Google Scholar] [PubMed]
- Wan, X.Y.; Wei, L.L.; Jiang, Y.; Li, P.; Yao, B. Effects of time delay and body temperature on measurements of central venous oxygen saturation, venous-arterial blood carbon dioxide partial pressures difference, venous-arterial blood carbon dioxide partial pressures difference/arterial-venous oxygen difference ratio and lactate. BMC Anesthesiol. 2018, 18, 187. [Google Scholar] [CrossRef] [Scilit] [PubMed]
- Knowles, T.P.; Mullin, R.A.; Hunter, J.A.; Douce, F.H. Effects of syringe material, sample storage time, and temperature on blood gases and oxygen saturation in arterialized human blood samples. Respir. Care 2006, 51, 732–736. [Google Scholar] [CrossRef] [Scilit] [PubMed]
- Beaulieu, M.; Lapointe, Y.; Vinet, B. Stability of PO2, PCO2, and pH in fresh blood samples stored in a plastic syringe with low heparin in relation to various blood-gas and hematological parameters. Clin. Biochem. 1999, 32, 101–107. [Google Scholar] [CrossRef] [Scilit] [PubMed]
- Ghanpur, R.; Santamaria, J.; Dixon, B. Plastic blood gas syringes and measurement error in central venous oxygen saturations. Shock 2016, 46, 287–289. [Google Scholar] [CrossRef] [Scilit] [PubMed]
- Krzych, Ł.; Wojnarowicz, O.; Ignacy, P.; Dorniak, J. Be cautious during the interpretation of arterial blood gas analysis performed outside the intensive care unit. Acta Biochim Pol. 2020, 67, 353–358. [Google Scholar] [CrossRef] [Scilit] [PubMed]
- Centers for Medicare & Medicaid Services. Clinical Laboratory Improvement Amendments of 1988 (CLIA) proficiency testing regulations related to analytes and acceptable performance. Final rule. Fed. Regist. 2022, 87, 41194–41242. [Google Scholar]
- Fox, M.J.; Brody, J.S.; Weintraub, L.R. Leukocyte larceny: A cause of spurious hypoxemia. Am. J. Med. 1979, 67, 742–746. [Google Scholar] [CrossRef] [Scilit] [PubMed]
- Goodwin, M.L.; Harris, J.E.; Hernández, A.; Gladden, L.B. Blood lactate measurements and analysis during exercise: A guide for clinicians. J. Diabetes Sci. Technol. 2007, 1, 558–569. [Google Scholar] [CrossRef] [Scilit] [PubMed]
- Kowalski, T.; Rębiś, K.; Wilk, A.; Szwed, P.; Grochowska, J.; Debevec, T. Effectiveness of voluntary isocapnic hyperpnoea for mitigating hypoxemia and acute mountain sickness in normobaric hypoxia: A randomized crossover pilot trial. Sci. Rep. 2026, 16, 4784. [Google Scholar] [CrossRef] [Scilit] [PubMed]
- Chiumello, D.; Coppola, S.; Froio, S.; Mietto, C.; Brazzi, L.; Carlesso, E.; Gattinoni, L. Time to reach a new steady state after changes of positive end expiratory pressure. Intensive Care Med. 2013, 39, 1377–1385. [Google Scholar] [CrossRef] [Scilit] [PubMed]

Disclaimer/Publisher’s Note: The statements, opinions and data contained in all publications are solely those of the individual author(s) and contributor(s) and not of MDPI and/or the editor(s). MDPI and/or the editor(s) disclaim responsibility for any injury to people or property resulting from any ideas, methods, instructions or products referred to in the content. |
© 2026 by the authors. Licensee MDPI, Basel, Switzerland. This article is an open access article distributed under the terms and conditions of the Creative Commons Attribution (CC BY) license.