


Abstract
This study develops an econometric-guided framework for assessing the predictive consequences of valuation-information removal while distinguishing econometric significance and predictor importance from predictive necessity. Three predefined information environments are examined: a full-information benchmark (Model A), the ex ante removal of an economically meaningful valuation-information channel (Model B), and an independently econometrically screened specification (Model C). Random Forest, XGBoost, and artificial neural networks are evaluated under common within-dataset validation conditions across four public housing datasets. The controlled-removal experiments identify accessibility and local amenities in UCI Real Estate Valuation, geographical location in California Housing, and property quality and living space in Ames Housing and King County as consequential valuation-information channels. Mean hold-out R2 across the four datasets was 0.8313 for Model A, 0.7726 for Model B, and 0.8225 for Model C, corresponding to descriptive predictive-retention ratios of 92.74% and 98.93% for Models B and C, respectively. The findings indicate that observed predictive deterioration depends on the information removed rather than solely on the number of excluded predictors. The proposed framework offers a replicable approach to evaluating information-removal effects across heterogeneous datasets without implying statistical equivalence or cross-market model transferability.
1. Introduction
Advances in computational methods and the growing availability of property-level data have transformed housing-market analysis. Classical hedonic theory conceptualizes property value as the outcome of a bundle of observable characteristics, while subsequent empirical research has demonstrated that the composition and relative influence of these characteristics can vary substantially across markets and property types [1,2]. More recently, machine-learning (ML) methods have expanded the analytical capacity of real estate valuation by capturing nonlinear relationships, complex interactions, and heterogeneous effects that are difficult to represent within conventional parametric specifications [3,4,5,6,7,8]. Systematic evidence further indicates that ML has become an important component of contemporary real estate analytics, with applications ranging from housing-price prediction and automated valuation to interpretable market analysis [5,6,9].
Much of this research has focused on predictive accuracy. Random Forest, boosting algorithms, artificial neural networks, and related approaches have been increasingly employed to improve housing-price prediction and compare alternative learning architectures [3,4,5,7,10]. At the same time, the literature demonstrates that predictive capability depends not only on algorithmic choice but also on the information supplied to the learning process. Contemporary valuation models draw on heterogeneous information sources, including property-level structural characteristics, socioeconomic indicators, macroeconomic conditions, spatial attributes, and market variables [11,12,13]. Location and accessibility are particularly prominent examples, with GIS-based, transport-accessibility, and other location-sensitive information contributing materially to housing-price modelling [14,15]. Algorithmic sophistication and predictor information should therefore be regarded as distinct but interacting determinants of predictive performance.
This distinction becomes important because real estate datasets typically contain multiple, partially overlapping dimensions of valuation information. Structural characteristics, dwelling quality, age, usable living space, accessibility, neighbourhood attributes, spatial location, income-related factors, and broader market conditions may all contribute to price formation, but they need not provide equal or independent predictive information. Expanding the predictor set may expose a learning algorithm to additional signal, yet it can also introduce redundancy, multicollinearity, weakly incremental variables, and dataset-specific noise. Conversely, reducing dimensionality may simplify model specification without materially affecting prediction when the removed information is recoverable from retained predictors; but the same reduction can be consequential when it suppresses an information channel that the remaining variables cannot reconstruct. The central methodological question is therefore not merely how many predictors to retain, but which information contributes meaningfully to out-of-sample prediction. Econometric and ML approaches offer complementary perspectives on this problem. Econometric analysis provides interpretable evidence concerning conditional associations, coefficient magnitude and direction, statistical significance, and multicollinearity, whereas ML provides flexible predictive structures capable of exploiting nonlinearities, interactions, and heterogeneous relationships [16,17]. This complementarity is particularly relevant in real estate research, where explainable ML methods have increasingly been used to reveal how individual property and market characteristics contribute to fitted predictions [6,9].
Recent hybrid approaches have extended this integration by combining econometric modelling, nonlinear machine learning, and explainable artificial intelligence within unified valuation architectures, demonstrating that predictive performance, economic interpretation, and model transparency can be considered jointly across heterogeneous real estate environments [18]. Such developments represent an important progression beyond purely algorithm-centred valuation. However, they primarily address how available information is modelled, interpreted, or attributed once it has entered the predictive system. They do not, by themselves, establish whether a particular predictor-or the broader valuation-information channel represented by that predictor-is necessary for maintaining predictive capability when the information is no longer available.
This study examines the predictive consequences of removing theoretically meaningful valuation information by measuring the out-of-sample consequences of its deliberate removal within an econometric-guided A–B–C framework. This objective distinguishes predictive necessity from statistical significance and algorithmic feature importance, neither of which independently establishes the predictive consequences of information absence. Feature importance and predictive necessity are not equivalent. Attribution methods characterize how a fitted model distributes predictive contribution across the information available to it, while econometric significance describes conditional association under a specified model. Neither criterion alone establishes whether the corresponding information can be removed without a material predictive cost. A highly ranked predictor may be replaceable by correlated or substitutable information, whereas a predictor with modest individual importance may become consequential when the broader information channel it represents is unavailable. Correlation, redundancy, substitution, and nonlinear interaction therefore make the identification of important predictors conceptually distinct from the identification of necessary information.
Despite the rapid expansion of ML applications in real estate analysis, much of the literature remains focused on improving predictive accuracy, comparing algorithms, developing forecasting architectures, or explaining fitted predictions [3,4,5,6,7,8,9,10]. These contributions have substantially advanced automated valuation and housing-market prediction, but they leave a less developed question: does information associated with a statistically relevant or algorithmically important predictor remain necessary once the remaining predictor structure is allowed to compensate for its absence? Answering this question requires a counterfactual evaluation of information availability rather than an importance ranking alone.
A related gap concerns the role of econometrics in hybrid econometric-ML research. When an unchanged predictor set is passed to both econometric and ML models, econometrics functions largely as a parallel benchmark. A more substantive integration is possible when econometric analysis operates upstream of ML by characterizing conditional relevance, multicollinearity, structural dependence, and the empirical support for theoretically meaningful valuation-information channels. ML can then evaluate whether alternative information environments remain sufficient for out-of-sample prediction. However, the use of training-sample econometric evidence to define ex ante information-removal experiments, followed by independent out-of-sample assessment of their predictive consequences, remains comparatively underexplored in real estate valuation research.
This perspective also exposes an important distinction between dimensional reduction and information reduction. A smaller predictor set need not be informationally deficient when the removed variables are weakly incremental, redundant, or recoverable from retained predictors. Conversely, removing only a few variables may cause substantial deterioration when they jointly encode a consequential valuation mechanism. Existing real estate ML studies demonstrate that strong predictive performance can be obtained from different combinations of structural, spatial, socioeconomic, and market variables [3,4,5,6,7,9,10,12,13,14,15], but predictor reduction and deliberate removal of coherent valuation information are rarely formulated as separate empirical experiments. Controlled information removal provides a direct means of addressing this distinction by measuring what happens to out-of-sample performance when a pre-identified information channel is no longer available to the learner.
External validity presents an additional challenge. Evidence on predictor relevance is commonly derived from individual markets, datasets, or learning architectures [7,8,13,14,15], making it difficult to distinguish general methodological patterns from dataset-specific information structures. A predictor that is consequential in one market need not be universally necessary because valuation mechanisms, predictor availability, substitution possibilities, and market conditions differ across data environments. The relevant objective is therefore not necessarily to establish a universal ranking of housing predictors, but to develop a transferable identification procedure capable of determining which information is consequential within a given valuation environment. Cross-dataset and cross-algorithm evaluation provides a means of testing whether such a procedure remains informative despite heterogeneity in markets, samples, predictor structures, and learning architectures.
To operationalize this objective, the proposed framework defines three information environments. Model A provides the full eligible predictor benchmark; Model B implements the ex ante removal of a theoretically interpretable and econometrically supported valuation-information channel; and Model C independently constructs a reduced predictor set using predefined econometric screening criteria.
Random Forest, XGBoost, and artificial neural networks are applied to all three predefined information environments under common validation conditions. The primary comparative analysis uses hold-out R2 and corresponding predictive-retention measures, complemented by five-fold cross-validation. Importantly, both the controlled information-removal specification and the econometrically screened specification are defined before the corresponding hold-out predictive outcomes are examined.
The framework is evaluated using four independently accessible housing datasets-UCI Real Estate Valuation, California Housing, Ames Housing, and King County House Sales-which differ substantially in sample size, predictor dimensionality, geographic setting, and information composition. Their heterogeneity permits accessibility and local amenities, explicit spatial location, property quality, living-space capacity, and related valuation mechanisms to be examined within a common experimental logic. Importantly, the study does not claim that these channels constitute a universal set of essential housing attributes. Instead, it tests whether dataset-specific consequential information can be identified through a reproducible ex ante procedure and subsequently validated through the predictive consequences of its absence.
The principal methodological contribution of this study is an econometric-guided framework that distinguishes predictor importance and econometric relevance from the observed predictive consequences of information removal. Rather than assuming that statistically significant or highly ranked predictors are indispensable, the framework evaluates the out-of-sample effects of withholding predefined, economically meaningful valuation-information channels. Model B represents deliberate information loss, whereas Model C examines predictor reduction through independent econometric screening. Their comparison with the full-information benchmark across four heterogeneous housing datasets and three learning architectures provides a structured assessment of information-removal effects. The resulting evidence is conditional on the evaluated datasets, predictor configurations, and validation procedures and does not establish universal predictor necessity or cross-market predictive transferability.
2. Literature Review and Related Work
This review provides a focused methodological synthesis rather than a systematic bibliometric assessment. The selected literature covers five interrelated areas: (i) hedonic and econometric foundations of property valuation; (ii) machine-learning approaches to housing-price prediction and mass appraisal; (iii) feature selection, predictor importance, and explainable artificial intelligence; (iv) structural, spatial, and socioeconomic information in valuation; and (v) hybrid econometric–machine-learning frameworks. Foundational contributions are considered alongside recent empirical studies to clarify the distinction between identifying influential predictors and assessing the predictive consequences of removing the information they represent.
Real estate valuation research has evolved from conventional econometric models grounded in hedonic price theory toward increasingly flexible machine-learning and hybrid approaches. Hedonic theory conceptualizes property value as a function of structural, locational, environmental, and market characteristics [1,2]. This perspective remains fundamental because property prices reflect combinations of heterogeneous attributes rather than a single dominant determinant. Nevertheless, conventional parametric models may be constrained by predefined functional forms and may not fully capture nonlinear relationships, interaction effects, and complex dependencies among valuation characteristics.
The growing availability of property-level data has encouraged the application of machine-learning methods to real estate valuation. Comparative studies have examined Random Forest, boosting algorithms, artificial neural networks, and related techniques, primarily to improve predictive accuracy [3,4,5,7,8,10]. Chou et al. [3] compared machine-learning models for preliminary property-price forecasting, while Deaconu et al. [4] investigated the performance of alternative real estate valuation models. Lee [7] examined the use of richer property representations to improve neural-network predictions. The systematic review by Tekouabou et al. [5] further documents the increasing role of machine learning in urban real estate prediction. Although these studies demonstrate the potential of nonlinear predictive methods, their primary emphasis is on modelling available information rather than evaluating the consequences of its deliberate removal.
A related research direction concerns the interpretability of machine-learning predictions. Lorenz et al. [6] applied interpretable machine learning to real estate market analysis, while Bachmann [9] investigated the behaviour of predictive models in residential rental markets. SHAP and related attribution methods provide a framework for explaining how available features contribute to model predictions [19]. These approaches improve transparency but do not directly establish whether a predictor, or the broader information channel it represents, is indispensable for out-of-sample prediction. Correlated predictors may partially substitute for one another, and information that appears important in an individual model may not produce a comparable predictive penalty when removed. Consequently, predictor attribution and controlled information removal address related but distinct methodological questions.
The informational structure of real estate valuation is also heterogeneous. Recent studies increasingly integrate property-level characteristics with socioeconomic, macroeconomic, and market information. Schmid [12] developed a two-stage housing-price-index approach using linked microeconomic, socioeconomic, and macroeconomic data, illustrating the potential benefits of combining information from different levels of market analysis. Spatial information represents another important dimension. GIS-based accessibility analysis has demonstrated the relevance of geographical position and transport connectivity to housing valuation [14], while location-based services have been incorporated into machine-learning assessments of residential attractiveness [15]. These studies support the importance of multidimensional valuation information but generally examine its contribution through association, prediction, or interpretation rather than predefined information-removal experiments.
Recent research on automated mass appraisal reinforces the distinction between predictive performance and the informational contribution of property attributes. Kim et al. [20] investigated explainable AI-based mass appraisal using SHAP and permutation feature importance. Tapia et al. [21] compared machine-learning valuation approaches with spatially adjusted hedonic models, emphasizing the relevance of property and location characteristics. Aydinoglu and Sisman [22] examined differences in predictive performance and feature importance across geographical appraisal zones. Together, these studies demonstrate the value of interpretable and spatially informed valuation methods while highlighting the context-dependent nature of predictor relevance. However, their methodological objectives differ from assessing the out-of-sample consequences of deliberately withholding predefined valuation-information channels.
Another important development is the integration of econometric reasoning with machine learning. Econometric models provide interpretable evidence concerning conditional relationships, coefficient estimates, statistical significance, and multicollinearity, whereas machine-learning methods accommodate flexible nonlinear predictive relationships. Previous studies have explored combinations of these approaches [16,17]. More recently, Mammadrzayeva et al. [18] proposed a generalized explainable hybrid econometric–machine-learning framework integrating econometric analysis, nonlinear prediction, and explainable AI. Such integration strengthens economic interpretation and predictive analysis. Nevertheless, identifying statistically relevant or algorithmically important predictors remains conceptually different from evaluating the predictive consequences of making their information unavailable.
This distinction is particularly relevant when predictors contain overlapping information. Statistical significance characterizes conditional association under a specified econometric model, while the variance inflation factor (VIF) describes linear dependence among explanatory variables. Feature-importance measures characterize how a fitted predictive model uses available information. None of these measures independently establishes the predictive necessity of a particular information channel. A controlled removal experiment provides complementary evidence by examining whether the remaining predictors can compensate for the excluded information. In housing markets, such substitution may occur among variables describing property quality, living space, geographical location, accessibility, and neighbourhood characteristics.
The generalizability of predictor-related findings presents an additional methodological challenge. Many empirical studies focus on individual housing markets, datasets, or learning architectures. As a result, predictors identified as influential in one setting may reflect local valuation mechanisms, sample composition, information availability, or algorithm-specific behaviour. A universally applicable ranking of essential housing characteristics is therefore difficult to justify. A more appropriate objective is to evaluate whether a common information-assessment procedure produces informative comparisons across heterogeneous datasets, without assuming that the same predictors are essential in every market.
Against this background, the proposed A–B–C framework addresses a methodological question that differs from predictive model optimization, conventional feature selection, and explainable machine learning. Model A represents the full eligible predictor set. Model B deliberately removes a theoretically interpretable and econometrically supported valuation-information channel identified before predictive evaluation, whereas Model C independently applies predefined econometric screening criteria. Comparing these information environments using common learning architectures and validation procedures makes it possible to examine the observed predictive consequences of controlled information loss relative to conventional predictor reduction.
The framework is evaluated across four heterogeneous housing datasets using Random Forest, XGBoost, and artificial neural networks. This design provides cross-dataset and cross-algorithm evidence concerning the consequences of information removal under the evaluated conditions. It does not establish universal predictor necessity, formal predictive equivalence, or transferability of fitted models between housing markets. The principal contribution is therefore an econometric-guided experimental procedure for distinguishing the observed effects of deliberate valuation-information loss from those of econometrically guided predictor screening.
Table 1 summarizes representative contributions to hedonic valuation, machine-learning prediction, explainable AI, spatial mass appraisal, and hybrid econometric–machine-learning modelling. The comparison emphasizes methodological objectives, predictor interpretation, and the treatment of information availability rather than differences in reported predictive accuracy. It thereby positions the proposed framework in relation to existing research and clarifies the specific role of controlled information removal in the present study.
Table 1.
Comparative overview of econometric, machine-learning, explainable AI, and spatial valuation studies in relation to the proposed A–B–C information-assessment framework.
As summarized in Table 1, previous research has established strong foundations for hedonic interpretation, nonlinear valuation modelling, explainable machine learning, spatial information integration, and hybrid econometric–ML analysis. These approaches primarily investigate how available predictors contribute to model estimation, predictive accuracy, or interpretation. The present study addresses a complementary question: how does out-of-sample predictive performance change when an economically meaningful valuation-information channel is deliberately withheld? By comparing controlled information removal with independent econometric screening across four datasets and three learning architectures, the A–B–C framework provides a structured assessment of information availability and its observed predictive consequences. This distinction motivates the experimental design described in Section 3.
3. Methodology
The proposed econometric-guided framework examines the predictive consequences of valuation-information removal by distinguishing a reduction in predictor count from a loss of economically meaningful information. These two forms of reduction are not necessarily equivalent. Some predictors may be redundant, weakly incremental, or alternative representations of the same underlying valuation mechanism. Conversely, removing a small group of predictors may substantially affect predictive performance when those variables jointly represent a consequential source of valuation information.
The conceptual distinction can be illustrated by the income-capitalization relationship commonly applied to income-producing real estate:
where V denotes property value, NOI represents net operating income, and CR is the capitalization rate. Although the public housing datasets examined in this study do not generally include these variables, the relationship illustrates the broader principle that valuation information is economically heterogeneous. In housing-price prediction, relevant information channels may instead be represented by accessibility, geographical location, property quality, usable living space, and other characteristics associated with market value.
To identify such channels independently of subsequent machine-learning outcomes, an ex ante information-identification procedure is applied. A predictor or coherent group of predictors is eligible for controlled removal when three conditions are satisfied: (i) the information has a theoretically interpretable relationship with property value; (ii) the corresponding predictors receive econometric support from the training data, assessed primarily through statistical significance and standardized coefficient magnitudes; and (iii) predictors representing a common valuation mechanism or exhibiting structural dependence are treated as a coherent information block. Econometric evidence therefore informs the identification of candidate information channels but does not mechanically determine the final removal set. Importantly, the removal decision is made before examining the corresponding hold-out predictive outcomes.
All econometric analyses are conducted exclusively on the training data. Coefficient estimates and standardized effects are used to assess conditional relationships, while variance inflation factors (VIFs) are employed to examine multicollinearity. Statistical significance is evaluated at the 5% level, and VIF < 10 is adopted as the principal multicollinearity threshold. Test observations are excluded from econometric screening and information-channel identification to avoid using hold-out outcomes in the construction of predictor configurations.
The framework comprises three predefined information environments. Model A includes all eligible predictors after excluding identifiers, target-derived variables, and non-informative fields, thereby establishing the full-information benchmark. Model B represents a controlled information-removal experiment in which a theoretically interpretable and econometrically supported valuation-information channel is deliberately excluded. Depending on the dataset, this channel may represent accessibility and local amenities, explicit geographical location, property quality, usable living space, or a coherent combination of related characteristics. Model C is constructed independently through econometric screening, retaining predictors primarily according to statistical significance and multicollinearity criteria, with appropriate treatment of deterministic or near-deterministic structural dependencies.
Models A, B, and C represent alternative predictor configurations rather than different machine-learning algorithms. In particular, Model B is not an algorithmic feature-selection procedure: its purpose is to evaluate the observed consequences of withholding predefined valuation information. Model C addresses a separate question, namely whether an econometrically screened predictor set can preserve much of the predictive performance achieved using the full eligible information set.
Formally, let the full eligible predictor set be defined as
A = X1, X2,…, Xp
Let the existing notation for the predefined valuation-information block be retained. The predictor set for Model B is then
B = A\.
XB = {Xj ∈ XA:Xj ∉ ε}
Model C is defined by the independently screened predictor set:
XC = {Xj ∈ XA:pj < 0.05, VIFj < 10}
The construction of Model C is guided primarily by the conditions pj < 0.05 and VIFj < 10. These criteria are applied with explicit consideration of structural relationships among predictors, since mechanical predictor-by-predictor screening may be inappropriate when variables exhibit deterministic or near-deterministic dependence. Importantly, econometric retention does not itself establish predictive necessity, and exclusion does not imply that a predictor is economically irrelevant.
Three machine-learning algorithms are employed to evaluate the predefined information environments: Random Forest (RF), XGBoost (XGB), and an artificial neural network (ANN). These algorithms were selected to represent contrasting learning architectures rather than to provide an exhaustive comparison of forecasting methods. RF uses bootstrap aggregation of decision trees to reduce prediction variability; XGB employs sequential gradient boosting to improve predictive fit; and ANN, implemented as a multilayer perceptron, provides a flexible nonlinear approximation through interconnected computational layers. Their combined use allows the consequences of information removal to be examined across different inductive assumptions.
Alternative algorithms, including support vector regression (SVR) and k-nearest neighbours (kNN), were not included in the principal comparison because the objective was to evaluate the A–B–C framework across selected contrasting learning architectures rather than to rank the full range of available prediction methods. Conventional regression serves a separate methodological function in the econometric screening stage. Within each dataset, RF, XGB, and ANN are applied to Models A, B, and C using common training and hold-out partitions. Further implementation details are provided in Section 3.1 and Supplementary Table S1.
The principal evaluation measures are the predictive penalty and predictive retention relative to Model A. For the coefficient of determination, the predictive penalty is defined as
Predictive retention is calculated as:
For error-based performance measures, the corresponding predictive penalty is defined as
A positive predictive penalty indicates deterioration relative to the full-information benchmark, whereas a negative value indicates improved performance on the corresponding evaluation sample. The principal empirical comparison examines whether deliberate removal of a predefined valuation-information channel produces a larger observed predictive penalty than independent econometric screening:
PP(B) > PP(C)
This comparison assesses the consequences of information availability rather than predictor count alone. A relatively small penalty under Model C indicates that the econometrically screened specification preserved much of the predictive performance observed under Model A in the evaluated setting. A larger penalty under Model B indicates that the deliberately excluded information was consequential for the corresponding predictive models. These observations are conditional on the dataset, predictor structure, learning algorithm, and validation procedure; they do not establish causal necessity or formal statistical equivalence.
The framework is evaluated using four publicly accessible housing datasets: UCI Real Estate Valuation, California Housing, Ames Housing, and King County House Sales. Their differences in sample size, geographical setting, predictor dimensionality, and information composition allow the same experimental procedure to be examined across heterogeneous empirical contexts. Each dataset is analysed independently, and the cross-dataset design evaluates the consistency of the information-removal framework rather than the transferability of fitted models between markets.
Table 2 specifies the predictor configurations used for each dataset. Model A identifies the full eligible predictor set, Model B records the predefined valuation-information channel excluded from that set, and Model C reports the independently econometrically screened predictors. These configurations are established before the corresponding hold-out performance comparisons. The table therefore documents the experimental information environments rather than predictive outcomes and provides a transparent basis for the subsequent analysis.
Table 2.
Dataset-specific construction of the full-information, controlled information-removal, and econometrically screened predictor configurations.
An important distinction must be maintained between econometric significance, predictor importance, and predictive necessity. Statistical significance measures conditional association under a specified econometric model, whereas multicollinearity diagnostics characterize linear dependencies among predictors. Neither criterion independently establishes whether a predictor is indispensable for nonlinear out-of-sample prediction. Accordingly, the A–B–C framework treats information-removal experiments as dataset- and model-conditional ablation analyses. The resulting predictive penalties describe the observed consequences of withholding predefined valuation-information channels under the evaluated learning architectures and validation conditions. They should not be interpreted as demonstrating universal predictor essentiality, causal necessity, or formal statistical equivalence between alternative information environments.
Table 2 illustrates that the A–B–C information environments differ in both predictor composition and the rationale underlying predictor exclusion. Model B deliberately removes predefined, economically interpretable information channels, whereas Model C applies independent econometric screening. The resulting configurations are dataset-specific and do not imply a universal reduced predictor set. Their predictive consequences are examined in the subsequent analysis.
Computational environment. All analyses were conducted in Python 3.12.3. Data processing and numerical operations were performed using pandas 3.0.2 and NumPy 2.4.4. Econometric estimation, including ordinary least squares regression and multicollinearity diagnostics, was implemented using statsmodels 0.15.0. Data preprocessing, train–test splitting, cross-validation, Random Forest, and artificial neural network modelling were carried out using scikit-learn 1.8.0. Gradient-boosting models were implemented using XGBoost 3.4.1. SHAP 0.52.0 was available for model-interpretation procedures, and Matplotlib 3.10.8 was used to generate graphical outputs. Random-state controls and the principal algorithm-specific settings were maintained consistently across the A–B–C comparisons within each dataset to support computational reproducibility.
3.1. Implementation and Validation Protocol
To support reproducibility and prevent predictor selection from being influenced by subsequent machine-learning outcomes, the empirical analysis followed a predefined sequential protocol. Data preparation, econometric assessment, construction of the A–B–C information environments, machine-learning estimation, and out-of-sample evaluation were treated as distinct stages. The objective was not to identify reduced predictor sets retrospectively from predictive performance, but to assess the consequences of information configurations established before the corresponding hold-out results were examined.
For each dataset, identifiers, target-derived variables, and fields that could introduce direct information leakage were excluded before model construction. The remaining eligible predictors constituted Model A, the full-information benchmark. Dataset-specific preprocessing, including missing-value treatment and algorithm-dependent transformations or scaling, was based exclusively on training data.
Econometric assessment preceded the RF, XGB, and ANN performance comparisons. Predictor-level conditional associations and multicollinearity were examined using standardized coefficients, statistical significance, and variance inflation factors. Model C was constructed primarily according to the predefined criteria of (p < 0.05) and (VIF < 10), with deterministic or structurally dependent predictors treated coherently rather than screened mechanically as independent variables.
The same econometric assessment also informed the identification of theoretically interpretable valuation-information channels for Model B. Candidate predictors or coherent predictor blocks were required to represent recognizable valuation mechanisms and receive econometric support in the training data. Where several predictors represented the same underlying mechanism, they were considered jointly to avoid unintentionally retaining substantial portions of the information channel designated for removal. Model B was therefore constructed independently of subsequent ML outcomes and represents a predefined controlled information-removal experiment, whereas Model C represents an independently econometrically screened information environment. These configurations address distinct questions: Model B examines the predictive consequences of withholding economically meaningful information, while Model C evaluates the predictive performance of a reduced predictor set constructed through econometric screening.
Figure 1 summarizes the sequential analytical procedure, from data preparation and econometric assessment to the construction of the three information environments and their subsequent predictive evaluation. Econometric analysis and machine learning serve complementary functions: the former characterizes conditional associations, multicollinearity, and the empirical support for theoretically meaningful information channels, while the latter measures the out-of-sample consequences of retaining or excluding predefined information.
Figure 1.
Econometric-guided A–B–C framework for evaluating the predictive consequences of valuation-information removal. Model A represents the full eligible predictor set, Model B excludes a predefined economically meaningful information channel, and Model C applies independent econometric screening. Common machine-learning algorithms and validation procedures are used to evaluate the predictive penalties and retention ratios associated with the alternative information environments. The arrows indicate the sequential stages of the proposed framework, while the colors distinguish its main methodological components.
Once the A–B–C configurations had been established, RF, XGB, and ANN models were estimated under common validation conditions within each dataset. Observations were divided into an 80% training sample and a 20% independent hold-out sample using random_state = 42. Identical train–test partitions were maintained across Models A, B, and C within each dataset. Five-fold cross-validation using common folds provided an additional assessment of predictive stability.
Predictive performance was evaluated primarily using the coefficient of determination (R2) on the common hold-out test set. R2 was selected because the principal objective was to compare the observed predictive consequences of predefined information removal and econometric screening. Differences in hold-out R2 and the corresponding retention ratios were interpreted as descriptive performance measures rather than formal evidence of statistical equivalence.
The ANN implementation was standardized across datasets using two hidden layers containing 32 and 16 neurons, respectively, ReLU activation, Adam optimization, L2 regularization (alpha = 0.01), and early stopping. Input predictors and target values were standardized using training information only, and predictions were subsequently transformed back to the original target scale. Early stopping relied on an internal validation subset drawn exclusively from the training sample, thereby excluding the independent hold-out observations from optimization and stopping decisions. The same ANN architecture and optimization settings were maintained across the A–B–C information environments.
Implementation settings, preprocessing controls, and validation procedures are documented in Supplementary Table S1. Supplementary Table S2 presents the theoretical rationale and coherent predictor blocks underlying the controlled information-removal experiments, while Supplementary Table S3 provides the predictor-level econometric evidence supporting the construction of Models B and C. Together, these materials document the distinction between theoretical information identification, econometric screening, and subsequent predictive evaluation.
Reproducibility and Robustness Control
The analytical protocol was applied consistently across four housing datasets and three machine-learning algorithms. Within each dataset, Models A, B, and C were evaluated using identical hold-out partitions, complemented by five-fold cross-validation. Preprocessing, econometric screening, and the identification of Model B information channels were based on training information and completed before inspection of the corresponding hold-out predictive outcomes. This separation was intended to limit test-set leakage and prevent retrospective selection of predictor configurations based on observed ML performance.
The principal implementation settings for RF, XGB, and ANN are summarized in Supplementary Table S1. The same algorithm-specific settings were maintained across Models A, B, and C within each dataset to support consistent comparisons of alternative information environments.
The principal algorithm-specific implementation settings are summarized in Table 3. Further details concerning preprocessing, validation procedures, and computational reproducibility are provided in Supplementary Table S1.
Table 3.
Model implementation settings for the machine-learning algorithms.
Supplementary Table S2 documents the economic rationale for the valuation-information channels deliberately removed in Model B. Supplementary Table S3 provides the corresponding predictor-level econometric audit trail, including standardized coefficients, statistical significance, variance inflation factors, and dataset-specific retention or exclusion decisions. These materials support the transparency of the A–B–C construction and establish a traceable connection between the predefined methodological criteria and the predictor configurations reported in Table 2.
The contribution of the proposed framework is therefore not a new feature-selection algorithm, but a structured procedure for assessing the observed out-of-sample consequences of withholding economically meaningful valuation information. The resulting evidence is conditional on the evaluated datasets, learning architectures, and validation procedures and should not be interpreted as establishing universal predictor necessity.
4. Results
The empirical results reveal a consistent distinction between reducing predictor dimensionality and deliberately removing economically meaningful valuation information. Across the four housing datasets, the observed predictive consequences varied with the information represented by the excluded predictors rather than simply with the number of predictors removed. This pattern was examined using Random Forest (RF), XGBoost (XGB), and artificial neural networks (ANN), across datasets differing in sample size, geographical context, and predictor composition.
Model A serves as the full-information benchmark, whereas Models B and C represent two distinct information-reduction procedures. Model B deliberately excludes a predefined, theoretically interpretable valuation-information channel before the corresponding hold-out outcomes are examined. Model C independently applies econometric screening criteria to the training data. The predictor-level evidence supporting these configurations is documented in Supplementary Table S3.
Predictive performance is evaluated using mean hold-out R2, the absolute R2 penalty relative to Model A, and the proportion of benchmark R2 retained by each reduced specification. Table 4 presents the results averaged across RF, XGB, and ANN within each dataset. These measures describe the observed predictive consequences of the predefined information environments and are not intended as formal statistical tests of performance differences.
Table 4.
Cross-dataset predictive consequences of ex ante information removal and econometric screening relative to the full-information specification.
Table 4 indicates that Model B produces a larger mean R2 penalty than Model C in each of the four datasets. Across datasets, the overall mean R2 values are 0.8313 for Model A, 0.7726 for Model B, and 0.8225 for Model C. The corresponding mean penalties relative to Model A are 0.0587 and 0.0088 for Models B and C, respectively. Based on the overall mean R2 values, Models B and C retain approximately 92.74% and 98.93% of the full-information benchmark. Thus, the observed mean penalty associated with deliberate information removal is approximately 6.7 times that associated with econometric screening. This comparison is descriptive and does not establish statistical significance or equivalence.
The dataset-specific findings clarify the informational mechanisms underlying these differences. In UCI Real Estate Valuation, Model B excludes the distance to the nearest MRT station and the number of convenience stores, thereby removing the predefined accessibility and local-amenity channel. Its mean R2 retention is 91.36%, compared with 98.07% for Model C, which excludes Longitude on the basis of insufficient conditional statistical support. The larger observed penalty under Model B indicates that the removed accessibility-related information contributes to predictive performance under the evaluated conditions.
California Housing exhibits the largest Model B penalty among the four datasets. Removing Latitude and Longitude reduces mean R2 retention to 88.18%. Model C, by contrast, excludes Population while retaining the remaining seven predictors, including both spatial coordinates, and achieves 99.77% retention. The difference suggests that explicit geographical information provides a substantial predictive contribution in this dataset. The observed deterioration under Model B cannot be explained solely by the number of excluded predictors, because Model C also reduces the predictor set without producing a comparable loss.
In Ames Housing, Model B excludes Overall Qual and Gr Liv Area, representing property quality and usable living space, and retains 97.59% of the Model A benchmark. Model C instead excludes Full Bath and TotRms AbvGrd according to the predefined econometric screening criteria. Its mean hold-out R2 is 0.9020, compared with 0.8988 for Model A, corresponding to a retention ratio of 100.36%. This small observed improvement should not be interpreted as evidence of systematic superiority or formal predictive equivalence. Rather, it indicates that the econometrically screened configuration performed comparably to the full-information benchmark on the evaluated hold-out sample.
King County House Sales provides an additional contrast between deliberate information removal and econometric screening. Model B excludes Grade and the current living-space block comprising sqft_living, sqft_above, and sqft_basement, reducing mean R2 retention to 93.84%. Model C excludes the structurally collinear living-space block while retaining Grade and Floors, producing a 14-predictor configuration with 97.53% retention. The smaller observed penalty under Model C is consistent with the distinction between removing a broader valuation-information channel and addressing structural redundancy in the predictor set.
Taken together, the dataset-level results show a common descriptive ordering: Model B has a lower mean hold-out R2 than both Model A and Model C in all four datasets, while Model C remains relatively close to the full-information benchmark. This ordering does not imply that Model C is universally equivalent to Model A or that predictors excluded by econometric screening lack economic relevance. Instead, it indicates that the predefined Model B removals were associated with larger observed predictive losses than the independently screened Model C configurations.
Figure 2 illustrates the differences in predictor composition across the three information environments. Model A contains the complete eligible predictor set, Model B excludes dataset-specific valuation-information channels, and Model C retains predictors according to independent econometric screening. The figure documents the experimental configurations rather than the predictive performance of individual predictors. Their out-of-sample consequences are evaluated separately in Table 3 and Figure 3.
Figure 2.
Predictor retention and exclusion across the A–B–C information environments for four housing datasets: (A) UCI Real Estate Valuation, (B) California Housing, (C) Ames Housing, and (D) King County House Sales. Model A includes all eligible predictors; Model B removes predefined, economically interpretable valuation-information channels; and Model C applies independent econometric screening. Green cells indicate retained predictors, whereas red cells indicate excluded predictors. The selection decisions correspond to Supplementary Table S3. Multivariable predictive performance is reported separately in Table 3 and Figure 3.
Figure 3.
Cross-dataset comparison of predictive performance under the A–B–C information environments. Bars represent the mean hold-out R2 across Random Forest, XGBoost, and artificial neural network models for each dataset. Model A includes all eligible predictors, Model B excludes a predefined valuation-information channel, and Model C applies econometric screening. The overall mean summarizes the four dataset-level results. Values correspond to Table 3.
Figure 3 visualizes the multivariable predictive performance of the three information environments across the four datasets. Model B exhibits a larger reduction in mean hold-out R2 than Model C in every dataset. The largest Model B penalty occurs in California Housing (0.0912), following the exclusion of explicit spatial-location information. Model C remains comparatively close to Model A, with a small negative penalty in Ames Housing (−0.0032), indicating marginally higher observed R2 on the evaluated test sample. The overall mean values further illustrate the difference between deliberate information removal and econometric screening.
The cross-dataset comparison is informative because the datasets differ in their geographical settings, predictor structures, sample sizes, and housing-market characteristics. The results do not identify a universal set of essential housing predictors. Instead, they demonstrate the applicability of a common experimental procedure for evaluating dataset-specific information-removal effects. Each dataset was modelled independently; therefore, the findings should not be interpreted as evidence of cross-market transferability of fitted prediction models.
The results also clarify the distinction between econometric significance, algorithmic importance, and observed predictive consequences. Statistical significance describes conditional relationships under an econometric specification, while feature-importance measures characterize how fitted models use available predictors. Controlled information removal provides complementary evidence by examining changes in predictive performance when predefined valuation information is withheld. However, the resulting penalties remain conditional on the available predictors, learning architectures, and validation procedures.
The comparisons reported in Table 3 and Figure 3 are descriptive assessments of hold-out predictive performance. Although Model C exhibits relatively small observed R2 differences from Model A, formal statistical equivalence has not been established. Such a conclusion would require a prespecified equivalence margin and an appropriate inferential procedure, such as the two one-sided tests (TOST) approach. Similarly, paired bootstrap confidence intervals could be used to quantify uncertainty surrounding the observed performance differences. Accordingly, the present results support a comparative interpretation of information-removal effects rather than claims of statistically significant superiority or equivalence.
5. Discussion
The principal finding of this study is that reducing predictor dimensionality and removing economically meaningful valuation information are not equivalent operations. Across four heterogeneous housing datasets, the econometrically screened specifications generally preserved predictive performance close to the full-information benchmark, whereas the deliberate removal of predefined valuation-information channels produced larger observed predictive penalties. This distinction shifts the methodological focus from the number of predictors retained to the information represented by those predictors and its contribution to out-of-sample valuation performance.
The contrast between Models B and C is central to this interpretation. Model C applies predefined econometric criteria to construct a reduced predictor set, accounting for conditional statistical relevance and structural multicollinearity. Model B addresses a different question by deliberately withholding a theoretically interpretable and econometrically supported valuation-information channel before subsequent machine-learning outcomes are examined. As documented in Supplementary Table S3, these configurations are supported by training-sample econometric evidence and constructed independently of the corresponding hold-out performance results. Consequently, their predictive penalties can be interpreted as the observed outcomes of predefined information-removal and screening procedures rather than retrospective feature selection based on test-set accuracy.
The aggregate findings illustrate the practical importance of this distinction. Across the four datasets, the overall mean hold-out R2 values were 0.8313 for Model A, 0.7726 for Model B, and 0.8225 for Model C. Relative to the full-information benchmark, the corresponding mean R2 penalties were 0.0587 and 0.0088 for Models B and C, respectively. Based on the overall mean R2 values, Model B retained approximately 92.74% of the benchmark performance, compared with 98.93% for Model C. The observed mean penalty associated with controlled information removal was therefore approximately 6.7 times that associated with econometric screening. Although this ratio is descriptive and does not establish statistical significance, it indicates that the informational content of excluded predictors can be more consequential than the extent of dimensionality reduction.
These findings clarify the complementary roles of econometrics and machine learning. Econometric analysis provides interpretable evidence concerning conditional associations, standardized effects, and multicollinearity, while machine-learning algorithms evaluate the predictive consequences of alternative information environments under nonlinear modelling assumptions. This division of methodological functions is consistent with the broader rationale for integrating econometric reasoning and machine learning in valuation research [16]. Within the proposed framework, however, econometric evidence is not treated as a definitive measure of predictive necessity. Instead, it informs the construction of theoretically meaningful information environments whose consequences are subsequently assessed through out-of-sample prediction.
The dataset-specific results provide further insight into the economic interpretation of information removal. In UCI Real Estate Valuation, excluding distance to the nearest MRT station and the number of convenience stores reduced predictive performance, indicating the contribution of accessibility and local amenities within the available predictor structure. California Housing exhibited the largest Model B penalty following the removal of Latitude and Longitude, suggesting a substantial predictive role for explicit geographical information in that dataset. In Ames Housing, the deliberate exclusion of Overall Qual and Gr Liv Area affected performance more than the econometric screening of Full Bath and TotRms AbvGrd. King County House Sales showed a related pattern: removing Grade together with the current living-space information block produced a larger penalty than the Model C specification, which addressed structural collinearity while retaining Grade and other relevant characteristics.
These differences indicate that the predictive contribution of valuation information depends on the surrounding predictor environment. Housing markets vary in how property quality, living space, accessibility, geographical location, and neighbourhood characteristics are reflected in observed prices. Accordingly, the results do not support a universal ranking of essential housing predictors. Instead, they suggest that economically interpretable information channels may recur across datasets even when the particular predictors representing those channels differ. The broader methodological implication is that the consequences of information absence should be evaluated within each empirical setting rather than inferred from predictor names or rankings alone.
This interpretation also distinguishes predictive information assessment from conventional feature-importance analysis. Explainable machine-learning methods, including SHAP, characterize how fitted models use available predictors [19]. Such explanations are valuable for understanding model behaviour, but they do not independently establish whether the same information can be removed without a predictive penalty. Correlated predictors may substitute for one another, while nonlinear interactions may influence the distribution of model-attribution scores. Controlled information removal provides complementary evidence by evaluating the observed change in predictive performance when a predefined information channel is withheld. Thus, econometric relevance, algorithmic importance, and the predictive consequences of information absence should be treated as related but distinct analytical concepts.
The findings also illustrate why econometric screening should not be interpreted as a universally optimal feature-selection strategy. Statistical significance and VIF thresholds are conditional on the specified econometric model and may not fully capture nonlinear relationships, interactions, or substitution among predictors. The relatively small Model C penalties observed in this study therefore demonstrate the performance of the particular screened configurations rather than the general superiority of econometric screening. In Ames Housing, Model C achieved a marginally higher mean hold-out R2 than Model A. This difference is best interpreted as a small observed performance variation under the specified validation conditions, not as evidence of systematic superiority or formally established predictive equivalence.
The use of RF, XGB, and ANN provides an additional perspective on the evaluated information environments. These algorithms represent contrasting nonlinear learning architectures and were applied using common within-dataset validation conditions. The aggregate results across the three algorithms indicate that the distinction between controlled information removal and econometric screening is not confined to a single predictive architecture. Nevertheless, averaging results across algorithms does not establish that every individual learner exhibits an identical response to information removal. The findings therefore support a comparative cross-algorithm assessment rather than a universal claim of algorithm-independent information necessity.
From a practical perspective, the framework has implications for data acquisition, automated valuation, and information-quality management. Property datasets often differ in completeness, measurement consistency, and the cost of collecting or maintaining individual attributes. The proposed approach offers a structured basis for evaluating whether particular information channels contribute meaningfully to predictive performance under an established modelling environment. Predictors whose removal produces little observed deterioration may be candidates for further investigation when simplifying data-collection procedures. Conversely, information channels associated with larger and consistently observed penalties may warrant greater attention in data quality control, measurement design, and valuation-system development. Such decisions should also consider acquisition costs, operational requirements, and the consequences of prediction errors rather than relying on R2 penalties alone.
Several limitations qualify these interpretations. First, the four public datasets differ in sample size, target definition, geographical context, predictor dimensionality, and information richness. Although this heterogeneity allows the experimental procedure to be examined under different empirical conditions, it does not justify direct comparison of raw valuation coefficients or absolute prediction errors across markets. The findings are conditional on the available information within each dataset and should not be interpreted as identifying intrinsically essential predictors. This qualification is particularly important for Ames Housing, where the analysis uses a predefined panel of 15 numerical predictors extracted from a substantially richer original dataset. The observed information-removal effects therefore apply to that restricted predictor environment.
Second, the validation design relies on common random training and hold-out partitions within each dataset. This approach supports consistent comparisons among Models A, B, and C but does not eliminate potential spatial dependence between geographically proximate observations. Properties located near one another may share unobserved neighbourhood characteristics and appear in both training and test samples. Consequently, the reported hold-out performance may be optimistic relative to validation involving geographically separated observations. The results should therefore be interpreted as within-dataset comparisons rather than evidence of predictive generalization to previously unseen geographical areas. Spatially blocked cross-validation would provide a valuable extension.
Third, methodological replication across heterogeneous datasets should be distinguished from cross-market predictive transfer. The A–B–C procedure was implemented independently for each dataset; models trained in one housing market were not evaluated in another. The study therefore assesses the applicability of a common information-removal procedure across datasets rather than the transferability of fitted models. Direct cross-market evaluation would require harmonized target definitions, comparable predictor measurements, and explicit source-market and target-market validation protocols. The recurrence of broad valuation-information channels across the evaluated datasets is consequently suggestive of methodological relevance, not proof of transferable predictive relationships.
Fourth, the observed R2 differences and retention ratios are descriptive measures. Although Model C remained relatively close to the full-information benchmark, formal predictive equivalence was not tested. Establishing equivalence would require a prespecified margin and an appropriate inferential procedure, while paired bootstrap confidence intervals or other suitable methods could quantify uncertainty surrounding the observed penalties. The present findings therefore support comparative statements about the evaluated information environments without establishing statistically significant superiority or equivalence.
The methodological scope is also limited to three selected learning architectures. RF, XGB, and ANN provide contrasting approaches for assessing predefined information environments, but they do not constitute an exhaustive algorithm benchmark. Future research could extend the analysis to additional tabular learning methods, including TabPFN and TabICL, and investigate the sensitivity of information-removal effects to alternative model specifications. Bayesian Model Averaging could provide complementary evidence concerning specification uncertainty and posterior predictor inclusion, although such analysis would address a different question from the controlled information-removal experiment.
Further extensions should consider richer commercial and income-producing real estate datasets containing direct financial valuation variables, transaction-liquidity indicators, macroeconomic conditions, and more detailed spatial information. In particular, net operating income and capitalization rates could be examined using the same predefined information-removal logic, alongside structural, accessibility, and market characteristics. Such research would help determine whether the distinction between econometric relevance and observed predictive consequences persists when valuation information is more directly associated with income-generation mechanisms.
Overall, the findings suggest that valuation-model development should consider not only how effectively available predictors are used, but also how predictive performance changes when economically meaningful information becomes unavailable. The proposed A–B–C framework contributes a reproducible procedure linking theoretical information identification, econometric assessment, controlled information removal, and out-of-sample machine-learning evaluation. Its principal value lies in distinguishing the observed predictive consequences of information loss from those of econometrically guided predictor reduction, while recognizing that these consequences remain conditional on the datasets, algorithms, and validation conditions examined.
6. Conclusions
This study developed an econometric-guided framework for assessing the predictive consequences of valuation-information removal in machine-learning-based real estate valuation. By integrating theoretical interpretation, training-sample econometric evidence, predefined information-removal experiments, and out-of-sample machine-learning evaluation, the framework distinguishes conventional predictor reduction from the deliberate exclusion of economically meaningful valuation information. Its applicability was examined across four heterogeneous public housing datasets using Random Forest, XGBoost, and artificial neural networks.
The results reveal a consistent descriptive difference between controlled information removal and econometric screening. Across the four datasets, the overall mean hold-out R2 was 0.8313 for the full-information Model A, 0.7726 for Model B, and 0.8225 for Model C. Relative to Model A, the corresponding predictive-retention ratios were 92.74% and 98.93% for Models B and C, respectively. The mean R2 penalty associated with deliberate information removal 0.0587 was substantially greater than that associated with econometric screening 0.0088. These findings indicate that the observed predictive consequences of reducing an information set depend not only on predictor count but also on the economic content of the excluded information.
The dataset-specific findings further demonstrate that consequential valuation information is context-dependent. Accessibility and local amenities contributed to predictive performance in UCI Real Estate Valuation, explicit geographical location was particularly consequential in California Housing, and property quality and living-space characteristics were important in Ames Housing and King County House Sales. In contrast, the econometrically screened Model C configurations generally preserved performance close to the full-information benchmark. These results do not establish a universal ranking of essential housing predictors; rather, they illustrate how economically interpretable information channels can be evaluated within different empirical information environments.
The principal methodological contribution lies in distinguishing econometric relevance and algorithm-specific predictor importance from the observed predictive consequences of information absence. Econometric evidence informs the identification and screening of valuation predictors, while controlled removal and subsequent machine-learning evaluation assess the extent to which the remaining information supports out-of-sample prediction. Model B therefore represents a predefined information-loss experiment, whereas Model C evaluates an independently econometrically screened specification. This distinction provides a replicable basis for investigating valuation-information requirements without equating statistical significance or feature importance with predictive indispensability.
The conclusions remain conditional on the evaluated datasets, predictor configurations, learning architectures, and validation procedures. The reported retention ratios do not establish formal statistical equivalence, random hold-out evaluation does not ensure spatial independence, and methodological replication across datasets does not demonstrate cross-market transferability. Future research should examine spatially blocked validation, uncertainty quantification for predictive penalties, alternative learning architectures, and explicit cross-market evaluation. Extending the framework to commercial and income-producing real estate, particularly datasets containing net operating income and capitalization rates, would also permit assessment of directly income-related valuation-information channels. The proposed framework thus offers a structured approach to evaluating the consequences of information availability in data-driven property valuation.
Supplementary Materials
The following supporting information can be downloaded at: https://www.mdpi.com/article/10.3390/realestate3040022/s1, Supplementary Table S1, Implementation, Validation, and Reproducibility Protocol for the A–B–C Experiments; Supplementary Table S2, Ex Ante Identification and Justification of the Valuation-Information Blocks Removed in Model B; and Supplementary Table S3, Econometric Evidence Supporting Ex Ante Information Removal in Model B and Predictor Screening in Model C.
Author Contributions
Conceptualization, I.G.A.; methodology, I.G.A.; formal analysis, I.G.A.; investigation, I.G.A. and A.A.; data curation, A.A.; visualization, A.A.; validation, I.G.A.; writing—original draft preparation, A.A.; writing—review and editing, A.A. and I.G.A.; supervision, A.A. and I.G.A.; project administration, A.A. All authors have read and agreed to the published version of the manuscript.
Funding
This research received no external funding.
Data Availability Statement
All datasets analysed in this study are publicly available from their respective repositories or source platforms. The UCI Real Estate Valuation dataset is available from the UCI Machine Learning Repository: https://archive.ics.uci.edu/dataset/477/real+estate+valuation+data+set (accessed on 30 August 2026). The California Housing dataset is publicly accessible through the fetch_california_housing dataset loader provided by scikit-learn: https://www.kaggle.com/datasets/camnugent/california-housing-prices (accessed on 30 August 2026). The Ames Housing dataset is available through the data resources accompanying De Cock (2011), Ames, Iowa: Alternative to the Boston Housing Data as an End of Semester Regression Project: https://www.kaggle.com/datasets/shashanknecrothapa/ames-housing-dataset (accessed on 30 August 2026). The King County House Sales dataset is publicly available through Kaggle as: House Sales in King County, USA (accessed on 30 August 2026). No proprietary or confidential data were used in the study. The dataset-specific predictor compositions and econometric screening decisions required to reproduce the A-B-C information environments are additionally documented in Table 2 and Supplementary Tables S2 and S3.
Acknowledgments
During the preparation of this manuscript, the authors used ChatGPT (GPT-5.1, OpenAI, default mode; specific model version not recorded) to assist with English-language refinement, terminology consistency, and the presentation of figures. The authors carefully reviewed and edited the AI-assisted content and take full responsibility for the accuracy, scientific integrity, and final content of the manuscript.
Conflicts of Interest
Author Aghalar Allahyarov is employed by the company Industrial and Civil Construction Services LLC, Baku, Azerbaijan. The remaining author declares that the research was conducted in the absence of any commercial or financial relationships that could be construed as a potential conflict of interest.
Abbreviations
The following abbreviations are used in this manuscript:
| ANN | Artificial Neural Network |
| CV | Cross-Validation |
| ML | Machine Learning |
| MRT | Mass Rapid Transit |
| OLS | Ordinary Least Squares |
| PP | Predictive Penalty |
| RF | Random Forest |
| SHAP | SHapley Additive exPlanations |
| VIF | Variance Inflation Factor |
| XGB | XGBoost (Extreme Gradient Boosting) |
References
- Sirmans, S.; Macpherson, D.; Zietz, E. The Composition of Hedonic Pricing Models. J. Real Estate Lit. 2005, 13, 1–44. [Google Scholar] [CrossRef] [Scilit]
- Rosen, S. Hedonic Prices and Implicit Markets: Product Differentiation in Pure Competition. J. Political Econ. 1974, 82, 34–55. [Google Scholar] [CrossRef] [Scilit] [PubMed]
- Chou, J.-S.; Fleshman, D.-B.; Truong, D.-N. Comparison of Machine Learning Models to Provide Preliminary Forecasts of Real Estate Prices. J. Hous. Built Environ. 2022, 37, 2079–2114. [Google Scholar] [CrossRef] [Scilit]
- Deaconu, A.; Buiga, A.; Tothăzan, H. Real Estate Valuation Models Performance in Price Prediction. Int. J. Strateg. Prop. Manag. 2022, 26, 86–105. [Google Scholar] [CrossRef] [Scilit]
- Tekouabou, S.C.K.; Gherghina, Ş.C.; Kameni, E.D.; Filali, Y.; Idrissi Gartoumi, K. AI-Based on Machine Learning Methods for Urban Real Estate Prediction: A Systematic Survey. Arch. Comput. Methods Eng. 2024, 31, 1079–1095. [Google Scholar] [CrossRef] [Scilit]
- Lorenz, F.; Willwersch, J.; Cajias, M.; Fuerst, F. Interpretable Machine Learning for Real Estate Market Analysis. Real Estate Econ. 2023, 51, 1178–1208. [Google Scholar] [CrossRef] [Scilit]
- Lee, C. Enhancing the Performance of a Neural Network with Entity Embeddings: An Application to Real Estate Valuation. J. Hous. Built Environ. 2022, 37, 1057–1072. [Google Scholar] [CrossRef] [Scilit]
- Kim, C.D.; Bedorf, N. Predicting Housing Sale Prices in Germany by Application of Machine Learning Models and Methods of Data Exploration. Kwart. Nauk. Przedsiębiorstwie 2024, 71, 107–122. [Google Scholar] [CrossRef] [Scilit]
- Bachmann, S. Interpretable Machine Learning for the German Residential Rental Market-Shedding Light into Model Mechanics. Aestimum 2025, 86, 25–46. [Google Scholar] [CrossRef] [Scilit]
- Jin, B.; Xu, X. Predictions of Residential Property Price Indices for China via Machine Learning Models. Qual. Quant. 2025, 59, 1481–1513. [Google Scholar] [CrossRef] [Scilit]
- Gafarbayli, K.; Hashimova, A.; Aliyev, I.G. Market Dynamics and Determinants of Commercial Real Estate Performance: Evidence from an Emerging Economy. Economies 2026, 14, 310. [Google Scholar] [CrossRef] [Scilit]
- Schmid, J. Predicting a Housing Price Index: A Two-Stage Machine Learning Approach Using Linked Micro-, Socio- and Macroeconomic Data from Frankfurt am Main. Real Estate 2026, 3, 8. [Google Scholar] [CrossRef] [Scilit]
- Grybauskas, A.; Pilinkienė, V.; Stundžienė, A. Predictive Analytics Using Big Data for the Real Estate Market during the COVID-19 Pandemic. J. Big Data 2021, 8, 105. [Google Scholar] [CrossRef] [Scilit] [PubMed]
- Xue, C.; Ju, Y.; Li, S.; Zhou, Q.; Liu, Q. Research on Accurate House Price Analysis by Using GIS Technology and Transport Accessibility: A Case Study of Xi’an, China. Symmetry 2020, 12, 1329. [Google Scholar] [CrossRef] [Scilit]
- Elariane, S.A. Location Based Services APIs for Measuring the Attractiveness of Long-Term Rental Apartment Location Using Machine Learning Model. Cities 2022, 122, 103588. [Google Scholar] [CrossRef] [Scilit]
- Hajirahimi, Z.; Khashei, M. Hybrid Structures in Time Series Modeling and Forecasting: A Review. Eng. Appl. Artif. Intell. 2019, 86, 83–106. [Google Scholar] [CrossRef] [Scilit]
- Mullainathan, S.; Spiess, J. Machine Learning: An Applied Econometric Approach. J. Econ. Perspect. 2017, 31, 87–106. [Google Scholar] [CrossRef] [Scilit]
- Mammadrzayeva, F.; Jafarov, N.; Aliyev, I.G. Beyond Prediction: A Generalized Explainable Hybrid Econometric-Machine Learning Framework for Real Estate Valuation. Real Estate 2026, 3, 15. [Google Scholar] [CrossRef] [Scilit]
- Lundberg, S.M.; Lee, S.I. A Unified Approach to Interpreting Model Predictions. Adv. Neural Inf. Process. Syst. 2017, 30, 4765–4774. [Google Scholar]
- Kim, W.; Choi, I.; Lee, M. Explainable AI-based mass appraisal: Insights from machine learning applications in Korea’s residential property market. Int. J. Strateg. Prop. Manag. 2025, 29, 350–376. [Google Scholar] [CrossRef] [Scilit]
- Tapia, J.; Chavez-Garzon, N.; Pezoa, R.; Suarez-Aldunate, P.; Pilleux, M. Comparing automated valuation models for realestate assessment in the Santiago Metropolitan Region: A study on machine learning algorithms and hedonic pricing with spatial adjustments. PLoS ONE 2025, 20, e0318701. [Google Scholar] [CrossRef] [Scilit] [PubMed]
- Aydinoglu, A.C.; Sisman, S. Comparing modelling performance and evaluating differences of feature importance on defined geographical appraisal zones for mass realestate appraisal. Spat. Econ. Anal. 2024, 19, 225–249. [Google Scholar] [CrossRef] [Scilit]
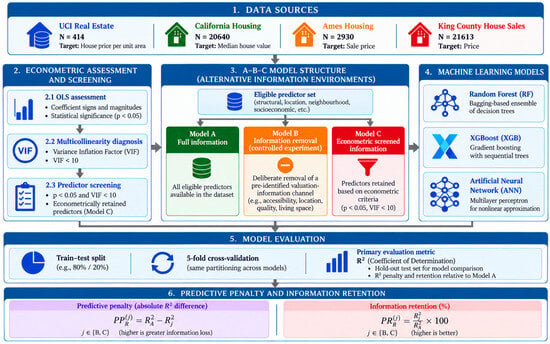
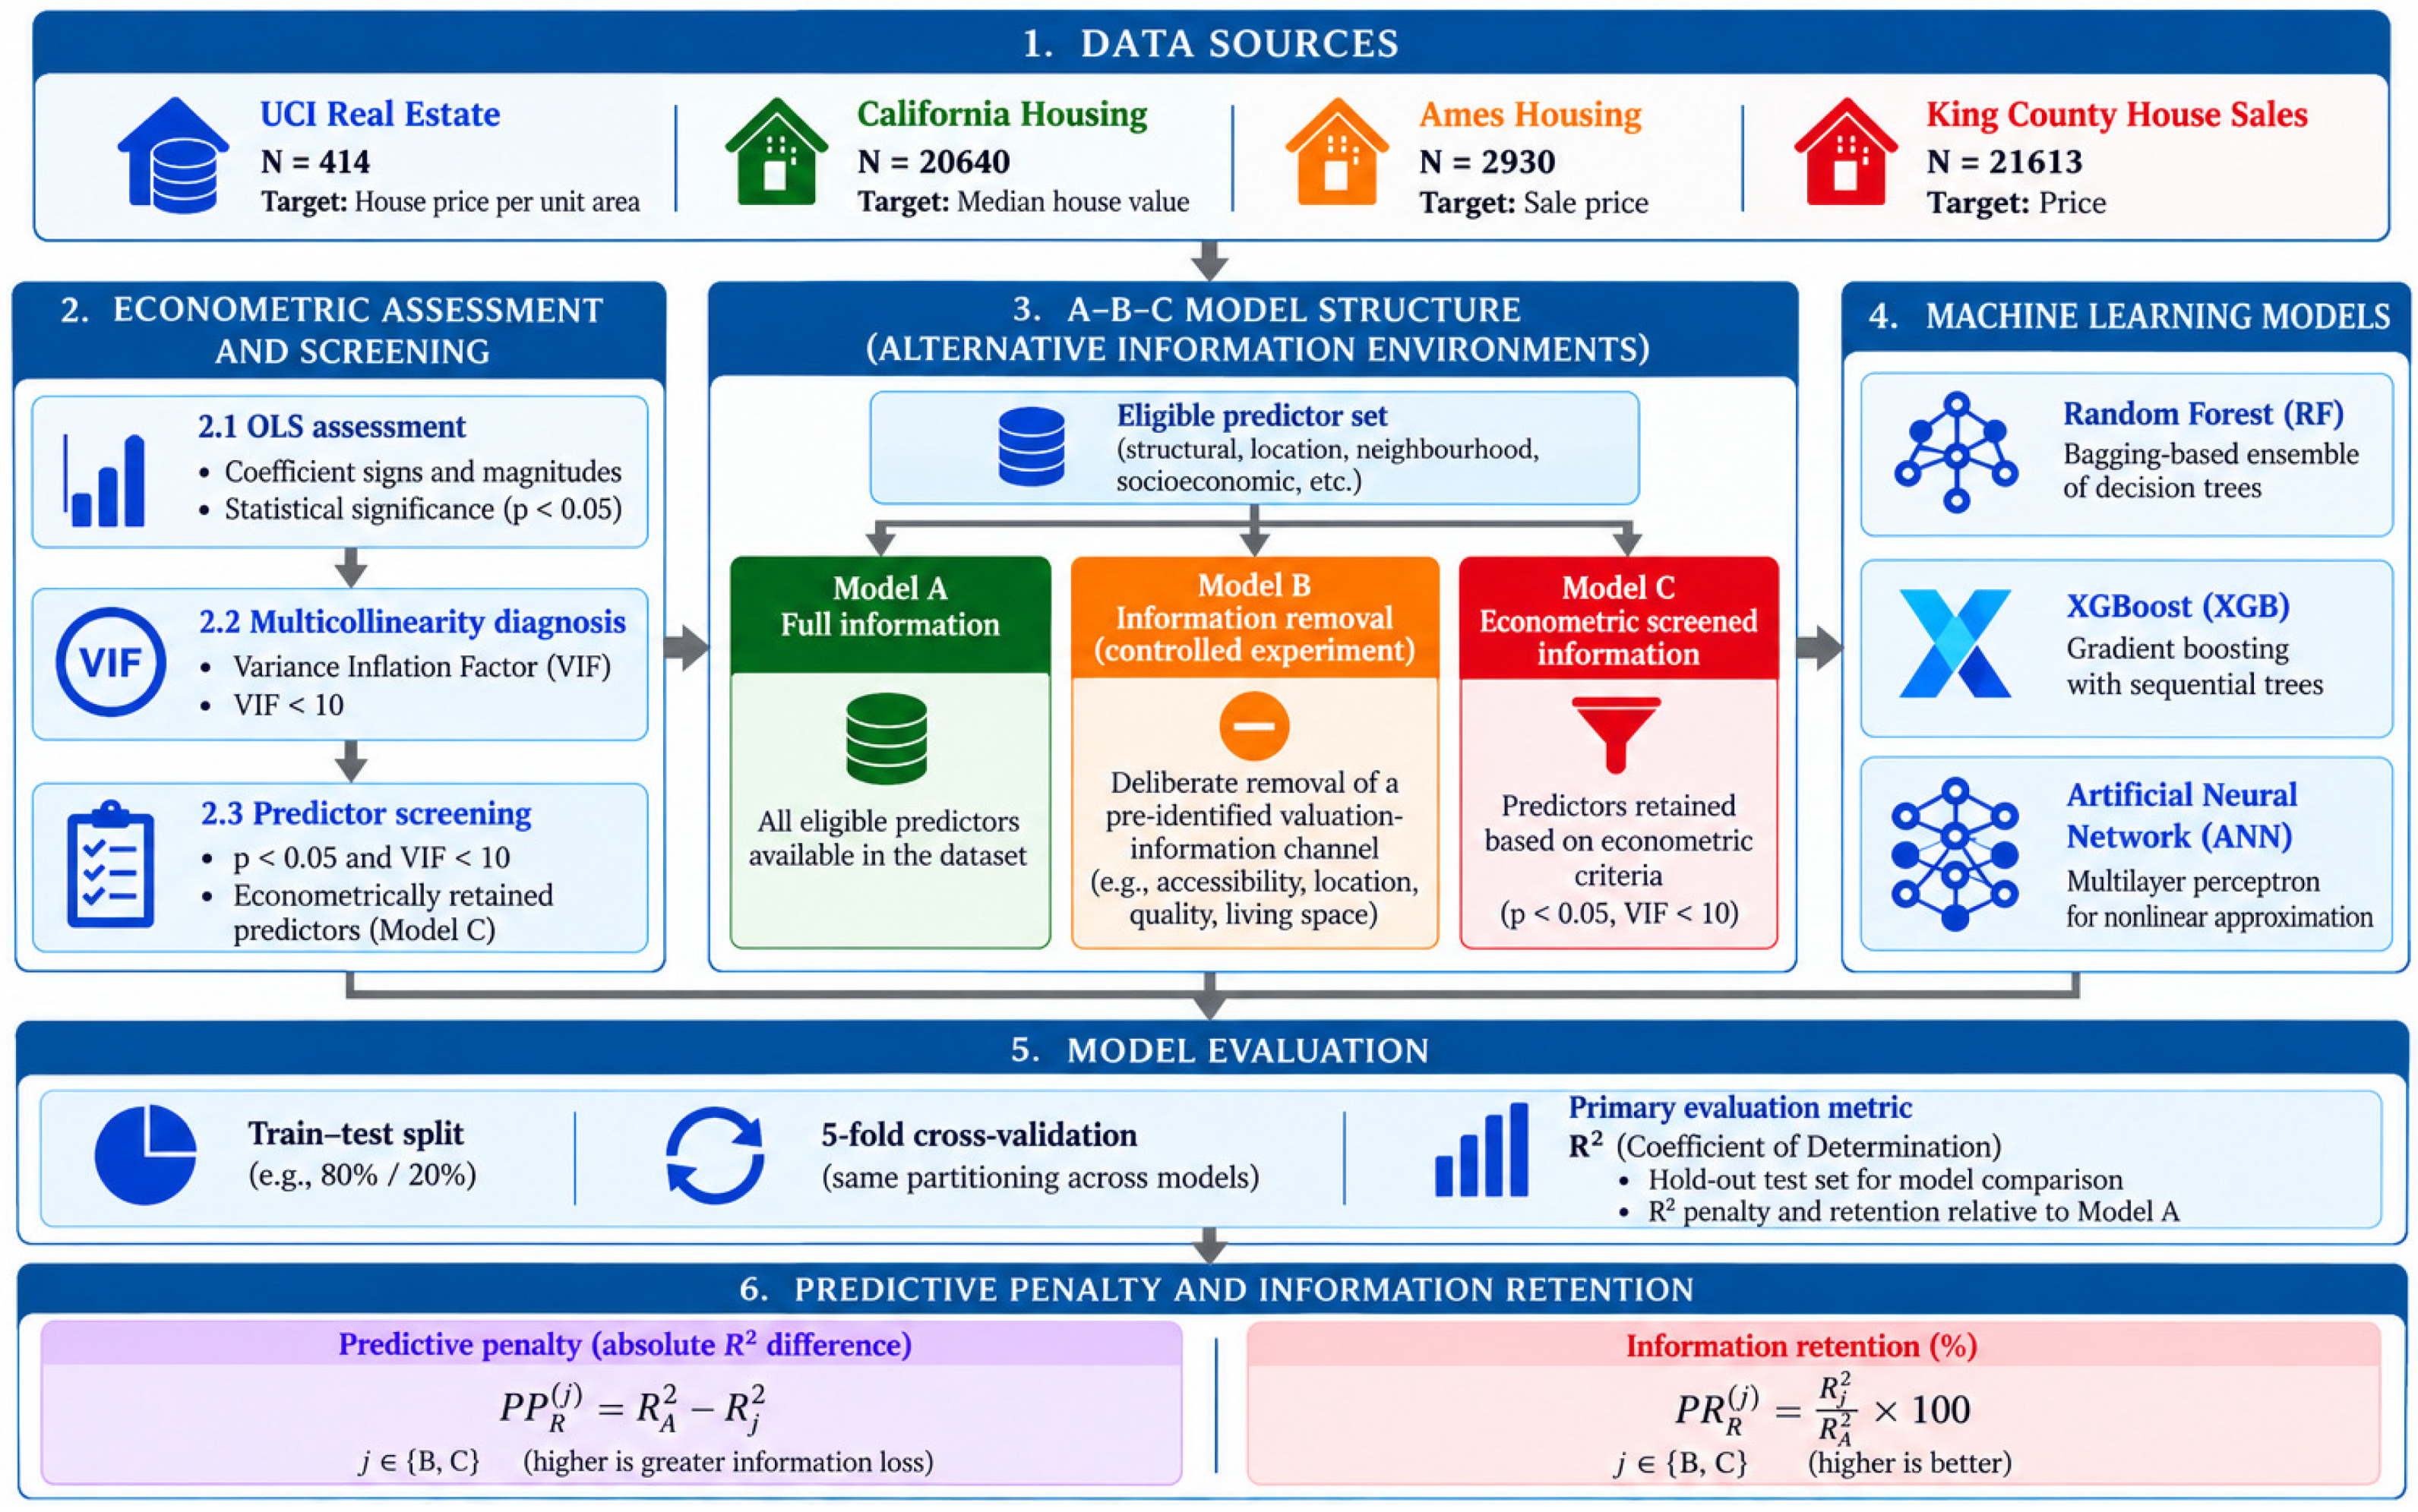
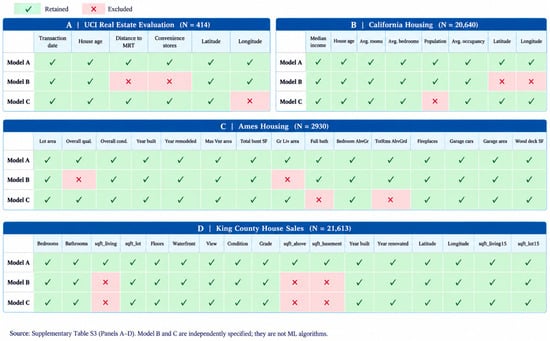
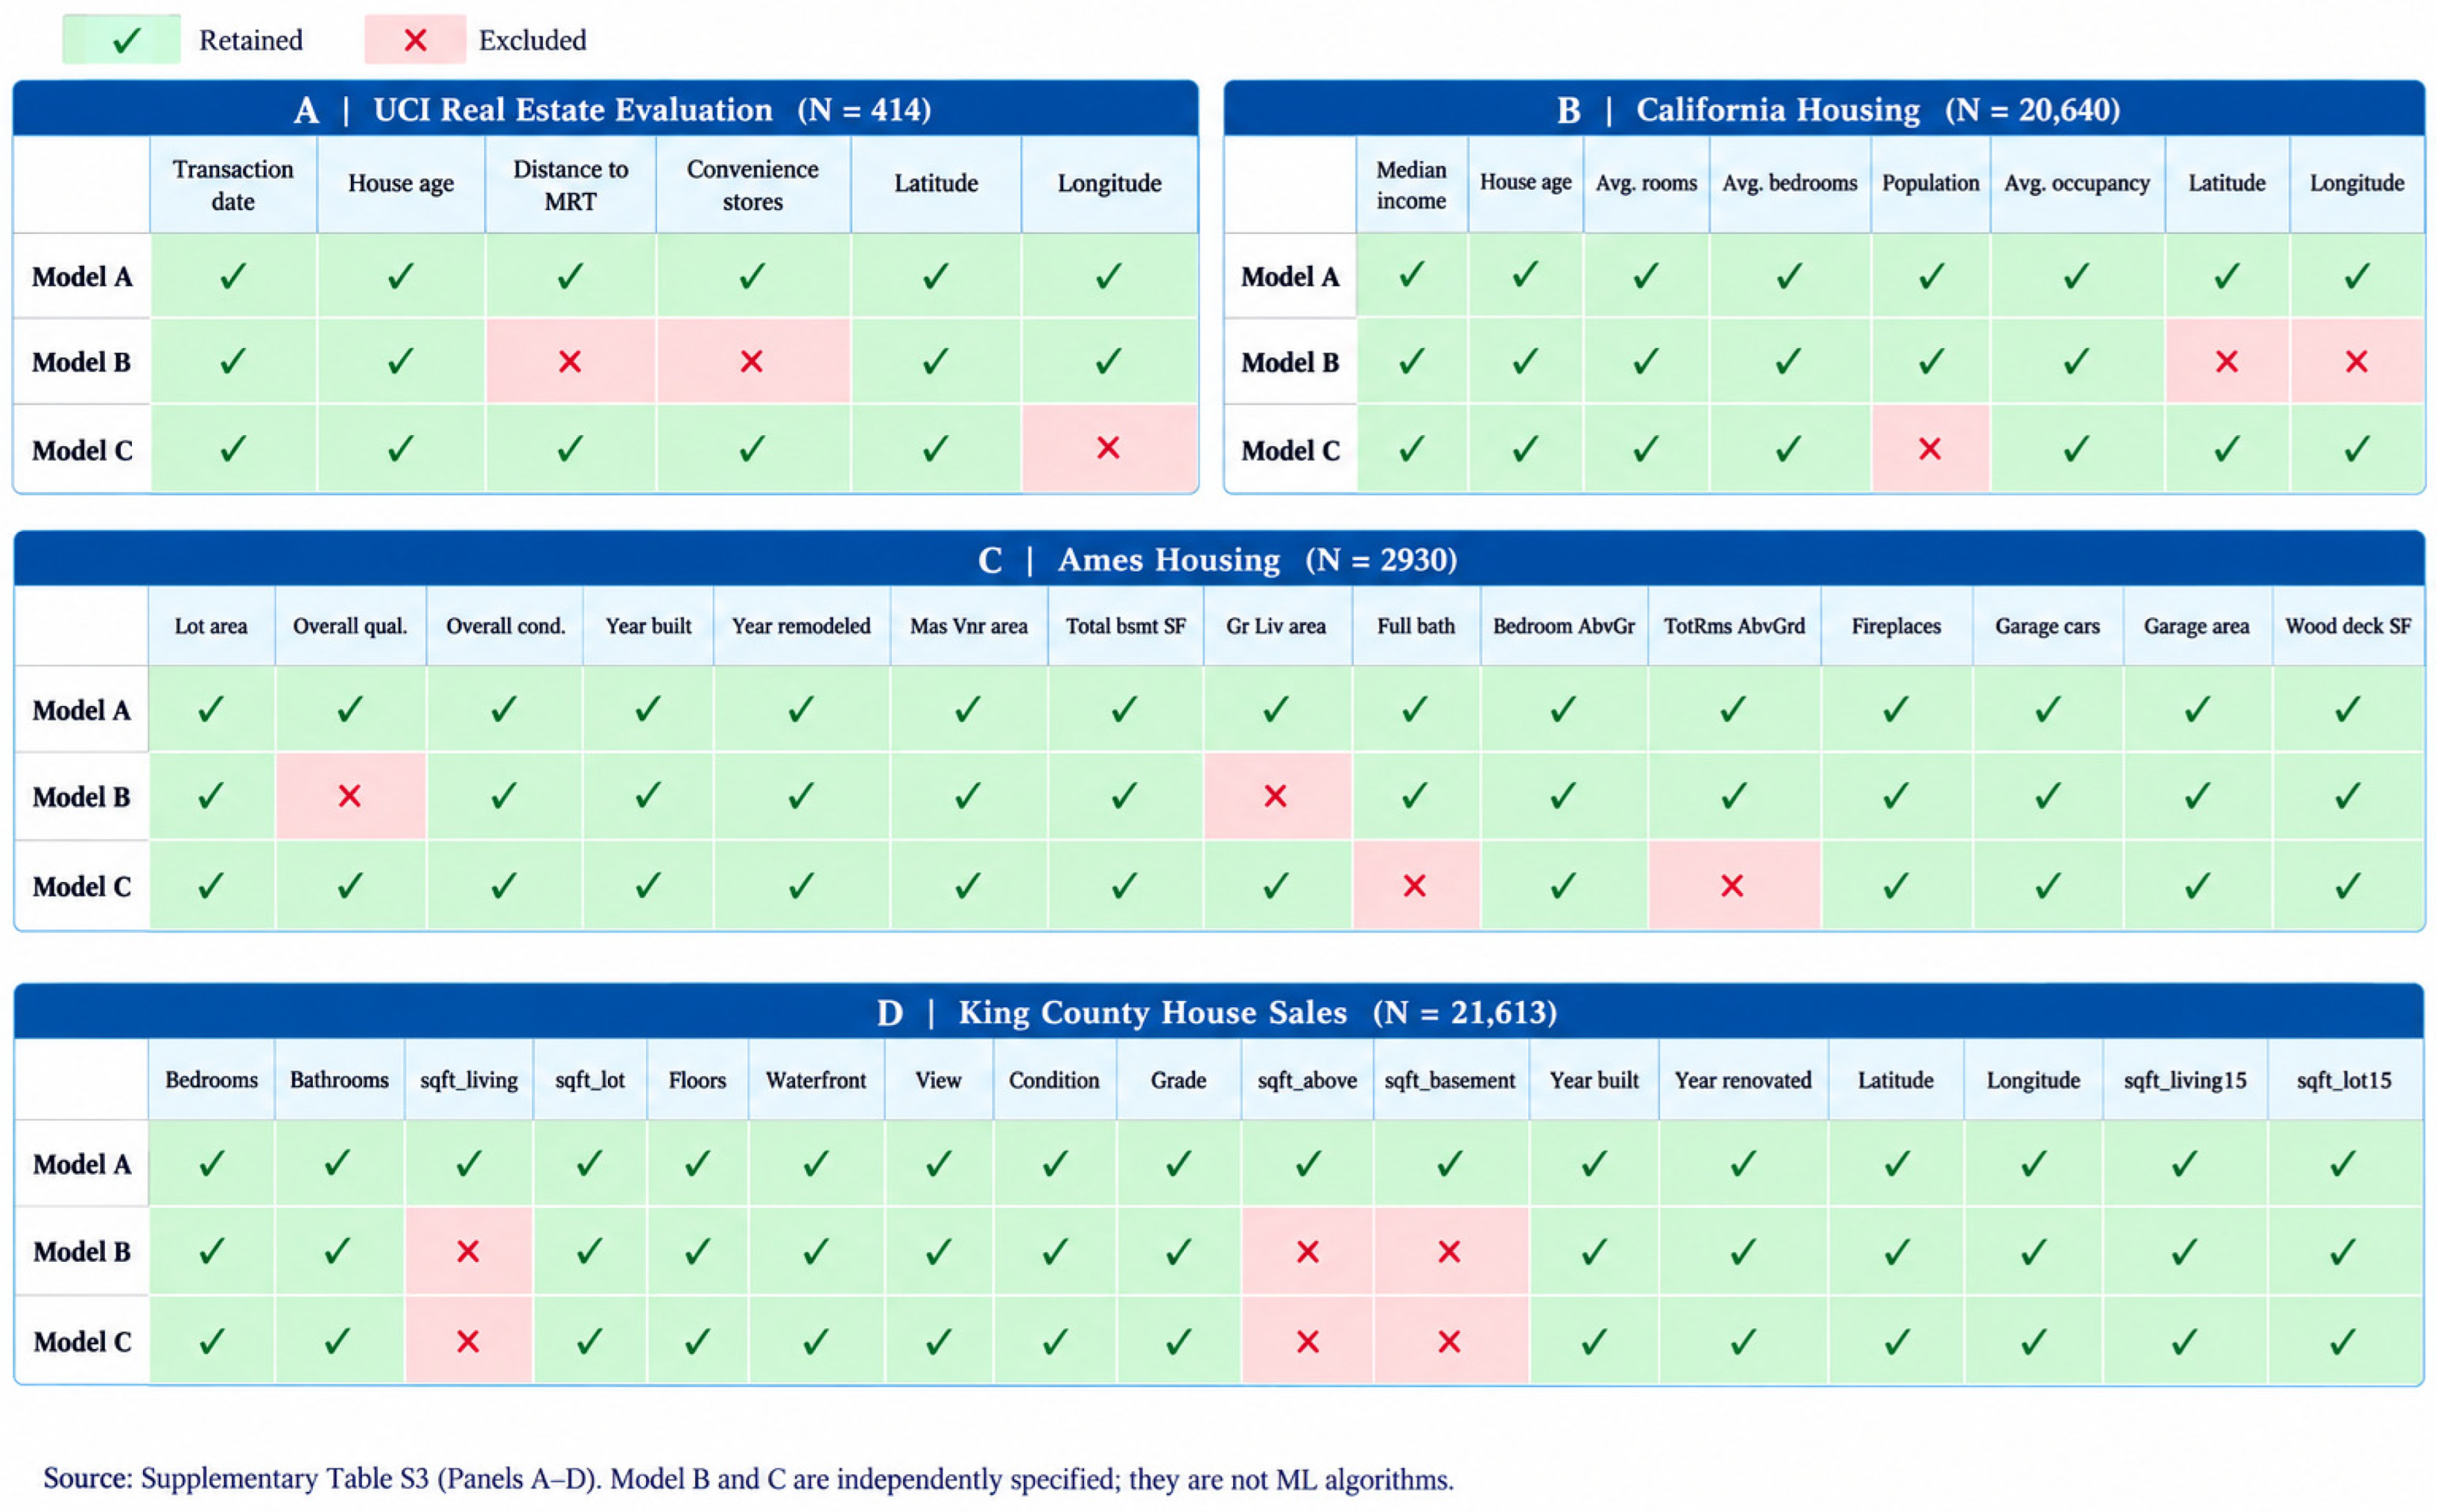
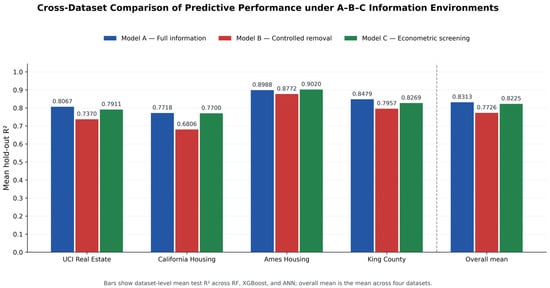
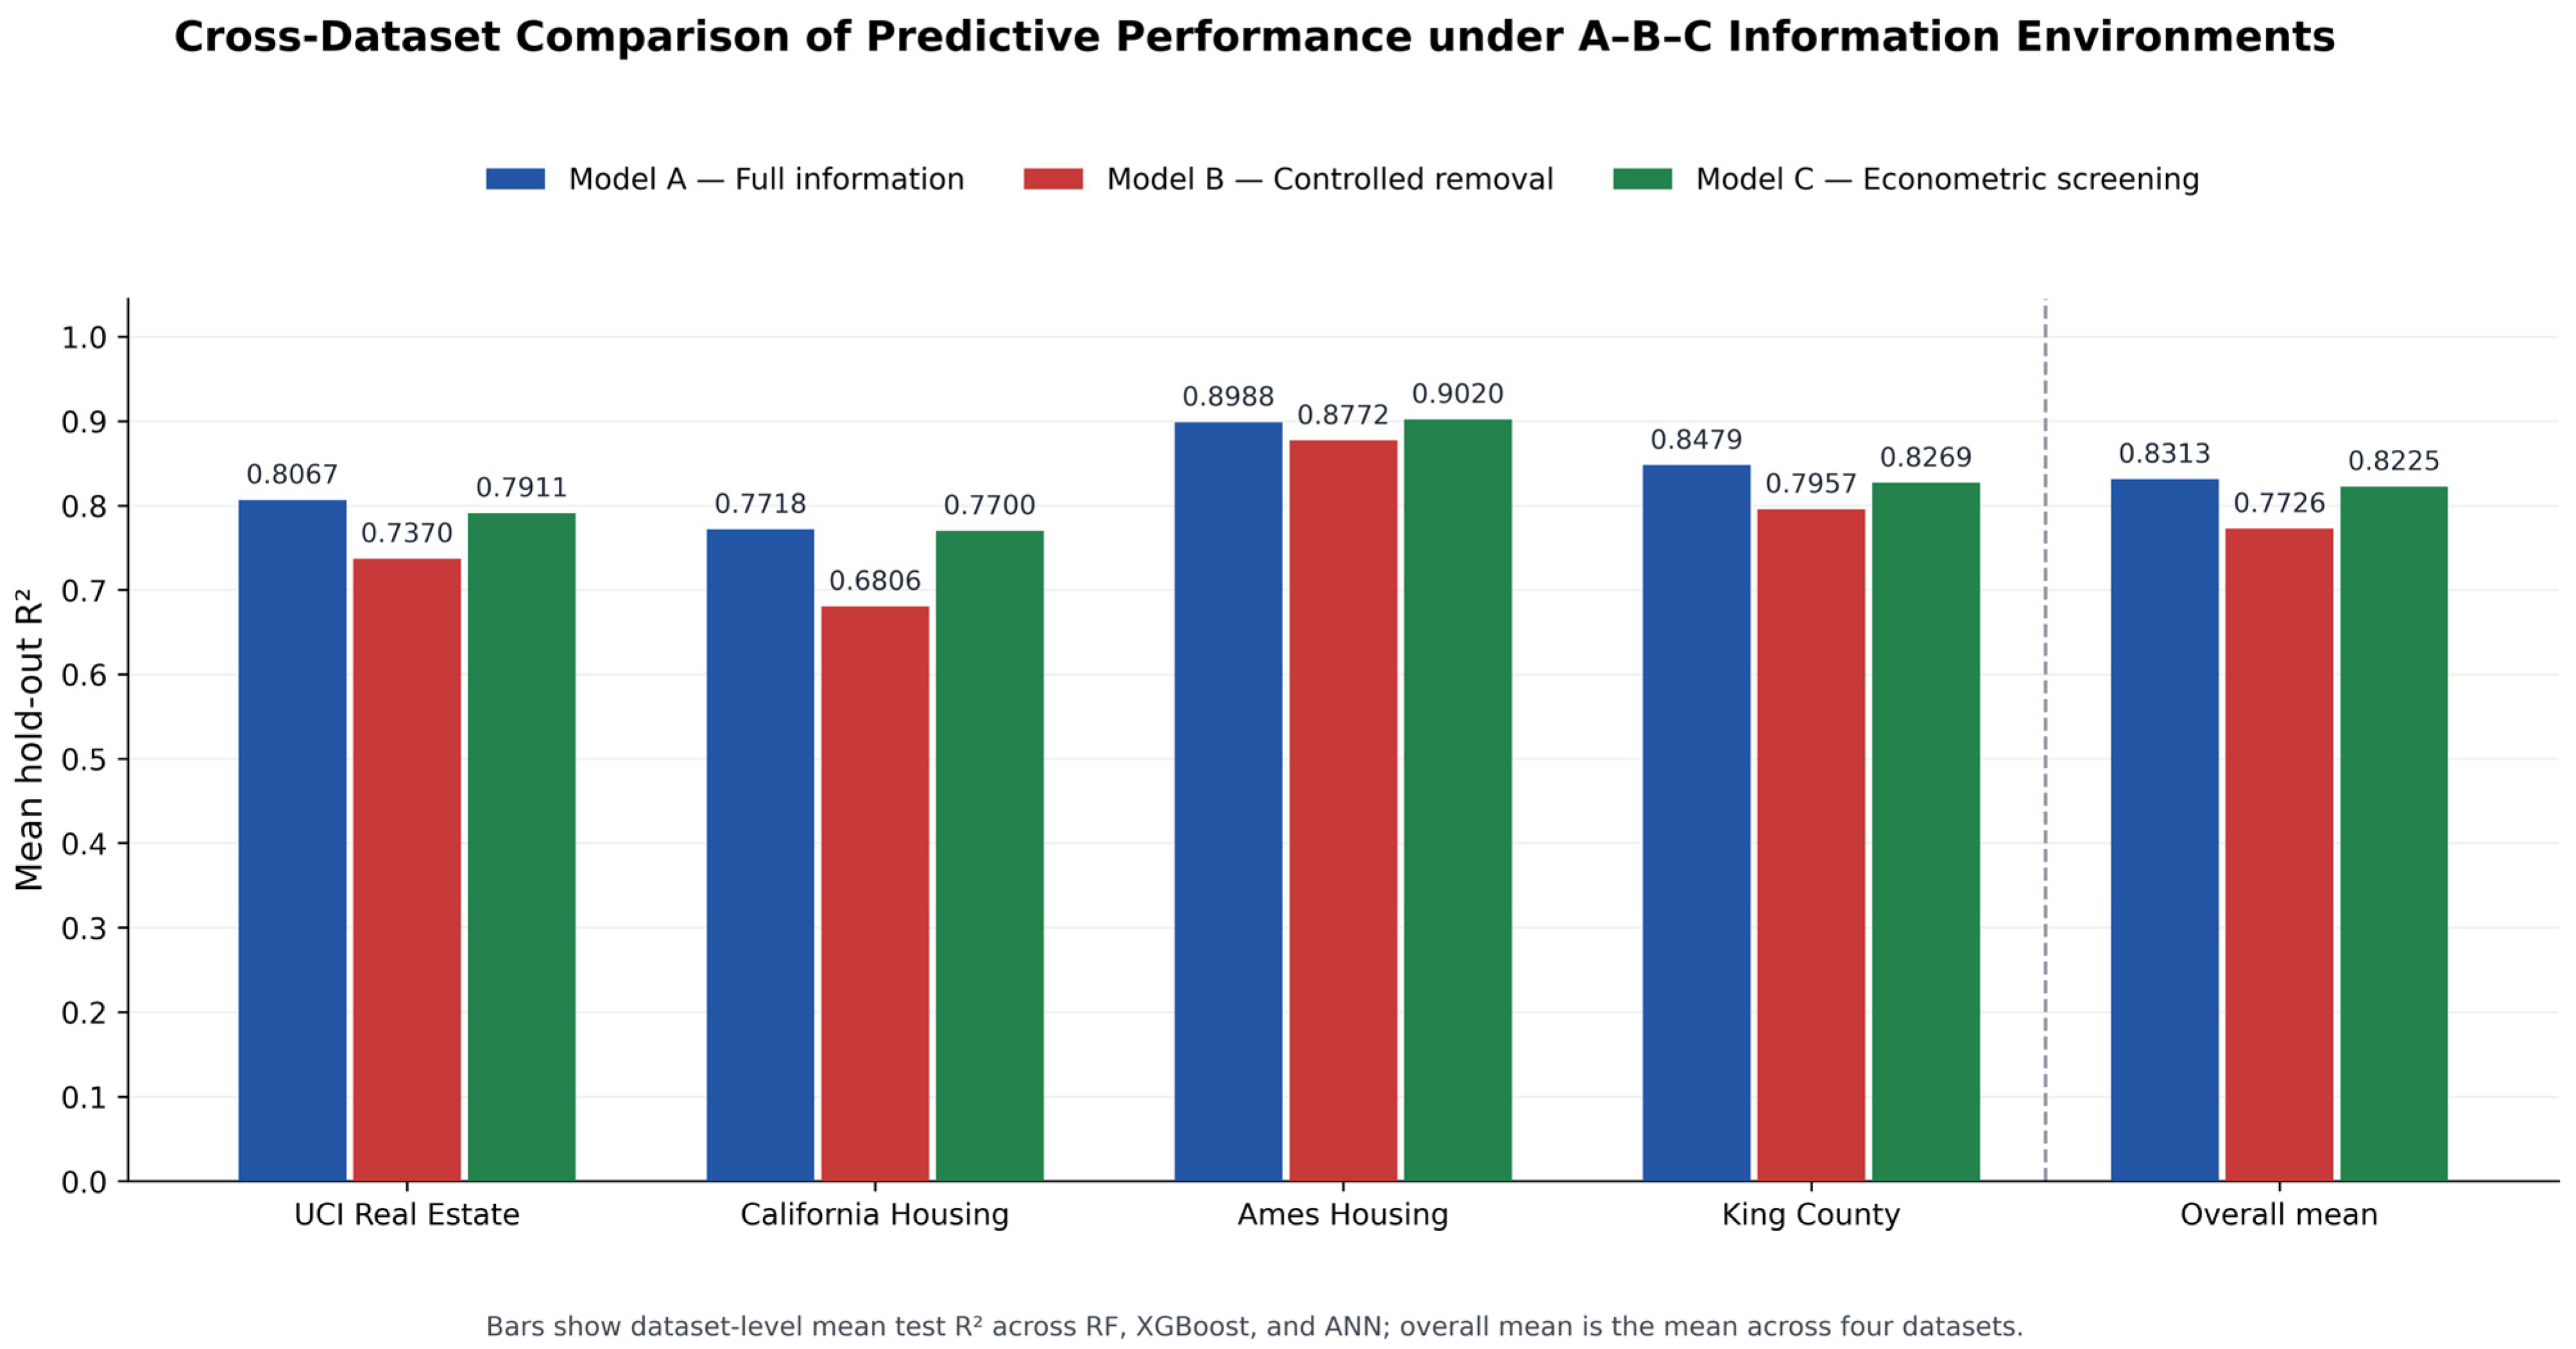

Disclaimer/Publisher’s Note: The statements, opinions and data contained in all publications are solely those of the individual author(s) and contributor(s) and not of MDPI and/or the editor(s). MDPI and/or the editor(s) disclaim responsibility for any injury to people or property resulting from any ideas, methods, instructions or products referred to in the content. |
© 2026 by the authors. Licensee MDPI, Basel, Switzerland. This article is an open access article distributed under the terms and conditions of the Creative Commons Attribution (CC BY) license.