


Abstract
Research on airport proximity has focused mainly on permanent residential markets, leaving its relationship with property values in resort-oriented markets less clear. This study examines 9841 resort-style property transactions in Mobile and Baldwin Counties, Alabama, from 1996 to 2023. We use hedonic pricing models, spatial econometric methods, and geographically weighted regression to assess market-wide and local relationships between airport proximity and resort property values. In the spatial error model with transaction-year fixed effects, each additional kilometer from the nearest airport corresponds to an approximately $10,791 increase in sale price. Properties linked to Primary Commercial airports have an estimated conditional value $97,698 higher than properties linked to General Aviation airports. The local analysis also shows significant spatial variation in how airport distance relates to property values. These findings align with the Amenity Separation Effect, which suggests that coastal property markets may value airport access and resort amenities differently. They also show the importance of accounting for spatial variation when evaluating transportation infrastructure in amenity-oriented locations.
1. Introduction
Airport proximity shapes real estate markets by improving accessibility while also contributing to noise and congestion. Researchers have extensively examined this trade-off in the residential sector [1,2,3], but few studies have focused on vacation resort properties, despite their growing economic significance. Unlike typical housing markets, resort-oriented markets may prioritize tranquility, scenic views, and recreational access over commuting convenience [4]. This primary distinction is essential to understanding how airport proximity affects property values.
Vacation resort properties differ from year-round housing in their ownership structures and buyer intentions. Buyers may value experiential and locational amenities more than commuting convenience. Because our data do not identify occupancy, second-home use, buyer addresses, or short-term rental activity, we define the study’s sample by geography and residential property type rather than claiming to observe every buyer’s motivation.
Understanding how proximity to airports affects resort values has direct implications for planning, investment, and tax policy. Regions such as Mobile and Baldwin Counties, which accounted for 41.2% of Alabama’s 2023 $23.5 billion in tourism-related economic impact [5] and rely on tourism, are especially vulnerable to changes in visitor demand. Seasonal fluctuations make it even more important to identify airport-related effects accurately to guide strategic planning and investment [6]. Sustainable development in resort regions depends on protecting the amenities that initially attract visitors. This makes airport proximity a critical planning consideration, not merely an academic concern [7]. However, no hedonic study has examined vacation resort properties in a coastal tourism market using airport-specific disaggregation and local spatial estimation.
We use a hedonic price model (HPM), an adaptive-bandwidth geographically weighted regression (GWR), and conventional global spatial models to analyze property sales from 1996 to 2023. This study makes four important contributions to the literature. First, it estimates the association between airport proximity and property values in a coastal, resort-oriented market. Second, it distinguishes market-wide spatial dependence from local spatial heterogeneity. Third, it introduces the Amenity Separation Effect to interpret the trade-off between airport accessibility and disamenity in locations where the valued amenity and transportation hub are spatially separated. Fourth, it identifies implications for valuation research and coastal planning while recognizing that the observed relationships are associational.
2. Literature Review
Research on airport proximity consistently finds that nearby homes sell for less. Nelson’s survey [3] provided foundational evidence. McMillen [2] estimated that properties near Chicago O’Hare International Airport lost 9% of their value. Jud and Winkler [8] found a 9% decline after airport expansion announcements. Nelson’s meta-analysis [9] estimated a typical noise-related discount of 0.5% to 0.6% per decibel. Studies in other cities support this pattern. Chalermpong [10] documented comparable discounts near Bangkok’s Suvarnabhumi Airport, while Trojanek et al. [11] found similar effects in Poznan, Poland. Ozdenerol et al. [12] linked road traffic and aircraft noise to lower housing values in Memphis. Espey and Lopez [13] further found that the discount grows with proximity to the airport rather than applying uniformly within a fixed airport-influence radius.
The relationship is not uniformly negative. Cohen and Coughlin [1,14,15] document cases in which accessibility improvements offset the costs of disamenities. Lipscomb [16] finds that proximity to Atlanta’s Hartsfield International Airport increases nearby property values, suggesting that accessibility benefits can outweigh noise costs in markets with strong economic ties to air travel. Brueckner [17] extends this reasoning beyond housing, showing that increased airline traffic stimulates broader urban economic development. This development can benefit local property markets even when noise disamenities are present. Thanos et al. [18] complicate this picture by showing that the relationship between noise and property prices is nonlinear and that stigma effects can persist even after noise levels decline.
Boes and Nüesch [19] use a natural experiment surrounding a runway closure to show that noise effects are causal, not merely correlational, addressing a common concern in cross-sectional hedonic studies. In nonurban areas, accessibility benefits may outweigh disamenity costs for permanent residents and increase property prices, contrary to the expected negative effect of proximity [20,21]. Resort-oriented markets may place different weights on tranquility, scenery, and recreational access, although the present data do not capture buyers’ motivations or noise exposure. These competing mechanisms motivate an associational analysis that allows airport distance capitalization to vary across space.
2.1. Hedonic Studies of Vacation and Resort Properties
A smaller body of research applies hedonic methods directly to vacation and resort real estate, consistently finding that location-specific amenities shape property prices. Spahr and Sunderman [22] show that proximity to a resort community itself raises prices for nearby properties, suggesting that resort amenities extend their value outward, much like an urban center benefits its suburbs. Wassmer [23] confirms that proximity to short-term vacation rentals affects prices in resort communities, independently of a home’s structural characteristics. Research on airport proximity and single-family housing also demonstrates how spatial econometrics can detect geographically uneven capitalization [24,25]. Together, these findings underscore the importance of location in vacation-property valuation.
Research in hospitality supports this pattern beyond property sales markets. Yang et al. [26] find that guests assess hotel location attributes in ways similar to buyers evaluating resort properties. Galeote and Mestanza [27] show that tourists and residents living near Málaga’s airport perceive its proximity differently. Their findings underscore that the value of airport proximity depends on the evaluator. This study extends that literature by examining airport distance as a potentially heterogeneous location attribute in a coastal, resort-oriented property market and by distinguishing distance from airport category. This distinction offers a clearer account of how location shapes property value.
2.2. General Aviation as a Distinct Externality Class
Researchers commonly believe that airport externalities increase with operational volume [9] and often regard general aviation airports as minor sources of these effects. However, general aviation and primary commercial airports may differ in operating patterns, aircraft mix, regulatory treatment, and surrounding land use [28]. These differences may lead to distinct associations with property values, although this study does not measure flight frequency, flight paths, aircraft noise, or mitigation activity. Spatially disaggregated hedonic methods can identify variation around individual airfields [24,25], but researchers should interpret local estimates only where the data provide adequate support.
3. Theoretical Framework
3.1. Hedonic Pricing Model and GWR
Our analysis uses the Hedonic Pricing Model (HPM) to decompose property values into key attributes, including proximity to airports, environmental quality, recreational amenities, and structural characteristics. Lancaster [29] developed the model in 1966, and Rosen [30] expanded it in 1974. The HPM suits resort properties because it accounts for both tangible and intangible factors that influence value. We use geographically weighted regression (GWR) as a complementary tool to capture local variations that the global model cannot account for, because airport impacts vary by location. Global spatial models and GWR serve complementary purposes. Global models address market-wide spatial dependence, while GWR estimates how associations vary across space without requiring analysts to prespecify their spatial form [31,32].
3.2. The Amenity Separation Effect
McMillen [33] predicts that rents rise near a transportation hub because it serves as a destination and creates value. Buyers express this value through their willingness to pay for greater proximity to the transportation hub. Resort markets, however, operate differently. In these markets, valued amenities include the shoreline, beach, harbor, boardwalk, golf course, vista, and even the most remote wilderness. Airports provide accessibility but do not necessarily constitute the valued destination. In these markets, the valued amenity and the infrastructure that provides access to it need not occupy the same location. We call this the Amenity Separation Effect. It provides an economic interpretation in which localized airport-related disamenities may outweigh accessibility benefits in some amenity-oriented locations. This framework predicts spatially heterogeneous capitalization rather than a universal discount. It also does not assume that researchers directly observe buyer motivation or a specific noise mechanism.
3.3. Endogeneity
Hedonic price models may suffer from a specific bias that property values may influence airport investment decisions just as airport proximity may affect property values [34,35]. For example, cities may build or expand airports near high-value areas that are already growing, rather than airport development causing that growth. Observed structural and locational controls, transaction-year fixed effects, and spatial econometric models account for measured market cycles and spatial structure but do not eliminate bias from unobserved variables or establish causal identification.
This examination addresses two empirical questions. First, does the capitalization of distance to the nearest airport vary spatially across the resort-oriented coastal market? Second, do conditional property values differ between properties associated with General Aviation airports versus those associated with Primary Commercial airports?
Hypothesis 1.
The capitalization of distance to the nearest airport varies spatially across the resort-oriented coastal market.
We test Hypothesis 1 primarily using the formal GWR Monte Carlo test for nonstationarity and Multiple-Testing-Corrected Local Inference for the airport-distance coefficient. Evidence of spatial variation does not mean that the coefficient has the same sign throughout the market.
Hypothesis 2.
Conditional property values differ between properties associated with General Aviation airports and properties associated with Primary Commercial airports.
Prior research suggests that accessibility and disamenity may be capitalized differently near General Aviation and Primary Commercial airports [20,21]. Hypothesis 2 therefore assesses a market-wide difference between these airport categories rather than relying on unstable absolute local category coefficients.
We test Hypothesis 2 using the Primary Commercial-minus-General Aviation contrast, with General Aviation as the reference. Because magnitude and precision vary across spatial specifications and airport-category overlap remains limited, we interpret the evidence cautiously, not as a universal category effect.
4. Methodology
4.1. Study Area, Airport Classification, and Sales Transaction Data
Our study area covers Mobile and Baldwin Counties on Alabama’s coast and includes nine airports (Table 1). The source geographic data classify airport roles as General Aviation or Primary Commercial. The analytical sample includes 9606 transactions associated with General Aviation airports and 235 associated with Primary Commercial airports. All 8865 observations from Baldwin County involve General Aviation airports, while Mobile County has 741 General Aviation observations and 235 Primary Commercial observations. This imbalance limits county-specific estimation of airport-category effects and motivates estimating a global category contrast.
Table 1.
Federal Aviation Administration airport classifications and study area airports.
We obtain transaction data from the Mobile and Baldwin County Tax Assessor offices. We focus on small, residential-style resort properties, including condominiums, vacation homes, townhomes, and villas, within the study’s resort-oriented geographic classification. This classification does not verify occupancy or second-home use. Waterfront access drives property values throughout this Gulf of Mexico coastal corridor, so isolating airport effects from beach effects is essential for credible estimates. The source file contains 51,826 rows. After classifying properties, addressing missing data, and restricting square footage, construction year, sale year, bedrooms, and CPI-adjusted price, we retain 9841 transactions in the final analytical sample (Appendix A Table A1). The sample covers 1996–2023 and includes observations through 27 February 2023. We apply the $2500–$1,000,000 price screen in 2023 dollars [36]. We do not exclude deed types, family transfers, foreclosures, or other non-arm’s-length sales. We report annual counts by county and airport category (Appendix A Table A2).
4.2. Variable Specification
The dependent variable is the inflation-adjusted sale price (Table 2). The model includes airport proximity in two forms. Distance to Airport measures the Euclidean distance, in kilometers, to the nearest airport of any category. In the identified global models, General Aviation serves as the reference category. The Primary Commercial indicator estimates the conditional difference between observations near Primary Commercial airports and those near General Aviation airports. We do not interpret the intercept as a causal effect of General Aviation. Because noise contour data are unavailable, we cannot distinguish the effects of noise exposure from those of accessibility. The data treat the nearest-airport category as time-invariant.
Table 2.
Resort property characteristics.
Control variables include distance to the nearest beach and distance to the nearest airport, measured in kilometers. The common specification also includes distances to the nearest park and school; square footage, year built, number of bedrooms, and number of bathrooms; and indicators for a general hospital, top-1% and top-10% schools, and a transportation hub. The main OLS and SEM include transaction-year fixed effects from 1996 to 2023. We report the full-control, log-price, and Mobile-only specifications as additional robustness analyses (Appendix A Table A3). We exclude price per square foot because it changes the estimate and mechanically incorporates square footage, which the model already includes as a hedonic characteristic.
4.3. Data Preparation
We address missing values in beds, baths, year built, and square footage using Multiple Imputation by Chained Equations [37,38,39]. We chose this method over listwise deletion because removing incomplete records could introduce systematic bias if missingness correlates with property vintage or transaction era. We did not impute airport distance or categorical values. We use predictive mean matching with m = 5, maxit = 10, and seed = 285. Before imputation, missingness rates were 8.20% for square footage, 10.78% for year built, 58.30% for bedrooms, and 74.78% for bathrooms. We include a sequential row identifier as a predictor, and the procedure recorded no events. We use completed dataset 1, rather than Rubin-pooled estimates, in all analyses. During research and revision, ChatGPT (GPT-5.6 Sol) and Codex (GPT-5.6 Sol, high reasoning effort) assisted with scientific and editorial review, interpretation and manuscript revision, reviewer-response drafting, code execution and review, reproducibility auditing, and document processing. The authors reviewed and validated the resulting outputs.
4.4. Geographically Weighted Regression
GWR extends the global hedonic model by allowing coefficients to vary by location [31,32]. We estimate Equation (1):
where coefficients βk(ui,vi) are estimated at each location (ui,vi) using a proximity-based kernel. Coordinates are transformed from EPSG:4326 to WGS84/UTM Zone 16N (EPSG:32616). The 3 km neighbor rule leaves 9821 observations after 20 isolates are removed. GWR uses planar Euclidean distances, a Gaussian adaptive kernel, and a cross-validation-selected bandwidth of 1340 nearest neighbors. A 99-permutation Monte Carlo test evaluates coefficient nonstationarity, and the Fotheringham–Byrne procedure controls multiple testing for the local airport-distance coefficient. Post-GWR residual spatial dependence is assessed with the same row-standardized 3 km weights. Local collinearity diagnostics limit substantive local interpretation to the stable airport-distance surface and Local R2 [40,41].
yi = β0(ui,vi) + Σk βk(ui,vi)xik + ϵi
4.5. Spatial Econometric Models
The global analysis estimates an ordinary least squares model (OLS) and a spatial error model (SEM) with transaction-year fixed effects. Spatial dependence is defined by neighbors within 3 km and a row-standardized weights matrix. The SEM serves as the primary global spatial benchmark because diagnostics favor error dependence and its residuals show no detectable spatial autocorrelation. For comparison, common no-year OLS, spatial lag (SAR), SEM, and spatial Durbin models (SDMs) use the same 9821 observations and identified covariates. SAR and SDM results are presented as direct, indirect, and total impacts; SDM is interpreted as a broader spillover specification and has the best information criteria among these common models.
5. Results
5.1. Global Models and the Case for Local Estimation
Our OLS estimation shows that our structural variables behave as expected (Table 3). With transaction-year fixed effects, the OLS airport-distance coefficient is $1141 per kilometer (p = 0.034; HC3 p = 0.026), while residuals remain spatially autocorrelated (Moran’s I = 0.1074, p < 0.001). The SEM estimates $10,791 per kilometer farther from the nearest airport (p < 0.001) and a $97,698 Primary Commercial-minus-General Aviation contrast (p = 0.033), with λ = 0.8997 (p < 0.001). SEM residual Moran’s I is −0.0005 (p = 0.767). These are conditional associations. The case for local estimation rests on the formal evidence of coefficient nonstationarity reported below, not on the significance of one global coefficient.
Table 3.
Global hedonic models with transaction-year fixed effects.
5.2. GWR Coefficient Distribution
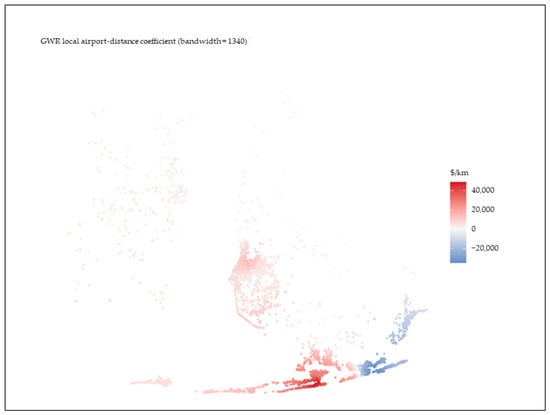
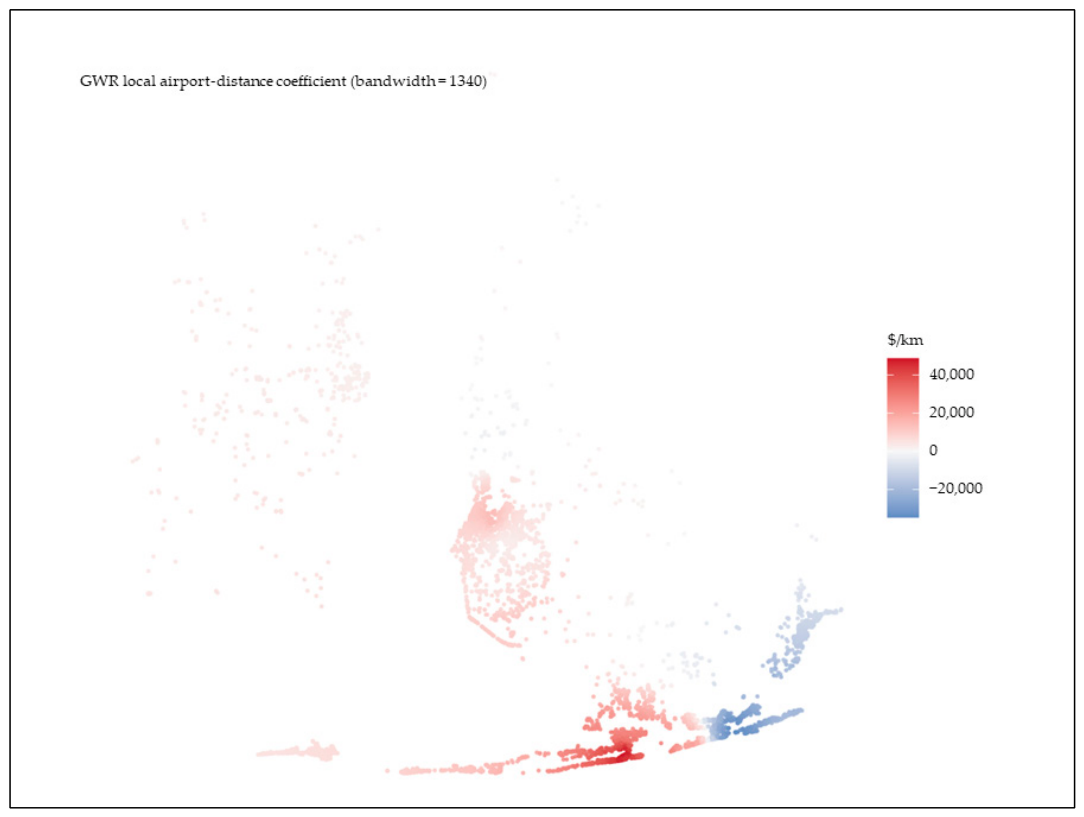
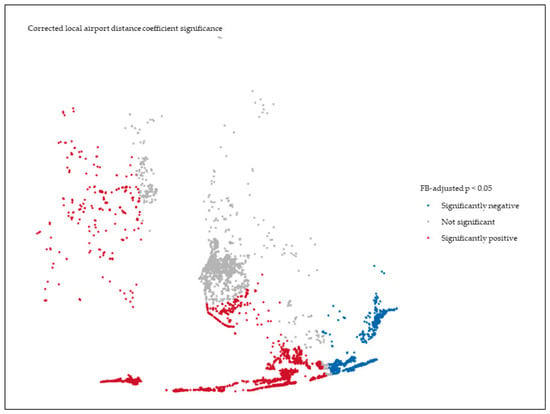
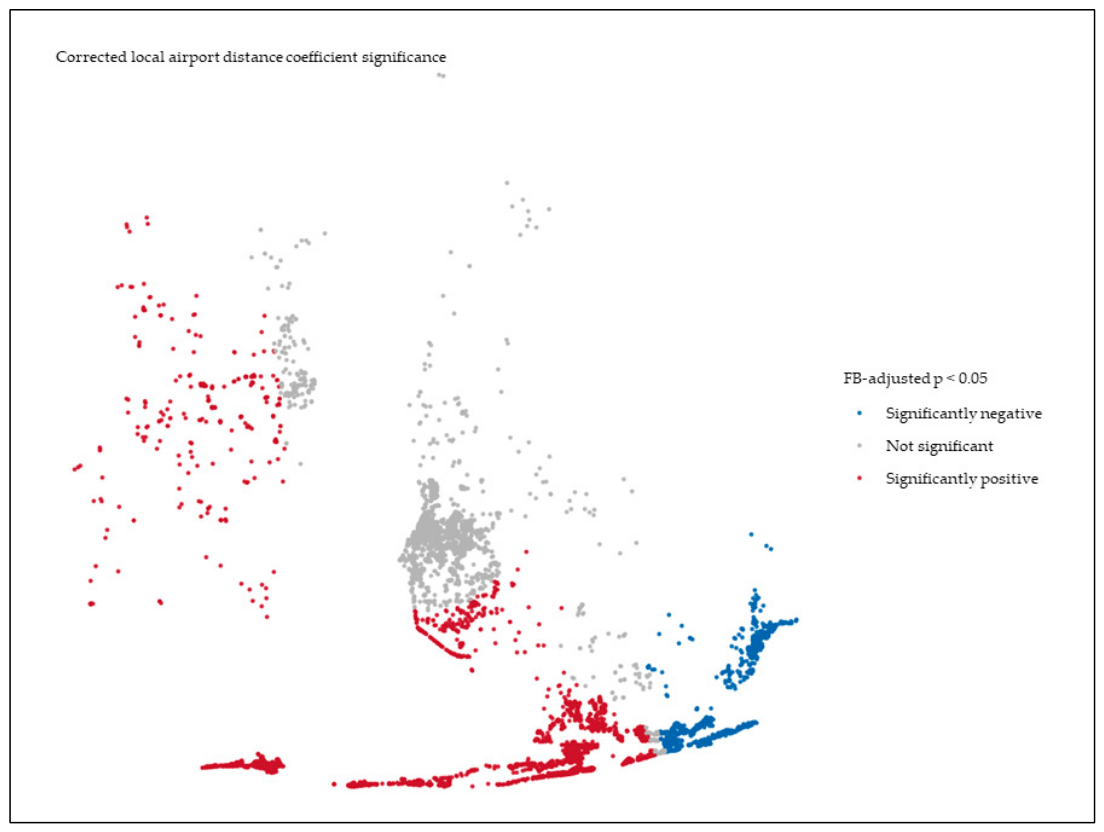
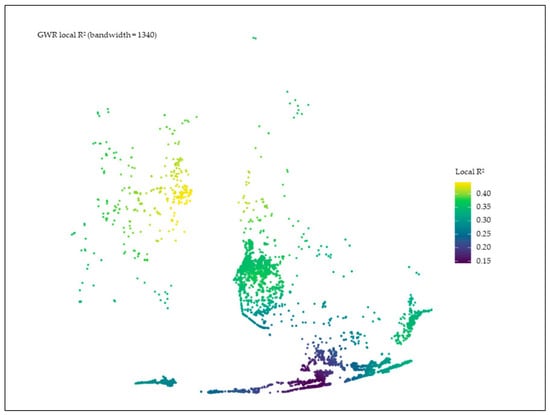
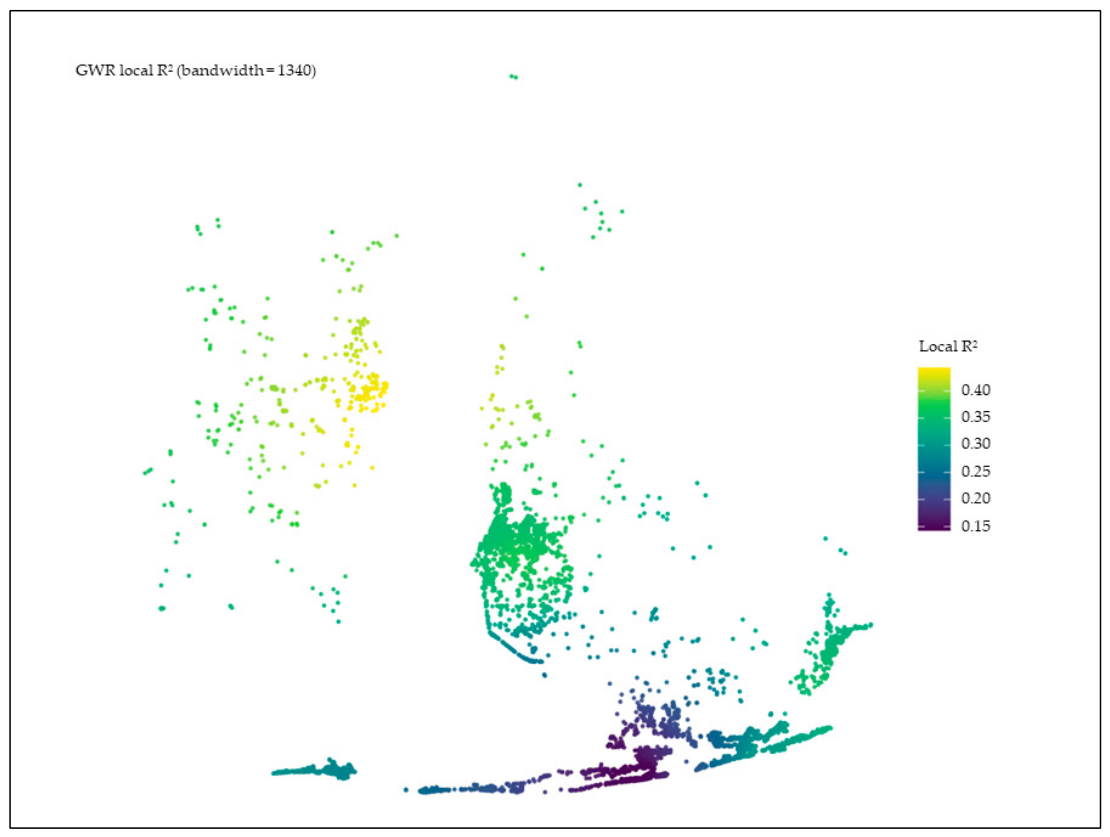
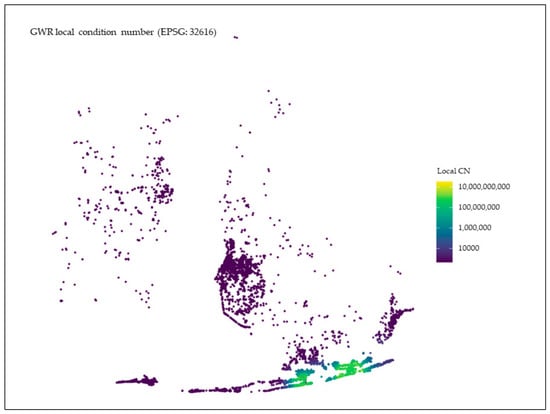
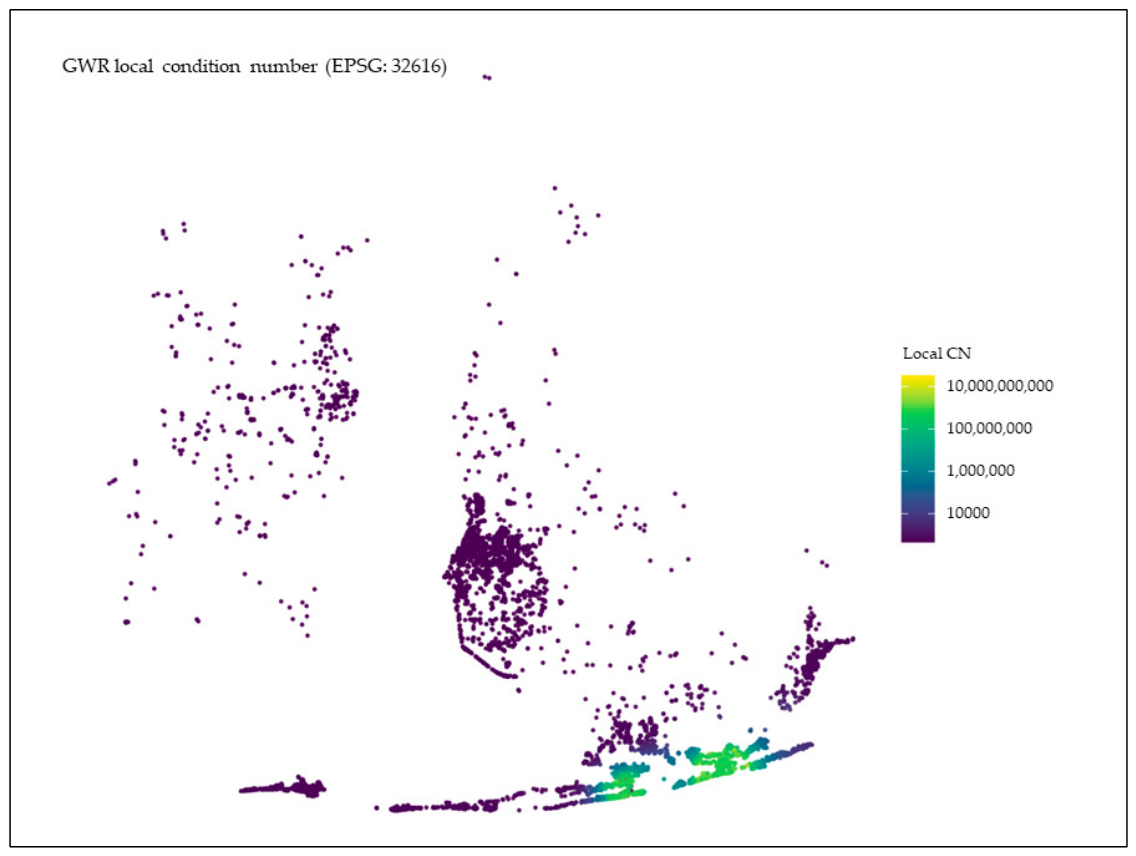
Our geographically weighted regression (GWR) analysis estimates a coefficient matrix from 9821 local regressions after excluding 20 observations without neighbors under the 3-km rule (Table 4). Using the cross-validation bandwidth of 1340, GWR produces an AIC of 262,163.0486, an AICc of 262,214.0067, 60.9083 effective parameters, and an adjusted R2 of 0.3111. The airport-distance coefficient varies from −$34,687 to $48,705 per kilometer, with a median of $8085. Positive local coefficient values dominate the sample, while negative values concentrate in a southeastern coastal cluster (Figure 1). A Monte Carlo test indicates spatial variation in this coefficient (p < 0.01). After applying the Fotheringham–Byrne correction, 51.20% of local estimates are significantly positive, 19.82% are significantly negative, and 28.98% are not statistically significant. Mapping the corrected significance classes illustrates that significantly negative estimates cluster in the southeast, significantly positive estimates appear across the west and south, and non-significant estimates concentrate in the center of the study area (Figure 2). Local R2 values range from 0.143 to 0.443. Local explanatory power is highest in the northwestern part of the study area and lowest along portions of the southern coastal strip (Figure 3). The post-GWR residual Moran’s I equals 0.0286 (p < 0.001), and every local condition number exceeds 100. The most severe local collinearity is confined to a small southern coastal area, where condition numbers are orders of magnitude higher than elsewhere (Figure 4). These results indicate that residual spatial autocorrelation remains and that local coefficient estimates may be unstable. We therefore interpret the airport-distance surface and Local R2 as spatial patterns, but we do not treat unstable local categorical coefficients as economic evidence. This distinction keeps the interpretation aligned with the diagnostics and avoids overstating what the local estimates can establish.
Table 4.
GWR airport-distance heterogeneity and diagnostics.
Figure 1.
Local GWR airport distance coefficient.
Figure 2.
Fotheringham Byrne corrected local significance for the airport distance coefficient.
Figure 3.
GWR Local R2.
Figure 4.
Local condition number for the GWR design.
5.3. Hypothesis Tests and Spatial Model Comparison
We compare OLS, SAR, SEM, and SDM under a common no-year specification (Table 5). SEM and SDM eliminate detectable residual spatial autocorrelation, while SAR retains a small residual signal. SDM achieves the highest log-likelihood and the lowest AIC and BIC. It also captures a broader mechanism, with covariate changes producing effects at both their own locations and spillover locations. These models provide complementary evidence, not a universal ranking across substantive questions.
Table 5.
Spatial model comparison and focal airport effects. (A). Common No-Year Spatial Sensitivity Comparison; (B). Focal Airport Results.
Evidence for Hypothesis 1 comes from the formal GWR nonstationarity test for airport distance (p < 0.01) and corrected local estimates that vary in sign and statistical significance. These findings indicate that the estimated relationship between airport distance and the outcome differs across locations. The market-wide effect also varies across models. In the common comparison, OLS and SAR estimates are close to zero and statistically uncertain. SEM estimates a positive effect of $8941 per kilometer (p < 0.001). By contrast, SDM estimates a positive direct impact of $33,136 (p < 0.001) and a negative indirect impact of −$36,883 (p < 0.001). These impacts combine to produce a negative total impact of −$3746, which is not statistically significant (p = 0.088). Taken together, the results support spatial variation in the airport-distance relationship, rather than a single, universal effect across the market. They therefore do not establish a consistent market-wide direction or magnitude for this relationship.
Evidence for Hypothesis 2 varies across model specifications. The Primary Commercial-minus-General Aviation contrast is positive in the OLS, SAR, and SEM, whereas the SDM estimates a total impact of −$10,076 (p = 0.862), indicating substantial uncertainty. Reversing the contrast to General Aviation-minus-Primary Commercial changes only the sign and preserves the same uncertainty. Baldwin County has no Primary Commercial observations, so the comparison depends heavily on overlap with Mobile County. We do not interpret absolute local GWR airport-category coefficients or use the previous Wilcoxon comparison to evaluate either hypothesis.
5.4. Robustness Analyses
Transaction-year fixed effects substantially improve OLS and SEM fit, while the main SEM estimates remain broadly similar. In the full-control SEM with year fixed effects, the estimated effect of airport distance remains positive ($9994 per km, p < 0.001), while the Primary Commercial versus General Aviation contrast is less precise ($81,927, p = 0.142). In log-price models with year fixed effects, SEM estimates positive associations for airport distance (+1.668% per km, p = 0.048) and category (+50.05%, p = 0.037), whereas OLS estimates a negative airport-distance semi-elasticity. Within Mobile County, where both categories occur, the year-fixed-effects SEM estimates a category contrast of $103,229 (p = 0.002). The parcel identifier equals the placeholder value zero for 8487 observations, so it cannot support reliable property-level clustering or repeat-sales claims.
6. Discussion
6.1. Airport Proximity in Resort-Oriented Markets
The relationship between airport distance and price does not follow a single, universal discount. The beach emerges as a major amenity. In this setting, the year-fixed-effects SEM and the central GWR distribution indicate higher conditional prices farther from airports. However, the SDM separates the relationship into opposing direct and indirect effects, while log-OLS reverses the sign. Resort transactions cluster in a coastal market where airport access and environmental amenities coexist over relatively short distances. These findings suggest that locations and model structures shape how the market capitalizes airport proximity, rather than revealing a single, market-wide noise penalty.
6.2. The Amenity Separation Effect and the Residential Comparison
Residential literature shows that permanent nonurban residents may view proximity to an airport as an advantage when transportation options are limited [20,21]. The Amenity Separation Effect offers a different explanation for resort-oriented markets. When an amenity and a transportation hub are located apart, localized airport-related disadvantages may outweigh the benefits of access. The observed spatial variation aligns with this trade-off. The difference between residential property expectations around nonurban general aviation airports and the findings for resort properties forms our primary theoretical contribution. We did not measure buyer motivations, preferences for tranquility, aircraft noise, or flight paths, so this explanation remains a plausible economic mechanism rather than a causal finding.
6.3. Differences by Airport Type
The identified airport-type comparison contrasts Primary Commercial airports with General Aviation airports. Positive associations in the OLS, SAR, SEM, log-price models, and Mobile-only analysis suggest differences between these categories. However, the SDM total impact is near zero and statistically insignificant, while the full-control SEM estimate is imprecise. Baldwin County has no Primary Commercial observations, so the comparison also reflects limited geographic overlap. Aviation traffic patterns may help explain these results. Differences in aircraft mix, operating times, regulation, and noise mitigation could matter, but the analysis does not observe these factors. Direct operational and exposure data are needed to assess these possible channels. The evidence does not establish that General Aviation universally produces a larger discount.
6.4. Global and Local Spatial Patterns
The formal nonstationarity test and corrected local inference show that the association between airport distance and the outcome varies substantially across the study area. In some specifications, the market-wide estimate is near zero or imprecise, but this does not indicate that no spatial relationship exists, because a single estimate cannot capture location-specific differences. GWR complements the other approaches but is not uniquely preferred. Residual spatial dependence remains detectable, and severe local collinearity prevents an economic interpretation of the local categorical coefficients. SEM provides a parsimonious global benchmark, while SAR and SDM demonstrate sensitivity to alternative spatial processes. GWR describes the stable, continuous distance surface.
7. Policy and Practical Implications
7.1. Ad Valorem Assessment
Counties generally assess property through mass appraisal, using common valuation models. When assessors apply uniform valuations, they may overlook spatially varying relationships near airports. According to the International Association of Assessing Officers [42], this concern involves not accuracy but the uniformity that the profession currently expects. Researchers should not apply these local estimates directly as parcel-level tax adjustments. Instead, the findings support future assessment-ratio studies that combine local validation with direct noise, flight-track, and repeated-sale data to better inform local assessment practices.
7.2. Appraisal Practice
Because an airport’s effect on resort property values varies by location, using a comparable sale from a more distant area may introduce a hidden pricing error. These findings suggest that future appraisal research should examine whether comparable sales from locations with substantially different airport exposure create systematic pricing differences. However, the reported GWR coefficients do not constitute validated appraisal adjustments. Researchers need independent samples, reliable parcel identifiers, and direct measures of airport exposure before practitioners can use location-specific adjustments [43].
7.3. Noise Compatibility Planning
Our research indicates that tourism-dependent areas should give general aviation airports similar attention. The varied associations point to priorities for collecting data on flight routes, altitude, frequency, operating hours, and measured noise. Researchers need this evidence before assessing routing or scheduling changes. The present study does not justify immediate operational recommendations.
7.4. Disclosure Policy
Pope [44] shows that mandatory noise disclosure changes how noise affects home prices. The present data do not capture buyers’ knowledge of existing noise levels or identify a causal effect of disclosure. Future research could examine whether measured exposure and disclosure affect resort-oriented transactions. However, these results do not support a disclosure mandate.
8. Limitations
Our study has several limitations. Because noise contours and flight-track data are unavailable for the general aviation facilities in our sample, we cannot separate the airport effect into noise and accessibility components. We also cannot determine which parcels lie directly beneath active flight paths and which are simply nearby. Unobserved features of resort properties, including floor level, water views, and on-site amenities, may explain much of the price variation that our model does not capture. These features may also correlate with airport proximity in ways we cannot measure. Methodologically, our cross-sectional design identifies associations rather than causal relationships. Our sample spans several distinct market periods, including the 2006 peak, post-hurricane recoveries, and the restructuring of short-term rentals after 2012. The main OLS and SEM include transaction-year fixed effects, but the common SAR/SEM/SDM comparison and GWR do not. The administrative data do not verify use status, and the upstream address-geocoding process lacks documentation. MICE uses a single completed dataset rather than Rubin-pooled inference. Placeholder values dominate the parcel identifier, so it cannot support property clustering or a reliable repeat-sales analysis. Airport categories are highly imbalanced, and Baldwin County has no Primary Commercial observations. Finally, significant residual spatial dependence remains after GWR, and local condition numbers are severe throughout the study area. We interpret only the airport-distance surface and R2 locally.
9. Conclusions
This study examines how proximity to airports affects vacation resort property values along Alabama’s coast. It applies hedonic pricing, geographically weighted regression, and global spatial models to 9841 property sales recorded from 1996 through 2023. In the year-fixed-effects SEM, each additional kilometer from the nearest airport corresponds to an estimated $10,791 increase in sale price. Properties associated with Primary Commercial airports have an estimated conditional value $97,698 higher than those associated with the General Aviation reference category. These market-wide estimates do not apply uniformly, as their magnitude and precision vary across spatial specifications and local market contexts.
The most consistent finding is that the capitalization of airport proximity varies across space. The Gaussian adaptive GWR uses a cross-validation bandwidth of 1340, and the Monte Carlo test confirms nonstationarity (p < 0.01). Corrected local inference identifies areas with positive, negative, and insignificant effects. The lack of a single uniform effect does not mean that proximity is irrelevant; rather, it shows that a market-wide coefficient cannot fully capture local differences. However, residual spatial dependence and local collinearity require caution when interpreting results for individual locations.
The Amenity Separation Effect remains the study’s central theoretical contribution. It provides an economic interpretation that values coastal amenities separately from airport accessibility. In some resort-oriented locations, airport-related disamenities may outweigh the benefits of access. Our findings suggest that resort-oriented property markets may require valuation frameworks distinct from those developed mainly for conventional residential markets. However, because our study does not observe buyer motivations or exposure channels, we note that the spatial evidence supports this mechanism without establishing it causally.
Our findings offer practical value to assessors, appraisers, airport sponsors, policymakers, and local planners. They point to a need for stronger local validation and data collection, not direct parcel adjustments, operational changes, or disclosure mandates. As tourism-dependent coastal regions balance airport access with the amenities that attract visitors and support local economies, future studies can strengthen valuation and policy by combining transaction records with reliable parcel histories, measured noise, flight paths, and property-use data.
Author Contributions
Conceptualization, J.E.E., J.R.C. and E.A.; methodology, J.E.E., E.A., S.R.S. and J.F.H.J.; software, J.E.E., E.A. and J.F.H.J.; formal analysis, J.E.E. and E.A.; data curation, J.E.E. and S.R.S.; writing—original draft, J.E.E. and J.R.C.; writing—review and editing, J.R.C.; supervision, J.R.C., E.A., S.R.S. and J.F.H.J. All authors have read and agreed to the published version of the manuscript.
Funding
This research received no external funding.
Data Availability Statement
The datasets presented in this article are not readily available because the data are part of an ongoing study. Requests to access the datasets should be directed to the corresponding author.
Acknowledgments
During the revision process, the authors used ChatGPT (GPT-5.6 Sol) and Codex (GPT-5.6 Sol, high reasoning effort) for scientific and editorial review, interpretation, and manuscript revision; reviewer-response drafting; code execution and review; reproducibility auditing; and document processing. The authors reviewed and validated all outputs, analyses, interpretations, manuscript changes, and reviewer responses and take full responsibility for the final content.
Conflicts of Interest
Author Julius E. Ekeroma is employed by the company Symlytic. The remaining authors declare that the research was conducted in the absence of any commercial or financial relationships that could be construed as a potential conflict of interest.
Appendix A. Additional Descriptive and Robustness Analyses
Table A1.
Sequential sample flow.
Table A2.
Final transactions by year, county, and nearest-airport category.
Table A3.
Focal robustness analyses.
References
- Cohen, J.P.; Coughlin, C.C. Spatial hedonic models of airport noise, proximity, and housing prices. J. Reg. Sci. 2008, 48, 859–878. [Google Scholar] [CrossRef] [Scilit]
- McMillen, D.P. Airport expansions and property values: The case of Chicago O’Hare Airport. J. Urban Econ. 2004, 55, 627–640. [Google Scholar] [CrossRef] [Scilit]
- Nelson, J.P. Airports and property values: A survey of recent evidence. J. Transp. Econ. Policy 1980, 14, 37–52. [Google Scholar] [CrossRef] [Scilit]
- Stringam, B.B. Timeshare and vacation ownership executives’ analysis of the industry and the future. J. Retail Leis. Prop. 2010, 9, 37–54. [Google Scholar] [CrossRef] [Scilit]
- Alabama Tourism Department. Alabama Tourism Economic Reports. 2023. Available online: https://tourism.alabama.gov/about-us/reports-hub (accessed on 23 June 2026).
- Ridderstaat, J.; Oduber, M.; Croes, R.; Nijkamp, P.; Martens, P. Impacts of seasonal patterns of climate on recurrent fluctuations in tourism demand: Evidence from Aruba. Tour. Manag. 2014, 41, 245–256. [Google Scholar] [CrossRef] [Scilit]
- Dreizis, Y.I.; Vidishcheva, E.V.; Kopyrin, A.S. The concept of resort regions (territories) sustainable development: Factors and indicators. In Advances in Natural, Human-Made, and Coupled Human-Natural Systems Research; Springer: Berlin/Heidelberg, Germany, 2023. [Google Scholar] [CrossRef] [Scilit]
- Jud, G.D.; Winkler, D.T. The announcement effect of an airport expansion on housing prices. J. Real Estate Finance Econ. 2006, 33, 91–103. [Google Scholar] [CrossRef] [Scilit]
- Nelson, J.P. Meta-analysis of airport noise and hedonic property values: Problems and prospects. J. Transp. Econ. Policy 2004, 38, 1–27. [Google Scholar] [CrossRef] [Scilit]
- Chalermpong, S. Impact of airport noise on property values: Case of Suvarnabhumi International Airport. Transp. Res. Rec. 2010, 2177, 8–16. [Google Scholar] [CrossRef] [Scilit]
- Trojanek, R.; Tanas, J.; Raslanas, S.; Banaitis, A. The impact of aircraft noise on housing prices in Poznan. Sustainability 2017, 9, 2088. [Google Scholar] [CrossRef] [Scilit]
- Ozdenerol, E.; Huang, Y.; Javadnejad, F.; Antipova, A. The impact of traffic noise on housing values. J. Real Estate Pract. Educ. 2015, 18, 35–54. [Google Scholar] [CrossRef] [Scilit]
- Espey, M.; Lopez, H. The impact of airport noise and proximity on residential property values. Growth Change 2000, 31, 408–419. [Google Scholar] [CrossRef] [Scilit]
- Affuso, E.; Caudill, S.B.; Mixon, F.G.; Starnes, K.W. Is airport proximity an amenity or disamenity? An empirical investigation based on house prices. Land Econ. 2019, 95, 391–408. [Google Scholar] [CrossRef] [Scilit]
- Florido-Benítez, L. The location of airports: An added value to improve the number of visitors at US museums. Case Stud. Transp. Policy 2023, 11, 100961. [Google Scholar] [CrossRef] [Scilit]
- Lipscomb, C. Small cities matter, too: The impacts of an airport and local infrastructure on housing prices in a small urban city. Rev. Urban Reg. Dev. Stud. 2003, 15, 255–273. [Google Scholar] [CrossRef] [Scilit]
- Brueckner, J.K. Airline traffic and urban economic development. Urban Stud. 2003, 40, 1455–1469. [Google Scholar] [CrossRef] [Scilit]
- Thanos, S.; Bristow, A.L.; Wardman, M.R. Residential sorting and environmental externalities: The case of nonlinearities and stigma in aviation noise values. J. Reg. Sci. 2015, 55, 468–490. [Google Scholar] [CrossRef] [Scilit]
- Boes, S.; Nüesch, S. Quasi-experimental evidence on the effect of aircraft noise on apartment rents. J. Urban Econ. 2011, 69, 196–204. [Google Scholar] [CrossRef] [Scilit]
- Green, R.K. Airports and economic development. Real Estate Econ. 2007, 35, 91–112. [Google Scholar] [CrossRef] [Scilit]
- Partridge, M.D.; Rickman, D.S.; Ali, K.; Olfert, M.R. Recent spatial growth dynamics in wages and housing costs: Proximity to urban production externalities and consumer amenities. Reg. Sci. Urban Econ. 2010, 40, 440–452. [Google Scholar] [CrossRef] [Scilit]
- Spahr, R.; Sunderman, M. Valuation of property surrounding a resort community. J. Real Estate Res. 1999, 17, 227–243. [Google Scholar] [CrossRef] [Scilit]
- Wassmer, R.W. The value of proximity to a vacation home rental in a resort community. J. Plan. Educ. Res. 2022, 42, 638–653. [Google Scholar] [CrossRef] [Scilit]
- Bełej, M.; Cellmer, R.; Głuszak, M. The impact of airport proximity on single-family house prices: Evidence from Poland. Sustainability 2020, 12, 7928. [Google Scholar] [CrossRef] [Scilit]
- Cellmer, R.; Bełej, M.; Konowalczuk, J. Impact of a vicinity of airport on the prices of single-family houses with the use of geospatial analysis. Int. J. Geo-Inf. 2019, 8, 471. [Google Scholar] [CrossRef] [Scilit]
- Yang, Y.; Mao, Z.; Tang, J. Understanding guest satisfaction with urban hotel location. J. Travel Res. 2018, 57, 243–259. [Google Scholar] [CrossRef] [Scilit]
- Caballero Galeote, L.; García Mestanza, J. Qualitative impact analysis of international tourists and residents’ perceptions of Málaga-Costa Del Sol Airport. Sustainability 2020, 12, 4725. [Google Scholar] [CrossRef] [Scilit]
- Batóg, J.; Foryś, I.; Gaca, R.; Głuszak, M.; Konowalczuk, J. Investigating the impact of airport noise and land use restrictions on house prices: Evidence from selected regional airports in Poland. Sustainability 2019, 11, 412. [Google Scholar] [CrossRef] [Scilit]
- Lancaster, K.J. A new approach to consumer theory. J. Political Econ. 1966, 74, 132–157. [Google Scholar] [CrossRef] [Scilit] [PubMed]
- Rosen, S. Hedonic prices and implicit markets: Product differentiation in pure competition. J. Political Econ. 1974, 82, 34–55. [Google Scholar] [CrossRef] [Scilit] [PubMed]
- Brunsdon, C.; Fotheringham, A.S.; Charlton, M.E. Geographically weighted regression: A method for exploring spatial nonstationarity. Geogr. Anal. 1996, 28, 281–298. [Google Scholar] [CrossRef] [Scilit]
- Fotheringham, S. Geographically weighted regression. In The SAGE Handbook of Spatial Analysis; Fotheringham, S., Rogerson, P.A., Eds.; Sage: Thousand Oaks, CA, USA, 2009; pp. 243–253. [Google Scholar] [CrossRef] [Scilit]
- McMillen, D.P. Multiple regime bid-rent function estimation. J. Urban Econ. 1997, 41, 301–319. [Google Scholar] [CrossRef] [Scilit]
- Epple, D. Hedonic prices and implicit markets: Estimating demand and supply functions for differentiated products. J. Political Econ. 1987, 95, 59–80. [Google Scholar] [CrossRef] [Scilit] [PubMed]
- Baranzini, A.; Ramirez, J.V.; Schaerer, C.; Thalmann, P. Hedonic Methods in Housing Markets: Pricing Environmental Amenities and Segregation; Springer: Berlin/Heidelberg, Germany, 2008. [Google Scholar]
- Hillinger, C. Measuring real value and inflation. Economics 2008, 2, 1–26. [Google Scholar] [CrossRef] [Scilit]
- Raghunathan, T.E.; Lepkowski, J.M.; Van Hoewyk, J.; Solenberger, P. A multivariate technique for multiply imputing missing values using a sequence of regression models. Surv. Methodol. 2001, 27, 85–96. [Google Scholar]
- Van Buuren, S.; Groothuis-Oudshoorn, K. mice: Multivariate imputation by chained equations in R. J. Stat. Softw. 2011, 45, 1–67. [Google Scholar] [CrossRef] [Scilit]
- White, I.R.; Carlin, J.B. Bias and efficiency of multiple imputation compared with complete-case analysis for missing covariate values. Stat. Med. 2010, 29, 2920–2931. [Google Scholar] [CrossRef] [Scilit] [PubMed]
- da Silva, A.R.; Fotheringham, A.S. The multiple testing issue in geographically weighted regression. Geogr. Anal. 2016, 48, 233–247. [Google Scholar] [CrossRef] [Scilit]
- Wheeler, D.C.; Tiefelsdorf, M. Multicollinearity and correlation among local regression coefficients in geographically weighted regression. J. Geogr. Syst. 2005, 7, 161–187. [Google Scholar] [CrossRef] [Scilit]
- International Association of Assessing Officers. Standard on Ratio Studies; International Association of Assessing Officers: Kansas City, MO, USA, 2013. [Google Scholar]
- Appraisal Foundation. Uniform Standards of Professional Appraisal Practice, 2024th ed.; The Appraisal Foundation: Washington, DC, USA, 2024. [Google Scholar]
- Pope, J.C. Buyer information and the hedonic: The impact of a seller disclosure on the implicit price for airport noise. J. Urban Econ. 2008, 63, 498–516. [Google Scholar] [CrossRef] [Scilit]

Disclaimer/Publisher’s Note: The statements, opinions and data contained in all publications are solely those of the individual author(s) and contributor(s) and not of MDPI and/or the editor(s). MDPI and/or the editor(s) disclaim responsibility for any injury to people or property resulting from any ideas, methods, instructions or products referred to in the content. |
© 2026 by the authors. Licensee MDPI, Basel, Switzerland. This article is an open access article distributed under the terms and conditions of the Creative Commons Attribution (CC BY) license.