


Abstract
Chronic lymphocytic leukemia (CLL) exhibits marked clinical heterogeneity that is closely associated with genomic instability. Although cytogenetic abnormalities are widely used for risk stratification, they do not fully capture the biological complexity of the disease. Telomere dysfunction and alterations in DNA damage response pathways have been implicated in disease progression, but their relationship with cytogenetic risk in CLL remains incompletely characterized. In this study, peripheral blood mononuclear cells (PBMCs) from 48 CLL patients were analyzed. The analyzed PBMC fractions were enriched in leukemic B cells, with an estimated median tumor content above 85–90%. Cytogenetic profiles were obtained by conventional karyotyping following in vitro immunostimulation with DSP30 and interleukin-2 and classified according to ERIC and Döhner criteria. Telomere length was assessed by quantitative PCR, and CHEK1 and CHEK2 expression levels were quantified by RT–qPCR. Molecular parameters were compared across cytogenetic risk groups. Distinct molecular profiles were observed across cytogenetic categories. Favorable-risk CLL cases showed preserved telomere length, low CHEK1 expression, and maintained CHEK2 levels. Intermediate-risk cases, predominantly characterized by trisomy 12, exhibited moderate telomere shortening accompanied by increased CHEK1 expression and partial reduction of CHEK2. High-risk CLL cases, defined by del(11q), del(17p), or complex karyotypes, displayed pronounced telomere shortening, marked CHEK1 upregulation, and strong suppression of CHEK2. Telomere length was inversely correlated with cytogenetic risk (Spearman’s ρ = −0.68, p < 0.0001), and the CHEK1/CHEK2 expression ratio increased progressively with genomic complexity. These findings indicate that telomere length and CHEK1/CHEK2 expression patterns are closely associated with cytogenetic risk in CLL and may provide complementary biological information for risk stratification.
1. Introduction
Chronic lymphocytic leukemia (CLL) is a biologically heterogeneous B-cell malignancy characterized by the progressive accumulation of mature but functionally impaired lymphocytes in peripheral blood, bone marrow, and lymphoid tissues [1,2]. Although CLL has traditionally been viewed as a disease driven primarily by defective apoptosis rather than high proliferative activity, leukemic cells are continuously exposed to endogenous genomic stress arising from replication errors, oxidative damage, and telomere erosion [3,4]. The capacity of CLL cells to tolerate and adapt to this chronic stress is increasingly recognized as a key determinant of clonal evolution, disease progression, and therapeutic resistance [5].
Genomic instability represents a central hallmark of CLL and is closely associated with recurrent chromosomal abnormalities, including deletion of 13q14, trisomy 12, deletion of 11q22–23, and deletion of 17p13 [6,7]. These cytogenetic lesions define biologically distinct subgroups and are accompanied by varying degrees of disruption in DNA damage response (DDR) pathways [8]. Beyond chromosomal copy number changes, genomic instability in CLL is strongly influenced by telomere dysfunction, which constitutes a persistent and endogenous source of DNA damage signaling [9,10].
Telomeres are specialized nucleoprotein structures that protect chromosome ends from being recognized as DNA double-strand breaks. In CLL, telomere shortening and altered telomere length distributions have been consistently associated with increased chromosomal complexity and adverse clinical outcomes [11,12,13]. Critically shortened telomeres trigger sustained DDR activation, leading to checkpoint engagement and, under physiological conditions, cellular senescence or apoptosis [14]. In leukemic cells, however, this chronic telomere-associated stress imposes selective pressure on checkpoint signaling pathways, favoring adaptations that permit continued survival and proliferation.
Key mediators of DNA damage response (DDR) signaling include the checkpoint kinases CHEK1 and CHEK2, which function downstream of the ATR and ATM pathways, respectively [15,16]. CHEK2 is primarily activated by ATM in response to DNA double-strand breaks and telomere uncapping, triggering cell cycle arrest and apoptosis to preserve genomic integrity. In contrast, CHEK1 is predominantly activated by ATR under conditions of replication stress, where it promotes replication fork stabilization and facilitates S-phase progression [17,18].
Dysfunctional telomeres can activate both ATM–CHEK2 and ATR–CHEK1 signaling pathways. However, selective reliance on CHEK1-mediated signaling may allow leukemic cells to tolerate persistent replication stress and continue proliferating despite ongoing genomic instability. Consequently, an imbalance between these checkpoint pathways may reflect adaptive signaling mechanisms that support survival and progression in genomically unstable CLL cells.
Based on this framework, the present study aimed to test the hypothesis that cytogenetic risk in CLL is associated with coordinated alterations in telomere length and CHEK1/CHEK2 expression. Specifically, we investigated whether differential expressions of CHEK1 and CHEK2 correlate with telomere dysfunction across established cytogenetic risk subgroups, thereby reflecting distinct biological states associated with disease progression.
2. Results
2.1. Cytogenetic Characterization of CLL Patients
Cytogenetic analysis by conventional G-banding, complemented by interphase FISH, was successfully performed in all 48 CLL patients included in the study. Based on integrated karyotype–FISH findings and according to the Döhner risk stratification, patients were classified into favorable, intermediate, and high-risk cytogenetic groups (Table 1).
Table 1.
Integrative Karyotype–FISH analysis and Döhner risk stratification in chronic lymphocytic leukemia.
The favorable cytogenetic category represented the largest subgroup in the cohort and comprised patients with a normal karyotype or isolated deletion of chromosome 13q14. Normal karyotypes were identified by G-banding and confirmed by normal FISH signal patterns. Isolated del(13q14), detected either in all analyzed metaphases or in mosaic form, was confirmed by FISH using probes targeting the D13S319 region and constituted the most frequent chromosomal abnormality in the cohort. These cases were consistently classified as favorable risk (Table 1).
The intermediate-risk group was primarily defined by the presence of trisomy 12, identified as a sole abnormality or in combination with del(13q14) in a subset of cases. Trisomy 12 was confirmed by FISH using centromeric probes for chromosome 12 and was observed with variable percentages of abnormal nuclei (Table 1). Patients harboring trisomy 12, either isolated or associated with additional favorable lesions, were categorized as intermediate risk according to established criteria.
The high-risk cytogenetic group included patients carrying deletions of 11q22–23 and/or deletions of 17p13, detected by G-banding and confirmed by FISH targeting the ATM and TP53 loci, respectively. Several patients exhibited isolated del(11q) or del(17p), while others showed complex karyotypic patterns with multiple chromosomal abnormalities. In cases presenting with combined cytogenetic abnormalities, risk assignment was determined by the highest-risk lesion present, such that the presence of del(11q) and/or del(17p) superseded concomitant favorable or intermediate abnormalities, including trisomy 12 or del(13q14). These lesions were frequently present in a high proportion of analyzed cells and were consistently assigned to the high-risk category. A subset of cases showed combined deletions involving both 11q and 17p, reflecting increased cytogenetic complexity (Table 1).
Overall, cytogenetic analysis revealed a heterogeneous distribution of chromosomal abnormalities within the cohort, with a predominance of favorable lesions, followed by intermediate- and high-risk alterations. The integration of conventional cytogenetics and FISH allowed accurate and consistent classification of CLL patients into cytogenetic risk groups, providing a robust framework for subsequent correlation with molecular and clinical parameters.
The high proportion of abnormal nuclei detected by FISH in most samples (frequently ranging between 30% and 67%) further supports a substantial leukemic clone representation within PBMC fractions. Considering the absolute lymphocytosis present in all patients and the cytogenetic clone size, the samples analyzed predominantly consisted of malignant B cells, reinforcing the biological relevance of the molecular measurements.
2.2. CHEK1 and CHEK2 Expression According to Cytogenetic Profile in CLL
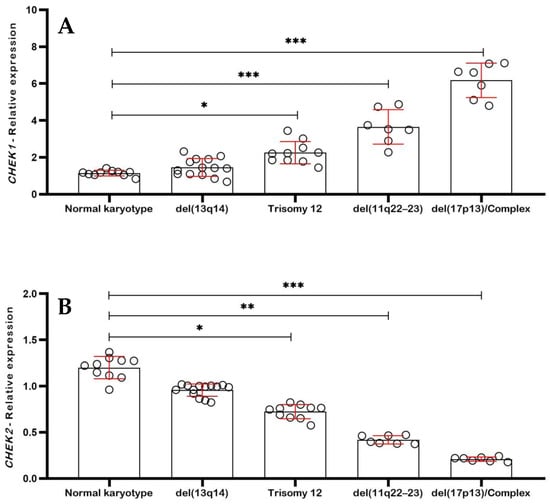
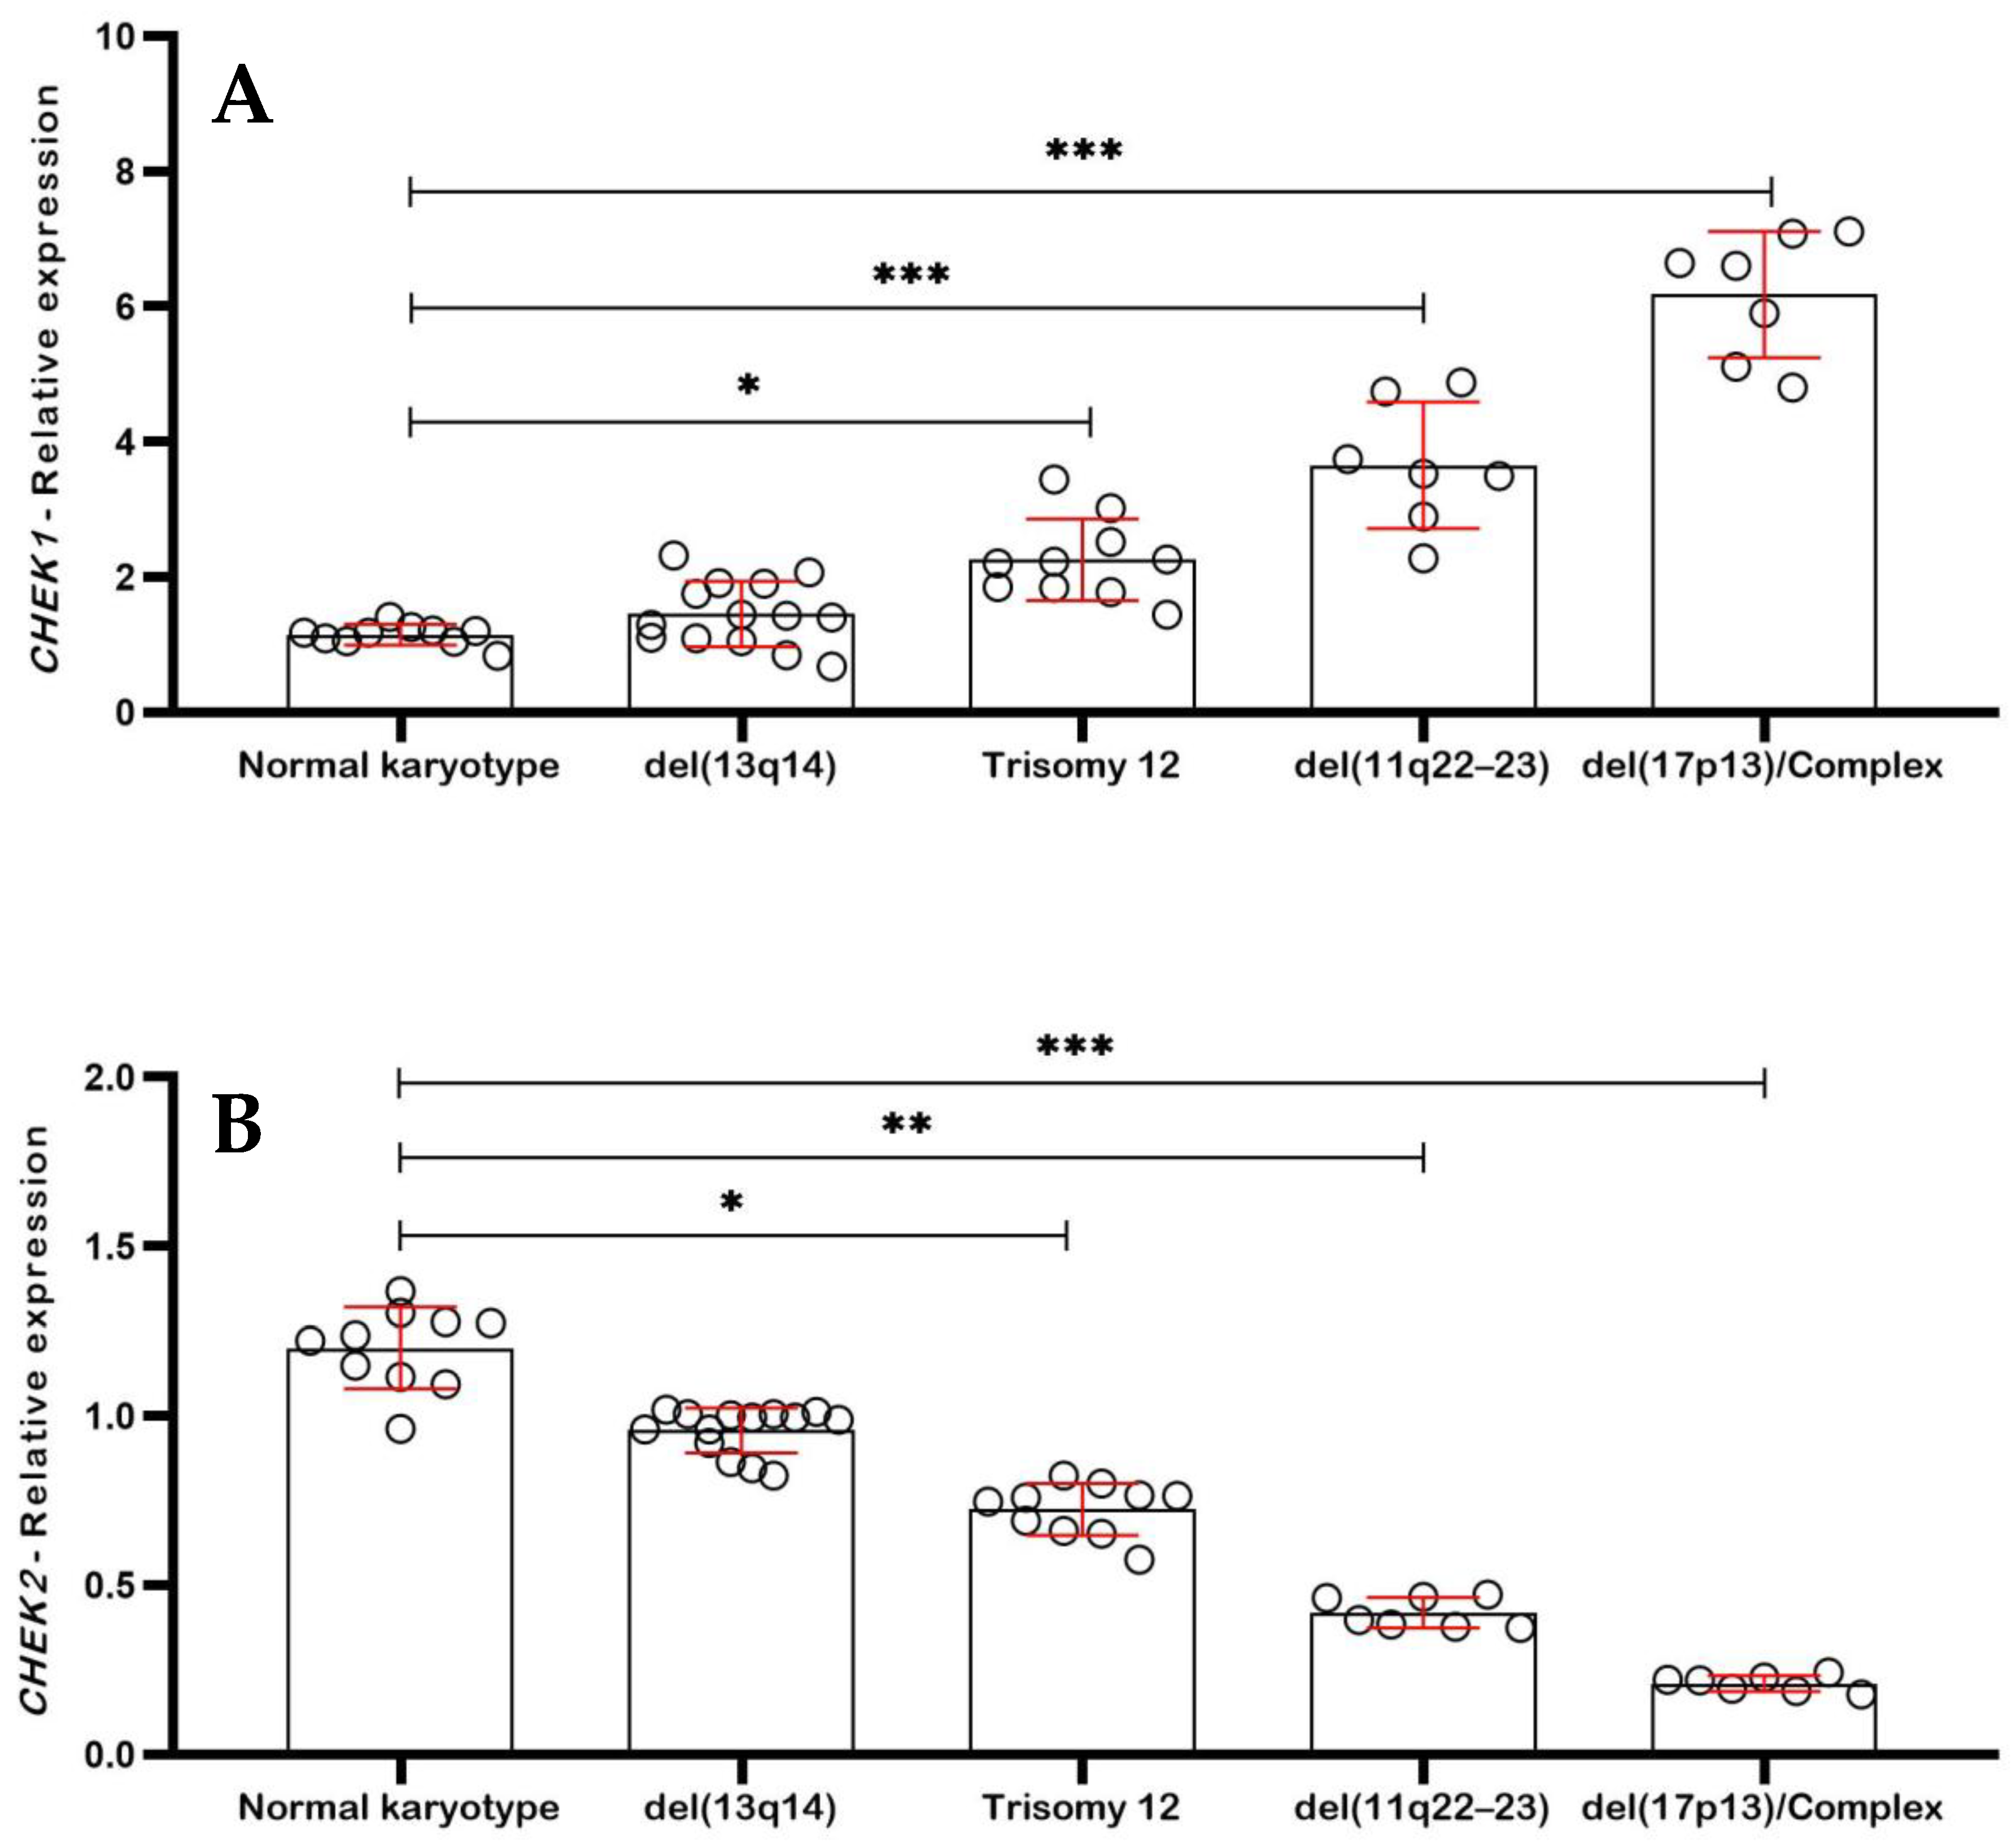
To investigate the relationship between checkpoint signaling and genomic instability in chronic lymphocytic leukemia (CLL), the relative expression levels of CHEK1 and CHEK2 were analyzed across cytogenetic subgroups defined according to the Döhner classification. Gene expression was quantified by RT–qPCR using the 2−ΔΔCt method, normalized to the housekeeping gene GAPDH, and expressed as fold change relative to a pooled cDNA calibrator. Each dot in Figure 1 represents an individual patient sample, with horizontal bars indicating the median and interquartile range (IQR). Statistical comparisons among cytogenetic groups were performed using the Kruskal–Wallis test followed by Dunn’s post hoc multiple-comparison test.
Figure 1.
Differential expression of checkpoint kinases across cytogenetic risk groups in chronic lymphocytic leukemia. (A) Relative CHEK1 expression levels determined by RT–qPCR and calculated using the 2−ΔΔCt method, normalized to the housekeeping gene GAPDH. Each dot represents an individual patient sample, and horizontal bars indicate the median with interquartile range (IQR). A progressive increase in CHEK1 expression is observed with increasing cytogenetic risk, with the highest levels detected in cases harboring del(11q22–23) and del(17p13)/complex karyotypes, consistent with enhanced replication stress signaling in genomically unstable CLL. (B) Relative CHEK2 expression levels in the same cohort, measured by RT–qPCR and normalized to GAPDH. In contrast to CHEK1, CHEK2 expression progressively decreases with increasing cytogenetic risk, with the lowest levels observed in high-risk CLL cases carrying del(11q22–23) and del(17p13)/complex karyotypes, suggesting attenuation of ATM–CHEK2-mediated checkpoint signaling in advanced genomic instability. Statistical comparisons among cytogenetic groups were performed using the Kruskal–Wallis test followed by Dunn’s multiple-comparison test. Statistical significance is indicated as follows: * p < 0.05, ** p < 0.01, *** p < 0.001. For panel (A), CHEK1 expression was significantly increased in trisomy 12 (** p < 0.01), del(11q22–23) (*** p < 0.001), and del(17p13)/complex karyotype groups (*** p < 0.001) compared with normal karyotype cases. For panel (B), CHEK2 expression was significantly reduced in trisomy 12 (* p < 0.05), del(11q22–23) (** p < 0.01), and del(17p13)/complex karyotype groups (*** p < 0.001) relative to normal karyotype. Each dot represents an individual patient sample.
As shown in Figure 1A, CHEK1 expression increased progressively across cytogenetic risk groups. CLL patients with a normal karyotype displayed low checkpoint activation, with CHEK1 expression remaining close to baseline (1.0 ± 0.3). Similarly, cases harboring isolated del(13q14) showed only a modest increase in CHEK1 expression (1.4 ± 0.5), which did not differ significantly from the normal karyotype group. In contrast, samples with trisomy 12 exhibited significantly higher CHEK1 expression (2.3 ± 0.7; p < 0.01 vs. normal karyotype, Dunn’s test), indicating activation of replication stress-associated checkpoint signaling. The most pronounced upregulation of CHEK1 was observed in high-risk cytogenetic groups. Patients carrying del(11q22–23) demonstrated marked CHEK1 overexpression (3.6 ± 1.1; p < 0.001 vs. normal karyotype), while cases with del(17p13) and/or complex karyotypes showed the highest expression levels (5.1 ± 1.4; p < 0.001).
In contrast, CHEK2 expression displayed the opposite trend (Figure 1B). Patients with a normal karyotype maintained preserved CHEK2 expression (1.1 ± 0.4), while cases with isolated del(13q14) showed similar levels (0.9 ± 0.3), indicating relatively intact ATM–CHEK2 checkpoint signaling in low-risk CLL. However, samples harboring trisomy 12 exhibited a significant reduction in CHEK2 expression (0.7 ± 0.2; p < 0.05 vs. normal karyotype). This reduction became more pronounced in high-risk cytogenetic subgroups. Patients with del(11q22–23) showed markedly decreased CHEK2 expression (0.45 ± 0.15; p < 0.01), whereas cases with del(17p13) and/or complex karyotypes exhibited profound downregulation (0.22 ± 0.10; p < 0.001).
When expressed as a ratio, the CHEK1/CHEK2 index increased progressively with cytogenetic risk, effectively distinguishing low-risk from high-risk CLL groups (p < 0.0001, Kruskal–Wallis test). This progressive polarization of checkpoint kinase signaling closely paralleled the gradient of telomere shortening observed across cytogenetic subgroups, supporting a strong association between telomere dysfunction, chromosomal instability, and altered DNA damage checkpoint regulation in CLL.
2.3. Telomere Shortening According to Cytogenetic Profile in CLL
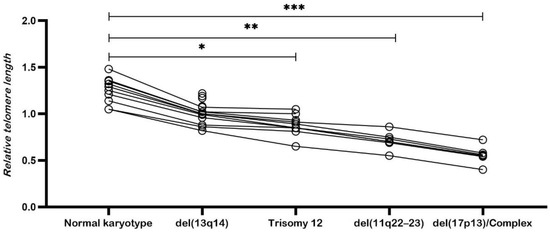
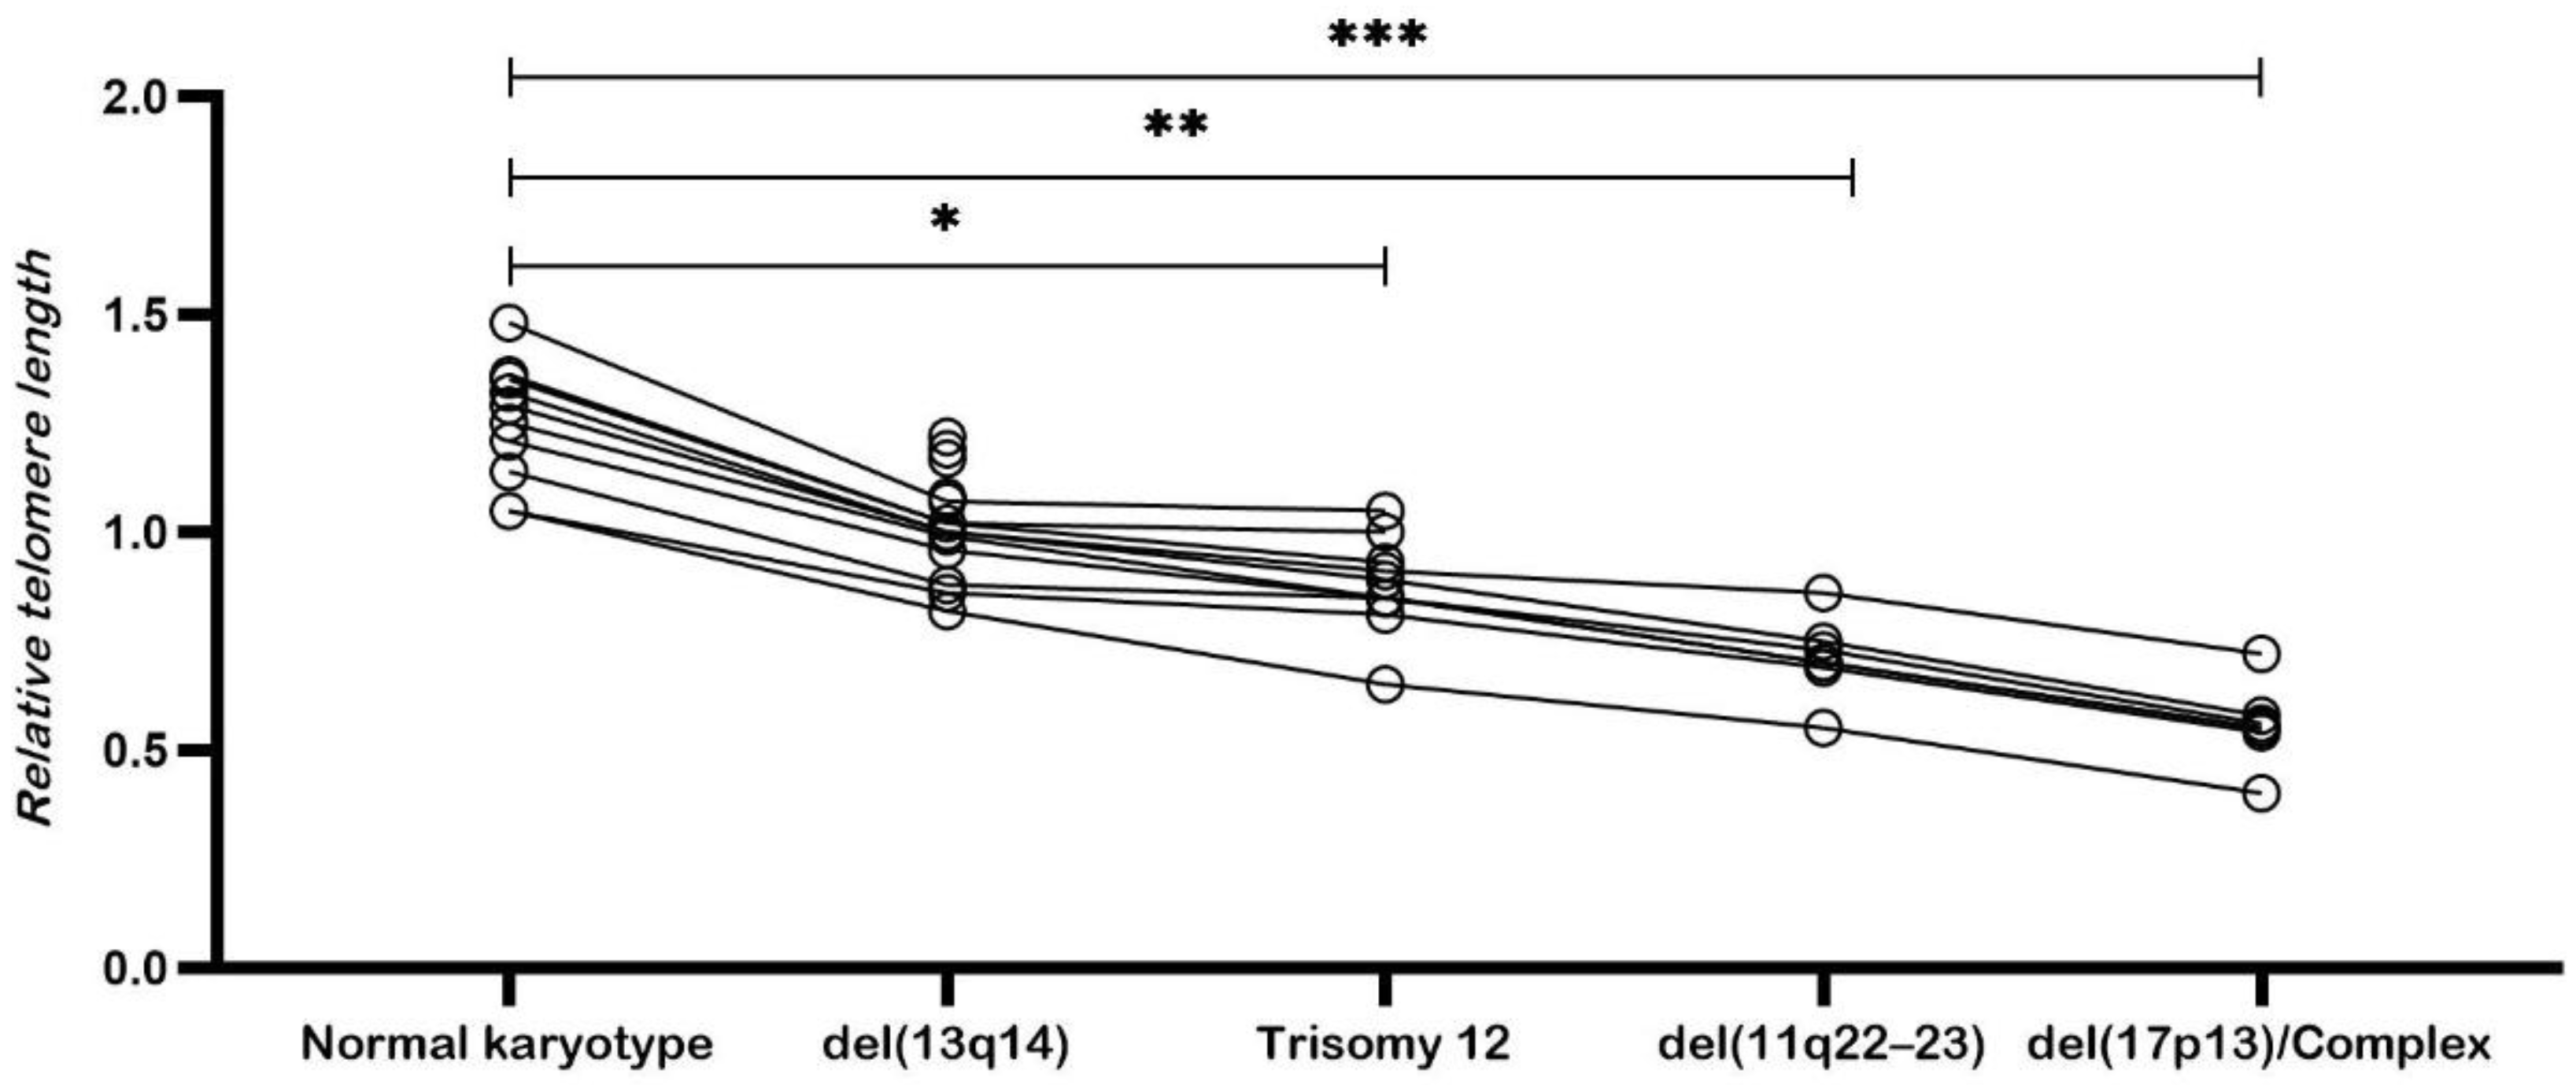
Analysis of relative telomere length (RTL) revealed a clear and progressive association between telomere shortening and increasing cytogenetic risk in patients with chronic lymphocytic leukemia (CLL) (Figure 2). Telomere length was quantified by qPCR and expressed as the telomere-to-single-copy gene ratio (T/S). Each point in the figure represents an individual patient sample, and horizontal bars indicate the median with interquartile range (IQR).
Figure 2.
Progressive telomere shortening across cytogenetic risk groups in chronic lymphocytic leukemia. Relative telomere length (T/S ratio) measured by quantitative PCR in peripheral blood mononuclear cells (PBMCs) from patients with chronic lymphocytic leukemia (CLL), stratified according to cytogenetic risk groups defined by the Döhner classification. Each dot represents an individual patient sample, and horizontal bars indicate the median with interquartile range (IQR). A progressive reduction in telomere length is observed with increasing cytogenetic risk, with the shortest telomeres detected in high-risk groups, including cases harboring del(11q22–23) and del(17p13)/complex karyotypes, reflecting increased genomic instability and replicative history. Statistical comparisons among groups were performed using the Kruskal–Wallis test followed by Dunn’s multiple-comparison test. Statistical significance is indicated as follows: * p < 0.05, ** p < 0.01, *** p < 0.001, and ns (not significant). Compared with the normal karyotype group, telomere length was mildly reduced in del(13q14) cases (ns), moderately reduced in trisomy 12 cases (* p < 0.05), and significantly reduced in high-risk cytogenetic groups, including del(11q22–23) (** p < 0.01) and del(17p13)/complex karyotypes (*** p < 0.001).
Patients with a normal karyotype (n = 10) exhibited the longest telomeres in the cohort, with a mean T/S ratio of 1.25 ± 0.14, a median of 1.27, and a range of 1.05–1.48 (Figure 2). These values indicate preserved telomeric integrity in the absence of detectable chromosomal abnormalities.
CLL cases harboring isolated del(13q14) (n = 14) showed only mild telomere erosion, with a mean T/S ratio of 1.02 ± 0.12, a median of 1.01, and a range of 0.82–1.22 (Figure 2). Telomere lengths in this subgroup remained clearly distinct from those observed in higher-risk cytogenetic categories.
In contrast, patients with trisomy 12 (n = 10), representing the intermediate-risk group, demonstrated moderate telomere shortening with a mean T/S ratio of 0.88 ± 0.11, a median of 0.87, and a range of 0.65–1.05 (Figure 2).
The most pronounced telomere shortening was observed in high-risk cytogenetic subgroups. Patients carrying del(11q22–23) (n = 7) exhibited substantial telomere erosion, with a mean T/S ratio of 0.71 ± 0.09, a median of 0.70, and a range of 0.55–0.86. Similarly, CLL cases with del(17p13) and/or complex karyotypes (n = 7) showed the shortest telomeres in the cohort, with a mean T/S ratio of 0.56 ± 0.08, a median of 0.55, and a range of 0.40–0.72 (Figure 2).
Statistical comparison among cytogenetic groups confirmed significant differences in telomere length distribution (Kruskal–Wallis test, p < 0.001). Post hoc analysis using Dunn’s multiple-comparison test demonstrated that high-risk cytogenetic groups displayed significantly shorter telomeres compared with favorable categories.
To further evaluate the relationship between cytogenetic risk and telomere length, cytogenetic categories ranked according to the Döhner risk stratification were correlated with telomere length as a continuous variable. This analysis revealed a strong inverse correlation between cytogenetic risk and telomere length across the cohort (Spearman’s ρ = −0.68, p < 0.0001), confirming a stepwise reduction in telomere length with increasing genomic complexity in CLL.
An integrated analysis of cytogenetic alterations, checkpoint kinase expression, and telomere length revealed a coherent and progressive biological pattern associated with disease severity in CLL. Favorable cytogenetic profiles, defined by a normal karyotype or isolated del(13q14), were consistently characterized by preserved telomere length, low CHEK1 expression, and maintained CHEK2 levels. These cases showed limited molecular heterogeneity and clustered within the lowest-risk categories, consistent with a more indolent disease phenotype.
In contrast, patients classified within the intermediate-risk group, primarily those harboring trisomy 12, displayed a coordinated shift across all three parameters. This subgroup exhibited moderate telomere shortening, increased CHEK1 expression, and partial reduction in CHEK2 levels. These molecular features were accompanied by greater variability within the group, suggesting a transitional biological state between favorable and high-risk disease categories.
The most pronounced convergence of alterations was observed in high-risk cytogenetic subgroups, particularly among patients carrying del(11q22–23), del(17p13), and/or complex karyotypes. These cases were characterized by severe telomere erosion, marked CHEK1 overexpression, and profound suppression of CHEK2. Accordingly, the CHEK1/CHEK2 expression ratio increased sharply with cytogenetic complexity and telomere attrition, defining a molecular profile closely associated with advanced genomic instability. Notably, these patterns were consistently observed in patients assigned to the highest cytogenetic risk categories, which are clinically linked to rapid disease progression, treatment resistance, and unfavorable outcomes.
Taken together, cytogenetic findings, telomere length measurements, and checkpoint kinase expression profiles delineate a biological continuum that parallels the clinical spectrum of CLL, ranging from indolent to aggressive forms. The accumulation of chromosomal abnormalities is accompanied by progressive telomere shortening and increasing imbalance in checkpoint kinase expression, highlighting a coordinated molecular landscape that distinguishes early-stage disease from genomically unstable, high-risk CLL. This integrative framework supports a model in which chromosomal instability, telomere dysfunction, and altered checkpoint signaling coexist and intensify as CLL advances.
3. Discussion
Chronic lymphocytic leukemia (CLL) is a biologically heterogeneous malignancy in which clinical behavior is tightly linked to the progressive accumulation of genomic instability. Although cytogenetic abnormalities remain fundamental for risk stratification and prognostication, growing evidence suggests that chromosomal lesions represent only one layer of a complex and dynamic molecular architecture that includes telomere dysfunction and alterations in DNA damage response pathways [2,19,20,21,22,23].
A methodological consideration in the present study concerns the use of peripheral blood mononuclear cells (PBMCs), which comprise a heterogeneous leukocyte population. However, CLL is characterized by peripheral expansion of clonal CD19+/CD5+ B lymphocytes, and in this cohort peripheral blood samples demonstrated a high tumor burden, with an estimated median leukemic B-cell proportion exceeding 85–90%. The substantial percentage of abnormal nuclei detected by FISH—frequently ranging from 30% to over 60%—together with consistent cytogenetic clone sizes, strongly indicates dominant clonal representation within the PBMC fraction.
Accordingly, the telomere length and checkpoint kinase measurements obtained in this study are highly likely to reflect intrinsic leukemic cell biology rather than contributions from residual non-malignant leukocyte subsets. While the use of purified CD19+ fractions could provide even greater cellular specificity, the high leukemic burden observed here minimizes the probability that telomere length assessments were significantly confounded by normal hematopoietic cells. Future investigations employing cell-sorting approaches may further refine the resolution of telomere and checkpoint analyses at the single-cell or lineage-specific level.
Telomerase reactivation has been reported in subsets of CLL, particularly in aggressive disease characterized by short telomeres and TP53 disruption. Although telomerase activity was not directly measured in this study, differential telomerase expression may partially compensate for telomere attrition in certain clones. Therefore, the observed telomere shortening likely reflects cumulative replicative stress rather than a complete absence of telomerase function. Future studies integrating telomerase activity measurements would help clarify its contribution to the telomere–checkpoint axis in CLL.
In the present study, cytogenetic categories defined according to established ERIC and Döhner frameworks—obtained after in vitro immunostimulation of CLL cells using DSP30 and interleukin-2 (IL-2)—were associated with distinct molecular profiles integrating telomere length and checkpoint kinase expression. Patients with favorable cytogenetics, including normal karyotype and isolated del(13q14), consistently exhibited preserved telomere length and balanced CHEK1 and CHEK2 expressions. These features are compatible with a relatively stable genomic state and align with previous reports linking longer telomeres to prolonged progression-free survival and delayed treatment requirement in CLL [24,25].
Interestingly, in the present cohort patients with a normal karyotype exhibited slightly longer telomeres and lower CHEK1/CHEK2 ratios compared with cases harboring isolated del(13q14). Previous large cohort studies have reported that normal karyotype CLL may in some cases display shorter telomeres than del(13q)-only cases. This apparent discrepancy may reflect biological heterogeneity within the normal-karyotype group, which frequently includes subclones with distinct molecular features. One possible explanation is the distribution of IGHV mutational status, as IGHV-mutated cases are often associated with longer telomeres and more indolent disease behavior. Because IGHV mutation status was not available in the present study, differences in the proportion of IGHV-mutated cases within the normal-karyotype subgroup may partially account for this observation.
Intermediate-risk cases, largely represented by trisomy 12, displayed a coordinated molecular pattern characterized by moderate telomere shortening, increased CHEK1 expression, and partial reduction of CHEK2. Trisomy 12 CLL is widely recognized as a biologically heterogeneous subgroup with variable clinical behavior, and recent genomic studies support its classification as an intermediate state between genomically stable and highly unstable disease [26]. Our findings are consistent with this concept and suggest that telomere length and checkpoint kinase expression may reflect this intermediate biological status, without implying causality.
The most pronounced molecular alterations were observed in high-risk cytogenetic subgroups, particularly among patients harboring del(11q22–23), del(17p13), and/or complex karyotypes. These cases showed marked telomere shortening, elevated CHEK1 expression, and reduced CHEK2 levels. High-risk cytogenetic lesions, especially those involving ATM and TP53, are well established markers of aggressive disease and poor clinical outcome, frequently occurring in the context of widespread chromosomal instability [16,27,28]. Our data extends these observations by demonstrating that telomere length and checkpoint kinase expression patterns closely parallel cytogenetic complexity.
From a biological perspective, telomere shortening represents a persistent source of DNA damage signaling and replication stress in CLL cells. In normal settings, such stress activates ATM–CHEK2-dependent pathways that promote cell cycle arrest or apoptosis [25,26]. In this study, however, alterations in CHEK1 and CHEK2 expression were observed in association with increasing cytogenetic risk. Importantly, these findings are correlative and do not demonstrate functional checkpoint rewiring or adaptive remodeling. Rather, they indicate that differences in checkpoint kinase expression coexist with telomere dysfunction and genomic instability across CLL subgroups.
The present study demonstrates associations between telomere shortening and differential checkpoint kinase expression rather than establishing a direct mechanistic relationship. Telomere dysfunction is known to activate DNA damage response pathways, including the ATM–CHEK2 and ATR–CHEK1 axes; however, whether telomere erosion directly induces the observed transcriptional polarization of CHEK1 and CHEK2 remains to be determined. Experimental models inducing telomere dysfunction or telomerase inhibition would be valuable to determine whether telomere shortening directly modulates checkpoint signaling in leukemic B cells.
Beyond the intrinsic genomic pressure, the dynamic interaction between CLL cells and the tumor microenvironment (TME) may further modulate the checkpoint kinase landscape. In the lymphatic niches, signals mediated by the B-cell receptor (BCR) and CD40L stimulation are known to drive proliferation and enhance survival signaling. It is plausible that these extrinsic stimuli cooperate with telomere-driven stress to sustain high CHEK1 levels, particularly in the most aggressive clones that frequently home to these protective sites [2,3]. Such kinase-dependent crosstalk highlights that CHEK1/2 remodeling is not only a consequence of genomic instability but may also be reinforced by microenvironmental factors that promote a replication-stress-tolerant phenotype [13]. Understanding how the TME influences this checkpoint polarization could reveal why high-risk CLL cells are particularly adept at escaping DNA-damage-induced apoptosis within lymphoid tissues [17,20].
These molecular associations may nonetheless have translational relevance. Conventional cytogenetic analysis in CLL requires in vitro immunostimulation to induce metaphase formation, which limits accessibility and may be unsuccessful in samples with low proliferative capacity. In contrast, telomere length assessment and gene expression analysis of CHEK1 and CHEK2 can be performed directly on peripheral blood samples, offering practical advantages. Several studies have emphasized the need for complementary biomarkers that capture biological aggressiveness when cytogenetic information is incomplete or unavailable [28,29].
Importantly, the combined assessment of telomere length and CHEK1/CHEK2 expression provided biologically informative patterns that paralleled cytogenetic risk categories in this cohort. Elevated CHEK1 expression, reduced CHEK2 levels, and shortened telomeres may therefore serve as surrogate indicators of underlying genomic instability, particularly in early-stage disease or technically challenging settings [30,31,32]. However, their clinical utility and predictive value require validation in independent cohorts.
From a therapeutic standpoint, the association between high cytogenetic risk and altered CHEK1/CHEK2 expression suggests potential vulnerabilities in DNA damage response pathways. Nonetheless, any therapeutic implications remain hypothesis-generating, as no functional or pharmacological assays were performed in this study. Further experimental work will be required to determine whether checkpoint kinase dependencies can be exploited therapeutically in CLL, particularly in TP53- or ATM-deficient contexts [10,11,12,13].
Finally, telomere length emerges as a robust quantitative marker reflecting cumulative replicative history and genomic stress [33,34]. Unlike cytogenetic abnormalities, which provide a static snapshot, telomere length captures dynamic aspects of disease biology and may complement cytogenetic analysis by identifying biologically aggressive diseases not immediately apparent at the chromosomal level.
In summary, our study reveals coordinated associations between telomere shortening and checkpoint kinase expression and cytogenetic risk in CLL. The polarization toward a CHEK1-high and CHEK2-low profile in aggressive cases suggests a strategic adaptation to sustain genomic integrity despite high replication stress. Importantly, this molecular signature identifies CHEK1 as a critical dependency and a promising therapeutic target, particularly in the context of the tumor microenvironment where survival signals may further reinforce this pathway. Given that high-risk clones rely on CHEK1 to bypass DNA damage-induced apoptosis, the use of selective inhibitors could disrupt this kinase-dependent crosstalk, potentially sensitizing CLL cells to conventional therapies and overcoming the protective effects of the lymphatic niches. Therefore, monitoring the telomere–checkpoint axis may not only refine risk stratification but also guide the development of personalized kinase-targeted strategies for patients with unfavorable cytogenetics.
Several limitations of the present study should be acknowledged. First, checkpoint kinase expression was evaluated at the mRNA level using quantitative PCR. Although transcriptional changes can reflect pathway activation, mRNA levels do not necessarily correspond to protein abundance or kinase activity due to post-transcriptional regulatory mechanisms. Future studies integrating protein-level analyses, such as Western blotting or immunohistochemistry, will be important to determine whether the transcriptional polarization of CHEK1 and CHEK2 observed in this study translates into functional differences in checkpoint signaling in CLL cells. Second, IGHV mutational status was not available for this cohort, which may influence both telomere dynamics and clinical behavior in CLL. Finally, longitudinal clinical outcomes such as progression-free survival or overall survival were not analyzed, limiting the ability to directly assess the prognostic value of telomere length and checkpoint kinase expression in this patient population. Future studies integrating molecular markers, IGHV mutational status, and clinical follow-up will be important to clarify the clinical significance of the telomere–checkpoint signaling axis in CLL.
4. Material and Methods
4.1. Samples
This study included 48 peripheral blood samples obtained from patients diagnosed with chronic lymphocytic leukemia (CLL), comprising cases with either normal or abnormal karyotypes. The cohort consisted of 32 men and 16 women, with a median age of 58.5 years (range: 48–74 years). Samples were obtained through collaborating private clinical laboratories located in Goiás State and the Federal District, Brazil.
Peripheral blood samples were collected at the time of diagnosis or prior to the initiation of systemic therapy. All patients were treatment-naive at the time of sample collection and had not received chemotherapy or targeted therapy. Clinical and laboratory data were obtained at diagnosis to ensure that molecular and cytogenetic analyses reflected the baseline biological characteristics of the disease. Clinical staging according to the Rai classification system was available for the cohort, reflecting the clinical heterogeneity of the disease (Supplementary Table S1).
CLL diagnosis was established according to the International Workshop on Chronic Lymphocytic Leukemia (iwCLL) criteria [35], based on sustained peripheral blood lymphocytosis (≥5 × 10⁹/L), characteristic lymphocyte morphology, and immunophenotypic confirmation of clonal B cells expressing CD5, CD19, CD20, and CD23. Patients with a previous history of other hematological malignancies or hematologic disorders were excluded from the study. At diagnosis and sample collection, all patients exhibited sustained lymphocytosis fulfilling iwCLL criteria.
Based on diagnostic immunophenotyping routinely performed at the participating hospital, peripheral blood samples were characterized by a high tumor burden with a predominance of CD19+/CD5+ leukemic B cells. Although cell sorting was not performed prior to molecular analyses, the estimated proportion of clonal B cells within the peripheral blood mononuclear cell (PBMC) fraction was consistently high, with a median tumor cell content above 85% and frequently exceeding 90%, as inferred from absolute lymphocyte counts and the percentage of abnormal clones detected by FISH. Therefore, the PBMC fractions analyzed were largely enriched for leukemic B cells, minimizing potential confounding effects from non-malignant leukocyte populations.
All participants provided written informed consent in compliance with the Declaration of Helsinki. The study protocol was reviewed and approved by the institutional Research Ethics Board for studies involving human subjects (protocol no. 1243/2017). Given that CLL is a circulating B-cell malignancy characterized by peripheral blood expansion of clonal lymphocytes, the use of PBMCs in this cohort reflects the biological composition of the disease. The high leukemic cell burden minimizes potential confounding effects of non-malignant leukocyte subsets on telomere length and gene expression measurements.
4.2. Metaphase Induction and G-Banding Cytogenetic Analysis
Metaphase chromosome preparations were obtained from 1 × 10⁶ peripheral blood mononuclear cells (PBMCs) per sample. Cells were cultured in RPMI 1640 medium (Gibco; Thermo Fisher Scientific, Waltham, MA, USA) supplemented with 10% fetal calf serum (FCS; Gibco, Thermo Fisher Scientific). Mitotic stimulation was performed using the CpG-oligonucleotide DSP30 (TIB Molbiol, Berlin, Germany) in combination with recombinant human interleukin-2 (IL-2; PeproTech, Rocky Hill, NJ, USA) to enhance mitotic yield. Cultures were maintained at 37 °C in a humidified atmosphere with 5% CO2 for 72 h, after which colcemid (KaryoMAX™, Thermo Fisher Scientific) was added to arrest cells in metaphase.
Chromosome harvesting and slide preparation were carried out using standard cytogenetic protocols, including hypotonic treatment and methanol–acetic acid fixation. G-banding was performed by trypsin–Giemsa staining, and karyotypes were described according to the International System for Human Cytogenomic Nomenclature (ISCN 2020) [36]. Metaphases were analyzed using an Axio Imager M1 microscope (Carl Zeiss, Oberkochen, Germany) equipped with digital image acquisition and karyotyping software (ISIS, version 6.3, MetaSystems, Altlussheim, Germany), achieving an average resolution of approximately 450 bands per haploid set. For each sample, a minimum of 20 metaphases was evaluated to ensure cytogenetic reliability. Complex karyotype was defined according to established criteria as the presence of three or more chromosomal abnormalities within the same clone (ISCN 2020) [36].
4.3. Interphase Fluorescence In Situ Hybridization (FISH) Analysis
Interphase fluorescence in situ hybridization (FISH) analysis was performed to detect recurrent chromosomal abnormalities commonly observed in chronic lymphocytic leukemia (CLL). Commercially available locus-specific DNA probes were used to assess deletions of chromosome 13q14 (D13S319), 11q22–23 (ATM), and 17p13 (TP53), as well as trisomy 12 using a centromeric probe for chromosome 12 (D12Z1). All probes were obtained from Abbott Molecular/Vysis (Des Plaines, IL, USA) and applied according to the manufacturer’s instructions. FISH analyses were performed on interphase nuclei prepared from peripheral blood mononuclear cells (PBMCs). Hybridization signals were evaluated using a fluorescence microscope equipped with appropriate filter sets. For each probe, a minimum of 200 interphase nuclei were analyzed per sample. Cut-off values for positivity were established based on internal laboratory validation and manufacturer recommendations and were defined as >5% abnormal nuclei for deletion probes (13q14, ATM, TP53) and >3% abnormal nuclei for trisomy 12. FISH results were independently interpreted by two experienced cytogeneticists, and discrepancies were resolved by joint review. Final FISH findings were integrated with conventional G-banding results for cytogenetic risk stratification according to established Döhner criteria.
4.4. Gene Expressions of CHEK1 and CHEK2 Genes by qPCR
CHEK1 and CHEK2 gene expression levels were quantified in CLL PBMCs by reverse transcription quantitative PCR (RT–qPCR). PBMCs were isolated by density-gradient centrifugation using Ficoll-Paque™ PLUS (Cytiva, Uppsala, Sweden). Total RNA was extracted using the RNeasy Mini Kit (Qiagen, Hilden, Germany), including on-column DNase digestion with RNase-Free DNase Set (Qiagen) to remove residual genomic DNA. RNA concentration and purity were assessed by NanoDrop™ spectrophotometry (Thermo Fisher Scientific, Waltham, MA, USA), and RNA integrity was evaluated by agarose gel electrophoresis. Only samples with A260/A280 ratios between 1.8 and 2.1 were included. RNA was stored at −80 °C until use.
Complementary DNA (cDNA) was synthesized from 0.5 to 1.0 µg of total RNA using the High-Capacity cDNA Reverse Transcription Kit (Applied Biosystems, Thermo Fisher Scientific, Foster City, CA, USA). Quantitative PCR was performed using PowerUp™ SYBR™ Green Master Mix on a QuantStudio™ 5 Real-Time PCR System (Applied Biosystems, Thermo Fisher Scientific). Gene-specific primers for CHEK1 and CHEK2 were designed to span exon–exon junctions when possible to avoid amplification of genomic DNA. The primer sequences used were as follows: CHEK1 forward 5′-AGCTGAAGAAGCAGCAGTTC-3′ and CHEK1 reverse 5′-TCTGGTGAAGTCCTCCTTCC-3′; CHEK2 forward 5′-GCAGACTTCTTCCTGCTGAA-3′ and CHEK2 reverse 5′-TGGGATGTCTTCTGCTTCTG-3′. Primer specificity was confirmed by melt-curve analysis and agarose gel electrophoresis, yielding a single specific amplicon of the expected size for each target gene. No amplification was detected in no-template or no–reverse transcription control reactions.
Gene expression levels were quantified using real-time quantitative PCR and normalized to the housekeeping gene GAPDH, which has been validated as a stable internal control in gene expression studies involving hematological malignancies and leukemia samples under comparable experimental conditions [37,38]. Relative expression levels were calculated using the comparative Ct (2−ΔΔCt) method. A pooled cDNA calibrator, generated by combining equal amounts of cDNA from all samples in the cohort, was included on each qPCR plate to minimize inter-run variability. All reactions were performed in technical triplicates, and both no-template and no–reverse transcription controls were included to monitor potential contamination and genomic DNA amplification. Samples displaying high replicate variability were reanalyzed to ensure data reliability. Amplification efficiencies for CHEK1, CHEK2, and GAPDH ranged from 92% to 105%, with correlation coefficients (R2) exceeding 0.98.
4.5. Telomere Length Analysis by qPCR
Relative telomere length was determined by quantitative PCR using a well-established telomere-to-single-copy gene (T/S) ratio method. Genomic DNA was extracted from PBMCs using a silica-membrane-based commercial kit (Qiagen, Hilden, Germany). DNA concentration and purity were assessed using NanoDrop™ spectrophotometry (Thermo Fisher Scientific, Waltham, MA, USA), and all samples were diluted to a uniform working concentration in nuclease-free water and stored at −20 °C until analysis.
Telomeric repeat amplification and single-copy gene amplification were performed using validated primer sets. The single-copy reference gene used was 36B4 (RPLP0). qPCR reactions were carried out on a QuantStudio™ 5 Real-Time PCR System using SYBR™ Green PCR Master Mix (Applied Biosystems™, Thermo Fisher Scientific, Waltham, MA, USA). Each sample was analyzed in triplicate for both telomere and single-copy gene reactions. A pooled genomic DNA sample was used as a calibrator across all plates, and no-template controls were included to monitor contamination.
Relative telomere length was calculated using the ΔΔCt method and expressed as a T/S ratio (2−ΔΔCt). Intra-assay and inter-assay variability were monitored by repeated analysis of the calibrator DNA, with coefficients of variation consistently below 10%. Samples exhibiting high intra-assay variability were reanalyzed to ensure reproducibility and accuracy.
Standard curves for telomere and 36B4 amplification were generated using five serial 1:5 dilutions of pooled genomic DNA to validate assay performance. Amplification efficiencies ranged between 95% and 102%, with correlation coefficients (R2) consistently above 0.99. All analyzed samples exhibited Ct values within the established linear dynamic range of the standard curves. Melt curve analysis confirmed single, specific amplification products for both telomere and 36B4 reactions, with no evidence of primer-dimer formation.
4.6. Statistical Analysis
Statistical analyses were performed using GraphPad Prism (version 8; GraphPad Software, San Diego, CA, USA). Data distribution was assessed using the Shapiro–Wilk normality test. As most variables did not follow a normal distribution, nonparametric statistical tests were applied throughout the analysis.
Comparisons of telomere length, CHEK1 expression, CHEK2 expression, and the CHEK1/CHEK2 expression ratio among cytogenetic risk groups (favorable, intermediate, and high risk) were performed using the Kruskal–Wallis test. When statistically significant differences were observed, Dunn’s multiple-comparison post hoc test was applied to identify pairwise differences between groups.
Associations between cytogenetic risk, ranked according to the Döhner classification, and telomere length were evaluated using Spearman’s rank correlation coefficient (ρ). Correlation analyses were conducted across the entire cohort rather than within individual cytogenetic subgroups.
Continuous variables are presented as mean ± standard deviation (SD), unless otherwise stated. Categorical variables are expressed as absolute numbers and percentages. All statistical tests were two-tailed, and a p-value < 0.05 was considered statistically significant.
Supplementary Materials
The following supporting information can be downloaded at: https://www.mdpi.com/article/10.3390/kinasesphosphatases4020009/s1, Table S1: Clinical characteristics and Rai staging distribution of the CLL cohort.
Author Contributions
F.M.d.O. conceived and designed the study, supervised data analysis and interpretation, and drafted the manuscript. F.M.d.O. also performed cytogenetic analyses, including metaphase preparation, G-banding, and karyotype interpretation. F.S.L.N., E.V.F. and M.B. carried out molecular experiments, including RNA extraction, RT–qPCR assays for CHEK1 and CHEK2, and telomere length measurements, and curated the resulting data. B.M.R.F. contributed clinical data, supported patient selection, and provided clinical interpretation of the findings. All authors have read and agreed to the published version of the manuscript.
Funding
This research received no external funding.
Institutional Review Board Statement
The study was approved by the Ethics Committee of the Federal University (protocol no. 1243/2017, Approval date: 4 September 2017).
Informed Consent Statement
Written informed consent was obtained from all patients.
Data Availability Statement
The raw data generated and/or analyzed during the current study are not publicly available due to ethical and confidentiality restrictions imposed by the research ethics committee. The data includes sensitive and potentially identifiable information from participants, and even with anonymization, there is a risk of compromising their privacy. However, the datasets may be made available from the corresponding author upon reasonable request and pending approval by the ethics committee.
Acknowledgments
We are thankful to the Research group in Molecular Epidemiology (EPIMOL), CNPq, Brazil, and the Genomic Medicine Study Group (GMEG).
Conflicts of Interest
The authors declare no commercial or financial relationships that could be construed as a potential conflict of interest. All data analysis, and interpretation were independently performed by the research team at the Federal University of Jataí.
References
- Hallek, M. Chronic lymphocytic leukemia: 2025 update on diagnosis, risk stratification and treatment. Am. J. Hematol. 2025, 100, 450–480. [Google Scholar] [CrossRef] [Scilit] [PubMed]
- Baliakas, P.; Espinet, B.; Mellink, C.; Jarosova, M.; Athanasiadou, A.; Ghia, P.; Kater, A.P.; Oscier, D.; Haferlach, C.; Stamatopoulos, K. Cytogenetics in Chronic Lymphocytic Leukemia: ERIC Perspectives and Recommendations. Hemasphere 2022, 6, e707. [Google Scholar] [CrossRef] [Scilit] [PubMed] [PubMed Central]
- Baliakas, P.; Jeromin, S.; Iskas, M.; Puiggros, A.; Plevova, K.; Nguyen-Khac, F.; Davis, Z.; Rigolin, G.M.; Visentin, A.; Xochelli, A.; et al. Cytogenetic complexity in chronic lymphocytic leukemia: Definitions, associations, and clinical impact. Blood 2019, 133, 1205–1216. [Google Scholar] [CrossRef] [Scilit] [PubMed]
- Jebaraj, B.M.C.; Stilgenbauer, S. Telomere dysfunction in chronic lymphocytic leukemia. Front. Oncol. 2021, 10, 612665. [Google Scholar] [CrossRef] [Scilit] [PubMed]
- Steinbrecher, D.; Jebaraj, B.M.C.; Schneider, C.; Edelmann, J.; Cymbalista, F.; Leblond, V.; Delmer, A.; Ibach, S.; Tausch, E.; Scheffold, A.; et al. Telomere length in poor-risk chronic lymphocytic leukemia. Leuk. Lymphoma 2018, 59, 1126–1133. [Google Scholar] [CrossRef] [Scilit] [PubMed]
- Rampazzo, E.; Bonaldi, L.; Trentin, L.; Visco, C.; Keppel, S.; Giunco, S.; Frezzato, F.; Facco, M.; Novella, E.; Giaretta, I.; et al. Telomere length and telomerase levels delineate subgroups of B-cell chronic lymphocytic leukemia with different biological characteristics and clinical outcomes. Haematologica 2012, 97, 56–63. [Google Scholar] [CrossRef] [Scilit] [PubMed] [PubMed Central]
- Rossi, D.; Gaidano, G. Telomere length as a prognostic factor in chronic lymphocytic leukemia. Leukemia 2009, 23, 1144–1147. [Google Scholar] [CrossRef] [Scilit] [PubMed]
- Lin, T.T.; Norris, K.; Heppel, N.H.; Pratt, G.; Allan, J.M.; Allsup, D.J.; Bailey, J.; Cawkwell, L.; Hills, R.; Grimstead, J.W.; et al. Telomere dysfunction accurately predicts clinical outcome in chronic lymphocytic leukaemia, even in patients with early stage disease. Br. J. Haematol. 2014, 167, 214–223. [Google Scholar] [CrossRef] [Scilit] [PubMed]
- Boudny, M.; Zemanova, J.; Khirsariya, P.; Borsky, M.; Verner, J.; Cerna, J.; Oltova, A.; Seda, V.; Mraz, M.; Jaros, J.; et al. Novel CHK1 inhibitor MU380 exhibits single-agent activity in TP53-mutated chronic lymphocytic leukemia cells. Haematologica 2019, 104, 2443–2455. [Google Scholar] [CrossRef] [Scilit] [PubMed]
- Zemanova, J.; Hylse, O.; Collakova, J.; Vesely, P.; Oltova, A.; Borsky, M.; Zaprazna, K.; Kasparkova, M.; Janovska, P.; Verner, J.; et al. Chk1 inhibition significantly potentiates nucleoside analog activity in TP53-mutated B-lymphoid cells. Oncotarget 2016, 7, 62091–62106. [Google Scholar] [CrossRef] [Scilit] [PubMed]
- Stracker, T.H.; Usui, T.; Petrini, J.H.J. The checkpoint effector kinases Chk1 and Chk2 and the DNA damage response. DNA Repair 2009, 8, 1047–1054. [Google Scholar] [CrossRef] [Scilit] [PubMed]
- Smith, H.L.; Southgate, H.; Tweddle, D.A.; Curtin, N.J. DNA damage checkpoint kinases in cancer. Expert Rev. Mol. Med. 2020, 22, e2. [Google Scholar] [CrossRef] [Scilit] [PubMed]
- Rudd, M.F.; Sellick, G.S.; Webb, E.L.; Catovsky, D. Variants in the ATM–BRCA2–CHEK2 axis predispose to chronic lymphocytic leukemia. Blood 2006, 108, 638–644. [Google Scholar] [CrossRef] [Scilit] [PubMed]
- Juliusson, G.; Oscier, D.G.; Fitchett, M.; Ross, F.M.; Stockdill, G.; Mackie, M.J.; Parker, A.C.; Castoldi, G.L.; Cuneo, A.; Knuutila, S.; et al. Prognostic subgroups in chronic lymphocytic leukemia defined by specific chromosomal abnormalities. N. Engl. J. Med. 1990, 323, 720–724. [Google Scholar] [CrossRef] [Scilit] [PubMed]
- Döhner, H.; Stilgenbauer, S.; Benner, A.; Leupolt, E.; Kröber, A.; Bullinger, L.; Döhner, K.; Bentz, M.; Lichter, P. Genomic aberrations and survival in chronic lymphocytic leukemia. N. Engl. J. Med. 2000, 343, 1910–1916. [Google Scholar] [CrossRef] [Scilit] [PubMed]
- Griffen, T.L.; Hoff, F.W.; Qiu, Y.; Burger, J.; Wierda, W.; Kornblau, S.M. Prognostication of DNA Damage Response Protein Expression Patterns in Chronic Lymphocytic Leukemia. Int. J. Mol. Sci. 2023, 24, 5481. [Google Scholar] [CrossRef] [Scilit] [PubMed]
- Turk, A.; Čeh, E.; Calin, G.A.; Kunej, T. Multiple omics levels of chronic lymphocytic leukemia. Cell Death Discov. 2024, 10, 293. [Google Scholar] [CrossRef] [Scilit]
- Landau, D.A.; Tausch, E.; Taylor-Weiner, A.N.; Stewart, C.; Reiter, J.G.; Bahlo, J.; Kluth, S.; Bozic, I.; Lawrence, M.; Böttcher, S.; et al. Mutations driving chronic lymphocytic leukemia and their evolution in progression and relapse. Nature 2015, 526, 525–530. [Google Scholar] [CrossRef] [Scilit] [PubMed]
- Visentin, A.; Bonaldi, L.; Rigolin, G.M.; Mauro, F.R.; Martines, A.; Frezzato, F.; Pravato, S.; Gargarella, L.R.; Bardi, M.A.; Cavallari, M.; et al. The complex karyotype landscape in chronic lymphocytic leukemia allows refinement of Richter syndrome risk. Haematologica 2022, 107, 585–592. [Google Scholar] [CrossRef] [Scilit] [PubMed]
- Ramos-Campoy, S.; Puiggros, A.; Beà, S.; Bougeon, S.; Larráyoz, M.J.; Costa, D.; Parker, H.; Rigolin, G.M.; Ortega, M.; Blanco, M.L.; et al. Chromosome banding analysis and genomic microarrays for genomic complexity stratification in CLL. Haematologica 2022, 107, 593–603. [Google Scholar] [CrossRef] [Scilit] [PubMed]
- Knisbacher, B.A.; Lin, Z.; Hahn, C.K.; Nadeu, F.; Duran-Ferrer, M.; Stevenson, K.E.; Tausch, E.; Delgado, J.; Barbera-Mourelle, A.; Taylor-Weiner, A.; et al. Molecular map of chronic lymphocytic leukemia and its impact on outcome. Nat. Genet. 2022, 54, 1664–1674. [Google Scholar] [CrossRef] [Scilit] [PubMed]
- Robbe, P.; Ridout, K.E.; Vavoulis, D.V.; Dréau, H.; Kinnersley, B.; Denny, N.; Chubb, D.; Appleby, N.; Cutts, A.; Cornish, A.J.; et al. Whole-genome sequencing identifies CLL subgroups with distinct biology. Nat. Genet. 2022, 54, 1675–1689. [Google Scholar] [CrossRef] [Scilit] [PubMed]
- Hallek, M.; Al-Sawaf, O. Chronic lymphocytic leukemia: 2022 update on diagnostic and therapeutic procedures. Am. J. Hematol. 2021, 96, 1679–1705. [Google Scholar] [CrossRef] [Scilit] [PubMed]
- Pepper, A.G.S.; Zucchetto, A.; Norris, K.; Tissino, E.; Polesel, J.; Soe, Z.; Allsup, D.; Hockaday, A.; Ow, P.L.; Hillmen, P.; et al. Combined analysis of IGHV mutations, telomere length and CD49d identifies long-term survivors in CLL. Leukemia 2022, 36, 271–274. [Google Scholar] [CrossRef] [Scilit] [PubMed]
- Zavacka, K.; Plevova, K. Chromothripsis in chronic lymphocytic leukemia: A driving force of genome instability. Front. Oncol. 2021, 11, 771664. [Google Scholar] [CrossRef] [Scilit] [PubMed]
- Braish, J.; McCarthy, H.; Burger, J.A. An overview of prognostic markers in patients with CLL. Front. Oncol. 2024, 14, 1371057. [Google Scholar] [CrossRef] [Scilit] [PubMed] [PubMed Central]
- De Mel, S.; Lee, A.R.; Tan, J.H.I.; Tan, R.Z.Y.; Poon, L.M.; Chan, E.; Lee, J.; Chee, Y.L.; Lakshminarasappa, S.R.; Jaynes, P.W.; et al. Targeting the DNA damage response in hematological malignancies. Front. Oncol. 2024, 14, 1307839. [Google Scholar] [CrossRef] [Scilit] [PubMed]
- Parry, E.M.; Ten Hacken, E.; Wu, C.J. Richter syndrome: Novel insights into the biology of transformation. Blood 2023, 142, 11–22. [Google Scholar] [CrossRef] [Scilit] [PubMed]
- de Campos, C.B.; McCabe, C.E.; Bruins, L.A.; O’Brien, D.R.; Brown, S.; Tschumper, R.C.; Allmer, C.; Zhu, Y.X.; Rabe, K.G.; Parikh, S.A.; et al. Genomic characterization of chronic lymphocytic leukemia in patients of African ancestry. Blood Cancer J. 2025, 15, 14. [Google Scholar] [CrossRef] [Scilit] [PubMed]
- da Costa, A.A.B.A.; Chowdhury, D.; Shapiro, G.I.; D’Andrea, A.D.; Konstantinopoulos, P.A. Targeting replication stress in cancer therapy. Nat. Rev. Drug Discov. 2023, 22, 38–58. [Google Scholar] [CrossRef] [Scilit] [PubMed]
- Li, Y.; Chen, J.; Sun, T.; Chen, Y.; Fu, R.; Liu, X.; Xue, F.; Liu, W.; Ju, M.; Dai, X.; et al. Genetically determined telomere length and risk for hematologic diseases. Blood Cancer J. 2024, 14, 48. [Google Scholar] [CrossRef] [Scilit] [PubMed]
- Boudny, M.; Trbusek, M. ATR-CHK1 pathway as a therapeutic target for acute and chronic leukemias. Cancer Treat. Rev. 2020, 88, 102026. [Google Scholar] [CrossRef] [Scilit] [PubMed]
- Wang, Y.; Liu, Q.; Liang, S.; Yao, M.; Zheng, H.; Hu, D.; Wang, Y. Genetically predicted telomere length and risk of hematological diseases. Aging 2024, 16, 4270–4281. [Google Scholar] [CrossRef] [Scilit] [PubMed]
- Federica, G.; Michela, C.; Giovanna, D. Targeting the DNA damage response in cancer. MedComm 2024, 5, e788. [Google Scholar] [CrossRef] [Scilit] [PubMed]
- Hallek, M.; Cheson, B.D.; Catovsky, D.; Caligaris-Cappio, F.; Dighiero, G.; Döhner, H.; Hillmen, P.; Keating, M.; Montserrat, E.; Chiorazzi, N.; et al. iwCLL guidelines for diagnosis, indications for treatment, response assessment, and supportive management of CLL. Blood 2018, 131, 2745–2760. [Google Scholar] [CrossRef] [Scilit] [PubMed]
- McGowan-Jordan, J.; Simons, A.; Schmid, M. (Eds.) ISCN 2020: An International System for Human Cytogenomic Nomenclature; Karger: Basel, Switzerland, 2020. [Google Scholar] [CrossRef] [Scilit]
- Gupta, D.G.; Varma, N.; Sreedharanunni, S.; Abdulkadir, S.A.; Naseem, S.; Sachdeva, M.U.S.; Binota, J.; Bose, P.; Malhotra, P.; Khadwal, A.; et al. Evaluation of adverse prognostic gene alterations & MRD positivity in BCR::ABL1-like B-lineage acute lymphoblastic leukaemia patients, in a resource-constrained setting. Br. J. Cancer. 2023, 129, 143–152. [Google Scholar] [CrossRef] [Scilit]
- Gupta, D.G.; Varma, N.; Kumar, A.; Naseem, S.; Sachdeva, M.U.S.; Bose, P.; Binota, J.; Gupta, M.; Sonam, P.; Rana, P.; et al. Identification and validation of suitable housekeeping genes for gene expression studies in BCR-ABL1 positive B-lineage acute lymphoblastic leukemia. Mol. Biol. Rep. 2022, 49, 4841–4848. [Google Scholar] [CrossRef] [Scilit]

Disclaimer/Publisher’s Note: The statements, opinions and data contained in all publications are solely those of the individual author(s) and contributor(s) and not of MDPI and/or the editor(s). MDPI and/or the editor(s) disclaim responsibility for any injury to people or property resulting from any ideas, methods, instructions or products referred to in the content. |
© 2026 by the authors. Licensee MDPI, Basel, Switzerland. This article is an open access article distributed under the terms and conditions of the Creative Commons Attribution (CC BY) license.