


Highlights
Main findings:
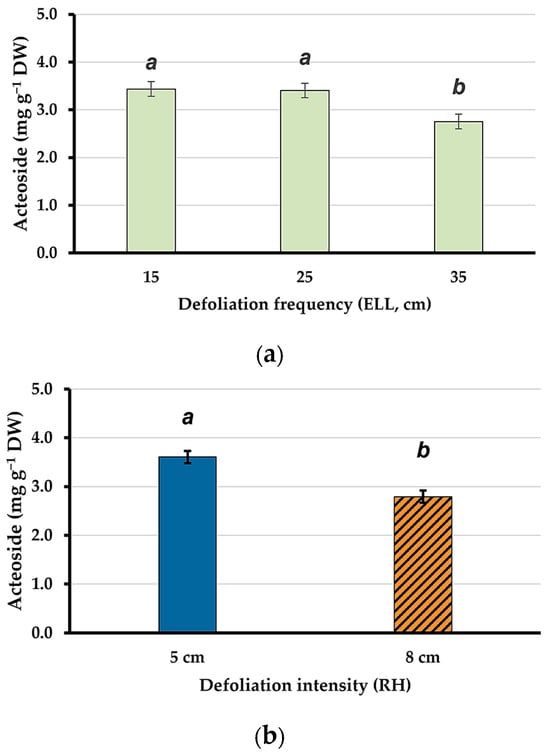
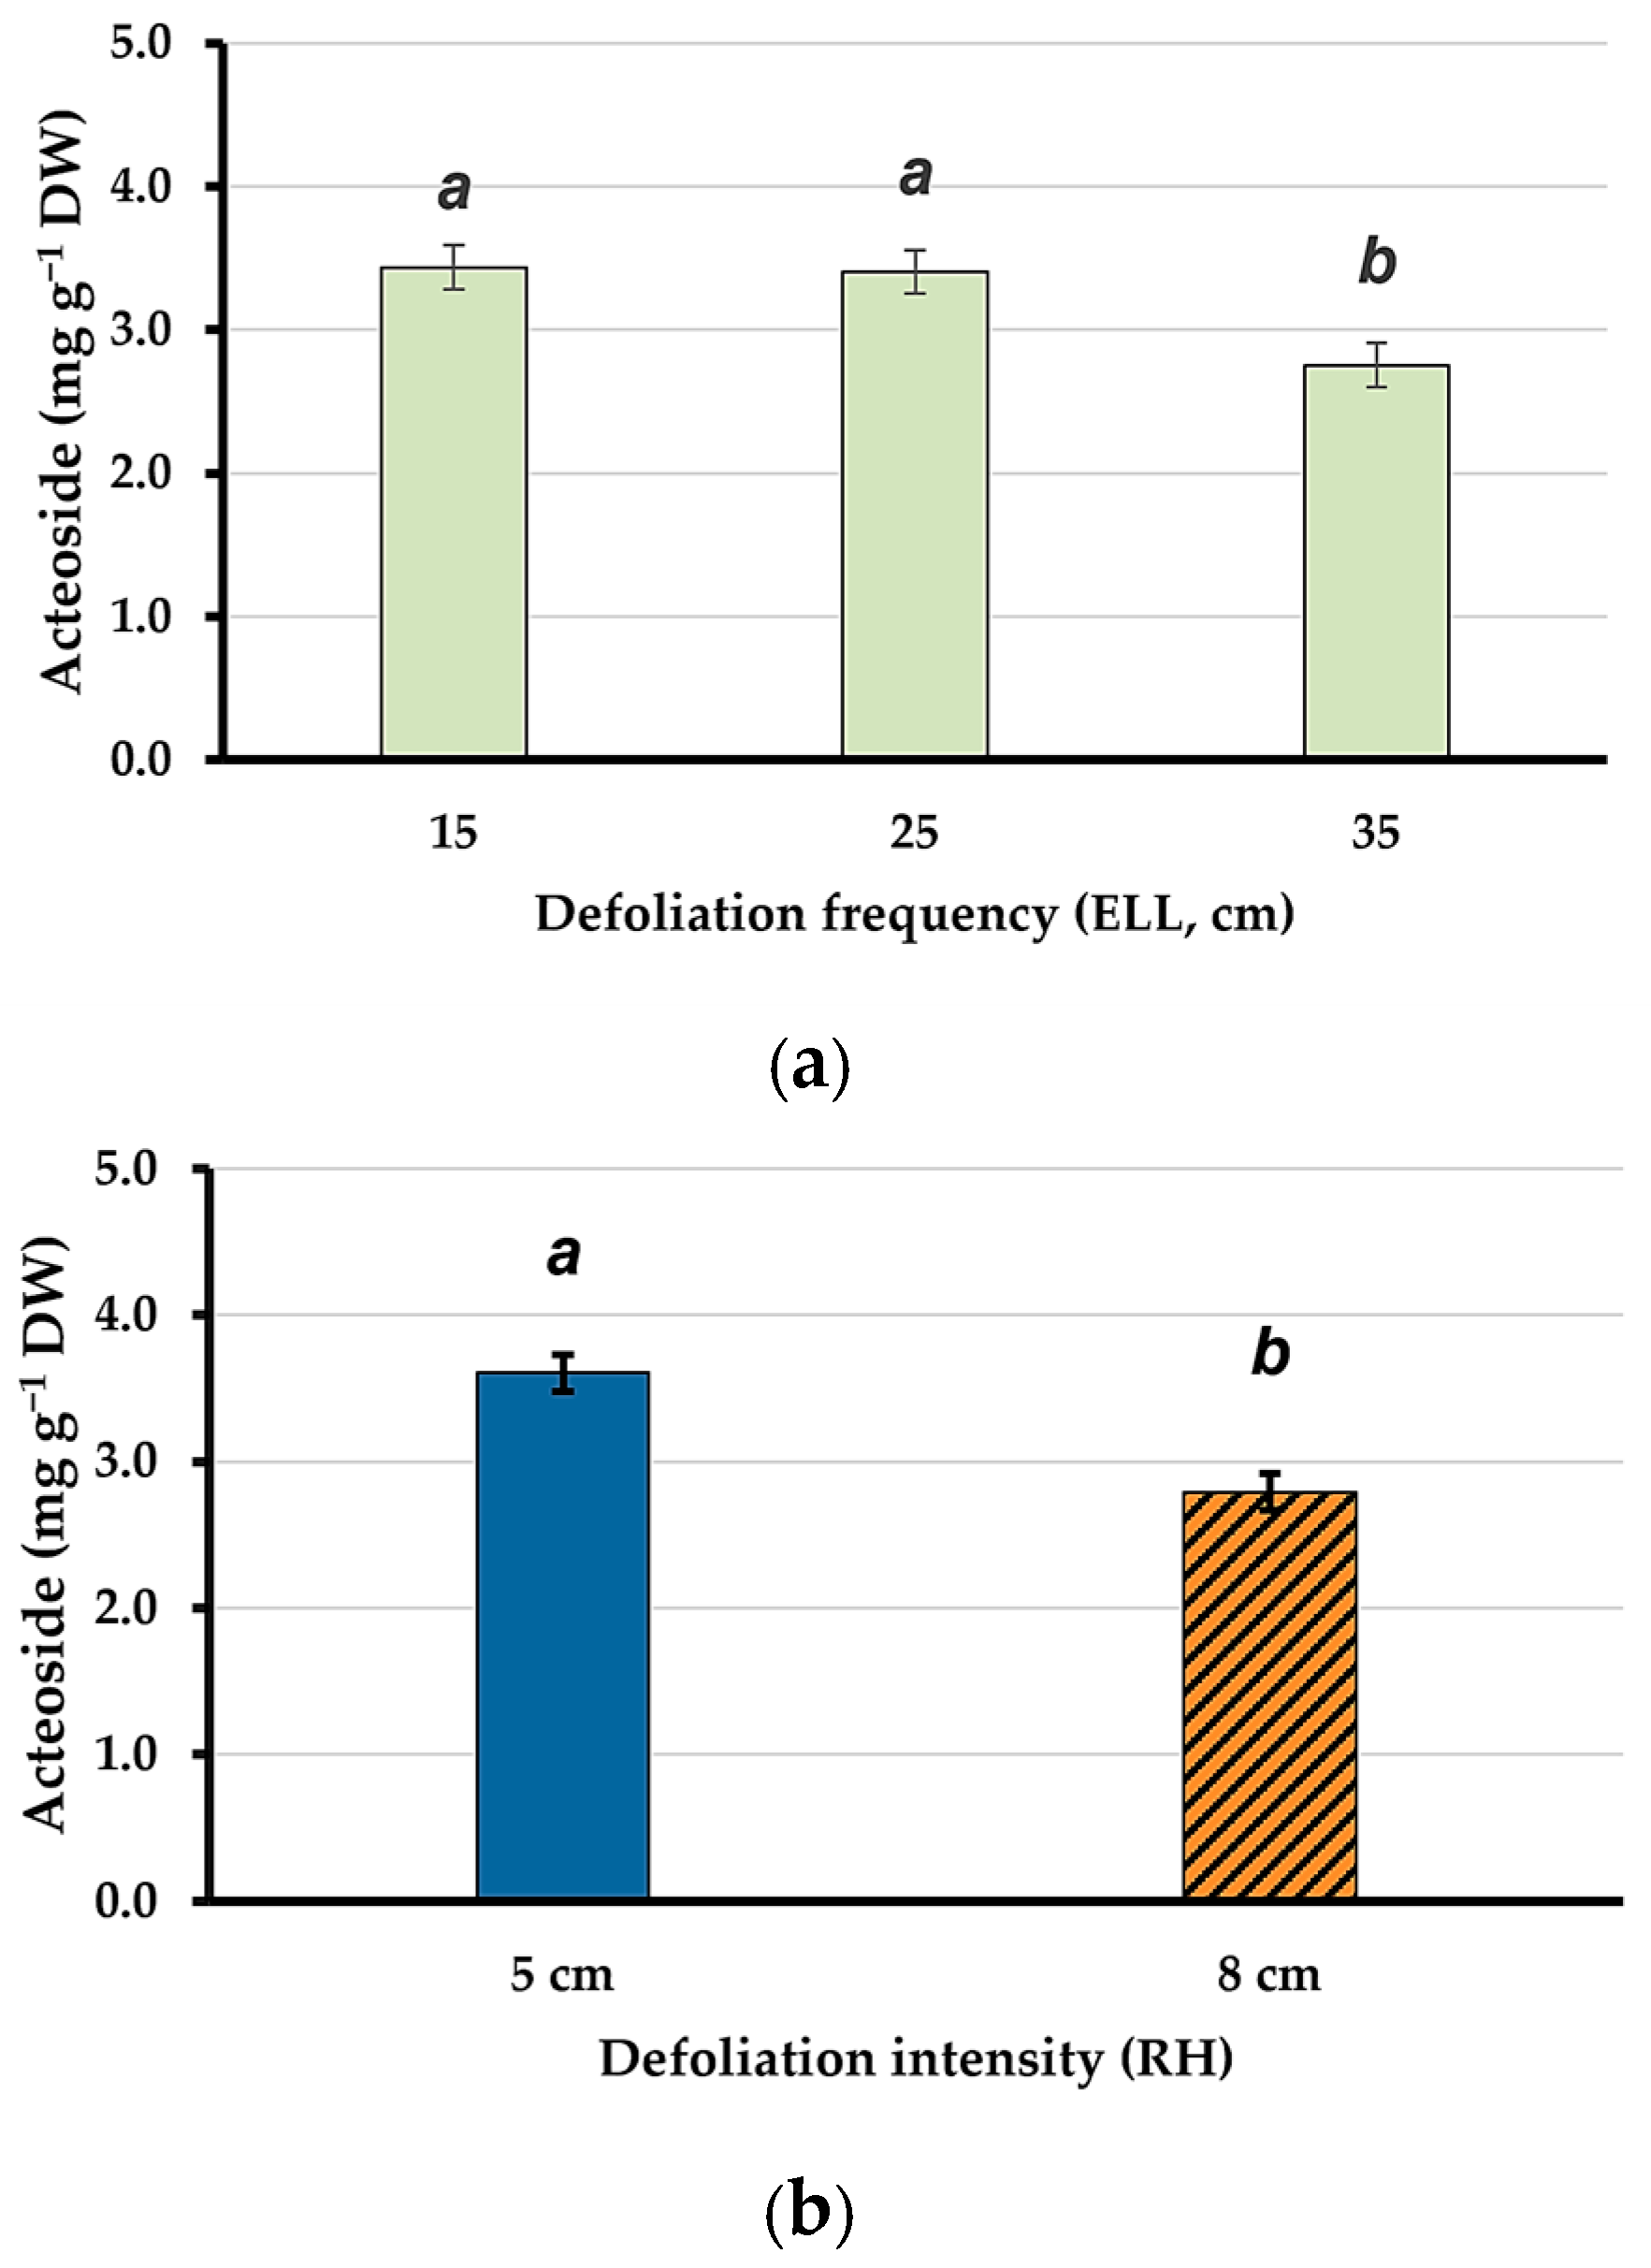
- More intense defoliation (5 vs. 8 cm residual height, RH) increased antioxidant activity (43.0 vs. 30.3%) and acteoside concentration (3.61 vs. 2.79 mg g−1 dry weight, DW). Catalpol was similar among treatments (averaged 18.6 mg g−1 DW). Acteoside was lower at 35 cm extended leaf length (ELL) than at 15–25 cm ELL (2.75 vs. 3.42 mg g−1 DW).
- Aerial and root water-soluble carbohydrate (WSC) content per plant increased under less frequent defoliation (35 cm ELL), mainly owing to greater organ dry mass. Root low-molecular-weight WSC was also higher at 8 than at 5 cm RH (0.82 vs. 0.57 mg plant−1).
Implications:
- Grazing management based on the extended leaf length and post-grazing residual height could help to balance acteoside concentration, antioxidant activity and WSC reserves of P. lanceolata-based pastures, once validated under grazing and in ruminant feeding trials.
Abstract
Plantago lanceolata L. is a herb with diverse pharmacological properties attributed to its rich phytochemical composition, including iridoids, flavonoids, caffeic acid derivatives, and polyphenols with significant antioxidant potential. This study investigated how defoliation frequency (extended leaf length, ELL: 15, 25, and 35 cm) and intensity (residual height, RH: 5 and 8 cm) affect bioactive compound content and antioxidant activity in P. lanceolata extracts. Six defoliation combinations were evaluated in a 3 × 2 factorial arrangement (three pots per combination; n = 18 pots). Total phenolic content (TPC), antioxidant activity (DPPH radical scavenging), lipid content, the iridoids aucubin (AU) and catalpol (CAT), and the phenylpropanoid glycoside acteoside (AC) were determined in the aerial biomass, and high- and low-molecular-weight water-soluble carbohydrate (WSC) content in the aerial and root biomass. Functional group profiling was performed using Fourier transform infrared (FT-IR) spectroscopy; lipophilic compounds were putatively identified by gas chromatography–mass spectrometry (GC-MS) in pooled samples; and AU, CAT, and AC were quantified by high-performance liquid chromatography (HPLC). Total phenolic content depended on the ELL × RH interaction, while antioxidant activity was higher at 5 cm than at 8 cm RH (43.0 vs. 30.3%). Lipid content was not significantly affected by defoliation. GC-MS profiles were dominated by n-alkanes; putative neophytadiene exceeded the reporting threshold only at 15 cm ELL/5 cm RH, and tentatively identified α-tocospiro compounds (α-tocopherol oxidation products) showed their highest relative abundance at 35 cm ELL. Among the targeted bioactive compounds, acteoside was higher under the more frequent defoliations (15 and 25 cm ELL) and at 5 cm RH, catalpol remained unchanged across treatments, and aucubin was below the limit of quantification. High- and low-molecular-weight WSC contents in the aerial and root biomass accumulated most under the less frequent (25 and 35 cm ELL) defoliation regimes, driven mainly by greater herbage and root mass rather than by changes in concentration. Root low-molecular-weight WSC content was also higher at 8 than at 5 cm RH. Overall, more intense defoliation (5 cm RH) increased antioxidant activity and acteoside concentration, whereas less frequent defoliation increased WSC content, suggesting that defoliation management could be adjusted to balance the phytochemical quality and regrowth potential of P. lanceolata.
1. Introduction
Livestock production systems face the dual challenge of meeting growing global food demand while reducing environmental impact. Livestock supply chains account for approximately 14.5% of total anthropogenic greenhouse-gas emissions, and enteric methane is the largest single source among them [1], intensifying the search for sustainable nutritional strategies. Among the proposed solutions, the strategic incorporation of bioactive plant species into ruminant diets offers a promising alternative to modulate rumen fermentation and reduce methane emissions.
Plantago lanceolata L. (ribwort plantain), a perennial herbaceous species of the Plantaginaceae family, has garnered considerable scientific attention as a multifunctional forage plant. In temperate dairy systems, P. lanceolata is intentionally sown as a companion forage species in mixed perennial pastures, particularly in association with perennial ryegrass (Lolium perenne L.) and white clover (Trifolium repens L.), and can also be included in more diverse grass–legume–herb mixtures with chicory (Cichorium intybus L.) [2,3]. Studies have documented its potential to mitigate nitrogen losses in grazing systems [4], increase milk production, and reduce nitrogen excretion in dairy cows [5]. This species naturally synthesises a diverse array of bioactive compounds, including polyphenols with antioxidant activity [6], iridoid glycosides such as aucubin (AU) and catalpol (CAT), the phenylpropanoid glycoside acteoside (AC), and specific lipid fractions, which can modulate ruminal microbiome composition and reduce methanogenesis [7]. However, secondary metabolite biosynthesis in plants responds dynamically to environmental pressures and agronomic management [8]. Defoliation, a fundamental component of forage management in grazing systems, triggers complex physiological and biochemical responses [9]. Recent evidence shows that defoliation frequency and intensity substantially influence regrowth dynamics and resource allocation in P. lanceolata [10]. In particular, WSC reserves stored in aerial and root biomass constitute the carbon pool that sustains regrowth after defoliation, and their partitioning between organs shifts with defoliation frequency and intensity [10]. Despite these insights, how defoliation frequency and intensity affect bioactive compounds with antioxidant and potential methane-mitigating activity, and whether these responses are associated with WSC reserves, remain poorly characterised.
The present study was therefore designed to investigate the effects of defoliation frequency (extended leaf length, ELL: 15, 25, and 35 cm) and intensity (residual height, RH: 5 and 8 cm) on the biochemical composition and antioxidant capacity of P. lanceolata aerial biomass, as well as on the content of low- and high-molecular-weight WSC in both aerial biomass and roots. To assess the intrinsic response of the species to defoliation management, while minimising the effects of interspecific competition and environmental variability, pure stands of P. lanceolata were evaluated under controlled environmental conditions. We hypothesised that specific combinations of defoliation frequency and intensity would differentially enhance secondary metabolite biosynthesis and antioxidant activity while modulating WSC reserve accumulation in aerial biomass and root biomass.
2. Materials and Methods
2.1. Chemicals and Reagents
The reagents used in this study included 2,2-diphenyl-1-picrylhydrazyl (DPPH) and the Folin–Ciocalteu reagent, which were purchased from Sigma-Aldrich (St. Louis, MO, USA). All other chemicals and reagents used were of analytical grade, ensuring reliable, reproducible results. Extraction solvents for extraction processes were sourced from Merck (Darmstadt, Germany).
2.2. Plant Material and Experimental Site Conditions
Pure stands of Plantago lanceolata cv. ‘Ceres Tonic’ (four plants per pot) were grown for nine months in plastic pots (25 × 25 × 27 cm) under controlled environmental conditions, as described in detail by Merino et al. [10,11]. Relative humidity ranged from 45% to 70%. Day and night air temperatures were 26 °C and 16 °C, respectively. This range lies within the optimal range for the growth of temperate C3 forage species and was chosen to avoid thermal stress and to minimise temperature-driven variation among treatments [12]. Lighting conditions were regulated with a 14 h light/10 h dark photoperiod, using two 1000-W LED panels (30 × 50 cm, ECO LED-1000, ProGarden, Dongguan, China). The light spectrum consisted of 68% at 660 nm, 12% at 460 nm, 14% white light, 4% at 730 nm, and 2% at 410 nm. The combined output of the two panels was set by adjusting the distance between the panels and the pot surface so that photosynthetically active radiation (PAR) at canopy level reached 400 µmol m−2 s−1, measured with a quantum sensor (SQ-521, Apogee, Logan, UT, USA) [13].
2.3. Defoliation Frequencies, Intensities, and Experimental Design
The experiment followed a completely randomised design with six combinations of defoliation frequencies and intensities in a 3 × 2 factorial arrangement. The experimental factors consisted of three defoliation frequencies, defined by the time required for leaves to reach target lengths of 15, 25, and 35 cm (extended leaf length, ELL), and two defoliation intensities, corresponding to residual heights of 5 cm and 8 cm (RH). Each combination of defoliation frequency and intensity was replicated three times, for a total of 18 experimental units (pots).
The treatments were chosen to represent contrasting rotational grazing regimes of ruminants. Extended leaf lengths of 15, 25 and 35 cm represent short, intermediate and long intervals between grazing events (i.e., high, medium and low defoliation frequency), within the range of leaf lengths reached by P. lanceolata during regrowth [10,14]. In pure pastures of cv. ‘Ceres Tonic’, these leaf lengths corresponded to approximately 10–39 days between defoliations, and defoliation at 25 cm has been recommended to balance yield and nutritive value [10,11,15]. Residual heights of 5 and 8 cm correspond to hard and lax post-grazing residuals, respectively, and are within the range recommended for P. lanceolata-based pastures grazed by dairy cattle [4].
Defoliation began when all plants had developed at least six fully expanded leaves [16]. Before assigning defoliation frequencies and intensities, pots were standardised based on the number and height of mature leaves per plant to ensure uniform initial conditions. On average, each plant had 13.5 mature leaves with a mean leaf height of 22.4 cm. The pots were then randomly assigned to one of the six combinations of defoliation frequencies and intensities.
ELL was measured every three days on one randomly selected, fully expanded leaf per plant (12 leaves per combination, 72 in total), with a ruler from the leaf base to the apex. Once the average ELL reached the target length (15, 25, 35 cm) for each treatment, the herbage of each pot was harvested by cutting it to a residual height of either 5 or 8 cm using hand-shears.
2.4. Sample Preparation and Extraction
Following each defoliation event, harvested plant material was weighed immediately to determine fresh weight, then dried at 60 °C in a forced-air oven until a constant weight was achieved. Dried samples were ground to a fine powder using a mill and stored in sealed containers at room temperature in the dark until analysis. Specific extraction procedures for each analytical assay are described in their respective sections (Section 2.5, Section 2.6, Section 2.7, Section 2.8, Section 2.9, Section 2.10, Section 2.11 and Section 2.12), as each assay required different solvents, ratios, and extraction conditions to ensure optimal recovery of the target compounds. Composite samples (comprising all dried herbage harvested from each pot at its specific residual height across defoliation events) were used for chemical analysis. All assays were performed on this aerial biomass, except for the WSC content, which was additionally determined in roots.
2.5. Determination of Total Phenolic Content
Total phenolic content was determined using the Folin–Ciocalteu method with modifications. For each combination of defoliation frequency and intensity, 250 mg of dried and pulverised P. lanceolata aerial biomass was extracted with 1 mL of 80% methanol (MeOH) to obtain a 250 mg mL−1 stock extract. The reaction mixture consisted of 100 µL of extract, 700 µL of distilled water, 150 µL of 20% (w/v) anhydrous sodium carbonate (Na2CO3; Sigma-Aldrich, St. Louis, MO, USA) and 50 µL of Folin–Ciocalteu reagent (Sigma-Aldrich, St. Louis, MO, USA). The mixture was stirred and incubated at 4 °C in darkness for 2 h. Absorbance was measured at 760 nm using a UV–visible spectrophotometer (SHIMADZU UV MINI-1240, Duisburg, Germany). The blank contained all reagents, with the extract replaced by 80% methanol. Samples from each combination of defoliation frequency and intensity were analysed in triplicate. Total phenolic content was quantified from a standard curve prepared with gallic acid (Sigma-Aldrich, St. Louis, MO, USA) and expressed as gallic acid equivalents (mg GAE g−1 DW) [17].
2.6. Antioxidant Activity Assay—DPPH Radical Scavenging
The antioxidant and radical-scavenging activities of P. lanceolata extracts were evaluated using the DPPH free radical method [18]. The stock solution previously prepared for total phenolic content determination was used to prepare serial dilutions in 80% MeOH, yielding final concentrations of 1, 0.5, 0.25, 0.125, 0.0625, and 0.03125 mg mL−1. This concentration range was used to verify the linear range of radical-scavenging response, and 1 mg mL−1 was selected as the working concentration for comparing antioxidant activity (AA%) among defoliation treatments.
A DPPH stock solution was prepared at 1.27 mM in 80% methanol and stored in the dark at 4 °C. For the assay, 200 µL of each sample dilution was mixed with 1000 µL of the working DPPH solution in a quartz cuvette. The initial absorbance was measured immediately at 517 nm using the same UV–visible spectrophotometer (SHIMADZU UV MINI-1240, Duisburg, Germany). After a 30 min incubation period in darkness at room temperature, absorbance was measured again at the same wavelength, with 1200 µL of 80% methanol as the blank.
The percentage of DPPH radical inhibition was calculated using the following equation:
where Abs0 denotes the absorbance at 0 min and Abs30 the absorbance after the 30 min reaction period. Antioxidant activity was expressed as the percentage of DPPH radical-scavenging activity at an extract concentration of 1 mg mL−1. All assays were conducted in triplicate (three technical replicates, averaged prior to analysis).
% Inhibition = [(Abs0 − Abs30)/Abs0] × 100
2.7. Determination of Lipid Content
Lipid content was determined using the Folch method [19], which is widely recognised for its effectiveness in extracting lipids from biological samples. For the assay, 200 mg of dried biomass was used, and a chloroform–methanol (2:1; Sigma-Aldrich, St. Louis, MO, USA) solvent mixture was prepared, with 0.01% butylhydroxytoluene (BHT) added as an antioxidant to prevent lipid oxidation during extraction.
The solution was homogenised thoroughly, after which 2 mL of 0.88% potassium chloride (KCl) was added to facilitate phase separation. The mixture was centrifuged at 2000 rpm for 5 min, forming two distinct phases. The upper phase, containing methanol and water, was discarded, while the lower phase, containing lipids, was collected and filtered to remove particulate matter. The lipid solution was cooled to −20 °C for at least 20 min, and the thin salt layer that formed on the surface was carefully removed. Lipids were then weighed and stored under a nitrogen atmosphere to prevent oxidation. Each sample was analysed in triplicate (three technical replicates, averaged before statistical analysis).
Lipid content was calculated as:
Lipids (%) = [Lipids (g)/Biomass (g DW)] × 100
2.8. Extraction and Identification of Bioactive Compounds by Gas Chromatography–Mass Spectrometry (GC-MS)
2.8.1. Sample Pooling and Extraction for GC-MS
For each defoliation treatment, dried herbage samples from three independent biological replicates (pots) were combined in equal mass proportions (0.5 g per replicate, 2 g total composite sample) to generate a representative pooled sample. Pooled samples were extracted three times with chloroform:ethanol (1:1 v/v, 100 mL) for 72 h in the dark at room temperature. Combined extracts were filtered through Whatman No. 1 filter paper (Whatman Co., Maidstone, UK) and concentrated to dryness by rotary evaporation (Büchi RE111-011, Flawil, Switzerland) at 40 °C under reduced pressure. The dried extract residue was redissolved in n-hexane: ethyl acetate (1:1 v/v; HPLC grade, ≥99% purity, Merck, Darmstadt, Germany) at a concentration of 1 mg mL−1. Samples were stored at −20 °C in amber glass vials until analysis. Because the biological replicates were pooled, one composite sample per treatment was analysed (n = 1) with a single injection; GC-MS data were therefore not analysed statistically, and differences among treatments are described as differences in relative chromatographic abundance.
2.8.2. GC-MS Instrumentation and Conditions
Phytochemical screening was conducted using an Agilent Technologies 7890A GC System coupled to an Agilent Technologies 5975C inert Mass Selective Detector with Triple-Axis Detector (Agilent Technologies, Inc., Santa Clara, CA, USA). Sample injection (1 µL) was performed in splitless mode at 250 °C. Chromatographic separation was performed using an Agilent J&W HP-5MS capillary column (30 m × 0.25 mm i.d. × 0.25 µm film thickness) with helium as the carrier gas at a constant pressure of 15.95 psi. The oven temperature program consisted of an initial hold at 100 °C for 3 min, followed by a ramp to 280 °C at 10 °C/min, and a final hold at 280 °C for 20 min (total run time: 41 min). The mass spectrometer operated in electron ionisation (EI) mode at 70 eV, scanning m/z 50–900, with a solvent delay of 4 min. The MS source and quadrupole temperatures were 230 °C and 150 °C, respectively, and the transfer line was maintained at 285 °C.
2.8.3. Data Processing and Compound Identification
Chromatographic data processing used the RTE integrator (MSD ChemStation version E.02.02.1431, Agilent Technologies, Inc., Santa Clara, CA, USA) with the following parameters: data point sampling of 1; 5-point smoothing; detection thresholds of 0.200 (start) and 0.000 (stop); baseline reset at 5 points; minimum peak area of 2 counts; maximum of 200 peaks; and apex-based peak location. Compounds were putatively identified by comparison of their apex mass spectra with the NIST/EPA/NIH Mass Spectral Library (NIST 2017) [20] and were retained when the match quality was ≥80%; compounds with match quality between 55 and 79%, or with ambiguous library assignment, are reported as tentatively identified (‡). Because n-alkanes produce closely similar spectra, library assignment of chain length was not considered reliable; n-alkanes were therefore identified by their characteristic fragmentation (m/z 57, 71, 85), their molecular ions and their homologous elution pattern, using an n-tetracosane (C24) standard analysed under the same conditions as reference (†). Peaks corresponding to exogenous compounds, namely plasticisers and polymer additives (phthalates and tris(2,4-di-tert-butylphenyl) phosphate), column-bleed siloxanes and other non-plant contaminants, were excluded, and relative abundances were recalculated on the remaining chromatographic area (retention time ≥ 10 min). Compounds with a relative abundance < 0.5% were considered not detected (nd). Relative peak areas express relative chromatographic abundance and not absolute concentration.
2.9. Determination of Iridoids and Acteoside
Iridoids (CAT and AU) and acteoside (AC) were quantified using high-performance liquid chromatography (HPLC). Samples were extracted following the procedure described by Navarrete et al. [21], with minor modifications.
For each ground sample, a 0.1 g aliquot was extracted with 10 mL of methanol in a 15 mL centrifuge tube and stirred for 2 h at room temperature on an orbital shaker. After centrifugation, the supernatant was recovered. For CAT and AU determination, 2 mL of supernatant was diluted with 8 mL of Type I water and filtered through a 0.2 µm syringe filter (Whatman Co., Maidstone, UK); a 10 µL aliquot was injected into the HPLC. For AC determination, the supernatant was filtered directly through a 0.2 µm syringe filter without dilution, and a 10 µL aliquot was injected.
Separation was performed on a Hitachi Primaide HPLC-DAD system (Hitachi Technologies, Merck, Darmstadt, Germany) equipped with a Kromasil C18 reversed-phase column (250 × 4.6 mm, 5 µm particle size; Nouryon AB, Göteborg, Sweden). The mobile phases consisted of 2% acetonitrile in water for CAT and AU, and 29% methanol in water containing 1% formic acid for AC, at a flow rate of 1 mL min−1. Detection was performed at 204 nm for CAT and AU, and at 330 nm for AC [22]. Calibration was performed using commercial standards: catalpol and aucubin (Sigma-Aldrich, St. Louis, MO, USA) and acteoside (ChromaDex, Inc., Irvine, CA, USA). Each sample was analysed in triplicate (three technical replicates, averaged before statistical analysis), and results were expressed as milligrams of each metabolite per gram of dry weight (mg g−1 DW).
Detection limits (LOD) and quantification limits (LOQ) were calculated as 3·S(y/x)/m and 10·S(y/x)/m, respectively, from calibration curves constructed in their linear range (0–100 mg L−1 for catalpol and aucubin and 0–200 mg L−1 for acteoside; R2 ≥ 0.999), yielding LOQ values of 2.45, 4.44, and 11.67 mg L−1 for catalpol, aucubin, and acteoside, respectively. Catalpol and acteoside concentrations in the injected solutions were above their LOQ in all samples. Aucubin was detected in 87.5% of the herbage samples, but its concentration in the injected solutions was below the LOQ in all samples; aucubin is therefore reported as below the limit of quantification (<LOQ) and was not analysed statistically.
2.10. UV–Visible Spectroscopy for Phytochemical Fingerprinting
UV–visible absorption spectroscopy was employed as a qualitative fingerprint of the ethanolic extracts of aerial biomass. The ethanolic aerial-biomass extracts were subjected to UV-Vis scanning analysis using an Epoch microplate spectrophotometer (BioTek Instruments, Inc., Winooski, VT, USA). Before the analysis, the samples were diluted 30-fold (1:30, v/v) in ethanol at ambient temperature to ensure the absorbance values remained within the instrument’s linear detection range. The absorbance spectrum was recorded across a wavelength range of 200 to 700 nm at 10 nm intervals. Absorbance below ~300 nm was constrained by the UV cut-off of the polystyrene microplate and was therefore excluded from interpretation. Each extract was read in duplicate wells against a solvent blank, and the mean blank-corrected spectrum is shown. As one composite extract per treatment was analysed, spectra were interpreted qualitatively.
2.11. FT-IR Characterisation of Functional Groups in P. lanceolata Aerial Biomass Under Defoliation Treatments
Fourier transform infrared (FT-IR) spectroscopy was used to identify and compare characteristic functional groups associated with lipids (3000–2800 cm−1), proteins (1700–1500 cm−1), carbohydrates (1500–1200 cm−1), and cell wall components (1100–600 cm−1) across defoliation treatments. Samples for each defoliation combination were prepared by selecting and drying sufficient aerial-biomass material, which was then weighed, homogenised to a uniform particle size, and stored in a dry place until measurement. FT-IR spectra were recorded using a spectrophotometer equipped with a QATR 10 accessory (Shimadzu Corporation, Kyoto, Japan) in Attenuated Total Reflection (ATR) mode, which allows minimal sample preparation and high sensitivity for solid sample characterisation [23,24]. The instrument included a DLATGS detector and utilised LabSolutions IR software version 2.10 (Shimadzu Corporation, Kyoto, Japan). Spectra were acquired in the 400–4000 cm−1 range with a resolution of 4 cm−1, conducting 60 scans per spectrum. One composite sample per treatment was analysed and one spectrum was recorded per sample; FT-IR spectra were interpreted qualitatively.
2.12. Determination of High- and Low-Molecular-Weight Water-Soluble Carbohydrates (WSC) Contents
At 296 days after sowing, aerial biomass and root samples were collected from each pot, dried in a forced-air oven at 60 °C to constant weight (BOV V-125F, BioBase, Jinan, China), and ground to pass a 1-mm sieve. For each dried sample, 25 mg was used for WSC analysis. WSCs were extracted sequentially with 1 mL of 80% (v/v) ethanol followed by 1 mL of distilled water, following the protocol of Lee et al. [16]; the ethanol extract contained the low-molecular-weight WSC fraction (glucose, fructose, sucrose) and the aqueous extract the high-molecular-weight WSC fraction (mainly fructans); hereafter, these fractions are referred to as low-WSC and high-WSC, respectively. Each extraction was carried out for 30 min at 65 °C, after which samples were centrifuged at 16,000× g for 20 min at room temperature and the supernatants collected. Carbohydrate concentrations in both extracts were determined by the phenol–sulfuric acid method [25]. An aliquot of each extract was mixed with 5% (w/v) phenol and concentrated sulfuric acid (Merck, Darmstadt, Germany; CAS 7664-93-9), and absorbance was measured at 490 nm using a Synergy H1M microplate reader (BioTek Instruments, Inc., Winooski, VT, USA). Raffinose pentahydrate (≥99%; CAS 17629-30-0; Sigma-Aldrich, St. Louis, MO, USA) was used for the calibration curve, as raffinose is the principal WSC reserve of P. lanceolata [16]. Low- and high-WSC concentrations were calculated from the raffinose standard curve and multiplied by the total dry biomass of the corresponding organ (aerial biomass or root) to estimate the WSC content per plant. Results were expressed as milligrams of raffinose equivalents per plant (mg plant−1). Three technical replicates were analysed per biological sample, and their mean was used for statistical analysis.
2.13. Statistical Analysis
Statistical analyses were performed in R (version 4.1.2), with the pot as the experimental unit (n = 3 per treatment combination); technical replicates were averaged before analysis. Total phenolic content, AA%, lipid content and CAT and AC concentrations were analysed by two-way analysis of variance (ANOVA), with ELL, RH and their interaction effect as fixed factors. Normality of residuals and homogeneity of variances were verified with the Shapiro–Wilk and Levene’s tests, respectively. High- and low-WSC contents were analysed with generalised linear models (GLMs) with a log-link function and the same fixed factors, because their residuals did not meet the assumptions of normality and homoscedasticity. For these variables, the error distribution (Gaussian or Gamma) was selected by comparing Akaike information criterion (AIC) values and checking simulated residuals with the DHARMa package, and fixed effects were tested with Type II tests (car package). For all variables, when the ELL × RH interaction was significant (p < 0.05), only the interaction was interpreted and the six treatment combinations were compared; otherwise, the means of the significant main effects were compared. Means were separated with Fisher’s least significant difference (LSD) test; for the GLMs, comparisons were made on back-transformed estimated marginal means (emmeans and multcomp packages). Results are presented as means with the standard error of the mean (SEM). GC-MS, FT-IR and UV-Vis profiles, obtained from pooled samples, were interpreted descriptively.
3. Results
3.1. Total Phenolic Content, DPPH Radical-Scavenging Activity and Lipid Content
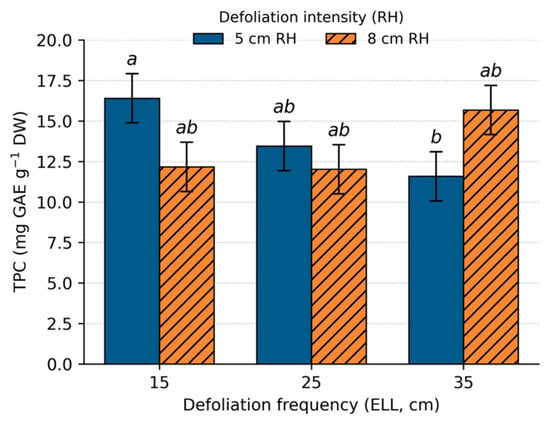
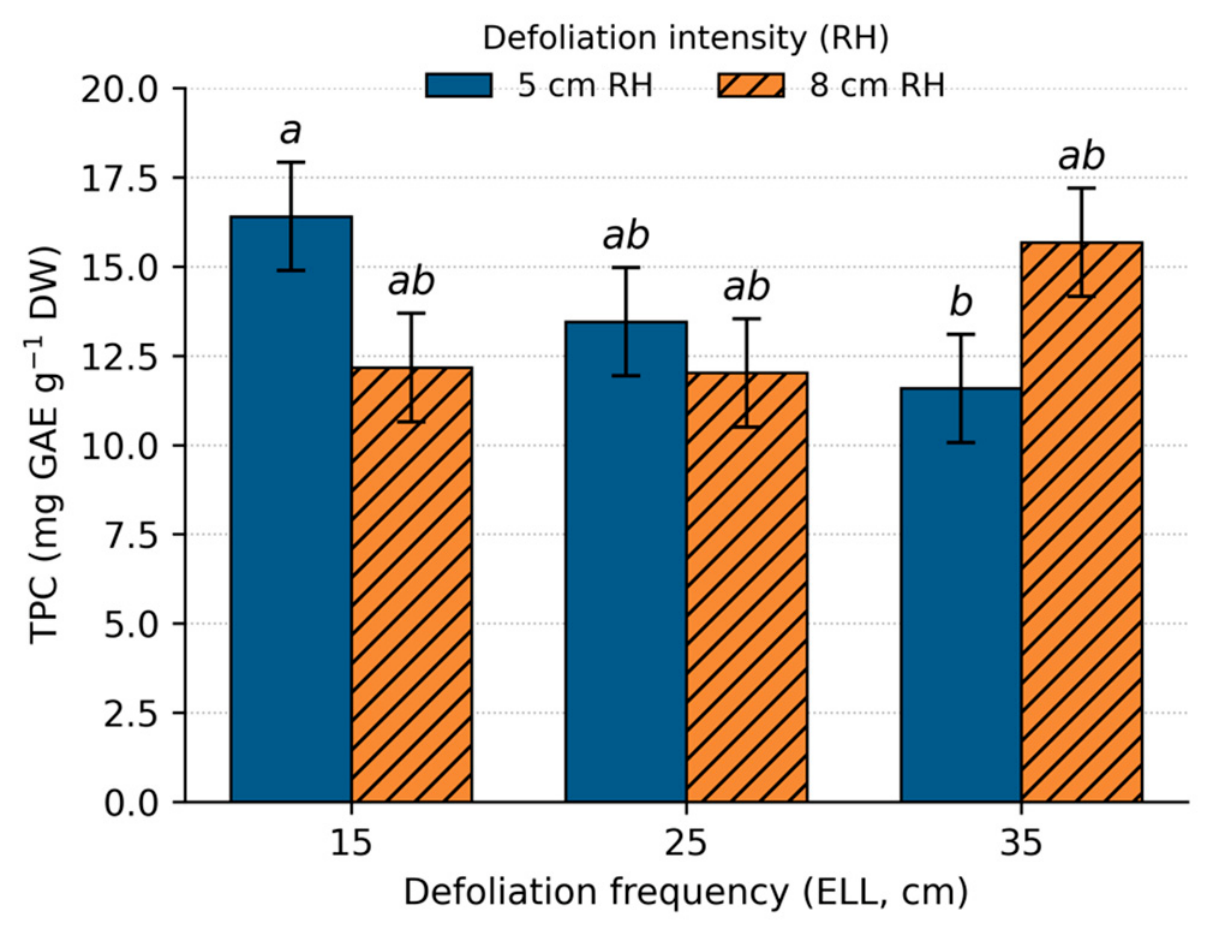
Antioxidant activity was significantly affected by RH (p = 0.0077) but not by ELL or the ELL × RH interaction (p > 0.05) (Table 1), with plants cut to 5 cm RH showing higher radical-scavenging activity than those cut to 8 cm RH. Total phenolic content was affected by the ELL × RH interaction (p = 0.0498); it was lowest at 35 cm ELL/5 cm RH (11.58 mg GAE g−1 DW) and highest at 15 cm ELL/5 cm RH (16.40 mg GAE g−1 DW), whereas the other four combinations did not differ from either extreme (Figure 1). Lipid content was not significantly affected by RH, ELL, or their interaction, and averaged 4.95% of DW (Table 1).
Table 1.
DPPH radical-scavenging activity (AA%, at 1 mg mL−1) and lipid content (% DW) of P. lanceolata under three defoliation frequencies (15, 25, and 35 cm ELL) and two intensities (5 and 8 cm RH).
Figure 1.
Interaction between defoliation frequency and intensity on total phenolic content (TPC) of Plantago lanceolata aerial biomass. Bars represent means (n = 3) and error bars the pooled standard error of the mean from the ANOVA. Different italicised letters indicate significant differences among treatment combinations according to Fisher’s LSD test (p < 0.05). ELL × RH interaction: p = 0.0498.
3.2. GC-MS Profile of Bioactive Compounds
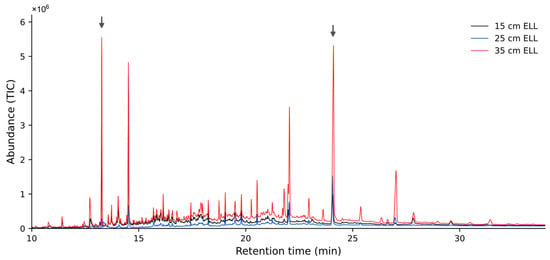
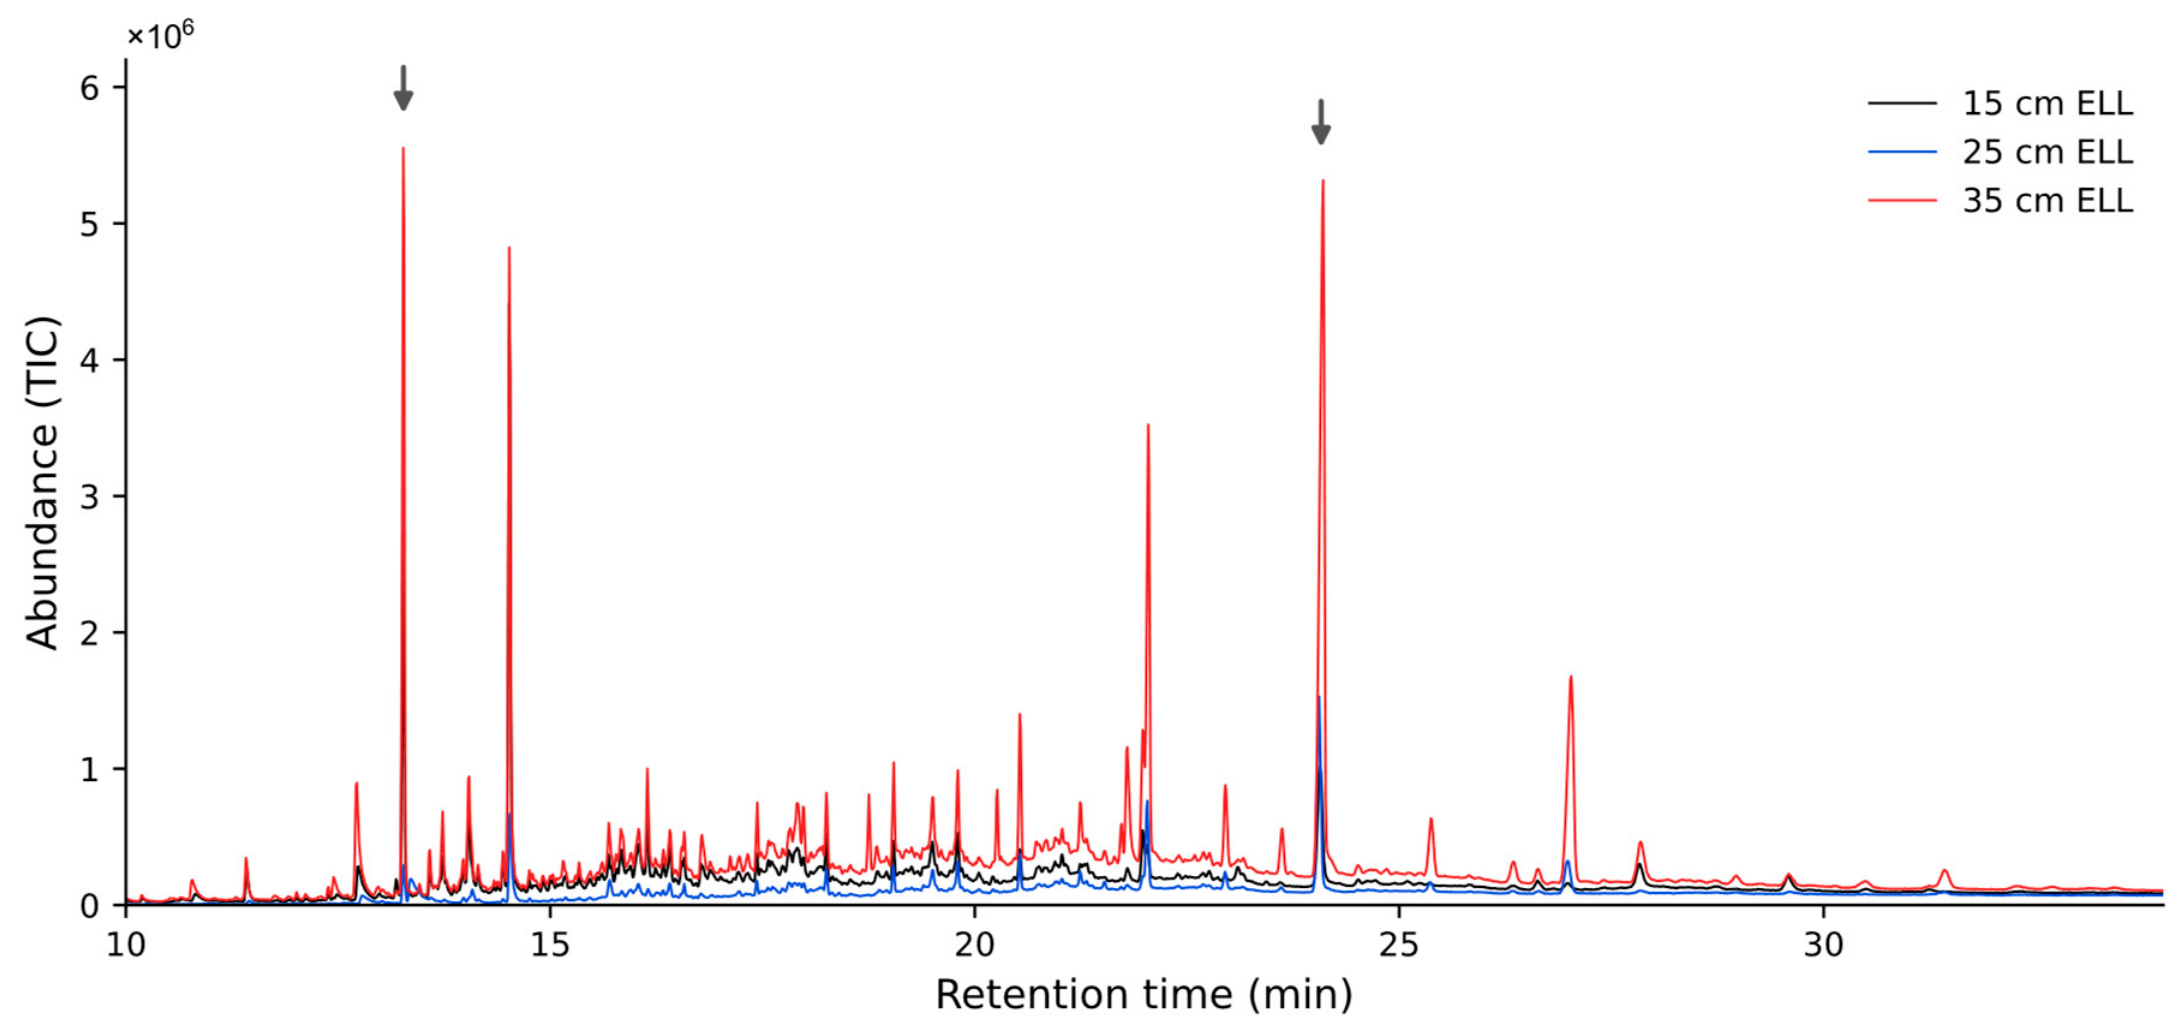
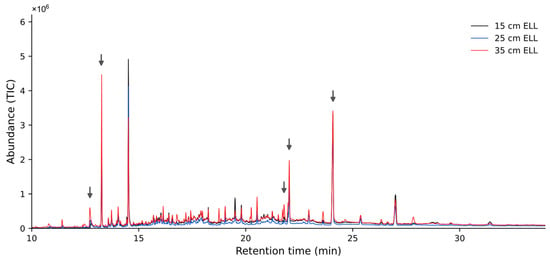
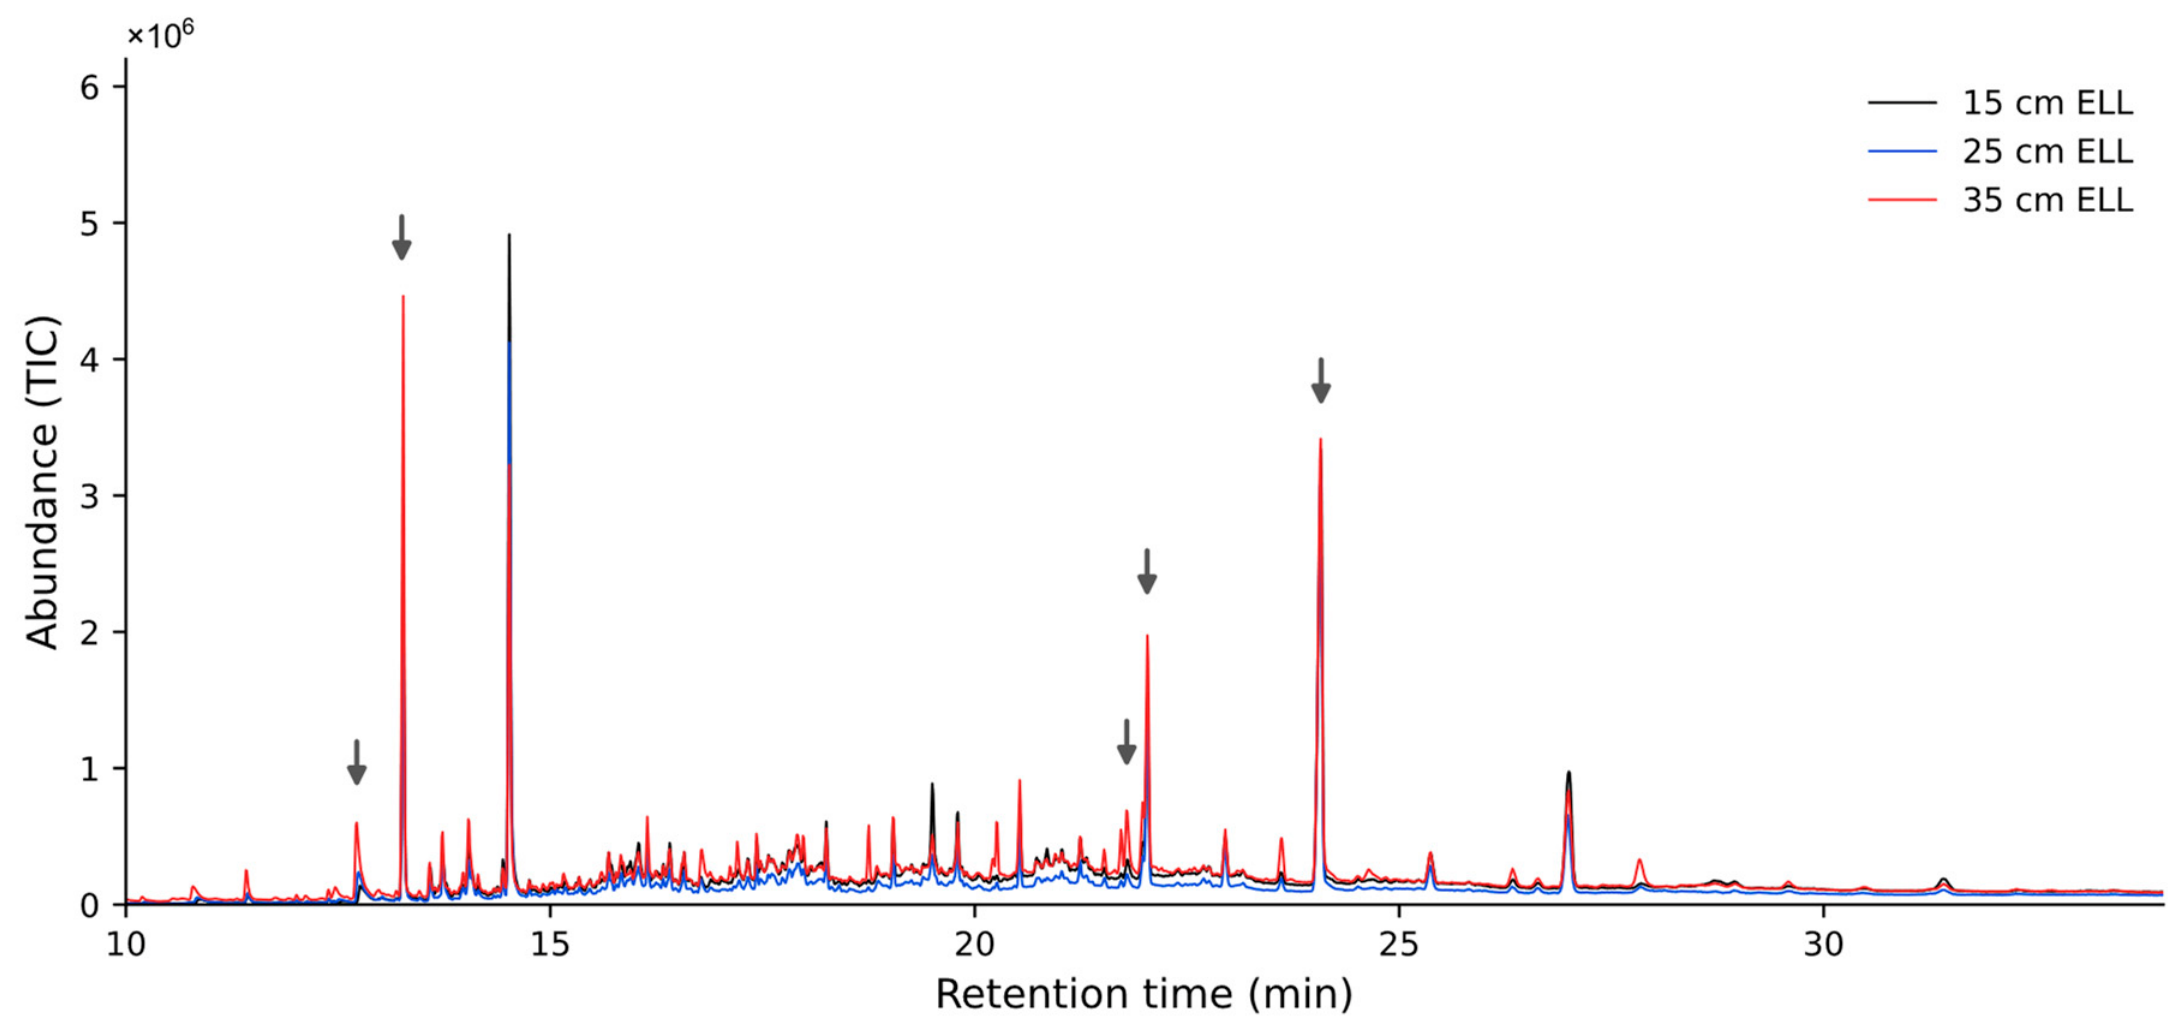
GC-MS analysis of the aerial-biomass extracts showed differences in the relative abundance of the detected bioactive compounds among the six defoliation combinations (Table 2, Figure 2 and Figure 3). Nine compounds were putatively or tentatively identified, in addition to a homologous series of n-alkanes (C20–C33); together they accounted for 81.0–96.6% of the artifact-free chromatographic area. n-Alkanes were the dominant group in all combinations (52.4–88.1%) and showed their lowest relative abundance at 5 cm RH/15 cm ELL. Hentriacontane (n-C31) was the major n-alkane and ranged from 12.2% (5 cm RH/15 cm ELL) to 31.7% (5 cm RH/25 cm ELL), followed by nonacosane (n-C29) and tritriacontane (n-C33), which were below the reporting threshold at 5 cm RH/15 cm ELL. Phytone was detected in all combinations and showed its highest relative abundance at 5 cm RH/15 cm ELL (17.4%) and its lowest at 5 cm RH/25 cm ELL (3.7%). Loliolide was also detected in all combinations (1.7–4.3%).
Table 2.
Putatively identified compounds and their relative abundance (% of artifact-free total chromatographic area) in P. lanceolata aerial biomass under three defoliation frequencies (ELL: 15, 25 and 35 cm) and two defoliation intensities (RH: 5 and 8 cm).
Figure 2.
GC-MS total ion chromatograms (10–34 min) of P. lanceolata defoliated at 5 cm residual height (RH) under three defoliation frequencies (ELL), differentiated by colour: black = 15 cm ELL, blue = 25 cm ELL, red = 35 cm ELL. Arrows indicate compounds of interest in order of retention time (RT): phytone (RT 13.3 min) and hentriacontane (n-C31, RT 24.1 min), the latter with its lowest relative abundance at 15 cm ELL. GC conditions: HP-5MS column (30 m × 0.25 mm × 0.25 µm); oven program 100–280 °C; EI, 70 eV; scan range m/z 50–900.
Figure 3.
GC-MS total ion chromatograms (10–34 min) of P. lanceolata defoliated at 8 cm residual height (RH) under three defoliation frequencies (ELL), differentiated by colour: black = 15 cm ELL, blue = 25 cm ELL, red = 35 cm ELL. Arrows indicate compounds of interest in order of retention time (RT): loliolide (RT 12.7 min), phytone (RT 13.3 min), tentatively identified α-tocospiro compounds (RT 21.8 and 22.0 min) and hentriacontane (n-C31, RT 24.1 min), chromatographic conditions as in Figure 2.
Putative neophytadiene exceeded the reporting threshold only at 5 cm RH/15 cm ELL (0.95%), where the tentatively identified stigmasta-3,5-dien-7-one (2.0%) was also detected. The tentatively identified α-tocospiro compounds showed their highest combined relative abundance at 35 cm ELL (5.7% at 5 cm RH and 4.7% at 8 cm RH), and were below the reporting threshold at 5 cm RH/25 cm ELL. Squalene (8 cm RH/35 cm ELL), 4,8,12,16-tetramethylheptadecan-4-olide (35 cm ELL) and hexadecanoic acid methyl ester (5 cm RH/25 cm ELL) were detected only in some combinations and at low relative abundance (0.6–2.1%).
3.3. Iridoid and Acteoside Concentrations
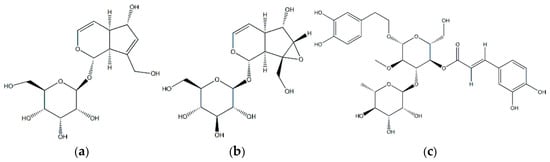
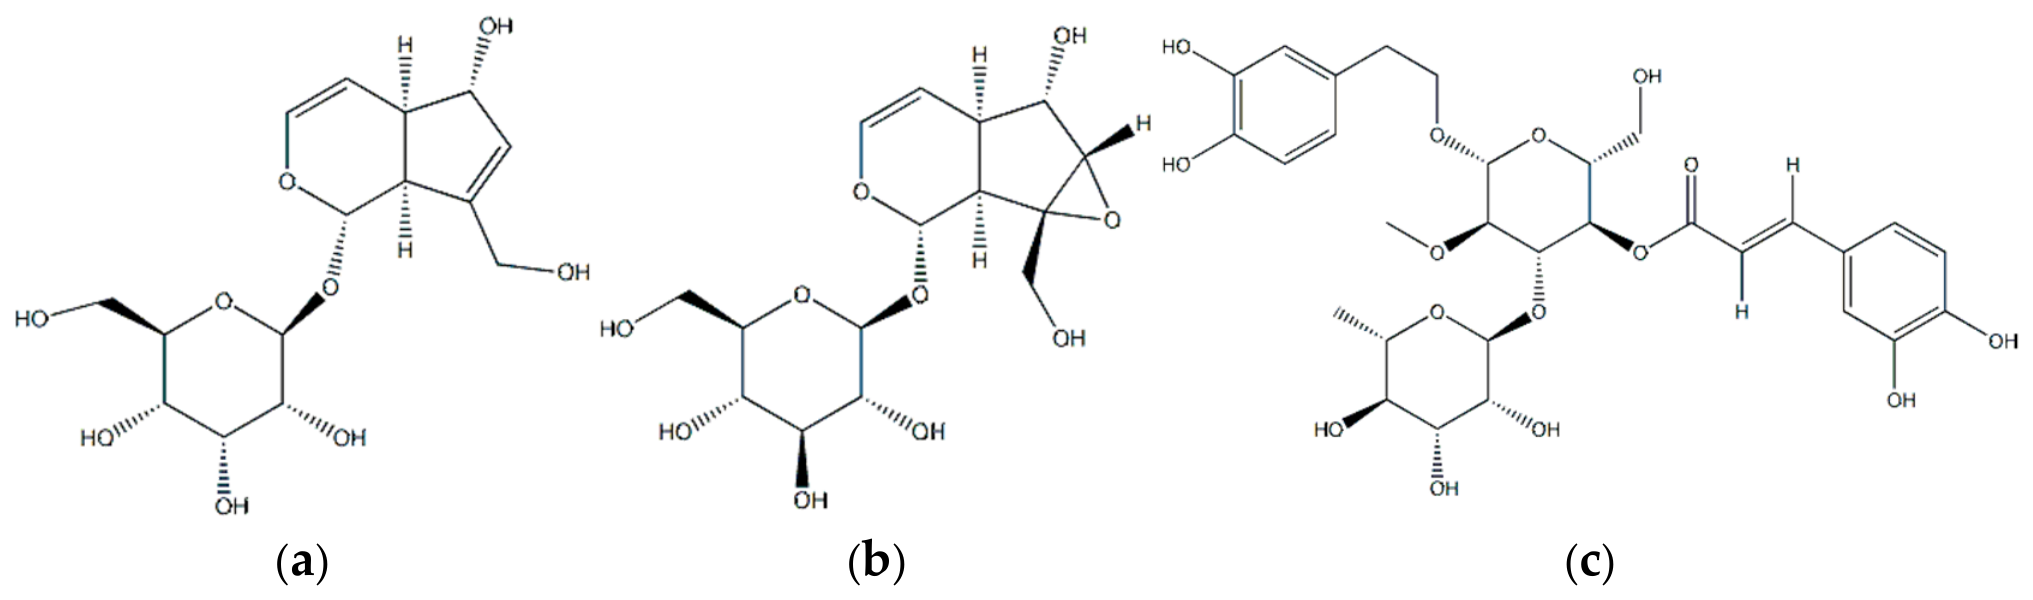
CAT and AC were detected in all samples of the aerial biomass of P. lanceolata, and AU in 87.5% of the samples (Figure 4). CAT concentration did not vary significantly with defoliation frequency or intensity, and no interaction was observed between these two factors. CAT averaged 18.64 mg g−1 DW across treatments. AU concentration was below the limit of quantification (4.44 mg L−1 in the injected solution, equivalent to approximately 2.2 mg g−1 DW) in all samples (Section 2.9); therefore, AU is reported as <LOQ and was not analysed statistically. Acteoside concentration varied significantly with both defoliation frequency (p = 0.0085) and intensity (p < 0.001), and there was no significant interaction between these factors (Figure 5a,b). Plants defoliated at 15 or 25 cm ELL averaged 3.42 mg g−1 DW, significantly higher than plants defoliated at 35 cm ELL (2.75 mg g−1 DW) (Figure 5a). Plants cut to 5 cm RH had higher AC concentrations than those with 8 cm RH (3.61 vs. 2.79 mg g−1 DW) (Figure 5b).
Figure 4.
Chemical structures of the principal bioactive compounds identified in P. lanceolata: (a) aucubin (AU), (b) catalpol (CAT), and (c) acteoside (AC).
Figure 5.
Acteoside concentration in P. lanceolata aerial biomass under (a) three defoliation frequencies (extended leaf length, ELL: 15, 25 and 35 cm) and (b) two defoliation intensities (residual height, RH: 5 and 8 cm). Bars represent means and error bars the standard error of the mean (SEM). Different letters above bars indicate significant differences between treatments according to Fisher’s least significant difference (LSD) test (p < 0.05).
3.4. UV–Visible Spectral Profiles Across Defoliation Treatments
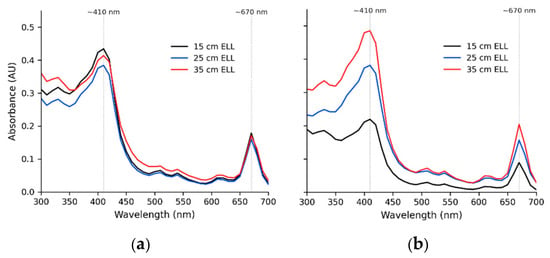
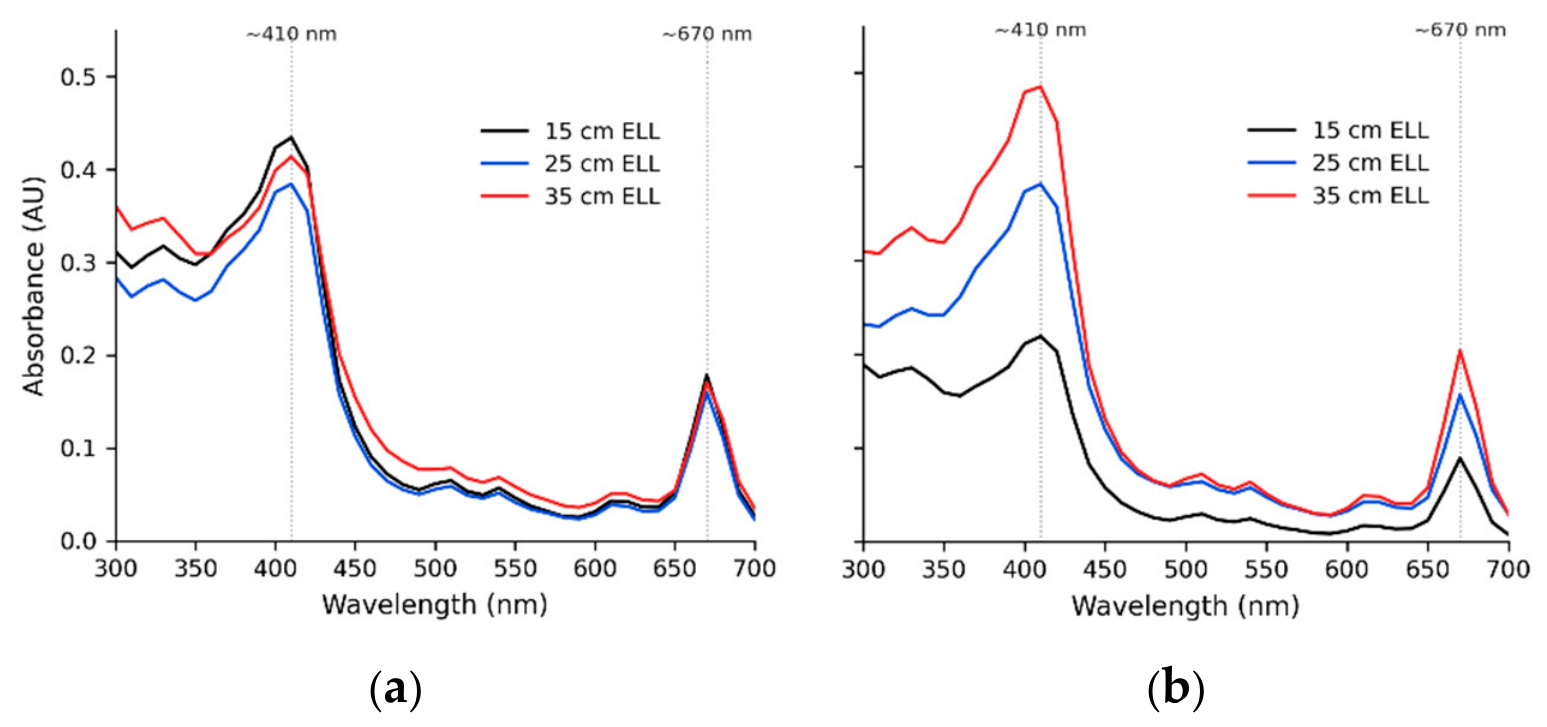
Within the interpretable range (>300 nm), all spectra showed bands at ~410 nm and ~670 nm, attributable to carotenoids and chlorophylls (Figure 6). Absorbance at 410 nm was 0.38–0.43 in four combinations and reached 0.49 at 8 cm RH/35 cm ELL, whereas the extract from 8 cm RH/15 cm ELL showed uniformly lower absorbance across the whole spectrum (0.22 at 410 nm).
Figure 6.
UV-Vis absorption spectra (300–700 nm, blank-corrected) of ethanolic extracts of P. lanceolata under (a) 5 cm and (b) 8 cm residual height (RH); line colour denotes defoliation frequency (ELL: black = 15, blue = 25, red = 35 cm). Bands at ~410 nm (carotenoids/chlorophyll) and ~670 nm (chlorophyll a) are indicated by dotted lines.
3.5. FT-IR Spectral Profiles Across Defoliation Treatments
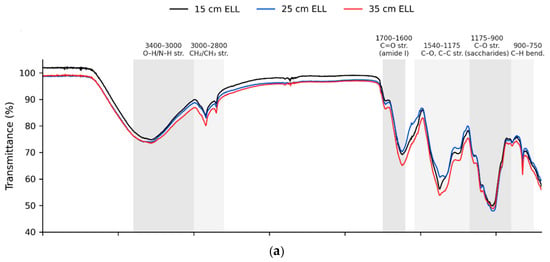
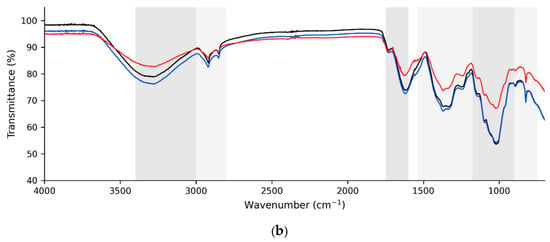
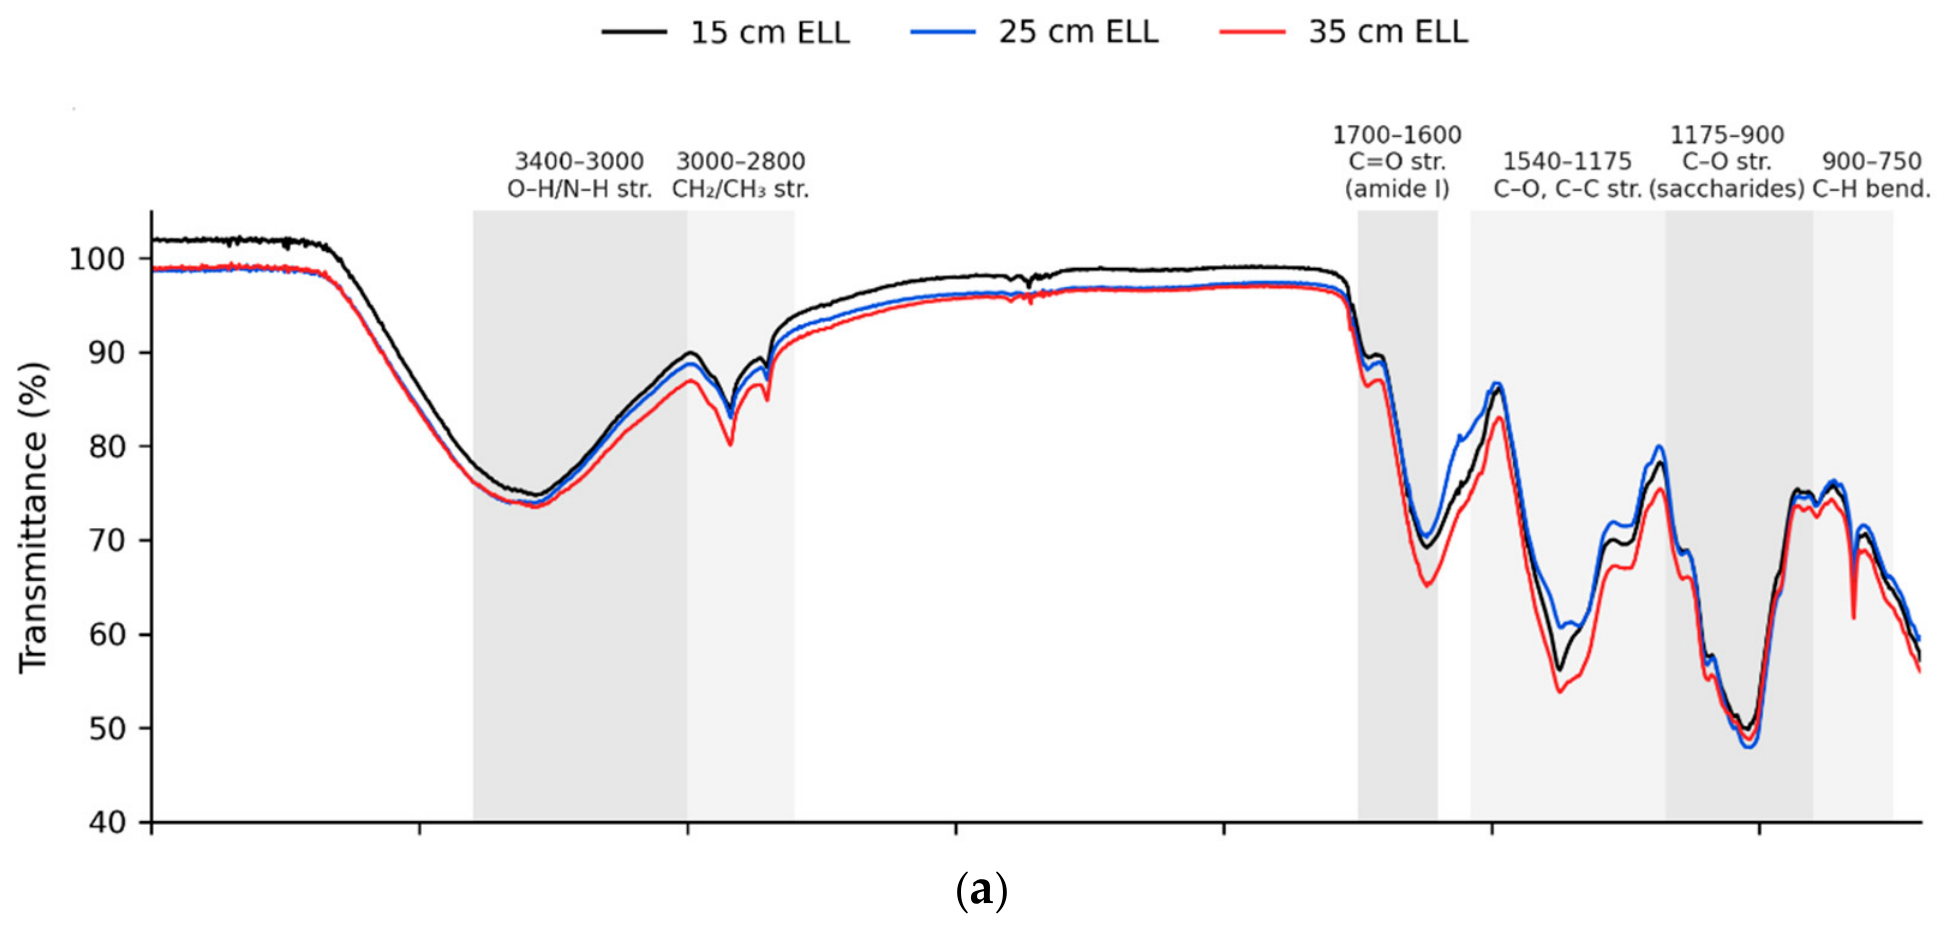
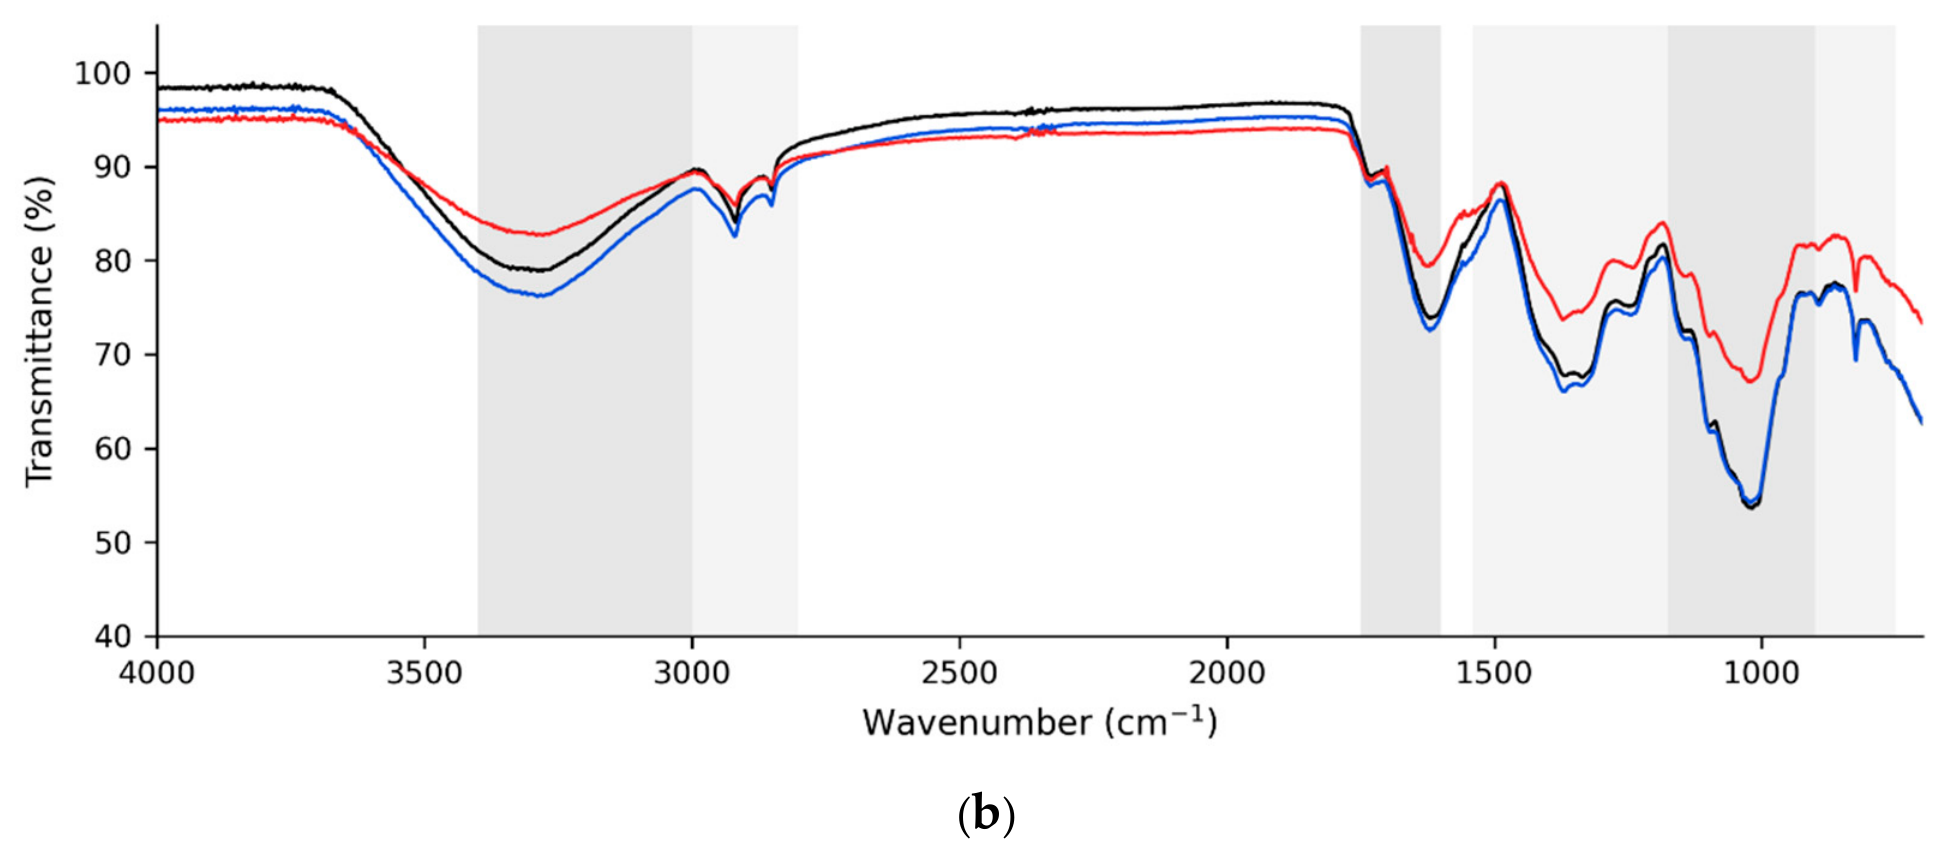
Characteristic absorption bands were identified in four biochemical regions: lipids (3000–2800 cm−1), proteins (1700–1500 cm−1), carbohydrates (1500–1200 cm−1), and cell wall components (1100–600 cm−1) (Figure 7, Table 3).
Figure 7.
FT-IR spectra (4000–700 cm−1) of P. lanceolata dried aerial biomass (ATR) from plants subjected to six combinations of defoliation frequencies and intensities: (a) 5 cm and (b) 8 cm residual height (RH); line colour denotes defoliation frequency (ELL: black = 15, blue = 25, red = 35 cm). Shaded areas indicate the main absorption regions.
Table 3.
Principal FT-IR absorption bands and their assignments in P. lanceolata aerial biomass. All bands were detected in the six combinations of defoliation frequency (ELL) and intensity (RH) (Figure 7).
C–H stretching bands at 2920–2850 cm−1 and asymmetric CH3 stretching at 2960 cm−1 were detected in all combinations. Amide I (~1650 cm−1) and amide II (~1550 cm−1) bands were present with comparable intensity across combinations. C–O stretching at 1250 cm−1 and β-1,4 glycosidic linkages (895 cm−1) were also present in all combinations. As only one spectrum was recorded per composite sample, differences in relative band intensity among combinations could not be distinguished from measurement variability (e.g., sample contact in ATR mode) and were therefore not interpreted.
3.6. High- and Low-Molecular-Weight Water Soluble Carbohydrate Content
No significant interaction effects between defoliation frequency and intensity were detected for any of the evaluated variables (Table 4). Regarding RH, a significant effect was observed exclusively for root low-molecular-weight WSC (p ≤ 0.05), with the 8 cm height promoting higher accumulation than the 5 cm height (0.82 vs. 0.57 mg plant−1); all other carbohydrate fractions remained unaffected by RH (p > 0.05).
Table 4.
Content of high- and low-molecular-weight water-soluble carbohydrates (WSC) per plant (mg plant−1) in aerial biomass and roots of P. lanceolata under three defoliation frequencies (ELL) and two intensities (RH).
In contrast, defoliation frequency significantly affected all evaluated carbohydrate fractions. Overall, longer defoliation intervals enhanced carbohydrate accumulation in both aerial and root tissues. Aerial high-molecular-weight WSC increased progressively with ELL (15 < 25 < 35 cm; p < 0.001), and aerial low-molecular-weight WSC was higher at 35 than at 15 cm ELL (p = 0.008), with 25 cm ELL intermediate. Similarly, root high-molecular-weight WSC peaked at the 35 cm ELL interval (p ≤ 0.001). For root low-molecular-weight WSC, both the 25 cm and 35 cm ELL intervals resulted in significantly higher accumulation compared to the 15 cm interval (p ≤ 0.001).
4. Discussion
4.1. Water-Soluble Carbohydrate Content in Aerial Biomass and Roots
Less frequent defoliation increased WSC content per plant in both aerial biomass and roots. In the same experiment, above-ground DM per plant was higher at 25 and 35 than at 15 cm ELL (0.55–0.63 vs. 0.26 g plant−1), and root DM per plant increased progressively from 15 to 35 cm ELL (0.11, 0.20 and 0.34 g plant−1), although root DM per pot was not affected [11]. A similar increase in root biomass under less frequent defoliation has been reported for other forage species under controlled conditions [26]. In contrast, among the WSC concentrations, only that of high-WSC in leaves was affected by defoliation frequency, being higher at 35 than at 15 and 25 cm ELL, whereas the concentrations of the other carbohydrate fractions in leaves and roots did not differ among treatments [11]. The WSC concentration of the harvested herbage was also higher at 35 cm ELL (5.38 vs. 3.95–4.01% of DM) [10]. As WSC content per plant is the product of organ DM and WSC concentration, the differences in WSC content per plant observed in the present study mainly reflect the greater above-ground and root DM accumulated under less frequent defoliation rather than changes in WSC concentration. From a whole-plant physiological perspective, WSC content per plant is a more appropriate indicator than WSC concentration [26,27,28,29], because it represents the total carbon pool available to support subsequent plant growth, maintenance, and other physiological and metabolic processes [30,31]. Accordingly, plants defoliated at 35 cm ELL accumulated the largest pools of high- and low-WSC in aerial biomass and roots, and those at 25 cm ELL had root low-WSC content similar to that at 35 cm ELL. Therefore, longer regrowth periods provide a greater amount of stored carbon available for subsequent plant functions [30,31]. At the whole-plant level, the high-WSC fraction constitutes the main carbon storage pool supporting physiological and metabolic processes [30,31] while also enhancing tolerance to environmental stress [29].
Regarding low-WSC, plants subjected to lower defoliation frequencies accumulated a larger pool of these compounds. Low-WSCs constitute the metabolically active carbon pool, supplying both energy (i.e., respiration) and carbon skeletons [30,31]. Consequently, a greater pool of these carbohydrates can potentially support a wide range of processes, including the synthesis of lipids, antioxidant compounds, phenolic compounds, and other bioactive metabolites measured in the present study. Therefore, a greater content of low-WSC at the whole-plant level likely represents an enhanced potential to support growth and maintenance. In root biomass, less intense defoliation (8 cm RH) increased only root low-WSC content. As root low-WSC concentration did not differ between residual heights [11], this difference mainly reflects the greater mean root DM per plant at 8 cm RH (0.25 vs. 0.19 g plant−1), particularly at 35 cm ELL, in the same experiment [11]. However, the larger reserves at 35 cm ELL did not coincide with higher acteoside or total phenolic content, whereas 5 cm RH increased acteoside and antioxidant activity but reduced root low-molecular-weight WSC. As WSCs were expressed per plant and phenolics per unit DW, and were sampled at different times, these patterns do not demonstrate a direct allocation trade-off.
4.2. Total Phenolic Content and Antioxidant Activity
Total phenolic content showed a significant ELL × RH interaction, indicating that the effect of regrowth duration on phenolic accumulation depended on defoliation intensity. Under more intense defoliation (5 cm RH), TPC was higher at the shortest (15 cm ELL) than at the longest regrowth interval (35 cm ELL). In contrast, under less intense defoliation (8 cm RH), TPC did not differ significantly among regrowth intervals. In the same experiment, the number of residual leaves per plant (i.e., the basal portions of leaves cut during defoliation that remained below the residual height) showed a similar pattern. Plants defoliated to a residual height of 5 cm, and a frequency of 35 cm of ELL had the lowest number of residual leaves compared with all other treatments [11]. However, the relationship between these two responses was not assessed.
Defoliation intensity (residual height), rather than frequency, was the main determinant of AA%: more intense defoliation (5 cm RH) increased radical-scavenging activity. Because neither defoliation frequency nor the ELL × RH interaction affected AA%, this response can be attributed to residual height alone. The higher AA% at 5 cm RH coincided with a higher concentration of acteoside, a secondary metabolite with well-documented antioxidant properties, acting as a free radical scavenger with protective effects against oxidative stress [32]. In contrast, catalpol did not respond to defoliation and aucubin was below the LOQ; therefore, iridoids are unlikely to explain the differences in AA%.
Defoliation and other stresses have been reported to modify the balance between growth and the synthesis of defence-related and antioxidant metabolites [33,34]. However, as metabolic pathways and carbon allocation were not assessed in the present study, the lower AA% at 8 cm RH cannot be attributed to a specific mechanism. Photosynthetic pigments, such as chlorophylls and carotenoids, may also have contributed to the radical-scavenging activity of the extracts [35]. Nevertheless, pigment absorbance of the extracts did not differ consistently between residual heights (Figure 6), and neither did relative chlorophyll content (SPAD) in the same experiment [10]. The leaf proportion of the harvested herbage differed by only 3.4 percentage points (94.5 vs. 91.1% of DM) [10]. Therefore, neither pigment content nor herbage composition is likely to account for the higher AA% at 5 cm RH. The lower quantum yield of photosystem II (Φ2) and higher fraction of absorbed light dissipated by non-photochemical quenching (ΦNPQ) at 5 cm RH [10] cannot be used to explain this response, as ΦNPQ also increased at 35 cm ELL without a change in AA%. Overall, defoliation intensity, rather than frequency, modified the antioxidant activity of the P. lanceolata extracts; whether this difference is relevant for forage quality or methane mitigation was not evaluated in the present study.
4.3. Lipid Content
Lipid content did not differ significantly among defoliation treatments (ELL, RH, or their interaction; Table 1); therefore, the numerical differences among combinations are not interpreted. Defoliation has been reported to modify resource allocation patterns in P. lanceolata [36] and source–sink relations in other species [37], but no effect on total lipid content was detected in the present study.
Whether defoliation modifies lipid composition (e.g., galactolipid and fatty acid profiles), which contributes to forage nutritional quality [38], rather than total lipid content, remains to be determined [39].
From a forage quality perspective, the lipid fractions identified in P. lanceolata remain of interest, given the reported roles of dietary lipids in modulating rumen fermentation and methane emissions [40], although this was not evaluated in the present study.
4.4. Gas Chromatography–Mass Spectrometry (GC-MS) Analysis
The distinct phytochemical profiles revealed by GC-MS analysis suggest that defoliation management may also be associated with differences in the lipophilic metabolite profile of P. lanceolata; as they derive from one pooled sample per treatment, these differences are descriptive. Putative neophytadiene exceeded the reporting threshold only at 5 cm RH/15 cm ELL. Neophytadiene has been identified in various medicinal plants where it exhibits antimicrobial, antifungal, and anti-inflammatory activities [41,42,43]. Although the production of secondary metabolites is known to respond to environmental stress [44], the low relative abundance of neophytadiene and the pooled design do not allow its detection only under the most frequent and intense defoliation to be attributed to an induced response, nor a functional role to be inferred.
n-Alkanes, mainly odd-numbered homologues (n-C29, n-C31 and n-C33), were the main group in all combinations but showed their lowest relative abundance at 5 cm RH/15 cm ELL. Long-chain alkanes are major constituents of plant cuticular wax, serving critical functions in reducing water loss, providing physical barriers against pathogens, and reflecting excess radiation [45,46,47]. Wax biosynthesis is energetically costly [48] and is regulated by abiotic and biotic stress [49,50]. The lower n-alkane abundance under the most frequent defoliation may reflect the younger age of the harvested leaves; however, as the analysis was based on one pooled sample per treatment, this difference is descriptive.
The higher combined relative abundance of the tentatively identified tocopherol-related derivatives (α-tocospiro A and B) at 35 cm ELL, regardless of residual height, is of interest because tocopherols act as lipophilic, membrane-protective antioxidants [51,52,53]. However, as oxidation derivatives of α-tocopherol, these compounds may also form during extraction, so their relative abundance cannot be taken as a measure of tocopherol content. Tocopherol biosynthesis is associated with chloroplast membranes and photosynthetic capacity [54]; whether the longer regrowth period at 35 cm ELL favours tocopherol accumulation would require targeted analysis. Moreover, because their identification remains tentative (Table 2), confirmation with authentic standards would be required before attributing specific vitamin E-related nutritional roles [54].
The distinct phytochemical profiles associated with different defoliation regimes showed that no single regime was associated with the highest values of all compounds. Putative neophytadiene was detected under the most frequent defoliation, which also reduced biomass production [10]. Whether these differences are relevant to forage quality or methane mitigation remains to be tested.
4.5. Concentrations of Bioactive Compounds (Aucubin, Catalpol and Acteoside)
The analysis of AU, CAT, and AC in P. lanceolata subjected to different defoliation regimes revealed differential responses among compounds. The significant variation in AC with both defoliation frequency and intensity, in the absence of interaction effects, suggests that these factors influence AC levels independently, in agreement with reports that AC concentrations in P. lanceolata respond to management and seasonal conditions [55]. The higher AC concentrations observed under more frequent defoliation (15 and 25 cm ELL) and under more intense defoliation (5 cm RH) could be related to the induction of the phenylpropanoid pathway by wounding reported in other species [56]. However, jasmonate signalling and gene expression were not assessed in the present study. AC has well-documented antioxidative and anti-inflammatory properties [57]. Beyond these properties, anti-methanogenic potential has been reported for AC: in vitro, it improved rumen fermentation as an energy source [21] and promoted propionate formation, an alternative hydrogen sink that lowers the acetate-to-propionate ratio and reduces the methane proportion of fermentation gas [58], although these effects were observed at concentrations higher than those found in the present study, and rumen fermentation was not evaluated here. The stability of CAT concentrations across all defoliation treatments indicates that CAT was less responsive to defoliation than AC in the present study. Previous research has noted that CAT concentrations tend to be more stable under varying environmental and agronomic conditions [59], and CAT concentrations of 1–2% of dry matter, with no clear seasonal change, have been reported for P. lanceolata [22], a range comparable to that found here; however, CAT has been reported at trace levels in cv. ‘Ceres Tonic’ [21,22]. Anti-methanogenic effects have also been reported for CAT in vitro at an added concentration of 10 mg g−1 DM [58]. AU was detected but remained below the limit of quantification in all samples. The low AU and AC concentrations relative to those reported for P. lanceolata [21,22,58] may partly reflect the drying of the present samples at 60 °C, since losses of these compounds during drying, larger for AC and AU than for CAT, have been reported [22]. AU has documented roles in plant defence against herbivores [59,60]. AU has also shown anti-methanogenic potential in vitro, delaying methanogenesis through antimicrobial inhibition [58] and reducing ruminal ammonia [21]. Whether defoliation management can modify these compounds to an extent relevant for rumen fermentation remains to be tested in vivo.
4.6. UV–Visible Spectral Analysis
UV–visible spectroscopy provided a rapid, non-destructive fingerprint of the aerial-biomass extracts under different defoliation regimes. After blank correction, the interpretable region of the spectra (>300 nm) was dominated by photosynthetic pigments, with a broad band in the carotenoid/Soret region (~400–410 nm) and a distinct chlorophyll a band near 670 nm [61,62]. Absorbance below ~300 nm was constrained by the UV cut-off of the polystyrene microplate and could not be reliably interpreted. The spectra therefore primarily reflect the pigment (chlorophyll and carotenoid) content of the extracts rather than individual phenolic or flavonoid chromophores.
Pigment-band absorbance increased with the regrowth interval at 8 cm RH (15 < 25 < 35 cm ELL) but was similar among defoliation frequencies at 5 cm RH (Figure 6). At 8 cm RH, this pattern is compatible with longer regrowth intervals allowing greater accumulation of photosynthetic pigments and photosynthetic tissue [10,37]. This is consistent with the higher WSC reserves and root development documented under less frequent defoliation [11]. The greater pigment content under infrequent, less intense defoliation may reflect either a favourable resource status that permits sustained investment in the photosynthetic apparatus, or an active recovery response following defoliation [37]; as one composite extract per treatment was analysed, the present data do not allow these alternatives to be distinguished.
Conversely, the lowest pigment absorbance, observed at 8 cm RH/15 cm ELL, is consistent with reduced photosynthetic recovery [10,37].
Overall, the UV-Vis spectra mainly reflect the pigment content of the extracts. The phenolic and flavonoid contribution to antioxidant capacity is addressed through the Folin–Ciocalteu and DPPH assays (Section 3.1 and Section 4.2).
4.7. FT-IR Spectroscopy Analysis
FT-IR spectroscopy was used to obtain a complementary functional-group profile of the aerial biomass, alongside the phytochemical, GC-MS, HPLC and UV-Vis analyses. This technique has been successfully applied to characterise the phytochemical profiles of Plantago species [63,64], and its non-destructive nature allows comprehensive functional-group characterisation with minimal sample preparation [24,65].
C–H stretching bands of alkyl chains (2920–2850 cm−1) were present in all combinations, consistent with the lipid fraction of the aerial biomass [66,67].
Amide I and amide II bands were present with similar intensity in all combinations, indicating no detectable differences in protein-related functional groups among defoliation regimes.
Bands in the carbohydrate and cell-wall regions, including C–O stretching at 1250 and 1050 cm−1, are characteristic of polysaccharides [68] and were observed in all combinations. FT-IR does not discriminate between WSC reserve and structural carbohydrates. Water-soluble carbohydrate reserves of P. lanceolata have been reported to increase under less frequent defoliation [10,11], and the carbohydrate fractions of the present plants were quantified separately (Section 3.6).
The β-glycosidic linkage bands at 895 and 823 cm−1, associated with cellulose and hemicellulose [69], were likewise present in all combinations.
The aromatic C=C bands identified in the FT-IR spectra are consistent with the presence of phenolic and other aromatic structures, in agreement with the total phenolic content measured by the Folin–Ciocalteu assay. Taken together, the FT-IR profiles showed the functional groups expected for leaf tissue (lipids, proteins and polysaccharides) in all combinations; as a single spectrum was recorded per treatment, differences in relative band intensity were not interpreted, and FT-IR therefore complements the other analyses without providing treatment-specific information in the present design.
4.8. Implications and Limitations Under Pasture Conditions
The present results were obtained in pure stands of P. lanceolata grown in pots under controlled conditions. This approach allowed the effects of defoliation frequency and intensity to be isolated, but it differs markedly from the conditions prevailing in grazed pastures. The absolute values reported here should therefore be interpreted with caution, and the results mainly indicate the direction and relative magnitude of the responses of P. lanceolata to defoliation management. In multispecies pastures, P. lanceolata competes with grasses and legumes for light, water and nutrients. Shading by taller companion species reduces the radiation intercepted by its leaves, and nitrogen supplied by legumes may modify the carbon–nutrient balance that regulates the synthesis of carbon-based secondary metabolites such as phenolic compounds and iridoids [8]. Neighbouring species have also been shown to alter the concentration of iridoid glycosides in P. lanceolata [59,60]. Grazing by cattle also differs from the uniform cutting applied in this study. Defoliation by grazing animals is selective and spatially heterogeneous, and it is accompanied by treading and the return of dung and urine, all of which affect regrowth, morphological and chemical composition and the persistence of pastures [15]. In addition, the seasonal and diurnal fluctuations in temperature, radiation and water availability that occur in the field, which were controlled in this experiment, influence the accumulation of secondary metabolites in plants [8]. Consequently, the responses observed here should be validated in multispecies pastures under grazing. Nevertheless, both factors evaluated in this study can be regulated through grazing management under pasture conditions. Defoliation frequency, expressed as extended leaf length, can be translated into the grazing interval of a rotational grazing system, in which paddocks are grazed when the leaves of P. lanceolata reach the target length. This is a simple, non-destructive criterion that can be measured in the field with a ruler, as in the present study and in previous work [10,11,15,16]. Defoliation intensity, expressed as residual height, corresponds to the post-grazing residual, which can be controlled through stocking density or grazing duration.
5. Conclusions
Defoliation frequency, defined by extended leaf length (ELL), and defoliation intensity, defined by residual height (RH), had mostly independent effects on P. lanceolata. More frequent defoliation (15–25 cm ELL) increased acteoside concentration, whereas less frequent defoliation (35 cm ELL) increased WSC content per plant in both aerial biomass and roots, mainly as a result of greater organ dry mass rather than higher WSC concentration. More intense defoliation (5 cm RH) increased antioxidant activity and acteoside concentration, whereas less intense defoliation (8 cm RH) increased root low-molecular-weight WSC content. Total phenolic content depended on the interaction between both factors, being higher at 15 than at 35 cm ELL only under 5 cm RH, whereas lipid and catalpol contents remained stable across treatments. Therefore, no single defoliation regime maximised both acteoside and WSC content. Defoliation at 25 cm ELL maintained acteoside concentration as high as that at 15 cm ELL, and its root low-molecular-weight WSC content did not differ from that at 35 cm ELL. In contrast, its aerial and root high-molecular-weight WSC contents were lower than those cut at 35 cm ELL. Leaf length and post-grazing residual height could therefore be used as simple field criteria to adjust the bioactive compounds and carbohydrate reserves of P. lanceolata. These results were obtained in pure stands under controlled conditions and should be validated in grazed multispecies pastures and in ruminant feeding trials.
Author Contributions
Conceptualization, V.M.M.; methodology, V.M.M., R.T.A.-D., M.D.L.-B., C.I.P., A.M. and L.M.G.; formal analysis, V.M.M., R.T.A.-D., M.J.R., I.P.O., and L.M.G.; investigation, V.M.M. and R.T.A.-D.; resources, V.M.M.; data curation, V.M.M., R.T.A.-D., C.I.P., A.M., I.P.O., and L.M.G.; writing—original draft preparation, V.M.M., C.I.P., R.T.A.-D., M.D.L.-B., M.J.R., I.P.O., L.F.P., and L.M.G.; writing—review and editing, all authors; visualization, V.M.M., R.T.A.-D., M.J.R., I.P.O., L.F.P., and L.M.G.; supervision, V.M.M.; project administration, V.M.M.; funding acquisition, V.M.M. All authors have read and agreed to the published version of the manuscript.
Funding
This research was funded by the Agencia Nacional de Investigación y Desarrollo (ANID), Chile, through FONDECYT de Iniciación en Investigación, grant number 11231053, and FONDEF IDeA I+D, grant number ID24I10241.
Data Availability Statement
The raw data supporting the conclusions of this article are not readily available because the data are part of an ongoing study. Requests to access the datasets should be directed to Verónica M. Merino (veronica.merino@uchile.cl).
Acknowledgments
The authors thank Héctor Aguilar and Allan Bascuñán (Facultad de Ciencias Químicas, Universidad de Concepción) for facilitating access to the FT-IR instrumentation and their support during the FT-IR measurements. During the preparation of this manuscript, the authors used Grammarly (Grammarly Inc., web/browser version, accessed August 2026) for grammar, spelling, and clarity editing of the English text, and LeapSpace (Elsevier, web version, accessed June 2026) for literature search and retrieval of peer-reviewed references. The authors have reviewed and edited the output and take full responsibility for the content of this publication.
Conflicts of Interest
The authors declare no conflicts of interest.
Abbreviations
The following abbreviations are used in this manuscript:
| Φ2 | Quantum yield of photosystem II |
| ΦNPQ | Fraction of absorbed light dissipated by non-photochemical quenching |
| AC | Acteoside |
| ATR | Attenuated Total Reflection |
| AU | Aucubin |
| CAT | Catalpol |
| DAD | Diode array detector |
| DPPH | 2,2-diphenyl-1-picrylhydrazyl |
| DW | Dry weight |
| ELL | Extended leaf length |
| FT-IR | Fourier transform infrared spectroscopy |
| GAE | Gallic acid equivalents |
| GC-MS | Gas chromatography–mass spectrometry |
| HPLC | High-performance liquid chromatography |
| LED | Light-emitting diode |
| NIST | National Institute of Standards and Technology |
| PAR | Photosynthetically active radiation |
| RH | Residual height |
| SPAD | Relative chlorophyll content |
| TPC | Total phenolic content |
| UV–Vis | Ultraviolet–visible spectroscopy |
| WSC | Water-soluble carbohydrates |
References
- Gerber, P.J.; Steinfeld, H.; Henderson, B.; Mottet, A.; Opio, C.; Dijkman, J.; Falcucci, A.; Tempio, G. Tackling Climate Change through Livestock—A Global Assessment of Emissions and Mitigation Opportunities; Food and Agriculture Organization of the United Nations (FAO): Rome, Italy, 2013.
- Nguyen, T.T.; Navarrete, S.; Horne, D.J.; Donaghy, D.J.; Kemp, P.D. Incorporating Plantain with Perennial Ryegrass–White Clover in a Dairy Grazing System: Dry Matter Yield, Botanical Composition, and Nutritive Value Response to Sowing Rate, Plantain Content and Season. Agronomy 2022, 12, 2789. [Google Scholar] [CrossRef] [Scilit]
- Cranston, L.M.; Kenyon, P.R.; Morris, S.T.; Kemp, P.D. A Review of the Use of Chicory, Plantain, Red Clover and White Clover in a Sward Mix for Increased Sheep and Beef Production. J. N. Z. Grassl. 2015, 77, 89–94. [Google Scholar] [CrossRef] [Scilit]
- Pinxterhuis, J.B.; Judson, H.G.; Peterson, M.E.; Navarrete, S.; Minnée, E.; Dodd, M.B.; Davis, S.R. Implementing Plantain (Plantago lanceolata) to Mitigate the Impact of Grazing Ruminants on Nitrogen Losses to the Environment: A Review. Grass Forage Sci. 2024, 79, 144–157. [Google Scholar] [CrossRef] [Scilit]
- Nguyen, T.T.; Navarrete, S.; Horne, D.; Donaghy, D.; Kemp, P. Milk Production and Nitrogen Excretion of Grazed Dairy Cows in Response to Plantain (Plantago lanceolata) Content and Lactation Season. Anim. Biosci. 2025, 38, 67–76. [Google Scholar] [CrossRef] [Scilit] [PubMed]
- Dalar, A.; Türker, M.; Konczak, I. Antioxidant Capacity and Phenolic Constituents of Malva neglecta Wallr. and Plantago lanceolata L. from Eastern Anatolia Region of Turkey. J. Herb. Med. 2012, 2, 42–51. [Google Scholar] [CrossRef] [Scilit]
- Hassan, F.; Arshad, M.A.; Ebeid, H.M.; Rehman, M.S.; Khan, M.S.; Shahid, S.; Yang, C. Phytogenic Additives Can Modulate Rumen Microbiome to Mediate Fermentation Kinetics and Methanogenesis Through Exploiting Diet–Microbe Interaction. Front. Vet. Sci. 2020, 7, 575801. [Google Scholar] [CrossRef] [Scilit] [PubMed]
- Jan, R.; Asaf, S.; Numan, M.; Lubna; Kim, K.-M. Plant Secondary Metabolite Biosynthesis and Transcriptional Regulation in Response to Biotic and Abiotic Stress Conditions. Agronomy 2021, 11, 968. [Google Scholar] [CrossRef] [Scilit]
- Briske, D.D.; Richards, J.H. Plant Responses to Defoliation: A Physiologic, Morphologic and Demographic Evaluation. In Wildland Plants: Physiological Ecology and Developmental Morphology; Bedunah, D.J., Sosebee, R.E., Eds.; Society for Range Management: Denver, CO, USA, 1995; pp. 635–710. [Google Scholar]
- Merino, V.M.; Aguilar, R.; Piña, L.F.; Garriga, M.; Ostria-Gallardo, E.; López, M.D.; Noriega, F.; Campos, J.; Navarrete, S.; Rivero, M.J. Regrowth Dynamics and Morpho-Physiological Characteristics of Plantago lanceolata under Different Defoliation Frequencies and Intensities. PLoS ONE 2024, 19, e0310009. [Google Scholar] [CrossRef] [Scilit] [PubMed]
- Merino, V.M.; Aguilar, R.I.; Rivero, M.J.; Ordóñez, I.P.; Piña, L.F.; López-Belchí, M.D.; Schoebitz, M.I.; Noriega, F.A.; Pérez, C.I.; Cooke, A.S.; et al. Distribution of Non-Structural Carbohydrates and Root Structure of Plantago lanceolata L. under Different Defoliation Frequencies and Intensities. Plants 2024, 13, 2773. [Google Scholar] [CrossRef] [Scilit] [PubMed]
- Perera, R.S.; Cullen, B.R.; Eckard, R.J. Growth and Physiological Responses of Temperate Pasture Species to Consecutive Heat and Drought Stresses. Plants 2019, 8, 227. [Google Scholar] [CrossRef] [Scilit] [PubMed]
- Brito, C.; Ferreira, H.; Dinis, L.-T.; Trindade, H.; Marques, D.; Correia, C.M.; Moutinho-Pereira, J. Different LED Light Intensity and Quality Change Perennial Ryegrass (Lolium perenne L.) Physiological and Growth Responses and Water and Energy Consumption. Front. Plant Sci. 2023, 14, 1160100. [Google Scholar] [CrossRef] [Scilit] [PubMed]
- Pol, M.; Schmidtke, K.; Lewandowska, S. Plantago lanceolata—An Overview of Its Agronomically and Healing Valuable Features. Open Agric. 2021, 6, 479–488. [Google Scholar] [CrossRef] [Scilit]
- Lee, J.M.; Hemmingson, N.R.; Minnee, E.M.K.; Clark, C.E.F. Management Strategies for Chicory (Cichorium intybus) and Plantain (Plantago lanceolata): Impact on Dry Matter Yield, Nutritive Characteristics and Plant Density. Crop Pasture Sci. 2015, 66, 168–183. [Google Scholar] [CrossRef] [Scilit]
- Lee, J.M.; Donaghy, D.J.; Sathish, P.; Roche, J.R. Interaction between Water-Soluble Carbohydrate Reserves and Defoliation Severity on the Regrowth of Perennial Ryegrass (Lolium perenne L.)-Dominant Swards. Grass Forage Sci. 2009, 64, 266–275. [Google Scholar] [CrossRef] [Scilit]
- Singleton, V.L.; Orthofer, R.; Lamuela-Raventós, R.M. Analysis of Total Phenols and Other Oxidation Substrates and Antioxidants by Means of Folin–Ciocalteu Reagent. In Methods in Enzymology; Academic Press: San Diego, CA, USA, 1999; Volume 299, pp. 152–178. [Google Scholar] [CrossRef] [Scilit]
- Brand-Williams, W.; Cuvelier, M.E.; Berset, C. Use of a Free Radical Method to Evaluate Antioxidant Activity. LWT Food Sci. Technol. 1995, 28, 25–30. [Google Scholar] [CrossRef] [Scilit]
- Folch, J.; Lees, M.; Sloane Stanley, G.H. A Simple Method for the Isolation and Purification of Total Lipides from Animal Tissues. J. Biol. Chem. 1957, 226, 497–509. [Google Scholar] [CrossRef] [Scilit]
- National Institute of Standards and Technology. NIST/EPA/NIH Mass Spectral Library (NIST 17); NIST: Gaithersburg, MD, USA, 2017.
- Navarrete, S.; Kemp, P.D.; Pain, S.J.; Back, P.J. Bioactive Compounds, Aucubin and Acteoside, in Plantain (Plantago lanceolata L.) and Their Effect on in vitro Rumen Fermentation. Anim. Feed Sci. Technol. 2016, 222, 158–167. [Google Scholar] [CrossRef] [Scilit]
- Tamura, Y.; Nishibe, S. Changes in the Concentrations of Bioactive Compounds in Plantain Leaves. J. Agric. Food Chem. 2002, 50, 2514–2518. [Google Scholar] [CrossRef] [Scilit] [PubMed]
- Coates, J. Interpretation of Infrared Spectra, a Practical Approach. In Encyclopedia of Analytical Chemistry; Meyers, R.A., Ed.; John Wiley & Sons: Chichester, UK, 2000; pp. 10815–10837. [Google Scholar]
- Stuart, B.H. Infrared Spectroscopy: Fundamentals and Applications; John Wiley & Sons: Chichester, UK, 2004; ISBN 9780470854280. [Google Scholar]
- Dubois, M.; Gilles, K.A.; Hamilton, J.K.; Rebers, P.A.; Smith, F. Colorimetric Method for Determination of Sugars and Related Substances. Anal. Chem. 1956, 28, 350–356. [Google Scholar] [CrossRef] [Scilit]
- Ordóñez, I.P.; López, I.F.; Kemp, P.D.; Donaghy, D.J.; Zhang, Y.; Herrmann, P. Response of Bromus valdivianus (Pasture Brome) Growth and Physiology to Defoliation Frequency Based on Leaf Stage Development. Agronomy 2021, 11, 2058. [Google Scholar] [CrossRef] [Scilit]
- Fulkerson, W.J.; Donaghy, D.J. Plant-Soluble Carbohydrate Reserves and Senescence—Key Criteria for Developing an Effective Grazing Management System for Ryegrass-Based Pastures: A Review. Aust. J. Exp. Agric. 2001, 41, 261–275. [Google Scholar] [CrossRef] [Scilit]
- Zwicke, M.; Picon-Cochard, C.; Morvan-Bertrand, A.; Prud’homme, M.-P.; Volaire, F. What Functional Strategies Drive Drought Survival and Recovery of Perennial Species from Upland Grassland? Ann. Bot. 2015, 116, 1001–1015. [Google Scholar] [CrossRef] [Scilit] [PubMed]
- Lambers, H.; Oliveira, R.S. Plant Physiological Ecology, 3rd ed.; Springer: Cham, Switzerland, 2019. [Google Scholar]
- Taiz, L.; Zeiger, E.; Møller, I.M.; Murphy, A. Plant Physiology and Development, 6th ed.; Sinauer Associates: Sunderland, MA, USA, 2015. [Google Scholar]
- Cannea, F.B.; Padiglia, A. Antioxidant Defense Systems in Plants: Mechanisms, Regulation, and Biotechnological Strategies for Enhanced Oxidative Stress Tolerance. Life 2025, 15, 1293. [Google Scholar] [CrossRef] [Scilit] [PubMed]
- Treml, J.; Večeřová, P.; Herczogová, P.; Šmejkal, K. Direct and Indirect Antioxidant Effects of Selected Plant Phenolics in Cell-Based Assays. Molecules 2021, 26, 2534. [Google Scholar] [CrossRef] [Scilit] [PubMed]
- Lamalakshmi Devi, E.; Kumar, S.; Basanta Singh, T.; Sharma, S.K.; Beemrote, A.; Devi, C.P.; Chongtham, S.K.; Singh, C.H.; Yumlembam, R.A.; Haribhushan, A.; et al. Adaptation Strategies and Defence Mechanisms of Plants During Environmental Stress. In Medicinal Plants and Environmental Challenges; Springer International Publishing: Cham, Switzerland, 2017; pp. 359–413. [Google Scholar]
- War, A.R.; Paulraj, M.G.; Ahmad, T.; Buhroo, A.A.; Hussain, B.; Ignacimuthu, S.; Sharma, H.C. Mechanisms of Plant Defense against Insect Herbivores. Plant Signal. Behav. 2012, 7, 1306–1320. [Google Scholar] [CrossRef] [Scilit] [PubMed]
- Simkin, A.J.; Kapoor, L.; Doss, C.G.P.; Hofmann, T.A.; Lawson, T.; Ramamoorthy, S. The Role of Photosynthesis Related Pigments in Light Harvesting, Photoprotection and Enhancement of Photosynthetic Yield in Planta. Photosynth. Res. 2022, 152, 23–42. [Google Scholar] [CrossRef] [Scilit] [PubMed]
- Fajer, E.D.; Bowers, M.D.; Bazzaz, F.A. Performance and Allocation Patterns of the Perennial Herb, Plantago lanceolata, in Response to Simulated Herbivory and Elevated CO2 Environments. Oecologia 1991, 87, 37–42. [Google Scholar] [CrossRef] [Scilit] [PubMed]
- Iqbal, N.; Masood, A.; Khan, N.A. Analyzing the Significance of Defoliation in Growth, Photosynthetic Compensation and Source-Sink Relations. Photosynthetica 2012, 50, 161–170. [Google Scholar] [CrossRef] [Scilit]
- Capstaff, N.M.; Miller, A.J. Improving the Yield and Nutritional Quality of Forage Crops. Front. Plant Sci. 2018, 9, 535. [Google Scholar] [CrossRef] [Scilit] [PubMed]
- Upchurch, R.G. Fatty Acid Unsaturation, Mobilization, and Regulation in the Response of Plants to Stress. Biotechnol. Lett. 2008, 30, 967–977. [Google Scholar] [CrossRef] [Scilit] [PubMed]
- Lileikis, T.; Nainienė, R.; Bliznikas, S.; Uchockis, V. Dietary Ruminant Enteric Methane Mitigation Strategies: Current Findings, Potential Risks and Applicability. Animals 2023, 13, 2586. [Google Scholar] [CrossRef] [Scilit] [PubMed]
- Rajeswaran, S.; Rajan, D.K. Neophytadiene: Biological Activities and Drug Development Prospects. Phytomedicine 2025, 143, 156872. [Google Scholar] [CrossRef] [Scilit] [PubMed]
- Kukavica, B.; Škondrić, S.; Gašić, U.; Stojković, D.; Nikolić, F.; Trifković, T.; Nakarada, Đ.; Mojović, M.; Mišić, D. Secondary Metabolites and Biochemical Adaptations of Scilla lakusicii and S. litardierei to Karst Environments: A Metabolomic Perspective. Biochem. Syst. Ecol. 2026, 124, 105123. [Google Scholar] [CrossRef] [Scilit]
- Nesru, Y.; Ahmed, M.; Mengistu, A.; Naimuddin, M. Phytochemical Screening and Inhibitory Effects of Catha edulis Forsk Extracts on Oxidation, Growth, Biofilm and Quorum Sensing of Selected Pathogens. J. Genet. Eng. Biotechnol. 2025, 23, 100560. [Google Scholar] [CrossRef] [Scilit] [PubMed]
- Sana; Aftab, T.; Naeem, M.; Jha, P.K.; Prasad, P.V.V. Production of Secondary Metabolites under Challenging Environments: Understanding Functions and Mechanisms of Signalling Molecules. Front. Plant Sci. 2025, 16, 1569014. [Google Scholar] [CrossRef] [Scilit] [PubMed]
- Rahman, T.; Shao, M.; Pahari, S.; Venglat, P.; Soolanayakanahally, R.; Qiu, X.; Rahman, A.; Tanino, K. Dissecting the Roles of Cuticular Wax in Plant Resistance to Shoot Dehydration and Low-Temperature Stress in Arabidopsis. Int. J. Mol. Sci. 2021, 22, 1554. [Google Scholar] [CrossRef] [Scilit] [PubMed]
- Seufert, P.; Staiger, S.; Arand, K.; Bueno, A.; Burghardt, M.; Riederer, M. Building a Barrier: The Influence of Different Wax Fractions on the Water Transpiration Barrier of Leaf Cuticles. Front. Plant Sci. 2022, 12, 766602. [Google Scholar] [CrossRef] [Scilit] [PubMed]
- Xue, D.; Zhang, X.; Lu, X.; Chen, G.; Chen, Z.-H. Molecular and Evolutionary Mechanisms of Cuticular Wax for Plant Drought Tolerance. Front. Plant Sci. 2017, 8, 621. [Google Scholar] [CrossRef] [Scilit] [PubMed]
- Lee, S.B.; Suh, M.C. Regulatory Mechanisms Underlying Cuticular Wax Biosynthesis. J. Exp. Bot. 2022, 73, 2799–2816. [Google Scholar] [CrossRef] [Scilit] [PubMed]
- Shaheenuzzamn, M.; Shi, S.; Sohail, K.; Wu, H.; Liu, T.; An, P.; Wang, Z.; Hasanuzzaman, M. Regulation of Cuticular Wax Biosynthesis in Plants under Abiotic Stress. Plant Biotechnol. Rep. 2021, 15, 1–12. [Google Scholar] [CrossRef] [Scilit]
- Lewandowska, M.; Keyl, A.; Feussner, I. Wax Biosynthesis in Response to Danger: Its Regulation upon Abiotic and Biotic Stress. New Phytol. 2020, 227, 698–713. [Google Scholar] [CrossRef] [Scilit] [PubMed]
- Falk, J.; Munné-Bosch, S. Tocochromanol Functions in Plants: Antioxidation and Beyond. J. Exp. Bot. 2010, 61, 1549–1566. [Google Scholar] [CrossRef] [Scilit] [PubMed]
- Atkinson, J.; Epand, R.F.; Epand, R.M. Tocopherols and Tocotrienols in Membranes: A Critical Review. Free Radic. Biol. Med. 2008, 44, 739–764. [Google Scholar] [CrossRef] [Scilit] [PubMed]
- Mène-Saffrané, L. Vitamin E Biosynthesis and Its Regulation in Plants. Antioxidants 2017, 7, 2. [Google Scholar] [CrossRef] [Scilit] [PubMed]
- Tang, C.; Tao, G.; Wang, Y.; Liu, Y.; Li, J. Identification of α-Tocopherol and Its Oxidation Products by Ultra-Performance Liquid Chromatography Coupled with Quadrupole Time-of-Flight Mass Spectrometry. J. Agric. Food Chem. 2020, 68, 669–677. [Google Scholar] [CrossRef] [Scilit] [PubMed]
- Box, L.A.; Edwards, G.R.; Bryant, R.H. Seasonal and Diurnal Changes in Aucubin, Catalpol and Acteoside Concentration of Plantain Herbage Grown at High and Low N Fertiliser Inputs. N. Z. J. Agric. Res. 2019, 62, 343–353. [Google Scholar] [CrossRef] [Scilit]
- Dixon, R.A.; Paiva, N.L. Stress-Induced Phenylpropanoid Metabolism. Plant Cell 1995, 7, 1085–1097. [Google Scholar] [CrossRef] [Scilit] [PubMed]
- Alipieva, K.; Korkina, L.; Orhan, I.E.; Georgiev, M.I. Verbascoside—A Review of Its Occurrence, (Bio)Synthesis and Pharmacological Significance. Biotechnol. Adv. 2014, 32, 1065–1076. [Google Scholar] [CrossRef] [Scilit] [PubMed]
- Sivanandarajah, K.; Donaghy, D.; Kemp, P.; Navarrete, S.; Horne, D.; Ramilan, T.; Molano, G.; Pacheco, D. Effects of Plantain (Plantago lanceolata L.) Metabolites Aucubin, Acteoside, and Catalpol on Methane Emissions In Vitro. J. Agric. Food Chem. 2025, 73, 12132–12145. [Google Scholar] [CrossRef] [Scilit] [PubMed]
- Mraja, A.; Unsicker, S.B.; Reichelt, M.; Gershenzon, J.; Roscher, C. Plant Community Diversity Influences Allocation to Direct Chemical Defence in Plantago lanceolata. PLoS ONE 2011, 6, e28055. [Google Scholar] [CrossRef] [Scilit] [PubMed]
- Barton, K.E.; Bowers, M.D. Neighbor Species Differentially Alter Resistance Phenotypes in Plantago. Oecologia 2006, 150, 442–452. [Google Scholar] [CrossRef] [Scilit] [PubMed]
- Lichtenthaler, H.K. Chlorophylls and Carotenoids: Pigments of Photosynthetic Biomembranes. In Methods in Enzymology; Academic Press: San Diego, CA, USA, 1987; Volume 148, pp. 350–382. [Google Scholar] [CrossRef] [Scilit]
- Chazaux, M.; Schiphorst, C.; Lazzari, G.; Caffarri, S. Precise Estimation of Chlorophyll a, b and Carotenoid Content by Deconvolution of the Absorption Spectrum and New Simultaneous Equations for Chl Determination. Plant J. 2022, 109, 1630–1648. [Google Scholar] [CrossRef] [Scilit] [PubMed]
- Mohammed, N.K. Phytochemical Screening by FTIR Spectroscopic Analysis and Anti-Bacterial Activity of Methanolic Extract of Selected Medicinal Plant of Anethum graveolens and Plantago major. Ann. Rom. Soc. Cell Biol. 2021, 25, 3110–3122. [Google Scholar]
- Dewi, A.F. Phytochemicals and the Ability of Plantago major Linn. Extract to Inhibit the Growth of Aeromonas hydrophila. Res. J. Life Sci. 2021, 8, 103–111. [Google Scholar] [CrossRef] [Scilit]
- Johnson, J.; Mani, J.; Ashwath, N.; Naiker, M. Potential for Fourier Transform Infrared (FTIR) Spectroscopy toward Predicting Antioxidant and Phenolic Contents in Powdered Plant Matrices. Spectrochim. Acta A Mol. Biomol. Spectrosc. 2020, 233, 118228. [Google Scholar] [CrossRef] [Scilit] [PubMed]
- Lewis, R.N.A.H.; McElhaney, R.N. Fourier Transform Infrared Spectroscopy in the Study of Lipid Phase Transitions in Model and Biological Membranes. In Methods in Membrane Lipids; Dopico, A.M., Ed.; Methods in Molecular Biology; Humana Press: Totowa, NJ, USA, 2007; Volume 400, pp. 207–226. [Google Scholar]
- Berthomieu, C.; Hienerwadel, R. Fourier Transform Infrared (FTIR) Spectroscopy. Photosynth. Res. 2009, 101, 157–170. [Google Scholar] [CrossRef] [Scilit] [PubMed]
- Guo, Q.; Ai, L.; Cui, S.W. Fourier Transform Infrared Spectroscopy (FTIR) for Carbohydrate Analysis. In Methodology for Structural Analysis of Polysaccharides; SpringerBriefs in Molecular Science; Springer: Cham, Switzerland, 2018; pp. 69–71. [Google Scholar]
- Faix, O. Fourier Transform Infrared Spectroscopy. In Methods in Lignin Chemistry; Lin, S.Y., Dence, C.W., Eds.; Springer: Berlin/Heidelberg, Germany, 1992; pp. 83–109. [Google Scholar]

Disclaimer/Publisher’s Note: The statements, opinions and data contained in all publications are solely those of the individual author(s) and contributor(s) and not of MDPI and/or the editor(s). MDPI and/or the editor(s) disclaim responsibility for any injury to people or property resulting from any ideas, methods, instructions or products referred to in the content. |
© 2026 by the authors. Licensee MDPI, Basel, Switzerland. This article is an open access article distributed under the terms and conditions of the Creative Commons Attribution (CC BY) license.