


Highlights
What are the main findings?
- Favorable plant performance across most evaluated traits was observed at 80% of pot water capacity.
- Excessive soil water availability, particularly at 120% of pot water capacity, adversely affected morphoagronomic and physiological performance in most evaluated genotypes.
- Urochloa humidicola showed greater stability under high soil water availability than the other evaluated genotypes.
What are the implications of the main findings?
- Approximately 80% of pot water capacity is proposed as a suitable reference condition for control treatments in controlled-environment waterlogging experiments.
- The defined soil water conditions provide a methodological basis for screening tropical forage grasses for waterlogging tolerance.
Abstract
The efficiency of screening tropical forage grass genotypes for waterlogging tolerance under controlled conditions depends on experimental protocols capable of accurately discriminating contrasting genotypes. This study evaluated morphoagronomic and physiological traits of Megathyrsus maximus and Urochloa spp. genotypes subjected to different soil water availabilities to define suitable experimental conditions for waterlogging screening. Two independent experiments were conducted in a randomized complete block design using a 5 × 4 factorial arrangement (five genotypes × four soil water regimes) with four replications, in which morphoagronomic and physiological traits were evaluated. The present study combines previously published data from the 80% and 120% pot water capacity treatments with data from the additional 60% and 100% treatments. Overall, favorable genotype performance was observed around the directly tested 80% of pot water capacity, with greater biomass production, higher numbers of green leaves, higher SPAD index values, and improved photosynthetic performance across several traits and genotypes. In contrast, 120% of pot water capacity caused the greatest reductions in plant growth and physiological activity, allowing clear discrimination between tolerant and susceptible genotypes, whereas 60% and 100% of pot water capacity produced less pronounced effects. The results indicate that approximately 80% of pot water capacity is the most suitable condition for the control treatment, whereas 120% efficiently induces waterlogging stress. This methodological approach provides an experimental basis for standardizing controlled-environment screening assays, improving the reliability of early-stage selection of tropical forage grass genotypes for waterlogging tolerance.
1. Introduction
Brazilian livestock production is supported by approximately 161 million hectares of pastureland, accounting for about 19% of the country’s territory [1]. Grasses of the genus Urochloa spp. (syn. Brachiaria spp.) comprise approximately 85% of Brazil’s cultivated pastures and are widely distributed throughout tropical regions [2]. Cultivars of Megathyrsus maximus (syn. Panicum maximum) are also economically important because of their high forage productivity, broad genetic diversity, and adaptation to diverse edaphoclimatic conditions [3]. In addition to their importance as livestock feed, species of both genera support the Brazilian tropical forage seed industry, with Brazil being the world’s leading exporter of tropical forage seeds to Latin American countries [4].
Throughout their life cycle, perennial tropical forage grasses may experience contrasting soil moisture conditions, ranging from water limitation to prolonged excess water [5,6]. These conditions can disrupt plant morphological, physiological, and biochemical processes, reducing growth and biomass accumulation and, under severe stress, compromising survival [7]. In tropical pasture systems, excessive soil moisture is also associated with Marandu Death Syndrome (MDS), a condition involving plant mortality in areas subject to temporary soil saturation or flooding [8,9].
The development of Marandu Death Syndrome (MDS) involves the combined effects of waterlogging-induced physiological stress and infection by soil-borne phytopathogens, particularly species belonging to the genera Pythium, Rhizoctonia, and Fusarium [8]. Occurrences have been documented across several Brazilian Amazonian states [10] and in other tropical areas of the Americas, such as the Llanos of Colombia and Venezuela and the savannas of Guyana [11]. Given the multifactorial nature of MDS, experiments conducted under controlled conditions can focus specifically on plant responses to excess soil water, allowing waterlogging tolerance to be investigated separately from pathogen-related effects.
The importance of this problem has led the Brazilian Agricultural Research Corporation (Embrapa) and the International Center for Tropical Agriculture (CIAT) to conduct studies aimed at identifying waterlogging-tolerant genotypes by evaluating the effects of excess soil water while excluding the influence of pathogens [12,13,14,15,16,17,18]. These studies demonstrated that morphological, physiological, and anatomical adjustments are important adaptive mechanisms associated with waterlogging tolerance and provided the scientific basis for recommending cultivars for cultivation in poorly drained soils. However, despite these advances, considerable variation remains in the experimental protocols used to evaluate this trait. Previous studies have employed permanent water layers ranging from approximately 2 to 5 cm to simulate waterlogging, whereas the control treatment has generally been described as soil maintained at or near pot water capacity, often without a quantitative definition of soil water availability [12,13,14,15,16,17,18]. This lack of methodological standardization hinders comparisons among studies and may compromise the ability of screening assays to discriminate between waterlogging-tolerant and susceptible genotypes. Standardized experimental conditions are essential because they increase the repeatability of screening assays and improve the comparability of results among breeding programs. Although field capacity—or pot water capacity in container experiments—is traditionally regarded as the condition that maximizes water availability for plant uptake [19], studies have shown that tropical forage grasses may achieve maximum growth and biomass production at soil water availabilities below the maximum water-holding capacity of the soil [20,21]. Likewise, excessively severe waterlogging conditions may not accurately represent those commonly encountered under field conditions, where natural drainage limits the persistence of standing water on the soil surface [22]. Consequently, the soil water availability most suitable for the control treatment, as well as the level of waterlogging required to maximize the discrimination between tolerant and susceptible genotypes in controlled-environment screening assays, has yet to be established.
In plant breeding programs, the efficiency of genotype selection depends on the ability of experimental protocols to reveal true differences among the evaluated genotypes. Therefore, inappropriate conditions for either control or stress treatment may reduce the contrast between tolerant and susceptible genotypes, compromising selection accuracy and limiting comparisons among studies conducted by different research groups. Recently, a set of morphoagronomic and physiological traits was proposed for discriminating M. maximus and Urochloa spp. genotypes under controlled conditions [23]. However, the soil water conditions that maximize the discriminatory capacity of these selection criteria have not yet been established, limiting the methodological standardization of screening assays for the early stages of breeding programs. We hypothesized that distinct soil water availability levels could be identified to establish a suitable control condition for plant growth and a waterlogging stress condition capable of inducing contrasting morphoagronomic and physiological responses among tropical forage grass genotypes.
Based on this, the objective of this study was to evaluate the morphoagronomic and physiological responses of M. maximus and Urochloa spp. genotypes subjected to different soil water availabilities in order to establish the most appropriate soil water conditions for controlled-environment screening assays for waterlogging tolerance.
2. Materials and Methods
2.1. Experimental Site
The experiments were carried out at Embrapa Acre’s experimental station in Rio Branco, Acre, Brazil, situated at 9°58′22″ S, 67°48′40″ W, at an elevation of 159 m above sea level. Climatic records reported by de Sousa [24] indicate annual averages of 2022 mm for precipitation, 25.46 °C for air temperature, and 85.2% for relative humidity.
2.2. Plant Material and Growing Conditions
Between 2020 and 2021, two independent experiments were carried out in a greenhouse with a transparent glass roof and white mesh side enclosures. The experiments involved genotypes of M. maximus and Urochloa spp., as detailed in Table 1. These genotypes were selected to represent a range of previously reported MDS tolerance levels, providing contrasting plant materials for evaluating soil water conditions suitable for controlled-environment screening assays in the early stages of forage breeding programs.
Table 1.
Species and genotypes of tropical forages used in the experiments, with previously reported tolerance levels to Marandu Death Syndrome.
The experimental units and corresponding observations from the 80% and 120% pot water capacity treatments were previously included in Experiment 2 (M. maximus) and Experiment 4 (Urochloa spp.), respectively, of Souza et al. [23]. In that study, these data were used as part of a two-condition comparison aimed at identifying traits associated with waterlogging tolerance and evaluating contrasting genotypes. In the present study, these experimental units and observations were analyzed together with those from the 60% and 100% pot water capacity treatments, which were not included in the previous publication, to evaluate plant responses across a four-level soil water availability gradient and address the distinct methodological objective of defining suitable soil water conditions for controlled-environment screening.
Plants were grown in 5 kg of a growth medium prepared with soil and sand at a 1:1 (v/v) ratio, without the addition of mineral fertilizers. The soil and sand were subjected to separate chemical analyses, and their properties are reported in Table 2. To prepare the substrate, washed and oven-dried sand was combined with a Rhodic Hapludox obtained from the upper 0–20 cm soil layer of an agricultural area at the Embrapa Acre experimental station. The soil was air-dried and passed through a sieve before being mixed with the sand. Plant nutrient status, including nitrogen status, was not directly assessed.
Table 2.
Chemical composition of the soil and sand.
For each genotype, 100 seeds were germinated using a commercial growing medium containing decomposed Pinus bark and ash. Unlike the other genotypes, Ub001 was established vegetatively from 10-cm-long tillers with an equal number of leaves, obtained at the Embrapa Acre experimental station. Ten days after sowing, three uniform and vigorous seedlings of each genotype were transplanted into 5.5-L plastic pots (24.5 cm upper diameter, 15.2 cm lower diameter, and 21.0 cm height) containing 5 kg of the growth medium. Three tillers of Ub001 were placed directly into each pot on the same day. After another 10 days, thinning was performed to leave only the most vigorous and uniform plant in each pot. All pots were subsequently maintained at 90% of pot water capacity for an additional 10 days. Thus, the establishment period lasted 20 days after transplanting. The four soil water availability treatments (60%, 80%, 100%, and 120% of pot water capacity) were then imposed for 21 days, resulting in a total experimental period of 41 days from transplanting to harvest. The reference value for 100% pot water capacity was determined previously from the average of four pots, following the method reported by Souza et al. [23]. Briefly, four pots containing 5 kg of dry substrate over 500 g of gravel (19–25 mm) were saturated with water and allowed to drain freely. The pots were weighed before saturation and subsequently at 1-h intervals during drainage until a constant mass was reached. Pot water capacity was then calculated as the difference between the constant mass recorded after drainage and the initial mass measured before saturation.
Both experiments were conducted using a randomized complete block design with four replications arranged in a 5 × 4 factorial design (five genotypes × four soil water availability levels: 60%, 80%, 100%, and 120% of pot water capacity). In the 120% treatment, soil water availability was maintained gravimetrically by daily weighing and water replacement to the predetermined pot mass corresponding to 120% of pot water capacity. Under these conditions, an approximately 1-cm water layer formed above the soil surface; this water layer was a consequence of maintaining the predetermined 120% pot water capacity and was not used as the criterion for water replacement. To prevent drainage and water loss, these pots were placed inside sealed outer containers lined with plastic bags. In the 60%, 80%, and 100% treatments, drainage occurred freely through holes in the bottom of the pots.
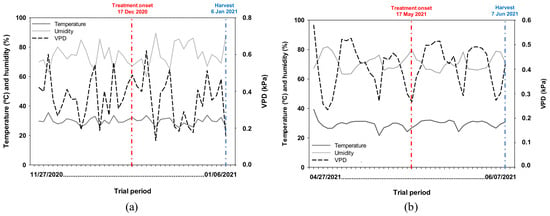
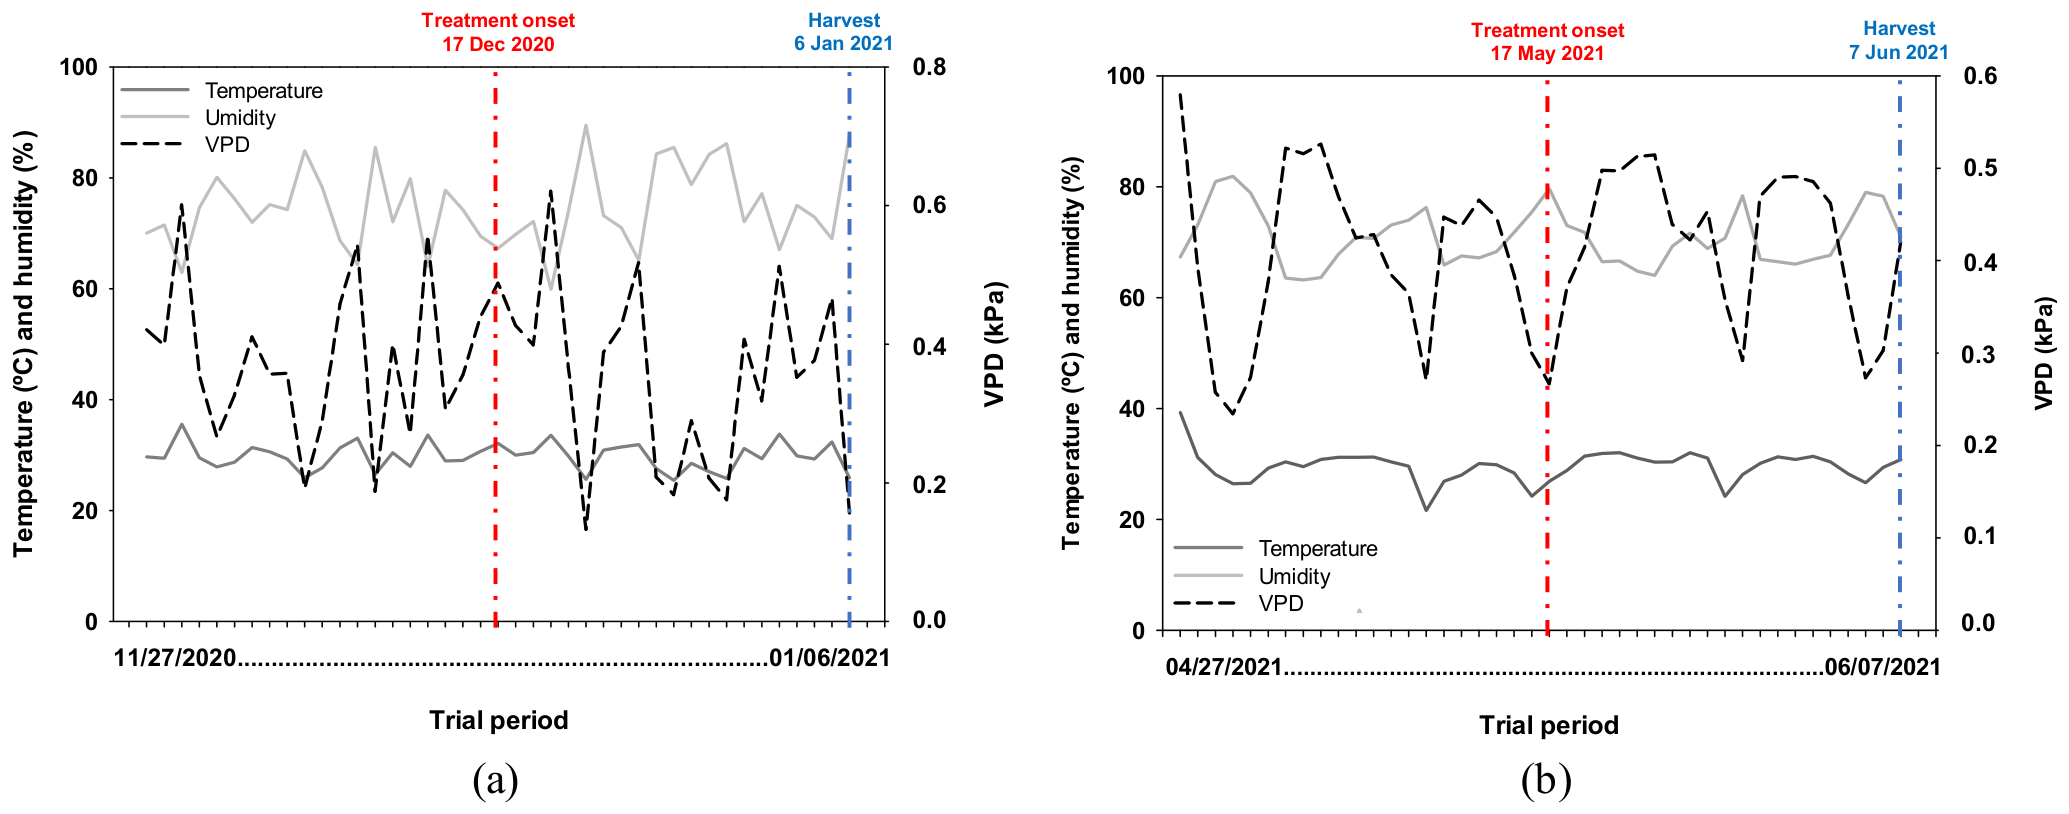
Air temperature and relative humidity were monitored inside the screenhouse during each experiment, and the recorded values were used to estimate vapor pressure deficit (VPD) using the Tetens equation [27]. Although the experiments were performed in different years and seasons, the semi-controlled growing environment reduced exposure to external climatic influences, particularly precipitation. Figure 1 illustrates the daily fluctuations in temperature, relative humidity, and VPD throughout the experimental periods. Because the experiments were conducted at different times, each dataset was analyzed separately, without statistical comparisons between experiments.
Figure 1.
Daily variation in temperature, relative humidity, and vapor pressure deficit (VPD) in a screenhouse (Embrapa Acre) for experiments with: (a) M. maximus and (b) Urochloa spp.
2.3. Plant Measurements
Morphoagronomic traits, SPAD index, and physiological variables related to leaf gas exchange were evaluated at the end of the 21 days of exposure to the different soil water availability levels, corresponding to 41 days after transplanting. The duration of the stress period followed the screening protocol proposed by the International Center for Tropical Agriculture (CIAT) [28]. This protocol consists of growing Urochloa plants under controlled conditions followed by 21 days of continuous waterlogging, allowing the evaluation of key morphophysiological traits, including green leaf biomass, SPAD index, and photosynthetic performance.
For each experimental unit, fully expanded leaves were counted separately according to their condition (green, yellow, or senescent), and the counts were combined to obtain the total leaf number. Tillers were also counted individually in each pot.
Leaf elongation rate was determined according to the methodology described by Dias-Filho and Carvalho [12]. A young expanding leaf, with the ligule not yet exposed, was selected and marked on each evaluated plant. Leaf length was measured daily, at approximately the same time, until ligule emergence. When the ligule became visible, another young expanding leaf was selected for subsequent measurements. Leaf elongation rate was calculated as the difference between leaf lengths recorded on consecutive days divided by the measurement interval (one day) and expressed in cm day−1. The SPAD index was determined using a chlorophyll meter (SPAD-502, Minolta Radiometric Instruments Division, Osaka, Japan) [29]. For each experimental unit, three fully expanded leaves were selected, and three successive readings were obtained from the middle third of each leaf, totaling nine measurements. The mean of these measurements was used for statistical analysis.
At the end of the 21-day soil water treatment period (41 days after transplanting), stem, root, and total dry mass were determined. The aboveground portion of each plant was cut at soil level, after which leaf blades were separated from stems and their associated sheaths at the ligule junction. The root system was washed with running water to remove the remaining growth medium. Subsequently, the collected plant fractions were maintained in a forced-air oven at 65 °C for 72 h before their dry mass was measured. Total dry mass was obtained by adding the dry mass values of leaf blades, stems, and roots.
Leaf gas exchange was assessed between 09:00 and 11:00 h using a portable infrared gas analyzer (IRGA; LI-6400XT, LI-COR Biosciences Inc., Lincoln, NE, USA). Measurements were obtained from the middle third of a young leaf blade that had reached full expansion. During the evaluations, the leaf chamber was operated with photosynthetically active radiation (PAR) of 1200 μmol photons m−2 s−1, a CO2 concentration of 400 μmol mol−1, and an air temperature of 30 °C. The air flow rate was approximately 300 μmol s−1, and the enclosed leaf area was 2 cm2. Chamber relative humidity and leaf-to-air vapor pressure deficit (VPD) were recorded during measurements. In the available IRGA records, chamber sample relative humidity ranged from 41.4% to 57.4%, while leaf-to-air VPD ranged from 2.08 to 3.63 kPa. Measurements were conducted sequentially by soil water availability treatment, following the order 60%, 80%, 100%, and 120% of pot water capacity. All genotypes and replicates within each treatment were evaluated before proceeding to the next treatment. The physiological variables recorded were net photosynthetic rate (Pn), stomatal conductance (gs), transpiration rate (E), and intercellular CO2 concentration (Ci). Carboxylation efficiency (CE) and water use efficiency (WUE) were subsequently obtained from the Pn/Ci and Pn/E ratios, respectively.
2.4. Statistical Analysis
Statistical analyses were performed using R software version 4.1.3 [30]. The assumptions of normality of residuals and homogeneity of variances were assessed using the ExpDes package version 1.2.2 [31]. Data were then subjected to analysis of variance (ANOVA), and treatment effects were evaluated by the F-test at the 5% significance level. When the genotype × soil water availability interaction was significant, the interaction was decomposed to evaluate the effect of soil water availability within each genotype. For genotypes showing a significant effect of soil water availability, linear and quadratic polynomial regression models were fitted. Model selection was based primarily on the significance of the polynomial components and the lack-of-fit test. A quadratic model was selected when the quadratic component was significant and the model showed no significant lack of fit. Otherwise, a linear model was retained when the linear component was significant and showed no significant lack of fit. When both models provided an adequate fit, the lower-order model was preferred according to the principle of parsimony. The coefficient of determination (R2) was used as a complementary measure of goodness of fit. When neither the linear nor the quadratic model provided an adequate fit, no regression equation was retained. Because only four soil water availability levels were evaluated, cubic regression models were not considered for model selection, as a third-degree polynomial would be saturated, leaving no degrees of freedom for assessing lack of fit. All statistical tests were performed at the 5% significance level.
3. Results
3.1. Morphoagronomic Traits and the SPAD Index
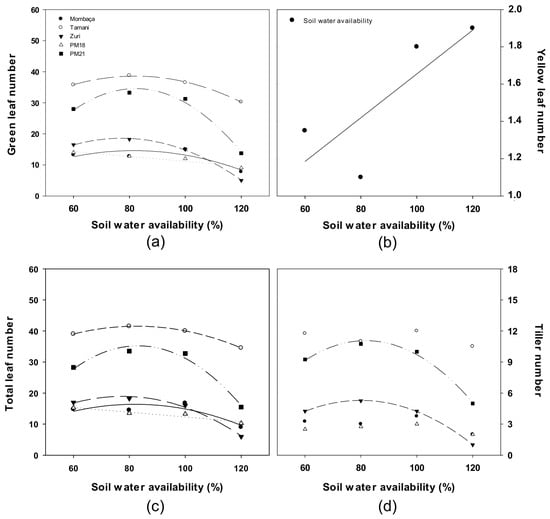
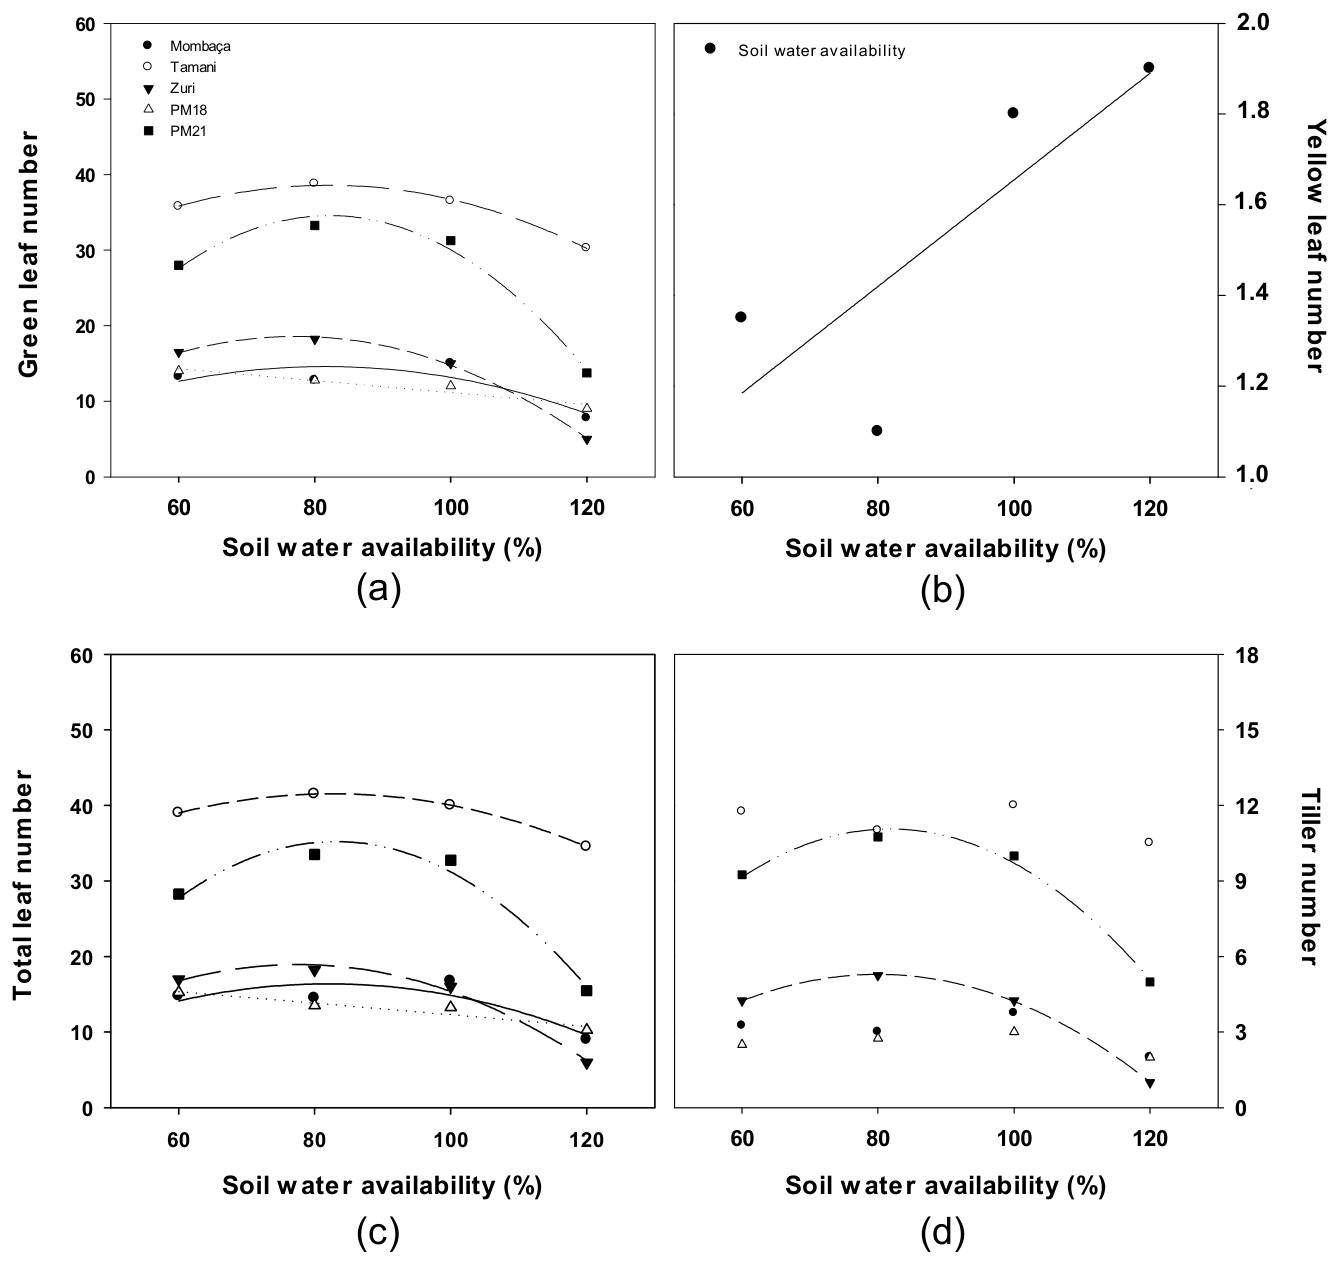
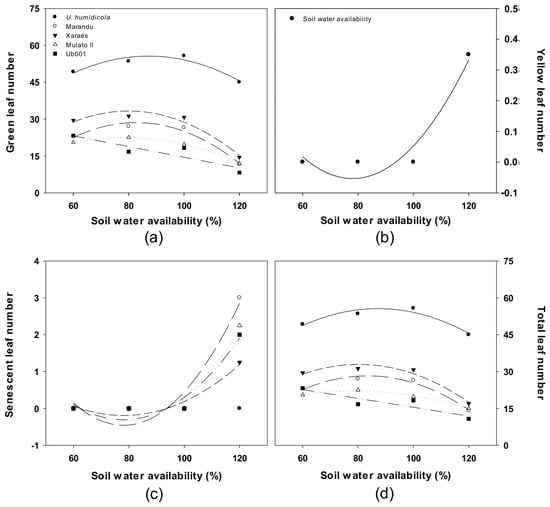
On average, soil water availability corresponding to 81% of pot water capacity resulted in the highest numbers of green and total leaves in most M. maximus (Figure 2a,c) and Urochloa spp. genotypes (Figure 3a,d). The exceptions were PM18 and Ub001, in which both traits decreased linearly with increasing soil water availability.
Figure 2.
Green leaf number (a), yellow leaf number (b), total leaf number (c), and tiller number (d) of five M. maximus genotypes grown under different soil water availability levels (% of pot water capacity). Note: Regression equations and coefficients of determination (R2) are presented only for significant models (p < 0.05). The symbols used in panels (c,d) correspond to the genotypes identified in panel (a).
Figure 3.
Green leaf number (a), yellow leaf number (b), senescent leaf number (c), and total leaf number (d) of five Urochloa spp. genotypes grown under different soil water availability levels (% of pot water capacity). Note: Regression equations and coefficients of determination (R2) are presented only for significant models (p < 0.05). The symbols used in panels (c,d) correspond to the genotypes identified in panel (a).
Green leaf number: Mombaça: y = −13.4625 + 0.6881x − 0.0042x2 (R2 = 0.74; p = 0.00026); BRS Tamani: y = −0.1875 + 0.9469x − 0.0058x2 (R2 = 0.99; p < 0.00001); BRS Zuri: y = −25.1375 + 1.1331x − 0.0073x2 (R2 = 0.99; p < 0.00001); PM18: y = 19.0250 − 0.0787x (R2 = 0.92; p = 0.00015); PM21: y = −61.3625 + 2.3356x − 0.0142x2 (R2 = 0.98; p < 0.00001).
Yellow leaf number: Soil water availability: y = 0.4800 + 0.0118x (R2 = 0.65; p = 0.01241).
Total leaf number: Mombaça: y = −15.1250 + 0.7687x − 0.0047x2 (R2 = 0.76; p = 0.00038); BRS Tamani: y = −23.2625 + 1.0894x − 0.0070x2 (R2 = 0.99; p < 0.00001); BRS Zuri: y = 7.5000 + 0.8250x − 0.0050x2 (R2 = 0.99; p = 0.00017); PM18: y = 19.9250 − 0.0762x (R2 = 0.90; p = 0.00111); PM21: y = −61.8250 + 2.3363x − 0.0141x2 (R2 = 0.92; p < 0.00001).
Tiller number: BRS Zuri: y = −11.6625 + 0.4244x − 0.0027x2 (R2 = 0.99; p < 0.00001); PM21: y = −16.0500 + 0.6637x − 0.0041x2 (R2 = 0.99; p < 0.00001).
Each point represents the mean of four independent replicates (n = 4) per genotype and soil water availability level. ANOVA results are provided in Tables S1 and S3, while the corresponding means ± SE are presented in Tables S2 and S4. Data from the 80% and 120% treatments, previously published by Souza et al. [23], were combined with data from the 60% and 100% treatments.
Green leaf number: U. humidicola: y = −15.6500 + 1.6350x − 0.0094x2 (R2 = 0.91; p < 0.00001); Marandu: y = −52.5000 + 1.9625x − 0.0119x2 (R2 = 0.97; p < 0.00001); Xaraés: y = −38.5250 + 1.7975x − 0.0112x2 (R2 = 0.95; p < 0.00001); Mulato II: y = −14.9125 + 0.9556x − 0.0061x2 (R2 = 0.99; p < 0.00001); Ub001: y = 36.2000 − 0.2175x (R2 = 0.81; p < 0.00001).
Yellow leaf number: Soil water availability: y = 1.2775 − 0.0341x + 0.0002x2 (R2 = 0.93; p < 0.00122).
Senescent leaf number: Marandu: y = 10.9500 − 0.2925x + 0.0019x2 (R2 = 0.93; p < 0.00001); Xaraés: y = 4.5625 − 0.1219x + 0.0008x2 (R2 = 0.93; p < 0.00001); Mulato II: y = 8.2125 − 0.2194x + 0.0014x2 (R2 = 0.93; p < 0.00001); Ub001: y = 7.3000 − 0.1950x + 0.0013x2 (R2 = 0.93; p < 0.00001).
Total leaf number: U. humidicola: y = −15.6500 + 1.6350x − 0.0094x2 (R2 = 0.91; p < 0.00001); Marandu: y = −43.3750 + 1.7188x − 0.0103x2 (R2 = 0.91; p < 0.00001); Xaraés: y = −29.4000 + 1.5537x − 0.0097x2 (R2 = 0.96; p < 0.00001); Mulato II: y = −3.9625 + 0.6631x −0.0042x2 (R2 = 0.99; p < 0.00001); Ub001: y = 33.4500 − 0.1800x (R2 = 0.82; p < 0.00001).
Each point represents the mean of four independent replicates (n = 4) per genotype and soil water availability level. ANOVA results are provided in Table S5, while the corresponding means ± SE are presented in Table S6. Data from the 80% and 120% treatments, previously published by Souza et al. [23], were combined with data from the 60% and 100% treatments.
The 60% and 120% soil water availability treatments reduced the number of green leaves in all M. maximus and Urochloa spp. genotypes that exhibited quadratic responses, with the greatest reductions occurring at 120% of pot water capacity (Figure 2a and Figure 3a). In M. maximus, no senescent leaves were recorded under any soil water availability level; however, yellow leaves were observed across the different soil water availability levels, with variation among genotypes and treatments (Figure 2b). In Urochloa spp., leaf yellowing also occurred exclusively at 120% of pot water capacity, whereas senescent leaves were recorded only under this condition, except in U. humidicola, in which no senescent leaves were observed at any soil water availability level (Figure 3b,c).
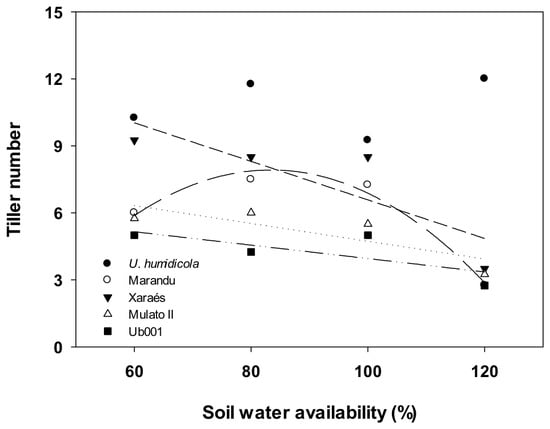
Regarding tillering, only ‘BRS Zuri’ and PM21 of M. maximus exhibited quadratic responses, with the highest tiller number occurring at approximately 80% of pot water capacity and decreasing toward both extremes of soil water availability, particularly at 120%, whereas ‘Mombaça’, ‘BRS Tamani’, and PM18 showed no response to soil water availability (Figure 2d). In Urochloa spp., ‘Marandu’ also exhibited a quadratic response, with the highest tiller number occurring at approximately 80% of pot water capacity and decreasing toward both extremes, particularly at 120%, whereas ‘Xaraés’, ‘Mulato II’, and Ub001 showed a linear decrease in tiller number with increasing soil water availability (Figure 4).
Figure 4.
Tiller number of five Urochloa spp. genotypes grown under different soil water availability levels (% of pot water capacity). Note: Regression equations and coefficients of determination (R2) are presented only for significant models (p < 0.05).
Tiller number: Marandu: y = −18.1250 + 0.6250x − 0.0037x2 (R2 = 0.98; p < 0.00001); Xaraés: y = 15.2000 − 0.0862x (R2 = 0.71; p < 0.00001); Mulato II: y = 8.7250 − 0.0400x (R2 = 0.66; p = 0.00281); Ub001: y = 6.9500 − 0.0300x (R2 = 0.53; p = 0.02268).
Each point represents the mean of four independent replicates (n = 4) per genotype and soil water availability level. ANOVA results are provided in Table S7, while the corresponding means ± SE are presented in Table S8. Data from the 80% and 120% treatments, previously published by Souza et al. [23], were combined with data from the 60% and 100% treatments.
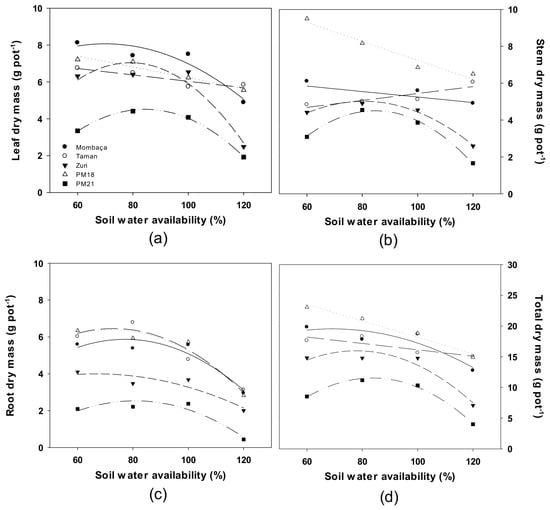
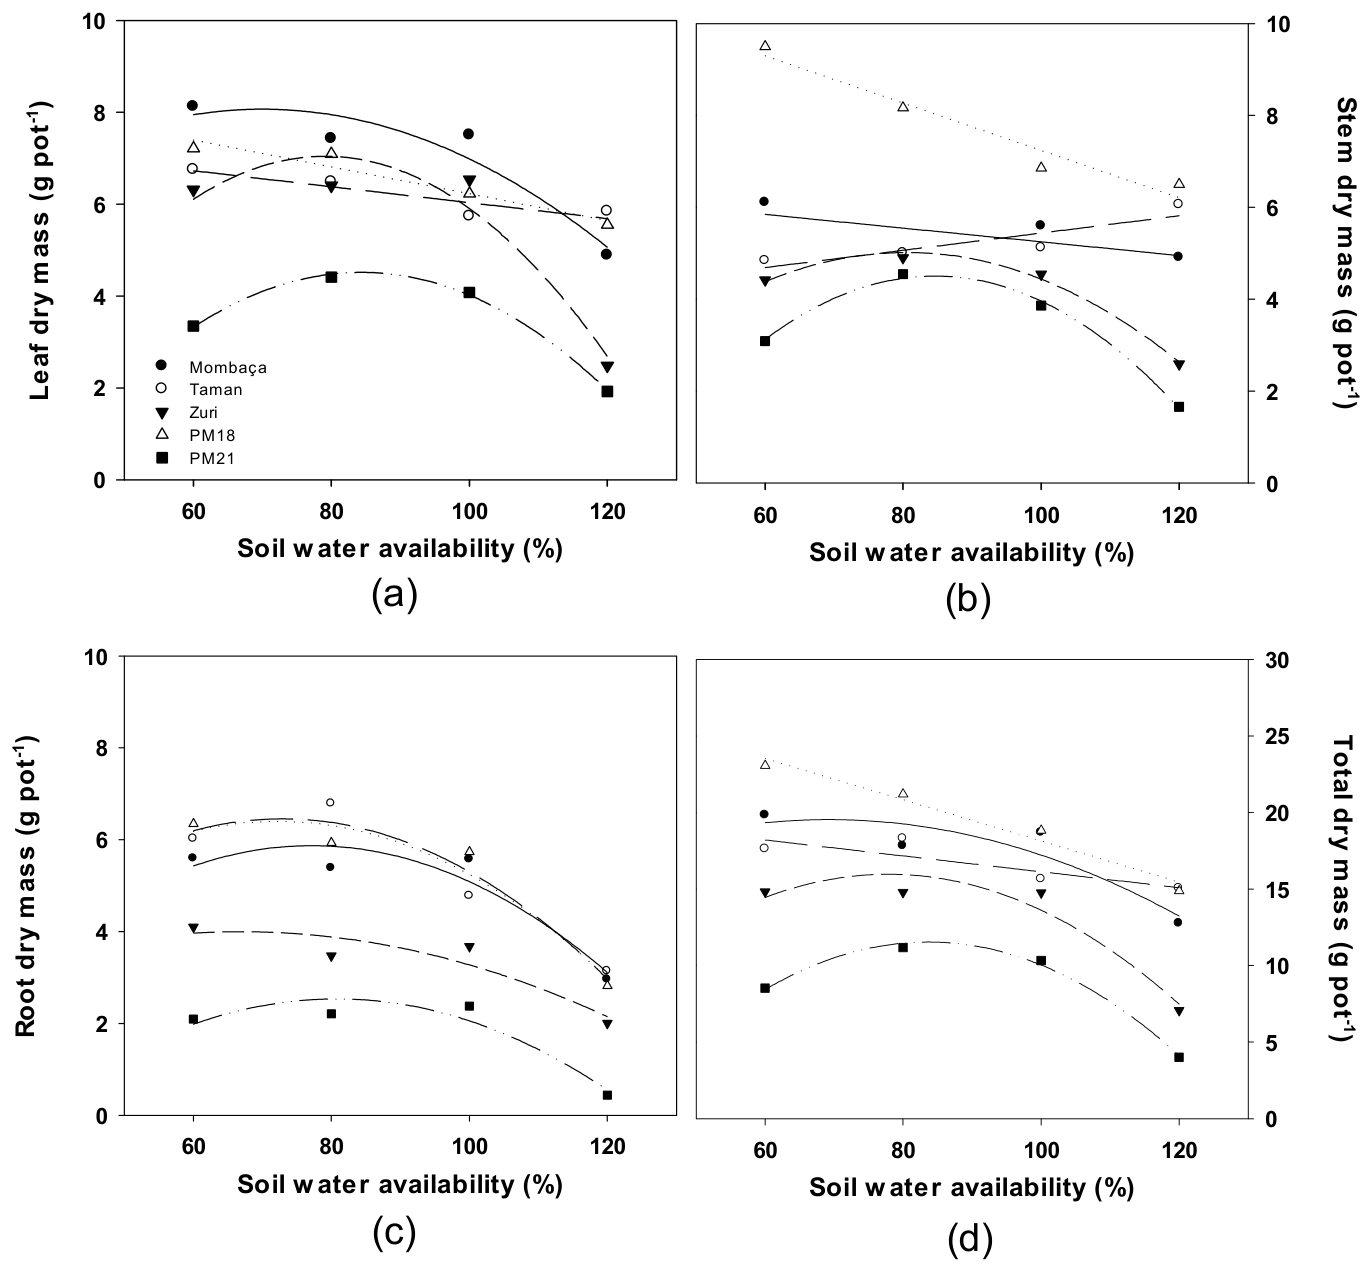
In M. maximus, leaf blade dry mass showed a response pattern like that observed for total dry mass (Figure 5a,d). In Tamani and PM18, both traits decreased linearly with increasing soil water availability. In contrast, ‘Mombaça’, ‘BRS Zuri’, and PM21 exhibited quadratic responses, with maximum values estimated at approximately 78% of pot water capacity. This soil water availability also corresponded closely to that associated with the highest leaf elongation rate and the greatest green leaf number (Figure 2a), whose maximum values occurred, on average, at 81% of pot water capacity.
Figure 5.
Leaf blade dry mass (a), stem dry mass (b), root dry mass (c), and total dry mass (d) of five M. maximus genotypes grown under different soil water availability levels (% of pot water capacity). Note: Regression equations and coefficients of determination (R2) are presented only for significant models (p < 0.05). The symbols used in panels (b–d) correspond to the genotypes identified in panel (a).
Leaf dry mass: Mombaça: y = 2.1713 + 0.1684x − 0.0012x2 (R2 = 0.90; p < 0.00001); BRS Tamani: y = 7.7650 − 0.0174x (R2 = 0.83; p < 0.00001); BRS Zuri: y = −9.1137 + 0.4089x − 0.0026x2 (R2 = 0.92; p < 0.00001); PM18: y = 9.1487 − 0.0292x (R2 = 0.94; p < 0.00001); PM21: y = −9.8090 + 0.3398x − 0.0020x2 (R2 = 0.99; p < 0.00001).
Stem dry mass: Mombaça: y = 6.7415 − 0.0149x (R2 = 0.48); BRS Tamani: y = 3.5600 + 0.0188x (R2 = 0.79; p < 0.00001); BRS Zuri: y = −4.8265 + 0.2448x − 0.0015x2 (R2 = 0.99; p < 0.00001); PM18: y = 12.3875 − 0.0515x (R2 = 0.95; p < 0.00001); PM21: y = −11.8596 + 0.3871x − 0.0023x2 (R2 = 0.99; p < 0.00001).
Root dry mass: Mombaça: y = −3.0874 + 0.2322x − 0.0015x2 (R2 = 0.90; p < 0.00001); BRS Tamani: y = −1.3859 + 0.2158x − 0.0015x2 (R2 = 0.93; p < 0.00001); BRS Zuri: y = 1.0885 + 0.0872x − 0.0007x2 (R2 = 0.85; p < 0.00016); PM18: y = −1.8445 + 0.2280x − 0.0016 × x2 (R2 = 0.94; p < 0.00001); PM21: y = −5.8257 + 0.2072x − 0.0013x2 (R2 = 0.90; p < 0.00001).
Total dry mass: Mombaça: y = 7.8085 + 0.3388x − 0.0024x2 (R2 = 0.84; p < 0.00001); BRS Tamani: y = 21.3035 − 0.0519x (R2 = 0.75; p < 0.00001); BRS Zuri: y = −12.8517 + 0.7408x − 0.0048x2 (R2 = 0.93; p < 0.00001); PM18: y = 31.5905 − 0.1346x (R2 = 0.97; p < 0.00001); PM21: y = −27.4944 + 0.9341x − 0.0056x2 (R2 = 0.99; p < 0.00001).
Each point represents the mean of four independent replicates (n = 4) per genotype and soil water availability level. ANOVA results are provided in Table S9, while the corresponding means ± SE are presented in Table S10. Data from the 80% and 120% treatments, previously published by Souza et al. [23], were combined with data from the 60% and 100% treatments.
Stem dry mass exhibited quadratic responses in ‘BRS Zuri’ and PM21, with maximum values estimated at approximately 83% of pot water capacity. The remaining genotypes showed linear responses, although only ‘BRS Tamani’ exhibited a positive linear trend (Figure 5b). Notably, tiller number remained unchanged across the different soil water availability levels in this genotype (Figure 2d).
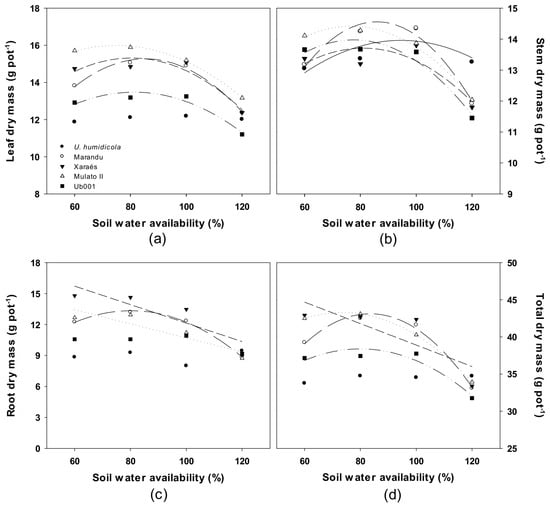
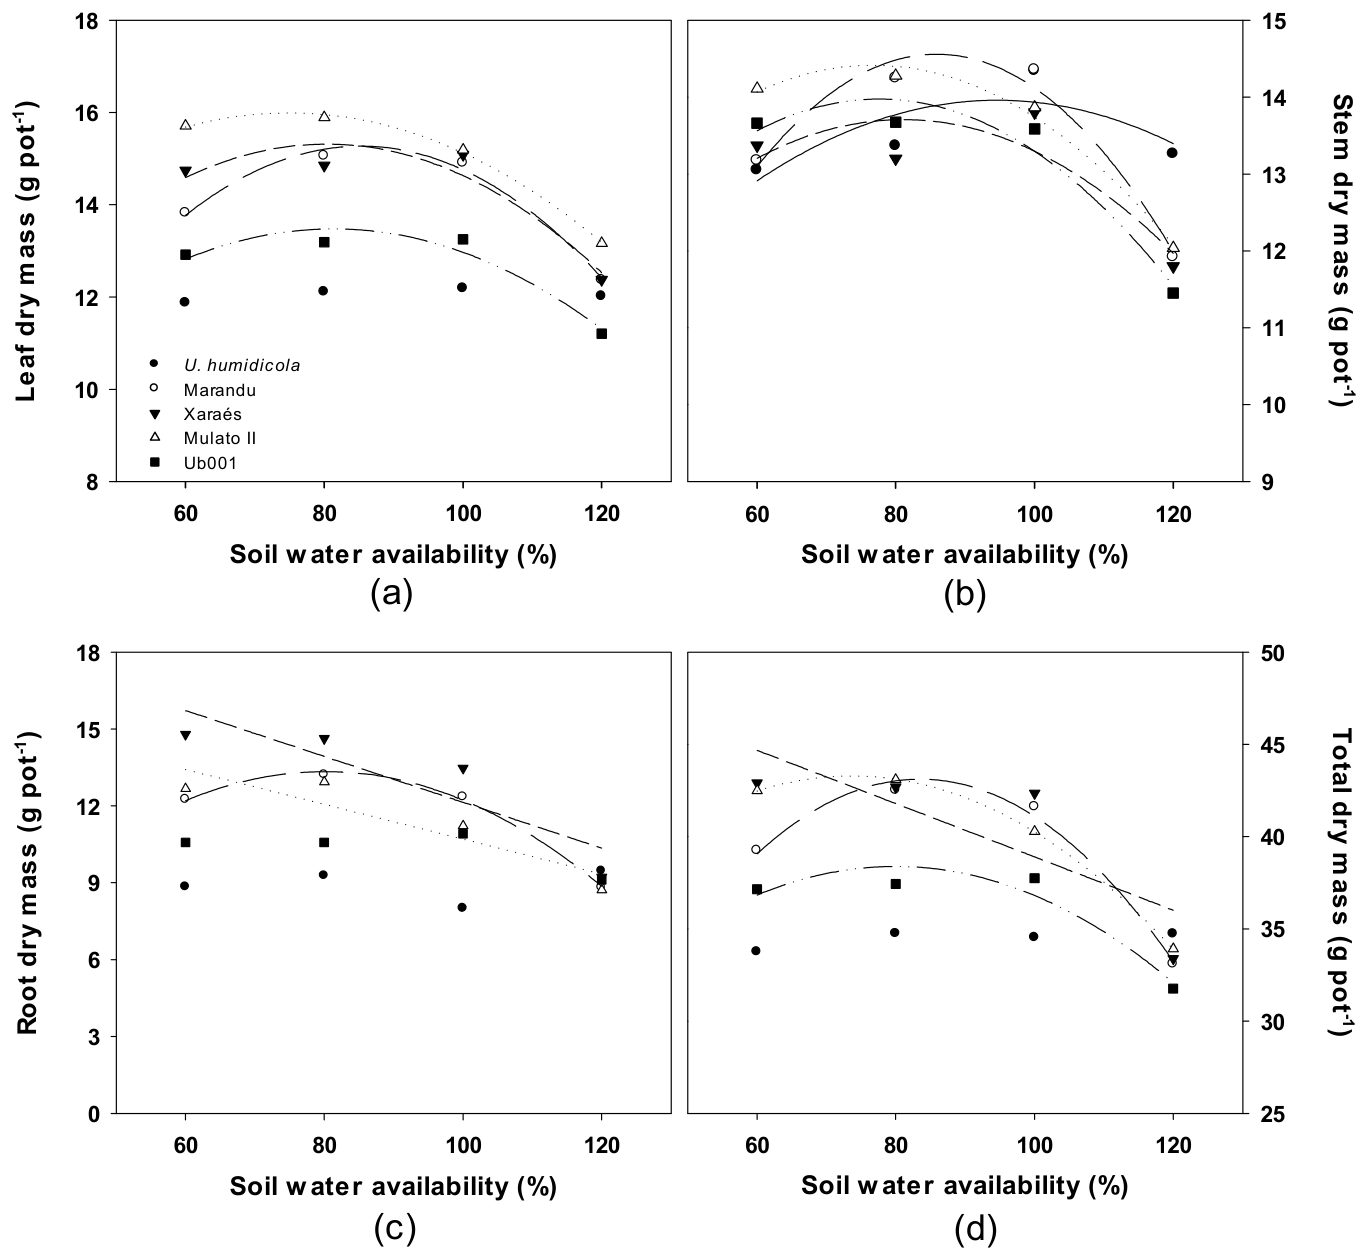
Root dry mass of the M. maximus genotypes reached maximum values, on average, at approximately 72% of pot water capacity and was markedly reduced under the 120% treatment in all genotypes (Figure 5c). A similar response was observed in ‘Xaraés’ and ‘Mulato II’, cultivars of Urochloa spp., whose root dry mass decreased linearly with increasing soil water availability (Figure 6c). In Marandu cultivar, root dry mass exhibited a quadratic response, decreasing under both low and high soil water availability, with the greatest reductions occurring at 120% of pot water capacity.
Figure 6.
Leaf blade dry mass (a), stem dry mass (b), root dry mass (c), and total dry mass (d) of five Urochloa spp. genotypes grown under different soil water availability levels (% of pot water capacity). Note: Regression equations and coefficients of determination (R2) are presented only for significant models (p < 0.05). The symbols used in panels (b–d) correspond to the genotypes identified in panel (a).
Unlike the other Urochloa spp. genotypes and cultivars, no statistically significant effect of soil water availability was detected on leaf blade (F = 0.139, p = 0.936), root (F = 0.868, p = 0.463), or total dry mass (F = 0.187, p = 0.905) of U. humidicola (Figure 6a,c,d). The estimated differences between 80% and 120% of pot water capacity (80% − 120%) were 0.093 g for leaf blade dry mass (95% CI: −0.945 to 1.130 g), −0.190 g for root dry mass (95% CI: −2.156 to 1.776 g), and 0.008 g for total dry mass (95% CI: −3.054 to 3.069 g).
Leaf dry mass: Marandu: y = −1.8417 + 0.4016x − 0.0024x2 (R2 = 0.99; p < 0.00001); Xaraés: y = 3.9378 + 0.2835x − 0.0018 x2 (R2 = 0.90; p = 0.00029); Mulato II: y = 8.2281 + 0.2072x − 0.0014x2 (R2 = 0.99; p = 0.00377); Ub001: y = 3.9174 + 0.2353x − 0.0014x2 (R2 = 0.94; p = 0.00250).
Stem dry mass: U. humidicola: y = 6.1270 + 0.1656x − 0.0009x2 (R2 = 0.62; p = 0.00208); Marandu: y = −1.6053 + 0.3766x − 0.0022x2 (R2 = 0.97; p < 0.00001); Xaraés: y = 6.2245 + 0.1848x − 0.0011x2 (R2 = 0.75; p = 0.00009); Mulato II: y = 7.0740 + 0.1913x − 0.0012x2 (R2 = 0.99; p = 0.00002); Ub001: y = 5.9018 + 0.2083x − 0.0013x2 (R2 = 0.95; p < 0.00001).
Root dry mass: Marandu: y = −4.6928 + 0.4504 x − 0.0028x2 (R2 = 0.99; p = 0.00200); Xaraés: y = 21.0853 − 0.0895x (R2 = 0.76; p < 0.00001); Mulato II: y = 17.4900 − 0.0679x (R2 = 0.82; p = 0.00005).
Total dry mass: Marandu: y = −8.1398 + 1.2285x − 0.0074x2 (R2 = 0.99; p < 0.00001); Xaraés: y = 53.3350 − 0.1444x (R2 = 0.65; p < 0.00001); Mulato II: y = 19.6465 + 0.6420x − 0.0044x2 (R2 = 0.99; p = 0.00208); Ub001: y = 13.3794 + 0.6259 x − 0.0039x2 (R2 = 0.92; p = 0.00530).
Each point represents the mean of four independent replicates (n = 4) per genotype and soil water availability level. ANOVA results are provided in Table S11, while the corresponding means ± SE are presented in Table S12. Data from the 80% and 120% treatments, previously published by Souza et al. [23], were combined with data from the 60% and 100% treatments.
In U. humidicola, stem dry mass exhibited a quadratic response, with maximum production estimated at approximately 92% of pot water capacity, followed by reductions toward both extremes of soil water availability, which were more pronounced at 60% of pot water capacity (Figure 6b). The number of tillers remained similar across the different soil water availability levels, ranging from 10.2 to 12.0 tillers per plant (Figure 4).
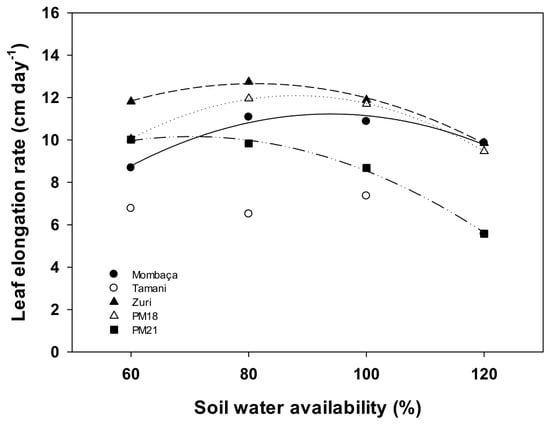
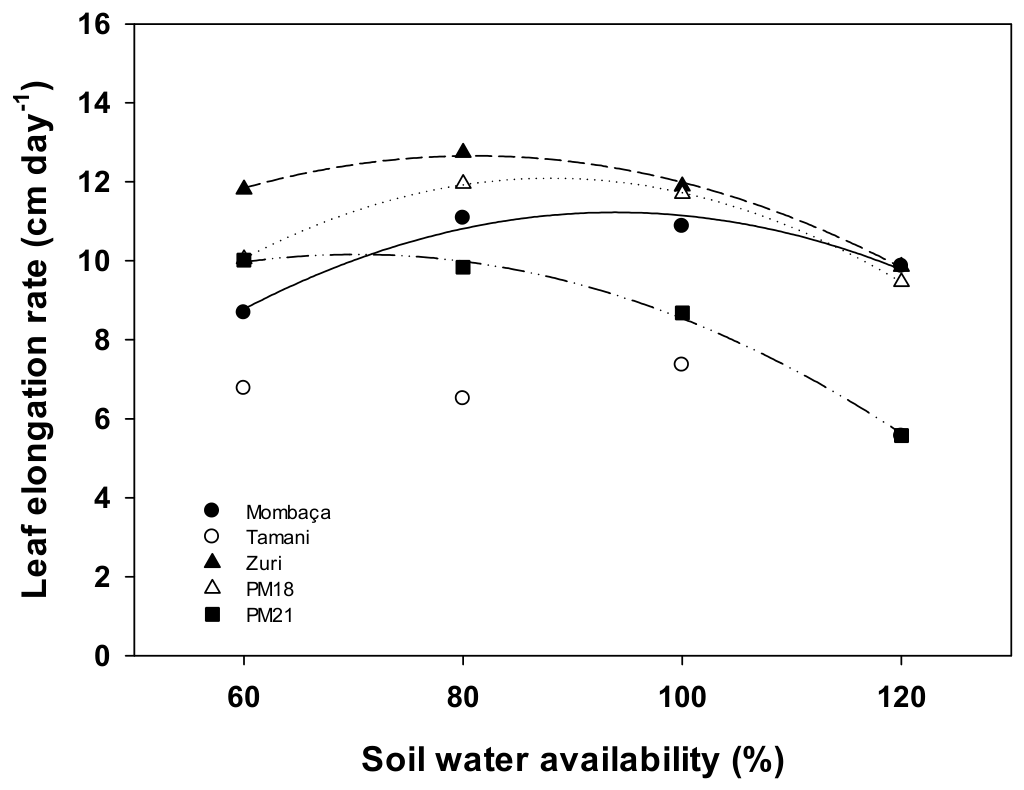
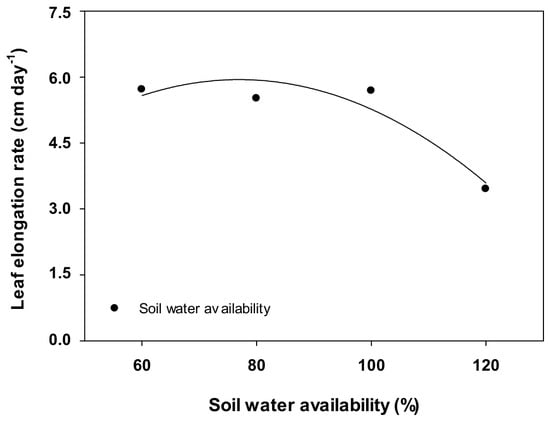
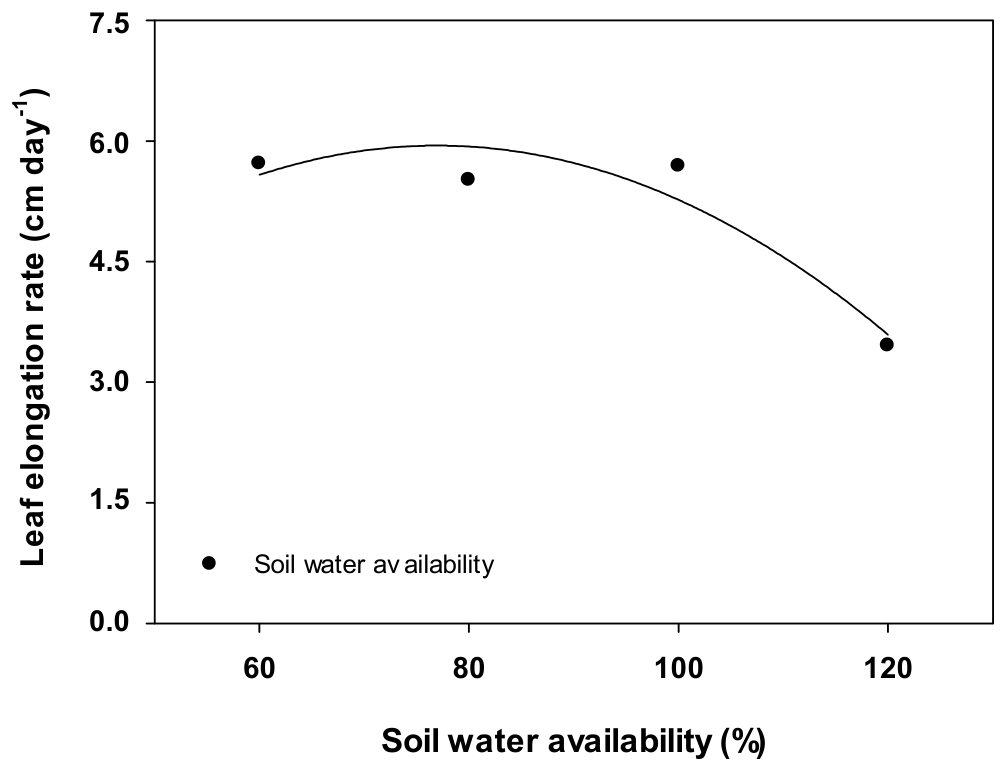
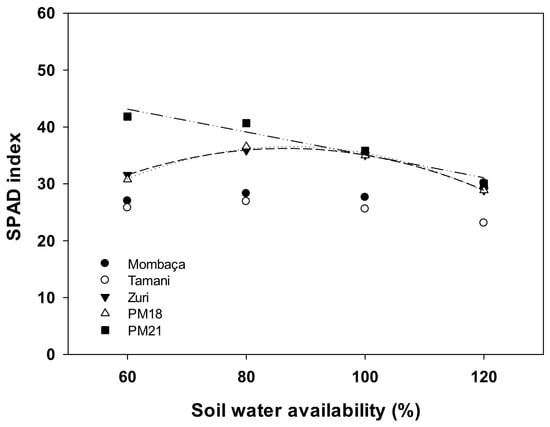
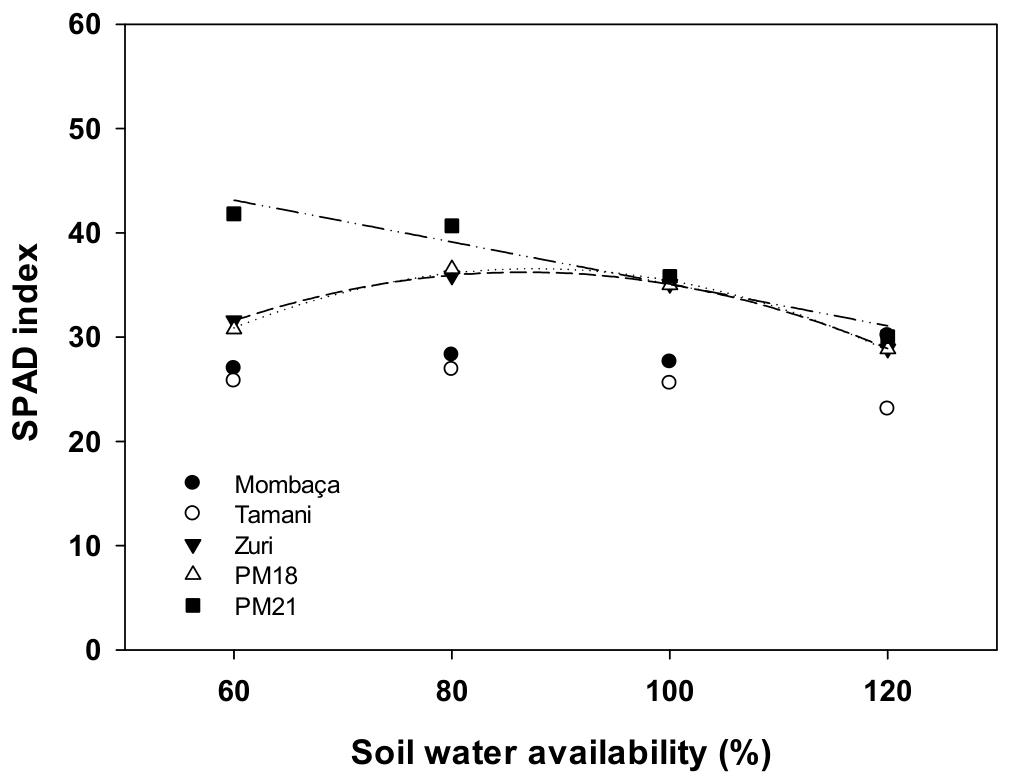
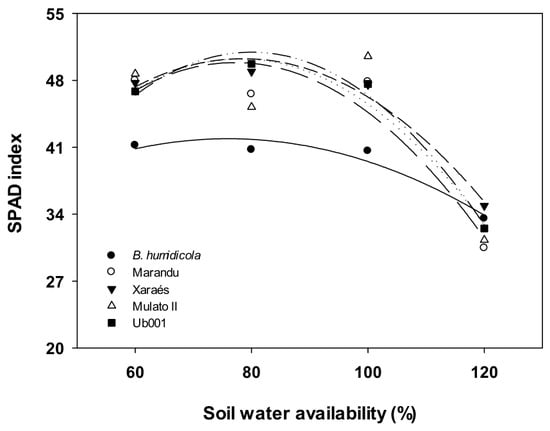
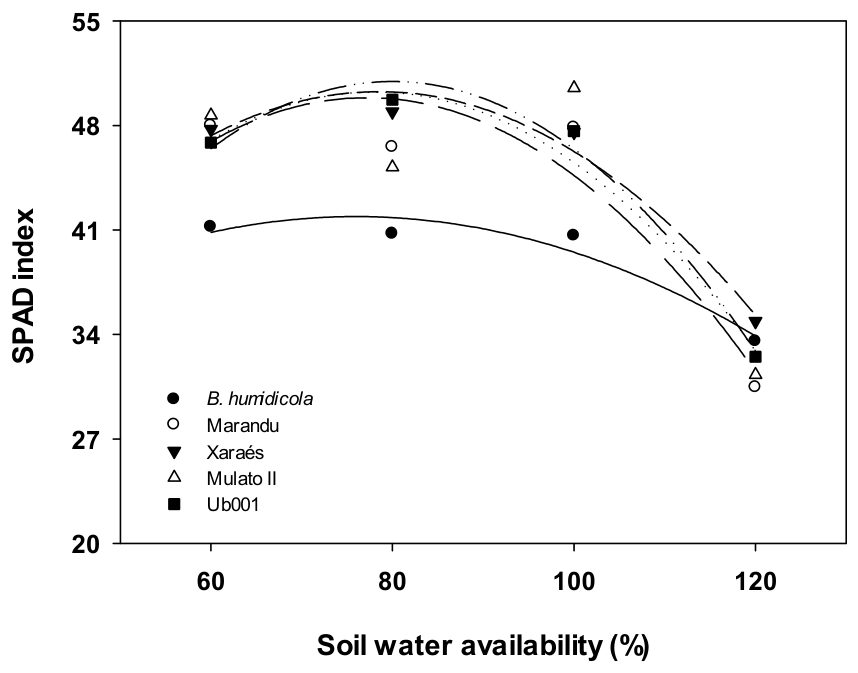
In ‘Marandu’, ‘Xaraés’, ‘Mulato II’, and Ub001, leaf blade and stem dry mass exhibited quadratic responses, with maximum values estimated between 75% and 85% of pot water capacity (Figure 6a,b). Leaf elongation rate also showed quadratic responses to soil water availability in M. maximus genotypes with significant regression models (Figure 7), while a similar quadratic response was observed in Urochloa spp., with maximum values estimated at approximately 75% of pot water capacity (Figure 8). Regarding the SPAD index, ‘BRS Zuri’ and PM18 of M. maximus exhibited quadratic responses, whereas PM21 showed a linear decrease with increasing soil water availability (Figure 9). In Urochloa spp., the highest SPAD index values were generally observed at approximately 80% of pot water capacity (Figure 10).
Figure 7.
Leaf elongation rate of five M. maximus genotypes grown under different soil water availability levels (% of pot water capacity). Note: Regression equations and coefficients of determination (R2) are presented only for significant models (p < 0.05).
Figure 8.
Leaf elongation rate of five Urochloa spp. genotypes grown under different soil water availability levels (% of pot water capacity). Note: Regression equations and coefficients of determination (R2) are presented only for significant models (p < 0.05).
Figure 9.
Soil–Plant Analysis Development (SPAD) index of five M. maximus genotypes grown under different soil water availability levels (% of pot water capacity). Note: Regression equations and coefficients of determination (R2) are presented only for significant models (p < 0.05).
Figure 10.
Soil–Plant Analysis Development (SPAD) index of five Urochloa spp. genotypes grown under different soil water availability levels (% of pot water capacity). Note: Regression equations and coefficients of determination (R2) are presented only for significant models (p < 0.05).
Leaf elongation rate: Mombaça: y = −7.5650 + 0.4003x − 0.0021x2 (R2 = 0.87; p = 0.00052); BRS Zuri: y = 0.4927 + 0.3005x − 0.0019x2 (R2 = 0.99; p = 0.00223); PM18: y = −7.9515 + 0.4552x − 0.0026x2 (R2 = 0.99; p = 0.00004); PM21: y = 1.1396 + 0.2569x − 0.0018x2 (R2 = 0.99; p = 0.00255).
Each point represents the mean of four independent replicates (n = 4) per genotype and soil water availability level. ANOVA results are provided in Table S3, while the corresponding means ± SE are presented in Table S4. Data from the 80% and 120% treatments, previously published by Souza et al. [23], were combined with data from the 60% and 100% treatments.
Leaf elongation rate: Soil water availability: y = −1.5729 + 0.1953x − 0.0013x2 (R2 = 0.89; p < 0.00001).
Each point represents the mean of four independent replicates (n = 4) per genotype and soil water availability level. ANOVA results are provided in Table S7, while the corresponding means ± SE are presented in Table S8. Data from the 80% and 120% treatments, previously published by Souza et al. [23], were combined with data from the 60% and 100% treatments.
SPAD index: BRS Zuri: y = −13.1213 + 1.1394x − 0.0066x2 (R2 = 0.99; p = 0.00792); PM18: y = −20.6112 + 1.3054x − 0.0075x2 (R2 = 0.99; p = 0.00285); PM21: y = 55.1725 − 0.2009x (R2 = 0.93; p = 0.00002).
Each point represents the mean of four independent replicates (n = 4) per genotype and soil water availability level. ANOVA results are provided in Table S3, while the corresponding means ± SE are presented in Table S4. Data from the 80% and 120% treatments, previously published by Souza et al. [23], were combined with data from the 60% and 100% treatments.
SPAD index: U. humidicola: y = 18.0800 + 0.6268x − 0.0041x2 (R2 = 0.93; p = 0.00529); Marandu: y = −9.4425 + 1.5376x − 0.0100x2 (R2 = 0.89); Xaraés: y = −3.0125 + 1.3581x − 0.0087x2 (R2 = 0.97; p < 0.00001); Mulato II: y = −9.7950 + 1.5374x − 0.0098x2 (R2 = 0.75; p < 0.00001); Ub001: y = −21.0075 + 1.7993x −0.0112x2 (R2 = 0.98; p < 0.00001).
Each point represents the mean of four independent replicates (n = 4) per genotype and soil water availability level. ANOVA results are provided in Table S7, while the corresponding means ± SE are presented in Table S8. Data from the 80% and 120% treatments, previously published by Souza et al. [23], were combined with data from the 60% and 100% treatments.
3.2. Gas Exchange Traits
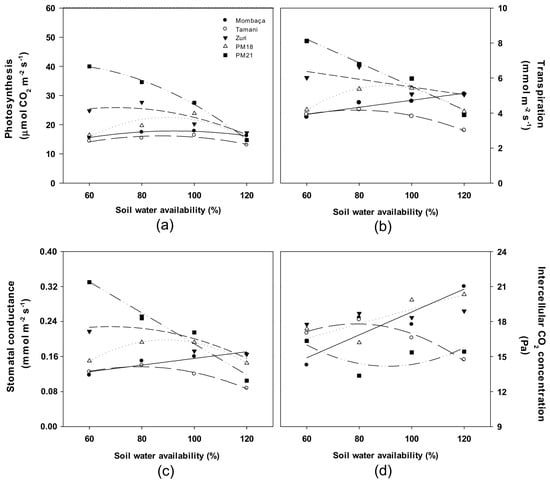
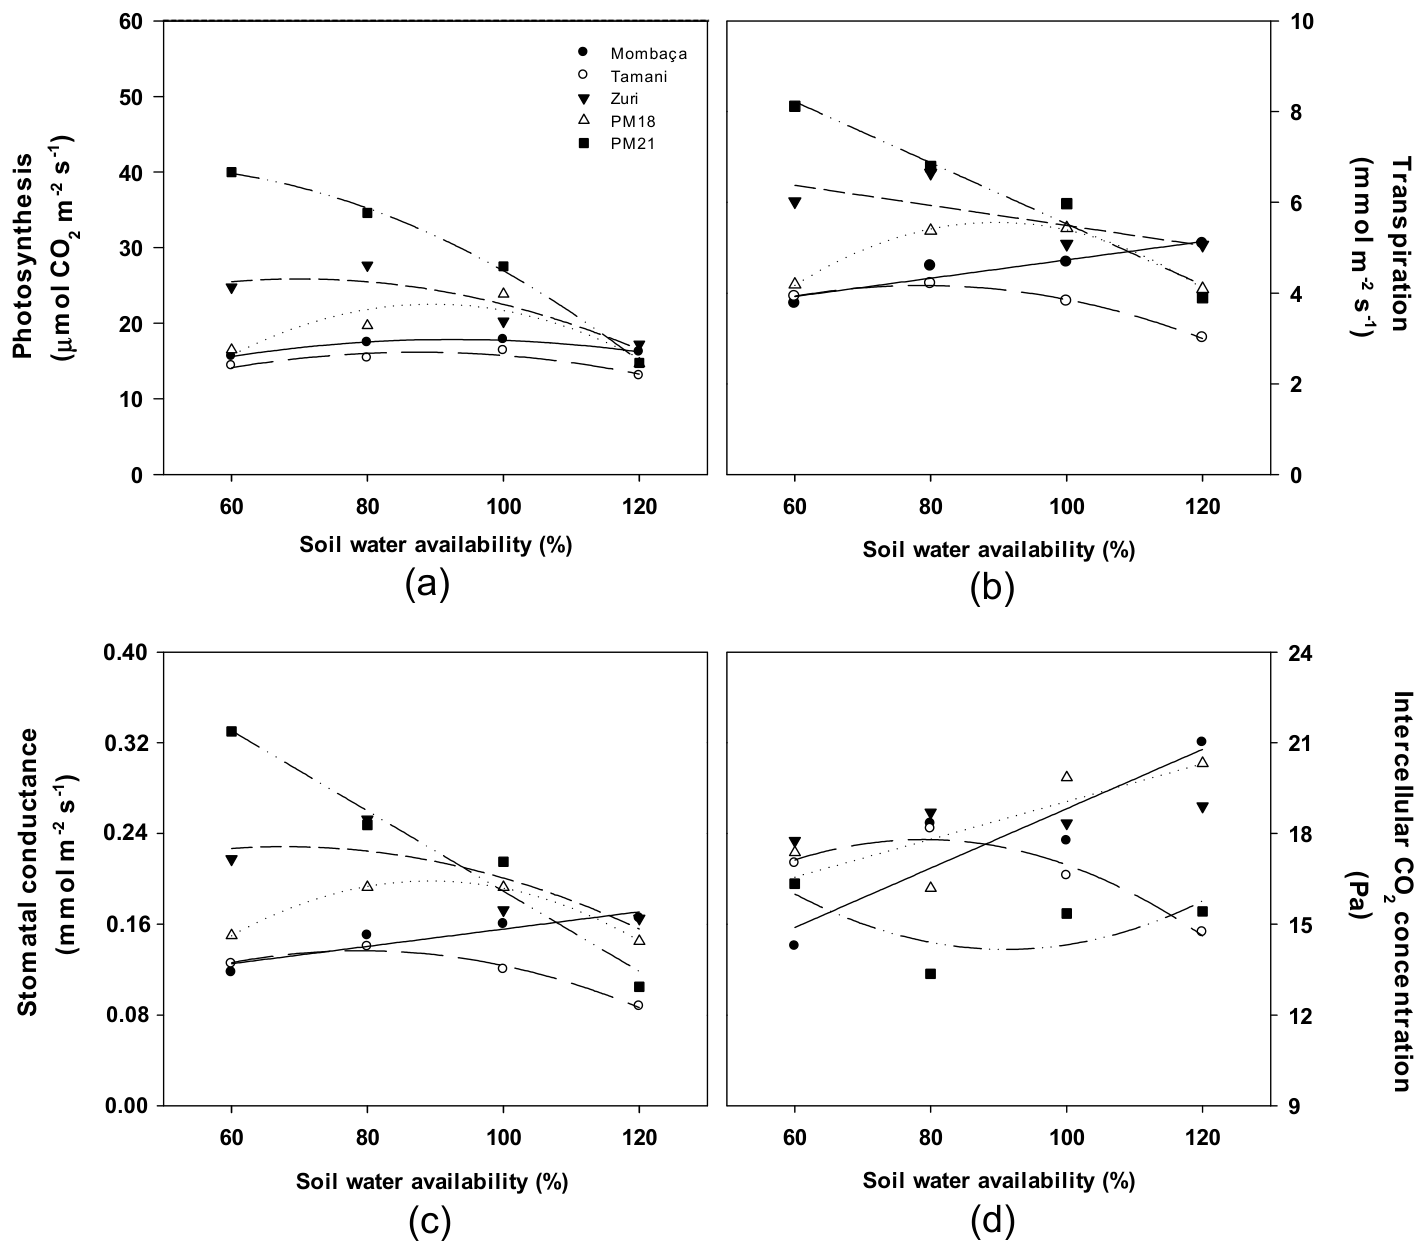
The M. maximus genotypes exhibited distinct gas exchange responses to soil water availability. In Tamani, net photosynthetic rate (Pn), transpiration rate (E), stomatal conductance (gs), and intercellular CO2 concentration (Ci) exhibited quadratic responses, although with relatively small variation among soil water availability levels (Figure 11a,d). In cv. ‘Mombaça’, only Pn exhibited a quadratic response, whereas E, gs, and Ci increased linearly with increasing soil water availability. In contrast, cv. BRS Zuri and PM21 showed marked reductions in Pn, E, and gs as soil water availability increased. In PM18, these three variables exhibited quadratic responses, with the lowest values occurring at 60% and 120% of pot water capacity, whereas Ci increased linearly with increasing soil water availability.
Figure 11.
Photosynthesis (Pn, (a)), transpiration (E, (b)), stomatal conductance (gs, (c)), and intercellular CO2 concentration (Ci, (d)) of five M. maximus genotypes grown under different soil water availability levels (% of pot water capacity). Note: Regression equations and coefficients of determination (R2) are presented only for significant models (p < 0.05). The symbols used in panels (b–d) correspond to the genotypes identified in panel (a).
Photosynthesis (Pn): Mombaça: y = −0.5145 + 0.3976x − 0.0022x2 (R2 = 0.99; p = 0.00070); BRS Tamani: y = −4.5663 + 0.4749x − 0.0027x2 (R2 = 0.84; p = 0.00003); BRS Zuri: y = 7.7245 + 0.5198x − 0.0037x2 (R2 = 0.83; p < 0.00001); PM18: y = −39.7398 + 1.3902x − 0.0078x2 (R2 = 0.79; p < 0.00001); PM21: y = 31.4239 + 0.4161x − 0.0046x2 (R2 = 0.99; p < 0.00001).
Transpiration (E): Mombaça: y = 2.7147 + 0.0202x (R2 = 0.89; p = 0.00017); BRS Tamani: y = −0.0610 + 0.1076x − 0.0007x2 (R2 = 0.99; p = 0.01758); BRS Zuri: y = 7.6992 − 0.0221x (R2 = 0.55; p = 0.00004); PM18: y = −7.1614 + 0.2838x − 0.0016x2 (R2 = 0.99; p < 0.00001); PM21: y = 12.2565 − 0.0673x (R2 = 0.97; p < 0.00001).
Stomatal conductance (gs): Mombaça: y = 0.0795 + 0.0008x (R2 = 0.85; p < 0.00001); BRS Tamani: y = −0.0479 + 0.0047x − 0.00003x2 (R2 = 0.98; p = 0.00011); BRS Zuri: y = 0.1069 + 0.0036x − 0.000026x2 (R2 = 0.65; p = 0.00046); PM18: y = −0.2507 + 0.0100x − 0.00056x2 (R2 = 0.99; p < 0.00001); PM21: y = 0.5427 − 0.0035x (R2 = 0.96; p < 0.00001).
Intercellular CO2 concentration (Ci): Mombaça: y = 9.0018 + 0.0982x (R2 = 0.84; p < 0.00001); BRS Tamani: y = 6.0621 + 0.2976x − 0.0019x2 (R2 = 0.95; p = 0.00350); PM18: y = 12.8072 + 0.0625x (R2 = 0.67; p < 0.00001); PM21: y = 29.9416 − 0.3467x + 0.0019x2 (R2 = 0.50; p = 0.00321). Each point represents the mean of four independent replicates (n = 4) per genotype and soil water availability level. ANOVA results are provided in Table S13, while the corresponding means ± SE are presented in Table S14. Data from the 80% and 120% treatments, previously published by Souza et al. [23], were combined with data from the 60% and 100% treatments.
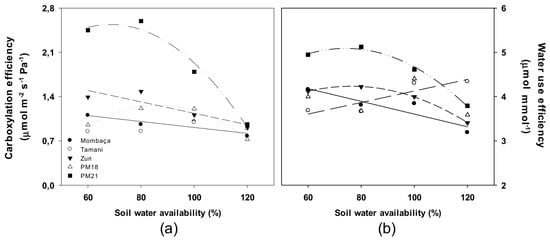
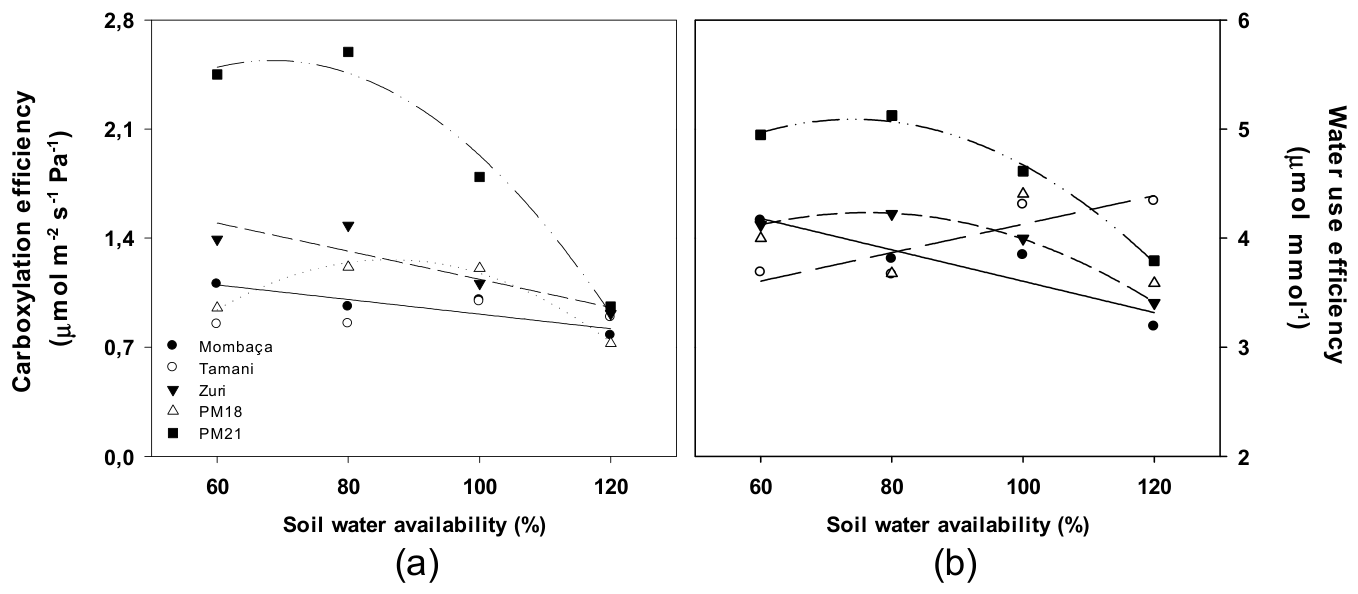
Instantaneous carboxylation efficiency (CE) and water use efficiency (WUE) decreased with increasing soil water availability in ‘Mombaça’, ‘BRS Zuri’, and PM21 (Figure 12a,b). In ‘Mombaça’, both variables decreased linearly, whereas in PM21 they exhibited quadratic responses, with more pronounced reductions occurring above approximately 80% of pot water capacity. A similar pattern was observed for WUE in ‘BRS Zuri’, whereas CE decreased linearly across the entire soil water availability gradient.
Figure 12.
Carboxylation efficiency (CE, (a)) and water use efficiency (WUE, (b)) of five M. maximus genotypes grown under different soil water availability levels (% of pot water capacity).
Note: Regression equations and coefficients of determination (R2) are presented only for significant models (p < 0.05). The symbols used in panel (b) correspond to the genotypes identified in panel (a).
Carboxylation efficiency (CE): Mombaça: y = 1.3813 − 0.0047x (R2 = 0.78; p < 0.00001); BRS Zuri: y = 2.0372 − 0.0090x (R2 = 0.80; p < 0.00001); PM18: y = −2.2057 + 0.0804x − 0.0005x2 (R2 = 0.98; p < 0.00001); PM21: y = −0.3211 + 0.0836x − 0.0006x2 (R2 = 0.97; p < 0.00001).
Water use efficiency (WUE): Mombaça: y = 5.0425 − 0.0144x (R2 = 0.84; p = 0.00008); BRS Tamani: y = 2.8252 + 0.0130x (R2 = 0.81; p = 0.00028); BRS Zuri: y = 1.7389 + 0.0655x − 0.0004x2 (R2 = 0.99; p = 0.02623); PM21: y = 1.6812 + 0.0921x − 0.0006x2 (R2 = 0.98; p = 0.00166).
Each point represents the mean of four independent replicates (n = 4) per genotype and soil water availability level. ANOVA results are provided in Table S15, while the corresponding means ± SE are presented in Table S16. Data from the 80% and 120% treatments, previously published by Souza et al. [23], were combined with data from the 60% and 100% treatments.
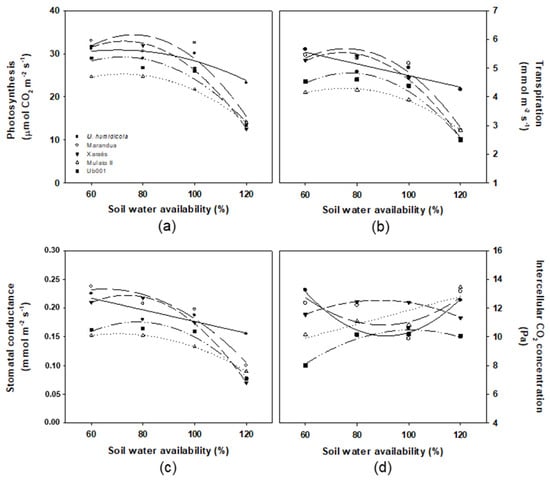
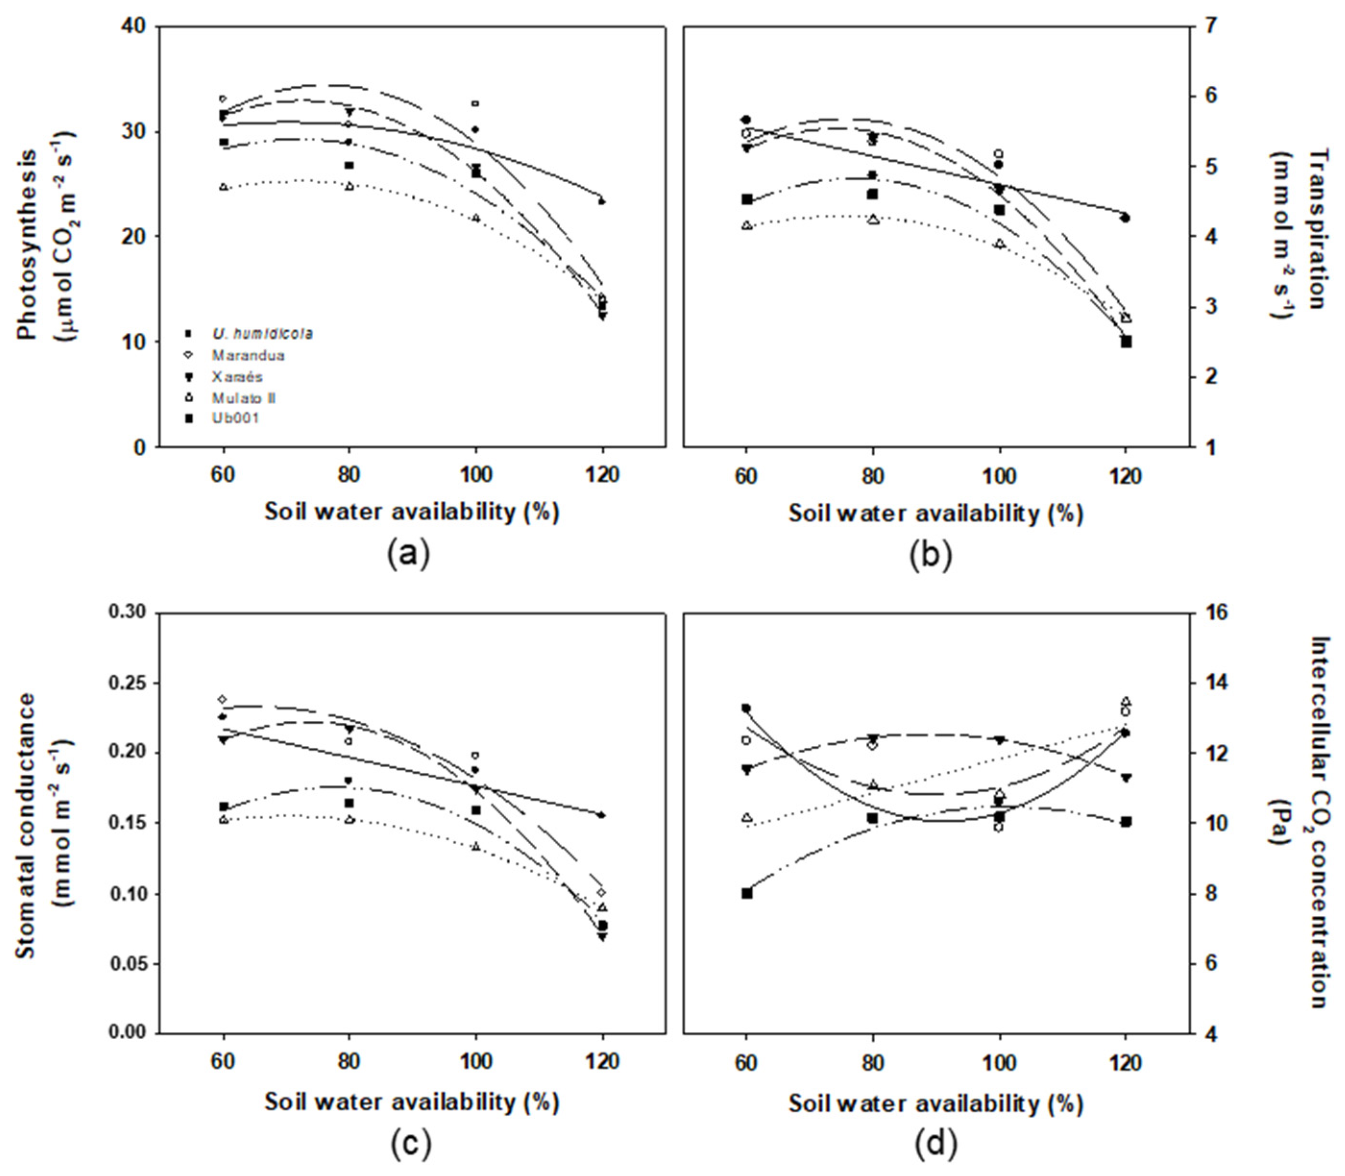
In Urochloa spp., photosynthesis (Pn), transpiration (E), and stomatal conductance (gs) exhibited quadratic responses in most genotypes. The exception was U. humidicola, which showed linear decreases in E and gs (Figure 13a,c). Overall, Pn, E, and gs declined above approximately 80% of pot water capacity in all genotypes, although the reduction in Pn was less pronounced in U. humidicola. Between 60% and 100% of pot water capacity, the genotypes differed in the magnitude of their responses for these variables. However, at 120% of pot water capacity, U. humidicola exhibited higher Pn, E, and gs values than the other genotypes.
Figure 13.
Photosynthesis (Pn, (a)), transpiration (E, (b)), stomatal conductance (gs, (c)), and intercellular CO2 concentration (Ci, (d)) of five Urochloa spp. genotypes grown under different soil water availability levels (% of pot water capacity). Note: Regression equations and coefficients of determination (R2) are presented only for significant models (p < 0.05). The symbols used in panels (b–d) correspond to the genotypes identified in panel (a).
Photosynthesis (Pn): U. humidicola: y = 16.6414 + 0.4044x − 0.0029x2 (R2 = 0.83; p < 0.00001); Marandu: y = −23.1131 + 1.5076x − 0.0099x2 (R2 = 0.87; p < 0.00001); Xaraés: y = −14.3151 + 1.3018x − 0.0090x2 (R2 = 0.99; p < 0.00001); Mulato II: y = −0.3875 + 0.7112x − 0.0049x2 (R2 = 0.99; p < 0.00001); Ub001: y = −4.3788 + 0.9366x − 0.0065x2 (R2 = 0.94; p < 0.00001).
Transpiration (E): U. humidicola: y = 6.7645 − 0.0202x (R2 = 0.83; p < 0.00001); Marandu: y = −2.1685 + 0.2080x − 0.0014x2 (R2 = 0.95; p < 0.00001); Xaraés: y = −2.2775 + 0.2106x − 0.0014x2 (R2 = 0.99; p < 0.00001); Mulato II: y = 0.2330 + 0.1084x − 0.0007x2 (R2 = 0.99; p < 0.00001); Ub001: y = −2.4301 + 0.1885x − 0.0012x2 (R2 = 0.97; p < 0.00001).
Stomatal conductance (gs): U. humidicola: y = 0.2780 − 0.0010x (R2 = 0.81; p < 0.00001); Marandu: y = 0.0551 + 0.0055x − 0.000042x2 (R2 = 0.95; p < 0.00001); Xaraés: y = −0.1581 + 0.0103x − 0.00007x2 (R2 = 0.99; p < 0.00001); Mulato II: y = 0.0234 + 0.0037x − 0.000026x2 (R2 = 0.99; p < 0.00001); Ub001: y = −0.1455 + 0.0083x − 0.000053x2 (R2 = 0.95; p < 0.00001).
Intercellular CO2 concentration (Ci): U. humidicola: y = 36.2878 − 0.5742x + 0.0031x2 (R2 = 0.97; p < 0.00001); Marandu: y = 28.1118 − 0.3848x + 0.0021x2 (R2 = 0.49; p = 0.00006); Xaraés: y = 3.0304 + 0.2149x − 0.0012x2 (R2 = 0.99; p = 0.00004); Mulato II: y = 6.9947 + 0.0485x (R2 = 0.76; p < 0.00001); Ub001: y = −3.9133 + 0.2852x − 0.0014x2 (R2 = 0.94; p = 0.00002).
Each point represents the mean of four independent replicates (n = 4) per genotype and soil water availability level. ANOVA results are provided in Table S17, while the corresponding means ± SE are presented in Table S18. Data from the 80% and 120% treatments, previously published by Souza et al. [23], were combined with data from the 60% and 100% treatments.
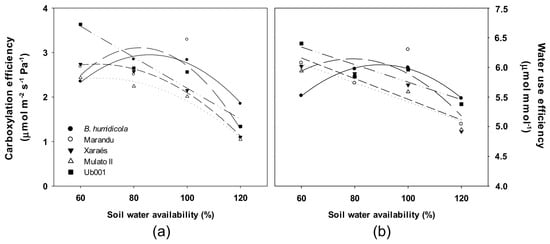
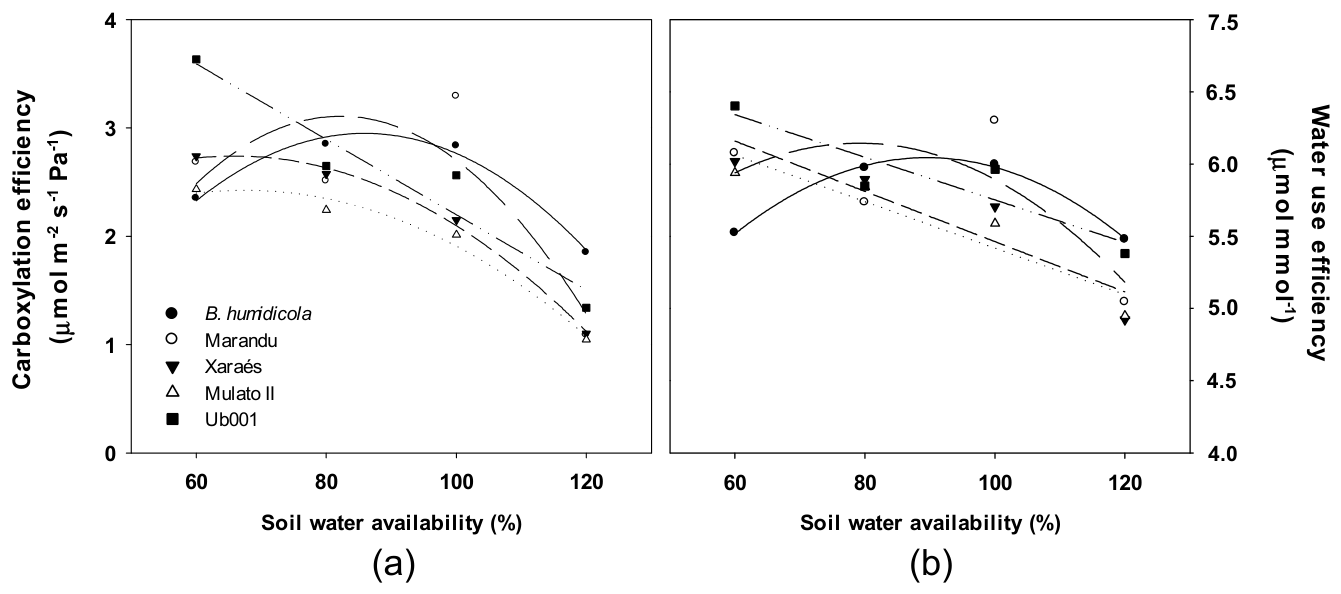
In Urochloa spp., carboxylation efficiency (CE) exhibited quadratic responses to soil water availability in U. humidicola, ‘Marandu’, ‘Xaraés’, and ‘Mulato II’, with maximum values estimated at intermediate soil water availability levels, whereas Ub001 showed a linear decrease (Figure 14a). Water use efficiency (WUE) also exhibited quadratic responses in U. humidicola and ‘Marandu’, with maximum values estimated at approximately 90% of pot water capacity. In contrast, ‘Xaraés’, ‘Mulato II’, and Ub001 showed linear decreases in WUE with increasing soil water availability (Figure 14b). Overall, both physiological traits tended to decline under high soil water availability.
Figure 14.
Carboxylation efficiency (CE, (a)) and water use efficiency (WUE, (b)) of five Urochloa spp. genotypes grown under different soil water availability levels (% of pot water capacity). Note: Regression equations and coefficients of determination (R2) are presented only for significant models (p < 0.05). The symbols used in panel (b) correspond to the genotypes identified in panel (a).
Carboxylation efficiency (CE): U. humidicola: y = −3.8884 + 0.1592x − 0.0009x2 (R2 = 0.98; p < 0.00001); Marandu: y = −5.4601 + 0.2086x − 0.0013x2 (R2 = 0.70; p < 0.00001); Xaraés: y = 0.3519 + 0.0726x − 0.0006x2 (R2 = 0.99; p < 0.00001); Mulato II: y = 0.2166 + 0.0655x − 0.0005x2 (R2 = 0.98; p < 0.00001); Ub001: y = 5.6787 − 0.0348x (R2 = 0.92; p < 0.00001).
Water use efficiency (WUE): U. humidicola: y = 1.1969 + 0.1083x − 0.0006x2 (R2 = 0.99; p = 0.00552); Marandu: y = 2.5788 + 0.0903x − 0.0006x2 (R2 = 0.59; p = 0.00845); Xaraés: y = 7.2028 − 0.0174x (R2 = 0.83; p = 0.00002); Mulato II: y = 7.0282 − 0.0161x (R2 = 0.87; p = 0.00007); Ub001: y = 7.2267 − 0.0148x (R2 = 0.82; p = 0.000023).
Each point represents the mean of four independent replicates (n = 4) per genotype and soil water availability level. ANOVA results are provided in Table S19, while the corresponding means ± SE are presented in Table S20. Data from the 80% and 120% treatments, previously published by Souza et al. [23], were combined with data from the 60% and 100% treatments.
4. Discussion
Differences in environmental conditions across experimental periods, particularly in photoperiod, temperature, and vapor pressure deficit (VPD), may have contributed to variations in plant growth despite the use of a greenhouse. The absence of mineral fertilization in the substrate may also have influenced plant development, as discussed by Souza et al. [23]. Although the biological responses were generally consistent with those reported in previous studies [6,11,12,13,14,15,16,17], the potential influence of nutrient availability cannot be excluded because plant nutrient status, particularly nitrogen status, was not directly assessed. This limitation should be considered when interpreting SPAD responses and differences among genotypes. It is also important to note that statistical analyses were performed independently for each experiment, and no analytical comparisons were made between them.
Overall, the morphological, agronomic, and physiological responses indicated favorable plant performance around the directly tested 80% of pot water capacity. This pattern was characterized by greater green leaf number, increased tillering in part of the evaluated materials, higher leaf elongation rates, greater biomass production, higher SPAD index values, and improved photosynthetic performance across several traits and genotypes. Collectively, these findings indicate that approximately 80% of pot water capacity provided suitable conditions for plant performance under the experimental conditions evaluated. These results are consistent with previous studies showing that maximum growth of tropical forage grasses does not necessarily occur at the maximum water-holding capacity of the soil, but rather under conditions that combine high water availability with adequate rhizosphere aeration [20,21,32].
The morphoagronomic changes observed in this study show that plant growth was adversely affected under both reduced and excessive soil water availability, although the effects were more pronounced at 120% of pot water capacity. The reductions in green leaf number (Figure 2a and Figure 3a), leaf elongation (Figure 7 and Figure 8), tillering (Figure 2d and Figure 4), and biomass production (Figure 5 and Figure 6) are consistent with impaired vegetative development under excessive soil water availability, as reflected in reduced production and expansion of new tissues. Similar responses have been reported for Urochloa spp. under waterlogging, including reduced tillering in cv. Marandu [14]. In contrast, greater tillering under high soil water availability has also been reported for M. maximus genotypes and cvs. Massai and BRS Tamani [3,7]. These contrasting results may reflect both the genetic variability among the evaluated materials and differences in experimental conditions, since studies conducted under open-field conditions may be exposed to higher evaporative demand, potentially reducing the effective intensity of excess soil water.
The differences observed among the water treatments may reflect the high morphological plasticity of tropical forage grasses in response to changes in soil water availability. Under waterlogged conditions, tolerant species may exhibit structural adjustments, such as shoot elongation, which helps maintain photosynthetically active tissues above the water surface and thereby minimizes the effects of oxygen deficiency [19]. Under water deficit, in contrast, plants tend to allocate more resources to root growth, thereby enhancing the exploration of deeper soil layers in search of water [5]. Conversely, under waterlogged conditions, root growth at greater soil depths is reduced as an adaptive strategy to minimize the effects of oxygen deficiency in the root system [17]. In addition, tolerant species develop morphological and anatomical adaptations, including adventitious roots, aerenchyma formation, and exodermal suberization, which facilitate oxygen diffusion and contribute to the maintenance of root function under waterlogged conditions [6,16]. Although these mechanisms have been documented in previous studies, anatomical and root morphological adaptations were not directly evaluated in the present experiment.
The absence of statistically significant effects of soil water availability on leaf blade, root, and total dry mass in U. humidicola is consistent with its reported adaptation to waterlogged environments, although it does not demonstrate biomass yield stability. Unlike the other evaluated genotypes and cultivars, this species showed no statistically significant differences in these biomass traits across the evaluated water availability levels and did not develop senescent leaves even at 120% of pot water capacity (Figure 3 and Figure 6). Furthermore, the estimated differences in dry mass between 80% and 120% of pot water capacity were close to zero, supporting the interpretation of a comparatively stable biomass response under the evaluated conditions. Nevertheless, the corresponding 95% confidence intervals indicate that some variation in biomass cannot be excluded. Similar responses have been reported for U. humidicola under waterlogging, with shoot dry mass maintained in 10 of the 12 evaluated accessions [17]. However, in that study, significant reductions in root dry mass were observed in most accessions [17], indicating that the magnitude of these responses may vary according to genetic background and experimental conditions. Likewise, reductions in forage dry mass, including leaf blade and stem dry mass, have also been reported for cvs. Marandu and Xaraés under waterlogging [21], corroborating the biomass reductions observed in the most waterlogging-sensitive genotypes in the present study.
From a molecular perspective, plant responses to waterlogging involve signaling mechanisms associated with oxygen deprivation. Under hypoxic conditions, the stabilization of group VII ethylene response factors (ERF-VIIs), regulated through the oxygen-dependent N-degron pathway, contributes to the activation of genes involved in hypoxia acclimation [33,34]. Furthermore, ethylene signaling can promote hypoxia tolerance by reducing nitric oxide (NO) availability, thereby favoring ERF-VII stabilization [35]. Although these molecular mechanisms were not directly investigated in the present study, they provide a possible mechanistic framework for interpreting the contrasting responses observed among the evaluated genotypes, including the comparatively limited biomass response of U. humidicola to increased soil water availability.
The physiological responses closely paralleled the morphoagronomic changes observed among the evaluated materials, suggesting an association between reduced growth and limitations in photosynthetic performance under excessive soil water availability. Overall, increasing soil water availability above approximately 80% of pot water capacity reduced SPAD index values, photosynthesis, transpiration, stomatal conductance, instantaneous carboxylation efficiency, and water use efficiency (Figure 9, Figure 10, Figure 11, Figure 12, Figure 13 and Figure 14), consistent with limitations in carbon assimilation. The reduction in SPAD index values may reflect changes in leaf chlorophyll content, which may have contributed to the lower photosynthetic performance observed under waterlogged conditions. These responses may also be associated with reduced oxygen availability in the rhizosphere and consequent limitations in root respiration, water uptake, and nutrient acquisition, as previously reported for plant species exposed to root hypoxia [6,36]. However, rhizosphere oxygen availability and root respiration were not directly measured in the present study.
The reduction in photosynthetic activity was accompanied by decreases in stomatal conductance and instantaneous carboxylation efficiency, suggesting that stomatal limitations may have contributed to the decline in carbon assimilation. Under waterlogged conditions, photosynthesis may be constrained not only by stomatal closure but also by reduced mesophyll conductance and damage to the photosynthetic apparatus [36]. However, neither reduced mesophyll conductance nor damage to the photosynthetic apparatus was directly demonstrated in the present study. The decline in SPAD index values, particularly in the Urochloa spp. genotypes (Figure 9 and Figure 10), may be associated with changes in chlorophyll content, potentially contributing to the observed decline in photosynthetic performance. This interpretation is consistent with the association between SPAD index values and chlorophyll pigment content previously reported [37].
Although reductions in physiological parameters were observed in all evaluated materials under excessive soil water availability, their consequences for plant growth differed markedly among genotypes. In U. humidicola, reductions in photosynthesis, transpiration, stomatal conductance, instantaneous carboxylation efficiency, and water use efficiency (Figure 13 and Figure 14) were not accompanied by statistically significant reductions in biomass production or tillering (Figure 4 and Figure 6), although changes in these traits cannot be ruled out under the experimental conditions evaluated. In contrast, with ‘Marandu’, ‘Xaraés’, ‘Mulato II’ and Ub001, the physiological changes (Figure 13 and Figure 14) were accompanied by substantial reductions in biomass production (Figure 6), suggesting an association between the maintenance of photosynthetic activity and greater tolerance to excess soil water. Similar responses have also been reported for cv. Marandu under waterlogged conditions, where declines in photosynthesis, transpiration, and stomatal conductance were associated with reduced dry matter yield [12,13,14]. These findings reinforce the importance of physiological responses in discriminating waterlogging tolerance and are consistent with recent evidence identifying both physiological and morphoagronomic traits as effective selection criteria for the early screening of tropical forage grass genotypes under controlled conditions [23].
Overall, the effects of excess soil water on plant growth and physiological activity were more severe than those caused by water deficit. Although 60% of pot water capacity reduced some morphoagronomic and physiological traits, these effects were less pronounced than those observed at 120% of pot water capacity. This pattern suggests that the evaluated forage grasses were more adversely affected by excess soil water than by the moderate water deficit imposed in the present study, a response that could be associated with reduced oxygen availability in the rhizosphere. Previous studies have shown that soil pore saturation can reduce oxygen diffusion, potentially limiting root respiration and ATP production, as well as energy-dependent processes such as water and nutrient uptake, which may contribute to reduced photosynthetic activity and plant growth under waterlogged conditions [6,36].
Although reductions in several morphoagronomic traits were also reported at 60% of pot water capacity, no detrimental effects on plant performance were observed between 100% and 120% of pot water capacity [3,7], in contrast to the present study. This discrepancy may be associated with differences in experimental conditions, as those studies were conducted outdoors with pots maintained under full sunlight. Under these conditions, the higher evaporative demand may have reduced the effective intensity of excess soil water, making the 100% and 120% treatments less restrictive to plant growth.
Considering the combined morphoagronomic and physiological responses, the directly tested 80% treatment was generally associated with favorable plant performance, whereas the 100% treatment caused substantial reductions in several traits. Although field capacity—or pot water capacity in container experiments—is traditionally considered the condition providing the greatest water availability for plants [19], the present results demonstrate that this condition does not necessarily represent the most favorable environment for the growth of tropical forage grasses. Similar findings have also been reported for Convert HD364 grass [20], with maximum growth observed between 78.2% and 92.5% of pot water capacity. Likewise, reduced forage production under waterlogging and lower plant performance at 100% of pot water capacity have also been reported for cvs. Marandu and Xaraés [21]. Collectively, these findings indicate that 100% of pot water capacity is not necessarily the most appropriate control treatment for pot experiments. Instead, under the conditions evaluated in the present study, approximately 80% of pot water capacity provided a more suitable reference condition for screening assays aimed at identifying waterlogging-tolerant tropical forage grass genotypes than the 100% treatment traditionally adopted in such studies [12,13,14,15,16,17]. Unlike the previous study by Souza et al. [23], which focused on the relative waterlogging tolerance of the evaluated genotypes using the 80% and 120% treatments, the present study incorporates the additional 60% and 100% treatments to examine plant responses across a broader range of soil water availability. This expanded analysis provides new evidence that 100% of pot water capacity does not necessarily represent the most favorable control condition and supports the use of approximately 80% as a reference treatment for controlled-environment waterlogging screening assays in the early stages of forage breeding programs, under the evaluated experimental conditions.
The use of approximately 80% of pot water capacity as the control treatment, combined with 120% of pot water capacity as the waterlogging treatment, provides a suitable methodological approach for screening assays conducted under the controlled conditions evaluated in this study. Under the experimental conditions of the present study, the 120% treatment produced an approximately 1 cm water layer above the soil surface. This depth is lower than the 3 cm water layer conventionally adopted in waterlogging studies with tropical forage grasses [11,12,13,14,17]. However, it was sufficient to induce the morphological, agronomic, and physiological responses typically associated with waterlogging stress, allowing clear discrimination between tolerant and susceptible genotypes. Therefore, the combination of 80% and 120% of pot water capacity represents a candidate screening protocol based on the specific genotypes, substrate, pot system, greenhouse conditions, and experimental duration evaluated in the present study. Broader application and standardization of these water availability levels would require independent validation across different substrates, environmental conditions, pot systems, experimental durations, and forage grass genotypes. This methodological framework expands upon the findings of Souza et al. [23] by providing an experimental basis for optimizing controlled-environment screening assays designed to identify waterlogging-tolerant tropical forage grass genotypes.
5. Conclusions
The M. maximus and Urochloa spp. genotypes generally exhibited favorable morphoagronomic and physiological performance at the directly tested 80% pot water capacity treatment under the experimental conditions evaluated. Based on these findings, approximately 80% pot water capacity is recommended as the control treatment for screening assays aimed at identifying waterlogging-tolerant genotypes.
The 120% treatment was sufficient to induce typical waterlogging responses, markedly impairing the productive and physiological performance of most evaluated materials while allowing clear discrimination between tolerant and susceptible genotypes. Therefore, the combination of approximately 80% of pot water capacity as the control treatment is proposed as a candidate protocol for screening waterlogging tolerance in tropical forage grasses under the substrate, plant materials, and 21-day exposure period evaluated in this study. Broader application and standardization of this protocol would require independent validation under different substrates, plant materials, and experimental conditions. Furthermore, although controlled-environment screening provides standardized conditions for preliminary genotype evaluation, it does not fully reproduce the complexity of field environments. Therefore, subsequent field evaluations are needed to confirm the agronomic performance and waterlogging tolerance of selected genotypes under more variable environmental conditions.
Supplementary Materials
The following supporting information can be downloaded at: https://www.mdpi.com/article/10.3390/grasses5040043/s1, Table S1. Analysis of variance for green, yellow, and total leaf numbers of Megathyrsus maximus genotypes subjected to different soil water availability levels; Table S2. Treatment means and standard errors for green, yellow, and total leaf numbers in Megathyrsus maximus genotypes under different soil water availability levels; Table S3. Analysis of variance for tiller number, leaf elongation rate, and SPAD index of Megathyrsus maximus genotypes subjected to different soil water availability levels; Table S4. Treatment means and standard errors for tiller number, leaf elongation rate, and SPAD index in Megathyrsus maximus genotypes under different soil water availability levels; Table S5. Analysis of variance for green, yellow, senescent, and total leaf numbers in Urochloa spp. genotypes subjected to different soil water availability levels; Table S6. Treatment means and standard errors for green, yellow, senescent, and total leaf numbers in Urochloa spp. genotypes under different soil water availability levels; Table S7. Analysis of variance for tiller number, leaf elongation rate, and SPAD index in Urochloa spp. genotypes under different soil water availability levels; Table S8. Treatment means and standard errors for tiller number, leaf elongation rate, and SPAD index in Urochloa spp. genotypes under different soil water availability levels; Table S9. Analysis of variance for leaf blade, stem, root, and total dry mass of Megathyrsus maximus genotypes subjected to different soil water availability levels; Table S10. Treatment means and standard errors for leaf, stem, root, and total dry mass in Megathyrsus maximus genotypes under different soil water availability levels; Table S11. Analysis of variance for leaf blade, stem, root, and total dry mass in Urochloa spp. genotypes under different soil water availability levels; Table S12. Treatment means and standard errors for leaf, stem, root, and total dry mass in Urochloa spp. genotypes under different soil water availability levels; Table S13. Analysis of variance for photosynthesis, transpiration, stomatal conductance, and intercellular CO2 concentration in Megathyrsus maximus genotypes subjected to different soil water availability levels; Table S14. Treatment means and standard errors for net photosynthetic rate, transpiration rate, stomatal conductance, and internal CO2 concentration in Megathyrsus maximus genotypes under different soil water availability levels; Table S15. Analysis of variance for carboxylation efficiency and water use efficiency in Megathyrsus maximus genotypes under different soil water availability levels; Table S16. Treatment means and standard errors for carboxylation efficiency and water use efficiency in Megathyrsus maximus genotypes under different soil water availability levels; Table S17. Analysis of variance for photosynthesis, transpiration, stomatal conductance, and intercellular CO2 concentration in Urochloa spp. genotypes under different soil water availability levels; Table S18. Treatment means and standard errors for net photosynthetic rate, transpiration rate, stomatal conductance, and internal CO2 concentration in Urochloa spp. genotypes under different soil water availability levels; Table S19. Analysis of variance for carboxylation efficiency and water use efficiency in Urochloa spp. genotypes under different soil water availability levels; Table S20. Treatment means and standard errors for carboxylation efficiency and water use efficiency in Urochloa spp. genotypes under different soil water availability levels.
Author Contributions
Conceptualization, C.S.d.S., G.M.L.d.A., C.M.S.d.A., L.J., and S.C.L.B.; methodology, C.S.d.S., G.M.L.d.A., and M.d.O.M.; investigation, C.S.d.S. and M.S.d.M.; data curation, C.S.d.S. and G.M.L.d.A.; formal analysis, C.S.d.S. and G.M.L.d.A.; writing—original draft preparation, C.S.d.S.; writing—review and editing, M.d.O.M., L.J., S.C.L.B., C.M.S.d.A., and G.M.L.d.A.; supervision, M.d.O.M. and G.M.L.d.A.; project administration, G.M.L.d.A. All authors have read and agreed to the published version of the manuscript.
Funding
This research was funded by the Association for the Promotion of Forage Breeding Research (UNIPASTO) (Grant No. 10200.17/0006-5), the Brazilian Agricultural Research Corporation (Embrapa), and the Coordination for the Improvement of Higher Education Personnel (CAPES; Finance Code 001).
Data Availability Statement
The data supporting the findings of this study are available from the corresponding author upon reasonable request.
Acknowledgments
The authors thank the Brazilian Agricultural Research Corporation (Embrapa Acre) for providing the facilities and technical support required to conduct this study. The authors also acknowledge the valuable collaboration of Embrapa Gado de Corte and the Federal University of Acre.
Conflicts of Interest
Liana Jank, Sanzio Carvalho Lima Barrios, Carlos Mauricio Soares de Andrade, and Giselle Mariano Lessa de Assis are employees of the Brazilian Agricultural Research Corporation (Embrapa). The remaining authors declare no conflicts of interest.
Abbreviations
The following abbreviations are used in this manuscript:
| ANOVA | Analysis of Variance |
| CE | Carboxylation efficiency |
| Ci | Intercellular CO2 Concentration |
| CIAT | International Center for Tropical Agriculture |
| E | Transpiration |
| IRGA | Infrared Gas Analyzer |
| MDS | Marandu Death Syndrome |
| PAR | Photosynthetically Active Radiation |
| gs | Stomatal conductance |
| Pn | Photosynthesis |
| VPD | Vapor Pressure Deficit |
| SPAD | SPAD index |
| WUE | Water use efficiency |
References
- Lapig. Laboratório de Processamento de Imagens e Geoprocessamento. Available online: https://atlasdaspastagens.ufg.br (accessed on 19 August 2022).
- Silva, C.T.R.; Bonfim-Silva, E.M.; Silva, T.J.A.; Pinheiro, E.A.R.; José, J.V.; Ferraz, A.P.F. Yield component responses of the Brachiaria brizantha forage grass to soil water availability in the Brazilian Cerrado. Agriculture 2020, 10, 13. [Google Scholar] [CrossRef] [Scilit]
- Oliveira, E.M.D.; Martuscello, J.A.; Jank, L.; Cunha, D.D.N.F.V.D.; Santos, M.F. Evaluation of Megathyrsus maximus genotypes under water stress conditions. Acta Sci. Anim. Sci. 2022, 44, e54975. [Google Scholar] [CrossRef] [Scilit]
- Jank, L.; Barrios, S.C.; do Valle, C.B.; Simeão, R.M.; Alves, G.F. The value of improved pastures to Brazilian beef production. Crop Pasture Sci. 2014, 65, 1132–1137. [Google Scholar] [CrossRef] [Scilit]
- Cardoso, J.A.; Pineda, M.; Jiménez, J.C.; Vergara, M.F.; Rao, I.M. Contrasting Strategies to Cope with Drought Conditions by Two Tropical Forage C4 Grasses. AoB Plants 2015, 7, plv107. [Google Scholar] [CrossRef] [Scilit] [PubMed]
- de La Cruz Jiménez, J.; Cardoso, J.A.; Kotula, L.; Veneklaas, E.J.; Pedersen, O.; Colmer, T.D. Root length is proxy for high-throughput screening of waterlogging tolerance in Urochloa spp. grasses. Funct. Plant Biol. 2020, 48, 411–421. [Google Scholar] [CrossRef] [Scilit] [PubMed]
- Maranhão, S.R.; Pompeu, R.C.F.F.; de Araújo, R.A.; Lopes, M.N.; de Souza, H.A.; Cavalcante, A.; Rogerio, M. Morphophysiology of tropical grasses under different water supply in two growing seasons: II. BRS Massai and BRS Tamani grasses. Semin. Ciênc. Agrár. 2021, 42, 301–318. [Google Scholar] [CrossRef] [Scilit]
- Pedreira, B.C.; Dias-Filho, M.B.; Andrade, C.; Pereira, D.H.; Holschuch, S.G.; Cavalli, J. Convivendo com a síndrome da morte do braquiarão na Amazônia. In Recuperação de Pastagens Degradadas na Amazônia, 1st ed.; Dias-Filho, M.B., de Andrade, C.M.S., Eds.; EMBRAPA: Brasília, Brazil, 2019; pp. 127–151. [Google Scholar]
- Ribeiro-Júnior, N.G.; Fagundes, O.S.; Benevenuti, A.S.; Yamashita, O.M.; Rossi, A.A.B.; Carvalho, M.A.C.; Silva, I.V. Tropical forages: Morphoanatomy of plants grown in areas with the death of pasture syndrome. Braz. J. Biol. 2017, 77, 868–875. [Google Scholar] [CrossRef] [Scilit] [PubMed][Green Version]
- Silva, M.A.; Lima, M.; Silva Junior, C.A.; Costa, G.M.; Peres, C.A. Achieving low-carbon cattle ranching in the Amazon: ‘Pasture sudden death’ as a window of opportunity. Land Degrad. Dev. 2018, 29, 3535–3543. [Google Scholar] [CrossRef] [Scilit]
- Cardoso, J.A.; Jiménez, J.; Rincón, J.; Guevara, E.; Van der Hoek, R.; Jarvis, A.; Rao, I. Advances in improving tolerance to waterlogging in Brachiaria grasses. Trop. Grassl.-Forrajes Trop. 2013, 1, 197–201. [Google Scholar] [CrossRef] [Scilit]
- Dias-Filho, M.B.; de Carvalho, C.J.R. Physiological and morphological responses of Brachiaria spp. to flooding. Pesqui. Agropecu. Bras. 2000, 35, 1959–1966. [Google Scholar] [CrossRef] [Scilit]
- Dias-Filho, M.B. Tolerance to flooding in five Brachiaria brizantha accessions. Pesqui. Agropecu. Bras. 2002, 37, 439–447. [Google Scholar] [CrossRef] [Scilit]
- Caetano, L.P.D.S.; Dias-Filho, M.B. Responses of six Brachiaria spp. accessions to root zone flooding. Rev. Bras. Zootec. 2008, 37, 795–801. [Google Scholar] [CrossRef] [Scilit]
- Silva, A.S.; Laura, V.A.; Jank, L. Soil flood tolerance of seven genotypes of Panicum maximum Jacq. Braz. Arch. Biol. Technol. 2009, 52, 1341–1348. [Google Scholar] [CrossRef] [Scilit]
- Cardoso, J.A.; Rincón, J.; Jiménez, J.D.L.C.; Noguera, D.; Rao, I.M. Morpho-anatomical adaptations to water-logging by germplasm accessions in a tropical forage grass. AoB Plants 2013, 5, plt047. [Google Scholar] [CrossRef] [Scilit]
- Cardoso, J.A.; Jiménez, J.D.L.C.; Rao, I.M. Waterlogging-induced changes in root architecture of germplasm accessions of the tropical forage grass Brachiaria humidicola. AoB Plants 2014, 6, plu017. [Google Scholar] [CrossRef] [Scilit] [PubMed]
- Jiménez, J.D.L.C.; Cardoso, J.A.; Dominguez, M.; Fischer, G.; Rao, I. Morpho-anatomical traits of root and non-enzymatic antioxidant system of leaf tissue contribute to waterlogging tolerance in Brachiaria grasses. Grassl. Sci. 2015, 61, 243–252. [Google Scholar] [CrossRef] [Scilit]
- Insausti, P.; Grimoldi, A.A.; Chaneton, E.J.; Vasellati, V. Flooding Induces a Suite of Adaptive Plastic Responses in the Grass Paspalum dilatatum. New Phytol. 2001, 152, 291–299. [Google Scholar] [CrossRef] [Scilit]
- Bonfim-Silva, E.M.; Silva, M.C.; Schlichting, A.F.; Porto, R.A.; Silva, T.J.A.; Koetz, M. Desenvolvimento e produção de capim-convert HD364 submetido ao estresse hídrico. Agro@mbiente On-Line 2014, 8, 134–141. [Google Scholar] [CrossRef] [Scilit]
- Mass Junior, R.; Domiciano, L.F.; Ribeiro, L.F.C.; Pedreira, B.C. Growth responses of nine tropical grasses under flooding conditions. Trop. Grassl.-Forrajes Trop. 2016, 4, 1–7. [Google Scholar] [CrossRef] [Scilit][Green Version]
- Chard, J.K.; Bugbee, B. Simulating the Field: How to Grow Plants in Soil Columns in the Greenhouse; Techniques and Instruments; Utah State University: Logan, UT, USA, 2005; 8p. [Google Scholar]
- Souza, C.S.; Martins, M.O.; Jank, L.; Barrios, S.C.L.; Andrade, C.M.S.; Mendonça, M.S.; Assis, G.M.L. Selection of Morphoagronomic Traits for Screening Tropical Forage Genotypes for Waterlogging Tolerance under Controlled Conditions. Grasses 2026, 5, 5. [Google Scholar] [CrossRef] [Scilit]
- de Sousa, J.W. Características climáticas do município de Rio Branco, Acre, período de 1990–2019. Sci. Nat. 2020, 2, 723–740. Available online: https://periodicos.ufac.br/index.php/SciNat/article/view/4231 (accessed on 8 May 2022).
- Tonato, F.; Perin, R.; Dias-Filho, M.B. Opções de forrageiras para pastagens na Amazônia. In Recuperação de Pastagens Degradadas na Amazônia; Dias-Filho, M.B., de Andrade, C.M.S., Eds.; EMBRAPA: Brasília, Brazil, 2019; pp. 79–126. [Google Scholar]
- de Assis, G.M.L.; de Andrade, C.M.S.; Jank, L.; Barrios, S.C.L.; Valentim, J.F. Metodologia para Avaliação e Seleção a Campo de Genótipos de Gramíneas Forrageiras para Tolerância à Síndrome da Morte do Braquiarão; Embrapa Acre, Documentos; Embrapa Acre: Rio Branco, Brazil, 2023; 42p. [Google Scholar]
- Tetens, O. Über einige meteorologische Begriffe. Z. Geophys 1930, 6, 297–309. [Google Scholar]
- Rao, I.M.; Rincon, J.; Garcia, R.; Miles, J.R.J. Screening for tolerance to waterlogging in Brachiaria hybrids. In Proceedings of the ASA-CSSA-SSSA International Annual Meeting 2007, New Orleans, LA, USA, 4–8 November 2007. [Google Scholar]
- Minolta, C. Manual for Chlorophyll Meter SPAD-502; Minolta Radiometric Instruments Divisions: Osaka, Japan, 1989; 22p. [Google Scholar]
- R Core Team. R: A Language and Environment for Statistical Computing; R Foundation for Statistical Computing: Vienna, Austria, 2022. [Google Scholar]
- Ferreira, E.B.; Cavalcanti, P.P.; Nogueira, D.A. R Package, version 1.2.2; ExpDes: Experimental Designs Package; CRAN: Vienna, Austria, 2021. Available online: https://CRAN.R-project.org/package=ExpDes (accessed on 15 July 2022).
- Bodner, G.; Nakhforoosh, A.; Kaul, H.-P. Management of Crop Water under Drought: A Review. Agron. Sustain. Dev. 2015, 35, 401–442. [Google Scholar] [CrossRef] [Scilit]
- Gibbs, D.J.; Lee, S.C.; Md Isa, N.; Gramuglia, S.; Fukao, T.; Bassel, G.W.; Correia, C.S.; Corbineau, F.; Theodoulou, F.L.; Bailey-Serres, J.; et al. Homeostatic Response to Hypoxia Is Regulated by the N-End Rule Pathway in Plants. Nature 2011, 479, 415–418. [Google Scholar] [CrossRef] [Scilit] [PubMed]
- Weits, D.A.; Giuntoli, B.; Kosmacz, M.; Parlanti, S.; Hubberten, H.-M.; Riegler, H.; Hoefgen, R.; Perata, P.; van Dongen, J.T.; Licausi, F. Plant Cysteine Oxidases Control the Oxygen-Dependent Branch of the N-End-Rule Pathway. Nat. Commun. 2014, 5, 3425. [Google Scholar] [CrossRef] [Scilit] [PubMed]
- Hartman, S.; Liu, Z.; van Veen, H.; Vicente, J.; Reinen, E.; Martopawiro, S.; Zhang, H.; van Dongen, N.; Bosman, F.; Bassel, G.W.; et al. Ethylene-Mediated Nitric Oxide Depletion Pre-Adapts Plants to Hypoxia Stress. Nat. Commun. 2019, 10, 4020. [Google Scholar] [CrossRef] [Scilit] [PubMed]
- Ploschuk, R.A.; Miralles, D.J.; Colmer, T.D.; Ploschuk, E.L.; Striker, G.G. Waterlogging of Winter Crops at Early and Late Stages: Impacts on Leaf Physiology, Growth and Yield. Front. Plant Sci. 2018, 9, 1863. [Google Scholar] [CrossRef] [Scilit] [PubMed]
- Baresel, J.P.; Rischbeck, P.; Hu, Y.; Kipp, S.; Barmeier, G.; Mistele, B.; Schmidhalter, U. Use of a Digital Camera as an Alternative Method for Non-Destructive Detection of Leaf Chlorophyll Content and Nitrogen Nutrition Status in Wheat. Comput. Electron. Agric. 2017, 140, 25–33. [Google Scholar] [CrossRef] [Scilit]

Disclaimer/Publisher’s Note: The statements, opinions and data contained in all publications are solely those of the individual author(s) and contributor(s) and not of MDPI and/or the editor(s). MDPI and/or the editor(s) disclaim responsibility for any injury to people or property resulting from any ideas, methods, instructions or products referred to in the content. |
© 2026 by the authors. Licensee MDPI, Basel, Switzerland. This article is an open access article distributed under the terms and conditions of the Creative Commons Attribution (CC BY) license.