


Abstract
Cerebral amyloid angiopathy (CAA) is a prevalent cerebral small vessel disease (CSVD) and prominent cause of vascular contributions to cognitive impairments and dementia (VCID). CAA is characterized by progressive accumulation of fibrillar amyloid β in cerebral vessel walls, leading to vascular wall degeneration, thrombotic occlusions, microbleeds, and perivascular inflammation causing cognitive deficits. Underlying mechanisms of CAA progression are poorly understood, and there exist no validated diagnostic biomarkers or therapeutic targets for CAA. Here, we performed proteomic mass spectrometry analysis of whole brain tissue and cerebral microvessel enriched fractions from the rTg-DI rat, a validated and well-characterized preclinical rat model of CAA, to identify potential targets and diagnostic markers related to vasculopathy progression in CAA. There were 92 increased and 104 decreased proteins identified in the rTg-DI whole brain samples, while 29 proteins were identified as increased in the enriched cerebral microvessel fractions. We identified several significant differentially expressed proteins in both sample types with commonly elevated proteins including HTRA1, APOE, APOD, CLU, MDK, and LAP3. This study also confirmed the differential expression of several proteins previously reported in isolated brain regions of rTg-DI rats, including ANXA3, APOD, APOE, CLU, CST3, CTSS, CTSD, CTSZ, GFAP, GSTA3, HTRA1, and ITGB2, with APOE, CLU, HTRA1, and GPC1 all reported in human CAA cases. We thus provide a “high-confidence” list of potential marker candidates from proteomic analysis in the rTg-DI rat model of capillary CAA type-1.
1. Introduction
Cerebral amyloid angiopathy (CAA) is a prevalent cerebral small vessel disease (CSVD) and prominent cause of vascular contributions to cognitive impairments and dementia (VCID) [1,2,3]. In addition to being the most common vascular comorbidity associated with Alzheimer’s disease (AD), CAA occurs sporadically in >60% of individuals over the age of 85 [1,2,3]. CAA arises from progressive accumulation of fibrillar amyloid β (Aβ) in the walls of cerebral vessels, ultimately leading to vascular wall degeneration and increased permeability/BBB dysfunction, thrombotic occlusions, intracerebral hemorrhages and microbleeds and subsequent perivascular tissue damage and white matter degeneration [1,4,5]. Additionally, Aβ fibrils extending into the surrounding perivascular environment, or dyshorric amyloid, drive pronounced glial cell responses, including astrocytosis and microgliosis, resulting in prominent perivascular neuroinflammation [6,7,8,9]. CAA is categorized based on impacted vascular beds: CAA type-1 which is largely restricted to capillaries, while CAA type-2 occurs in cerebral arteries and arterioles [6]. Though CAA patients can present with both CAA type-1 and type-2, cognitive decline correlates more with CAA type-1 severity [9], however, the exact unique and common contributions of CAA type-1 and CAA type-2 to disease progression remain to be determined. Despite its high prevalence, underlying mechanisms linking Aβ deposition to development of severe vasculopathies in CAA remain poorly understood, and there remain no validated targets nor effective disease-modifying therapies for CAA treatment. Furthermore, “probable” CAA diagnosis is only possible in later disease stages, when characteristic neuroimaging markers are present, with definitive diagnosis only possible postmortem [3,5]. Due to these key gaps in knowledge, timely diagnosis and interventions for meaningful CAA patient care remain elusive.
Mechanistic investigation of CAA pathology and progression for identifying diagnostic biomarkers or therapeutic targets is challenging in human patient samples and therefore necessitates the use of reliable and valid preclinical animal models that faithfully recapitulate human CAA pathological characteristics. Furthermore, due to the common co-occurrence clinically of CAA type-1 and CAA type-2, as well as the common occurrence of Aβ plaque pathology (as is seen in AD patients), it is also challenging to investigate the contributions of capillary CAA or arteriolar CAA in isolation. Recently, we developed a preclinical rat model of CAA type-1, the rTg-DI model, that produces human Aβ in brain harboring the Dutch (E22Q) and Iowa (D23N) familial CAA mutations [10]. The rTg-DI rat presents with early-onset and progressive deposition of predominantly Aβ40 in cerebral capillaries, faithfully recapitulating more severe CAA pathologies including thrombotic vessel occlusions, cerebral microhemorrhages, white matter degeneration, and pronounced perivascular neuroinflammation [10,11,12,13]. Additionally, rTg-DI rats present with cognitive impairments in an age-dependent manner, similar to those observed in human CAA cases [14]. Aβ deposition in the rTg-DI rat is restricted to capillaries, rendering it a specific model of CAA type-1. Thus, the rTg-DI rat is a reliable and relevant preclinical model of CAA type-1, allowing for molecular investigation of mechanisms underscoring development of severe CAA pathologies.
Interestingly, the rTg-DI rat displays a regional distribution of specific CAA pathologies. For example, while capillary amyloid deposition is observed globally, neuroinflammatory responses are more pronounced in the hippocampal and thalamic regions as compared to the cortex or corpus callosum, with thrombotic occlusions and microhemorrhages largely restricted to the thalamic region, and white matter degeneration most pronounced in the corpus callosum [10,11,12,15]. Recently we conducted several regional proteomic analyses of the rTg-DI rat brains, including analysis of cortical, hippocampal, thalamic, and corpus callosum regions, in both early- and late-disease state rTg-DI cohorts, linking differentially expressed proteins (DEPs) to specific CAA pathologies [12,13,15,16]. Importantly, these studies revealed significant overlap in DEPs with reported proteomic analysis of postmortem tissue, including protein markers serine protease HTRA1, apolipoprotein E (APOE), and clusterin (CLU), highlighting the clinical relevance and translatability of the model [12,13,15]. However, a limitation of these previous approaches is that, while isolating individual regions, the proteomic analysis was completed with bulk brain tissue within those regions and therefore failed to resolve proteome changes originating in cerebral vessels as a product of vascular pathologies versus those originating from parenchymal tissue.
Here we present a comparative proteomic analysis, employing data-independent acquisition proteomics as done previously, to compare proteome changes in rTg-DI bulk whole brain and cerebral microvessel enriched samples. The results presented here highlight DEPs, both common and unique between whole brain and vessel samples, that provide important insight into specific molecular changes both shared and unique between cerebral blood vessels and parenchymal tissue or specific to responses in parenchymal tissue. These findings bear high clinical significance, as the markers identified here harbor potential for diagnostic biomarkers or novel therapeutic target development.
2. Materials and Methods
2.1. Animals
All animal work and procedures were approved by the University of Rhode Island Institutional Animal Care and Use Committee and in accordance with the United States Public Health Service’s Policy on Humane Care and Use of Laboratory Animals and in compliance with the ARRIVE guidelines [17]. The rTg-DI rat model has been previously described [10] and expresses low levels of human Swedish/Dutch/Iowa mutant AβPP controlled by the neuronal specific Thy1.2 promoter leading to production of chimeric Dutch/Iowa Aβ peptides in rat brain. The 12 M rTg-DI and Sprague Dawley wild-type (WT) rats used in this study were housed on a standard 12 h light cycle, in a controlled room (22 ± 2 °C and 40–60% humidity), with chow and water available ad libitum. Animal cohorts consisted of the following: for whole brain analysis 9 WT (5 male, 4 female) and 8 rTg-DI (3 male, 5 female), for isolate cerebral vessels 9 WT (5 male, 4 female) and 8 rTg-DI (5 male, 3 female). Sample size calculations were not performed when determining the cohort sizes, though they were based on several previous proteomics studies in the rTg-DI model. Experiments/tissue processing were not blinded to genotype.
2.2. Brain Tissue Collection and Preparation
Rats were anesthetized and transcardially perfused with PBS prior to surgical removal of the brains. Following bisection in the mid-sagittal plane, one hemisphere was reserved for proteomics analysis, while the other was fixed in 4% paraformaldehyde (PFA) for immunohistochemical analysis. Hemispheres reserved for proteomics analysis were either frozen in liquid nitrogen or pulverized for whole brain sample analysis. Cerebral vessels were isolated from 12 M rTg-DI rat brain hemispheres as previously described [18,19].
2.3. Tissue Lysis and Protein Digest for Proteomics Sample Preparation
Pulverized whole brain tissue and isolated cerebral vessels were lysed in cold 1× radioimmunoprecipitation assay (RIPA) buffer via sonication (20 × 1 s bursts) on ice and incubation on ice for 2 h. Protein digestion and subsequent isolation from lysed tissue were performed as previously described [12,13,15,16,20,21]. Briefly, proteins were denatured by incubation with DTT (final concentration 20 mM) for 15 min at 95 °C with shaking and then subsequently alkylated by the addition of iodoacetamide and dark incubation for 30 min at room temperature. Proteins were then precipitated by chloroform methanol precipitation and resuspended in sodium deoxycholate (DOC, 3% w/v in 50 mM ammonium bicarbonate), digested with TPCK-treated trypsin via pressure cycling technology, and DOC precipitated from the final sample with formic acid as previously described [12,13,15,16,20,21]. Supernatant containing cleaned digested peptides was collected for analysis by mass spectrometry.
2.4. Mass Spectrometry Proteomics
Peptide separation was achieved over a 2 h gradient from 98:2 to 5:95 buffer A:B ratio, utilizing a Vanquish Flex (micro-flow) UHPLC and an Acquity UPLC Peptide BEH C18 (2.1 × 150 mm, 300 Å, 1.7 μm) column. Proteomic mass spectrometry (MS) was performed on a ThermoFisher Orbitrap Exploris 240 Mass Spectrometer (ThermoFisher Scientific, Waltham, MA, USA). Eluted peptides were ionized with an electrospray ionization (ESI) source, with spray voltage set to static, positive ion voltage set to 3600 V, negative ion set to 200 V, and the ion transfer tube set to 320 °C. For the MS1 scan, Orbitrap resolution was set to 60 K at a scan range of 400–1100 m/z, with a maximum injection time of 45 ms and a normalized ACG target of 300%. The RF lens was set to 70% and the data type was set to profile mode. The DIA scan utilized a precursor mass range of 400–1000 m/z, and scan range mode was set to “define m/z range” with a scan range set to 145–1450 m/z, with isolation window of 10 m/z, window overlap of 1 m/z, and optimized window placement turned on. HCD fragmentation was used with a normalized collision energy of 30%. Maximum injection time was set to 80 ms, and the custom AGC target was 2000%. All samples in head-to-head comparisons (i.e., enriched vessel fraction comparison or whole brain tissue comparison) were run as a single batch and were not randomized. Both comparisons were run with the WT group first and rTg-DI CAA group second, with WT = 1–9 and rTg-DI = 10–17.
2.5. Data Processing and Analysis
Data were processed and analyzed as previously described [12,13,15,16,20,21,22] with slight modifications. Raw spectral data was analyzed with Spectronaut™ software (Biognosys, Schlieren, Switzerland, version #19.4.241104.62635). Proteins were quantified and identified from DIA data referencing our previously published in-house library, formed from a combination of 128 rat brain tissue and cerebrospinal fluid DIA and data-dependent acquisition (DDA) runs from ThermoFisher Orbitrap Exploris 240, ThermoFisher Orbitrap Exploris 480, and AB Sciex (Marlborough, MA, USA) TripleTOF 5600 mass spectrometers, utilizing the Spectronaut™ (version #19.1.240806.62635) Pulsar™ algorithm, with all settings set to factory defaults and referencing the Rat_uniprot_proteome_UP000002494_10116 FASTA file [22]. For DIA analysis, all settings were kept as factory defaults, except that normalization strategy was set to “local”. Extracted Ion Chromatogram (XIC) Extraction settings for XIC Ion Mobility (IM) Extraction Window, XIC Retention Time (RT) Extraction Window, MS1 Mass Tolerance Strategy, and MS2 Mass Tolerance Strategy were all set to dynamic, utilizing Spectronaut’s High-Precision iRT algorithm for retention time alignment that performs non-linear segmented regression to dynamically correct for LC performance fluctuations [23]. A table with the exact configurations for the library formation can be found in Supplementary Table S1. Spectronaut™ maintained a false discovery rate of 0.01 at the protein, peptide, and protein spectrum match levels, and single hit proteins were excluded. Raw protein group quantities of the Spectronaut output were log2 transformed prior to differential expression analysis. To account for both missing not at random (MNAR) due to protein low abundance and missing at random (MAR) due to technical inconsistencies, imputation of missing values was performed using a hybrid MAR/MNAR approach utilizing the R packages “missForest” for MAR and “imputeLCMD” for MNAR, as use of single imputation methods may bias results by not adequately modeling experimental variability or exaggerating calculated fold change or statistical significance [24,25]. Filtering proteins from experimental results based on missingness as a percentage of total observations in the experiment (i.e., proteins missing in ≥50% of all samples) will consequently discard biologically relevant differences between experimental groups, especially in MNAR cases where a protein is missing in the majority of one experimental group and present in the other, and we thus chose not to do so [24,25]. Furthermore, hybrid MAR/MNAR approaches combining methods are reported to outperform individual use of MAR or MNAR methods across a variety of proteomics datasets [26]. As is commonly done, we defined MNAR values as those missing in >50% of samples within a group and performed a Persius-style Gaussian left-shift imputation for these values, sampling values from a left-shifted (1.8 SD) normal distribution with a width of 0.3 SD [27]. For MAR values (missing in <50% of samples within a group), we applied a random forest imputation method utilizing the “missForest” package in R, as random forest imputation is reported to outperform other methods for MAR imputation [28,29]. Following imputation, differentially expressed proteins (DEPs) were determined by head-to-head comparison utilizing the “limma” package in R and employing a moderated (empirical Bayes) t-test with a Benjamini–Hochberg correction, with fold-change (FC) threshold cutoffs of 1.5 (50% increase) and −1.5 (33% decrease) and FDR cutoff = 0.05. To assess enrichment for endothelial cell proteins in the cerebral microvessel enriched fractions compared to the whole brain tissue samples, we performed a Wilcoxon rank enrichment analysis in “R”, assessing enrichment for endothelial, astrocytic, microglial, neuronal, and oligodendrocytic proteins. Cell-type gene sets for these five cell types were obtained from the PanglaoDB scRNA-seq database [30].
2.6. Immunolabeling and Histological Analysis
Immunolabeling and histological analysis of whole brain tissue and isolated vessels were performed as previously described [10,12,15,18,20,22] with some modifications. Briefly, PFA-fixed brain hemispheres cut in the sagittal plane (thickness 20–50 μm) or isolated cerebral vessels were placed on slides. Slides were incubated with blocking buffer containing Triton X-100 (0.3% v/v) in Superblock blocking buffer (37518, ThermoFisher) for 30 min at room temperature, followed by overnight incubations with primary antibody at the following dilutions: to identify cerebral blood vessels, rabbit polyclonal antibody to collagen IV (1:250, SD2365885, Invitrogen Carlsbad, CA, USA); rabbit polyclonal antibody to HTRA1 (1:200, MAB2916, R&D Systems, Minneapolis, MN, USA), rabbit polyclonal antibody to midkine (1:200, PA5150201, Invitrogen) and rabbit monoclonal antibody to APOE (1:250, RRID: AB_2832971, Abcam, Cambridge, UK). Appropriate Alexa Fluorescent 594- or 488-conjugated secondary antibodies (1:1000) were used for detection of primary antibodies, while Thioflavin S (123H0598, Sigma-Aldrich, St. Louis, MO, USA) was used for staining of fibrillar amyloid deposits according to manufacturer guidelines. Immunolabeled and histological images were captured and analyzed using the Keyence BZ-X710 Microscope (RRID:SCR_017202) and Keyence BZ-X Analyzer Software Version 1.3.1.1 (Keyence Corp., Osaka, Japan), respectively.
3. Results
3.1. Aβ Deposition in rTg-DI Brain Tissue and Isolated Vessels
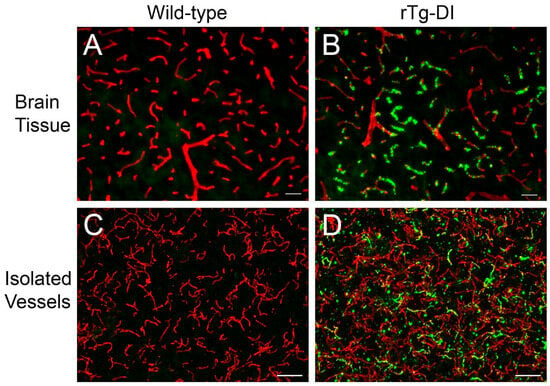
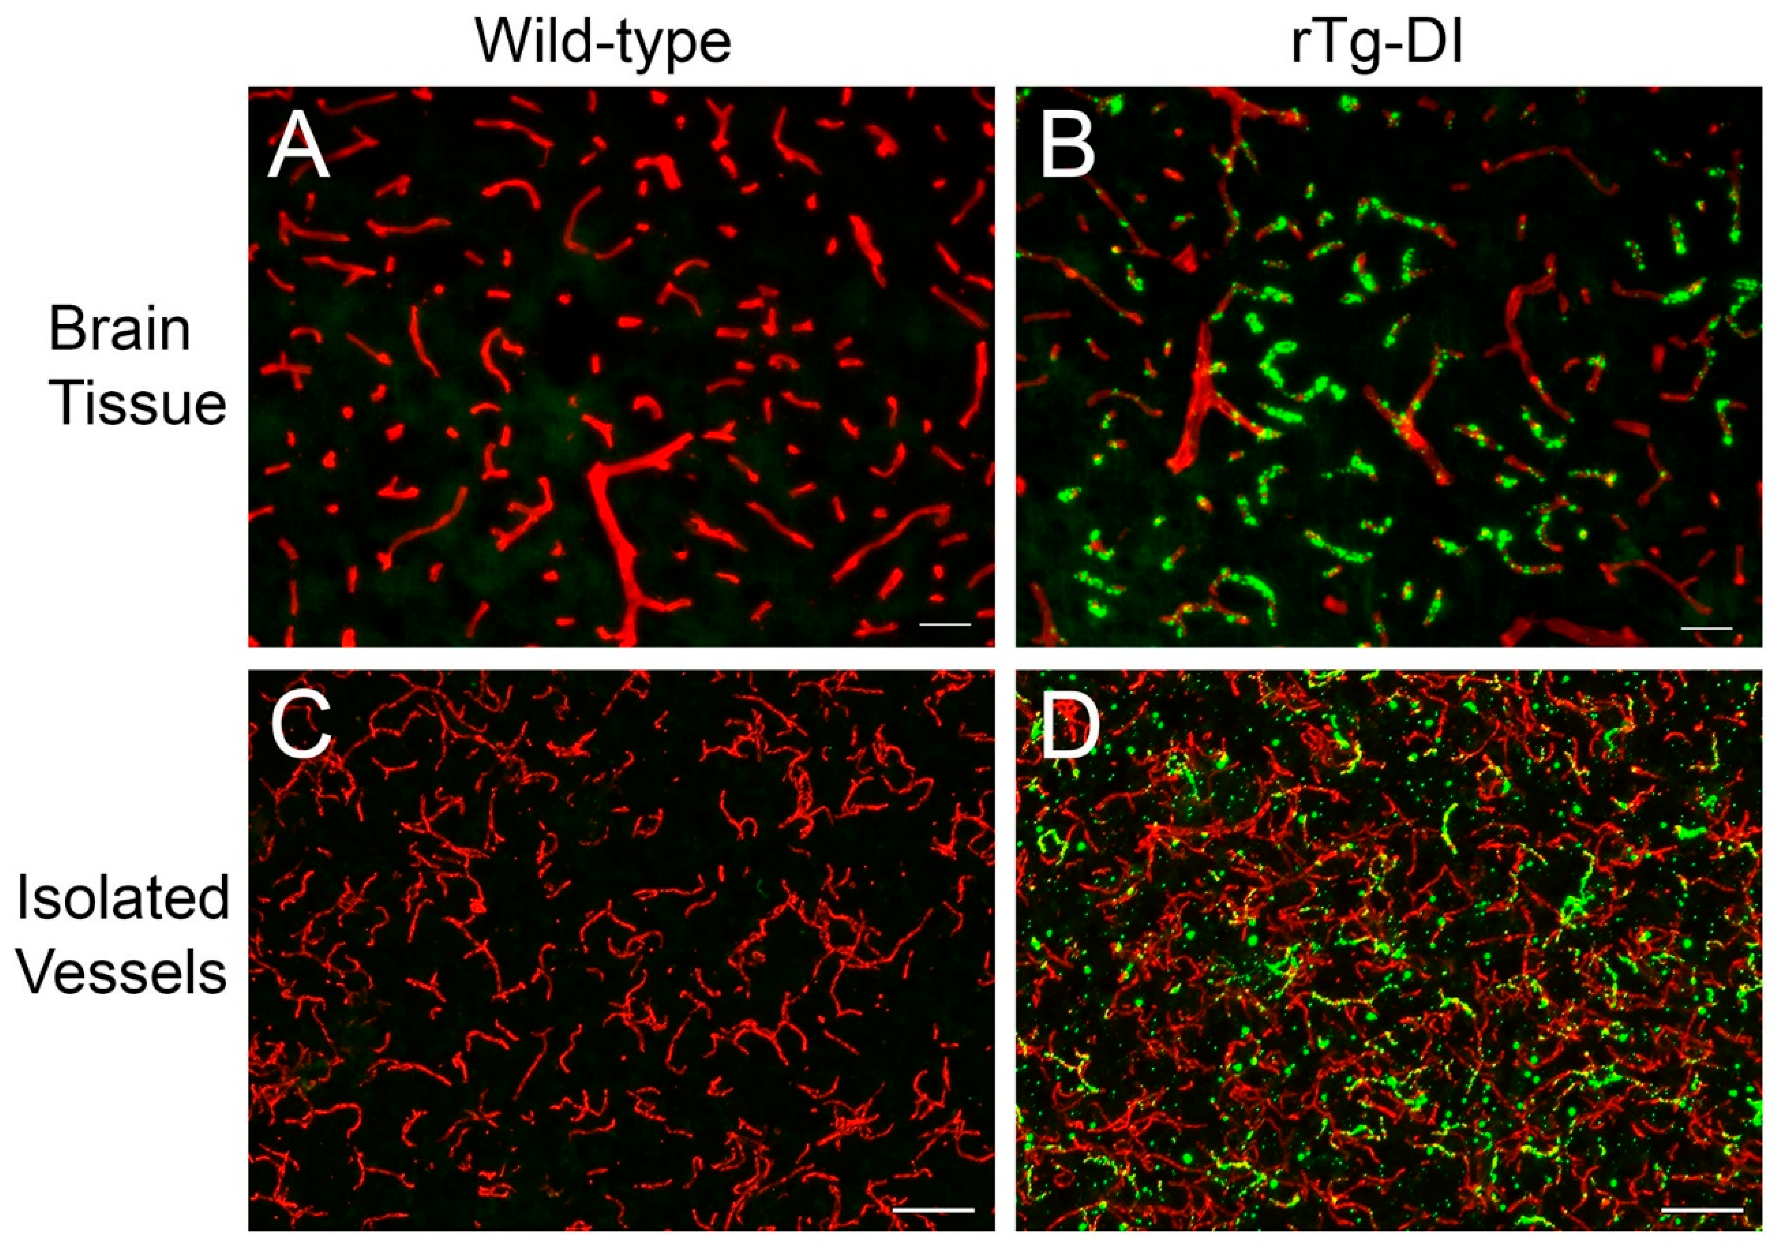
As we have previously reported, the rTg-DI rat is a specific model of CAA type-1, with Aβ deposition restricted primarily to capillaries, and devoid of parenchymal plaque pathology [10,12]. Representative images presented in Figure 1 show, at 12 M of age, brain sections and enriched microvessel fractions from WT rats showing no amyloid deposition (Figure 1A and Figure 1C, respectively). In contrast, brain sections and enriched microvessel fractions from 12 M Tg-DI rats display pronounced vascular amyloid coverage (Figure 1B and Figure 1D, respectively). As the 50 µm scale bars indicate, the enriched cerebral microvessel fractions primarily consist of capillaries (<10 µm diameter) with the rare presence of precapillary arterioles of slightly larger diameters.
Figure 1.
Cerebral microvascular amyloid in 12 M rTg-DI rat brain and isolated cerebral vessels. Cortical brain sections (A,B) and isolated cerebral vessels (C,D) from 12 M WT and rTg-DI rat brains were stained with thioflavin S to identify fibrillar amyloid (green) and immunolabeled with rabbit polyclonal antibody to collagen IV for the detection of microvessels (red). Pronounced microvascular fibrillar amyloid deposits were observed in both cortical brain sections and isolated cerebral vessels from rTg-DI rats. Scale bars = 50 μM.
3.2. Proteome Changes in rTg-DI Whole Brain Tissue
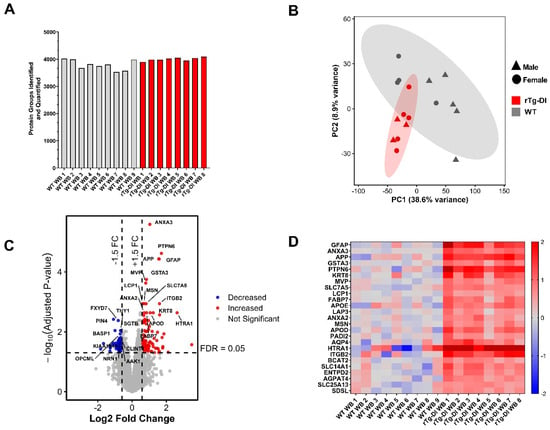
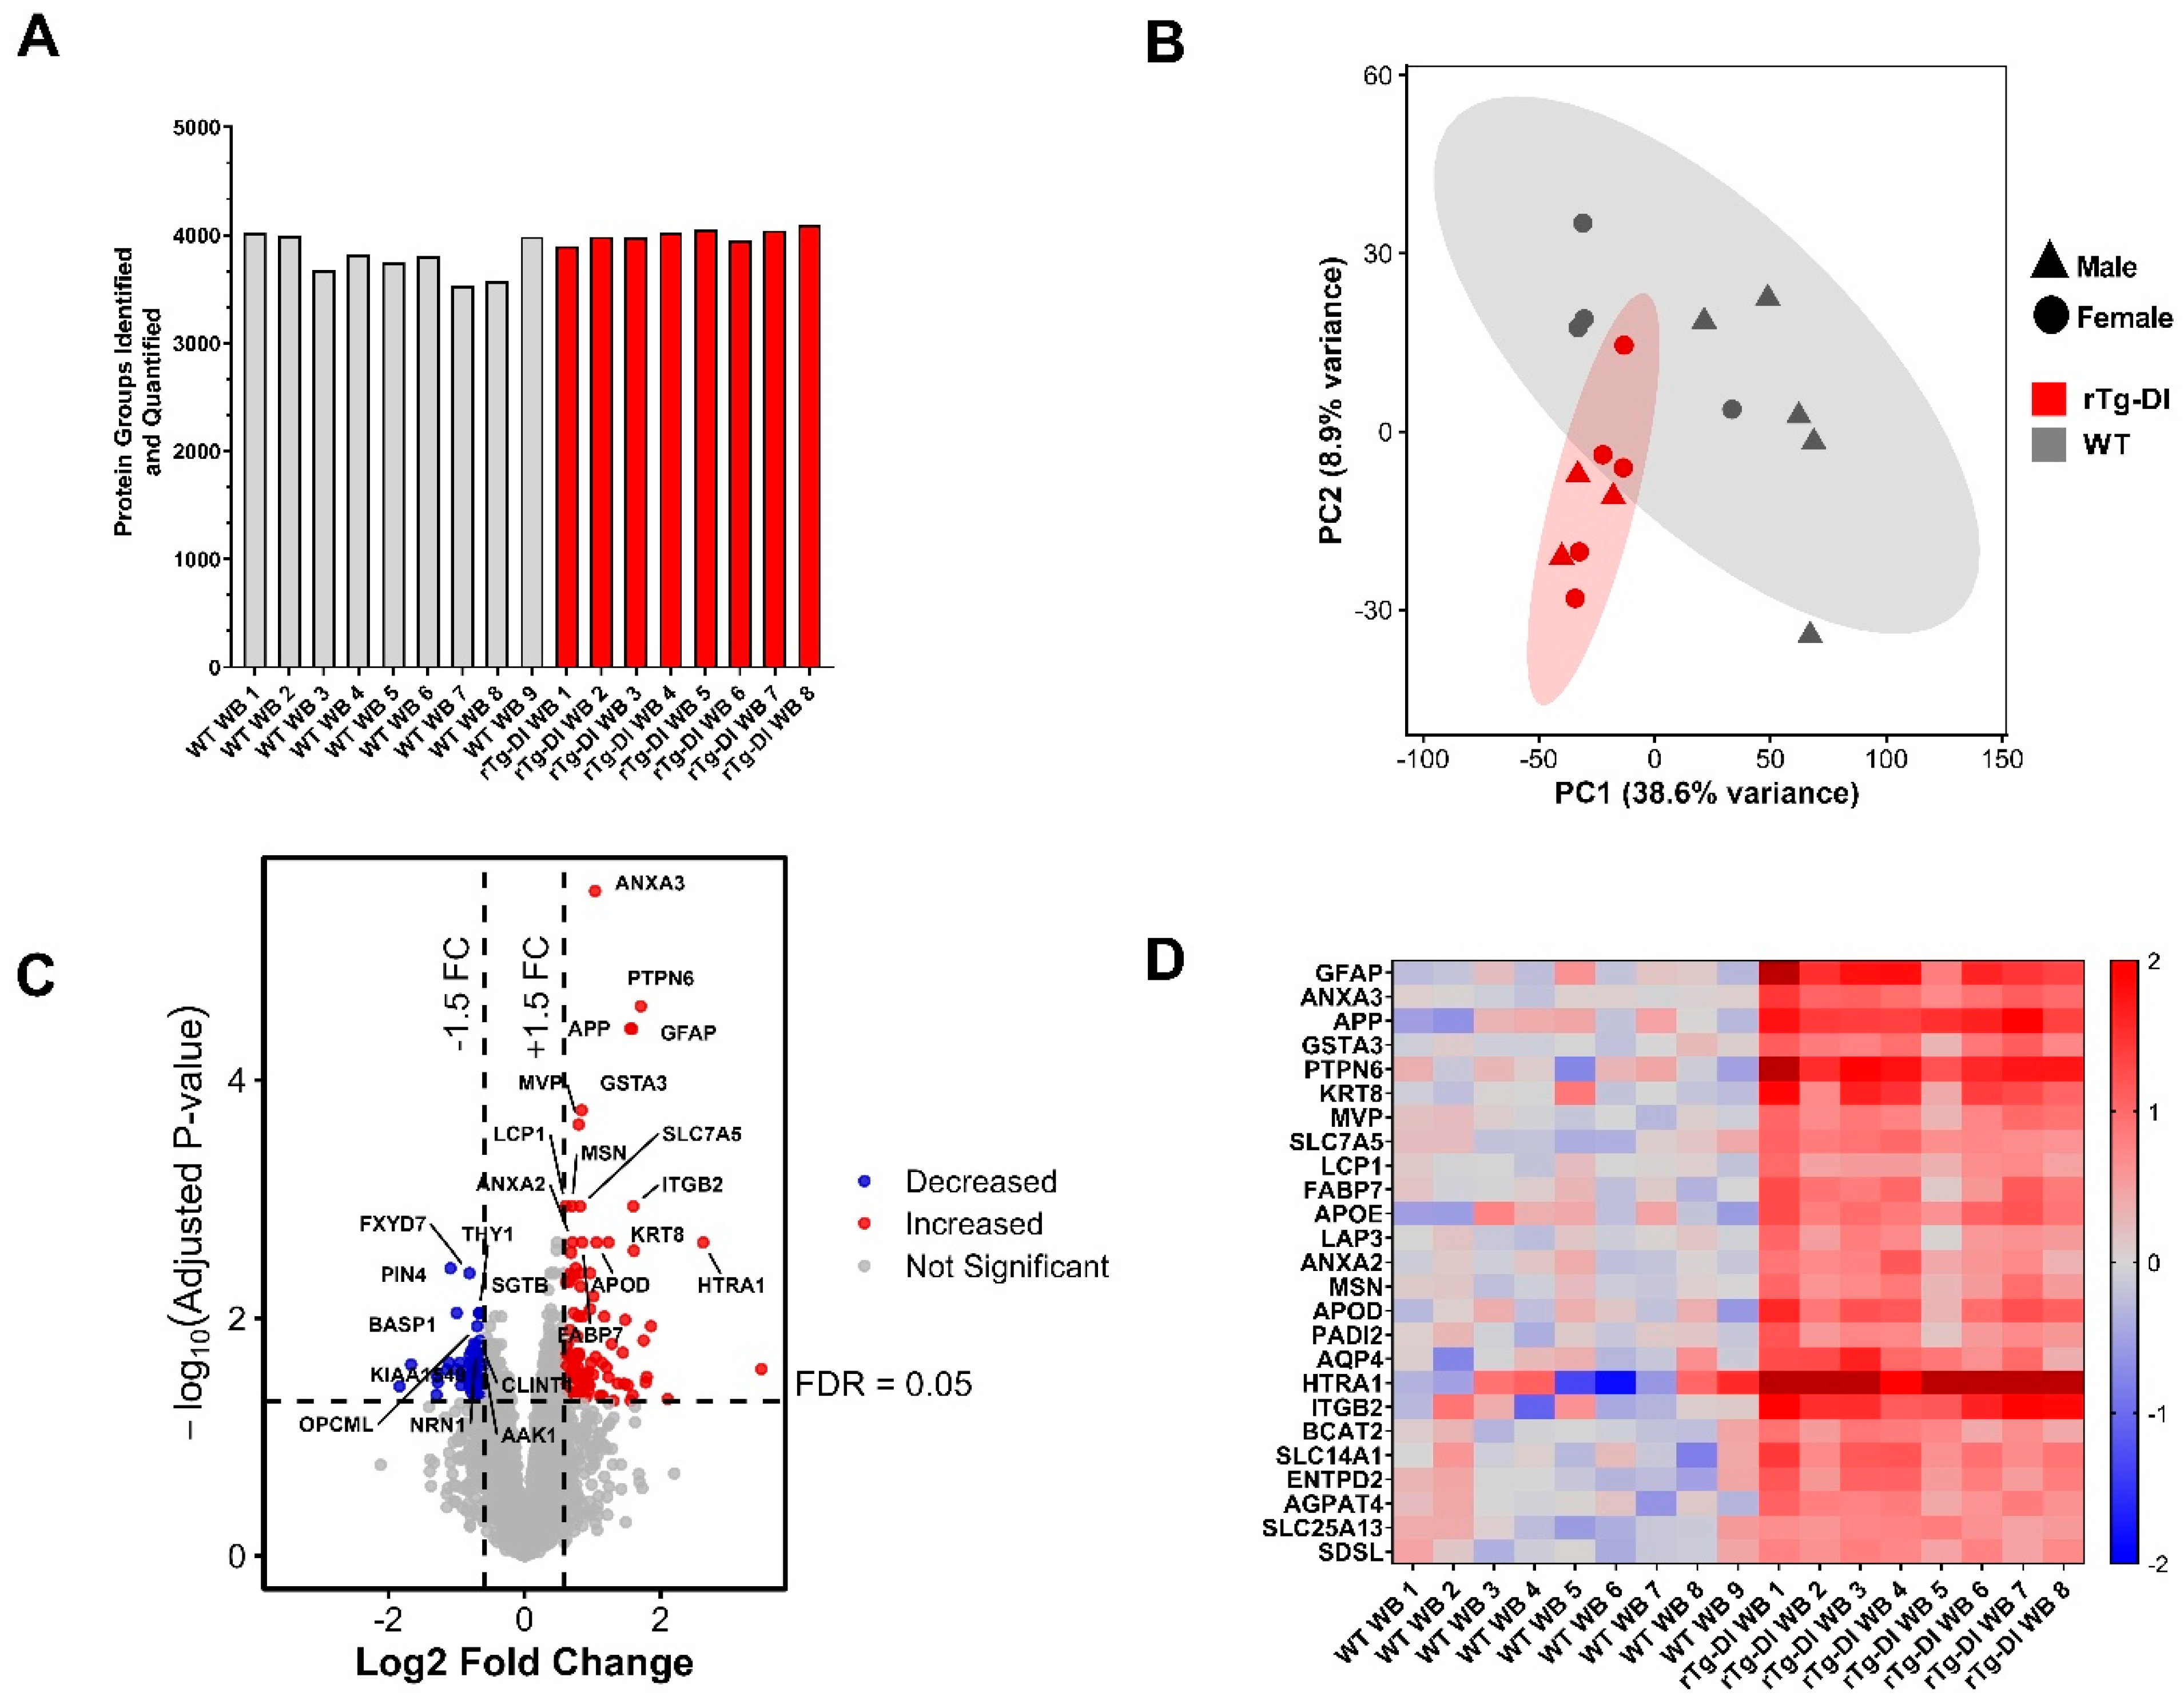
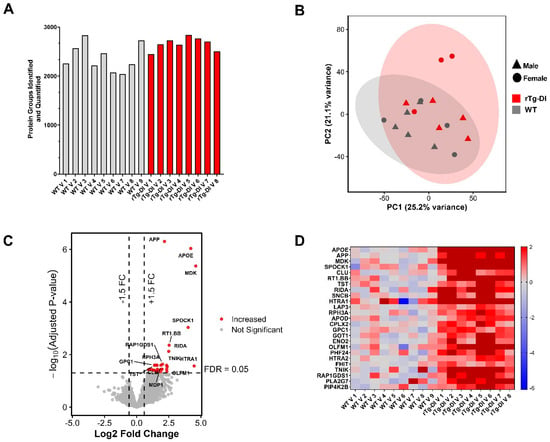
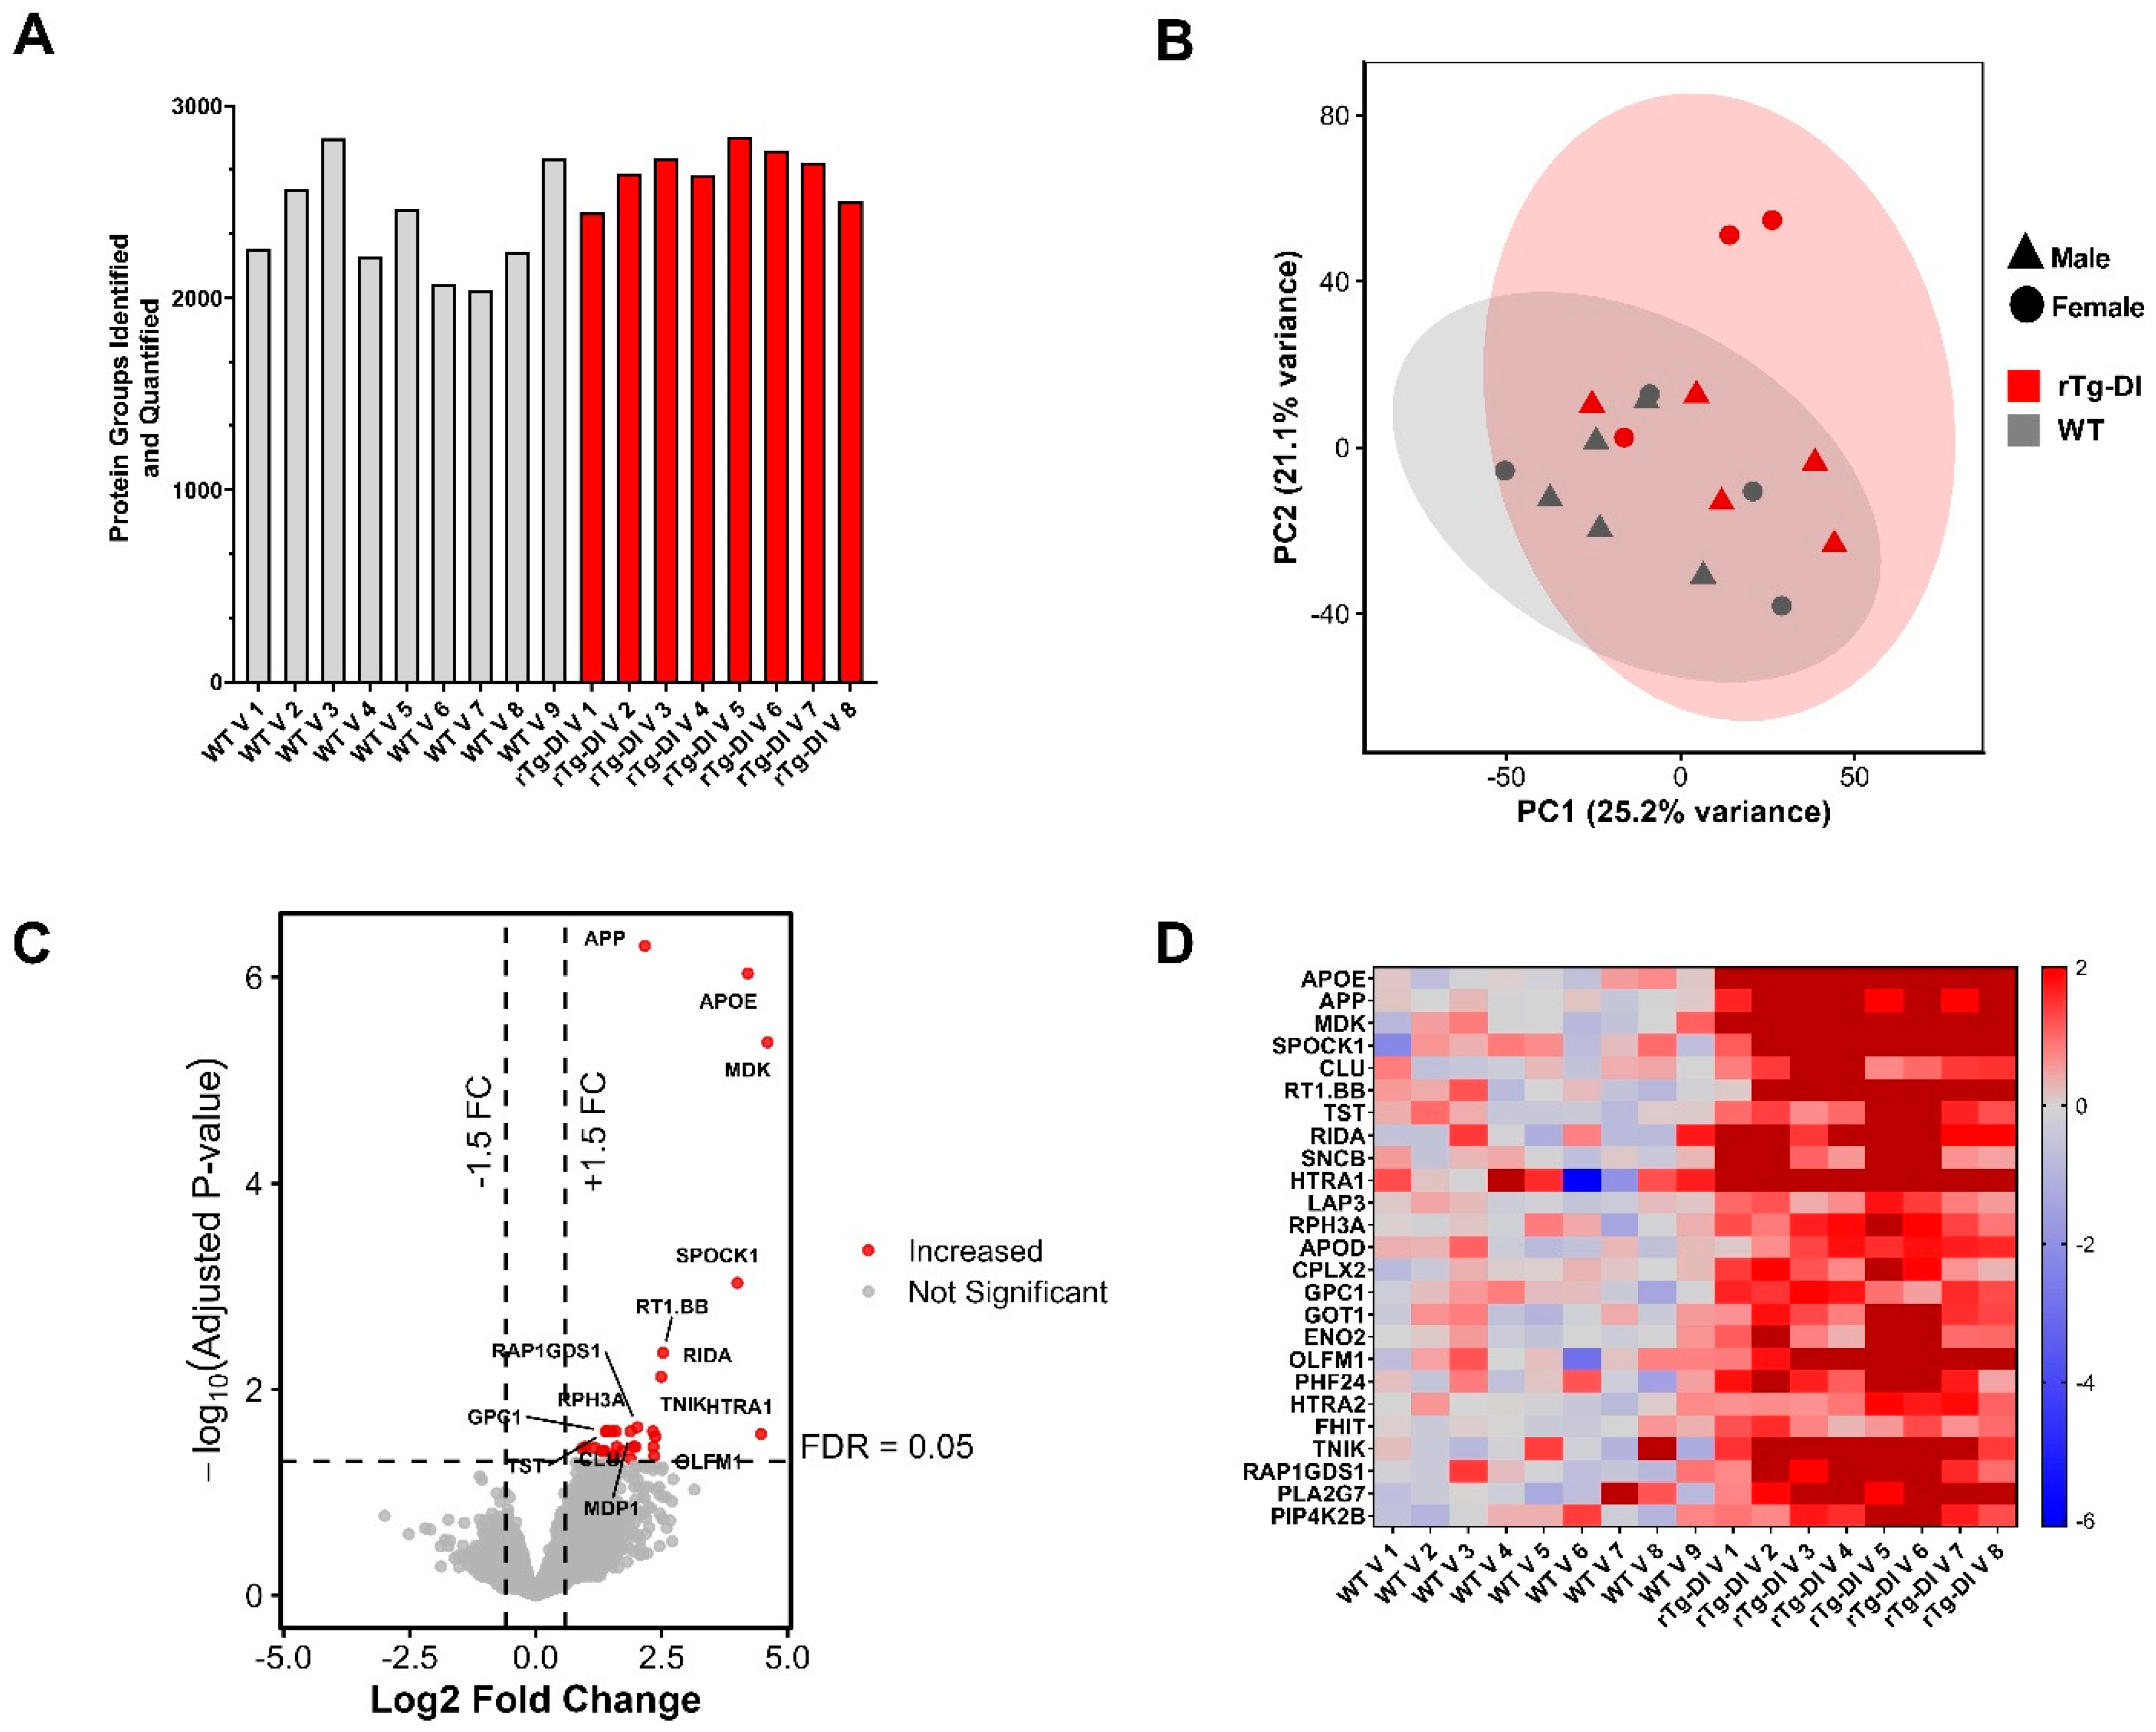
To elucidate proteomic changes in the rTg-DI rats that are both common and specific to whole brain tissue and cerebral microvessel enriched fractions, we first conducted discovery DIA proteomic analysis of pulverized, perfused whole brain tissue from 12 M rTg-DI rats and similarly aged WT rats as described in the “Materials and Methods” section and as done previously [12,13,15,16,20]. Protein identification and quantification from raw spectral data were performed with Spectronaut® Software (Biognosys, Cambridge, MA, USA) referencing our in-house proteomic library constructed within Spectronaut® utilizing its Pulsar algorithm as described in the “Materials and Methods”. In total 4239 unique protein groups were identified across all samples, with number of protein groups identified in each sample displayed in Figure 2A. Principal component analysis (PCA) (Figure 2B), conducted in RStudio® (version 4.5.2) (Posit, Boston, MA, USA), displays significant clustering of rTg-DI and WT datasets with little overlap, with no obvious clustering as a function of sex in these animals. Raw protein intensities from the Spectronaut® output were log2 transformed, and missing values were addressed by employing a hybrid imputation strategy for both missing at random (MAR) and missing not at random (MNAR) values in “R”, as described in the “Materials and Methods”. Metadata for the proteomic analysis of the rTg-DI whole brain tissue including individual animal ID, group, sex, run order, protein group identifications per sample, and rate of missingness/data completeness, as well as rates of MNAR and MAR within missing values, can be found in Supplementary Materials Table S2.
Figure 2.
Differential proteomic analysis of 12 M rTg-DI rat whole brain tissue. (A) Number of unique protein groups identified in individual pulverized whole brain samples from 12 M WT (grey) and rTg-DI (red) rats. (B) Principal Component Analysis (PCA) of log2 transformed data from 12 M WT (grey) and rTg-DI (red) rat pulverized whole brain tissue samples. Shapes indicate sex of individual rats, with triangles = male, circles = female. n = 9 (4 female, 5 male) for WT and n = 8 (5 female, 3 male) for rTg-DI. (C) Volcano plot of all identified and quantified proteins from the 12 M whole brain tissue analysis plotting log2 FC against −log10 adjusted p values (empirical Bayes moderated t-test with Benjamini–Hochberg correction) for each individual protein. Proteins satisfying our criteria for significantly increased (≥1.5 FC, adj. p ≤ 0.05) are highlighted in red, while those satisfying our criteria for significantly decreased (≥−1.5 FC adj. p ≤ 0.05) are highlighted in blue. (D) Heat map depicting the “Top 25” elevated proteins in the rTg-DI rat whole brain samples, with proteins scored by multiplying mean abundance (total experiment) by −log10 adjusted p values, with individual log2 expression for each animal shown relative to WT group mean, with red indicating increased abundance, blue decreased, and grey no change, and color intensity relative to the degree of change.
Determination of DEPs was performed by head-to-head comparison of mean log2 protein expression between the experimental groups, with expression ratio threshold cutoffs set to ±1.5 fold change (FC), and statistical significance (adjusted p value ≤ 0.05) determined by utilizing a moderated empirical Bayes t-test, followed by Benjamini–Hochberg correction in the “limma” package in “R”. A volcano plot for all analyzed proteins, plotting −log10 (adjusted p value) vs. log2 FC for each protein, is depicted in Figure 2C, with DEPs satisfying the above criteria highlighted as significantly increased (red) or decreased (blue). There were 92 proteins identified as significantly increased in the rTg-DI whole brain samples, while 104 proteins were identified as significantly decreased. A list of all DEPs, including their logFC, average log2 expression, standard deviation, p values, and adjusted p values, is found in Supplementary Materials Table S4. We then scored each significantly increased protein according to average abundance and statistical significance by multiplying the protein’s mean abundance (across the entire experiment) by the adjusted p value for that protein to highlight a “top 25” list of increased proteins. A heat map depicting the relative logFC (individual abundance compared to WT group mean) of each of these proteins in each individual rat sample is depicted in Figure 2D. Several notable proteins are highlighted in this list, including HTRA1, GFAP, APP, KRT8, HSPB1, APOD, ANXA3, AQP4, APOE, ITGB2, FABP7, and GSTA3, were similarly identified as increased in our previous regional brain analyses [12,13,15] adding to the consistency and confidence in the present results. To investigate the presence of sex-associated changes in our results, we performed a sex coefficient test, adjusting for genotype group and again employing a moderated empirical Bayes t-test utilizing the “limma” R package, however, this analysis did not return any significantly altered proteins based on this coefficient. It is worth noting that the cohort sizes in this study are likely underpowered to highlight any sex-specific changes, and to conclusively answer this question requires additional investigation in larger animal cohorts.
3.3. Proteome Changes in rTg-DI Isolated Cerebral Vessels
We next conducted proteomic analysis of cerebral microvessel enriched fractions prepared from 12 M rTg-DI and WT rat brains according to the same workflow as the whole brain tissue and as described in the “Materials and Methods”, with significant DEPs determined in the same manner. Metadata for the proteomic analysis of the rTg-DI cerebral microvessel enriched fractions including individual animal ID, group, sex, run order, protein group identifications per sample, and rate of missingness/data completeness, as well as rates of MNAR and MAR within missing values, can be found in Supplementary Materials Table S3.
The total number of unique protein groups identified across all samples was 2961, with 29 proteins significantly increased and 0 proteins significantly decreased. Identification numbers for each sample are displayed in Figure 3A. PCA of the vessel proteomic analysis (Figure 3B) revealed less distinct clustering, and as with the whole brain samples, analysis considering sex as a coefficient did not reveal any sex-associated protein changes. Again, it is worth noting that the cohort sizes in this study are likely underpowered to highlight any sex-specific changes, and to conclusively answer this question requires additional investigation in larger animal cohorts. A volcano plot for all analyzed proteins, plotting −log10 (adjusted p value) vs. log2 FC for each protein, is depicted in Figure 3C, highlighting significantly increased proteins (red) or decreased (blue) proteins. A list of these increased proteins, including their logFC, average log2 expression, standard deviation, p values, and adjusted p values, is found in Supplementary Materials Table S5. Increased proteins were scored as with the whole brain analysis, and a heat map depicting the top 25 is shown in Figure 3D. This list included several proteins of note, including: midkine (MDK), APOE, HTRA1, beta-synuclein (SNCB), CLU, PLA2G7, and SPOCK-1, among others.
Figure 3.
Differential proteomic analysis of 12 M rTg-DI rat cerebral microvessel enriched fractions. (A) Number of unique protein groups identified in individual cerebral microvessel enriched samples from 12 M WT (grey) and rTg-DI (red) rats. (B) Principal Component Analysis (PCA) of log2 transformed data from 12 M WT (grey) and rTg-DI (red) rat cerebral microvessel enriched fractions. Shapes indicate sex of individual rats, with triangles = male, circles = female. n = 9 (4 female, 5 male) for WT and n = 8 (3 female, 5 male) for rTg-DI. (C) Volcano plot of all identified and quantified proteins from the microvessel enriched fraction analysis plotting log2 FC against −log10 adjusted p values (empirical Bayes moderated t-test with Benjamini–Hochberg correction) for each individual protein. Proteins satisfying our criteria for significantly increased (≥1.5 FC, adj. p ≤ 0.05) are highlighted in red. (D) Heat map depicting the “Top 25” elevated proteins in the rTg-DI rat cerebral microvessel enriched samples, with proteins scored by multiplying mean abundance (total experiment) by −log10 adjusted p values, with individual logFC expression relative to WT group mean for each animal shown, with red indicating increased abundance, blue decreased, and grey no change, and color intensity relative to the degree of change.
3.4. Validation of Select Markers in rTg-DI Isolated Vessels
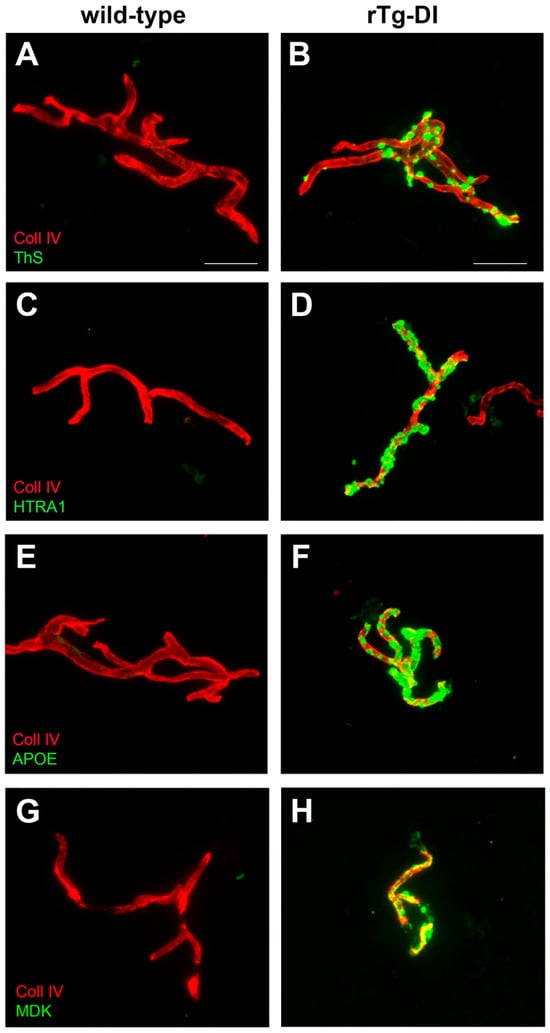
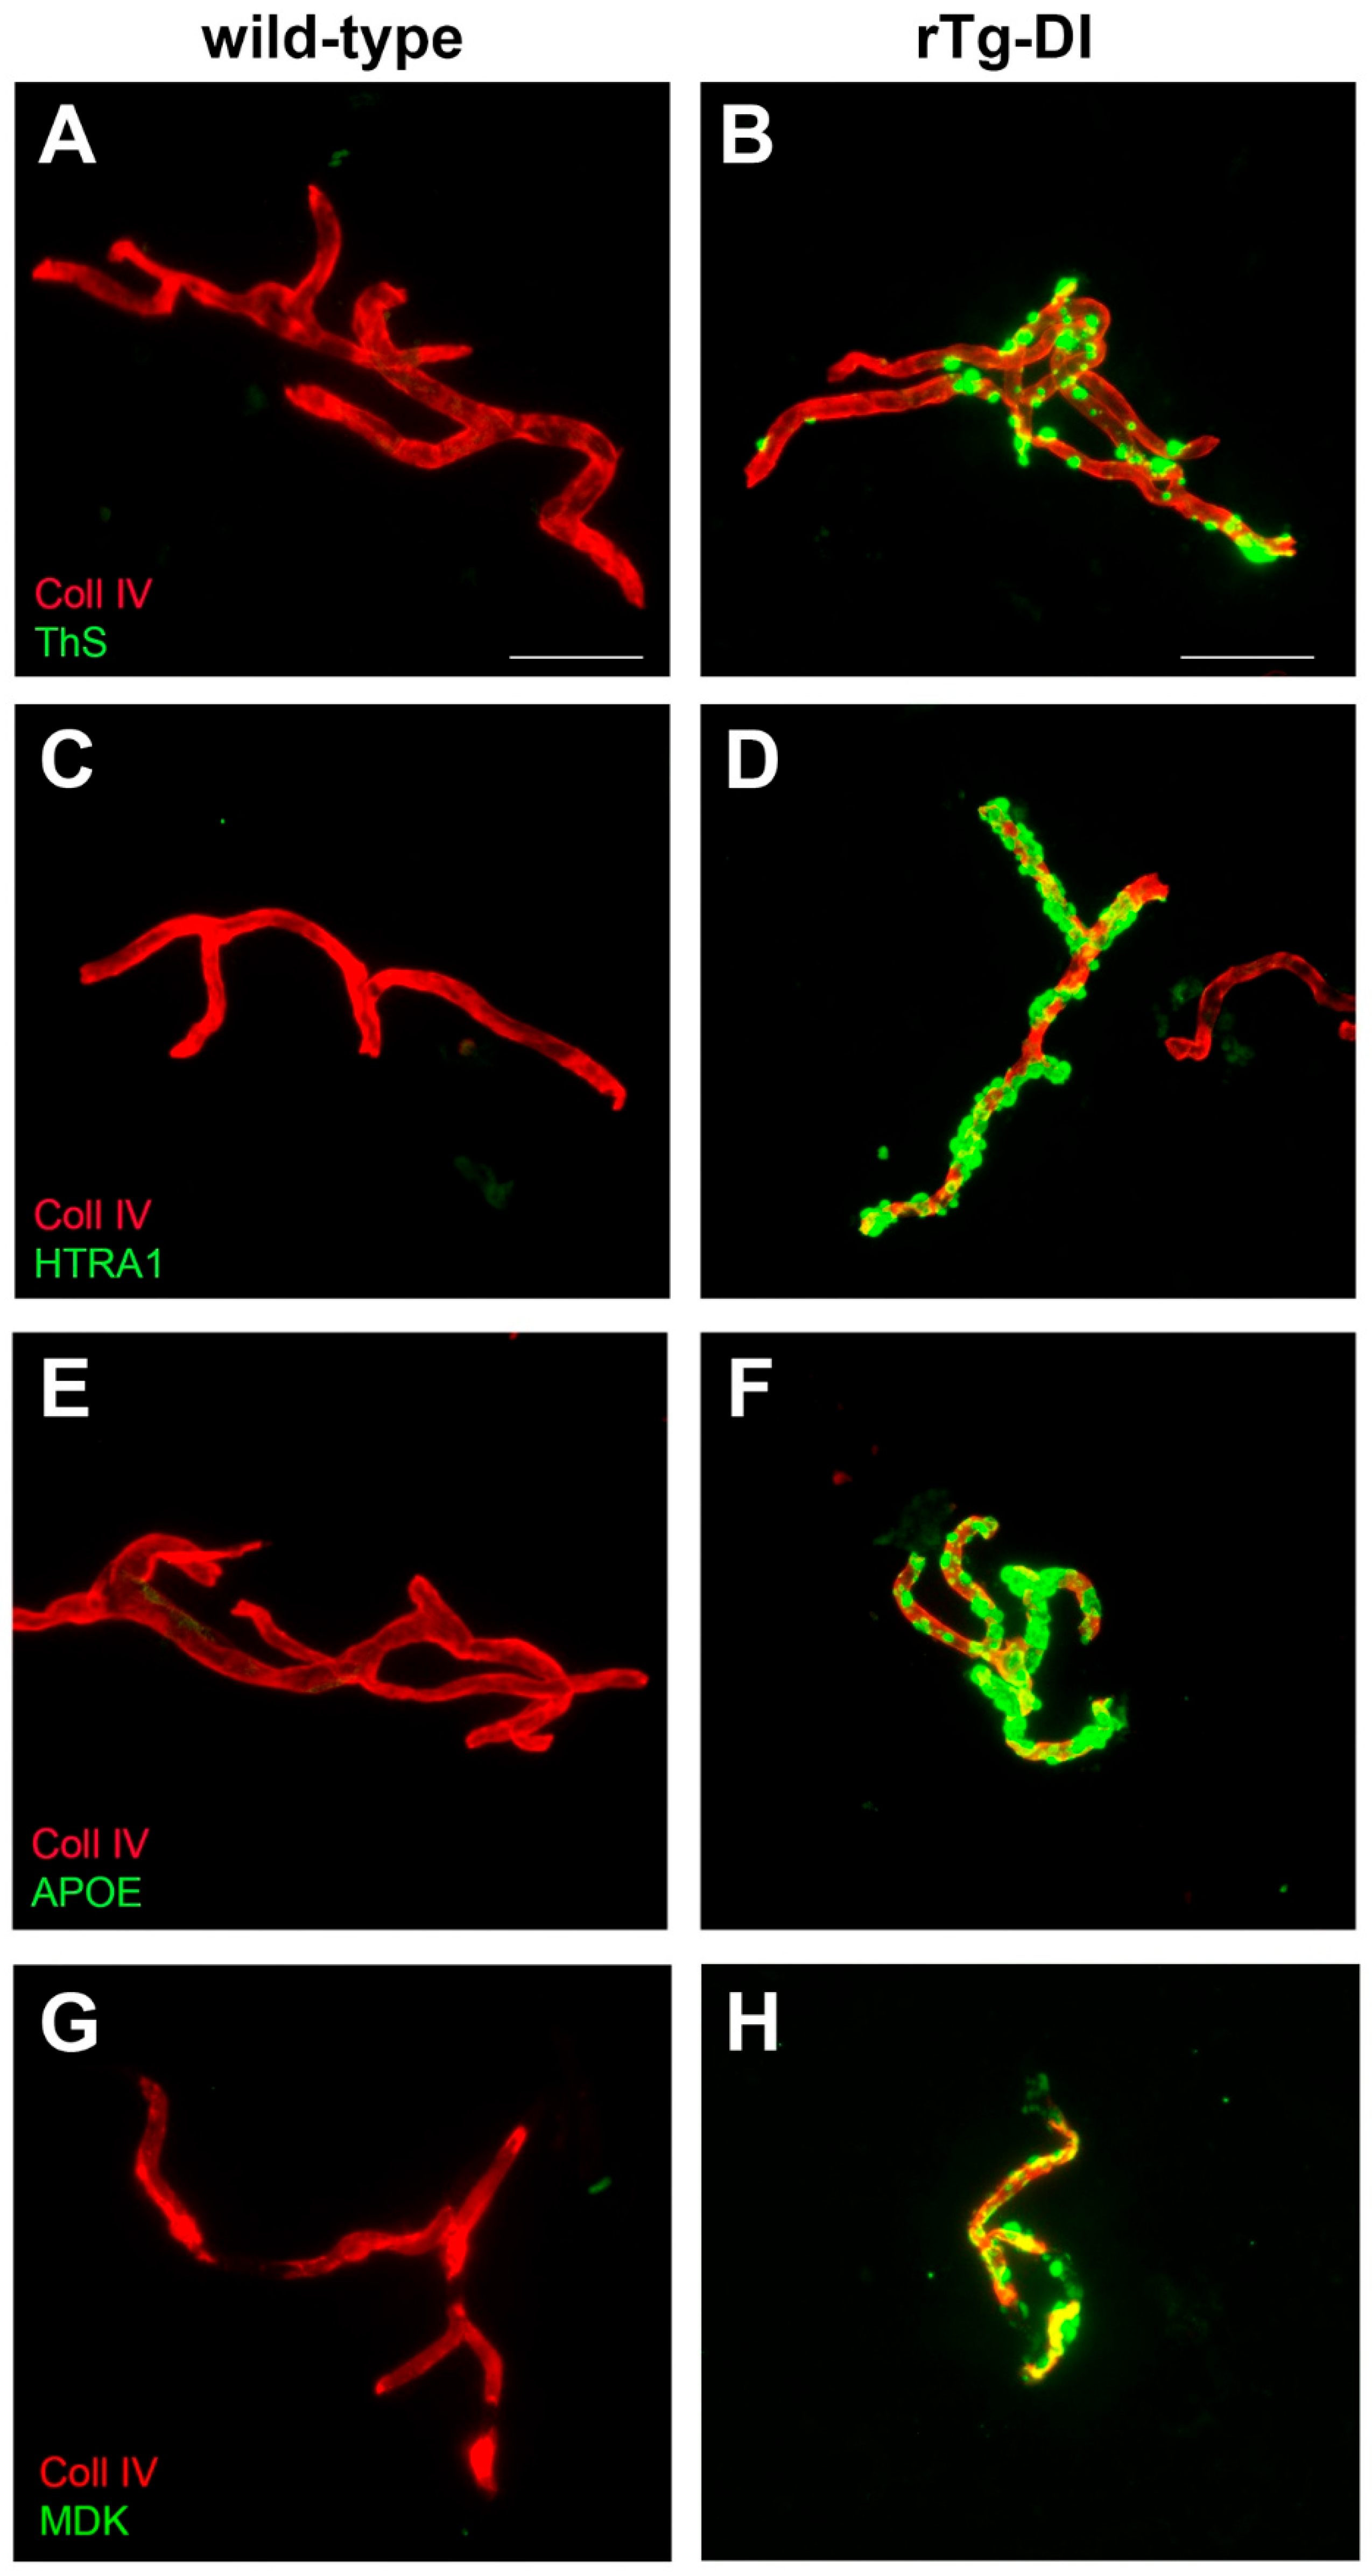
To provide validation of the proteomic results, we performed immunolabeling for select markers from the identified DEP lists, including HTRA1 (Figure 4C,D), APOE (Figure 4E,F), and MDK (Figure 4G,H). APOE, HTRA1, and MDK all displayed prominent signals in the rTg-DI isolated vessels presenting with amyloid deposition but not in WT vessels. Interestingly, the patterns of observed signal for APOE, HTRA1 and MDK bear a striking similarity to the localization of Aβ deposits (Figure 4B) as revealed by thioflavin S staining, suggesting that these markers accumulate in amyloid deposits. The observed increases in abundance of these markers in the proteomic analysis are supported by the immunolabeling results presented here.
Figure 4.
Immunolabeling for specific markers in isolated cerebral vessels from rTg-DI rats. Isolated cerebral vessels from 12 M WT and rTg-DI rats were immunolabeled with an antibody to collagen IV to identify the vessels (red) and stained with thioflavin S to detect fibrillar amyloid (green) (A,B); antibody to detect HTRA1 (green) (C,D); antibody to ApoE (green) (E,F); or antibody to detect MDK (green) (G,H) Scale bars = 50 μM.
3.5. Comparison of DEPs in 12 M rTg-DI Whole Brain and Isolated Cerebral Vessels
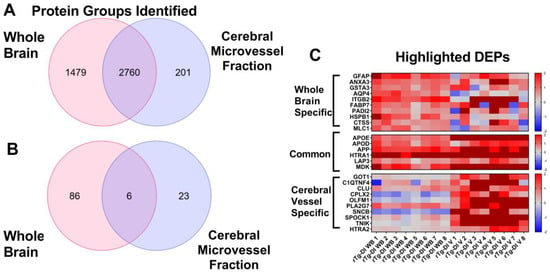
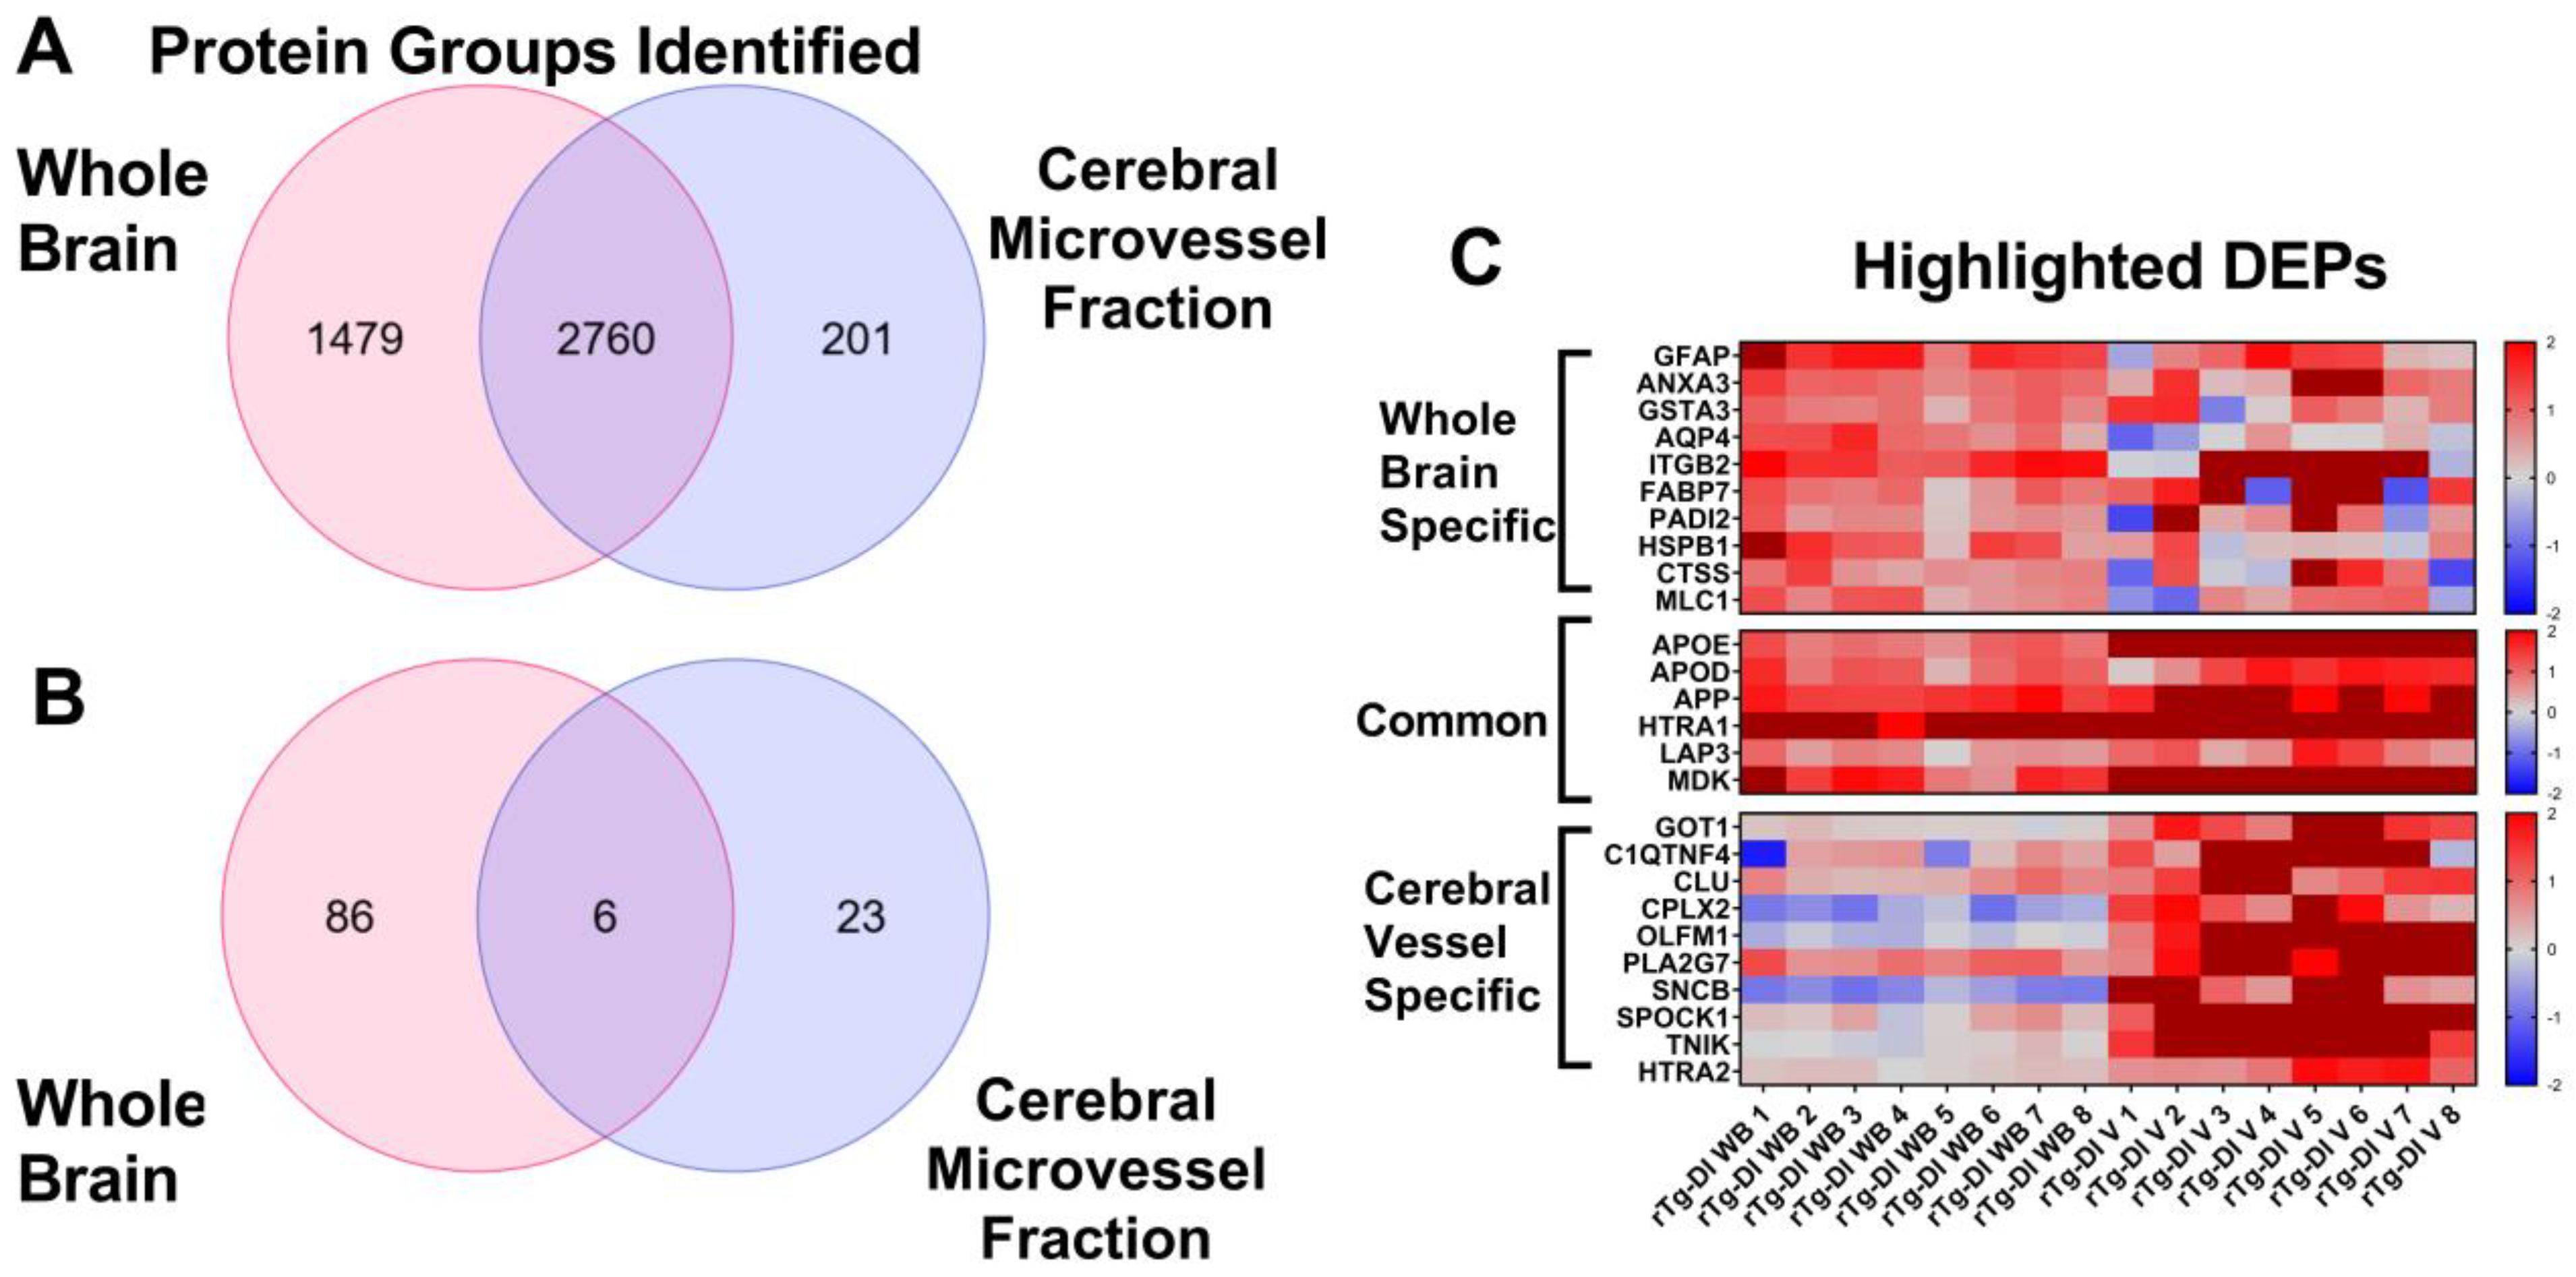
To determine protein changes specific to either cerebral microvessels enriched fractions or whole brain tissue in the rTg-DI model, and those that might be common between the two sample types, we conducted a comparison of the two proteomics analyses. While 4239 proteins were identified in the whole brain analysis, only 2961 were identified in the isolated cerebral vessels. This is unsurprising as the isolated cerebral vessels represent a more specialized tissue as compared to whole brain and therefore will likely reflect a narrower proteome. Furthermore, as described in the “Material and Methods”, the in-house spectral library was prepared from data-dependent acquisition (DDA) files from pulverized whole rat brain tissue, isolated rat brain regions, and cerebrospinal fluid (CSF) samples but not from cerebral microvessel enriched fractions. Therefore, peptides from proteins that are specific to cerebral microvessels may be underrepresented in the library, potentially limiting the protein identifications in those samples. Additionally, immunolabeling for astrocytes (GFAP) and microglia (IBA1) revealed the presence of glial cell markers, primarily for astrocytes, in cerebral microvessel enriched samples (Figure S1A,B). Indeed, comparison of the proteins identified in each sample revealed that the vast majority of those detected in the isolated cerebral vessels were found in the whole brain tissue samples, with only a small subset, 201 proteins, unique to the cerebral vessel enriched fractions (Figure 5A). Additionally, 1479 proteins were identified in the whole brain analysis that were not found in the cerebral small vessels (Figure 5A). Therefore, to ensure that our vessel enriched fractions dataset represented enrichment for vessel-associated proteins, we performed a Wilcoxon rank-sum analysis for cell-type enrichment for endothelial cells, astrocytes, microglia, oligodendrocytes, and neurons. Cell-type gene sets for these five cell types were obtained from the PanglaoDB scRNA-seq database [30]. In the Wilcoxon rank-sum enrichment test, detected proteins were ranked by abundance, and it was evaluated whether those mapping to the cell-type-specific marker sets were likely to be in the most abundant proteins. Following Benjamini–Hochberg correction, Wilcoxon rank enrichment p values were 0.007, 0.613, 0.984, 0.984, and 0.984 for endothelial cells, astrocytes, neurons, oligodendrocytes, and microglia, respectively, indicating significant enrichment of endothelial proteins but not those from other cell types (Figure S1C). On the other hand, the Wilcoxon rank enrichment p value for endothelial cells was only 0.4121 in whole brain tissue samples, while astrocytes and neurons displayed the greatest enrichment in that dataset (adjusted p value = 0.0006 each), and adjusted p values were 0.0947 and 0.9787 for oligodendrocytes and microglia, respectively. Thus, the cerebral microvessel enriched fractions displayed significant cell-type enrichment for vascular-associated proteins, while whole brain tissue displayed significant enrichment for neurons and astrocytes.
Figure 5.
Comparison of differential proteomic analyses of 12 M rTg-DI whole brain tissue and cerebral microvessel enriched samples. (A) Venn diagram comparing the unique protein groups identified in each of the rTg-DI whole brain tissue and cerebral microvessel enriched sample proteomics analyses. (B) Venn diagram showing the numbers of unique and common increased proteins (≥1.5 FC, adj. p ≤ 0.05) identified in the 12 M rTg-DI whole brain tissue and cerebral microvessel samples. (C) Heat map depicting highlighted differentially expressed proteins specific to the whole brain tissue samples, common to both sample types, or specific to the isolated cerebral vessels. Individual FC for each sample is shown (relative to the corresponding WT group mean for that protein) with red indicating increased, blue indicating decreased, grey no change, and color intensity relative to the degree of change.
Comparison of the DEPs identified in each sample type revealed six proteins commonly increased between the rTg-DI whole brain and isolated cerebral vessels (Figure 5B), including APOD, APOE, APP, HTRA1, MDK, and LAP3. Of these six proteins, we have previously reported enhancement of APOD, APOE, APP, and HTRA1 in rTg-DI rat brain regions [12,15], and this repetition of results adds confidence to the findings here. Although SPOCK-1 (adjusted p value = 0.346) PLA2G7 (adjusted p value = 0.092), and CLU (adjusted p value = 0.056) were not significantly elevated in the present analysis of whole brain tissue, we have previously reported increased expression of these proteins in specific brain regions of rTg-DI rats [12,13], adding confidence to their increases observed here in the cerebral microvessel enriched fractions. Heat maps depicting the relative logFC (individual abundance compared to WT group mean) of each of these proteins in each individual rat sample for those proteins specific to whole brain, cerebral microvessel enriched fractions, or common to both sample types are shown in Figure 5C. Notable proteins among those specific to the whole brain are ANXA3, AQP4, HSPB1, FABP7, MLC1, GSTA3, PADI2 and ITGB2, as we have previously reported increased expression of all these proteins in rTg-DI regional brain tissue [12,13,15]. Interestingly, SNCB displayed statistically significant decreases in the rTg-DI whole brain despite being elevated in the cerebral microvessel enriched fractions (Figure 5C). Thus, while there were several DEPs shared between the isolated vessels and whole brain tissue samples, unique protein changes are present as well, potentially indicating a protein signature within the vessels linked with the vascular breakdown/degeneration observed with CAA type-1 in the rTg-DI rat model. We previously reported, and validated with immunolabeling, HTRA1 and APOE increases in regional analysis of rTg-DI brains, with colocalization patterns in tissue sections largely resembling that displayed in Figure 4, and localized with cerebral vessels exhibiting amyloid deposits [12,13]. Here, we have validated MDK enhancement via immunolabeling in cerebral microvessel enriched fractions (Figure 4H). Due to shared elevation in whole brain tissue as well, we performed immunolabeling for MDK in brain tissue sections (Supplementary Materials Figure S2). Similar to what we have observed with HTRA1 and APOE, immunolabeling in brain tissue sections revealed MDK primarily colocalizing with capillaries harboring amyloid deposits (Figure S2B).
3.6. Comparative Pathway Analysis of DEPs in rTg-DI Whole Brain and Isolated Vessels
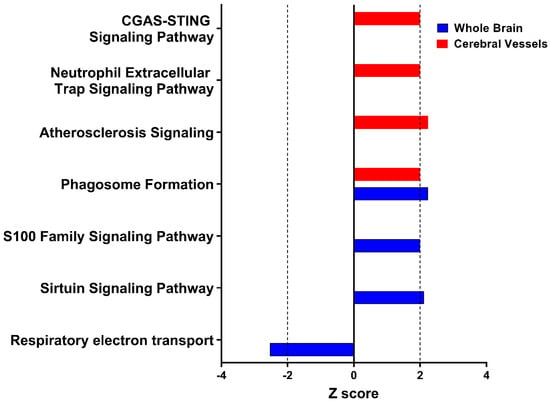
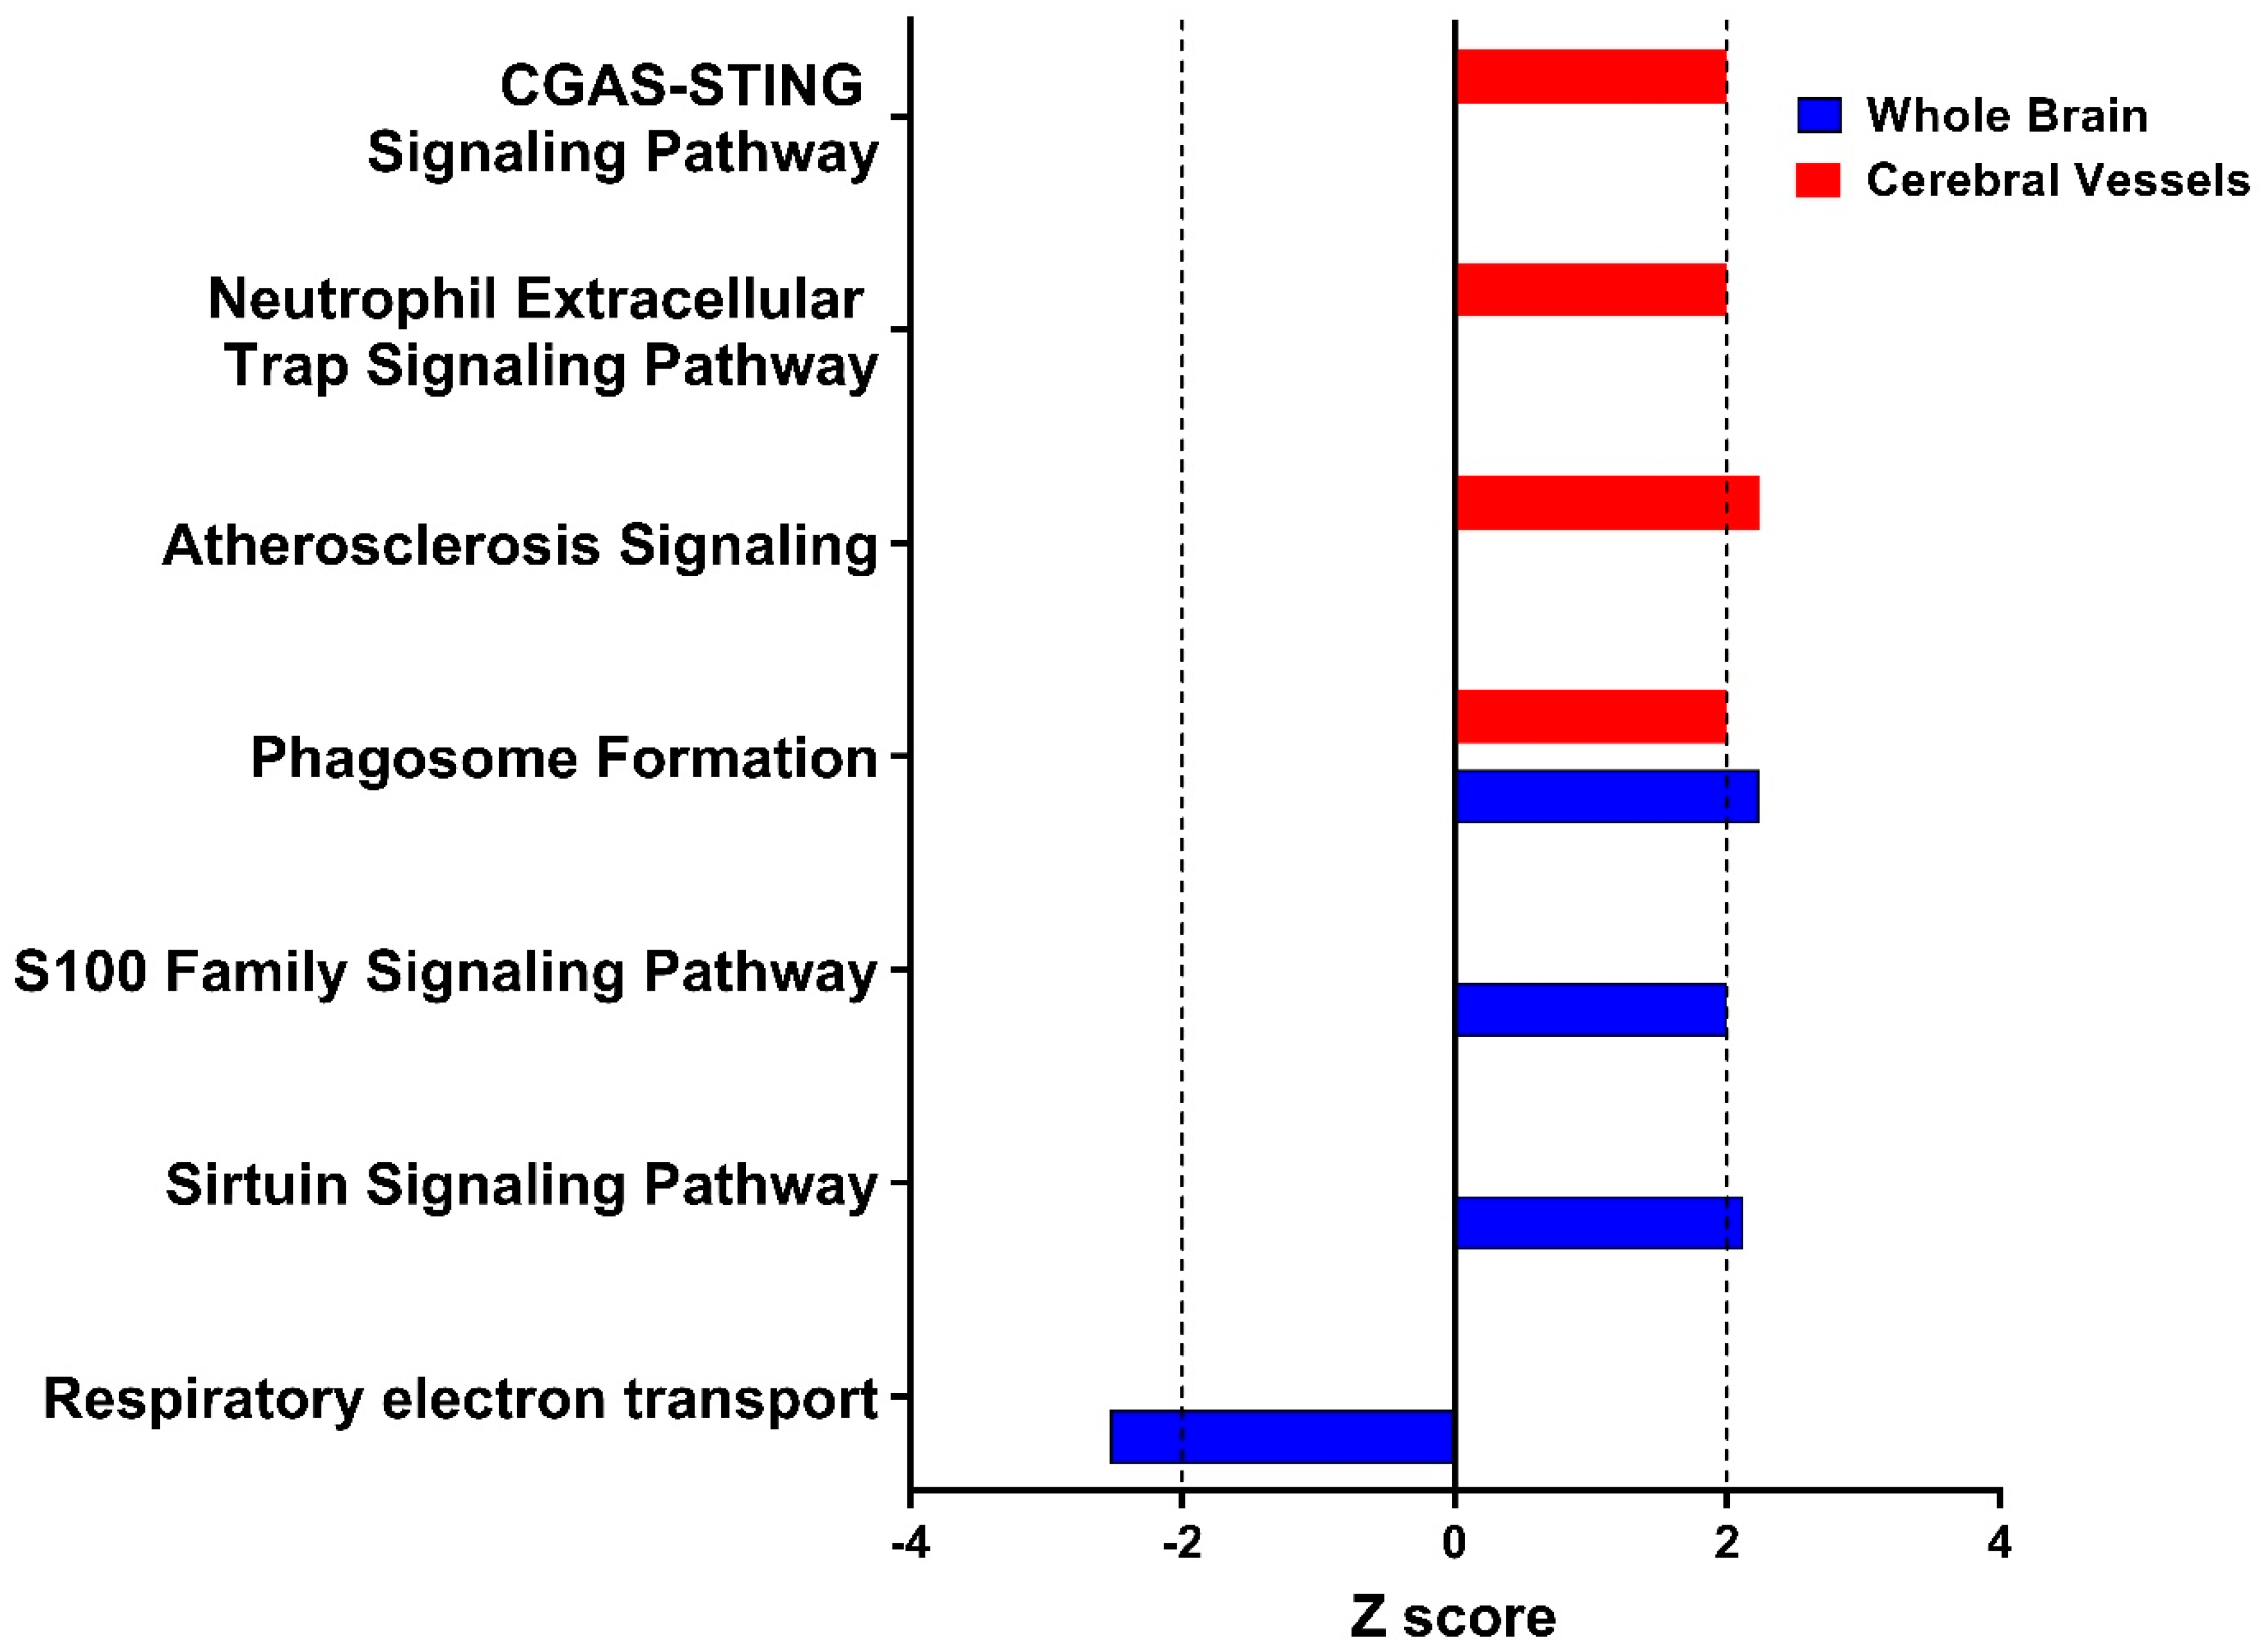
To investigate mechanistic context for the identified DEPs in both rTg-DI sample types, we conducted pathway analysis utilizing Ingenuity Pathway Analysis (IPA, Qiagen, Redwood City, CA, USA). IPA makes predictions for activation states of canonical pathways and molecular regulators using “causal” analysis based on the directional abundance changes in each target protein, providing a statistical significance expressed in z scores, in a process well described by Krämer et al. [31]. Due to the low number (29 increased, 0 decreased) of DEPs in the cerebral microvessel enriched fractions, for IPA we defined differential expression significance using a cutoff of p ≤ 0.1 rather than 0.05. Tables including IPA input data for both the whole brain and cerebral microvessel enriched fractions are included in Supplementary Materials Tables S6 and S7, respectively. Employing a significance cutoff of z ≥ 2, IPA identified several pathways in each rTg-DI sample type predicted to be activated. Tables including statistically significant pathway predictions for whole brain tissue and cerebral microvessel enriched fractions can be found in Supplementary Materials Tables S8 and S9, respectively. Figure 6 depicts predictive z scores for a number of these pathways, unique to both the rTg-DI whole brain and cerebral microvessel fractions. Interestingly, Atherosclerosis, CGAS-STING Signaling, and Neutrophil Extracellular Trap pathways were all predicted as activated in the rTg-DI cerebral microvessel fractions. Each of these pathways is implicated in immune cell mediated vascular remodeling, vascular degeneration/leakage, and vessel occlusion formation [32,33,34,35]. Both sample types resulted in predicted activation of phagosome formation, with whole brain analysis revealing other inflammatory/immune-response-associated pathways such as sirtuin signaling and S100 family signaling pathways. Meanwhile, predicted inhibition of respiratory electron transport could be indicative of mitochondrial dysfunction in the rTg-DI rat brain. While providing potentially interesting context to the numerous observed protein expression changes in the rTg-DI rat brains, it is important to note that the pathway predictions here are proposed for hypothesis generation. Elucidating the contributions of these pathways to CAA pathological progression requires further investigation.
Figure 6.
Summary of comparative ingenuity pathway analysis for rTg-DI whole brain tissue and isolated cerebral vessels. Plotted z scores for pathways predicted as activated in the 12 M rTg-DI whole brain (blue) and isolated cerebral vessels (red). Dashed line represents the z score cutoff for significance (z = 2, −2), with z scores exceeding this indicating activation/inhibition.
4. Discussion
Despite the significant public health burden and prevalence of CAA, both as a sporadic disease and as a prominent AD comorbidity, the molecular mechanisms linking the progressive deposition of Aβ in the walls of cerebral vessels to the development of severe vasculopathies are not well understood. The present study sought to provide a protein signature of CAA-induced cerebral vessel changes by conducting comparative discovery proteomic analysis of cerebral microvessel enriched fractions and whole brain tissue from the rTg-DI rats, a model of capillary CAA. This is the first study to investigate proteomic changes in cerebral microvessel enriched fractions from the rTg-DI rats and the first to compare protein changes between cerebral microvessel enriched fractions and whole brain tissue in this preclinical model of CAA. We hypothesized that this comparative analysis would reveal uniquely altered proteins in the cerebral microvessel enriched fractions, identifying a potential protein signature of CAA-related vascular damage, with commonly altered proteins indicating more broadly observed pathological responses, such as neuroinflammation or potentially those directly linked to vascular amyloid deposition.
The rTg-DI rat is advantageously positioned to deliver useful molecular insight in this study design. Firstly, compared with other experimental rodent models of CAA, the rTg-DI rat faithfully recapitulates the severe vasculopathies observed in human cases of disease, including thrombotic occlusions and microhemorrhages [10,12], and therefore harbors molecular changes relevant to these pathologies. Secondly, unlike human CAA cases, which exist on a variety of genetic, environmental, lifestyle and medical backgrounds, all of which are potentially confounding variables, the rTg-DI model populations are maintained on a consistent genetic and environmental background, limiting these potential caveats. Additionally, the uniform nature of the observed cerebral vascular Aβ deposition in rTg-DI rats (Figure 1) ensures isolation of microvessels with CAA, a challenging hurdle in human patient brain samples where CAA is less uniform and affected vessels must be isolated via laser microdissection [36,37]. Thus, while avoiding the potential confounders of variable backgrounds observed in human cases and providing a more practical platform for delivering uniform results in these molecular approaches, the rTg-DI rat model is well suited for mechanistic investigation into impacts of CAA on specific vasculopathy progression.
While delivering important molecular insight, this study is not without caveats. Firstly, while a credible model of capillary CAA type-1, including recapitulation of severe vasculopathies, the rTg-DI rat model may harbor critical species differences compared to human CAA patients that may limit the clinical translatability of the present results. While the previously mentioned overlap between our study and several studies conducted in human patient samples lends confidence to the translatability of the data described here, the proteomic findings presented here should be validated in human patient brain tissue and cerebral vessel samples to confirm clinical relevance. Secondly, while the pathway analysis presented here is intriguing, IPA is predictive and hypothesis generating, with many of the differentially expressed proteins mapping to multiple pathways. Therefore, determining the individual contributions of these proteins to specific signaling pathways will require subsequent validation, with the exact roles of these pathways in CAA pathology progression needing further investigation. Another limitation is the potential cellular heterogeneity of the microvascular enriched fractions, a known challenge when working with this sample type [38,39]. Technical variations in microvessel isolation often result in varying amounts of parenchymal tissue debris, glial cells, oligodendrocytes, and neurons in the final enriched fraction, potentially contributing to the higher global critical values (CVs) observed in this sample type and skewing proteomics results. However, the Wilcoxon rank-sum enrichment analysis we performed (Figure S1) reveals significant enrichment in endothelial markers in the most abundant proteins, while revealing no significant enrichment for astrocyte, microglia, oligodendrocyte, or neuronal marker proteins. Immunolabeling for the astrocyte marker GFAP did reveal some presence in the microvessel enriched fractions (Figure S1), presumably because of the tight interaction of astrocytic end feet with cerebral microvessel surfaces, as others have observed [40]. While the rank enrichment analysis showed the second highest score for astrocyte enrichment in our proteomics data, this fell well below the level of statistical significance, adding confidence in the quality of our microvessel enrichment. Astrocyte contamination could potentially impact proteome changes, with DEPs arising from astrocytic responses and not specific endothelial/vascular changes. However, neither GFAP nor AQP4, two prominent astrocytic proteins that were significantly enhanced in rTg-DI whole brain tissue, displayed significant increased abundance in the cerebral microvessel enriched fractions; an indication that astrocytic contamination was limited in the cerebral microvessel fractions. A final limitation is that, while both male and female rats were included in the cohorts, their representation was not equal and the study was not sufficiently powered to highlight sex-specific changes in our proteomics results. While PCA plots show no obvious clustering according to sex (Figure 2 and Figure 3) and covariant analysis revealed no significant sex-specific changes in our dataset, conclusively answering this question will require further investigation with larger animal cohorts of balanced sex representation.
Supporting the clinical translatability and relevance of the model was the observation that several of the altered proteins in the rTg-DI cerebral microvessel enriched fractions overlapped with those identified in human CAA patient sample proteomics studies [36,37,41], including APOE, Glypican-1 (GPC1), CLU, and HTRA1. These overlapping proteins lend credibility to the model and instill confidence in the translatability of the results. Comparative analysis did reveal overlap of six increased proteins between the whole brain and isolated vessels, many of which we have previously reported in both brain regional and longitudinal analyses of the rTg-DI rat model [12,13,15]. Furthermore, many of the DEPs observed in the rTg-DI whole brain tissue here confirm our previously reported protein changes in rTg-DI rat brains and CSF [12,13,15,16,42]. Though falling just outside our threshold cutoffs in this study (FC 1.45, adjusted p value = 0.011) cystatin-C (CST3) appears to be significantly increased in the rTg-DI whole brain, along with cathepsins CTSS, CTSD, and CTSZ. We have previously reported significant increases of these proteins in rTg-DI brain regions and CSF [12,13,42]. On the other hand, differential expression for PLA2G7 (1.84 FC, adjusted p value = 0.092) and CLU (FC 1.47, adjusted p value = 0.056) in rTg-DI whole brain tissue fell just outside threshold cutoffs despite our previous findings of significant increases for these proteins in isolated brain regions [12,13]. It is possible that their differential expression is driven by localized severe pathology and their effect sizes are diluted upon analysis of whole brain tissue. Still, their repeated differential expression here in cerebral microvessel enriched fractions, and that approaching significance in the whole brain tissue, bolsters confidence in these findings. The reproducible differential expression across numerous studies, utilizing unique instrumentation, in various sample types and regions from rTg-DI brains and in biofluid samples instills confidence in their potential use as protein biomarkers for CAA. Notably, we have now reported repeated increased abundance of ANXA3, APOD, APOE, CLU, CST3, CTSS, CTSD, CTSZ, GFAP, GSTA3, HTRA1, and ITGB2 across several proteomic studies [12,13,15,16,20], identifying a reproducible protein signature of CAA in the rTg-DI rat brains. While validation for some of them exists in biofluid samples, the potential as translatable clinical biomarkers needs to be further studied in biofluid samples and in human patient samples presenting with CAA type-1. Additionally, their potential as therapeutic targets should also be considered. However, their exact role in CAA pathology remains to be fully understood and requires further investigation.
Common increases in MDK between rTg-DI cerebral vessel enriched fractions and whole brain tissues are also of particular interest. MDK has recently been implicated in AD, with reported increases in MDK levels in AD patient plaques and serum [43]. Colocalization of MDK with vascular amyloid in both rTg-DI cerebral microvessel enriched fractions and brain tissue sections is consistent with MDK’s reported increase in AD plaques. MDK is reported to both inhibit Aβ fibril formation and cytotoxicity [44]. While these properties of MDK may play a protective role in amyloidogenic dementias, MDK is also reported to enhance leukocyte recruitment and migration, and potentiate secondary injury following traumatic brain injury in mice [45], and thus could contribute to chronic inflammatory responses in CAA.
As is summarized in Supplementary Materials Table S10, we propose a list of focused marker candidates for further investigation, based on several factors such as repeated differential expression in other rTg-DI brain tissue, validation of differential expression in rTg-DI biofluids, and validation with immunohistochemistry. Proteins marked with an asterisk have additionally been validated in human CAA samples. As differential expression of these proteins has been repeated in multiple studies, in various brain regions and tissue sample types in the rTg-DI rat model of CAA, along with immunolabeling validation for several of them, biofluid confirmation for a handful, and APOE, CLU, and HTRA1 all identified as increased in human CAA, these proteins harbor potential as markers for CAA detections and should be investigated further.
Future Directions
The results presented here identify several proteins of interest that may harbor potential as therapeutic targets or clinical biomarkers for capillary CAA type-1, however, understanding their exact clinical usefulness or translatability requires further investigation. Firstly, to further assess their usefulness as clinical biomarkers for CAA, DEPs identified here should be investigated for similar altered expression in biofluid samples, such as CSF or plasma, to ensure their reliability and practicality of clinical sampling. A panel or marker set of DEPs with consistent differential abundance across brain tissue, microvessel fractions, and biofluid samples should then be investigated in human CAA patient brain and biofluid samples for clinical translatability. A selected CAA marker set that remains through these validation steps should then be subjected to targeted parallel reaction monitoring (PRM) MS for quantitative analysis in blinded CAA model rat and human CAA patient cohorts for evaluation/validation as a diagnostic tool. Additionally, understanding the biological significance of the contradictory expression pattern of SNCB (increased in cerebral microvessel enriched fractions and decreased in whole brain tissue) will require further investigation that should include colocalization with immunolabeling in both vessel enriched fractions and tissue sections.
Supplementary Materials
The following supporting information can be downloaded at: https://www.mdpi.com/article/10.3390/targets4020020/s1. Table S1. Spectronaut® Configurations for Library Generation; Table S2. Metadata for Whole Brain Tissue Sample Proteomics; Table S3. Metadata for Cerebral Microvessel Enriched Fraction Sample Proteomics; Table S4. Differentially Expressed Proteins in the rTg-DI Whole Brain; Table S5. Differentially Expressed Proteins in the rTg-DI Cerebral Microvessels Enriched Fractions; Table S6. Input Data for IPA Analysis of rTg-DI Whole Brain Tissue; Table S7. Input Data for IPA Analysis of rTg-DI Cerebral Microvessel Enriched Fractions; Table S8. Statistically Significant Pathway Predictions in rTg-DI Whole Brain Tissue; Table S9. Statistically Significant Pathway Predictions in rTg-DI Cerebral Microvessel Enriched Fractions; Table S10. Prioritized rTg-DI Protein Candidate List; Figure S1. Cerebral Microvessel Enriched Fraction Validation. Cerebral microvessel enriched fractions (A,B) from 12 M WT rat brains were immunolabeled with rabbit polyclonal antibody to collagen IV for the detection of microvessel (red) and rabbity polyclonal antibody to detect GFAP (Z0334, Dako) (A, green) or rabbit polyclonal antibody (019-19741, Wako) to detect IBA1 (B, green) for labeling of astrocytes and microglia, respectively. Scale bar = 50 µm. Wilcoxon rank enrichment analysis for cell type protein enrichment in rTg-DI cerebral microvessel enriched fractions (C) and whole brain tissue samples (D). Figure S2. Immunolabeling for MDK in rTg-DI brain tissue sections. Thalamic brain sections from 12 M WT (top) and rTg-DI (bottom) rats were immunolabeled with rabbit polyclonal antibody to collagen IV for the detection of microvessel (red) and antibody to detect MDK (green). Pronounced MDK signal localized to cerebral microvessel was observed in rTg-DI thalamic sections while remaining largely absent in WT rat brains. Scale bars = 50 µm.
Author Contributions
J.M.S., K.J.A., F.X., J.D. and D.H. performed the experiments and analyzed the data. J.M.S. and W.E.V.N. designed and coordinated the research. J.M.S. and W.E.V.N. wrote and edited the paper. All authors have read and agreed to the published version of the manuscript.
Funding
This study was funded by research grant R03 AG085082 from the National Institute of Aging (J.M.S.) and R21 NS130390 from the National Institute of Neurological Diseases and Stroke (W.E.V.N.).
Institutional Review Board Statement
The study was conducted in accordance with the Declaration of Helsinki and the protocol was approved by the University of Rhode Island IACUC Committee (Project # AN1718-08) on 23 November 2023.
Informed Consent Statement
Not applicable.
Data Availability Statement
The datasets used and/or analyzed during the current study are available from the corresponding author on reasonable request. Raw mass spectrometry data can be found in the MassIVE repository (massive.ucsd.edu/ProteoSAFe/static/massive.jsp), project ID#: MSV000101957 and password: rTgDIMVWB2026.
Acknowledgments
Research reported in this publication was supported in part by the Institutional Development Award (IDeA) Network for Biomedical Research Excellence from the National Institute of General Medical Sciences of the National Institutes of Health under grant number P20GM103430. Additionally, the authors would like to thank Chang Liu for his assistance with the protein mass spectrometry analysis. Authors acknowledge the use of OpenAI (GPT-5.5) to assist in the development of “R” scripts for statistical analysis.
Conflicts of Interest
The authors declare no conflicts of interests.
References
- Attems, J.; Jellinger, K.; Thal, D.R.; Van Nostrand, W. Review: Sporadic Cerebral Amyloid Angiopathy. Neuropathol. Appl. Neurobiol. 2011, 37, 75–93. [Google Scholar] [CrossRef] [Scilit] [PubMed]
- Arvanitakis, Z.; Leurgans, S.E.; Wang, Z.; Wilson, R.S.; Bennett, D.A.; Schneider, J.A. Cerebral Amyloid Angiopathy Pathology and Cognitive Domains in Older Persons. Ann. Neurol. 2011, 69, 320–327. [Google Scholar] [CrossRef] [Scilit] [PubMed]
- Jäkel, L.; De Kort, A.M.; Klijn, C.J.M.; Schreuder, F.H.B.M.; Verbeek, M.M. Prevalence of Cerebral Amyloid Angiopathy: A Systematic Review and Meta-Analysis. Alzheimer’s Dement. 2022, 18, 10–28. [Google Scholar] [CrossRef] [Scilit]
- Phuah, C.-L.; Chen, Y.; Strain, J.F.; Yechoor, N.; Laurido-Soto, O.J.; Ances, B.M.; Lee, J.-M. Association of Data-Driven White Matter Hyperintensity Spatial Signatures with Distinct Cerebral Small Vessel Disease Etiologies. Neurology 2022, 99, e2535–e2547. [Google Scholar] [CrossRef] [Scilit] [PubMed]
- Chen, T.-B.; Lee, W.-J.; Chen, J.-P.; Chang, S.-Y.; Lin, C.-F.; Chen, H.-C. Imaging Markers of Cerebral Amyloid Angiopathy and Hypertensive Arteriopathy Differentiate Alzheimer Disease Subtypes Synergistically. Alzheimer’s Res. Ther. 2022, 14, 141. [Google Scholar] [CrossRef] [Scilit] [PubMed]
- Thal, D.R.; Ghebremedhin, E.; Rüb, U.; Yamaguchi, H.; Del Tredici, K.; Braak, H. Two Types of Sporadic Cerebral Amyloid Angiopathy. J. Neuropathol. Exp. Neurol. 2002, 61, 282–293. [Google Scholar] [CrossRef] [Scilit] [PubMed]
- Richard, E.; Carrano, A.; Hoozemans, J.J.; van Horssen, J.; van Haastert, E.S.; Eurelings, L.S.; de Vries, H.E.; Thal, D.R.; Eikelenboom, P.; van Gool, W.A.; et al. Characteristics of Dyshoric Capillary Cerebral Amyloid Angiopathy. J. Neuropathol. Exp. Neurol. 2010, 69, 1158–1167. [Google Scholar] [CrossRef] [Scilit] [PubMed]
- Eikelenboom, P.; Veerhuis, R.; Familian, A.; Hoozemans, J.J.M.; van Gool, W.A.; Rozemuller, A.J.M. Neuroinflammation in Plaque and Vascular Beta-Amyloid Disorders: Clinical and Therapeutic Implications. Neurodegener. Dis. 2008, 5, 190–193. [Google Scholar] [CrossRef] [Scilit] [PubMed]
- Thal, D.R.; Ghebremedhin, E.; Orantes, M.; Wiestler, O.D. Vascular Pathology in Alzheimer Disease: Correlation of Cerebral Amyloid Angiopathy and Arteriosclerosis/Lipohyalinosis with Cognitive Decline. J. Neuropathol. Exp. Neurol. 2003, 62, 1287–1301. [Google Scholar] [CrossRef] [Scilit] [PubMed]
- Davis, J.; Xu, F.; Hatfield, J.; Lee, H.; Hoos, M.D.; Popescu, D.; Crooks, E.; Kim, R.; Smith, S.O.; Robinson, J.K.; et al. A Novel Transgenic Rat Model of Robust Cerebral Microvascular Amyloid with Prominent Vasculopathy. Am. J. Pathol. 2018, 188, 2877–2889. [Google Scholar] [CrossRef] [Scilit] [PubMed]
- Lee, H.; Xu, F.; Liu, X.; Koundal, S.; Zhu, X.; Davis, J.; Yanez, D.; Schrader, J.; Stanisavljevic, A.; Rothman, D.L.; et al. Diffuse White Matter Loss in a Transgenic Rat Model of Cerebral Amyloid Angiopathy. J. Cereb. Blood Flow Metab. 2021, 41, 1103–1118. [Google Scholar] [CrossRef] [Scilit]
- Schrader, J.M.; Xu, F.; Van Nostrand, W.E. Distinct Brain Regional Proteome Changes in the rTg-DI Rat Model of Cerebral Amyloid Angiopathy. J. Neurochem. 2021, 159, 273–291. [Google Scholar] [CrossRef] [Scilit] [PubMed]
- Schrader, J.M.; Xu, F.; Agostinucci, K.J.; DaSilva, N.A.; Van Nostrand, W.E. Longitudinal Markers of Cerebral Amyloid Angiopathy and Related Inflammation in rTg-DI Rats. Sci. Rep. 2024, 14, 8441. [Google Scholar] [CrossRef] [Scilit] [PubMed]
- Popescu, D.L.; Van Nostrand, W.E.; Robinson, J.K. Longitudinal Cognitive Decline in a Novel Rodent Model of Cerebral Amyloid Angiopathy Type-1. Int. J. Mol. Sci. 2020, 21, 2348. [Google Scholar] [CrossRef] [Scilit] [PubMed]
- Schrader, J.M.; Xu, F.; Lee, H.; Barlock, B.; Benveniste, H.; Van Nostrand, W.E. Emergent White Matter Degeneration in the rTg-DI Rat Model of Cerebral Amyloid Angiopathy Exhibits Unique Proteomic Changes. Am. J. Pathol. 2022, 192, 426–440. [Google Scholar] [CrossRef] [Scilit] [PubMed]
- Schrader, J.M.; Stanisavljevic, A.; Xu, F.; Van Nostrand, W.E. Distinct Brain Proteomic Signatures in Cerebral Small Vessel Disease Rat Models of Hypertension and Cerebral Amyloid Angiopathy. J. Neuropathol. Exp. Neurol. 2022, 87, 731–745. [Google Scholar] [CrossRef] [Scilit] [PubMed]
- Kilkenny, C.; Browne, W.J.; Cuthill, I.C.; Emerson, M.; Altman, D.G. Improving Bioscience Research Reporting: The ARRIVE Guidelines for Reporting Animal Research. PLoS Biol. 2010, 8, e1000412. [Google Scholar] [CrossRef] [Scilit] [PubMed]
- Davis, J.; Xu, F.; Deane, R.; Romanov, G.; Previti, M.L.; Zeigler, K.; Zlokovic, B.V.; Van Nostrand, W.E. Early-Onset and Robust Cerebral Microvascular Accumulation of Amyloid β-Protein in Transgenic Mice Expressing Low Levels of a Vasculotropic Dutch/Iowa Mutant Form of Amyloid β-Protein Precursor. J. Biol. Chem. 2004, 279, 20296–20306. [Google Scholar] [CrossRef] [Scilit] [PubMed]
- Zlokovic, B.V.; Mackic, J.B.; Wang, L.; McComb, J.G.; McDonough, A. Differential Expression of Na,K-ATPase Alpha and Beta Subunit Isoforms at the Blood-Brain Barrier and the Choroid Plexus. J. Biol. Chem. 1993, 268, 8019–8025. [Google Scholar] [CrossRef] [Scilit]
- Stanisavljevic, A.; Schrader, J.M.; Zhu, X.; Mattar, J.M.; Hanks, A.; Xu, F.; Majchrzak, M.; Robinson, J.K.; Van Nostrand, W.E. Impact of Non-Pharmacological Chronic Hypertension on a Transgenic Rat Model of Cerebral Amyloid Angiopathy. Front. Neurosci. 2022, 16, 811371. [Google Scholar] [CrossRef] [Scilit] [PubMed]
- Schrader, J.M.; Majchrzak, M.; Xu, F.; Lee, H.; Agostinucci, K.; Davis, J.; Benveniste, H.; Van Nostrand, W.E. Cerebral Proteomic Changes in the rTg-D Rat Model of Cerebral Amyloid Angiopathy Type-2 with Cortical Microhemorrhages and Cognitive Impairments. Neurosci. Insights 2024, 19, 26331055241288172. [Google Scholar] [CrossRef] [Scilit] [PubMed]
- Schrader, J.M.; Xu, F.; Zhu, X.; Majchrzak, M.; Davis, J.; Van Nostrand, W.E. Parenchymal and Dyshoric Fibrillar Amyloid Pathology in the rTg-D Rat Model of Cerebral Amyloid Angiopathy Type-2. Am. J. Pathol. 2025, 195, 2213–2232. [Google Scholar] [CrossRef] [Scilit] [PubMed]
- Bruderer, R.; Bernhardt, O.M.; Gandhi, T.; Reiter, L. High-precision iRT Prediction in the Targeted Analysis of Data-independent Acquisition and Its Impact on Identification and Quantitation. Proteomics 2016, 16, 2246–2256. [Google Scholar] [CrossRef] [Scilit] [PubMed]
- Hediyeh-Zadeh, S.; Webb, A.I.; Davis, M.J. MsImpute: Estimation of Missing Peptide Intensity Data in Label-Free Quantitative Mass Spectrometry. Mol. Cell. Proteom. 2023, 22, 100558. [Google Scholar] [CrossRef] [Scilit] [PubMed]
- O’Brien, J.J.; Gunawardena, H.P.; Paulo, J.A.; Chen, X.; Ibrahim, J.G.; Gygi, S.P.; Qaqish, B.F. The Effects of Nonignorable Missing Data on Label-Free Mass Spectrometry Proteomics Experiments. Ann. Appl. Stat. 2018, 12, 2075–2095. [Google Scholar] [CrossRef] [Scilit] [PubMed]
- Gardner, M.L.; Freitas, M.A. Multiple Imputation Approaches Applied to the Missing Value Problem in Bottom-Up Proteomics. Int. J. Mol. Sci. 2021, 22, 9650. [Google Scholar] [CrossRef] [Scilit] [PubMed]
- Lazar, C.; Gatto, L.; Ferro, M.; Bruley, C.; Burger, T. Accounting for the Multiple Natures of Missing Values in Label-Free Quantitative Proteomics Data Sets to Compare Imputation Strategies. J. Proteome Res. 2016, 15, 1116–1125. [Google Scholar] [CrossRef] [Scilit] [PubMed]
- Stekhoven, D.J.; Bühlmann, P. MissForest--Non-Parametric Missing Value Imputation for Mixed-Type Data. Bioinformatics 2012, 28, 112–118. [Google Scholar] [CrossRef] [Scilit] [PubMed]
- Jin, L.; Bi, Y.; Hu, C.; Qu, J.; Shen, S.; Wang, X.; Tian, Y. A Comparative Study of Evaluating Missing Value Imputation Methods in Label-Free Proteomics. Sci. Rep. 2021, 11, 1760. [Google Scholar] [CrossRef] [Scilit] [PubMed]
- Franzén, O.; Gan, L.-M.; Björkegren, J.L.M. PanglaoDB: A Web Server for Exploration of Mouse and Human Single-Cell RNA Sequencing Data. Database 2019, 2019, baz046. [Google Scholar] [CrossRef] [Scilit] [PubMed]
- Krämer, A.; Green, J.; Pollard, J.; Tugendreich, S. Causal Analysis Approaches in Ingenuity Pathway Analysis. Bioinformatics 2014, 30, 523–530. [Google Scholar] [CrossRef] [Scilit] [PubMed]
- Zhang, X.; Cheng, L.; Ma, X.; Ma, K.; Xie, J.; Gui, W.; Chen, J.; Liu, K.; Ma, R. Research Progress on the Mechanisms of cGAS-STING Signaling in Immune Cell Infiltration Associated with Vascular Remodeling. J. Transl. Med. 2025, 24, 112. [Google Scholar] [CrossRef] [Scilit] [PubMed]
- Martinod, K.; Wagner, D.D. Thrombosis: Tangled up in NETs. Blood 2014, 123, 2768–2776. [Google Scholar] [CrossRef] [Scilit] [PubMed]
- Zhou, J.; Guo, P.; Hao, X.; Sun, X.; Feng, H.; Chen, Z. Neutrophil Extracellular Traps (NETs): A New Therapeutic Target for Neuroinflammation and Microthrombosis After Subarachnoid Hemorrhage? Transl. Stroke Res. 2022, 14, 443–445. [Google Scholar] [CrossRef] [Scilit] [PubMed]
- He, C.; Kim, H.I.; Park, J.; Guo, J.; Huang, W. The Role of Immune Cells in Different Stages of Atherosclerosis. Int. J. Med. Sci. 2024, 21, 1129–1143. [Google Scholar] [CrossRef] [Scilit] [PubMed]
- Hondius, D.C.; Eigenhuis, K.N.; Morrema, T.H.J.; van der Schors, R.C.; van Nierop, P.; Bugiani, M.; Li, K.W.; Hoozemans, J.J.M.; Smit, A.B.; Rozemuller, A.J.M. Proteomics Analysis Identifies New Markers Associated with Capillary Cerebral Amyloid Angiopathy in Alzheimer’s Disease. Acta Neuropathol. Commun. 2018, 6, 46. [Google Scholar] [CrossRef] [Scilit] [PubMed]
- Manousopoulou, A.; Gatherer, M.; Smith, C.; Nicoll, J.A.R.; Woelk, C.H.; Johnson, M.; Kalaria, R.; Attems, J.; Garbis, S.D.; Carare, R.O. Systems Proteomic Analysis Reveals That Clusterin and Tissue Inhibitor of Metalloproteinases 3 Increase in Leptomeningeal Arteries Affected by Cerebral Amyloid Angiopathy. Neuropathol. Appl. Neurobiol. 2017, 43, 492–504. [Google Scholar] [CrossRef] [Scilit] [PubMed]
- Ogata, S.; Ito, S.; Masuda, T.; Ohtsuki, S. Isolation Method of Brain Microvessels from Small Frozen Human Brain Tissue for Blood-Brain Barrier Protein Expression Analysis. Fluids Barriers CNS 2024, 21, 106. [Google Scholar] [CrossRef] [Scilit] [PubMed]
- Pardridge, W.M. The Isolated Brain Microvessel: A Versatile Experimental Model of the Blood-Brain Barrier. Front. Physiol. 2020, 11, 398. [Google Scholar] [CrossRef] [Scilit] [PubMed]
- Wakid, M.; Almeida, D.; Aouabed, Z.; Rahimian, R.; Davoli, M.A.; Yerko, V.; Leonova-Erko, E.; Richard, V.; Zahedi, R.; Borchers, C.; et al. Universal Method for the Isolation of Microvessels from Frozen Brain Tissue: A Proof-of-Concept Multiomic Investigation of the Neurovasculature. Brain Behav. Immun. Health 2023, 34, 100684. [Google Scholar] [CrossRef] [Scilit] [PubMed]
- Zellner, A.; Müller, S.A.; Lindner, B.; Beaufort, N.; Rozemuller, A.J.M.; Arzberger, T.; Gassen, N.C.; Lichtenthaler, S.F.; Kuster, B.; Haffner, C.; et al. Proteomic Profiling in Cerebral Amyloid Angiopathy Reveals an Overlap with CADASIL Highlighting Accumulation of HTRA1 and Its Substrates. Acta Neuropathol. Commun. 2022, 10, 6. [Google Scholar] [CrossRef] [Scilit] [PubMed]
- Vervuurt, M.; Schrader, J.M.; de Kort, A.M.; Kersten, I.; Wessels, H.J.C.T.; Klijn, C.J.M.; Schreuder, F.H.B.M.; Kuiperij, H.B.; Gloerich, J.; Van Nostrand, W.E.; et al. Cerebrospinal Fluid Shotgun Proteomics Identifies Distinct Proteomic Patterns in Cerebral Amyloid Angiopathy Rodent Models and Human Patients. Acta Neuropathol. Commun. 2024, 12, 6. [Google Scholar] [CrossRef] [Scilit] [PubMed]
- Salama, R.H.M.; Muramatsu, H.; Shimizu, E.; Hashimoto, K.; Ohgake, S.; Watanabe, H.; Komatsu, N.; Okamura, N.; Koike, K.; Shinoda, N.; et al. Increased Midkine Levels in Sera from Patients with Alzheimer’s Disease. Prog. Neuropsychopharmacol. Biol. Psychiatry 2005, 29, 611–616. [Google Scholar] [CrossRef] [Scilit] [PubMed]
- Yu, G.S.; Hu, J.; Nakagawa, H. Inhibition of Beta-Amyloid Cytotoxicity by Midkine. Neurosci. Lett. 1998, 254, 125–128. [Google Scholar] [CrossRef] [Scilit] [PubMed]
- Takada, S.; Sakakima, H.; Matsuyama, T.; Otsuka, S.; Nakanishi, K.; Norimatsu, K.; Itashiki, Y.; Tani, A.; Kikuchi, K. Disruption of Midkine Gene Reduces Traumatic Brain Injury through the Modulation of Neuroinflammation. J. Neuroinflammation 2020, 17, 40. [Google Scholar] [CrossRef] [Scilit] [PubMed]
Disclaimer/Publisher’s Note: The statements, opinions and data contained in all publications are solely those of the individual author(s) and contributor(s) and not of MDPI and/or the editor(s). MDPI and/or the editor(s) disclaim responsibility for any injury to people or property resulting from any ideas, methods, instructions or products referred to in the content. |
© 2026 by the authors. Licensee MDPI, Basel, Switzerland. This article is an open access article distributed under the terms and conditions of the Creative Commons Attribution (CC BY) license.