


Abstract
Background: Accurate evaluation of the Near Point of Convergence (NPC) is essential for diagnosing and managing convergence insufficiency (CI). Conventional assessment relies on the patient’s verbal feedback and the examiner’s visual observation, making it subjective and examiner-dependent. The AI-based MobileS platform, previously validated for both diagnosis and home-based therapy of CI, enables smartphone-based measurement and visualisation of NPC through eye tracking, without the need for verbal responses or additional equipment. This study, the third stage of our research programme, examined how ophthalmologists interpret NPC data when presented as videos versus AI-derived graphs. Methods: Twenty-two ophthalmologists completed an online questionnaire with 20 NPC test cases from the validated MobileS database, presented as both silent videos and AI-derived graphs. Accuracy was analysed using mixed-effects logistic regression, and continuous error was assessed using clustered bootstrap. Results: Graph-based interpretation showed higher odds of accurate NPC identification than video-based interpretation at the primary ±5 mm threshold (OR = 19.7, 95% CI: 13.50–28.74; p < 0.0001). Absolute error was lower for graphs than videos (Graphs − Videos: −22.73 mm; 95% CI: −26.88 to −18.59; p < 0.0001). “Uncertain” responses occurred in 28.2% of video-based assessments and 0% of graph-based assessments. Off-target errors decreased from 50.2% (videos) to 3.6% (graphs). Conclusions: AI-derived graphs of eye-movement data were associated with improved NPC estimation, suggesting a potential role in supporting clinical and tele-ophthalmology workflows.
1. Introduction
Convergence insufficiency (CI) is a common binocular vision disorder characterised by difficulty in maintaining adequate convergence during near work, resulting in eyestrain, blurred vision, and reduced reading performance [1,2,3,4]. Clinical evaluation traditionally relies on assessing the near point of convergence (NPC) using the RAF Ruler or Pencil tests, as well as on measuring positive fusional vergence (PFV) and administering the Convergence Insufficiency Symptom Survey (CISS) [3,5,6]. However, these measures are inherently subjective and examiner-dependent, often leading to poor inter-observer reproducibility. Similarly, home-based therapy, such as Pencil Push-Up therapy (PPU), remains limited by inconsistent adherence and lack of real-time feedback [7,8,9,10].
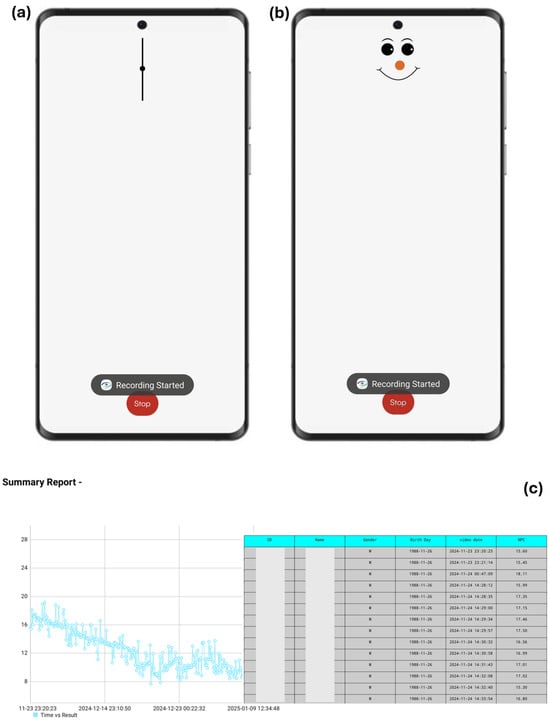
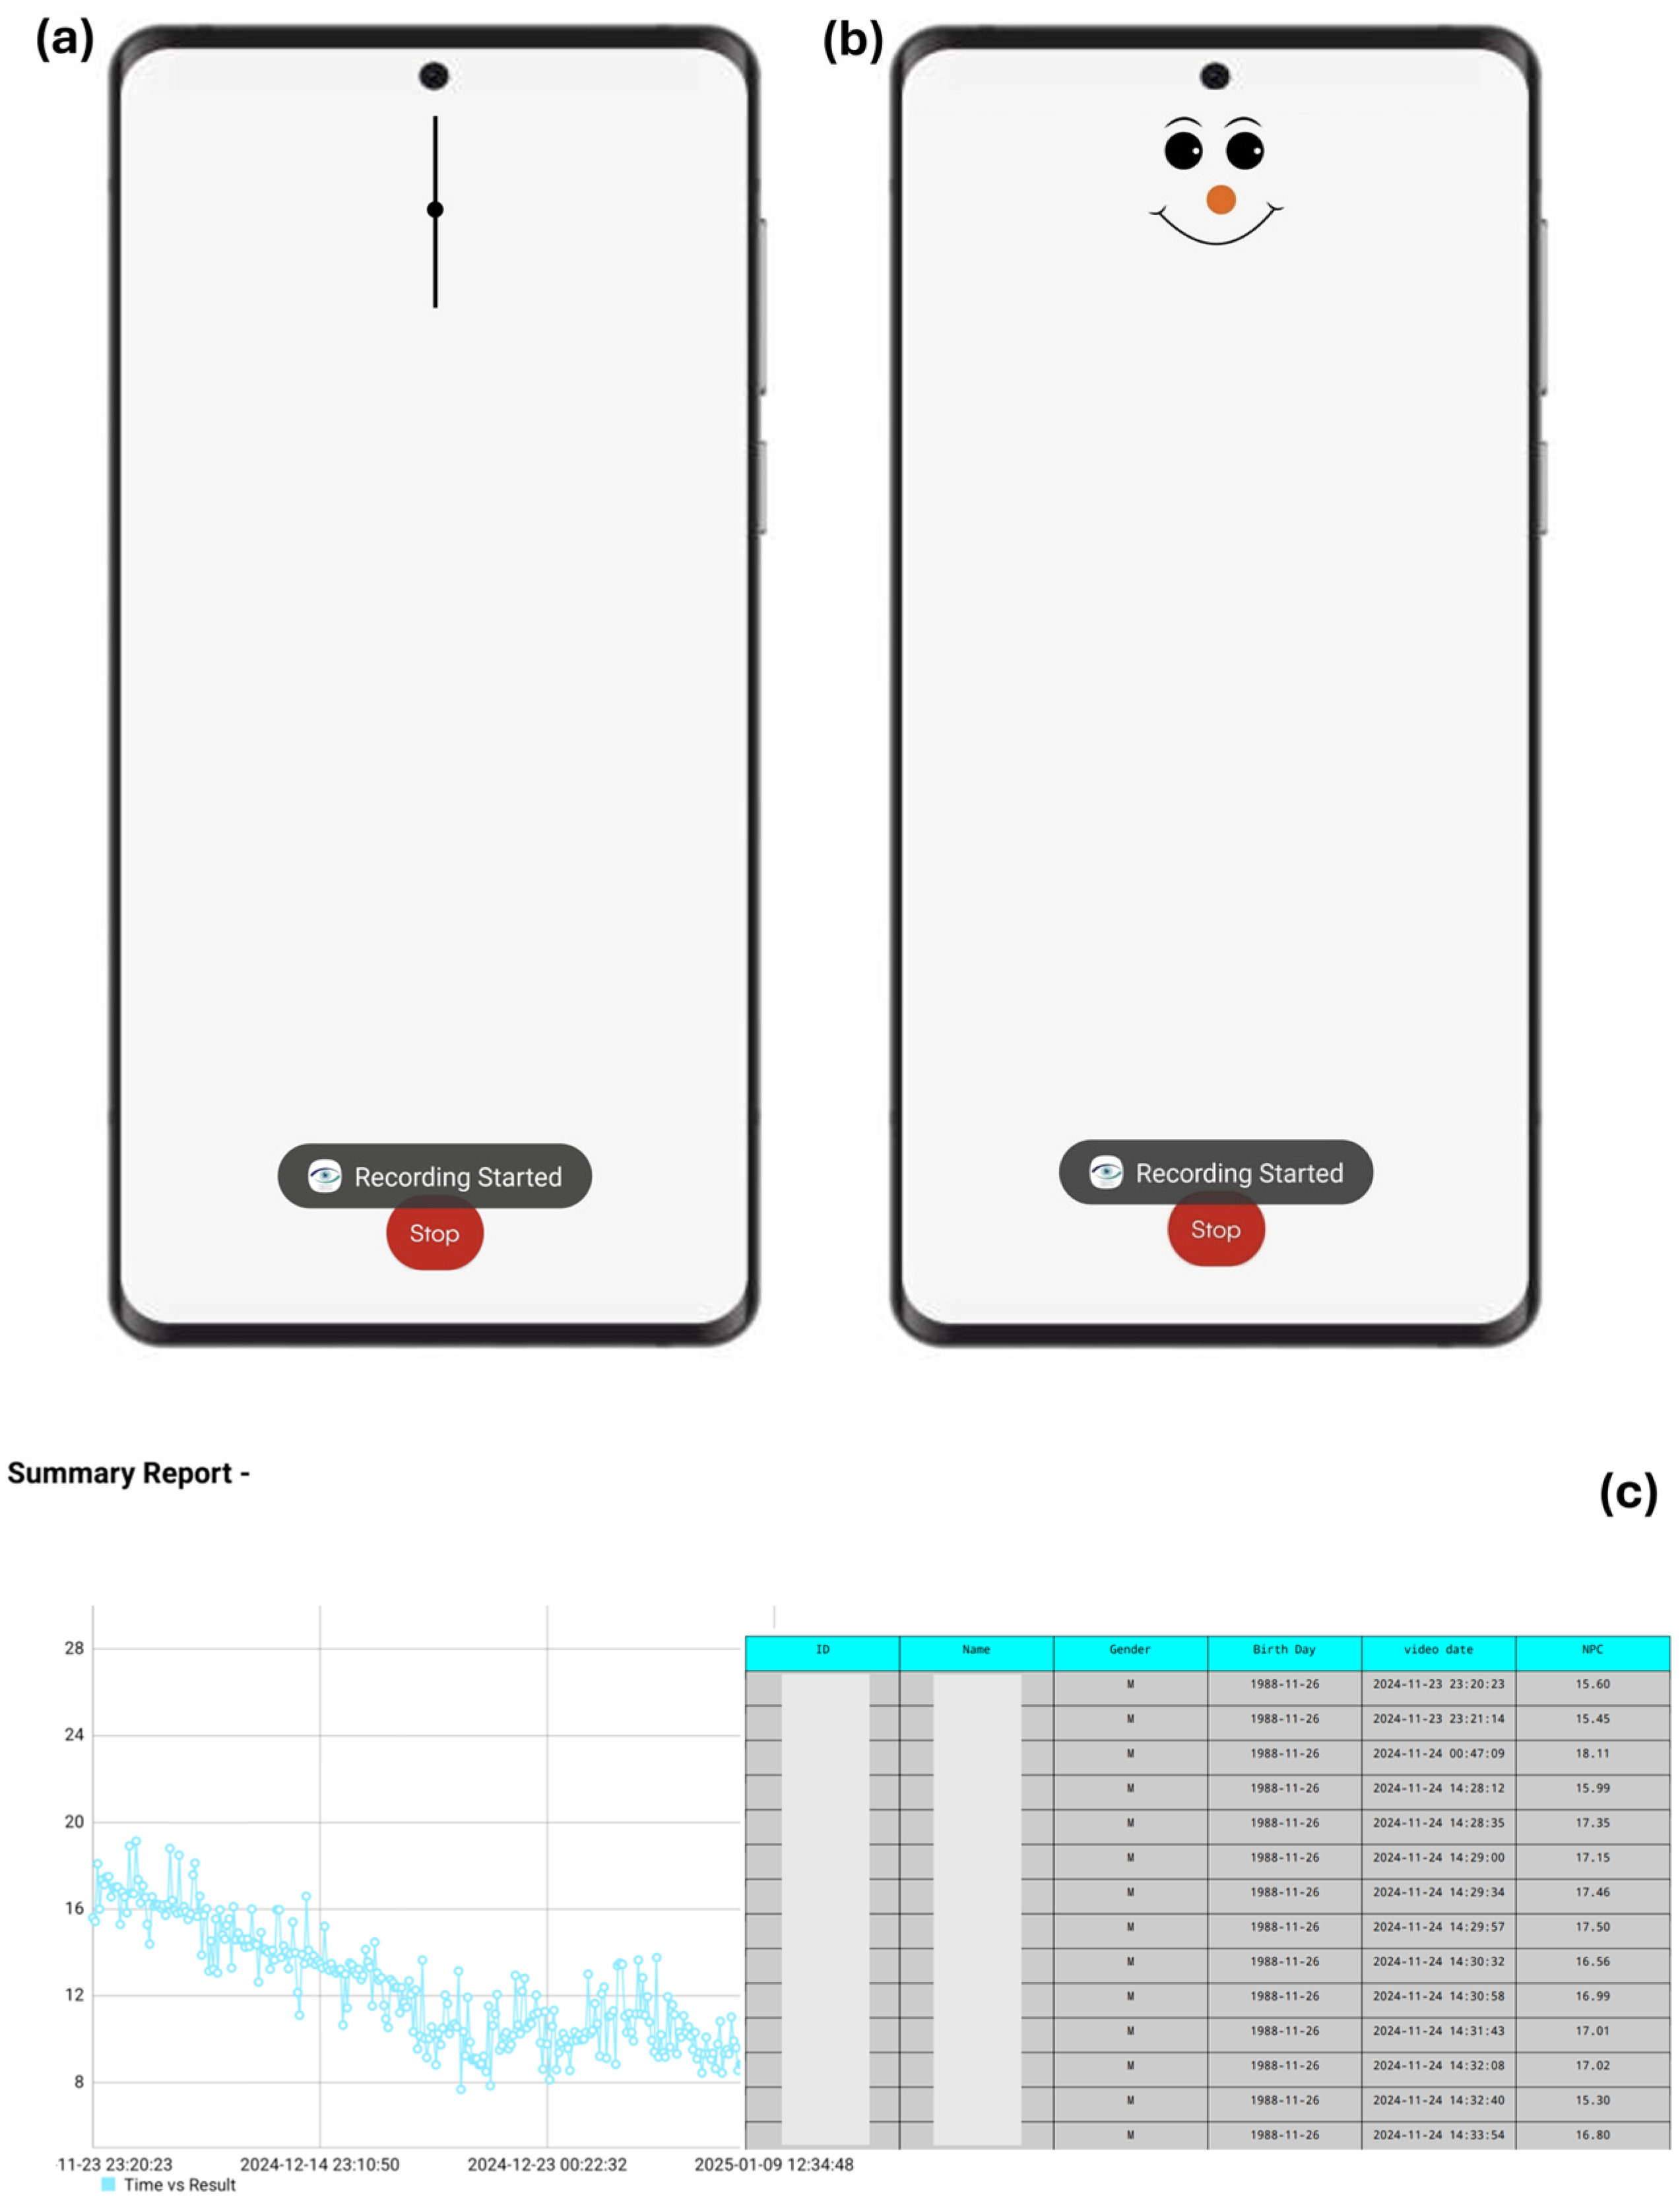
Recent advances in artificial intelligence (AI) and mobile health technologies have enabled automated, camera-based assessment of ocular motility and vergence behaviour [11,12,13,14,15,16,17,18,19,20]. Building on this concept, we previously developed the MobileS prototype—an AI-based smartphone approach designed to measure the NPC objectively using front-facing cameras and computer vision algorithms, without relying on the patient’s verbal response or the need for any additional equipment (Figure 1).
Figure 1.
Our Automatic System (MobileS) is a mobile phone application designed for NPC detection and CI treatment. (a) Shows adult NPC test; (b) Presents child-specific NPC test; (c) The platform automatically records NPC values (cm) during home-based training and displays a graphical summary of progress with a consistent downward trend across sessions, alongside a detailed log of individual measurements. Real-time smartphone feedback was used to promote engagement and support adherence during the study period.
In conventional NPC testing with the RAF Ruler, the examiner advances a near target toward the patient and identifies the break point based on the patient’s report of blur or diplopia. MobileS performs an analogous process digitally, estimating the NPC through camera-based eye tracking without requiring verbal feedback or any additional measuring device. It estimates NPC as the mobile-to-face distance; values are computed internally in millimetres (as reported in this study), while the user-facing output is presented in centimetres.
Our earlier studies provided preliminary validation of this framework in two sequential phases. The first, AI-Powered Smartphone Diagnostics for Convergence Insufficiency, demonstrated high agreement between automated and clinician-measured NPC values (ICC = 0.73, r = 0.74, p < 0.001) [21]. A subsequent study, currently under review, compared MobileS-based home therapy to Pencil Push-Up, suggesting greater improvement in NPC and higher adherence in the MobileS group.
While these studies provided initial evidence supporting the diagnostic and therapeutic feasibility of our approach, they raised a broader question: How do clinicians interpret AI-derived data? Evidence across medical domains suggests that visual analytics and graphical representation enhance human diagnostic accuracy and confidence by transforming abstract numerical data into intuitive spatial patterns [22,23,24,25]. In ophthalmology and related biomedical imaging fields, similar visualisation tools have been shown to improve clinician understanding of complex AI outputs and to facilitate interpretation of ocular and oculomotor data [26,27,28,29].
The primary objective of the study was to compare the accuracy of NPC determination from silent eye-focused videos versus AI-derived graphs against the established ground truth. The secondary objectives were to assess whether incorrect responses aligned with predefined mimickers, transient eye-movement patterns resembling true NPC, to compare the frequency of non-committal (“uncertain”) responses across modalities, and to determine which graphical type was perceived as more informative.
2. Materials and Methods
2.1. Analytical Framework and Study Rationale
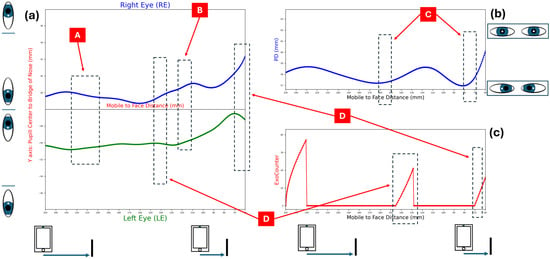
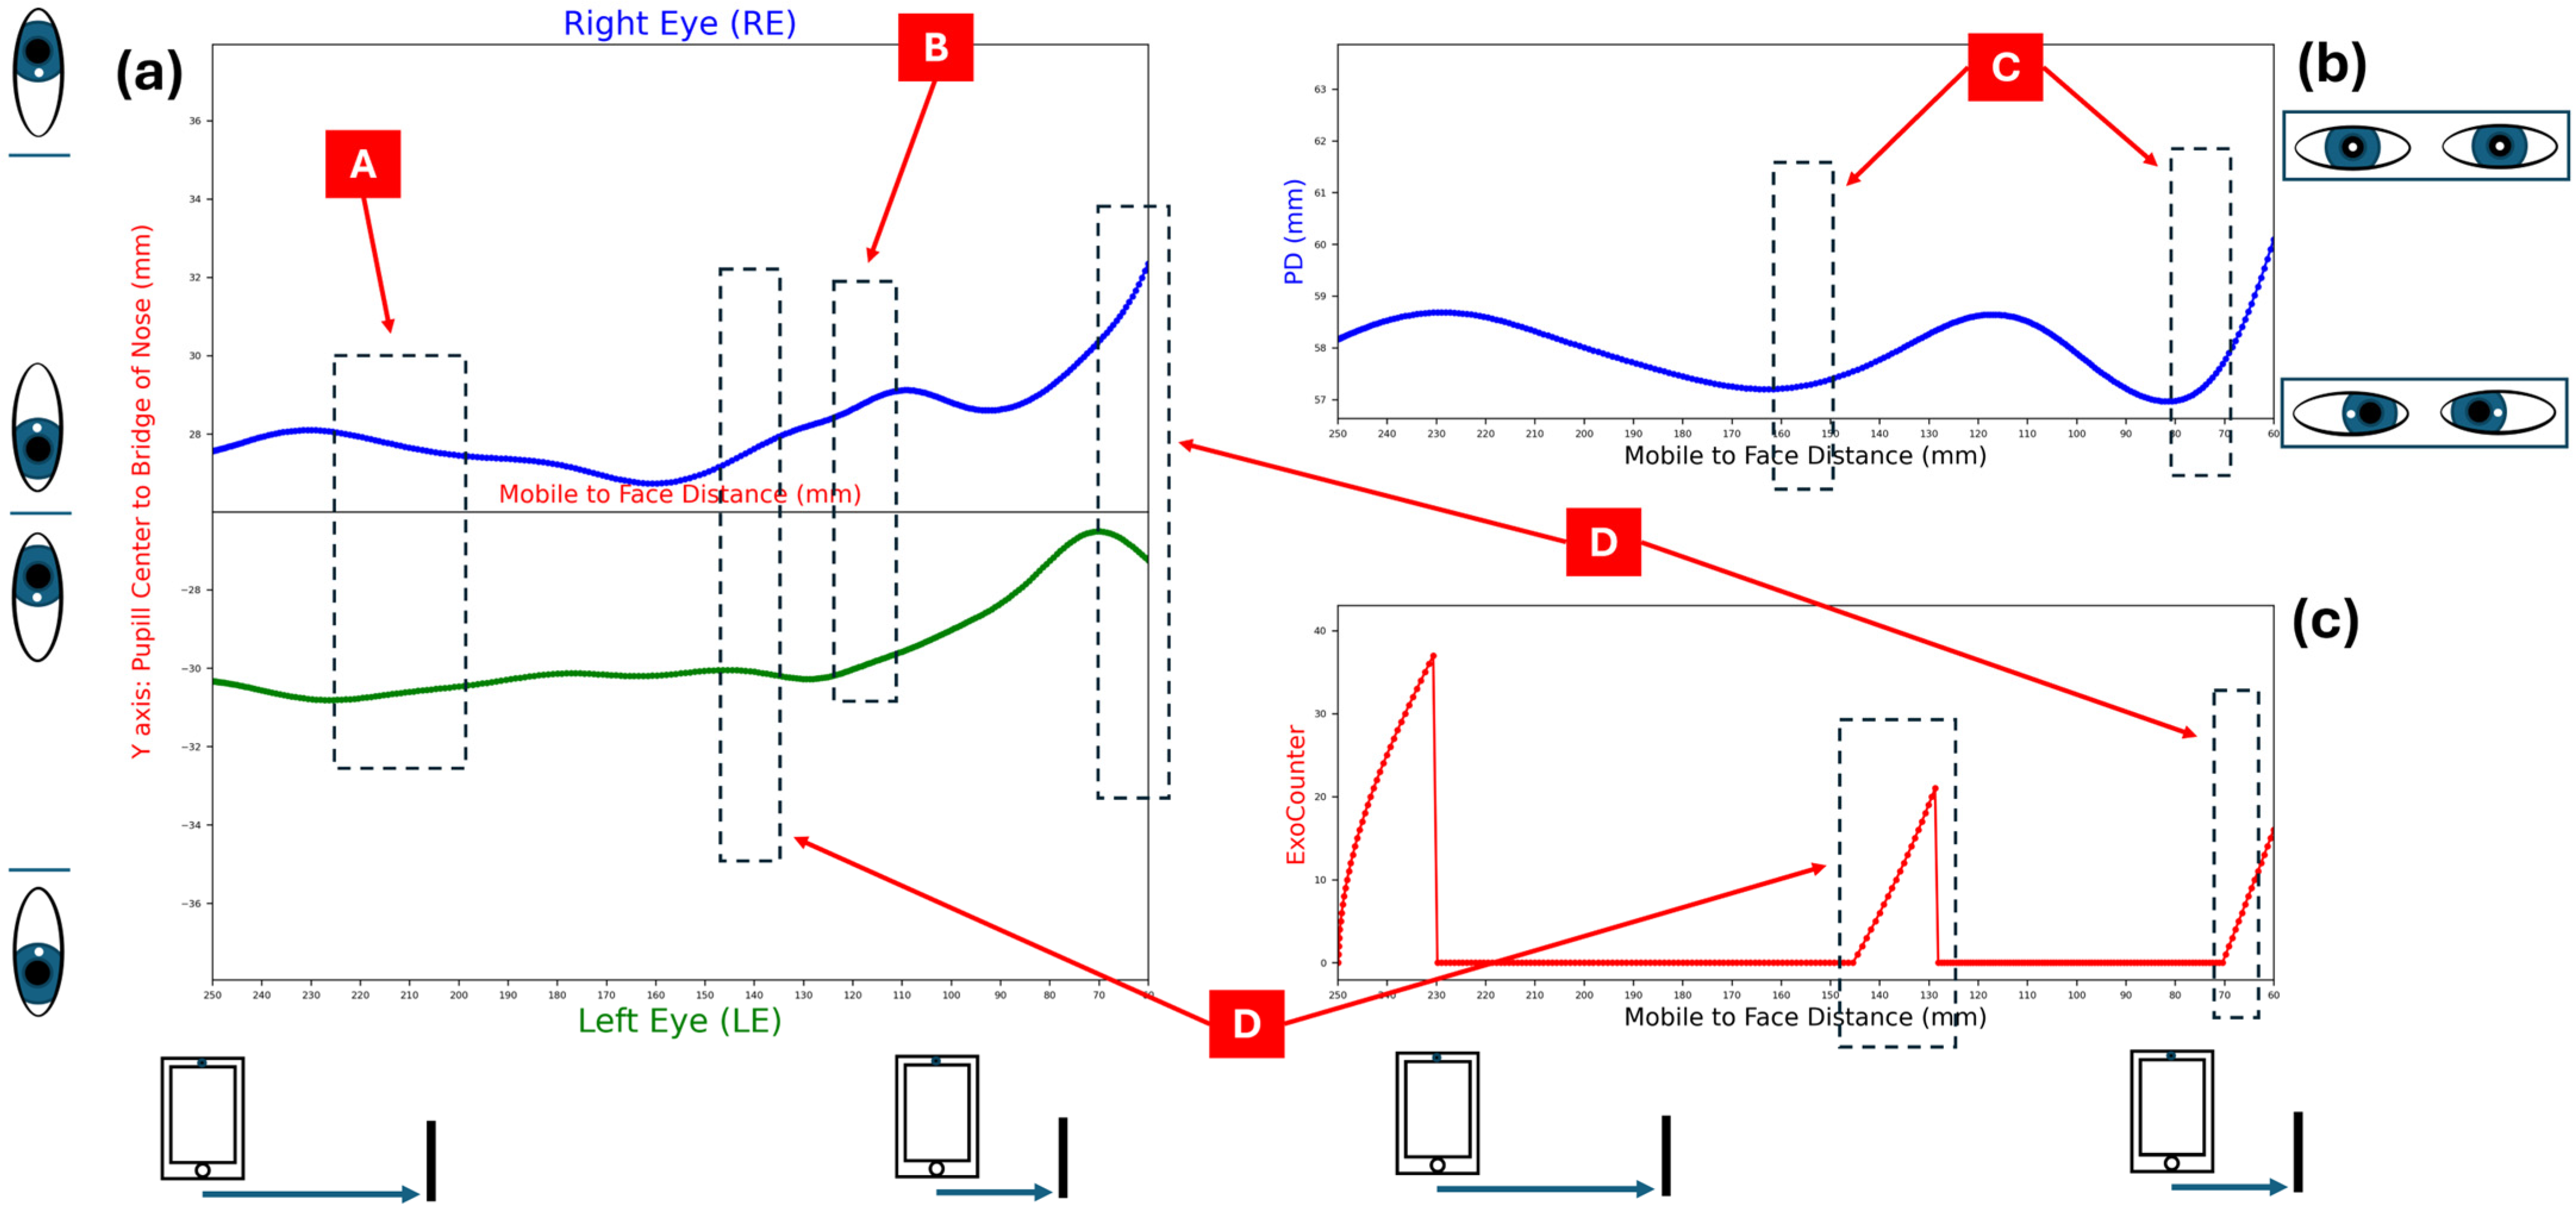
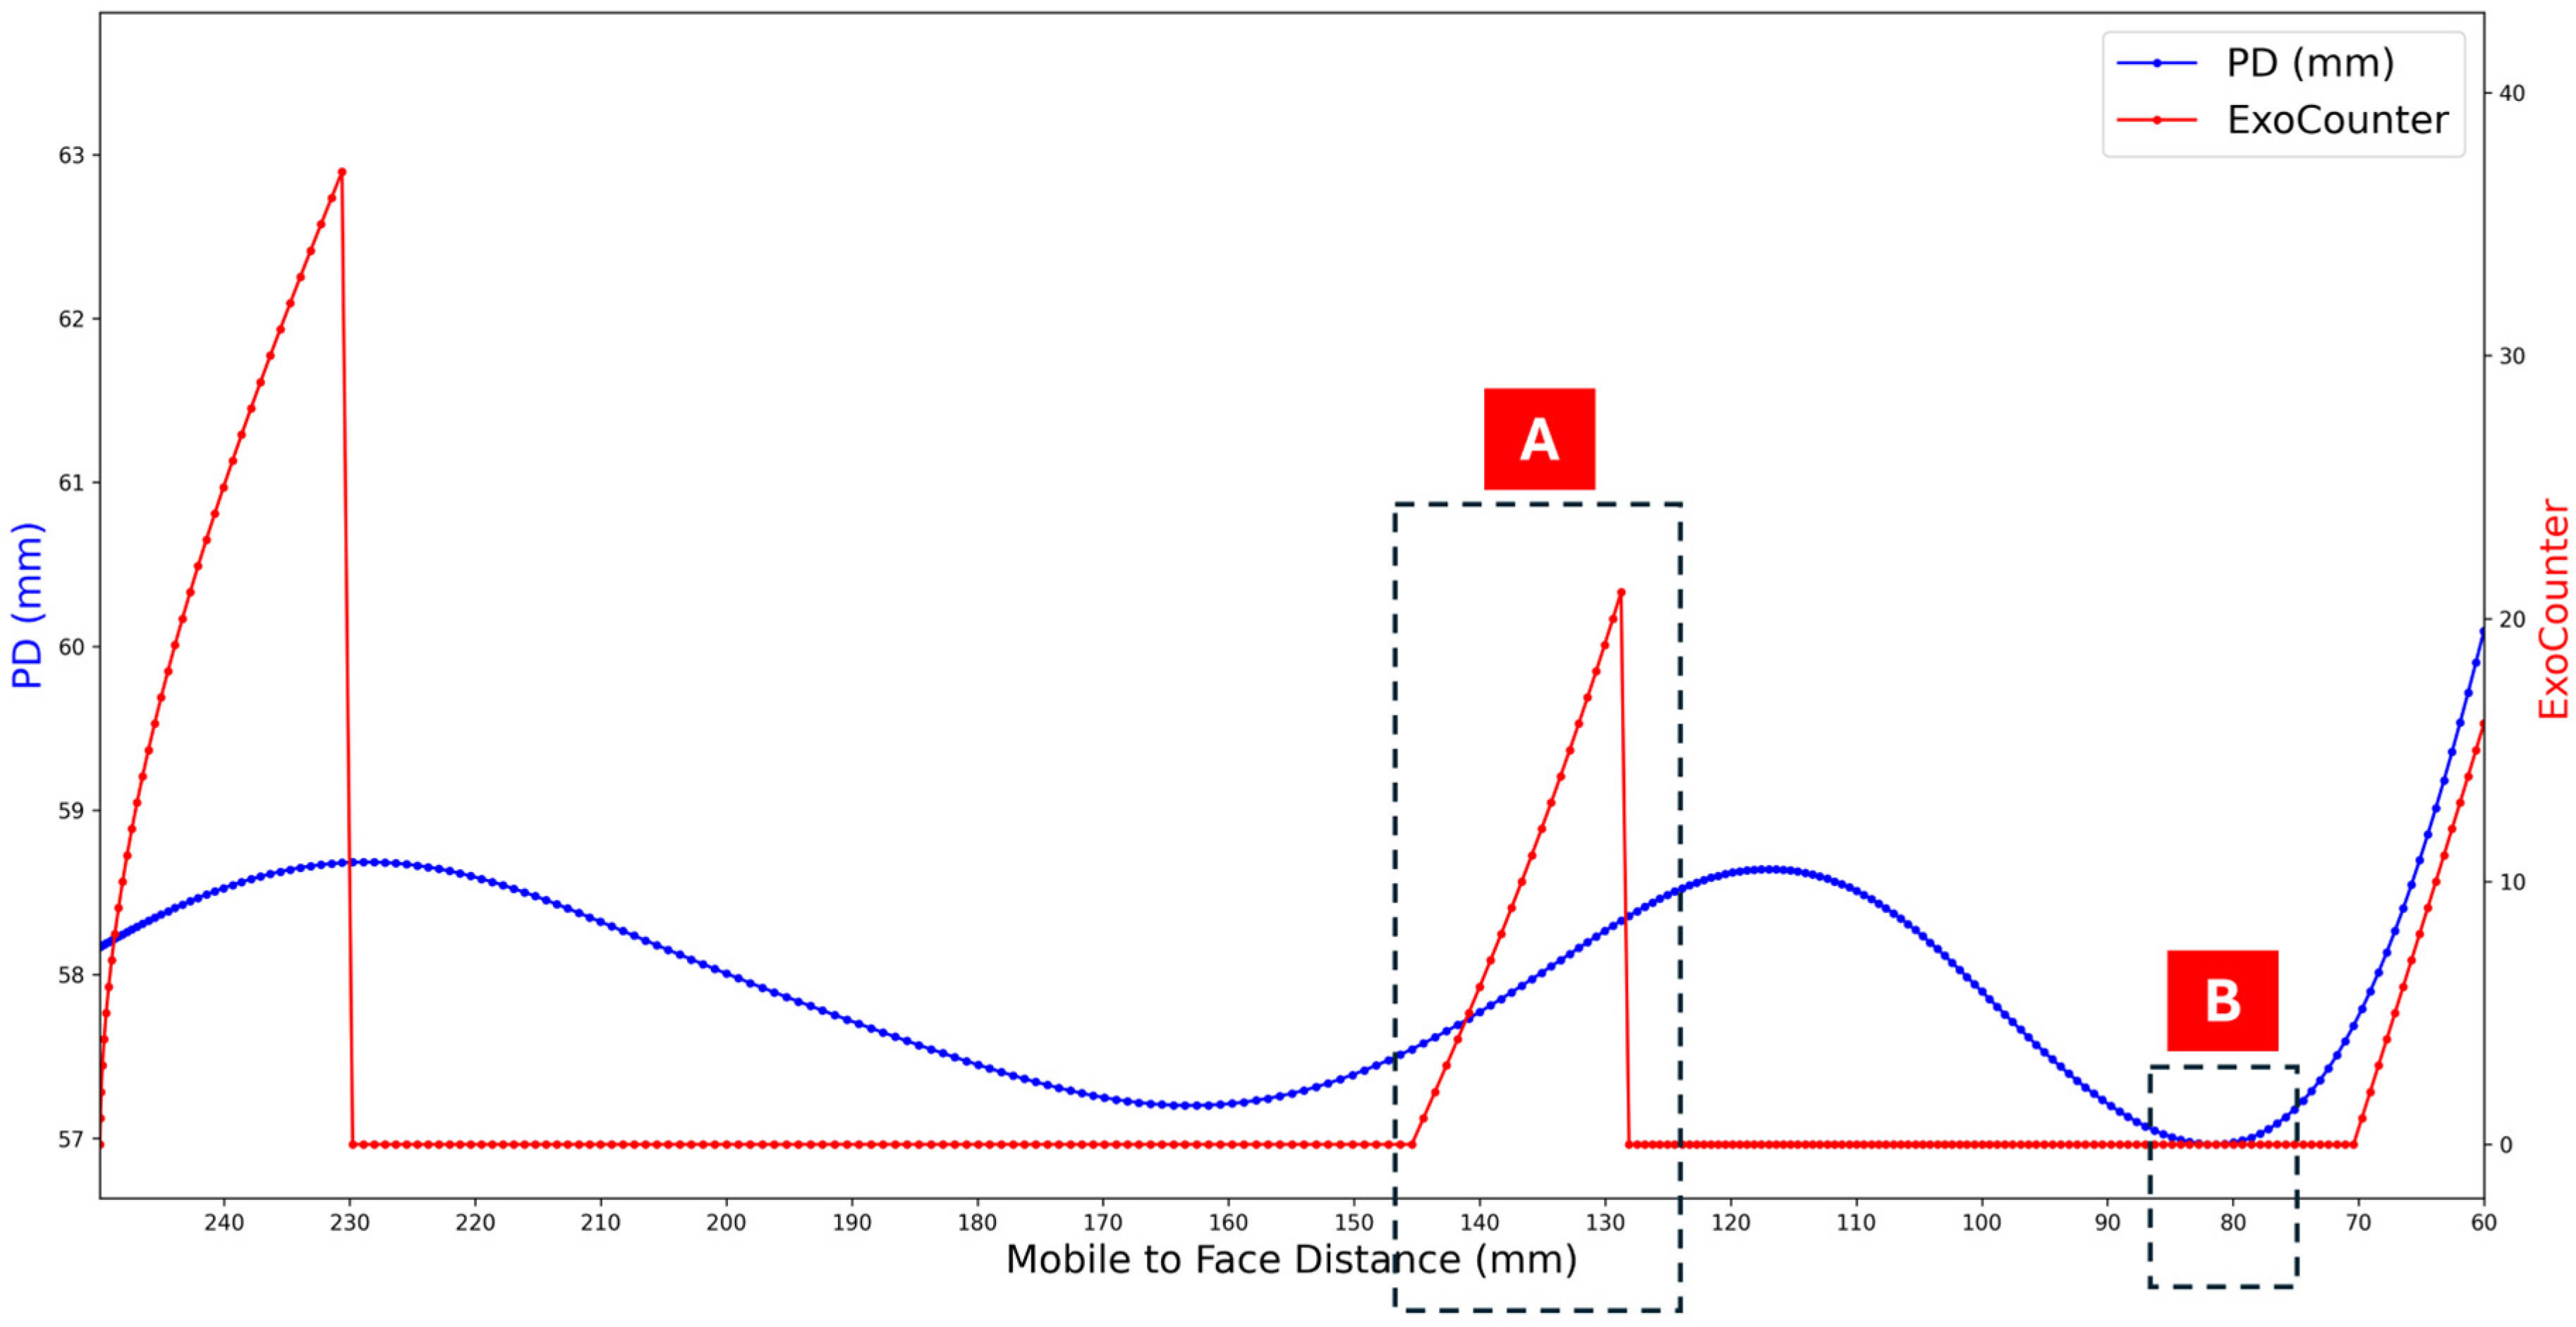
The RAF-based NPC assessment relies mainly on the patient’s verbal response and the target’s distance on the ruler, with limited attention to fine ocular movement patterns during convergence. In contrast, the MobileS platform determines NPC by tracking real-time eye movements independent of verbal feedback, generating a primary motion graph (Figure 2a) and several derivative graphs based solely on the same underlying signal (Figure 2b,c and Figure 3). AI was used for eye tracking and landmark extraction; the graphs are representations of AI-extracted and processed signals rather than outputs of a separate AI charting model.
Figure 2.
MobileS graphs for ocular motion analysis as a function of the mobile-to-face distance. (a) Eye Movement Graph: Displays the horizontal eye movements. (b) Pupillary Distance (PD) Graph: Shows the variation in PD. (c) ExoCounter Graph: Represents cumulative divergence events. A: Both eyes converge simultaneously. B: Both eyes move to the right. C: Pupillary separation following prolonged fixation. D: Both eyes diverge simultaneously. Abbreviations: PD—Pupillary Distance; ExoCounter—Exodeviation episode’s counter.
Figure 3.
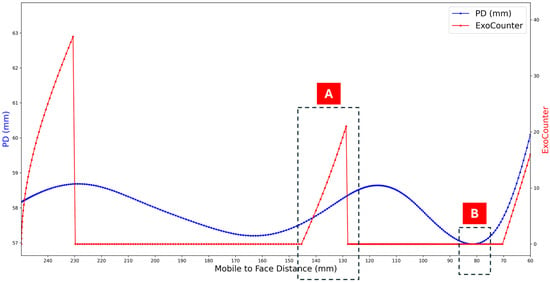
Integrated Summary graph combining PD and ExoCounter versus mobile-to-face distance to support identification of the NPC. A: Event corresponding to visual blur or diplopia. B: End of the final convergence attempt observed in the sequence. Abbreviations: PD—Pupillary Distance; ExoCounter—Exodeviation episode’s counter.
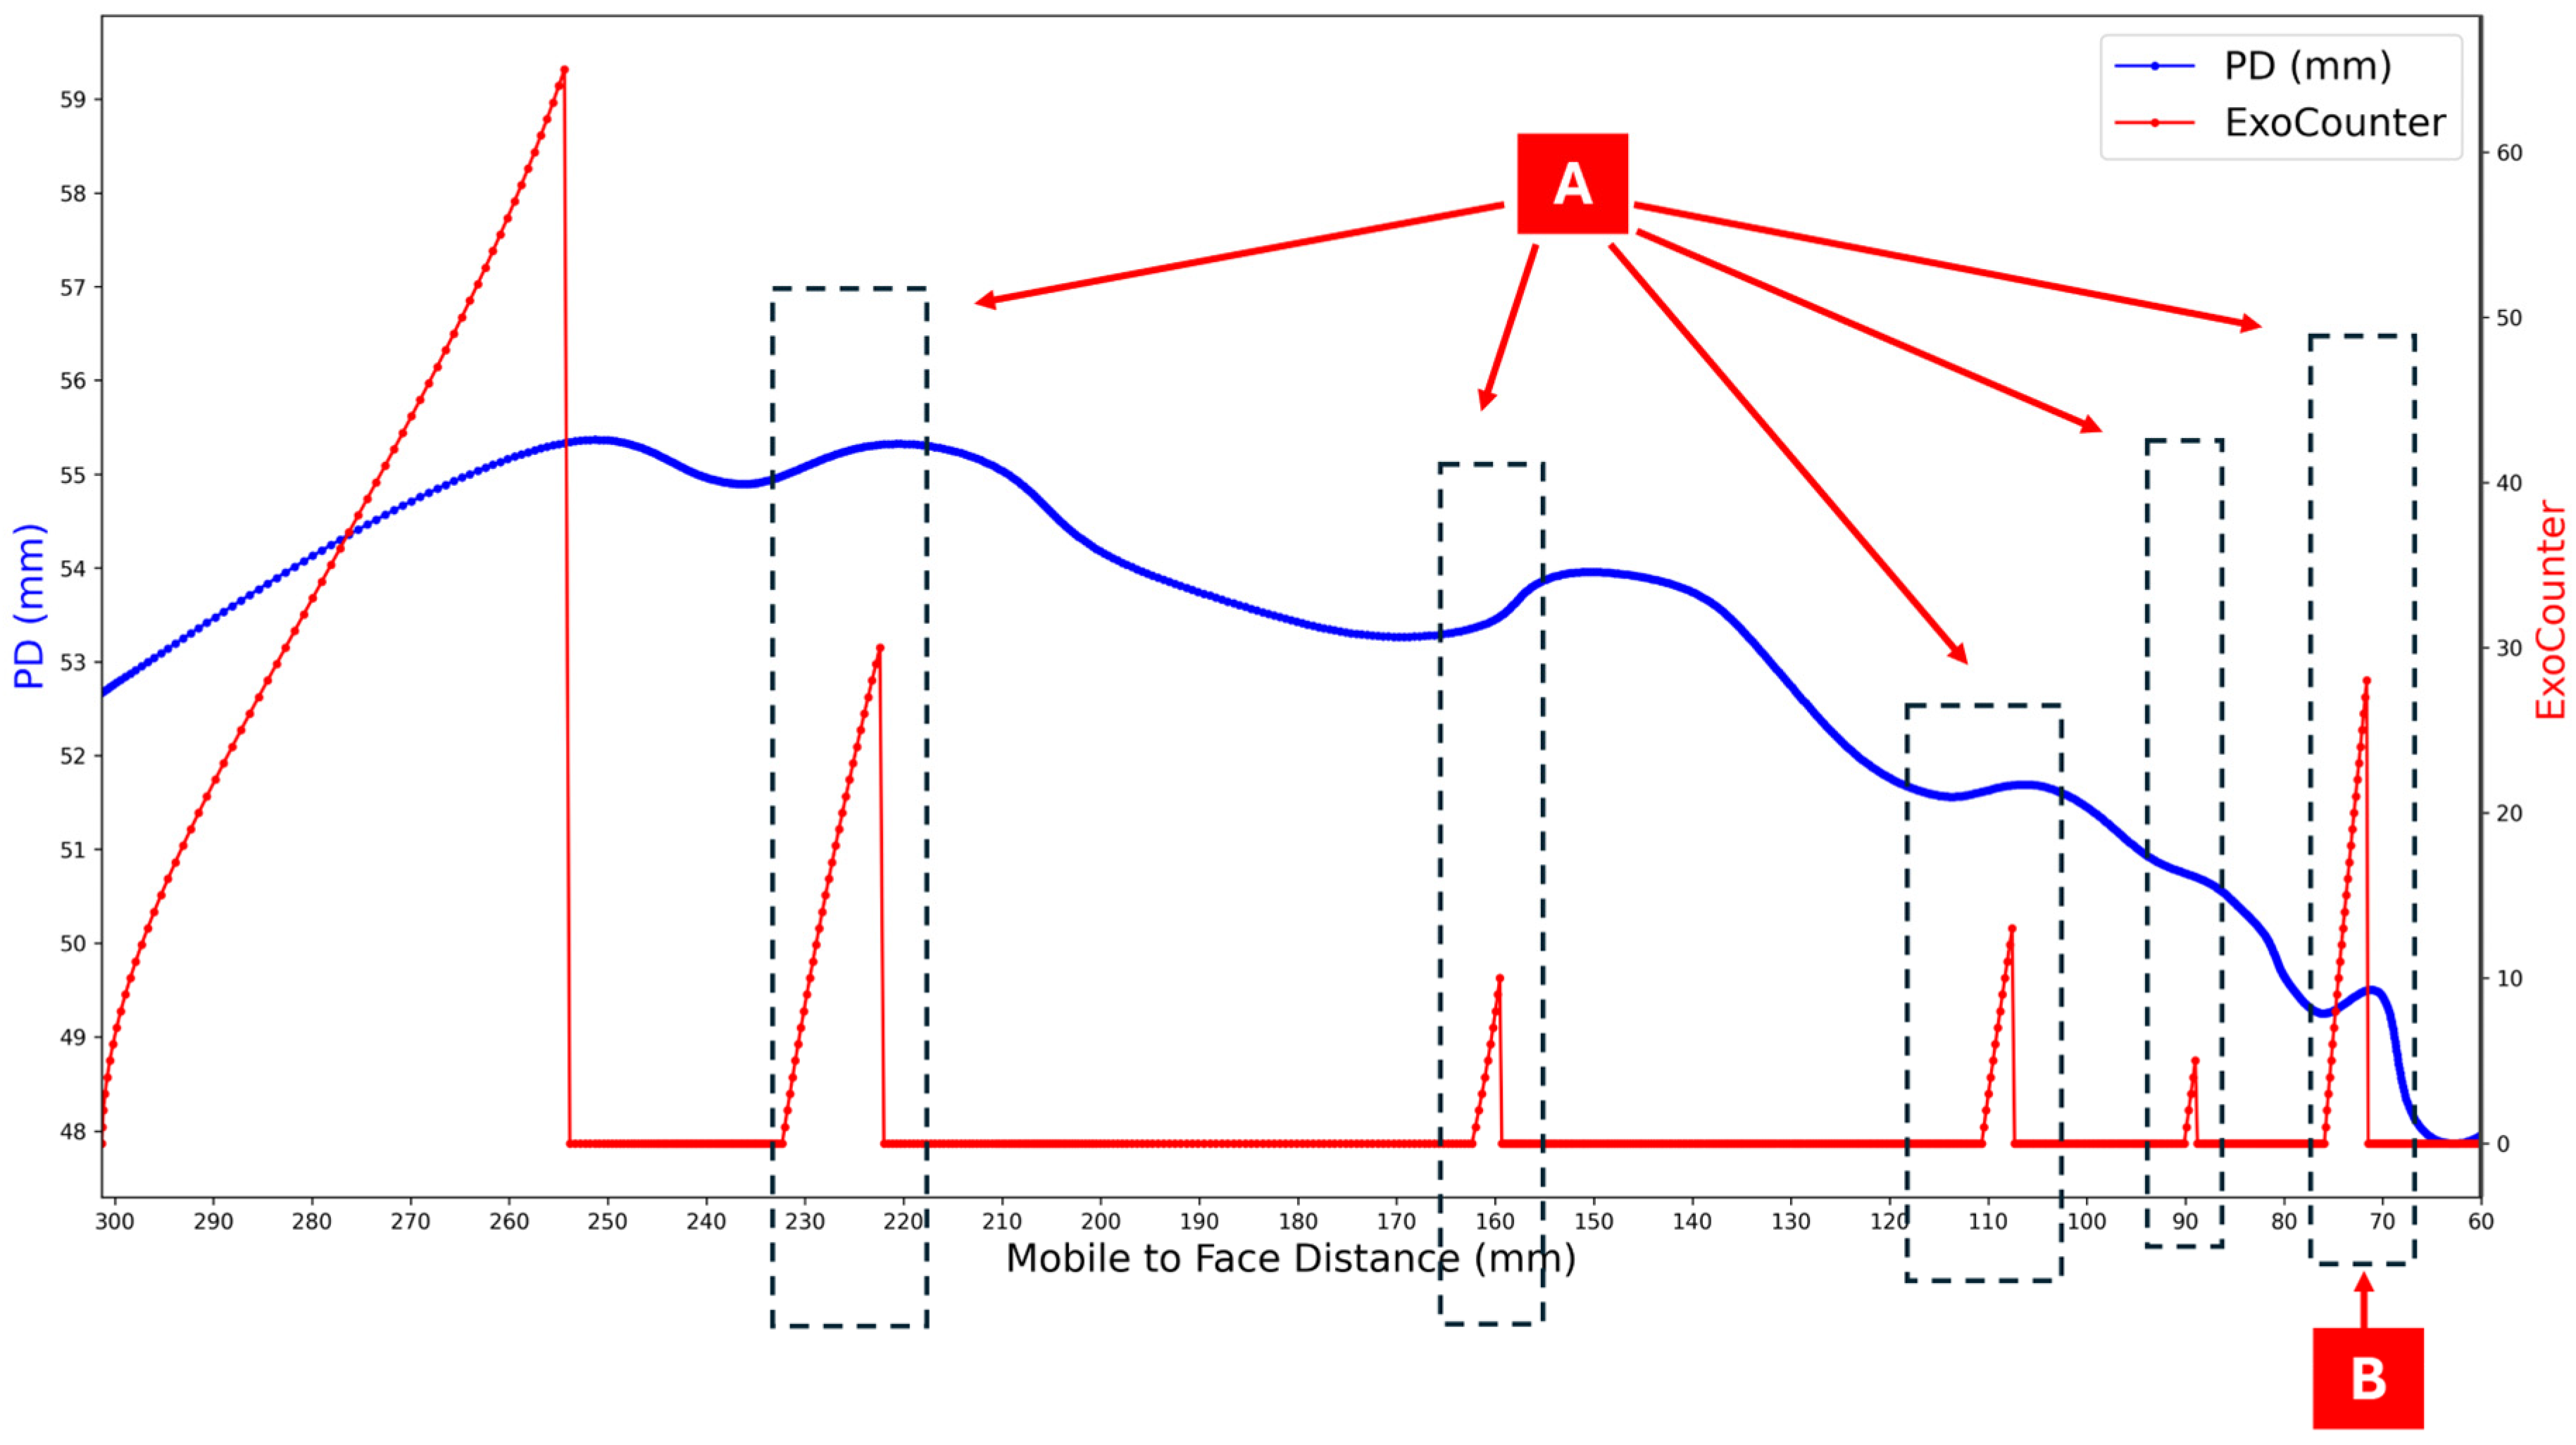
Analysis of our large dataset revealed recurrent eye-movement patterns that mimic true NPC (“mimickers”), which may mislead observers (Figure 4). For this study, we randomly selected validated cases that included a high-quality silent eye-focused video and their corresponding graphs.
Figure 4.
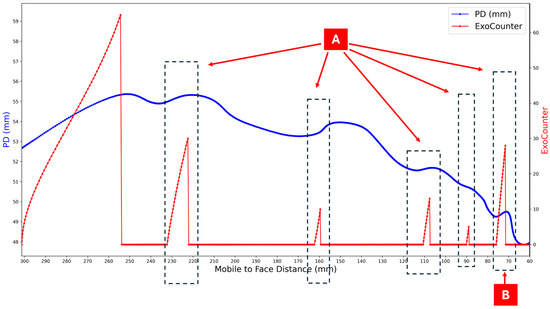
Example of a Summary graph showing multiple potential blur events during convergence testing relative to the mobile-to-face distance. The blue curve represents changes in Pupillary Distance (PD, in mm), while the red curve (ExoCounter) denotes cumulative outward eye-deviation events. Each red peak (A) indicates a short episode of simultaneous outward deviation that could correspond to a transient visual blur or diplopia (mimicker event). The likelihood of identifying the true NPC increases when a high red peak occurs near the last local minimum of the blue PD curve, representing the participant’s final convergence attempt (B). Abbreviations: PD—Pupillary Distance; ExoCounter—Exodeviation episode’s counter.
Unlike our earlier diagnostic work, where reference determination relied on algorithmic outputs, the ground truth in the present study (NPC and locations of mimickers) was established by the principal investigator, a board-certified ophthalmologist and PhD candidate with extensive expertise in AI-assisted ocular motion analysis, through careful, iterative review of both the original silent eye-focused videos and their corresponding graphical representations. Accordingly, any potential error in the reference standard stems from a single human source rather than from both human judgement and algorithmic estimation.
The ground truth was not extracted automatically from plotted features and was not directly encoded in the graphs; rather, it was determined via expert interpretation using complementary cues in both modalities. Video-based cues ranged from subtle periocular facial muscle activation, especially eyelid-aperture changes, to overt outward deviation/exotropia when present. Inspection of each eye’s trace relative to the fellow eye, together with the magnitude and temporal pattern of ExoCounter events and the depth and trajectory of the PD curve, helped distinguish NPC from transient mimicker episodes. Mimicker locations were annotated as transient divergence-like episodes that could plausibly be misinterpreted as an NPC when viewed in isolation.
A diverse group of ophthalmologists received standardised instructions and were asked to determine the NPC for each case using the following: (1) silent videos, and (2) AI-derived graphs. The matching between each video and its graphs was concealed.
2.2. Study Design and Participants
This cross-sectional study evaluated ophthalmologists’ ability to identify the NPC using two modalities: (1) silent video recordings of eye movements during NPC examinations, and (2) graphs automatically generated by the AI-powered MobileS system.
Twenty-two ophthalmologists participated voluntarily. Eligible participants included physicians currently engaged in ophthalmic practice or clinical training at a hospital-based department. No restrictions were applied regarding age or level of experience, and prior exposure to binocular vision disorders was not required.
The sample size was selected to balance the diversity of clinical experience as well as practical completion time. This number allowed inclusion of residents, specialists, and subspecialists representing different experiences, while maintaining a reasonable evaluation load per participant.
The study adhered to the tenets of the Declaration of Helsinki and approved by the Ethics Committee. Participation was fully anonymous, and completion of the online form implied informed consent.
2.3. Stimuli and Data Preparation
The visual materials used in this study were derived from clinical NPC recordings performed with the MobileS application. Each recording depicted a real subject undergoing a standard NPC test while the front-facing smartphone camera tracked ocular movements and Pupillary Distance (PD) in real time. The patients’ identity was obscured.
From each recording, two types of data representations were extracted:
- Video recordings: Silent clips showing the subject’s eyes during the convergence process.
- Graphical outputs: Four synchronised graphs derived from the same AI-analysed data:
- •
- Eye Movements Graph: Illustrating horizontal trajectories of each eye (in millimetres) relative to the midline corresponding to the nasal bridge (Figure 2a).
- •
- Pupillary Distance (PD) Graph: Depicting the change in inter-Pupillary Distance during convergence (Figure 2b).
- •
- ExoCounter Graph: Displaying automated cumulative count of simultaneous outward deviations in both eyes (divergence events) detected across the measurement sequence (Figure 2c).
- •
- Summary Graph: Combining the PD and ExoCounter data into a unified representation of the convergence event and allows accurate detection of the NPC (Figure 3).
Each of the 20 cases had a predefined ground truth NPC value (in millimetres). In addition, each case was assigned a set of mimicker values—alternative distances that represented plausible but incorrect interpretations. These mimickers were later used to assess whether inaccurate human estimates tended to align with misleading graphical patterns (Figure 4).
2.4. Google Form Structure
A custom Google Form questionnaire was designed to collect all responses and ensure consistent data presentation across participants. It consisted of four main sections:
- Demographic Section: Collected information on age, sex, training level (resident, specialist, subspecialist), years of clinical experience, and prior exposure to CI (none, few, or many cases).
- Video-Based Evaluation: Participants viewed 20 silent videos, each depicting an NPC test. For each case, they selected the moment at which they believed blur or diplopia occurred by replaying the clip and entered the corresponding timestamp (seconds). These timestamps were later converted into distance values (millimetres) using a predefined time–distance calibration table generated automatically by the MobileS system for each specific case, standardizing all results for comparison with the ground truth. Importantly, the calibration table was not available to participants during the task.
- Graph-Based Evaluation: Participants were then shown 20 cases presented solely as graphs, identical to the video cases but without explicit linkage. Each participant estimated the NPC (in millimetres) directly from the graphs. Each case displayed the full set of four static graphs (Eye Movements, PD, ExoCounter, and Summary) within the Google Form, without dedicated interactive tools beyond standard device/browser viewing.
- Perceptual Evaluation: Participants rated each of the four graph types on a 5-point informativeness scale (1 = not informative, 5 = highly informative) and ranked their relative importance (1 = most important, 4 = least important) for identifying the NPC.
A response of “uncertain” was available and applicable in both the video and graph sections and was equally acceptable as a valid response option. All participants completed the questionnaire remotely, using either a computer or a smartphone, in a single sitting lasting approximately 45–60 min.
2.5. Experimental Procedure
All evaluations were conducted online through a secure Google Form interface. Each participant received an identical survey link containing the same sequence of 20 clinical cases. All participants completed the video section first and the graph section second. The order of cases was identical in both modalities; however, participants were not informed that the same underlying cases were presented in both parts, which may reduce potential recall bias.
Before beginning the questionnaire, all participants attended a short instructional session conducted by the investigators, during which the purpose of the study and the structure of the survey were explained. The session also ensured that all participants fully understood the response process and expected tasks and received a brief standardised orientation explaining response mechanics and general interpretive cues for identifying the NPC in both the video and graph sections.
Additional on-screen instructions were provided before each section (video and graph) to remind participants of the task format. No case studies were used as examples, and no feedback regarding accuracy or correctness was given during the study. All responses were automatically recorded in the Google Form and exported for subsequent statistical analysis.
2.6. Statistical Analysis
All responses were analysed quantitatively to compare performance across the two modalities—video recordings and graphs.
We pre-specified ±5 mm from the ground truth as the primary tolerance threshold as a conservative criterion for NPC accuracy. Wider tolerance thresholds (±10, ±15, ±20 mm) were analysed as secondary outcomes. For each tolerance threshold, accuracy was coded as a binary outcome (accurate vs. not accurate), and “uncertain” responses were treated as incorrect. As a sensitivity analysis, we repeated the accuracy models treating “uncertain” responses as missing rather than incorrect.
To account for repeated measurements within clinicians, accuracy at each threshold was analysed using mixed-effects logistic regression with modality (graphs vs. videos) as a fixed effect and random intercepts for both participant and case. Results are reported as odds ratios (ORs) with 95% confidence intervals (Table 1).
Table 1.
Odds ratios for accurate NPC estimation using graphs versus videos across predefined tolerance thresholds.
For continuous error (absolute error in millimetres), uncertainty was estimated using a clustered bootstrap resampling by participant and case. We report the Graphs−Videos difference with its bootstrap 95% confidence interval and p-value. “Uncertain” responses were excluded from continuous error calculations because they do not represent numeric estimates.
Error-pattern metrics were summarised at the response level (N = 440 responses per modality; 22 participants × 20 cases), as shown in Table 2. Mimicker-hit rate was defined as responses outside ±5 mm of the ground truth that fell within ±5 mm of any predefined mimicker. The off-target error rate was computed as the proportion of responses falling outside ±20 mm of the ground truth and not within ±5 mm of any mimicker. “Uncertain” responses were included in the denominators and treated as incorrect.
Table 2.
Error Patterns and Accuracy Measures (Video vs Graphs).
Descriptive statistics were generated for all measures, and correlation analyses were performed using Pearson and Spearman coefficients to ensure robustness. Because both methods yielded comparable trends, Pearson-based results are reported in the main text.
3. Results
3.1. Participant Demographics
A total of 22 ophthalmologists completed the survey. The group included nine residents (40.9%), ten board-certified specialists (45.5%), and three subspecialists (13.6%). The mean age was 37.4 ± 9.7 years (range 26–59), with a mean clinical experience of 8.75 ± 8.3 years. Fourteen participants (63.6%) were male and eight (36.4%) were female. Fourteen respondents (63.6%) had previously treated patients with CI, while eight (36.4%) had not.
This distribution reflects a heterogeneous sample encompassing multiple levels of clinical experience and expertise, mirroring the typical diversity encountered in real-world ophthalmic practice.
3.2. Accuracy of NPC Estimation Across Modalities
Mixed-effects logistic regression models showed higher odds of accurate NPC identification when clinicians interpreted AI-derived graphs compared with silent video recordings across all predefined tolerance thresholds (Table 1). At the primary accuracy threshold (±5 mm from the ground truth), the odds of correct estimation were higher when using graphs than videos (OR = 19.7, 95% CI: 13.50–28.74, p < 0.0001). Similar results were observed at wider tolerance bands, including ±10 mm (OR = 21.8, 95% CI: 9.00–52.73, p < 0.0001), ±15 mm (OR = 15.4, 95% CI: 6.70–35.50, p < 0.0001), and ±20 mm (OR = 15.5, 95% CI: 7.12–33.83, p < 0.0001).
The proportion of “uncertain” responses decreased from 28.2% in videos to 0% in graphs. When “uncertain” responses were treated as missing rather than incorrect, the results were consistent with the main analysis across all predefined thresholds (all p < 0.0001).
3.3. Continuous Error Analysis
Continuous error was defined as the absolute difference (in millimetres) between the clinician’s estimate and the ground truth NPC. Using a clustered bootstrap resampling by participant and case, absolute error was significantly lower for graphs than videos (Graphs − Videos: −22.73 mm; 95% CI: −26.88 to −18.59; p < 0.0001).
3.4. Error Patterns and Misclassification
Response-level error patterns are summarised in Table 2. Across all 440 video-based responses, 120 (27.3%) represented incorrect estimations that fell within ±5 mm of a predefined mimicker. A similar proportion was observed in the graph-based modality, with 121 of 440 responses (27.5%) meeting this criterion.
Off-target errors—inaccurate responses that are not only far from the ground truth NPC (beyond ±20 mm) but also do not match any mimicker—were more frequent in videos (50.2%, 221/440) than in graphs (3.6%, 16/440).
3.5. Graph Informativeness and Importance Ratings
Participants rated the four graph types in terms of informativeness (1–5 scale, 5 = most informative) and importance for identifying the NPC (1–4 scale, 1 = highest importance). The Summary graph (Figure 3) received the highest scores in both categories (informativeness 4.73 ± 0.46, importance 1.55 ± 0.96, p < 0.001). The Pupillary Distance (PD) and ExoCounter graphs (Figure 2b,c) received intermediate scores (informativeness 3.6 ± 0.9), while the Eye Movements graph (Figure 2a) received the lowest rating (informativeness 3.4 ± 1.0).
3.6. Influence of Demographic Factors
No statistically significant associations were found between estimation accuracy and participants’ demographic characteristics. Correlation analyses showed negligible relationships with age and years of clinical experience (videos: r = 0.01–0.04, p = 0.86–0.95; graphs: r = 0.24–0.30, p = 0.18–0.29). Similarly, no significant differences in accuracy were observed across gender, prior exposure to CI, or professional level (p = 0.45–0.98).
4. Discussion
This study evaluated ophthalmologists’ ability to identify the NPC from two modalities—silent video recordings and AI-derived graphs from identical MobileS datasets. Across all predefined tolerance thresholds, mixed-effects logistic regression showed higher odds of accurate NPC identification with graphs compared with videos (Table 1).
At the primary accuracy threshold (±5 mm), graph-based interpretation yielded higher odds of correct estimation than video-based interpretation (OR = 19.7, 95% CI: 13.50–28.74, p < 0.0001), with similarly higher odds across wider thresholds (±10 to ±20 mm) (Table 1), suggesting improved diagnostic reliability under the study conditions. More accurate identification of the NPC could reduce false-positive or false-negative classifications of CI and improve treatment planning, particularly in telemedicine settings.
In addition, “uncertain” responses were common in the video condition (28.2%) and absent in the graph condition, reflecting fewer non-committal responses when using the graphs. This may serve as an indirect behavioural proxy for confidence, although it is not a direct confidence measure.
Using several tolerance thresholds (±5–20 mm from the ground truth) provides a more comprehensive view of clinicians’ diagnostic performance across different decision ranges. In addition, continuous error analysis based on absolute error showed significantly lower error for graphs than videos (Graphs−Videos: −22.73 mm; 95% CI: −26.88 to −18.59; p < 0.0001), consistent with the higher accuracy observed across tolerance thresholds.
MobileS graphs may provide clear visual cues for identifying the NPC by translating complex eye-movement dynamics into structured and quantitative representations. To reduce potential recognition bias, participants completed the video section first and the graph section second, were not informed that the same underlying cases were presented in both modalities, and the response formats differed (timestamps in seconds versus NPC in millimetres, without access to calibration tables). Nevertheless, because modality order was fixed and the case sequence was repeated, learning or recognition effects cannot be excluded, and we did not measure recognition or session duration to quantify this potential bias.
Although the absolute number of mimicker-associated responses was nearly identical across modalities (120 in videos vs. 121 in graphs), their interpretation differs depending on the denominator used. At the response level (Table 2; N = 440 per modality), the overall mimicker-hit rates were similar (120/440 vs. 121/440). However, in a secondary descriptive analysis restricted to incorrect responses, mimicker-aligned errors represented 31.0% of all incorrect estimations in the video modality (120/390), whereas they accounted for 68.8% of incorrect estimations in the graph modality (121/176). This pattern suggests that when errors occurred in the graph-based modality, they were more likely to cluster around physiologically plausible but misleading mimickers rather than being randomly distributed. This highlights the dual nature of AI-derived graphs, enhancing interpretability while also increasing susceptibility to false cues if not correctly contextualised.
In parallel, the substantial reduction in Off-Target Error Rate—from 50.2% in videos to 3.6% in graphs (Table 2)—indicates that graphs provided a more stable interpretive reference frame, limiting the occurrence of responses that lack a clear physiological basis.
The accuracy of NPC estimates from MobileS graphs was consistent regardless of the number of experience years, demographic or professional background. This suggests that even less experienced clinicians can interpret convergence patterns effectively when provided with clear, data-driven graphs. Such tools could therefore serve as valuable educational resources for residents and early-career ophthalmologists learning to detect subtle convergence abnormalities.
The Summary graph (Figure 3) was rated as the most informative and useful among all graphical formats, combining Pupillary Distance and ExoCounter (Figure 2b,c) data into a single, easily interpretable graph. This finding emphasises the importance of multi-parametric integration—merging spatial and dynamic signals—to support accurate perceptual decision-making.
This investigation represents the third phase in the MobileS research programme, building on earlier work that explored automated NPC detection and home-based CI training using the same platform. The current findings expand this framework to the interpretive domain, indicating that clinicians utilise AI-derived data and make more consistent judgments. These findings align with the concept of human–AI collaboration in ophthalmic diagnostics, where algorithmic analysis enhances, rather than replaces, clinician insight.
Several limitations should be outlined. First, the sample size (22 ophthalmologists) was modest, which may limit the subgroup analysis power. Nonetheless, the inclusion of residents, specialists, and subspecialists provided a representative cross-section of clinical expertise. Second, ground truth NPC and mimicker annotations were established by a single expert rater; therefore, inter-rater variability was not assessed, and rater-dependent bias cannot be excluded. Future work should include independent grading by additional clinicians and report inter-rater agreement. Third, because the modality order was fixed (videos first, then graphs) and the case order was repeated, learning or recognition effects cannot be fully excluded; future studies should counterbalance modality order and randomise case sequences. Fourth, the assessment was based on an observer-based task rather than real-time patient encounters, and confirmation in live clinical settings and larger cohorts is warranted. Finally, response time and cognitive load were not recorded; incorporating eye-tracking or workload measures could provide additional insights into perceptual efficiency.
Beyond convergence assessment, the same graph-based principles could be applied to other oculomotor domains—such as accommodation or saccadic control—potentially broadening the scope of AI-derived graphs in neuro-ophthalmology. Future studies may also examine the physiological explanation of mimickers and their relation to normal and fatigued eye movements during convergence, to extend the understanding of the underlying visual system functioning.
5. Conclusions
This study shows that AI-derived graphs are associated with higher accuracy and lower estimation error when ophthalmologists determine NPC compared with video-only review, under the study conditions. Such tools may reduce observer variability, support training, and offer practical advantages for remote monitoring. Integrating these graphs into tele-ophthalmology platforms may also reduce CI misclassification and enhance remote diagnosis, pending validation in real-world settings.
6. Patents
This work is protected by U.S. Patent Application CRML-P-047-USP, titled “System and Method for Diagnosis and Treatment of Various Movement Disorders and Diseases of the Eye.” Please note that the patent application is currently pending and has not yet been granted.
Author Contributions
Conceptualisation, A.K., S.R., H.J.-H. and I.S.; methodology, A.K., H.J.-H., S.R. and I.S.; software, A.K. and I.S.; validation, A.K. and H.J.-H.; formal analysis, A.K., H.J.-H., S.R. and I.S.; investigation, A.K. and H.J.-H.; resources, A.K., H.J.-H. and I.S.; data curation, A.K. and H.J.-H.; writing—original draft preparation, A.K.; writing—review and editing, A.K., H.J.-H., S.R. and I.S.; visualisation, A.K., H.J.-H. and I.S.; supervision, I.S.; project administration, A.K., S.R., H.J.-H. and I.S. All authors have read and agreed to the published version of the manuscript.
Funding
This research was funded by the Israel Innovation Authority, grant number 79054.
Institutional Review Board Statement
The study was conducted in accordance with the Declaration of Helsinki (0099-22-POR, Date: 6 December 2022), approved by the Ethics Committee of the Faculty of Social Science at the University of Haifa (087/22, Date: 16 March 2022), and was carried out at the ophthalmology clinic of Tzafon Medical Center.
Informed Consent Statement
Informed consent was obtained from all subjects involved in the study.
Data Availability Statement
The data presented in this study are available on request from the corresponding author due to privacy and ethical restrictions. Specifically, video recordings and patient images cannot be shared. However, other anonymised data may be provided upon reasonable request and subject to ethical approval.
Acknowledgments
We would like to thank Nitza Barkan for her assistance with statistical analysis and Mohammad Mahamid for his contributions to the development of the mobile application.
Conflicts of Interest
Ahmad Khatib, Ilan Shimshoni and Shmuil Raz are inventors on a pending U.S. patent application (CRML-P-047-USP) related to the system described in this manuscript. The authors declare no other competing interests.
Abbreviations
The following abbreviations are used in this manuscript:
| AI | Artificial Intelligence |
| CI | Convergence Insufficiency |
| NPC | Near Point of Convergence |
| PFV | positive fusional vergence |
| CISS | Convergence Insufficiency Symptom Survey |
| MobileS | Mobile application System |
| ExoCounter | Exodeviation episode’s counter |
References
- Gantz, L.; Stiebel-Kalish, H. Convergence insufficiency: Review of clinical diagnostic signs. J. Optom. 2022, 15, 256–270. [Google Scholar] [CrossRef] [Scilit]
- Rouse, M.W.; Hyman, L.; Hussein, M.; Solan, H. Frequency of convergence insufficiency in optometry clinic settings. Optom. Vis. Sci. 1998, 75, 88–96. [Google Scholar] [CrossRef] [Scilit] [PubMed]
- Rouse, M.W.; Borsting, E.J.; Lynn Mitchell, G.; Scheiman, M.; Cotter, S.A.; Cooper, J.; Kulp, M.T.; London, R.; Wensveen, J. Convergence Insufficiency Treatment Trial Group. Validity and reliability of the revised convergence insufficiency symptom survey in adults. Ophthalmic Physiol. Opt. 2004, 24, 384–390. [Google Scholar] [CrossRef] [Scilit] [PubMed]
- Eyewiki. Convergence Insufficiency. American Academy of Ophthalmology. Available online: http://eyewiki.aao.org/Convergence_Insufficiency (accessed on 14 March 2026).
- Neely, J. The RAF near-point rule. Br. J. Ophthalmol. 1956, 40, 636. [Google Scholar] [CrossRef] [Scilit] [PubMed]
- Siderov, J.; Chiu, S.C.; Waugh, S.J. Differences in the near point of convergence with target type. Ophthalmic Physiol. Opt. 2001, 21, 356–360. [Google Scholar] [CrossRef] [Scilit]
- Scheiman, M.; Mitchell, G.L.; Cotter, S.; Cooper, J.; Kulp, M.; Rouse, M.; Borsting, E.; London, R.; Wensveen, J. Convergence Insufficiency Treatment Trial (CITT) Study Group. A randomized clinical trial of treatments for convergence insufficiency in children. Arch. Ophthalmol. 2005, 123, 14–24. [Google Scholar] [CrossRef] [Scilit]
- Gallaway, M.; Scheiman, M.; Malhotra, K. The effectiveness of pencil pushups treatment for convergence insufficiency: A pilot study. Optom. Vis. Sci. 2002, 79, 265–267. [Google Scholar] [CrossRef] [Scilit]
- Convergence Insufficiency Treatment Trial Study Group. Randomized clinical trial of treatments for symptomatic convergence insufficiency in children. Arch. Ophthalmol. 2008, 126, 1336–1349. [CrossRef] [Scilit]
- Scheiman, M.; Kulp, M.; Cotter, S.; Mitchell, G.L.; Rouse, M.; Hertle, R.; Cooper, J.; Coulter, R.; Gallaway, M.; Hopkins, K.; et al. Long-term effectiveness of treatments for symptomatic convergence insufficiency in children. Optom. Vis. Sci. 2009, 86, 1096–1103. [Google Scholar] [CrossRef] [Scilit]
- Subbiah, A.; Aik, K.L.T.; Kumar, B.K. Mobile Health Diagnostics for Accommodative Dysfunction: Leveraging Handheld Device Technology for Near Point of Convergence Testing. In Proceedings of the IEEE International Colloquium on Signal Processing & Its Applications (CSPA), Pulau Pinang, Malaysia, 7–8 February 2025; pp. 277–282. [Google Scholar]
- Sharma, M.; Jain, N.; Ranganathan, S.; Sharma, N.; Honavar, S.G.; Sharma, N.; Sachdev, M.S. Tele-ophthalmology: Need of the hour. Indian J. Ophthalmol. 2020, 68, 1328–1338. [Google Scholar] [CrossRef] [Scilit]
- Woodward, M.A.; Ple-Plakon, P.; Blachley, T.; Musch, D.C.; Newman-Casey, P.A.; De Lott, L.B.; Lee, P.P. Eye care providers’ attitudes towards tele-ophthalmology. Telemed. e-Health 2015, 21, 271–273. [Google Scholar] [CrossRef] [Scilit] [PubMed]
- John, S.; Sengupta, S.; Reddy, S.J.; Prabhu, P.; Kirubanandan, K.; Badrinath, S.S. The Sankara Nethralaya mobile teleophthalmology model for comprehensive eye care delivery in rural India. Telemed. e-Health 2012, 18, 382–387. [Google Scholar] [CrossRef] [Scilit]
- Vinekar, A.; Jayadev, C.; Mangalesh, S.; Shetty, B.; Vidyasagar, D. Role of tele-medicine in retinopathy of prematurity screening in rural outreach centers in India—A report of 20,214 imaging sessions in the KIDROP program. In Seminars in Fetal and Neonatal Medicine; WB Saunders: Orlando, FL, USA, 2015; Volume 20, pp. 335–345. [Google Scholar]
- Nikolaidou, A.; Tsaousis, K.T. Teleophthalmology and artificial intelligence as game changers in ophthalmic care after the COVID-19 pandemic. Cureus 2021, 13, e16392. [Google Scholar] [CrossRef] [Scilit]
- Ignatowicz, A.A.; Marciniak, T.; Marciniak, E. AI-Powered Mobile App for Nuclear Cataract Detection. Sensors 2025, 25, 3954. [Google Scholar] [CrossRef] [Scilit]
- Nagino, K.; Sung, J.; Midorikawa-Inomata, A.; Eguchi, A.; Fujimoto, K.; Okumura, Y.; Miura, M.; Yee, A.; Hurramhon, S.; Fujio, K.; et al. Clinical utility of smartphone applications in ophthalmology: A systematic review. Ophthalmol. Sci. 2024, 4, 100342. [Google Scholar] [CrossRef] [Scilit] [PubMed]
- Li, S.; Tang, A.; Yang, B.; Wang, J.; Liu, L. Virtual reality-based vision therapy versus OBVAT in the treatment of convergence insufficiency, accommodative dysfunction: A pilot randomized controlled trial. BMC Ophthalmol. 2022, 22, 182. [Google Scholar] [CrossRef] [Scilit]
- Islam, T.; Roy, A.D. A virtual approach: Systematic review and meta-analysis of virtual reality-based therapies for convergence insufficiency. J. Optom. 2025, 18, 100540. [Google Scholar] [CrossRef] [Scilit]
- Khatib, A.; Raz, S.; Nasser, H.; Jabaly-Habib, H.; Shimshoni, I. AI-powered smartphone diagnostics for convergence insufficiency. J. Clin. Transl. Ophthalmol. 2024, 3, 8. [Google Scholar] [CrossRef] [Scilit]
- Andrienko, N.; Andrienko, G.; Adilova, L.; Wrobel, S. Visual analytics for human-centered machine learning. IEEE Comput. Graph. Appl. 2022, 42, 123–133. [Google Scholar] [CrossRef] [Scilit] [PubMed]
- Holzinger, A.; Langs, G.; Denk, H.; Zatloukal, K.; Müller, H. Causability and explainability of artificial intelligence in medicine. Wiley Interdiscip. Rev. Data Min. Knowl. Discov. 2019, 9, e1312. [Google Scholar] [CrossRef] [Scilit] [PubMed]
- Lee, M.H.; Chew, C.J. Understanding the effect of counterfactual explanations on trust and reliance on ai for human-ai collaborative clinical decision making. Proc. ACM Hum.-Comput. Interact. 2023, 7, 1–22. [Google Scholar] [CrossRef] [Scilit]
- Maleki, M.; Ghahari, S.A. Multimodal Generative AI in Diagnostics: Bridging Medical Imaging and Clinical Reasoning. Preprints.org 2025. Available online: https://www.preprints.org/manuscript/202508.1425/v1 (accessed on 14 March 2026).
- Dagnaw, G.H.; Zhu, Y.; Maqsood, M.H.; Yang, W.; Dong, X.; Yin, X.; Liew, A.W. Explainable artificial intelligence in biomedical image analysis: A comprehensive survey. arXiv 2025, arXiv:2507.07148. [Google Scholar] [CrossRef] [Scilit]
- Chen, J.; Yuan, X.L.; Liao, Z.; Zhu, W.; Zhou, X.; Duan, X. Research Trends and Hotspots of Big Data in Ophthalmology: A Bibliometric Analysis and Visualization. Semin. Ophthalmol. 2025, 40, 210–222. [Google Scholar] [CrossRef] [Scilit]
- Röhlig, M.; Nonnemann, L.; Schulz, H.J.; Stachs, O.; Schumann, H. Towards a Unified User Interface for Visual Analysis of Retinal Data in Ophthalmology. arXiv 2023, arXiv:2301.01840. [Google Scholar] [CrossRef] [Scilit]
- Blignaut, P.; van Rensburg, E.J.; Oberholzer, M. Visualization and quantification of eye tracking data for the evaluation of oculomotor function. Heliyon 2019, 5, e01127. [Google Scholar] [CrossRef] [Scilit] [PubMed]

Disclaimer/Publisher’s Note: The statements, opinions and data contained in all publications are solely those of the individual author(s) and contributor(s) and not of MDPI and/or the editor(s). MDPI and/or the editor(s) disclaim responsibility for any injury to people or property resulting from any ideas, methods, instructions or products referred to in the content. |
© 2026 by the authors. Licensee MDPI, Basel, Switzerland. This article is an open access article distributed under the terms and conditions of the Creative Commons Attribution (CC BY) license.