


Abstract
Background: Given global population growth and aging, it is imperative to prioritize early eye disease detection and treatment. However, as patient volume increases, providers are facing a shortage of workforce capacity, particularly in areas where eye doctors are already scarce, making it important to consider alternative innovative solutions that could help increase eye screening capabilities. This study compared virtual reality (VR) platform of vision screening exams that are used to evaluate ocular health, such as 24-2 perimetry, Ishihara tiles, and the Amsler grid, against their in-clinic counterparts. Methods: A total of 86 subjects were recruited from Mount Sinai’s ophthalmology clinic (New York, USA) for a comparison trial that was internally controlled across healthy eyes and those with glaucoma and retinal diseases. VR and in-office tests were administered to the patients during their clinical visit, including 24-2 perimetry, Ishihara tiles, and the Amsler grid in a randomized order, and the results were compared for each test. Results: Perimetry results from Humphrey Visual Field Analyzer (HVFA) and VR suprathreshold testing demonstrated a good sensitivity both overall (80% OD, 84% OS) and across control (86% OD, 89% OS), glaucoma (69% OD, 78% OS), and retinal disease (76% OD, 80% OS) groups. A Garway-Heath anatomical map showed an overall 70–80% agreement. Ishihara plate tests did not show a significant difference between the two testing modalities (p = 0.12; Mann–Whitney U test), which remained true across all groups. Amsler grid testing differences were also non-significant within each subgroup (p = 0.81; Mann–Whitney U test). Patient time required to complete VR exams was significantly improved (p < 0.0001; Welch’s t-test) compared to the clinical standard tests. Conclusions: All VR-based exams tested in this study showed high sensitivity and percent agreement when compared to their in-office standards. Given the results of this study, VR has a promising potential in visual function screening, which, in addition to its portable design and easy use, could assist eye doctors in screening for prevalent diseases such as glaucoma and retinal conditions. Translational Relevance: VR-based vision exams that test vision fields, color vision and visual distortions provide comparable results in healthy patients, as well as those with glaucoma and retinal diseases, indicating its potential as a screening technology for different ocular pathologies. Given VR’s portable and low-profile features, it is important to consider leveraging VR to augment delivery of vision care.
1. Introduction
A general lack of vision specialists and a growing need for vision care that was accentuated by the COVID-19 pandemic contributes to a rising prevalence of undiagnosed, advanced vision disorders [1,2,3,4,5]. In the United States alone, it is estimated that 1.5 and 2 percent of the 40+ year-old population suffers from age-related macular degeneration (AMD) and glaucoma, respectively [6,7]. In the developing world, CMV retinitis presents a high disease burden with 5–15% of those afflicted developing blindness [8]. Furthermore, lower socioeconomic status has been associated with more advanced visual function loss in glaucoma and AMD at the time of diagnosis [9,10,11]. Local availability of specialized vision testing leads to faster disease identification/awareness and successful treatment of retinal diseases like diabetic retinopathy (DR) and AMD [12].
Several studies have demonstrated the clinically meaningful benefits of empowering adult vision screening or monitoring in a primary care or community setting, particularly in identifying progressive diseases that could require ophthalmic interventions, such as glaucoma, DR, and AMD [13,14]. The benefits of implementing each test independently for a more comprehensive eye examination in a primary care setting have been variable. For example, mixed outcomes have been found for acuity testing in underserved or older populations [15,16,17,18]. However, screening tools that are used to help detect vision impairment to ensure early-stage treatment have shown promise. Such tests range from relatively sophisticated technologies, such as tonometers, to growingly available functional technologies, such as perimetry and Amsler grid tests [19,20,21,22,23,24]. Benefits have also been observed from early treatment and identification of AMD and DR using manual ophthalmoscopy or portable fundus photography and Amsler grid testing [25].
Given that many neurologic and endocrine conditions can present with ocular manifestations, multimodal vision testing tools, such as color vision and scotoma testing, can enhance screening potential for these conditions, which have also been incorporated in the study [26]. As with the ophthalmic diseases discussed above, non-ocular conditions such as multiple sclerosis, pseudotumor cerebri, cerebral neoplasms, and cerebrovascular events have a higher rate of treatment success with early detection and treatment.
Performing rapid vision testing across various clinical environments requires a portable, fast, and easy-to-use technology that allows administration of several vision function exams from the same device [12]. Such technological advancements have been explored on virtual reality, augmented reality, and smartphone-based platforms [27,28]. What remains to be explored is how integrating a series of retinal health screening exams into one platform allows for multimodal functional testing that can localize abnormalities to a specific anatomical area of the eye while allowing for improved user feasibility within a single device platform.
Ophthalmic tests have successfully been adopted on portable devices such as tablets and virtual reality (VR) headsets [29,30,31,32,33]. To contribute to this progress, our research group developed a platform that provides a comprehensive vision screening method to evaluate retinal health by developing a battery of VR vision tests that are analogous to ophthalmic in-office tests. This study compares the performance of VR analogues (24-2 suprathreshold perimetry, Ishihara tiles, and the Amsler grid) against their in-office standards to demonstrate that VR’s results are non-inferior. The tests selected for the platform were in part due to their frequent use in clinical settings, as described above, and also for the feasibility of their design in the VR environment. The primary outcome measure of this study was evaluating outcome similarities between each modality in healthy eyes, as well as those with glaucoma and retinal abnormalities. The secondary outcome was the test time necessary to complete the perimetry exam.
2. Materials and Methods
2.1. Overall Study Design
This was a single-center randomized clinical trial following the recommendations of the Consolidated Standards of Reporting Trials (CONSORT) (Supplementary Material S1). This study was approved by the Institutional Review Board (IRB) of the Icahn School of Medicine at Mount Sinai in New York, USA (IRB #19-00679, 29 August 2019), and registered on clinicaltrials.gov (NCT04714424, registration date 19 January 2021). Patient recruitment was conducted at the Mount Sinai 102nd Street Ophthalmology Clinic on a voluntary basis with randomization by sequential numbering of either the clinical gold standard exams followed by the VR counterpart or vice versa. This clinical space was utilized in our trial to obtain HVFA perimetry testing results and to recruit patients with known ocular pathology. On a clinic day, a researcher would come in to recruit patients by handing out flyers to patients older than 21 years old. The remaining inclusion criteria were otherwise left broad as we were preliminarily assessing how a VR platform of tests compares to clinical analogues. Only patients scheduled to receive HVFA perimetry that day were approached for VR study recruitment due to the clinical workflow structure. The exclusion criteria for the study were seizure disorder, vertigo, and imbalance, which are the commonly listed precautions for people using VR headsets. The recruitment took place from September 2022 until September 2023. Patients were then stratified into either healthy controls or disease groups for a glaucoma or retinal disease diagnosis. The glaucoma group consists of mild, moderate, and severe stages of primary open angle glaucoma. The retinal disease group included patients with macular degeneration, diabetic retinopathy, retinal tears, retinal detachments, retinal scars, and macular changes. Each condition was identified based on the diagnostic codes and billing in the chart based on the prior diagnosis by an ophthalmology provider. While the purpose of the study was not to demonstrate diagnostic utility of VR in each of these conditions, patients were grouped by overall structural involvement of the disease for data analysis. Patients with both glaucoma and retinal disease diagnoses (N = 6 patients) were included in each disease group. Table 1 breaks these groups down by age, gender and ethnicity.
Table 1.
A demographic breakdown of study participants’ subgroups.
The visual acuity was recorded from their measured visual acuity by the technician that same visit. The LogMAR acuity equivalents ranged from 0 to 1 for the normal group (mean 0.2; s.d. 0.3); 0–1 for glaucoma group (mean 0.3; s.d. 0.3); and 0–1.3 for the retina group (mean 0.16; s.d. 0.3), indicating comparable visual acuity between each group.
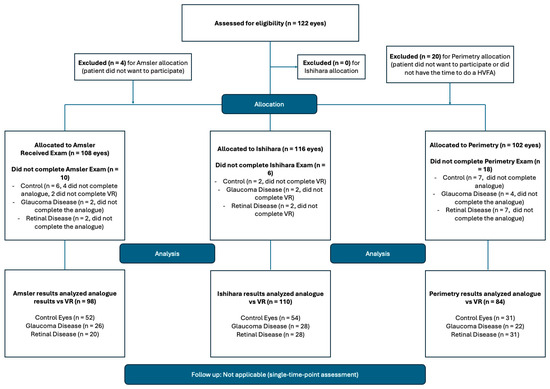
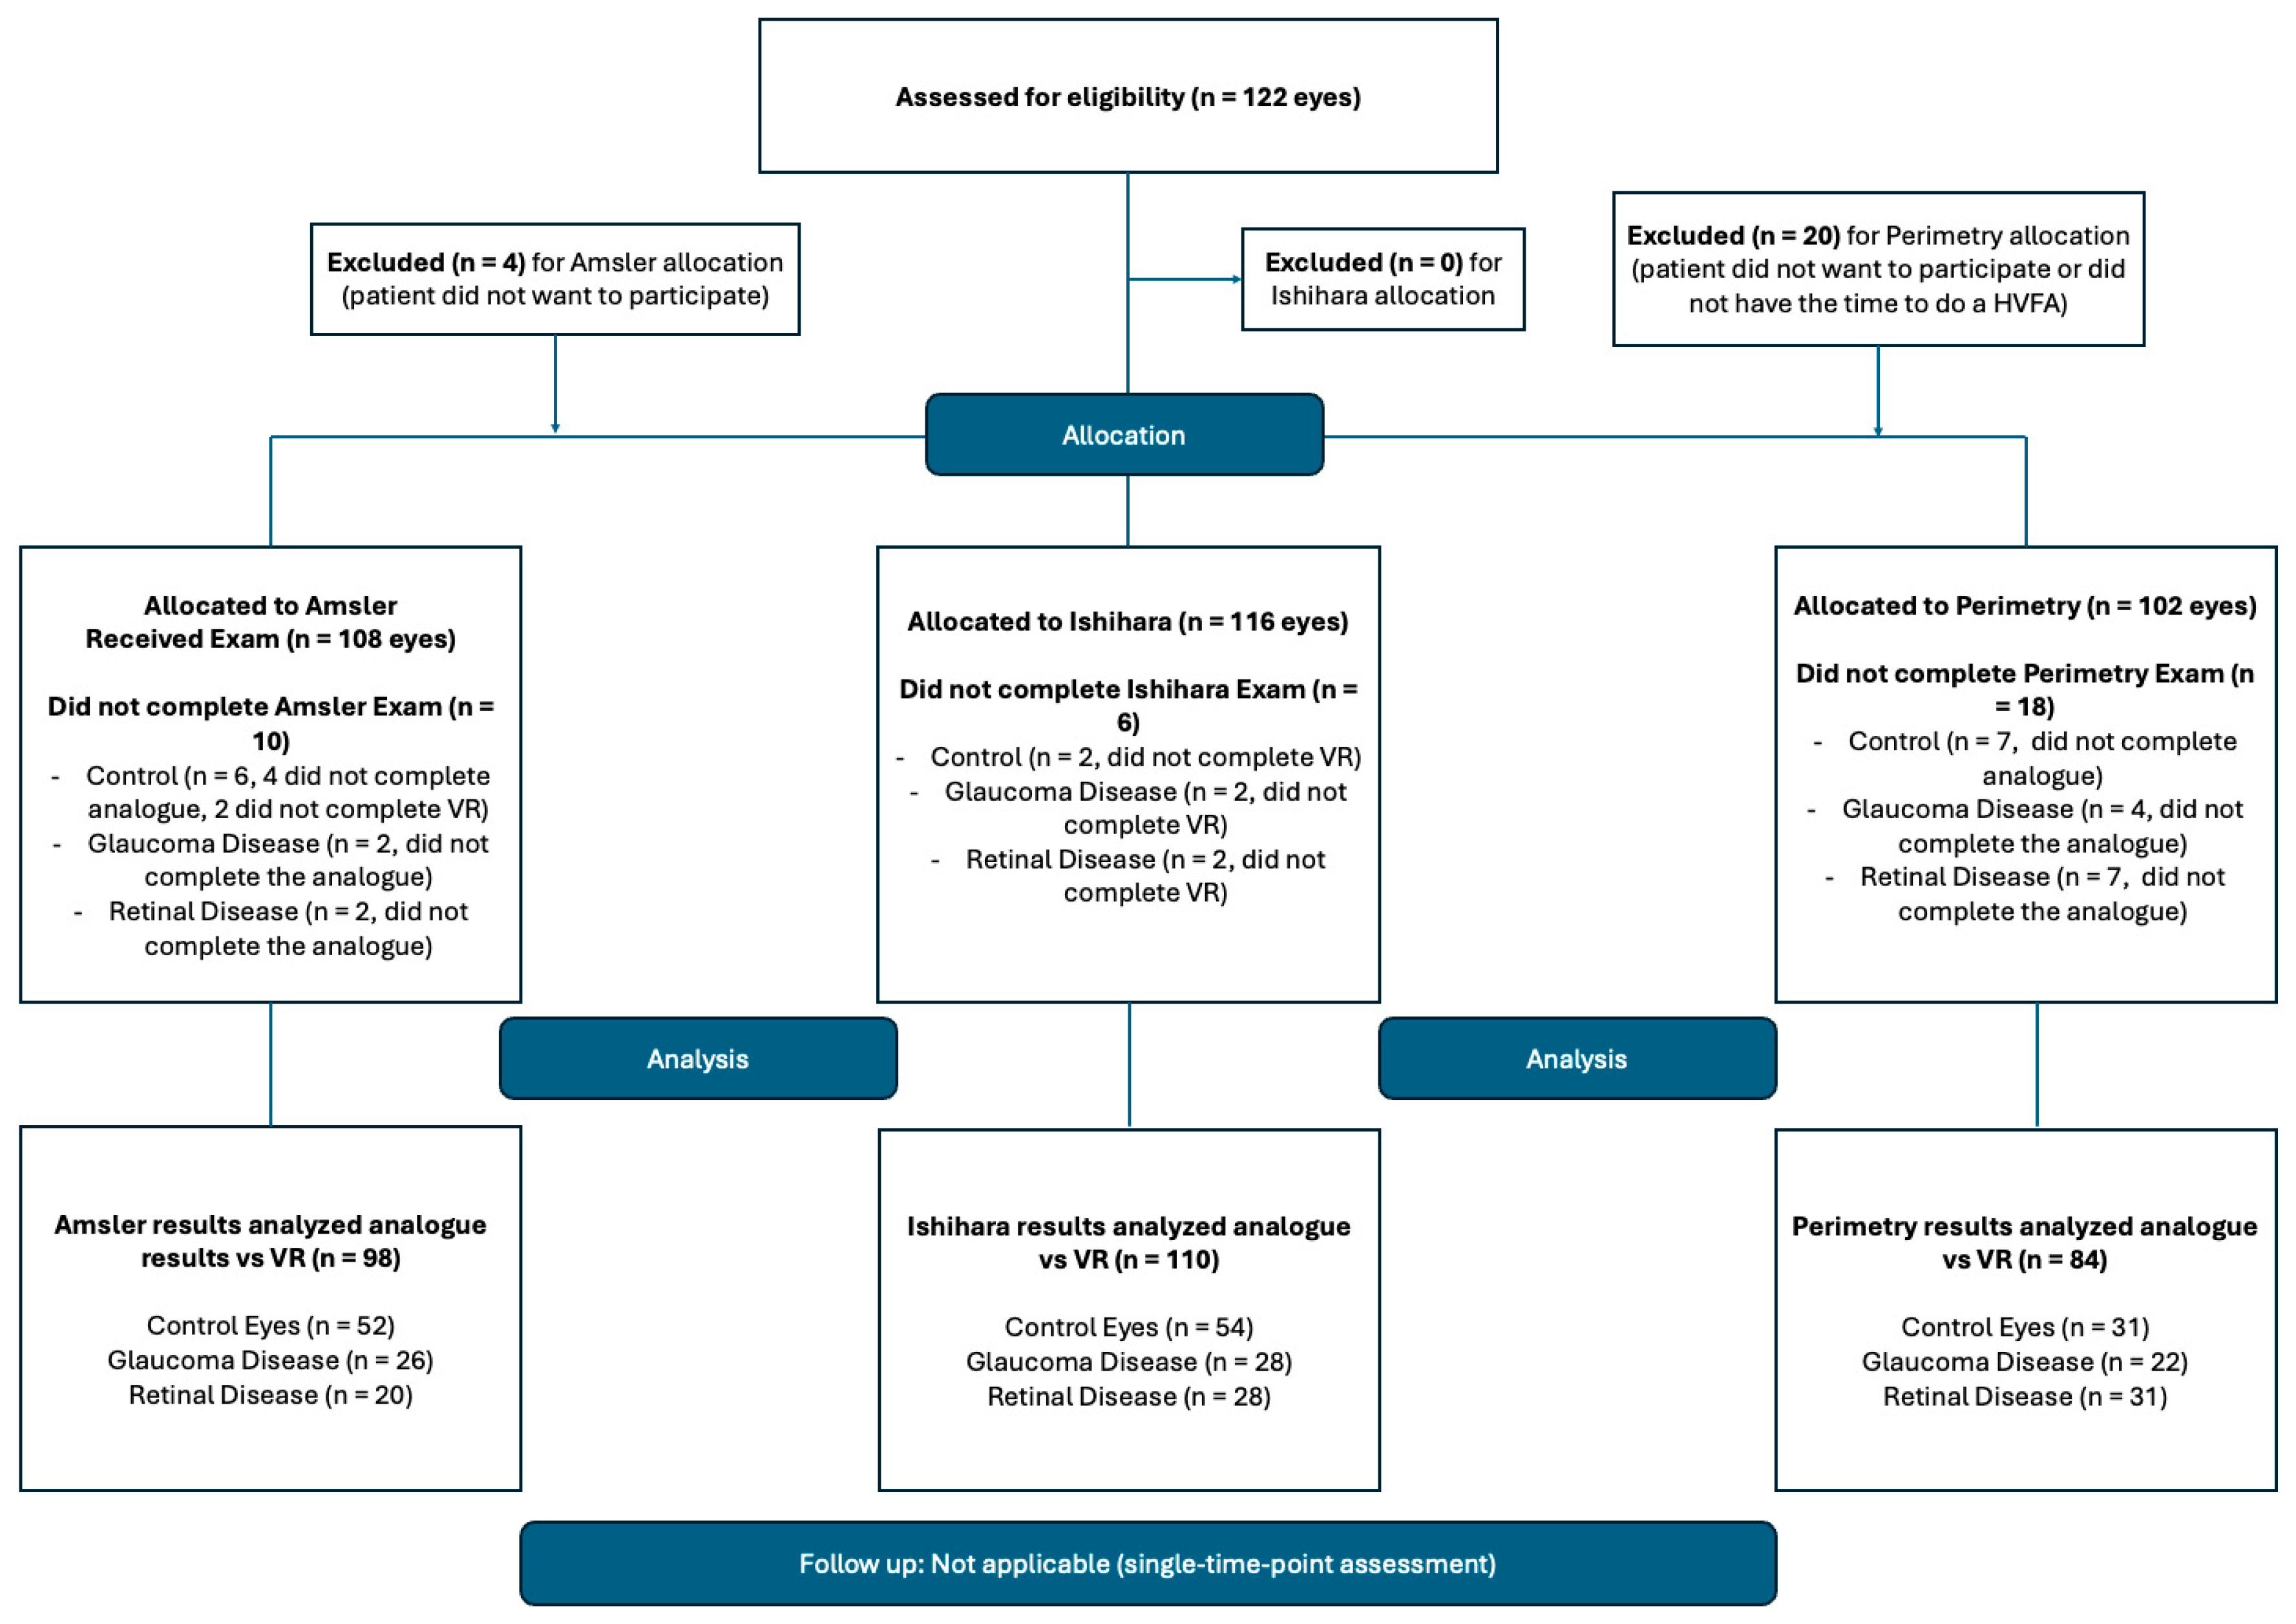
Due to factors such as time-restraints or workflow restrictions, not all patients completed all three exams (both in-clinic and VR analogues), which impacted the number of participants per test. The length of the study and test fatigue impacted the patients’ ability to complete the entire study, leading to missing data. A comprehensive diagram of the patient data funnel is shown in Figure 1, including data that was missing, most of which was perimetry data, as it was the lengthiest exam in the series. The sample size was determined based on the prior published literature on portable perimetry testing [27,28]. Patients’ data were only included for a particular test if they completed both the in-office and VR versions. The time taken to complete perimetry testing was recorded automatically by the Humphrey and VR devices.
Figure 1.
Participant Recruitment Flow Diagram. A breakdown of patients recruited and the data collected for perimetry, Ishihara, Amsler tests. Boxes on the right summarize data gaps that were mostly due to lack of clinical indication for binocular testing. In this figure, virtual delivery of exams is denoted by “VR”, and in-clinic exams are referred to as “analogue”. The “total eyes” account for each test per eye that the research subjects completed.
2.2. VR Hardware and Software
A PICO Neo Eye 2 (Pico, ByteDance, Beijing, China) commercial VR headset was used to demonstrate the hardware-agnostic performance of the three VR tests. This headset has a 4K screen resolution and a 3840 × 2160 LCD display, two controllers that are based on sensor fusion of electromagnetic and inertial measurement units, and Tobii eye tracking (Tobii, Danderyd, Sweden), including its intrinsic calibration feature. Eye-tracking capabilities are essential for ensuring that the patient’s gaze stays focused on the central target, thereby producing reliable visual field perimetry results. Software was written in Unity Version 2020.3.2.f1 with SDKs on software websites. Tobii eye-tracking technology and SDKs were implemented. Steam VR was used to monitor the progress of the patient during VR testing. For patients with significant eye deviation of 6 degrees or greater, which is the distance between the two stimuli points, the vision field testing was repeated. Patients used their maximal corrected vision acuity when undergoing testing by wearing their own glasses inside the VR headset, which has enough distance between the frame of the headset and the screen to accommodate for glasses. At any time, the patient could terminate the exam if they experienced any discomfort.
2.3. In-Office Test Analogues
A full-threshold and suprathreshold 24-2 perimetry test was conducted on a Humphrey Visual Field Analyzer (HVFA) by trained technicians as part of the patient’s scheduled visit. HVFA is a widely recognized clinical standard of glaucoma diagnosis and monitoring. Patients were provided with the appropriate refractive correction for each test. While the comparison of a full-threshold 24-2 perimetry to a suprathreshold VR 24-2 one is not a true direct comparison, our group prioritized the effect of increased speed during examination on sensitivity of the test outcomes. In terms of reliability of results, only data within established parameters of false positive and false negative stimuli selection below 33% and fixation loss below 20% were used in analysis, and patients were asked to retake the test if it was not reliable. Furthermore, this comparison was more conservative in assessing the performance of our 24-2 suprathreshold perimetry, as the full-threshold HVFA assesses the same point in the visual field several times, while the suprathreshold assesses a point once, reducing the likelihood of positive sensitivity at each point. For red–green color deficit testing, red–green color and control tiles from a physical Ishihara book were used, an established clinical standard for color vision testing. In metamorphopsia testing, we used the Amsler grid, which has been referred to as the clinical standard. A paper form and pen were given to a participant to draw or circle any abnormalities, such as distortions, holes, vision gaps, and wavy lines. All results were securely uploaded and encrypted on a folder with patients de-identified.
2.4. Design of VR Tests
2.4.1. 24-2 Perimetry Testing
The VR analogue for the 24-2 perimetry test (VR 24-2) was designed with an unchanging stimulus intensity at 25 Apostilibs with 15 non-stimulus points (a point not displayed on the VR headset) of 2 × 2 pixels, testing each point only once. The points were mapped in accordance with the 24-2 degrees from the center to minimize the time required to complete the exam. The results of VR 24-2 were compared to Humphrey results on a point-by-point analysis to determine % agreement. Eye tracking deviation calibration was performed to equivocate Unity meters to degrees. The four cardinal positions of gaze (left, right, top, bottom) were determined to be 0.4 Unity meters in each direction of the 24-degree field, and thus each 0.1 Unity meter is about 6 degrees, which is an approximate area of the blind spot. The degrees of VR testing points were mapped to be identical to the HVFA 24-2 distribution. Thus, any gaze deviation > 0.1 Unity meters was considered a true deviation. Participants were asked to retake the test if their gaze deviation time exceeded 20%. Each VR output was screened for reliability in terms of false positive and false negative stimulus response, and those outside of the 30% margin were asked to repeat the test. A Garway-Heath Analysis was applied to both 24-2 perimetry results to further characterize the VR analogue’s performance based on optical nerve fibers and percent agreement with Humphrey 24-2 results.
Patients were encouraged to undergo perimetry testing of both eyes; however, due to time constraints or workflow restrictions, many patients could only perform the test on one eye. To perform the test, participants used a VR controller and pressed the trigger in order to select the flashing light stimulus that appeared on the VR screen.
2.4.2. Ishihara Plates
For color deficit testing, a standard red–green/control 12-tile screening was implemented under pre-set VR illumination conditions similar to an office setting, and results were quantified using a light meter. Both the PICO and the VIVE headsets (VIVE, HTC, Taiwan) at white-light settings on maximum brightness resulted in outputs of around 250 units, which was confirmed with a luminometer and consistent across the screen. Specific tiles testing for red–green color blindness were the focus of analysis rather than magenta–grey controls for a diseased state. Numeric answer choices were presented in a multiple-choice format. Patients used the controller in a virtual environment to select the correct Ishihara plate from options provided on the bottom of the screen to match the plate shown on top of the screen.
2.4.3. Amsler Grid
A virtual pen and standard Amsler grid were provided in a virtual environment, with any dysmorphia counting as an abnormal result. The total amount of visible squares in a 20 × 20 grid was calculated for comparison. The patients were asked to either color in or circle grid areas with wavy lines, distortions or spots by bringing the pointer of the controller to the area of distortion and outlining it while pressing on the trigger. Each patient was able to practice using a drawing tool on a sample screen prior to beginning the test.
2.5. Statistical Analysis
All statistical analyses were conducted in R-4.0.4. Perimetry percent agreement graphs were made with the ggplot2 package and qplot function in R, with sensitivity and specificity calculations used to assess statistical differences in perimetry results between modalities. Mann–Whitney-U (with an alpha value set to 0.05), sensitivity, specificity and accuracy calculations were used to determine the statistical differences for Ishihara tile and Amsler grid tests. Welch’s t-tests were used to compare HVFA testing times against those of VR 24-2.
3. Results
For each exam tested, the patient population was grouped by diagnoses they had already received to demonstrate testing comparisons across conditions such as glaucoma and retinal diseases. While the intention was not to demonstrate diagnostic accuracy, each test was compared between VR and in-office tests for healthy controls and study subjects with established diagnoses. When analyzing all results, perimetry testing was 82% sensitive and 50% specific (N = 84 eyes). Ishihara plates were 100% sensitive and 79% specific (N = 110 eyes), while the Amsler grid was 100% sensitive and 98% specific across all participants (N = 98 eyes). In subsequent sections, these results are broken down for each test and based on previously diagnosed diseases to see how VR analogs compare to the in-office clinical standards.
3.1. Perimetry
A total of 84 eyes completed both VR and HVFA 24-2 perimetry; their results showed 80% sensitivity and 42% specificity in the right eye (n = 43 eyes) and 84% sensitivity and 59% specificity in the left eye (n = 41 eyes) compared with HVFA results (Table 2). When stratified by control (86% OD, n = 16 eyes; 89% OS, n = 15 eyes), glaucoma (69% OD, n = 11 eyes; 78% OS, n = 11 eyes), and retinal disease (76% OD, n = 16 eyes; 80% OS, n = 15 eyes) groups, the sensitivity remained high (Table 2).
Table 2.
Garway-Heath sensitivity and specificity values for all eyes (total = 84 eyes), controls (N = 31 eyes), and those with glaucoma (N = 22) and retinal diseases (N = 31 eyes).
VR outputs underwent Garway-Heath sectorization analysis, which is a way to anatomically demarcate the retina and to build archetypes for disease-specific patterns. Sensitivity varies by structural region, with all the outcomes listed in Table 2. It is important to note that the quadrant with highest percent sensitivity at a 25 Apostilibs threshold is the central part of the retina for the overall (92% OD, 96% OS), control (96% OD, 99% OS), glaucoma (82% OD, 93% OS), and retinal disease (94% OD, 96% OS) groups. With an overall agreement of U = 264, p = 0.63 between control and glaucoma and U = 269, p = 0.7 between control and retina groups.
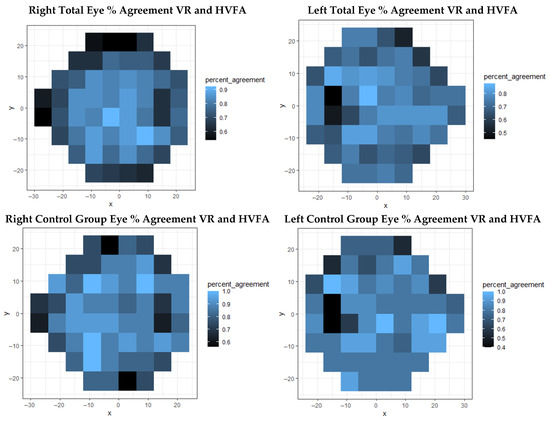
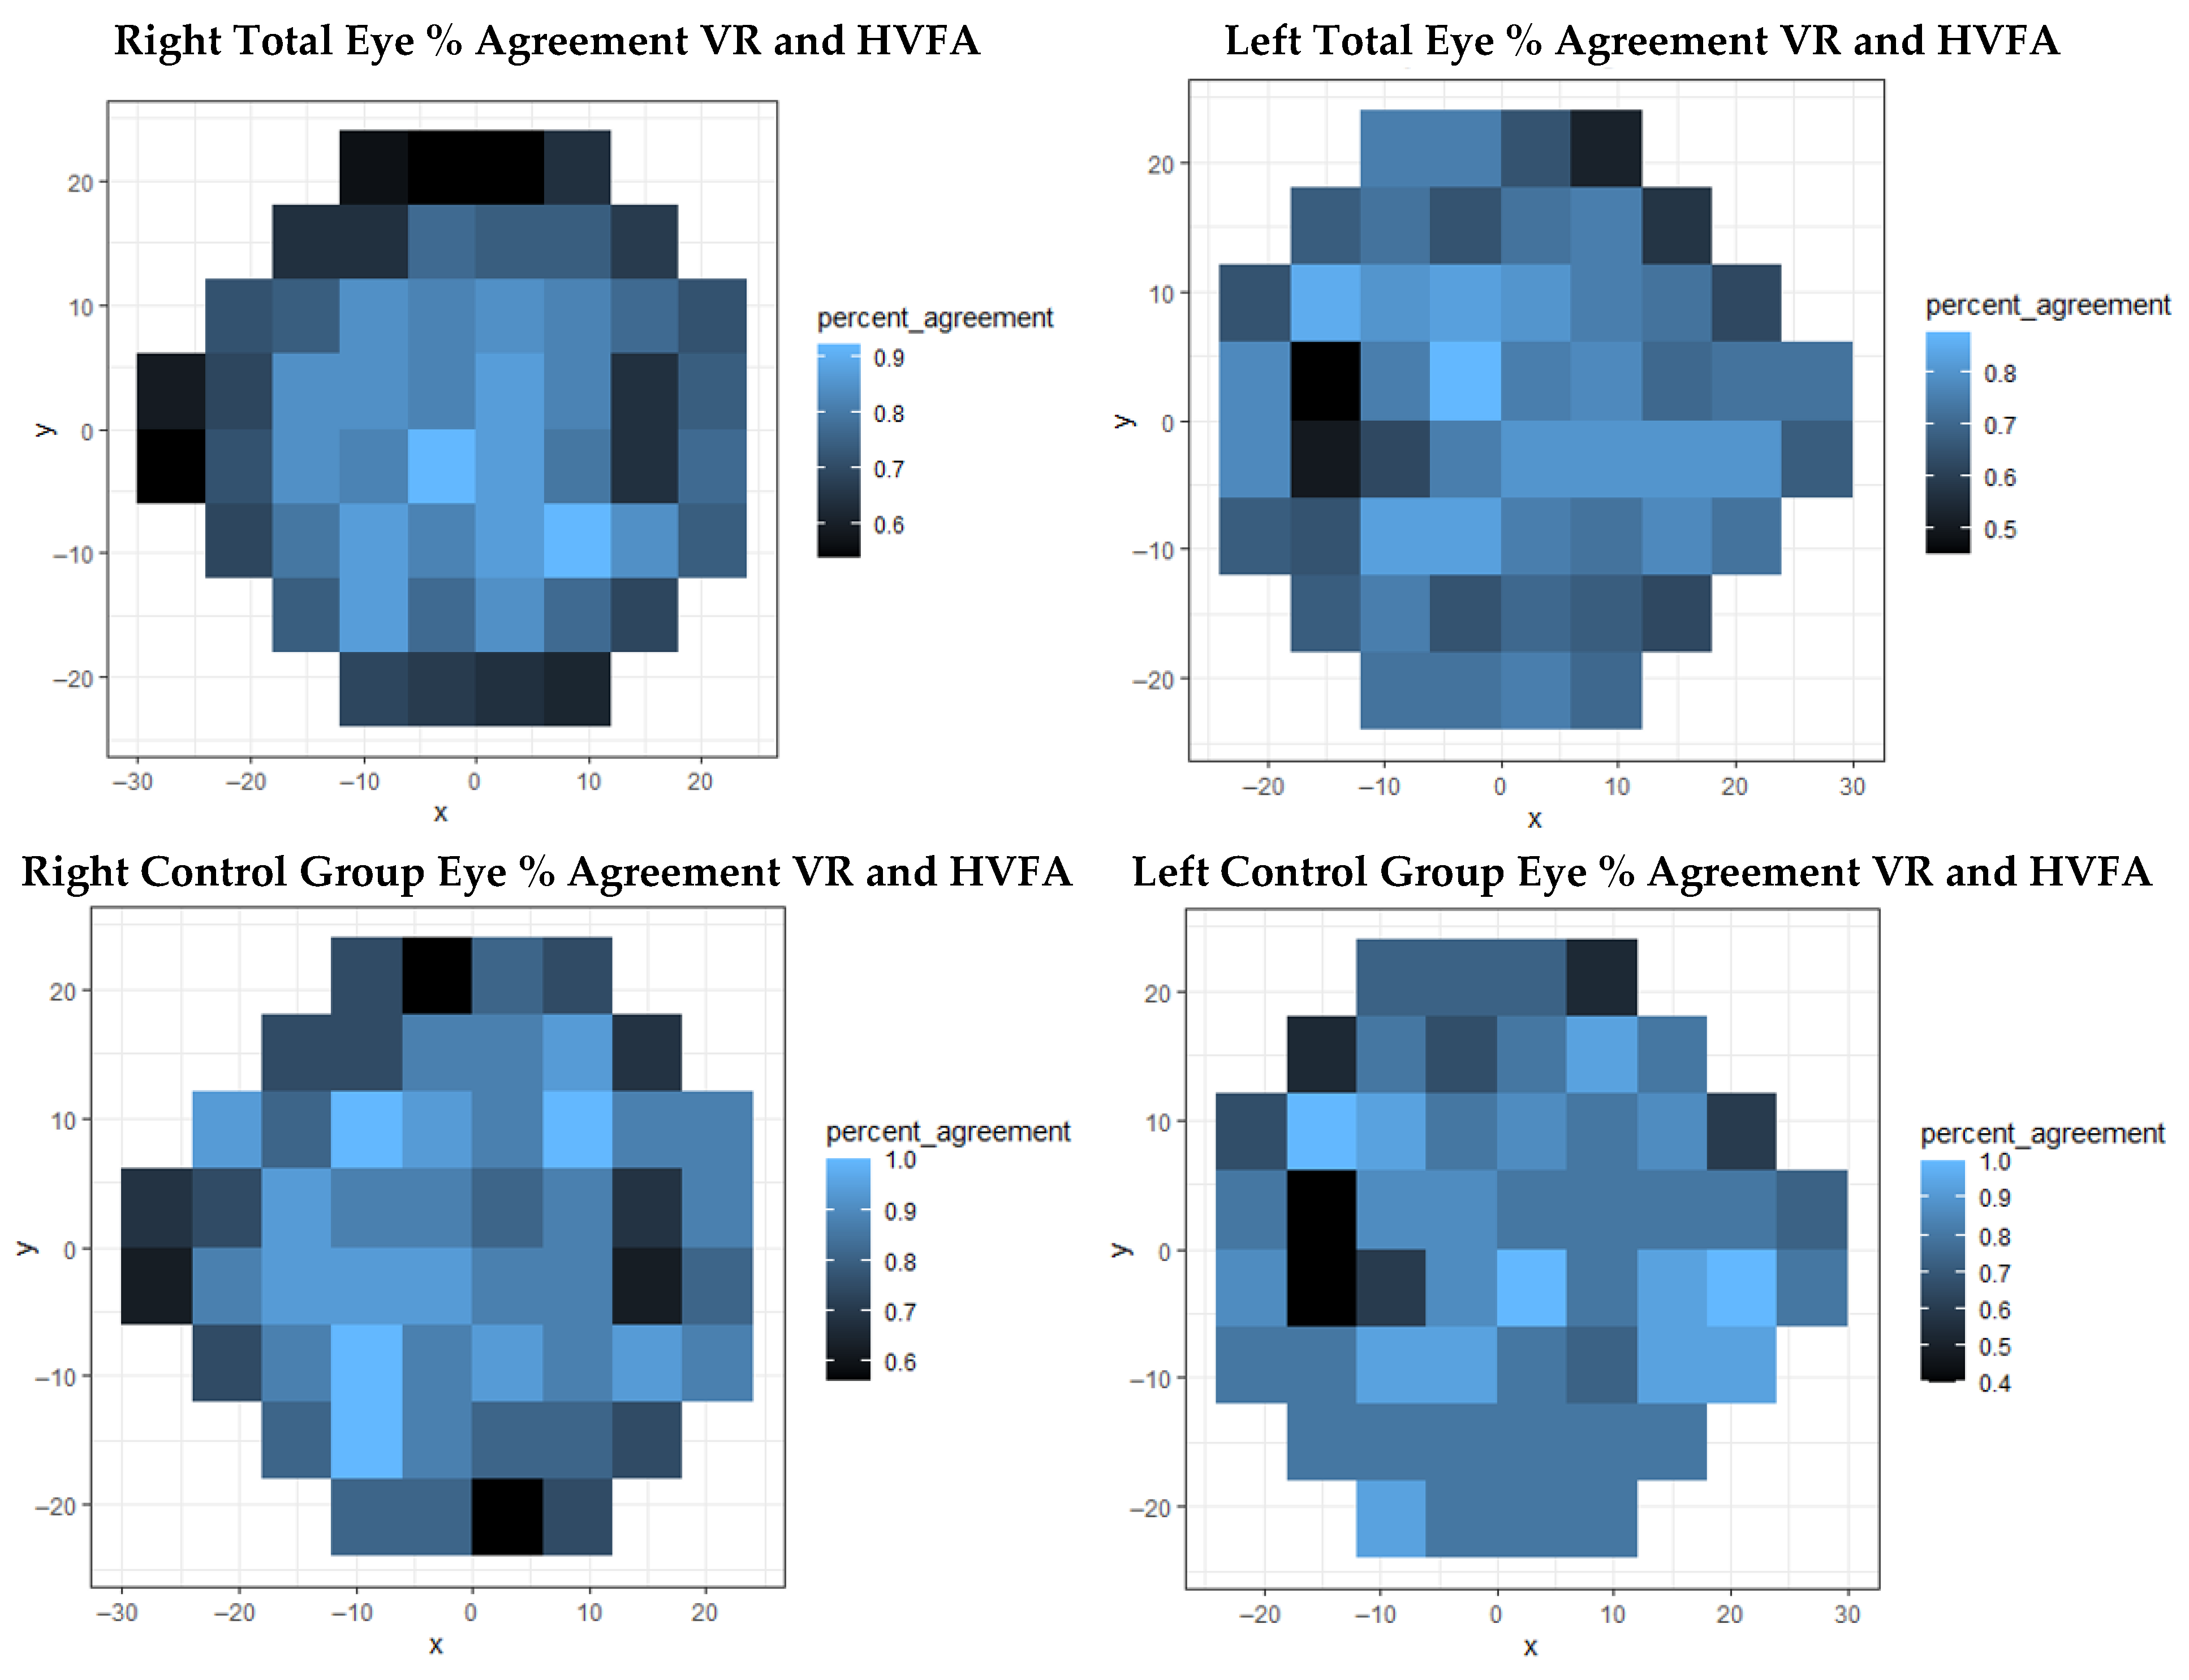
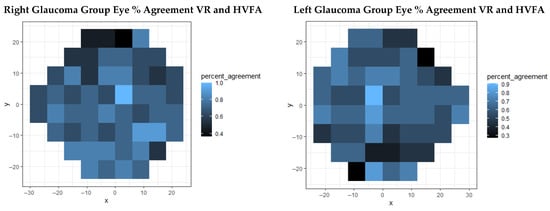
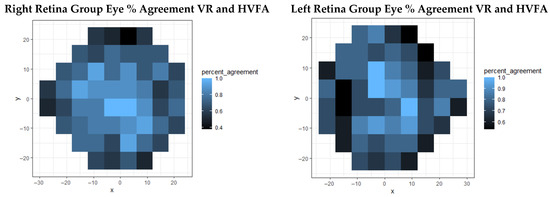
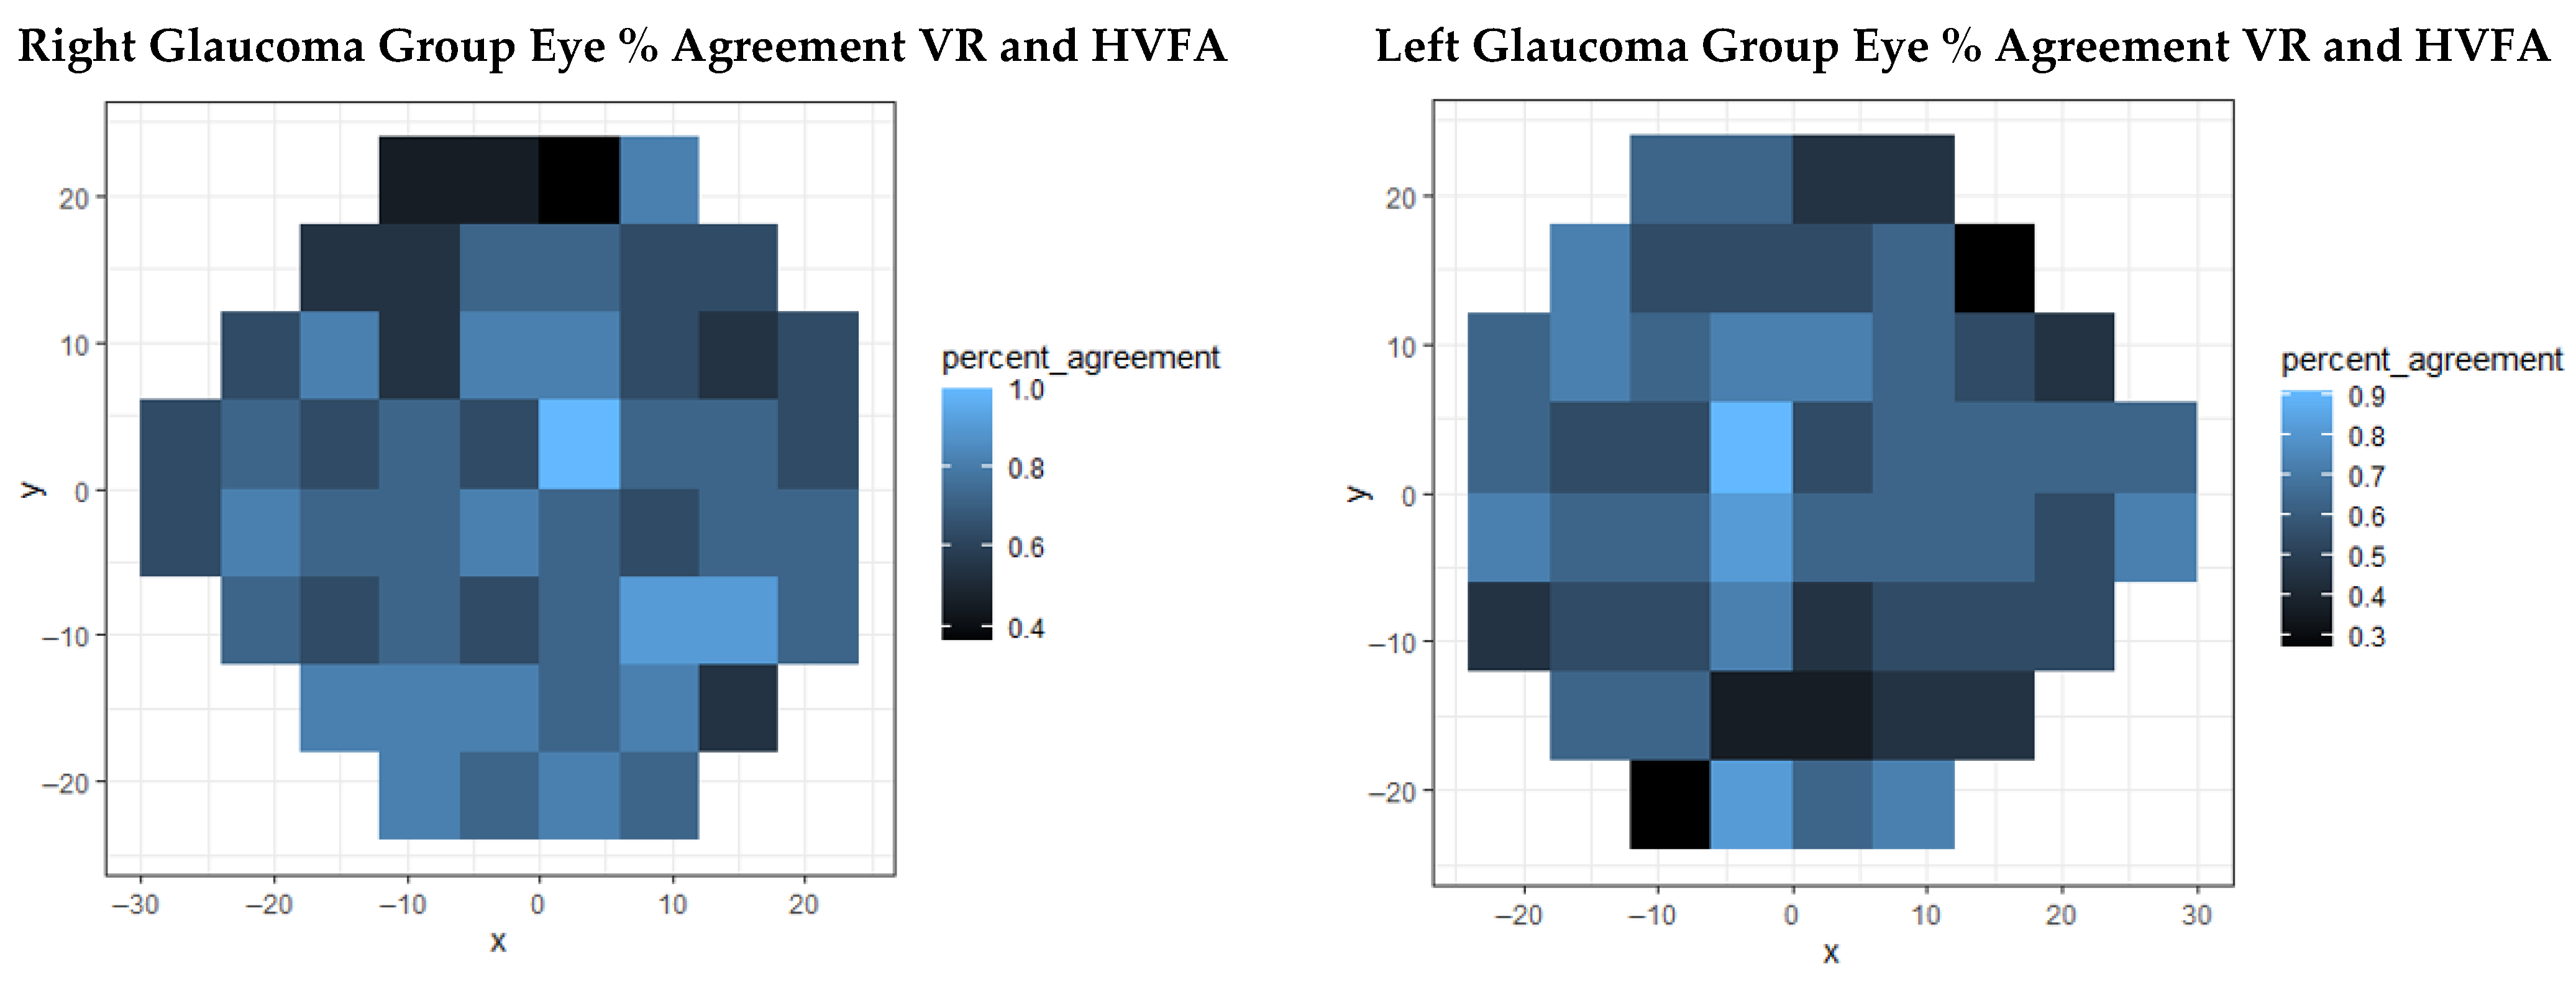
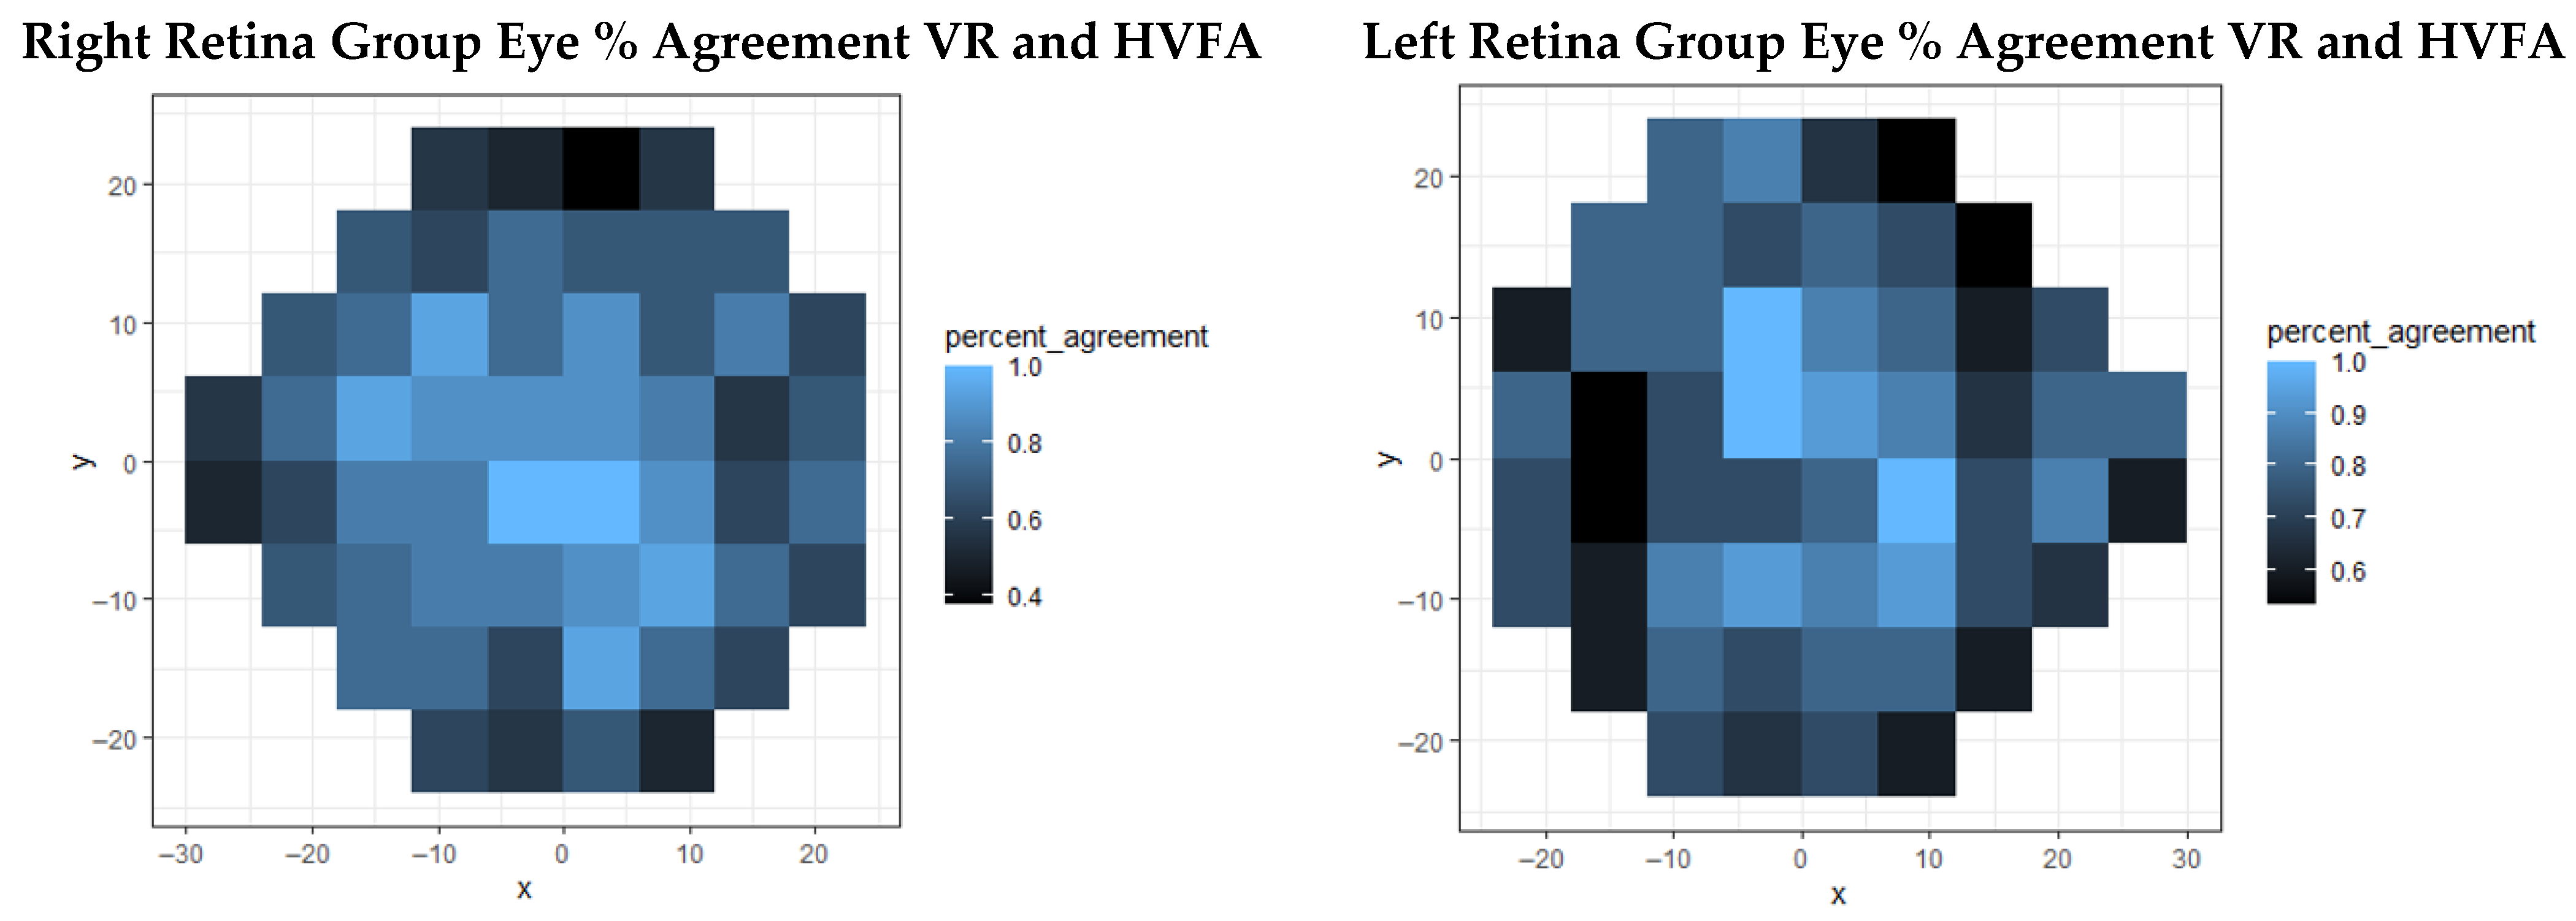
When looking at the percent agreement heat map in Figure 2 and Figure 3, the central Garway-Heath sector has the highest agreement percentage. Overall (n = 43 OD, n = 41 OS), patients exhibited >80% agreement for both eyes, with superior arcuate fibers being the weakest region. For controls (n = 16 OD, n = 15 OS) the central field agreement was generally >90%, while the superior and inferior arcuate fibers of the outer rim showed the most disagreement in the right eye (60–80%); only superior arcuate fibers showed disagreement on the left eye (40–80%). Eyes with glaucoma (n = 11 OD, n = 11 OS) showed high agreement centrally, ranging from 60 to 90. The weakest areas were the superior outer rim for the right eye (40–80%) and the inferior outer rim for the left eye (30–80%). Eyes with retinal disease (n = 16 OD, n = 15 OS) followed a pattern similar to other groups, with the central fields showing 80–100% agreement and peripheral fields displaying 40–70% agreement of the right eye and 60–80% of the left. Notably, disagreement in left eye field was more pronounced than the right.
Figure 2.
Agreement percentage for each point tested on the 24-2 exam coordinate plane with 25 Apostilibs set as a visibility threshold for total average (top) and control eyes (bottom).
Figure 3.
Point-by-point agreement of 24-2 exam based on 25 Apostilibs threshold in eyes with glaucoma (top) and retinal (bottom) diseases.
3.2. Ishihara
N = 110 eyes underwent both in-office and VR test versions of color testing. No significant difference was observed between the two modalities overall (p = 0.12, U = 1253.5), with sensitivity = 100%, specificity = 79%, and test accuracy = 82% (Table 3). Differences between results were also non-significant among the control and disease groups, including eyes with glaucoma and retinal abnormalities. Control eyes showed 100% sensitivity and 89% specificity with 89% accuracy and non-inferior testing (p = 0.49, U = 324). Glaucomatous eyes displayed 100% sensitivity, 45% specificity, and 57% accuracy while also demonstrating inter-test comparability (p = 0.051, U = 55). The retinal disease group showed 100% sensitivity, 89% specificity and 93% accuracy (p = 0.8, U = 92).
Table 3.
Ishihara color test comparison between VR analogues and in-office test results. Overall N = 110 eyes; control group N = 54 eyes, glaucoma N = 28 eyes; retinal disease group N = 28 eyes.
3.3. Amsler Grid
Amsler grid testing of N = 98 eyes showed no significant difference between the two tests (p = 0.81, U = 4514.5); sensitivity = 100%, specificity = 98%, and accuracy = 98%), as shown in Table 4. When comparing the controls and disease groups, the VR test remained non-inferior for the control (p = 0.74, U = 1352.5), glaucoma (p = 1, U = 264), and retinal disease groups (p = 0.99, U = 200). The sensitivities were 100% for each respective group while specificity varied slightly with 96% for control and 100% for diseased groups. Accuracy was 96% for the control group and 100% for the glaucoma and retina groups.
Table 4.
Amsler grid non-inferiority comparison between VR analogue and in-office test results. Overall N = 98 eyes; control group N = 52 eyes, glaucoma group N = 26 eyes, retinal disease group = 20 eyes).
3.4. Exam Efficiency Measured
When measuring testing speed, the mean amount of time required to complete the HVFA was 336.2 s per eye (range = 493 s, s.d. = 113.8 s) and was significantly longer compared to the VR perimetry time of 86.7 s per eye (range = 5 s, s.d. = 4.9 s), as expected with a suprathreshold examination (p < 0.0001; Welch’s t-test). Given that the HVFA used in this study included a full field perimetry exam, the threshold version takes approximately half the time, which would be 168.1 s per eye. The time difference between each test remained significant with this assumption (p < 0.001; Welch’s t-test).
4. Discussion
Global disparities in vision testing necessitate the introduction of validated, affordable screening and diagnostic technologies that are developed or adapted for ocular testing, such as VR headsets. To date, few groups have performed direct comparisons using several VR vision screening tests against in-office standards within a single clinical trial. In the present study, our group performed a preliminary comparison assessment of the in-office and VR analogues of 24-2 perimetry (HVFA vs. suprathreshold single contrast value), Ishihara tiles (book vs. VR multiple-choice), and the Amsler grid (paper vs. digital free-handing) tests.
All three VR tests showed high sensitivity compared to in-office tests, with a degree of geographical dependence in perimetry testing as evident in a Garway-Heath map breakdown. The central field showed the highest percentage sensitivity and agreement between the VR and HVFA results at a 25 Apostilbs threshold. Overall, perimetry VR results have a moderately high sensitivity that remained after patients were stratified into control and disease groups for glaucoma and retinal diseases. Additionally, in the glaucoma group, the superior and inferior nasal regions that are known to provide a characteristic pattern of glaucomatous field loss have the highest overall sensitivity [34]. On the other hand, the retina group had a high percent sensitivity in the central region of the field that is known to be most at-risk in conditions such as macular degeneration [35]. Li et al. described the complex pathogenesis of AMD and emphasized the importance of screening, especially in elderly populations [35].
VR analogues of Ishihara and Amsler tests also proved comparable to clinical standards in an overall comparison and within both healthy control and disease groups. Of note, while each group had high sensitivity, the specificity and accuracy did vary, with the glaucoma group having the overall lowest values. This could be due to peripheral vision field loss interfering with answer selection since each answer choice is positioned inferior to the Ishihara letter on the screen. Future endeavors will entail adjusting the user interface format to avoid this potential confound.
The transition to value-based care in the United States has emphasized empowering as well as financially and technically supporting primary care providers. Recent advancements in portable imaging and machine learning have enabled the adoption of handheld retinal cameras, with diabetic retinopathy diagnostic algorithms, in primary care settings. It is important to highlight that while a lot of the literature published on virtual reality emphasizes its automation and cost-effectiveness, this manuscript brings forward a portable platform that attempts to perform a multi-faceted functional vision exam and provides a novel method for result analysis [27,36]. While studies on vision screening for various conditions with different testing modalities present mixed conclusions, the literature largely supports increasing vision testing capabilities in rural and under-resourced populations, as well as for populations at risk of progressive diseases such as glaucoma, AMD, and DR [13,14].
Several studies have now documented VR-mediated perimetry examinations [31,37,38]. Most of these tests, however, are direct analogues of existing perimetry tests that modify visual stimulus signal intensity, and some measure intra-test outcomes to demonstrate reproducibility. Furthermore, some studies that have tested directly against HVFA report poor inter-device agreement [34,37]. VR perimetry analogues that do correlate well with HVFA required equivalent or longer testing times with sensitivities similar to our study presented here [31,36,37]. To our knowledge, this is a unique advantage of the accelerated analogue presented here. While variable sensitivities across Garway-Heath geographic retinal regions were observed to a certain degree, the lowest sensitivities were comparable to those of other studies. This result can be improved in the future by moderately increasing the number of stimuli presented or adding another stimulus intensity threshold while still keeping the exam substantially shorter than the HVFA version. When comparing speed of the current analogue exam, the VR 24-2 suprathreshold perimetry was approximately 2x faster than cited HVFA suprathreshold times.
More recent studies in utilizing VR for perimetry testing include a pediatric population with known glaucoma and craniopharyngioma diagnoses, showing feasibility and reliability of the device in this cohort of patients [39]. Different suprathreshold perimetry algorithms have also been studied in glaucoma cohorts in attempts to optimize the testing experience, thus further improving test efficiency [37]. Additionally, platform-based remote testing using VR in conjunction with rebound tonometry has been piloted for glaucoma patients, showing correlations between at-home and in-office disease monitoring [40].
The use cases for color vision deficit testing are growing every year, with its indications including Alzheimer’s, Parkinson’s, stroke, multiple sclerosis, AMD, glaucoma, and diabetes [31,41,42,43,44,45,46,47,48]. Specifically, several studies have documented the usefulness of Ishihara tile implementation in characterizing neurodegenerative disorders [49,50]. Contrast sensitivity was another test that was shown to correlate with neurodegenerative disease and has recently been incorporated into VR [45]. A limitation of the multiple-choice approach presented here has an increased probability of a false positive result. While alternative methods, such as verbal response recording, can be implemented within existing VR systems, there is a higher risk of technical complications due to factors obstructing communication, such as language barriers. Future studies with this test will involve performance of this VR analogue among patients with specific neurodegenerative disorders to assess the viability of multiple-choice testing, particularly in patients with declining cognitive status.
The Amsler grid has been an essential tool for monitoring ophthalmic disease progression of conditions like AMD [49]. Metamorphopsia can also present as a symptom of neurodegenerative and demyelinating conditions such as optic neuritis in multiple sclerosis [50,51]. The Amsler grid has also been effective at characterizing stroke-induced visual field deficits [39]. These functionalities warrant its presence on a VR functional testing platform.
It is important to note that a lot of diagnostic testing in ophthalmology entails the optical coherence tomography (OCT) and scanning laser ophthalmoscopy (SLO) systems that carry great value and are increasingly becoming more portable [52,53,54]. More investigation and development need to target integration of OCT and SLO on comprehensive portable device platforms to be used in remote settings.
Altogether, the delivery of a multi-faceted retinal function examination on a single device, such as a VR headset, can improve the accessibility of vision screening as well as clinical decision-making in specialties such as neurology, neurosurgery and endocrinology while also potentially providing the patient with more comfort than that afforded by standard in-office examinations. Future work will include continued adaptation and head-to-head validations of existing tests as well as the development of novel tests that will improve the adoption of VR technologies in spaces beyond vision specialist practices.
5. Limitations and Future Suggestions
This study had several limitations, primarily due to missing data from patients who underwent only part of the study and did not complete the entire series of exams. This was most likely due to the administration of analogue and VR tests on the same day as the clinical visit. Thus, recruiting participants ahead of time instead of on the same day could minimize dropout rates in future studies. Visual acuity was not a part of this platform design due to its ready availability and relatively low cost in most clinical settings. Future vision screening platforms can incorporate visual acuity and other functional screening tests, such as contrast sensitivity. Another limitation was not having a trial run of VR tests to help participants familiarize themselves with the virtual environment, which was especially true for older patients. While VR is starting to show potential for vision screening, the next step would be testing its diagnostic accuracy in larger studies, assessing its performance with prevalent conditions, such as glaucoma and diabetic retinopathy.
6. Conclusions
An assessment of diagnostic accuracy of VR-based 24-2 suprathreshold perimetry, Ishihara tiles, and the Amsler grid showed agreement across in-office testing methods for both healthy patients and those with previously diagnosed glaucoma and retinal pathologies. Improving vision screening accessibility can help achieve earlier diagnoses, promoting value-based treatment interventions and contributing to population health. VR-based screening may also allow for an expedited testing experience.
Supplementary Materials
The following supporting information can be downloaded at https://www.mdpi.com/article/10.3390/jcto4010008/s1, File S1: CONSORT 2025 checklist [55].
Author Contributions
Author Contributions: Conceptualization, A.A.V., R.A.S., H.R. and J.C.; methodology, A.A.V., R.A.S. and J.C.; software, V.N.; validation, M.L., J.C. and A.A.V.; formal analysis, M.L. and J.C.; investigation, C.P.C. and O.O.O.; resources, V.N., H.R. and J.C.; data curation, M.L. and A.J.W.; writing—original draft preparation, M.L.; writing—review and editing, R.A.S. and J.C.; visualization, A.J.W.; supervision, H.R. and J.C.; project administration, C.P.C., O.O.O., H.R. and J.C.; funding acquisition, J.C. All authors have read and agreed to the published version of the manuscript.
Funding
This study has been supported by the Icahn School of Medicine CTSA grant, number UL1TR001433. The grant was provided by the National Center for Advancing Translational Sciences, National Institutes of Health.
Institutional Review Board Statement
The study was approved by the Icahn School of Medicine’s Institutional Review Board in New York, USA (IRB #19-00679, Approval date: 29 August 2019).
Informed Consent Statement
Consent for both participation and publication of the findings was obtained from all subjects directly as no minors were recruited in this study. Participation in the study was voluntary and did not impact medical care provided.
Data Availability Statement
The original contributions presented in this study are included in the article/Supplementary Materials. Further inquiries can be directed to the corresponding author(s).All data and materials obtained in this study abide by the guidelines and regulations of the Institutional Review Board of the Icahn School of Medicine at Mount Sinai. Patient information was deidentified and protected for their privacy.
Acknowledgments
We would like to thank our statistician, Nicholas Kissel, for his help with representing the data in this manuscript.
Conflicts of Interest
Margarita Labkovich, Andrew J. Warburton, Randal A. Serafini, and Aly A.A. Valliani co-founded of Retina Technologies. Their involvement has been declared as a Conflict of Interest to the Institutional Review Board at Mount Sinai. The authors Christopher P. Cheng; Kemi Okome, Vicente Navarro, Harsha Reddy, and James Chelnis, do not report any conflicts of interests regarding this publication.
References
- Gibson, D.M. The geographic distribution of eye care providers in the United States: Implications for a national strategy to improve vision health. Prev. Med. 2015, 73, 30–36. [Google Scholar] [CrossRef] [Scilit]
- Kam, A.W.; Gunasekaran, N.; Chaudhry, S.G.; Vukasovic, M.; White, A.J.R.; Fung, A.T. Reduction in Ophthalmic Presentations to Australian Emergency Departments During the COVID-19 Period: Are We Seeing the Full Picture? Clin. Ophthalmol. 2021, 15, 341–346. [Google Scholar] [CrossRef] [Scilit]
- Lorente, M.G.; Martín, F.Z.; de Mora, M.R.C.; Rocha-de-Lossada, C. Impact of the COVID-19 pandemic on ophthalmic emergency services in a tertiary hospital in Spain. Eur. J. Ophthalmol. 2022, 32, NP313–NP315. [Google Scholar] [CrossRef] [Scilit]
- Gibson, D.M. Eye Care Availability and Access Among Individuals with Diabetes, Diabetic Retinopathy, or Age-Related Macular Degeneration. JAMA Ophthalmol. 2014, 132, 471–477. [Google Scholar] [CrossRef] [Scilit]
- Friedman, D.S.; O’Colmain, B.J.; Muñoz, B.; Tomany, S.C.; McCarty, C.; de Jong, P.T.V.M.; Nemesure, B.; Mitchell, P.; Kempen, J. Eye Diseases Prevalence Research Group. Prevalence of Age-Related Macular Degeneration in the United States. Arch. Ophthalmol. 2004, 122, 564–572. [Google Scholar] [CrossRef] [Scilit]
- Gupta, P.; Zhao, D.; Guallar, E.; Ko, F.; Boland, M.V.; Friedman, D.S. Prevalence of Glaucoma in the United States: The 2005–2008 National Health and Nutrition Examination Survey. Investig. Ophthalmol. Vis. Sci. 2016, 57, 2905–2913. [Google Scholar] [CrossRef] [Scilit]
- Teoh, S.C.; Wang, P.X.; Wong, E.P.Y. The epidemiology and incidence of cytomegalovirus retinitis in the HIV population in Singapore over 6 years. Investig. Ophthalmol. Vis. Sci. 2012, 53, 7546–7552. [Google Scholar] [CrossRef] [Scilit] [PubMed]
- More, P.; Almuhtaseb, H.; Smith, D.; Fraser, S.; Lotery, A.J. Socio-economic status and outcomes for patients with age-related macular degeneration. Eye 2019, 33, 1224–1231. [Google Scholar] [CrossRef] [Scilit]
- Sukumar, S.; Spencer, F.; Fenerty, C.; Harper, R.; Henson, D. The influence of socioeconomic and clinical factors upon the presenting visual field status of patients with glaucoma. Eye 2008, 23, 1038–1044. [Google Scholar] [CrossRef] [Scilit] [PubMed]
- Yip, J.L.Y.; Muthy, Z.; Peto, T.; Lotery, A.; Foster, P.J.; Patel, P. Socioeconomic risk factors and age-related macular degeneration in the UK Biobank study. BMJ Open Ophthalmol. 2021, 6, e000585. [Google Scholar] [CrossRef] [Scilit] [PubMed]
- Labkovich, M.; Paul, M.; Kim, E.; Serafini, R.A.; Lakhtakia, S.; Valliani, A.A.; Warburton, A.J.; Patel, A.; Zhou, D.; Sklar, B.; et al. Portable hardware & software technologies for addressing ophthalmic health disparities: A systematic review. Digit. Health 2022, 8, 205520762210900. [Google Scholar] [CrossRef] [Scilit]
- Strahlman, E.; Ford, D.; Whelton, P.; Sommer, A. Vision Screening in a Primary Care Setting: A Missed Opportunity? Arch. Intern. Med. 1990, 150, 2159–2164. [Google Scholar] [CrossRef] [Scilit]
- Nehmad, L.; Madonna, R.J. Optimizing the use of frequency doubling technology perimetry in community vision screenings. Optom. Vis. Sci. 2008, 85, 559–565. [Google Scholar] [CrossRef] [Scilit] [PubMed]
- Smeeth, L.; Fletcher, A.E.; Hanciles, S.; Evans, J.; Wormald, R. Screening older people for impaired vision in primary care: Cluster randomised trial. BMJ 2003, 327, 1027. [Google Scholar] [CrossRef] [Scilit]
- Friedman, D.S.; Cassard, S.D.; Williams, S.K.; Baldonado, K.; O’Brien, R.W.; Gower, E.W. Outcomes of a Vision Screening Program for Underserved Populations in the United States. Ophthalmic Epidemiol. 2013, 20, 201–211. [Google Scholar] [CrossRef] [Scilit]
- Ariyasu, R.G.; Lee, P.P.; Linton, K.P.; LaBree, L.D.; Azen, S.P.; Siu, A.L. Sensitivity, Specificity, and Predictive Values of Screening Tests for Eye Conditions in a Clinic-based Population. Ophthalmology 1996, 103, 1751–1760. [Google Scholar] [CrossRef] [Scilit]
- Wang, F.; Tielsch, J.M.; Ford, D.E.; Quigley, H.A.; Whelton, P.K. Evaluation of screening schemes for eye disease in a primary care setting. Ophthalmic Epidemiol. 2009, 5, 69–82. [Google Scholar] [CrossRef] [Scilit]
- Gessesse, G.W.; Tamrat, L.; Damji, K.F. Amsler grid test for detection of advanced glaucoma in Ethiopia. PLoS ONE 2020, 15, e0230017. [Google Scholar] [CrossRef] [Scilit]
- Su, D.; Greenberg, A.; Simonson, J.L.; Teng, C.C.; Liebmann, J.M.; Ritch, R.; Park, S.C. Efficacy of the Amsler Grid Test in Evaluating Glaucomatous Central Visual Field Defects. Ophthalmology 2016, 123, 737–743. [Google Scholar] [CrossRef] [Scilit] [PubMed]
- Nazemi, P.P.; Fink, W.; Sadun, A.A.; Francis, B.; Minckler, D. Early detection of glaucoma by means of a novel 3D computer-automated visual field test. Br. J. Ophthalmol. 2007, 91, 1331–1336. [Google Scholar] [CrossRef] [Scilit]
- Morejon, A.; Mayo-Iscar, A.; Martin, R.; Ussa, F. Development of a new algorithm based on FDT Matrix perimetry and SD-OCT to improve early glaucoma detection in primary care. Clin. Ophthalmol. 2019, 13, 33. [Google Scholar] [CrossRef] [Scilit] [PubMed]
- Lowry, E.A.; Hou, J.; Hennein, L.; Chang, R.T.; Lin, S.; Keenan, J.; Wang, S.K.; Ianchulev, S.; Pasquale, L.R.; Han, Y. Comparison of Peristat Online Perimetry with the Humphrey Perimetry in a Clinic-Based Setting. Transl. Vis. Sci. Technol. 2016, 5, 4. [Google Scholar] [CrossRef] [Scilit] [PubMed]
- Terauchi, R.; Wada, T.; Ogawa, S.; Kaji, M.; Kato, T.; Tatemichi, M.; Nakano, T. FDT Perimetry for Glaucoma Detection in Comprehensive Health Checkup Service. J. Ophthalmol. 2020, 2020, 4687398. [Google Scholar] [CrossRef] [Scilit]
- Bressler, N.M. Early detection and treatment of neovascular age-related macular degeneration. J. Am. Board Fam. Med. 2002, 15, 142–152. [Google Scholar]
- Kung, F.F.; Xu, T.T.; Leavitt, J.A.; Lossen, V.I.; Lai, K.E.; Ko, M.W.; Bhatti, M.T.; Chen, J.J. Characterization and Utility of Remote Interpretation of Visual Field Diagnostic Testing in an Academic Center. J. Neuro-Ophthalmol. Off. J. N. Am. Neuro-Ophthalmol. Soc. 2022, 42, e1–e7. [Google Scholar] [CrossRef] [Scilit]
- Ma, M.K.I.; Saha, C.; Poon, S.H.L.; You, R.S.W.; Shih, K.C.; Chan, Y.K. Virtual reality and augmented reality- emerging screening and diagnostic techniques in ophthalmology: A systematic review. Surv. Ophthalmol. 2022, 67, 1516–1530. [Google Scholar] [CrossRef] [Scilit] [PubMed]
- Sircar, T.; Mishra, A.; Bopardikar, A.; Tiwari, V.N. GearVision: Smartphone Based Head Mounted Perimeter for Detection of Visual Field Defects. Annu. Int. Conf. IEEE Eng. Med. Biol. Soc. 2018, 2018, 5402–5405. [Google Scholar] [CrossRef] [Scilit] [PubMed]
- Jones, P.R.; Smith, N.D.; Bi, W.; Crabb, D.P. Portable Perimetry Using Eye-Tracking on a Tablet Computer—A Feasibility Assessment. Transl. Vis. Sci. Technol. 2019, 8, 17. [Google Scholar] [CrossRef] [Scilit]
- Jones, P.R.; Lindfield, D.; Crabb, D.P. Using an open-source tablet perimeter (Eyecatcher) as a rapid triage measure for glaucoma clinic waiting areas. Br. J. Ophthalmol. 2021, 105, 681–686. [Google Scholar] [CrossRef] [Scilit]
- Razeghinejad, R.; Gonzalez-Garcia, A.; Myers, J.S.; Katz, L.J. Preliminary Report on a Novel Virtual Reality Perimeter Compared with Standard Automated Perimetry. J. Glaucoma 2021, 30, 17–23. [Google Scholar] [CrossRef] [Scilit]
- Hollander, D.A.; Volpe, N.J.; Moster, M.L.; Liu, G.T.; Balcer, L.J.; Judy, K.D.; Galetta, S.L. Use of a portable head mounted perimetry system to assess bedside visual fields. Br. J. Ophthalmol. 2000, 84, 1185–1190. [Google Scholar] [CrossRef] [Scilit]
- Tsapakis, S.; Papaconstantinou, D.; Diagourtas, A.; Droutsas, K.; Andreanos, K.; Moschos, M.M.; Brouzas, D. Visual field examination method using virtual reality glasses compared with the Humphrey perimeter. Clin. Ophthalmol. 2017, 11, 1431–1443. [Google Scholar] [CrossRef] [Scilit]
- Kong, Y.X.G.; He, M.; Crowston, J.G.; Vingrys, A.J. A Comparison of Perimetric Results from a Tablet Perimeter and Humphrey Field Analyzer in Glaucoma Patients. Transl. Vis. Sci. Technol. 2016, 5, 2. [Google Scholar] [CrossRef] [Scilit]
- Kim, J.M.; Kyung, H.; Shim, S.H.; Azarbod, P.; Caprioli, J. Location of Initial Visual Field Defects in Glaucoma and Their Modes of Deterioration. Investig. Ophthalmol. Vis. Sci. 2015, 56, 7956–7962. [Google Scholar] [CrossRef] [Scilit]
- Li, W. Overview and definition of age-related macular degeneration. In Age-Related Macular Degeneration; Elsevier: Amsterdam, The Netherlands, 2022; pp. 1–16. [Google Scholar] [CrossRef] [Scilit]
- Stapelfeldt, J.; Kucur, Ş.S.; Huber, N.; Höhn, R.; Sznitman, R. Virtual Reality–Based and Conventional Visual Field Examination Comparison in Healthy and Glaucoma Patients. Transl. Vis. Sci. Technol. 2021, 10, 10. [Google Scholar] [CrossRef] [Scilit]
- Prager, A.J.; Kang, J.M.; Tanna, A.P. Advances in perimetry for glaucoma. Curr. Opin. Ophthalmol. 2021, 32, 92–97. [Google Scholar] [CrossRef] [Scilit] [PubMed]
- Wolff, B.E.; Bearse, M.A.; Schneck, M.E.; Dhamdhere, K.; Harrison, W.W.; Barez, S.; Adams, A.J. Color vision and neuroretinal function in diabetes. Doc. Ophthalmol. 2015, 130, 131–139. [Google Scholar] [CrossRef] [Scilit] [PubMed]
- Mesfin, Y. Pilot study comparing a new virtual reality-based visual field test to standard perimetry in children. J. Am. Assoc. Pediatr. Ophthalmol. Strabismus 2024, 28, 103933. [Google Scholar] [CrossRef] [Scilit] [PubMed]
- Berneshawi, A.R.; Shue, A.; Chang, R.T. Glaucoma Home Self-Testing Using VR Visual Fields and Rebound Tonometry Versus In-Clinic Perimetry and Goldmann Applanation Tonometry: A Pilot Study. Transl. Vis. Sci. Technol. 2024, 13, 7. [Google Scholar] [CrossRef] [Scilit] [PubMed] [PubMed Central]
- Papaconstantinou, D.; Georgalas, I.; Kalantzis, G.; Karmiris, E.; Koutsandrea, C.; Diagourtas, R.; Ladas, I.; Georgopoulos, G. Acquired color vision and visual field defects in patients with ocular hypertension and early glaucoma. Clin. Ophthalmol. 2009, 3, 251–257. [Google Scholar] [CrossRef] [Scilit]
- Villoslada, P.; Cuneo, A.; Gelfand, J.; Hauser, S.L.; Green, A. Color vision is strongly associated with retinal thinning in multiple sclerosis. Mult. Scler. J. 2012, 18, 991–999. [Google Scholar] [CrossRef] [Scilit] [PubMed]
- Rowe, F.; VIS Group UK. Symptoms of stroke-related visual impairment. Strabismus 2013, 21, 150–154. [Google Scholar] [CrossRef] [Scilit]
- Pieri, V.; Diederich, N.J.; Raman, R.; Goetz, C.G. Decreased color discrimination and contrast sensitivity in Parkinson’s disease. J. Neurol. Sci. 2000, 172, 7–11. [Google Scholar] [CrossRef] [Scilit]
- Salamone, G.; di Lorenzo, C.; Mosti, S.; Lupo, F.; Cravello, L.; Palmer, K.; Musicco, M.; Caltagirone, C. Color Discrimination Performance in Patients with Alzheimer’s Disease. Dement. Geriatr. Cogn. Disord. 2009, 27, 501–507. [Google Scholar] [CrossRef] [Scilit]
- Arnaoutoglou, N.A.; Arnaoutoglou, M.; Nemtsas, P.; Costa, V.; Baloyannis, S.J.; Ebmeier, K.P. Color perception differentiates Alzheimer’s Disease (AD) from Vascular Dementia (VaD) patients. Int. Psychogeriatr. 2017, 29, 1355–1361. [Google Scholar] [CrossRef] [Scilit]
- Mirdedaev, S.; Toshev, J.; Nurmetov, N.; Kurbanov, O.; Ibodullaev, Z. The importance of Ishihara Testing in early diagnosing of Parkinson disease. Park. Relat. Disord. 2016, 22, e43. [Google Scholar] [CrossRef] [Scilit]
- Kaeser, P.F.; Ghika, J.; Borruat, F.X. Visual signs and symptoms in patients with the visual variant of Alzheimer disease. BMC Ophthalmol. 2015, 15, 65. [Google Scholar] [CrossRef] [Scilit] [PubMed]
- Faes, L.; Bodmer, N.S.; Bachmann, L.M.; Thiel, M.A.; Schmid, M.K. Diagnostic accuracy of the Amsler grid and the preferential hyperacuity perimetry in the screening of patients with age-related macular degeneration: Systematic review and meta-analysis. Eye 2014, 28, 788–796. [Google Scholar] [CrossRef] [Scilit] [PubMed]
- Ebers, G.C. Optic Neuritis and Multiple Sclerosis. Arch. Neurol. 1985, 42, 702–704. [Google Scholar] [CrossRef] [Scilit]
- Repovic, P. Management of multiple sclerosis relapses. Contin. Lifelong Learn. Neurol. 2019, 25, 655–669. [Google Scholar] [CrossRef] [Scilit]
- Zeppieri, M.; Marsili, S.; Enaholo, E.S.; Shuaibu, A.O.; Uwagboe, N.; Salati, C.; Spadea, L.; Musa, M. Optical Coherence Tomography (OCT): A Brief Look at the Uses and Technological Evolution of Ophthalmology. Medicina 2023, 59, 2114. [Google Scholar] [CrossRef] [Scilit] [PubMed]
- Fischer, J.; Otto, T.; Delori, F.; Pace, L.; Staurenghi, G. Scanning Laser Ophthalmoscopy (SLO). In High Resolution Imaging in Microscopy and Ophthalmology: New Frontiers in Biomedical Optics; Bille, J.F., Ed.; Springer: Cham, Switzerland, 2019. [Google Scholar] [CrossRef] [Scilit]
- Cheng, C.P.; Serafini, R.A.; Labkovich, M.; Warburton, A.J.; Navarro, V.; Shaik, N.; Reddy, H.; Chelnis, J.G. Clinical report: Virtual reality enables comparable contrast sensitivity measurements to in-office testing (pilot study). Optom. Vis. Sci. 2024, 101, 124–128. [Google Scholar] [CrossRef] [Scilit] [PubMed]
- Hopewell, S.; Chan, A.W.; Collins, G.S.; Hróbjartsson, A.; Moher, D.; Schulz, K.F.; Tunn, R.; Aggarwal, R.; Berkwits, M.; Berlin, J.A.; et al. CONSORT 2025 Statement: Updated guideline for reporting randomised trials. BMJ 2025, 388, e081123. [Google Scholar] [CrossRef] [Scilit] [PubMed]

Disclaimer/Publisher’s Note: The statements, opinions and data contained in all publications are solely those of the individual author(s) and contributor(s) and not of MDPI and/or the editor(s). MDPI and/or the editor(s) disclaim responsibility for any injury to people or property resulting from any ideas, methods, instructions or products referred to in the content. |
© 2026 by the authors. Licensee MDPI, Basel, Switzerland. This article is an open access article distributed under the terms and conditions of the Creative Commons Attribution (CC BY) license.