


Abstract
Brucellosis poses a persistent threat to livestock health in high-altitude pastoral regions of China, where harsh environments and semi-nomadic grazing increase transmission risk. Existing surveillance systems rely mainly on periodic serological testing and lack effective early warning capability. This study proposes an ensemble learning-based early warning framework integrating veterinary epidemiological indicators with environmental and herd-movement data. A total of 4826 herd-level records collected over five years (2019–2024) were analyzed, with an overall positivity rate of 11.4%. Multi-source data, including serological, clinical, reproductive, vaccination, meteorological, pasture-management, and herd-movement information (from GPS tracking and structured surveys), were integrated through epidemiology-guided feature engineering. To address class imbalance and temporal dynamics, Synthetic Minority Over-sampling Technique (SMOTE) resampling and sliding time-window features were applied. The proposed ensemble model combines Random Forest, XGBoost, and LightGBM using a soft-voting strategy, with logistic regression as a baseline. Results show that the ensemble model outperforms single models, achieving an AUC of 0.86 and a PR-AUC of 0.65. After threshold optimization, sensitivity increased from 0.78 to 0.87. Under field conditions, the system provided herd-level early warnings with an average lead time of approximately 12 days before confirmed outbreaks, demonstrating its feasibility and practical value for proactive brucellosis surveillance in high-altitude pastoral systems.
1. Introduction
Brucellosis is a widespread zoonotic disease, caused by Brucella bacteria, that has a devastating impact on global livestock production, public health, and the livelihoods of livestock farmers [1,2]. Brucellosis causes abortion, stillbirth, infertility, orchitis, and decreased milk production in ruminants such as cattle, sheep, and yaks [3]. These consequences not only result in economic losses but also lead to long-term instability in livestock productivity and the sustainability of livestock farming [4].
China has made significant progress in controlling brucellosis through vaccination, routine serological screening, and veterinary surveillance systems [5,6]. However, brucellosis continues to recur in pastoral and semi-pastoral areas, exhibiting a regionally heterogeneous epidemic pattern [7]. High-altitude pastoral areas constitute a unique epidemiological context, with environmental pressures, traditional grazing practices, and livestock movement collectively shaping the dynamics of disease transmission [8].
High-altitude pastoral areas are typically located above 2800 m in altitude, characterized by large diurnal temperature variations, strong ultraviolet radiation, low oxygen pressure, and seasonal scarcity of pasture [9]. These conditions can cause chronic physiological stress in some livestock, thereby impairing their immune function and increasing their susceptibility to infectious diseases [10]. Furthermore, the prevalence of semi-nomadic grazing systems leads to frequent mixing of livestock during seasonal migrations, sharing pastures and public water sources, which greatly increases the chances of contact between livestock from different households [11]. Such ecological stressors and mobility-driven contacts jointly create a transmission environment that differs substantially from low-altitude intensive farming systems, highlighting the need for context-specific early warning approaches.
For the prevention of brucellosis, many pastoral areas use regular serological testing, such as the rose bengal plate test (RBPT) and enzyme-linked immunosorbent assay (ELISA) [12]. However, these methods are usually performed at fixed intervals and focus more on identifying existing infections than predicting new risks [13]. Therefore, early transmission chains may remain undetected until clinical symptoms or abortion surges occur, at which point control measures are often reactive rather than preventative [14]. In this study, an “outbreak” is operationally defined as a monitoring-period event in which the herd-level seropositive rate exceeds the historical baseline by more than two standard deviations, or when newly confirmed positive cases surpass a predefined administrative threshold within a quarter. This definition integrates serological dynamics with field management criteria to ensure consistency with veterinary surveillance practice.
In recent years, advancements in data collection and digital animal health management technologies have made disease surveillance more effective [15]. In pastoral areas, data sources include serological results, clinical records, reproductive performance, vaccination coverage, environmental conditions, and herd movement patterns [15]. Effective integration of these multi-source data can provide a more comprehensive understanding of herd health and potential risk factors for brucellosis outbreaks [16]. Machine learning methods have been widely applied to disease risk prediction, pattern recognition, and early warning [17,18]. Tree-based models, such as random forests, gradient boosting, and XGBoost, are well-suited for handling high-dimensional data, nonlinear interactions, and missing values, making them ideal for analyzing complex pastoral disease systems [19]. Conversely, single algorithms may produce unstable predictions in situations with limited positive samples and high environmental heterogeneity [20]. Ensemble learning improves robustness, generalization ability, and predictive stability by combining multiple base learners [21]. By integrating the complementary strengths of different models, ensemble frameworks can reduce variance, mitigate model-specific biases, and enhance sensitivity to weak but meaningful risk signals [22]. This is particularly important for early warning tasks, as missed detections can have serious epidemiological and economic consequences [23].
Existing veterinary early warning systems have predominantly relied on time-series anomaly detection, regression-based climatic risk models, or syndromic surveillance frameworks centered on historical case counts. While these approaches contribute to outbreak monitoring, most do not explicitly incorporate high-altitude ecological stress indicators or mobility-derived contact-network proxies. In addition, few frameworks combine ensemble learning with rule-based epidemiological triggering mechanisms that align predictive outputs with administrative intervention thresholds. As a result, there remains a gap between predictive modeling performance and practical field applicability in high-altitude pastoral settings.
Besides selecting appropriate algorithms, early warning systems for brucellosis also need to integrate domain knowledge of veterinary epidemiology for specific regional conditions [24]. In high-altitude pastoral areas, environmental stress indicators, grazing management practices, and herd contact networks play a significant role in shaping transmission dynamics. Therefore, to improve the interpretability and predictive relevance of models, it is necessary to integrate epidemiological indicators, climate variables, and feature engineering based on mobile contact structures [25].
Against this background, the present study proposes a novel ensemble learning-based early warning framework for brucellosis outbreaks in high-altitude pastoral areas of China. The framework integrates four complementary components: (1) explicit modeling of high-altitude ecological stress factors; (2) construction of simplified contact-network proxies derived from herd mobility patterns; (3) a multi-model ensemble learning architecture to enhance robustness under class imbalance and environmental heterogeneity; and (4) a rule-based triggering strategy consistent with operational outbreak definitions. A data-driven model is constructed by integrating multi-year serological and clinical records with environmental, pasture management, and herd mobility data to identify high-risk outbreaks at an early stage. The ensemble structure combines multiple tree-based learners using a soft-voting strategy and incorporates a sensitivity optimization mechanism tailored to high-altitude ecological conditions. By systematically combining ecological context, network-informed features, and ensemble-based prediction, the proposed framework aims to bridge the gap between data-driven modeling and practical disease control implementation in high-altitude pastoral regions.
2. Materials and Methods
2.1. Study Area
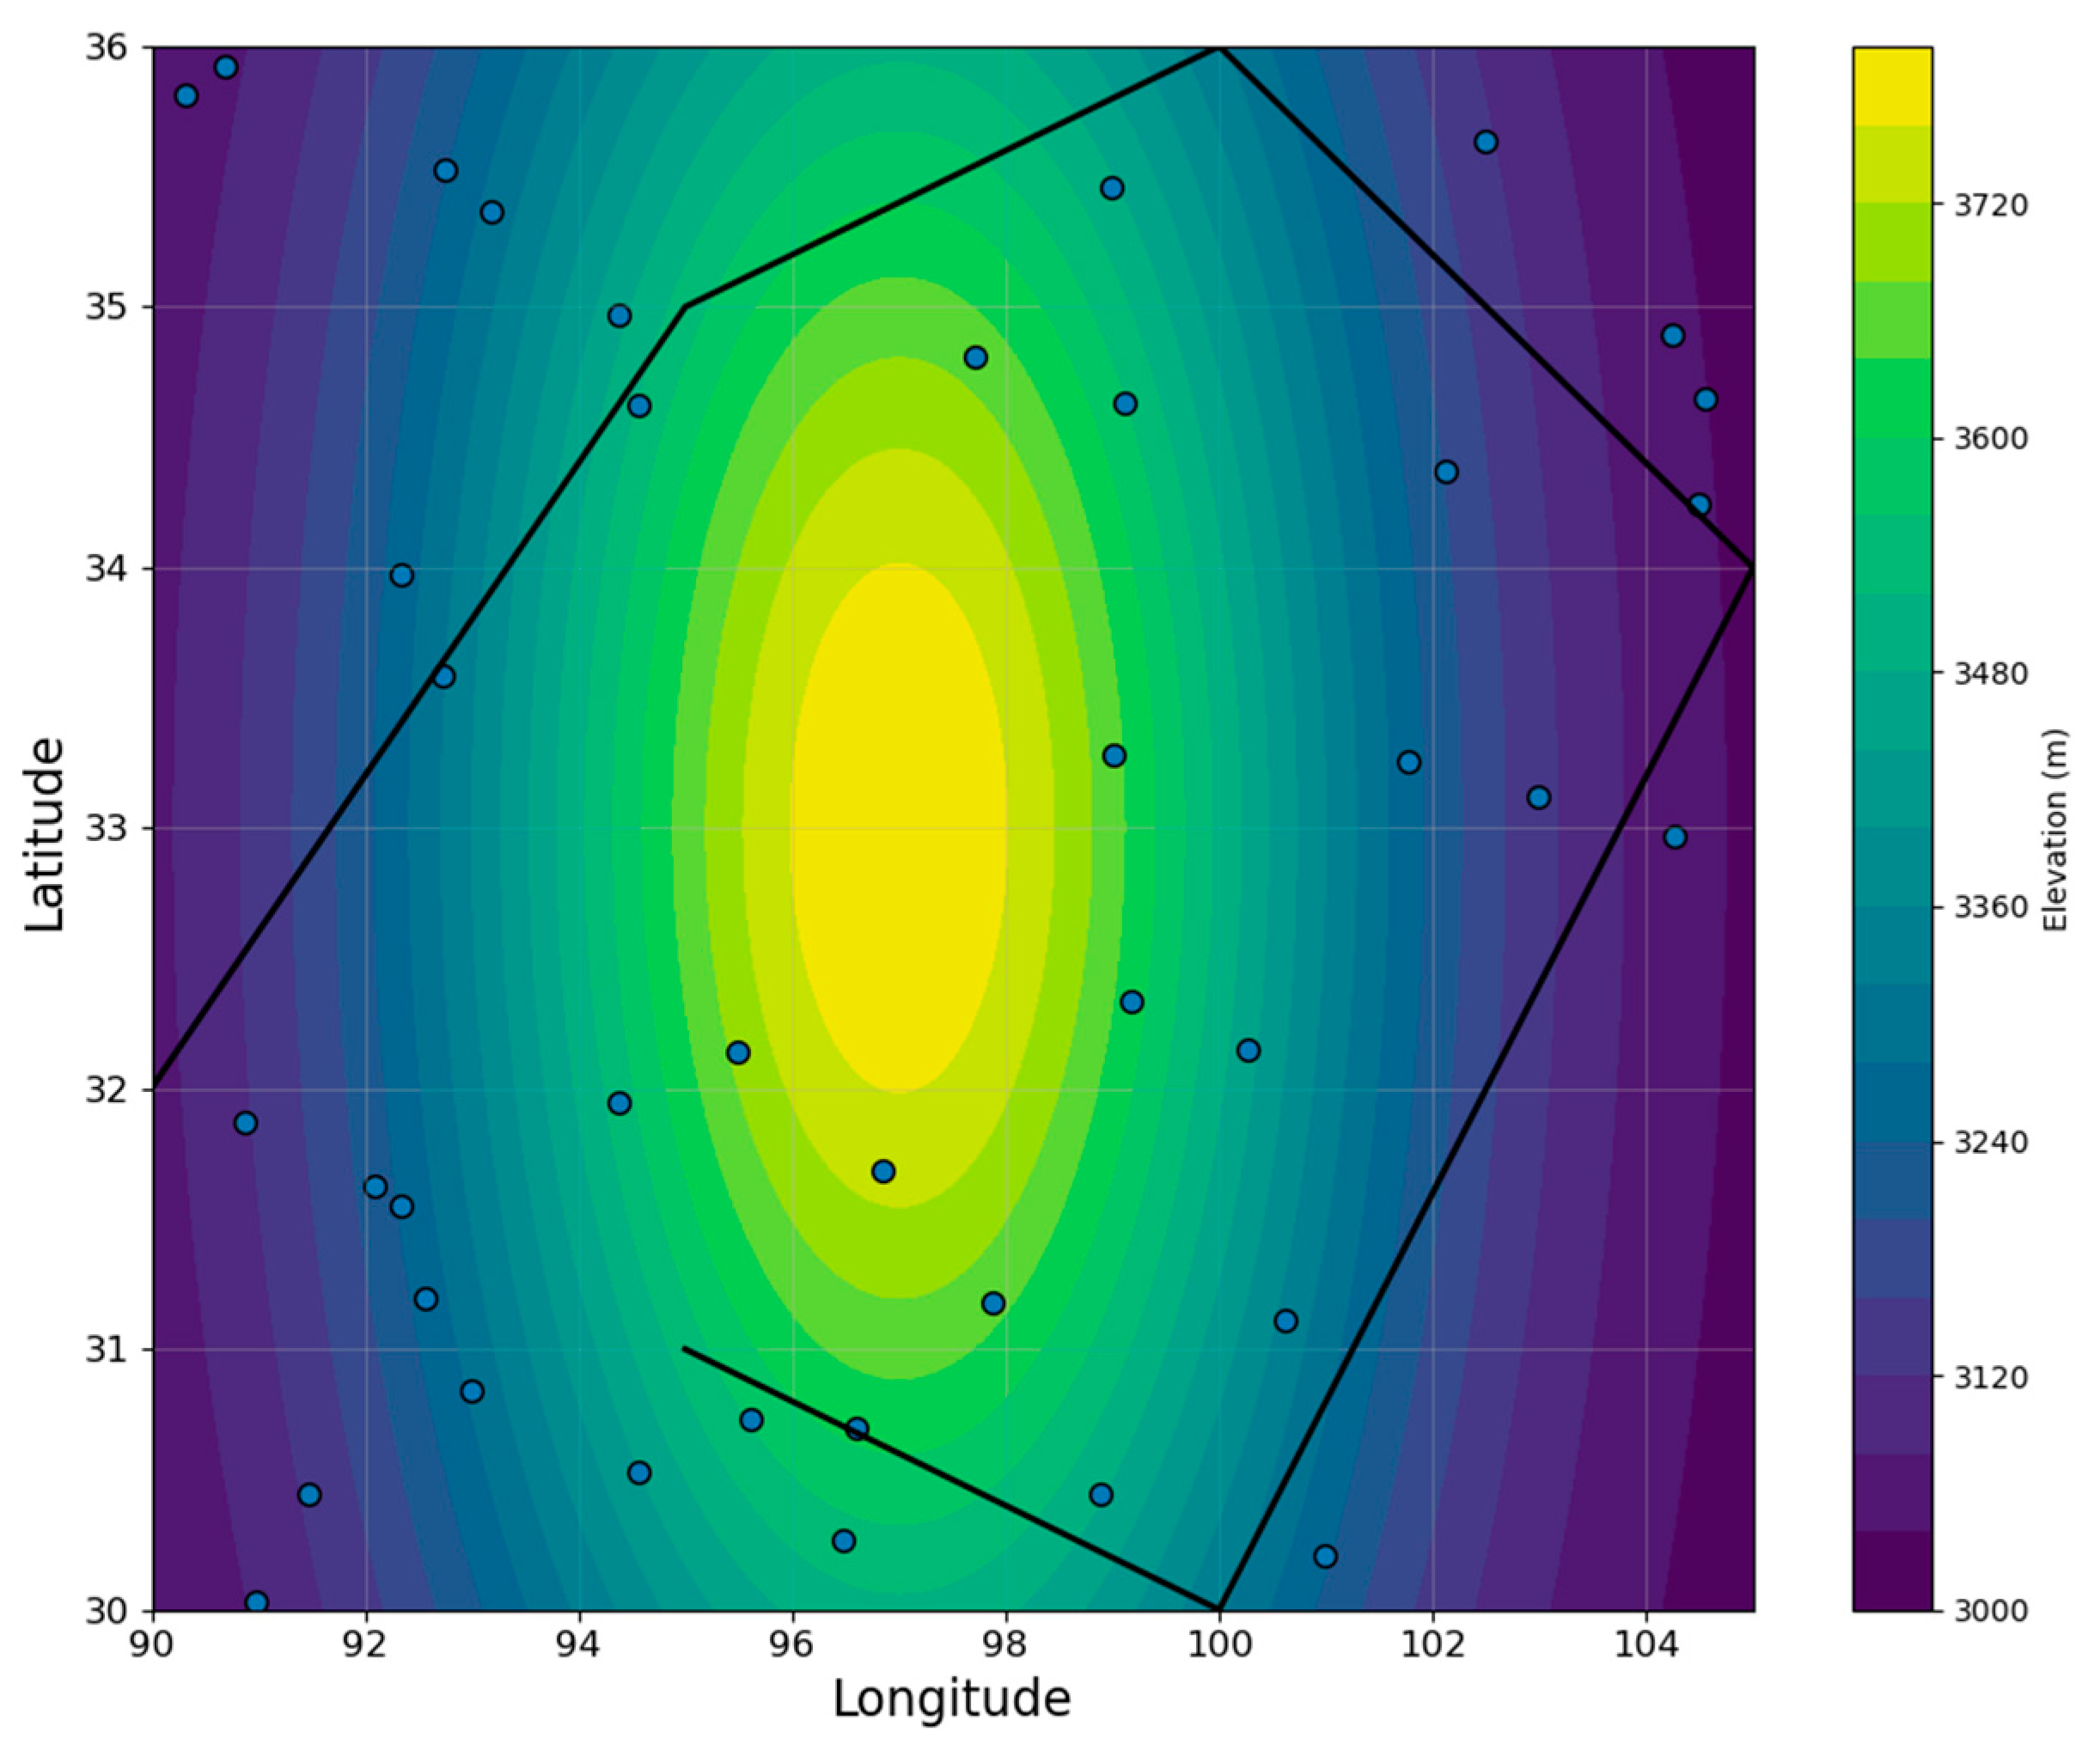
The pastoral area selected for this study is in the eastern Qinghai–Tibet Plateau in western China (Figure 1), at an altitude of approximately 2800–4200 m and dominated by cold-temperate alpine meadows. The region is characterized by a mean annual temperature of approximately −1 to 3 °C, pronounced diurnal temperature fluctuations, strong ultraviolet radiation, and low annual precipitation ranging from 350 to 450 mm, resulting in a harsh ecological environment. Under such conditions, livestock often experience increased energy expenditure and immune stress during the cold season [26].
Local animal husbandry mainly involves yak and sheep grazing under a semi-nomadic management system. The livestock population in the study area is dominated by yaks (approximately 1.2–1.5 million head) and sheep (approximately 2.0–2.5 million head), with a smaller number of cattle (less than 0.3 million head). Herds migrate seasonally between summer and winter pastures, leading to frequent inter-herd contact and mixing among animals from different households. Wild ungulates, such as Tibetan gazelle and blue sheep, are also present in the region and may serve as potential natural reservoirs or spillover hosts of Brucella, which, combined with the highly mobile and open grazing system, creates favorable conditions for the transmission of brucellosis [27].
Combined with historical monitoring data from local animal health supervision departments, brucellosis in cattle and sheep populations in this region tends to show a sporadic or periodically increasing trend, with the positivity rate typically influenced by seasonal changes, reproductive cycles, and the frequency of introduction of new breeds. Although the ranch mainly relies on grassroots veterinary stations for annual routine RBPT and ELISA testing, the existing monitoring system is still primarily based on periodic screening and lacks an early warning mechanism supported by real-time data, making it difficult to identify hidden transmission chains early. Based on this situation, this region is both typical and has practical application value in conducting early warning research for brucellosis outbreaks.
Figure 1.
Plateau pastoral study area map.
2.2. Data Sources
2.2.1. Serological and Clinical Data
The research team collaborated closely with local animal health supervision departments and partner farms to collect monitoring data spanning a five-year period from July 2019 to June 2024. This data primarily covers serological test results, clinical symptom records, herd reproduction information, and vaccination records and compliance status.
An overview of the main data categories, variables, and sources is summarized in Table 1 to provide a clear description of the data structure used in this study. Serological test data includes sample numbers, testing times, and positive/negative results for RBPT and indirect ELISA [28]. Clinical symptom records cover major manifestations related to brucellosis, such as abortion, stillbirth, arthritis, orchitis, and mastitis [1]. Herd reproduction information includes the number of breeding females, mating season, pregnancy rate, and parturition status. Vaccination data includes selective vaccination status, vaccine batches, and vaccination coverage. To ensure data integrity and analyzability, this data was entered quarterly by farm veterinarians and township animal disease control personnel and then compiled by the research team into a structured database for subsequent analysis.
2.2.2. Environmental and Pasture-Management Data
To comprehensively assess the potential impact of high-altitude environments on brucellosis outbreaks, this study collected multidimensional environmental and production management data from national meteorological stations and portable monitoring devices. Meteorological data included altitude, temperature, humidity, precipitation, and wind speed. Relevant variables used in the analysis are shown in Table 1.
In addition, core serological, clinical, reproductive, and vaccination-related indicators were incorporated into the same variable system to ensure consistency between data sources and model inputs. In this study, the basic prediction unit was defined as “ranch-month.” All serological, clinical, environmental, and herd mobility variables were aggregated on a monthly basis for each ranch. Environmental and management variables were temporally aligned to the same month as the outcome label. Lagged variables were constructed using historical observations preceding the target month to ensure proper temporal causality and prevent information leakage. Pasture condition records included changes in grassland quality, grazing intensity, and seasonal forage availability. Records of introduced and mixed herds covered the introduction time, origin, quarantine status, and contact with existing herds for each new introduction. Routine management practices included barn disinfection frequency, mating management patterns, and herd isolation strategies. These environmental data, combined with production records provided by pasture managers, can be used to construct variables reflecting risk characteristics, thus providing a foundation for subsequent analysis.
Table 1.
Data sources and variable definitions.
2.2.3. Herd Movement and Contact Network Data
Seasonal migration in high-altitude pastoral areas plays a crucial role in the spread of brucellosis. Therefore, this study obtained herd movement information through manual surveys and GPS collar devices. Manual survey records, provided by herders, mainly included migration routes, dwell time, and contact with neighboring herds. GPS collars were installed on livestock in some demonstration ranches to track daily movement and contact density. Movement-related indicators and management-related proxy variables incorporated into the contact network analysis are also summarized in Table 1. After preprocessing, this data can be used to analyze the frequency of contact between animals and potential transmission chains, thus providing crucial support for establishing brucellosis outbreak models.
Missing data rates across variables ranged from 2.3% to 7.8%, primarily due to incomplete environmental recordings or delayed herd reporting. Variables with missingness below 5% were imputed using median values (continuous variables) or mode values (categorical variables). For variables with 5–10% missingness, K-nearest neighbor (KNN) imputation (k = 5) was applied within the training set only. No imputation model was fitted using validation data to avoid leakage.
2.3. Feature Engineering
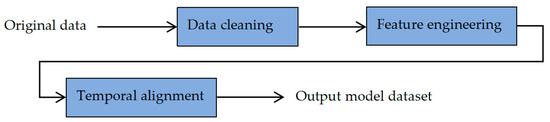
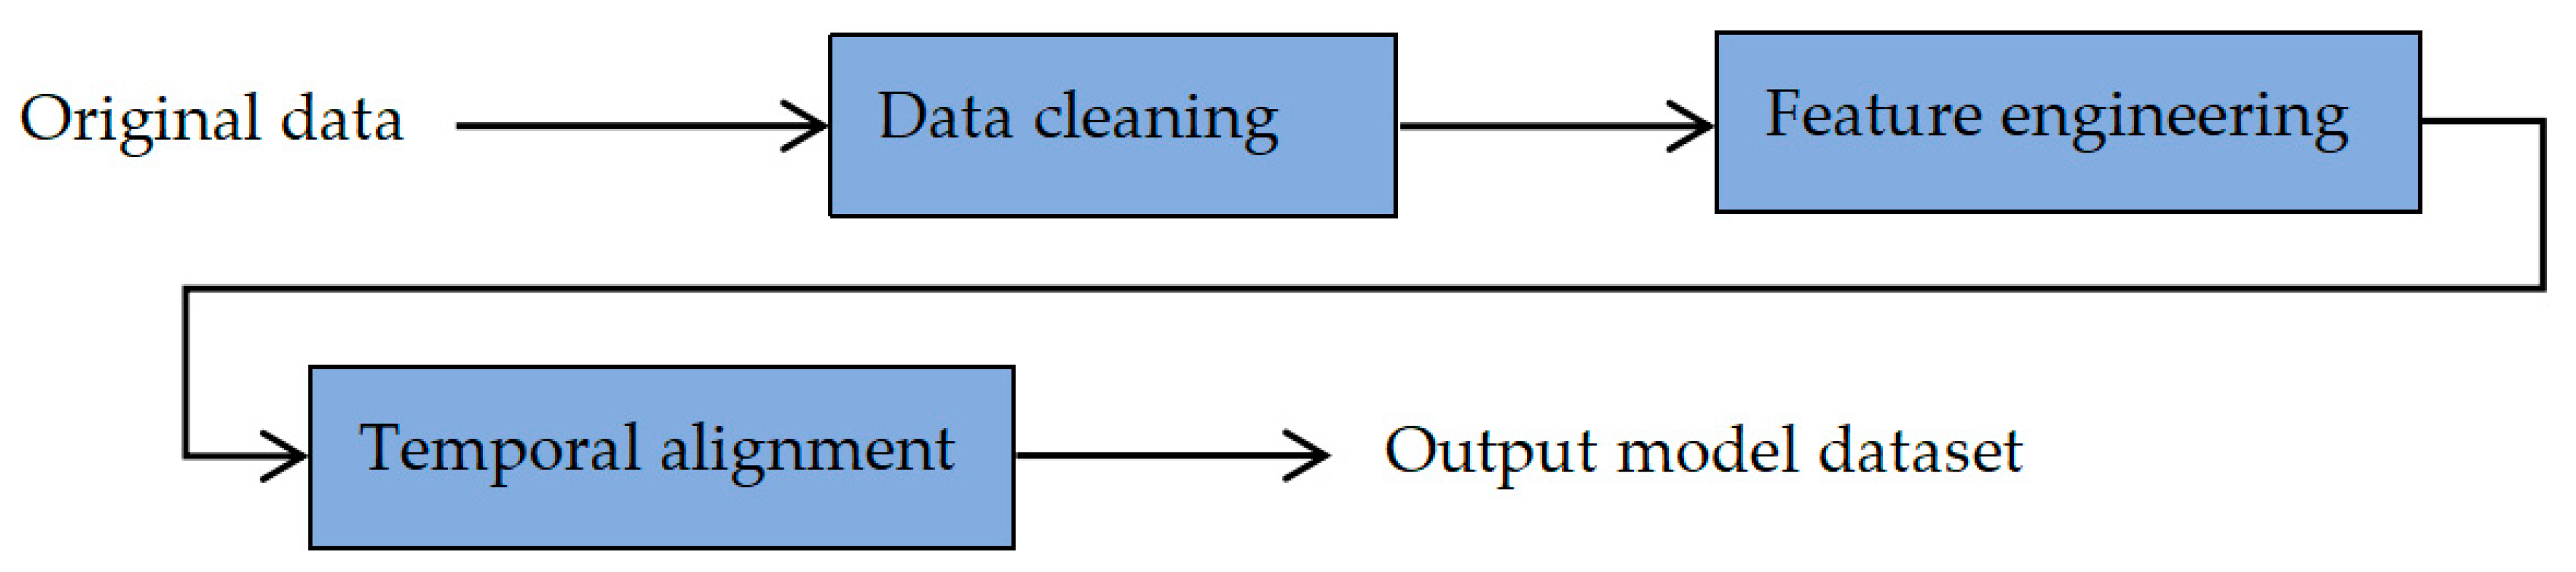
To enhance the model’s predictive ability, this study combined veterinary epidemiology theory with the unique environment of highland pastures to construct four key features to characterize the potential outbreak risk of brucellosis. The overall feature construction logic and processing pipeline are illustrated in Figure 2, which provides a systematic overview of how raw multi-source data were transformed into model-ready inputs. These features allow the model to more comprehensively reflect herd susceptibility and external triggering factors.
Figure 2.
Feature engineering workflow diagram.
The core epidemiological features mainly include the animal herd abortion rate, the new quarterly positive rate, the proportion of female animals and breeding density, past infection history, herd immunity gap (i.e., the proportion of unimmunized animals), introduction frequency, and the proportion of animals from other sources. These variables are closely related to the epidemic pattern of brucellosis, directly reflecting herd susceptibility and revealing potential outbreak risks.
The herd immunity gap was calculated based on official vaccination records rather than serological ELISA values. It was defined as:
where denotes the number of animals vaccinated within the recommended vaccination period, and represents the total number of animals eligible for vaccination.
Breeding density refers to the number of breeding animals per unit grazing area and was calculated as:
where is the number of breeding animals and is the grazing area.
Abnormal lambing rate represents the proportion of lambing events with reproductive abnormalities and was calculated as:
The unique natural conditions of the highlands have a significant impact on animal immunity, disease susceptibility, and pasture management practices. To conclude, this study designed environmentally sensitive characteristics such as the number of days with extremely low temperatures, the negative heat stress index, the timing of seasonal migration, the variation in the reproductive cycle caused by high altitude, and the grassland resource stress index based on grazing density. These indicators can more intuitively characterize the inducing effect of the plateau environment on potential brucellosis outbreaks, thus providing regionally adapted input information for the model.
The Temperature–Humidity Index (THI) was calculated to quantify environmental heat stress using the standard formulation:
where represents ambient temperature (°C) and denotes relative humidity (%). Daily THI values were averaged within each monitoring period.
To characterize cold stress exposure under plateau conditions, a Negative Heat Stress Index (NHSI) was constructed as:
where represents the daily mean temperature, is the number of days within the month, and was set to −5 °C based on regional livestock cold-stress reference standards.
The Grassland Resource Stress Index (GRSI) was defined to quantify forage pressure as:
where is breeding density and represents the standardized grassland quality score (scaled between 0 and 1) derived from seasonal pasture condition assessments. Higher GRSI values indicate stronger grazing pressure relative to resource availability.
Based on GPS data and records provided by herders, this study constructed simplified contact network characteristics among herds. An edge between herd and herd was defined when either: (1) the spatial distance between the two herds during grazing or migration was less than 1.5 km for at least 24 cumulative hours within the same month; or (2) both herds were recorded to share the same pasture or public water source during seasonal migration. The resulting network was modeled as an undirected and unweighted graph, due to incomplete high-resolution temporal tracking for all herds.
For herds lacking continuous GPS data, proxy contacts were constructed using seasonal co-grazing records, shared migration routes, and officially logged introduction records.
Network degree refers to the number of direct contact connections that a given herd has with other herds within the constructed contact network. It was calculated as:
where indicates contact between herd and herd .
Network density represents the overall connectivity level of the herd contact network and was calculated as:
where denotes the total number of edges and is the number of herds.
These characteristics help depict the transmission chains between different pastures and identify hidden high-risk nodes. Based on this, the model can obtain more structured information support when conducting brucellosis outbreak early warning and helps to understand potential transmission patterns.
Management-related variables (e.g., barn disinfection frequency, introduction logs, quarantine status, and herd isolation measures) were obtained from officially recorded veterinary supervision documents and pasture management logs rather than retrospective self-report questionnaires. To reduce reporting bias, records were cross-validated with vaccination databases and introduction permits issued by local animal health authorities. Variables with inconsistent or incomplete documentation were excluded during data cleaning.
Considering the relatively small number of positive samples, this study employed the SMOTE technique [29] to balance the data and reduce model bias. To prevent data leakage, SMOTE was applied exclusively to the training set after temporal data splitting, while validation and test sets remained untouched. No synthetic samples were generated from validation or future observations. Simultaneously, continuous variables were standardized, and a sliding window feature was designed for the time series data, enabling the model to capture trend changes before the brucellosis outbreak. A 3-month historical window (t − 3, t − 2, t − 1) was used to generate lagged features for key epidemiological and environmental variables, including seropositivity rate, abortion rate, THI, introduction frequency, and network density. The step size was 1 month. For environmental extremes, monthly cumulative values were used. These processing methods improved the model’s prediction accuracy and stability, thus providing more reliable support for subsequent early warning analysis.
To evaluate the effectiveness of SMOTE in handling class imbalance, we conducted comparative experiments between models trained on the original dataset and those trained with SMOTE-based resampling. The results showed that SMOTE significantly improved sensitivity (from 0.71 to 0.84) and PR-AUC (from 0.62 to 0.74), while maintaining stable specificity.
In addition, we tested the Synthetic Minority Over-sampling Technique combined with Edited Nearest Neighbors (SMOTEENN) [30] hybrid resampling strategy as suggested by recent studies. Although SMOTEENN slightly improved precision, it resulted in increased variance across folds and a reduction in early-warning lead time stability. Considering that early-warning systems prioritize sensitivity and temporal stability over marginal gains in precision, the SMOTE method was retained in the final model.
2.4. Ensemble Model Construction
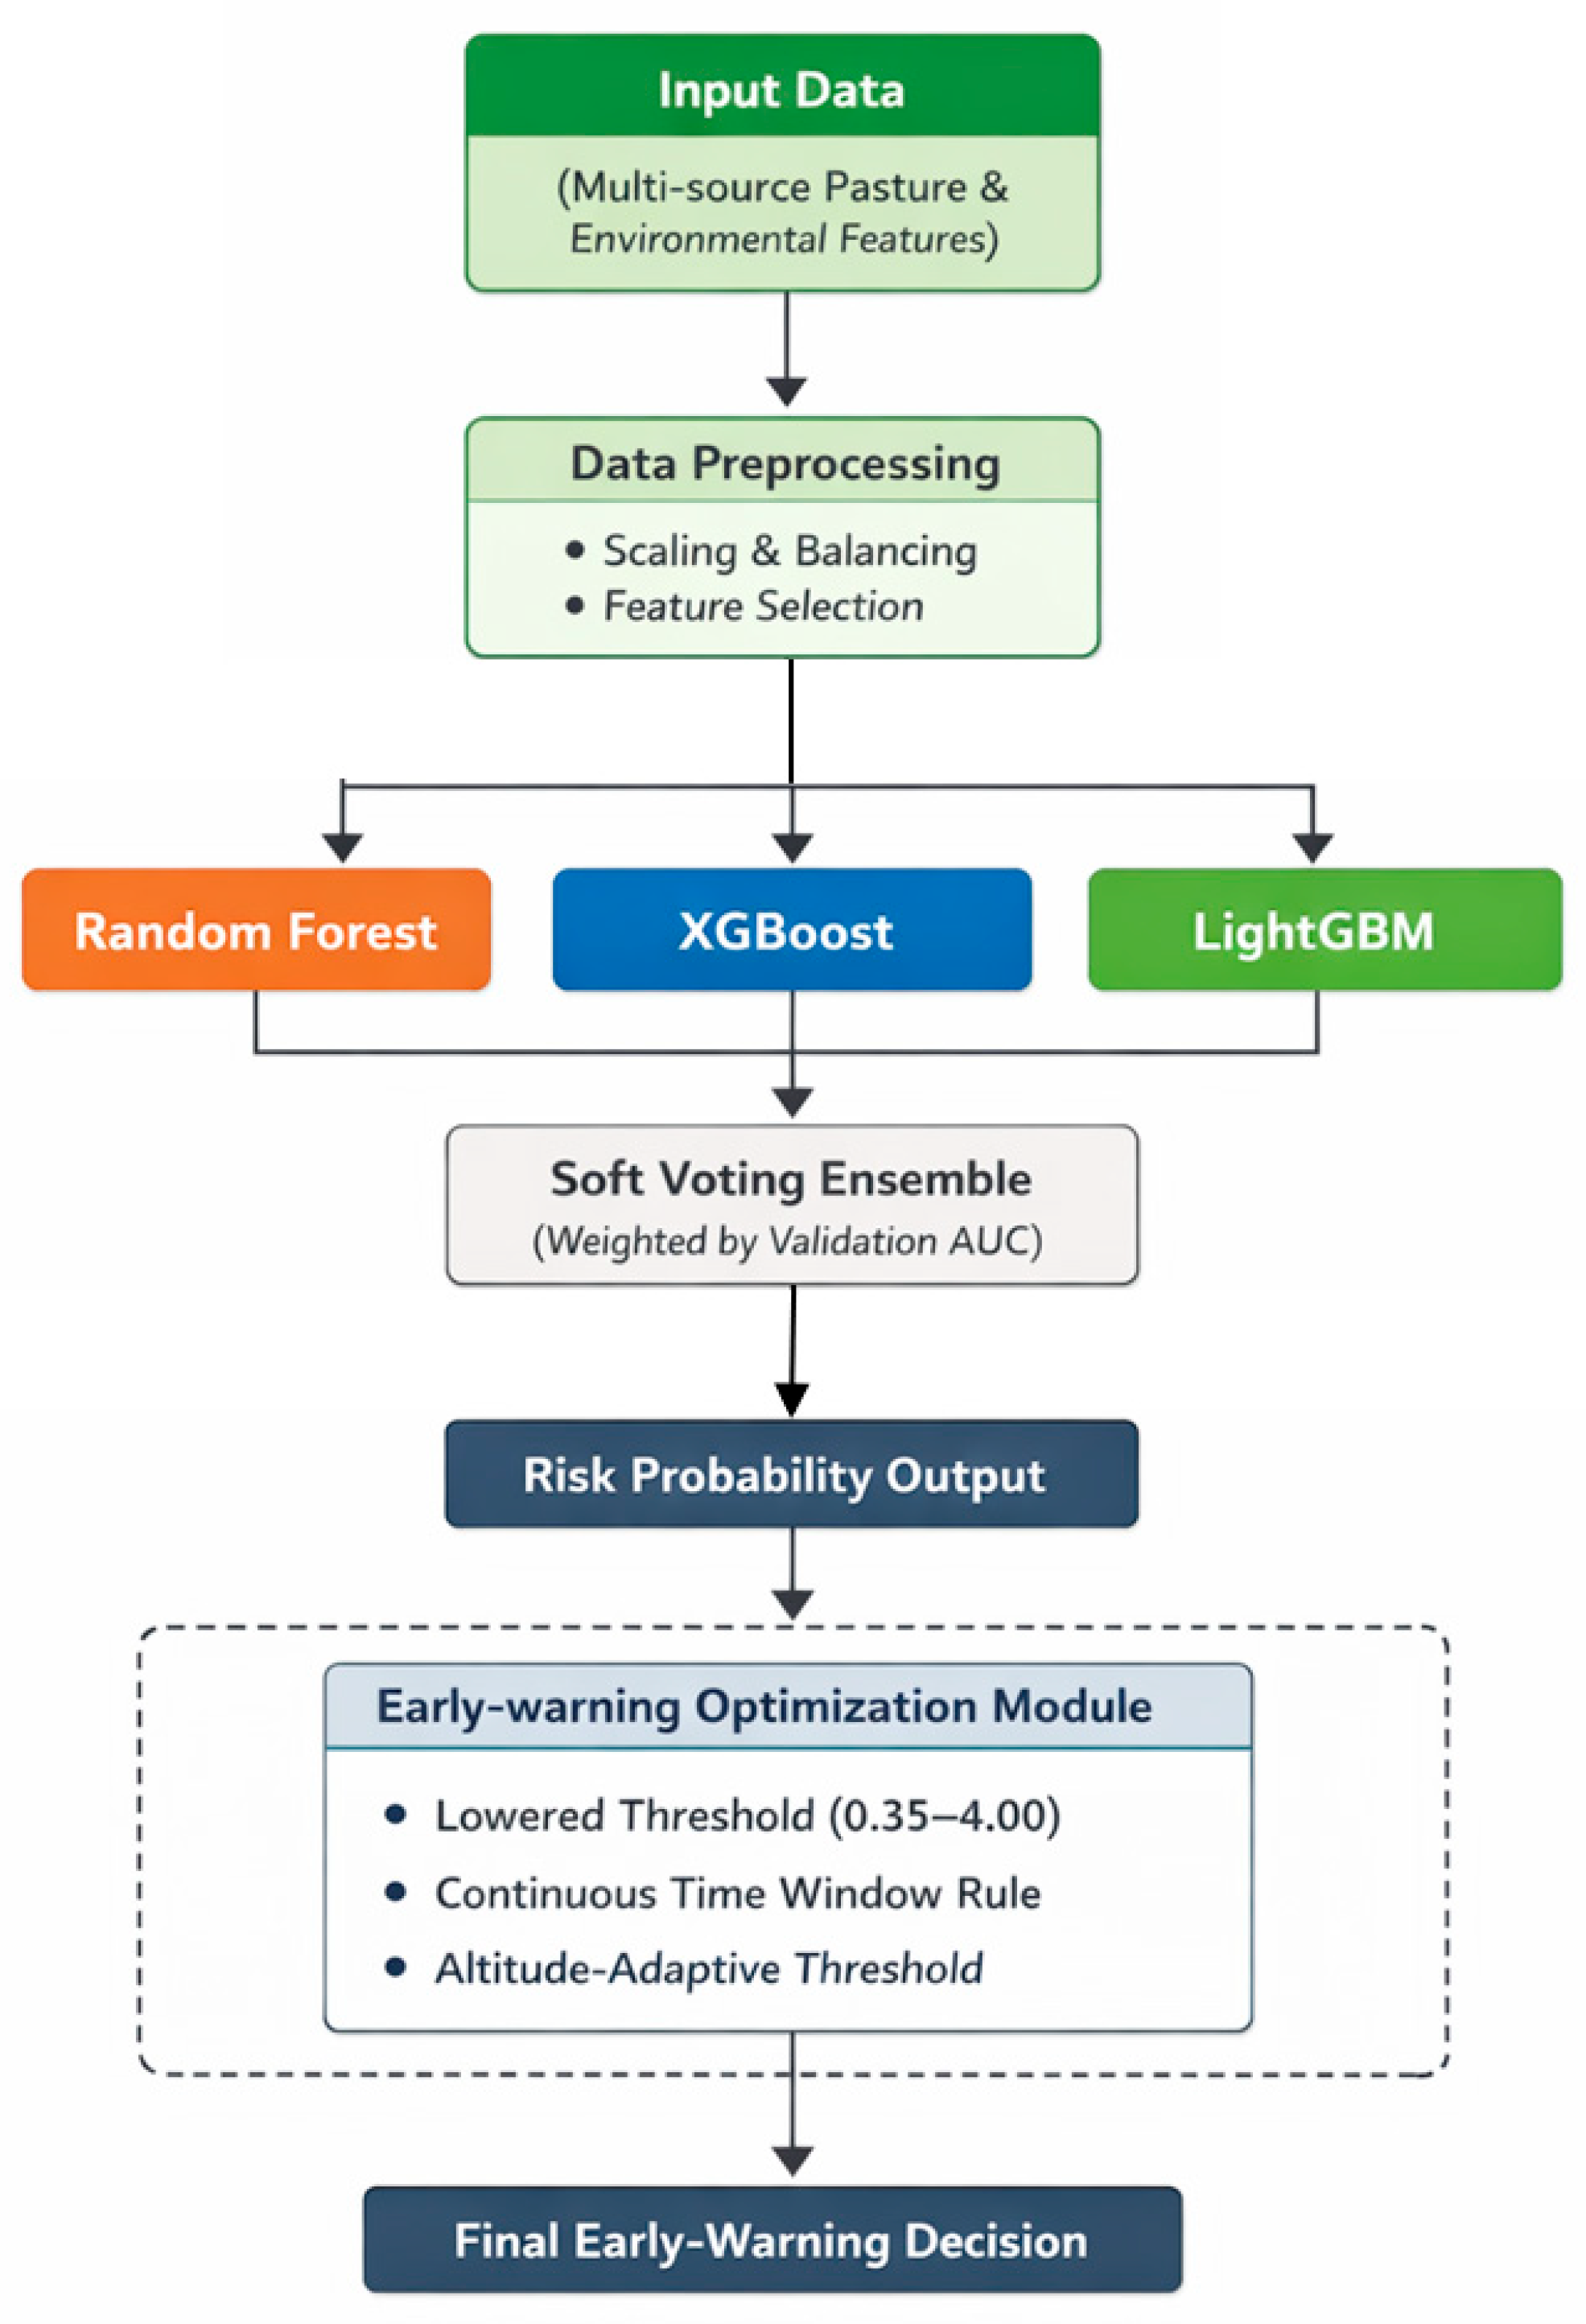
To achieve early identification of brucellosis outbreak risk in high-altitude pastures, this study constructs an early warning model based on an ensemble learning framework. The overall architecture of the proposed model is illustrated in Figure 3, which presents the complete workflow from multi-source data input to final early-warning decision making.
As shown in Figure 3, to improve data quality and model robustness, feature scaling, sample balancing, and feature selection were performed on multi-source pasture and environmental data. All preprocessing procedures were conducted exclusively within the training set to prevent data leakage, and identical transformations were subsequently applied to the validation set. Then, the base learners of the ensemble model were used to capture various nonlinear relationships in the complex feature space. Finally, the predicted risk probabilities generated by each base learner were integrated through a soft voting ensemble strategy, enabling the model to take advantage of the complementary advantages between different learning paradigms.
Pasture disease monitoring samples are characterized by limited quantity, class imbalance, and high variable dimensionality. Therefore, compared with single-model methods, ensemble learning can more comprehensively represent complex and heterogeneous data patterns, thereby improving prediction stability and significantly reducing the probability of missed detections [21].
Within the training period (July 2019–December 2022), five-fold cross-validation was implemented to estimate model performance and derive ensemble weights. The validation period (January 2023–June 2024) remained strictly independent for final evaluation.
2.4.1. Base Learners
Given the limited sample size, multidimensional variables, and nonlinear correlations among features in brucellosis data from high-altitude pastoral areas, this study selected Random Forest (RF), XGBoost, and LightGBM as the basic learners. Among them, Random Forest, through its ensemble strategy, utilizes multiple decision trees to improve noise resistance and the ability to represent feature interactions, and exhibits good stability in high-dimensional variables. XGBoost employs a gradient boosting framework combined with regularization mechanisms, maintaining high predictive performance even with imbalanced data and a small number of outliers, making it suitable for low-positivity applications like brucellosis. LightGBM, on the other hand, significantly improves training speed through a histogram-based splitting strategy and exhibits good adaptability to high-dimensional features, effectively capturing “weak signal” features under multi-source data integration conditions.
Figure 3.
Ensemble early-warning model framework.
To ensure the research results have a basis in traditional statistical comparison, this study uses Logistic Regression as the model baseline. It is emphasized that Logistic Regression was used solely as an independent comparator and was not applied as a meta-learner in the ensemble framework. Hyperparameter optimization was conducted using grid search within predefined parameter ranges informed by prior literature to avoid excessive parameter exploration under limited sample conditions. Model selection during cross-validation was primarily based on PR-AUC due to class imbalance, with sensitivity used as a secondary criterion to reduce missed detections. The key hyperparameters of each base learner and the meta-learner are summarized in Table 2. Parameter tuning was performed to balance predictive accuracy and model stability under sparse outbreak conditions.
Table 2.
Hyperparameters of base learners and meta-learners are used in the ensemble model.
2.4.2. Soft Voting Strategy
After the basic learners have completed independent training, this study uses a soft voting ensemble strategy to fuse the probability outputs of the three models. Unlike hard voting, which only focuses on classification results, soft voting uses a weighted average based on model predicted probabilities, making it more suitable for early warning systems centered on risk assessment and continuous risk monitoring.
For each base learner , the mean out-of-fold AUC across five cross-validation folds was calculated as:
where denotes the validation AUC of model in fold .
The ensemble weights were then normalized according to:
this procedure guarantees that weight assignment is proportional to cross-validated discriminatory performance and is fully reproducible.
The final predicted probability of the ensemble model can be expressed as:
where the weights , , and are automatically adjusted by the AUC performance of the validation set to improve overall predictive ability. In this way, different models complement each other’s understanding of data features. The soft voting strategy not only improves the smoothness of prediction but also enhances the system’s responsiveness to minor risk signals, making it suitable for trend identification and risk escalation monitoring before brucellosis outbreaks.
2.4.3. Probability Calibration Assessment
Given that early warning decisions depend on probability thresholds, probability calibration was evaluated to assess reliability. Calibration performance was assessed using the Brier score and reliability (calibration) curves on the independent validation set.
No additional Platt scaling or isotonic regression was applied, as the limited sample size may introduce overfitting in secondary calibration layers. The ensemble averaging mechanism inherently contributes to probability smoothing. This limitation is acknowledged in the Discussion section.
2.4.4. Early-Warning Sensitivity Optimization
Considering that the risk of latent transmission of brucellosis in pasture settings may accumulate gradually, sensitivity was prioritized in the early-warning design to improve timely detection of emerging outbreaks.
The early-warning threshold was determined using validation-set ROC and PR curve analyses. Given the asymmetric risk structure in pastoral disease monitoring—where missed detection may lead to sustained transmission—threshold selection prioritized sensitivity under acceptable false positive rates. The optimal threshold identified on the validation set was 0.38, and this value was fixed before final evaluation on the independent test period.
Compared with the conventional 0.5 classification cutoff, the selected threshold significantly improved sensitivity while maintaining acceptable specificity, thereby reducing the risk of missing high-risk herds.
To avoid false alarms caused by transient fluctuations, a continuous time window-based rule was introduced. A sensitivity analysis comparing one-, two-, and three-consecutive exceedance rules was conducted. While a single exceedance increased false positive rates and three consecutive exceedances reduced early detection sensitivity, the two-consecutive rule provided the most balanced trade-off between detection timeliness and stability. Therefore, the two-consecutive exceedance rule was adopted in the final system.
Finally, to account for ecological heterogeneity across altitude gradients, altitude-stratified validation analysis was performed. Results indicated that high-altitude pastures exhibited earlier risk signal amplification. Accordingly, a slightly lower threshold was applied for high-altitude regions to enhance early detection sensitivity, improving the regional adaptability of the early warning system.
2.5. Model Evaluation
To systematically evaluate the performance of the ensemble learning-based early warning model for brucellosis in high-altitude pastures, this study adopted a hierarchical data partitioning and validation strategy to ensure robustness under environmental heterogeneity and class imbalance. To avoid temporal leakage and better reflect real-world early warning scenarios, a time-based split was adopted rather than random partitioning. Data from July 2019 to December 2022 were used for model training, while data from January 2023 to June 2024 were reserved for independent validation. Five-fold cross-validation was conducted within the training period only to reduce model variance and improve generalization performance.
In addition, to better simulate real-world prospective deployment, a time-series cross-validation strategy (rolling-origin evaluation) was implemented within the training period. Specifically, models were iteratively trained on an expanding historical window and validated on the immediately subsequent time block. As a sensitivity analysis, a leave-one-year-out validation scheme was also conducted to assess inter-annual generalization stability.
Model performance was quantified using multidimensional evaluation metrics. Prediction results were converted into binary classification labels based on a set threshold θ. Given the class imbalance inherent in outbreak prediction, PR-AUC was designated as the primary discrimination metric, while ROC-AUC was reported as a complementary indicator to facilitate comparison with previous studies, PR-AUC more accurately reflects the model’s ability to identify positive events under imbalanced conditions [31]. Furthermore, when the proportion of positive samples was low, this study introduced PR-AUC to compensate for the shortcomings of ROC in imbalanced data and more accurately reflect the model’s ability to identify positive events.
Accuracy, Sensitivity (Se), Specificity (Sp), and F1-score are traditional evaluation indicators, and their mathematical definitions are as follows:
TP, TN, FP, and FN represent the number of true positives, true negatives, false positives, and false negatives, respectively. Sensitivity is particularly important in early warning tasks because it reflects the model’s ability to capture potential outbreak risks; missed reports can lead to serious control consequences.
To provide a comprehensive operational assessment, threshold-specific Se, Sp, and F1-score were reported at multiple operating points around the selected threshold, thereby illustrating the trade-offs between detection sensitivity and false-alarm control. To verify the applicability and field control value of the ensemble learning early warning system in actual pasture environments, this study systematically compared the risk probabilities output by the model with multi-source field data. First, using the manual monitoring records of grassroots veterinarians as a benchmark, the model’s ability to provide early warnings to managers before symptoms appear or before the discovery of suspicious individuals was assessed, thereby determining its consistency and reliability in actual operation. Second, the time when the model issued its first risk warning was compared with the time when the actual positive sample was first diagnosed to calculate the lead time. The lead time for early warning is defined as:
where is the time point when the system first predicts the risk probability to exceed the threshold, and is the time point when a confirmed positive individual is detected. positive lead time indicates that the model can identify outbreak risks in advance, helping to secure a critical time window before on-site sampling, isolation, and vaccination booster.
To better characterize the timeliness of early warning, lead time was summarized using distributional statistics, including median, interquartile range (IQR), and 95% confidence intervals, in addition to the mean value.
Furthermore, to quantify the incremental value of the proposed ensemble model, its performance was compared with practical baseline approaches, including (i) a seasonal-naïve model based on historical monthly averages and (ii) a rule-based surveillance strategy derived from conventional monitoring thresholds. Comparative analyses were conducted using PR-AUC, ROC-AUC, and threshold-specific classification metrics.
Finally, this study compared the model’s predictions with historical brucellosis outbreak records to verify its ability to accurately capture the temporal structure characteristics and pattern changes of past outbreaks. Through these multi-level validations, the model was demonstrated to not only possess excellent statistical discriminative power but also exhibit strong robustness in real-world scenarios.
3. Results
This section will present the results from the following four aspects: data description, model performance evaluation, early warning capability evaluation, and key risk factors.
3.1. Data Overview
This study ultimately integrated 4826 monitoring records from high-altitude pastoral areas, covering serological test results, clinical manifestations, environmental parameters, and livestock migration data. The overall positive detection rate was 11.4% (n = 549), exhibiting a typical distributional imbalance. By species, cattle accounted for 72% of the sample, and sheep for 28%, consistent with the herd structure of local pastures.
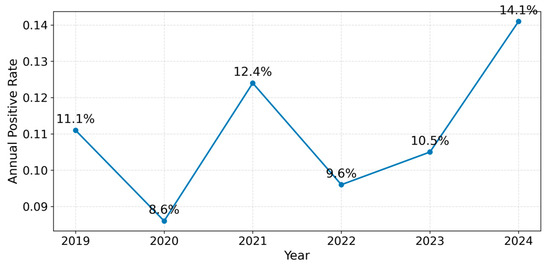
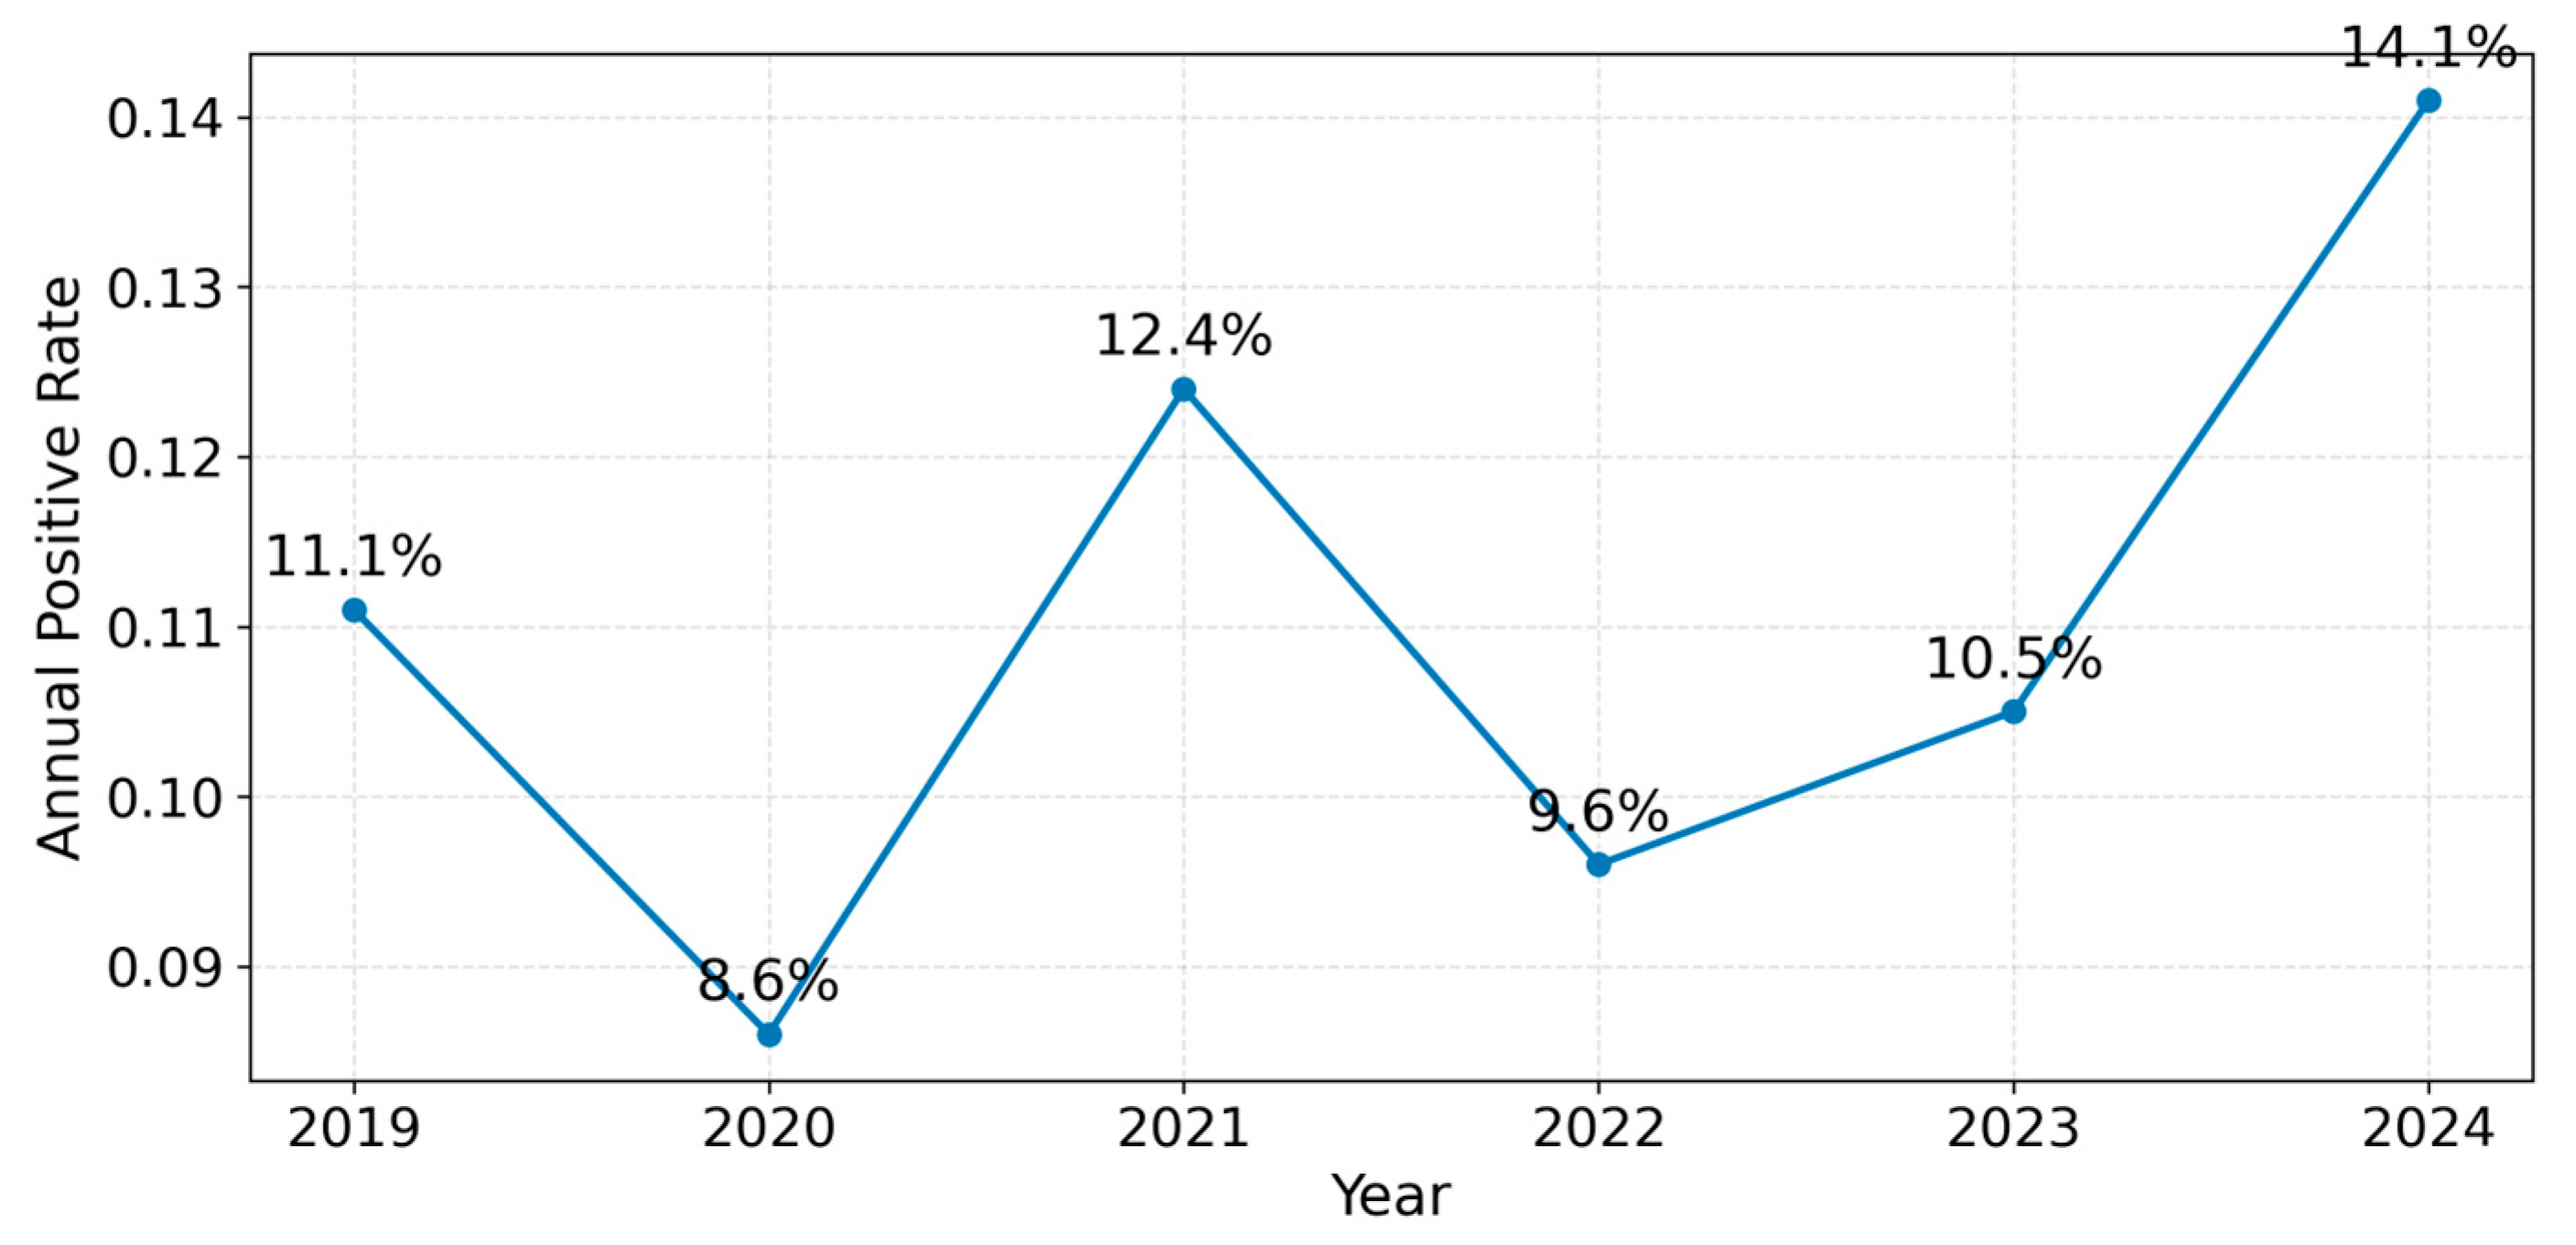
Seasonal analysis showed that the brucellosis positive detection rate exhibited significant periodic fluctuations, with slightly higher positive rates in winter and early spring. This trend coincides with the common seasonal migration time in pastoral areas, indicating that increased herd density and frequency of cross-herd contact during migration may be important factors influencing the risk of outbreaks. As shown in Figure 4, the annual positive rate peaked in the winter of 2021 and the spring of 2023 at a low risk, thus demonstrating a link between seasonality and outbreaks.
Figure 4.
Annual brucellosis positive rate trend.
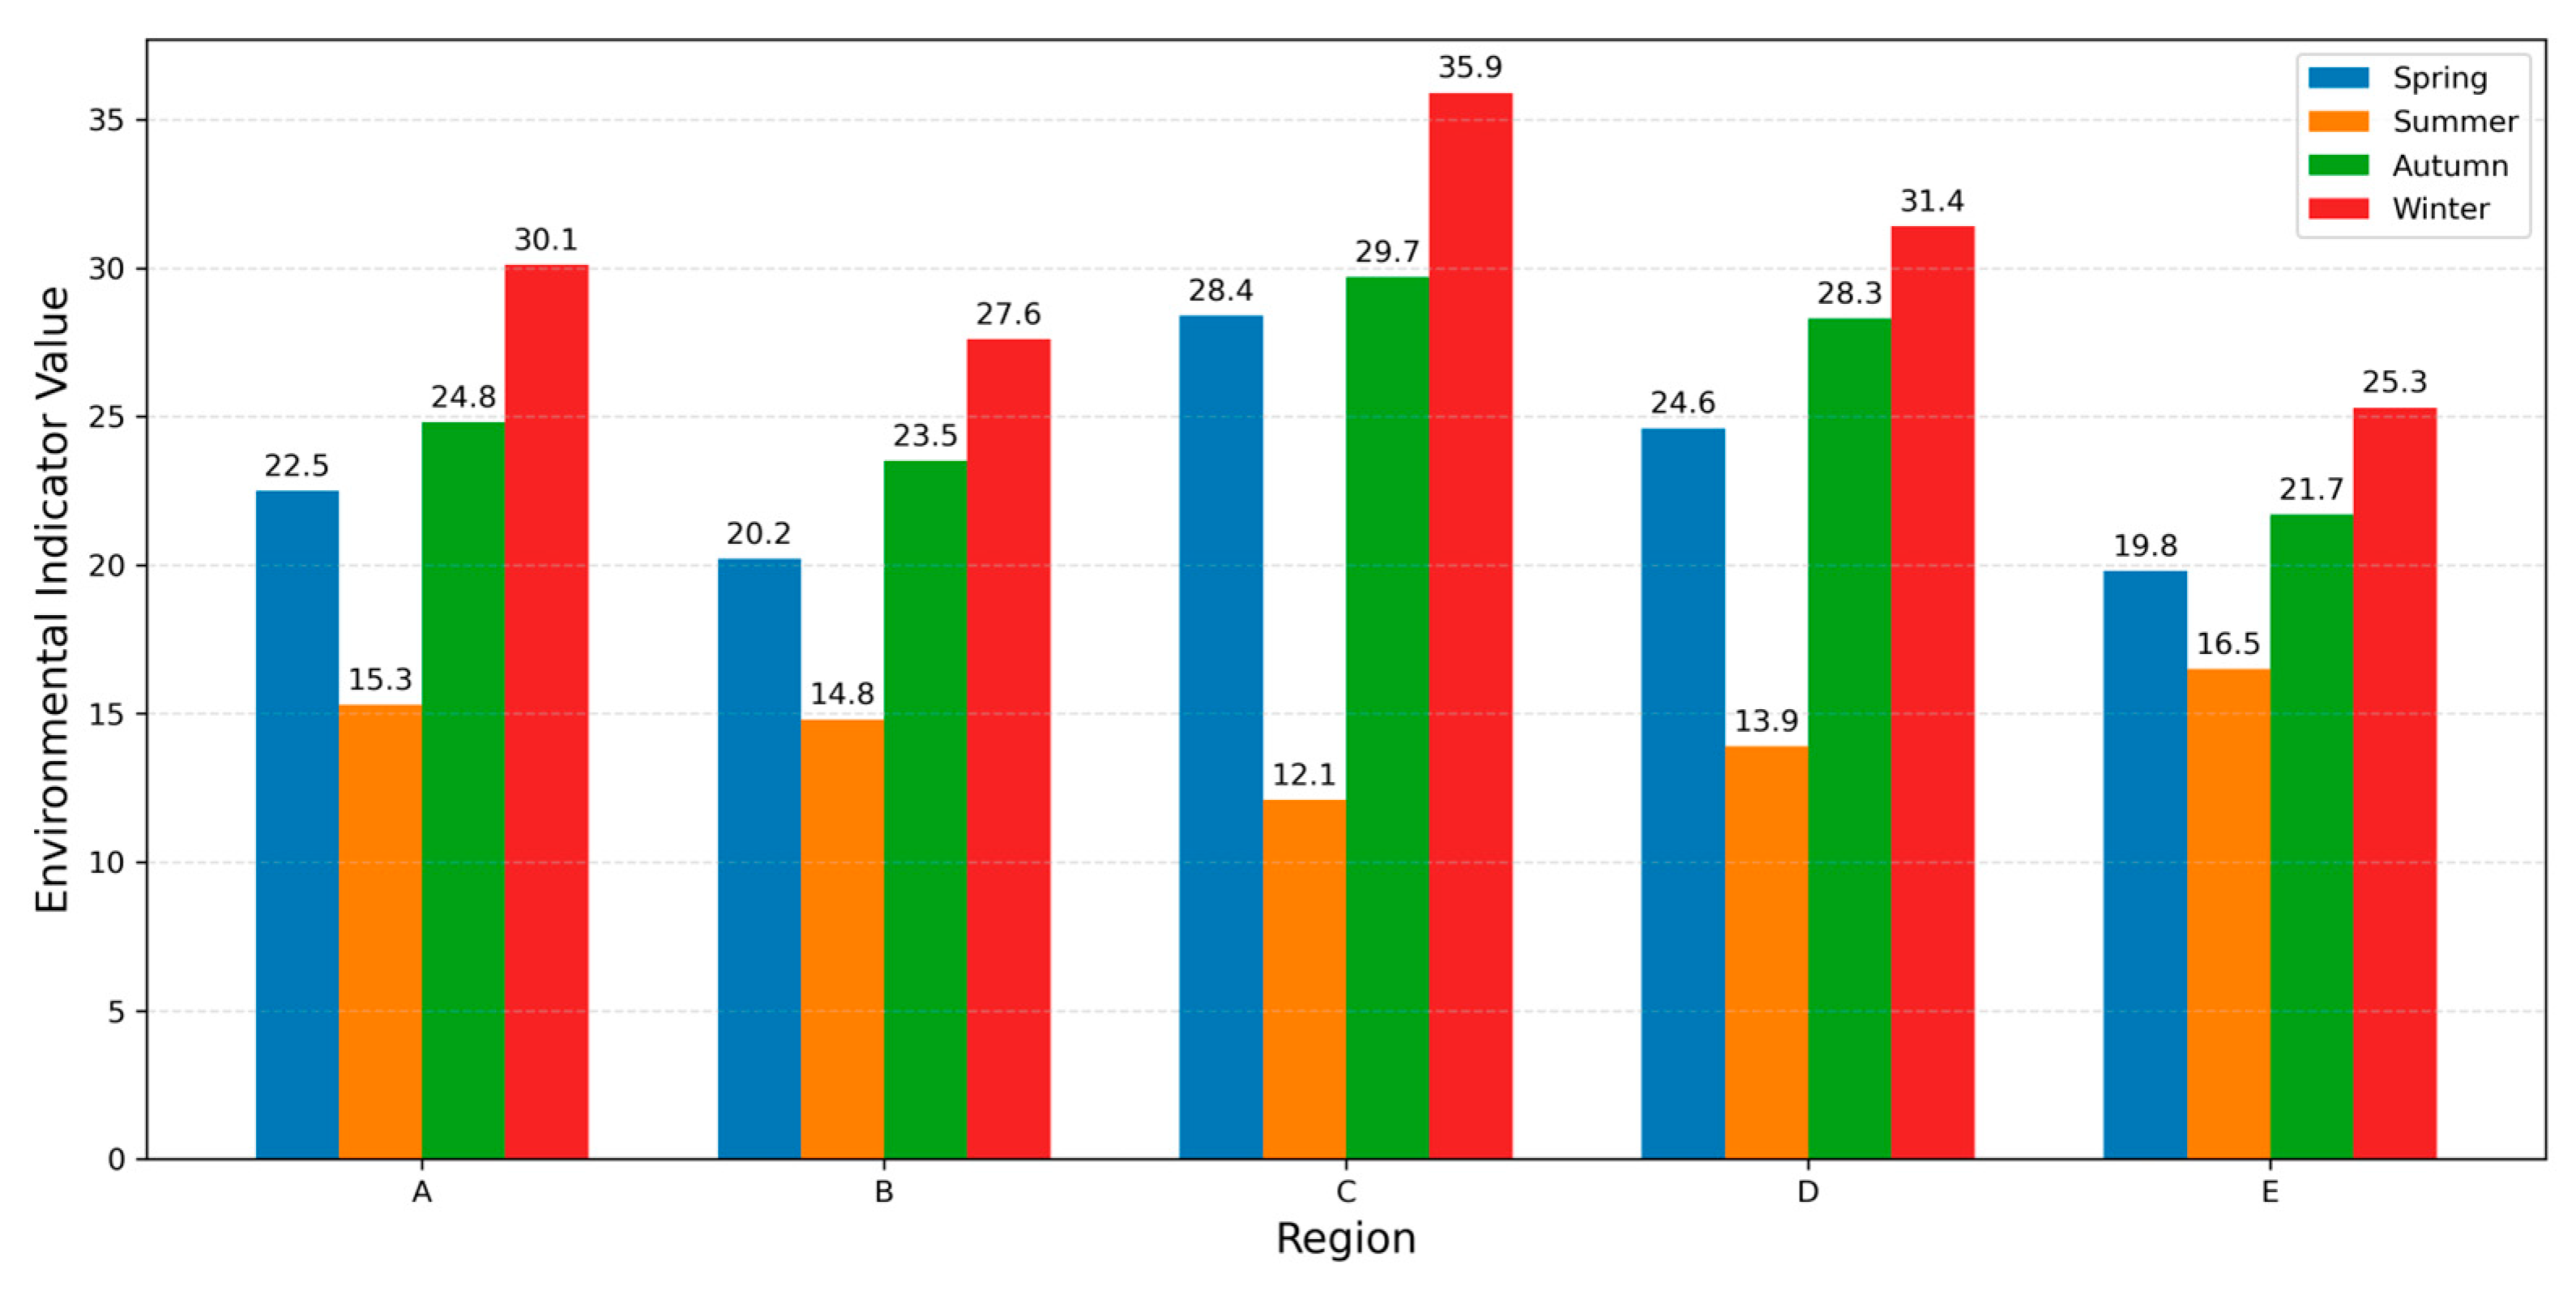
Environmental parameters exhibited clear seasonal and regional heterogeneity (Figure 5). In the plateau region (Region C), the number of days with extremely low temperatures increased markedly during winter, whereas in lower-altitude regions (Regions A and B), the winter increase was comparatively moderate. Conversely, the heat stress index reached its annual minimum during summer across all regions, but the decline was more pronounced in high-altitude areas.
Furthermore, contact network density showed distinct seasonal fluctuations. During herd migration periods (spring and autumn), network density increased substantially in Regions C and D, while remaining relatively stable in Regions A and E. These results demonstrate both seasonal variation and inter-regional differences in environmental stress and contact intensity, suggesting heterogeneous transmission risks across space and time.
Figure 5.
Seasonal and regional variations in environmental stress indicators and contact network density.
3.2. Model Performance Comparison
This section systematically compares the classification performance of each basic learner and the final ensemble model in the early warning task of brucellosis.
3.2.1. Basic Model Performance
This study first systematically evaluated the performance of four basic classification models, including Logistic Regression, Random Forest, XGBoost, and LightGBM, and the results are summarized in Table 3. Overall, there are significant differences among the models in feature representation ability and recognition performance of minority class samples. The Logistic Regression model has an AUC of 0.742, indicating limited overall discriminative ability, especially low sensitivity, reflecting its linear decision boundary’s inability to capture the nonlinear relationship between the complex environmental factors of highland pastures and the risk of brucellosis. In contrast, the three tree-based models exhibit superior nonlinear learning ability. Random Forest achieves an AUC of 0.812, demonstrating a significant advantage in handling multidimensional feature interactions. XGBoost showed more balanced performance, with an AUC of 0.836, maintaining high levels in both F1-score and specificity. LightGBM, with an AUC of 0.829, demonstrated a better PR-AUC under class imbalance conditions, indicating stronger risk sample identification ability in scenarios with a low proportion of positive samples.
Table 3.
Performance comparison of the four base models and the ensemble model.
The ROC curves of the base models are shown in Figure 6. The curves of the three tree models significantly outperformed the Logistic Regression model, further validating the applicability of nonlinear models in this task. As shown in Figure 7, the Precision–Recall curves further highlight the advantage of tree-based models under imbalanced outbreak conditions. Compared with logistic regression, ensemble learners maintain substantially higher precision in the medium- to high-recall region, indicating stronger robustness in identifying early-stage brucellosis risks.
3.2.2. Ensemble Model Performance
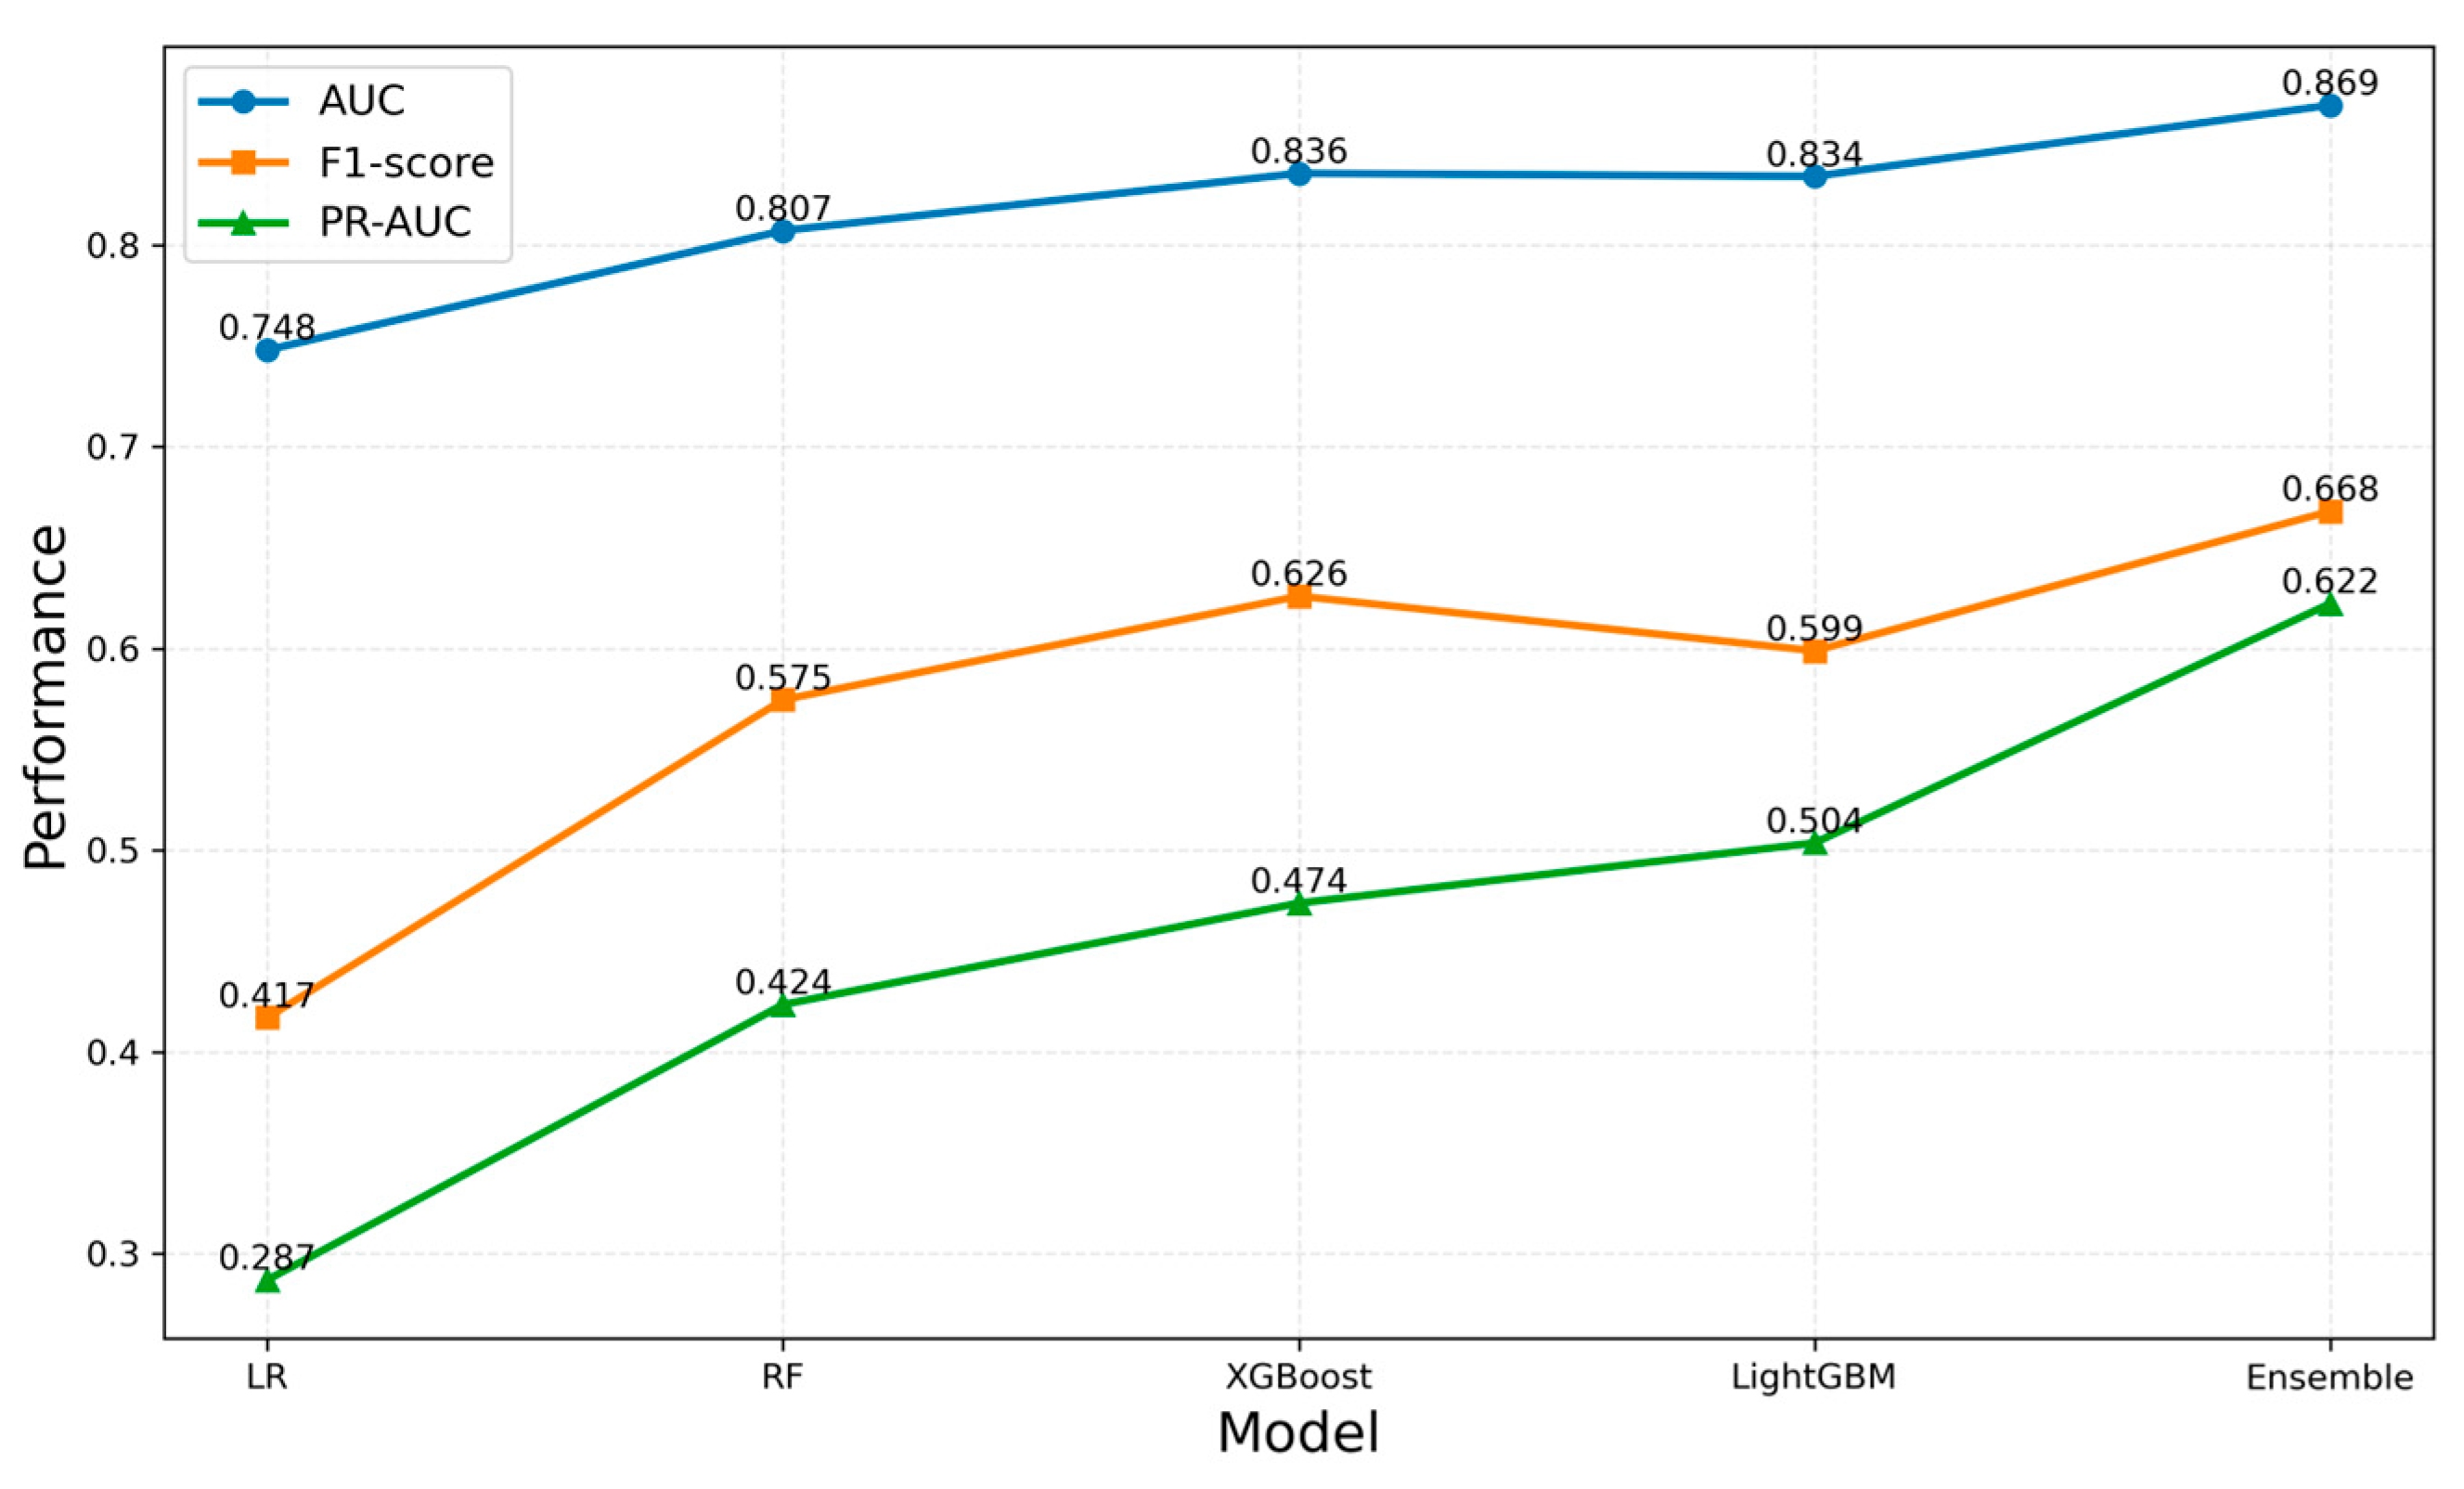
Based on the evaluation of the base models, this study further constructed a weighted soft-voting ensemble model to improve the stability and generalization ability of brucellosis risk assessment. Compared with the four individual models, the ensemble model achieved the best performance on all key performance indicators, with a validation set AUC of 0.869, exhibiting the highest classification discrimination. Under the default threshold, the model’s sensitivity was 0.78 and specificity was 0.81, showing a relatively balanced identification ability. Considering the need for “high sensitivity” in early warning systems, the sensitivity can be further improved to 0.87 by lowering the decision threshold, while the specificity remains within an acceptable range. The PR-AUC of the ensemble model is 0.648, showing that it can still effectively identify key at-risk individuals even with a low proportion of positive samples. Figure 8 shows a comparison of the ensemble model and the base model in terms of AUC, F1-score, and PR-AUC. The results show that the ensemble strategy significantly improves predictive performance and early warning consistency, fully demonstrating its rationality as the final early warning model.
Figure 6.
ROC curves of the baseline models.
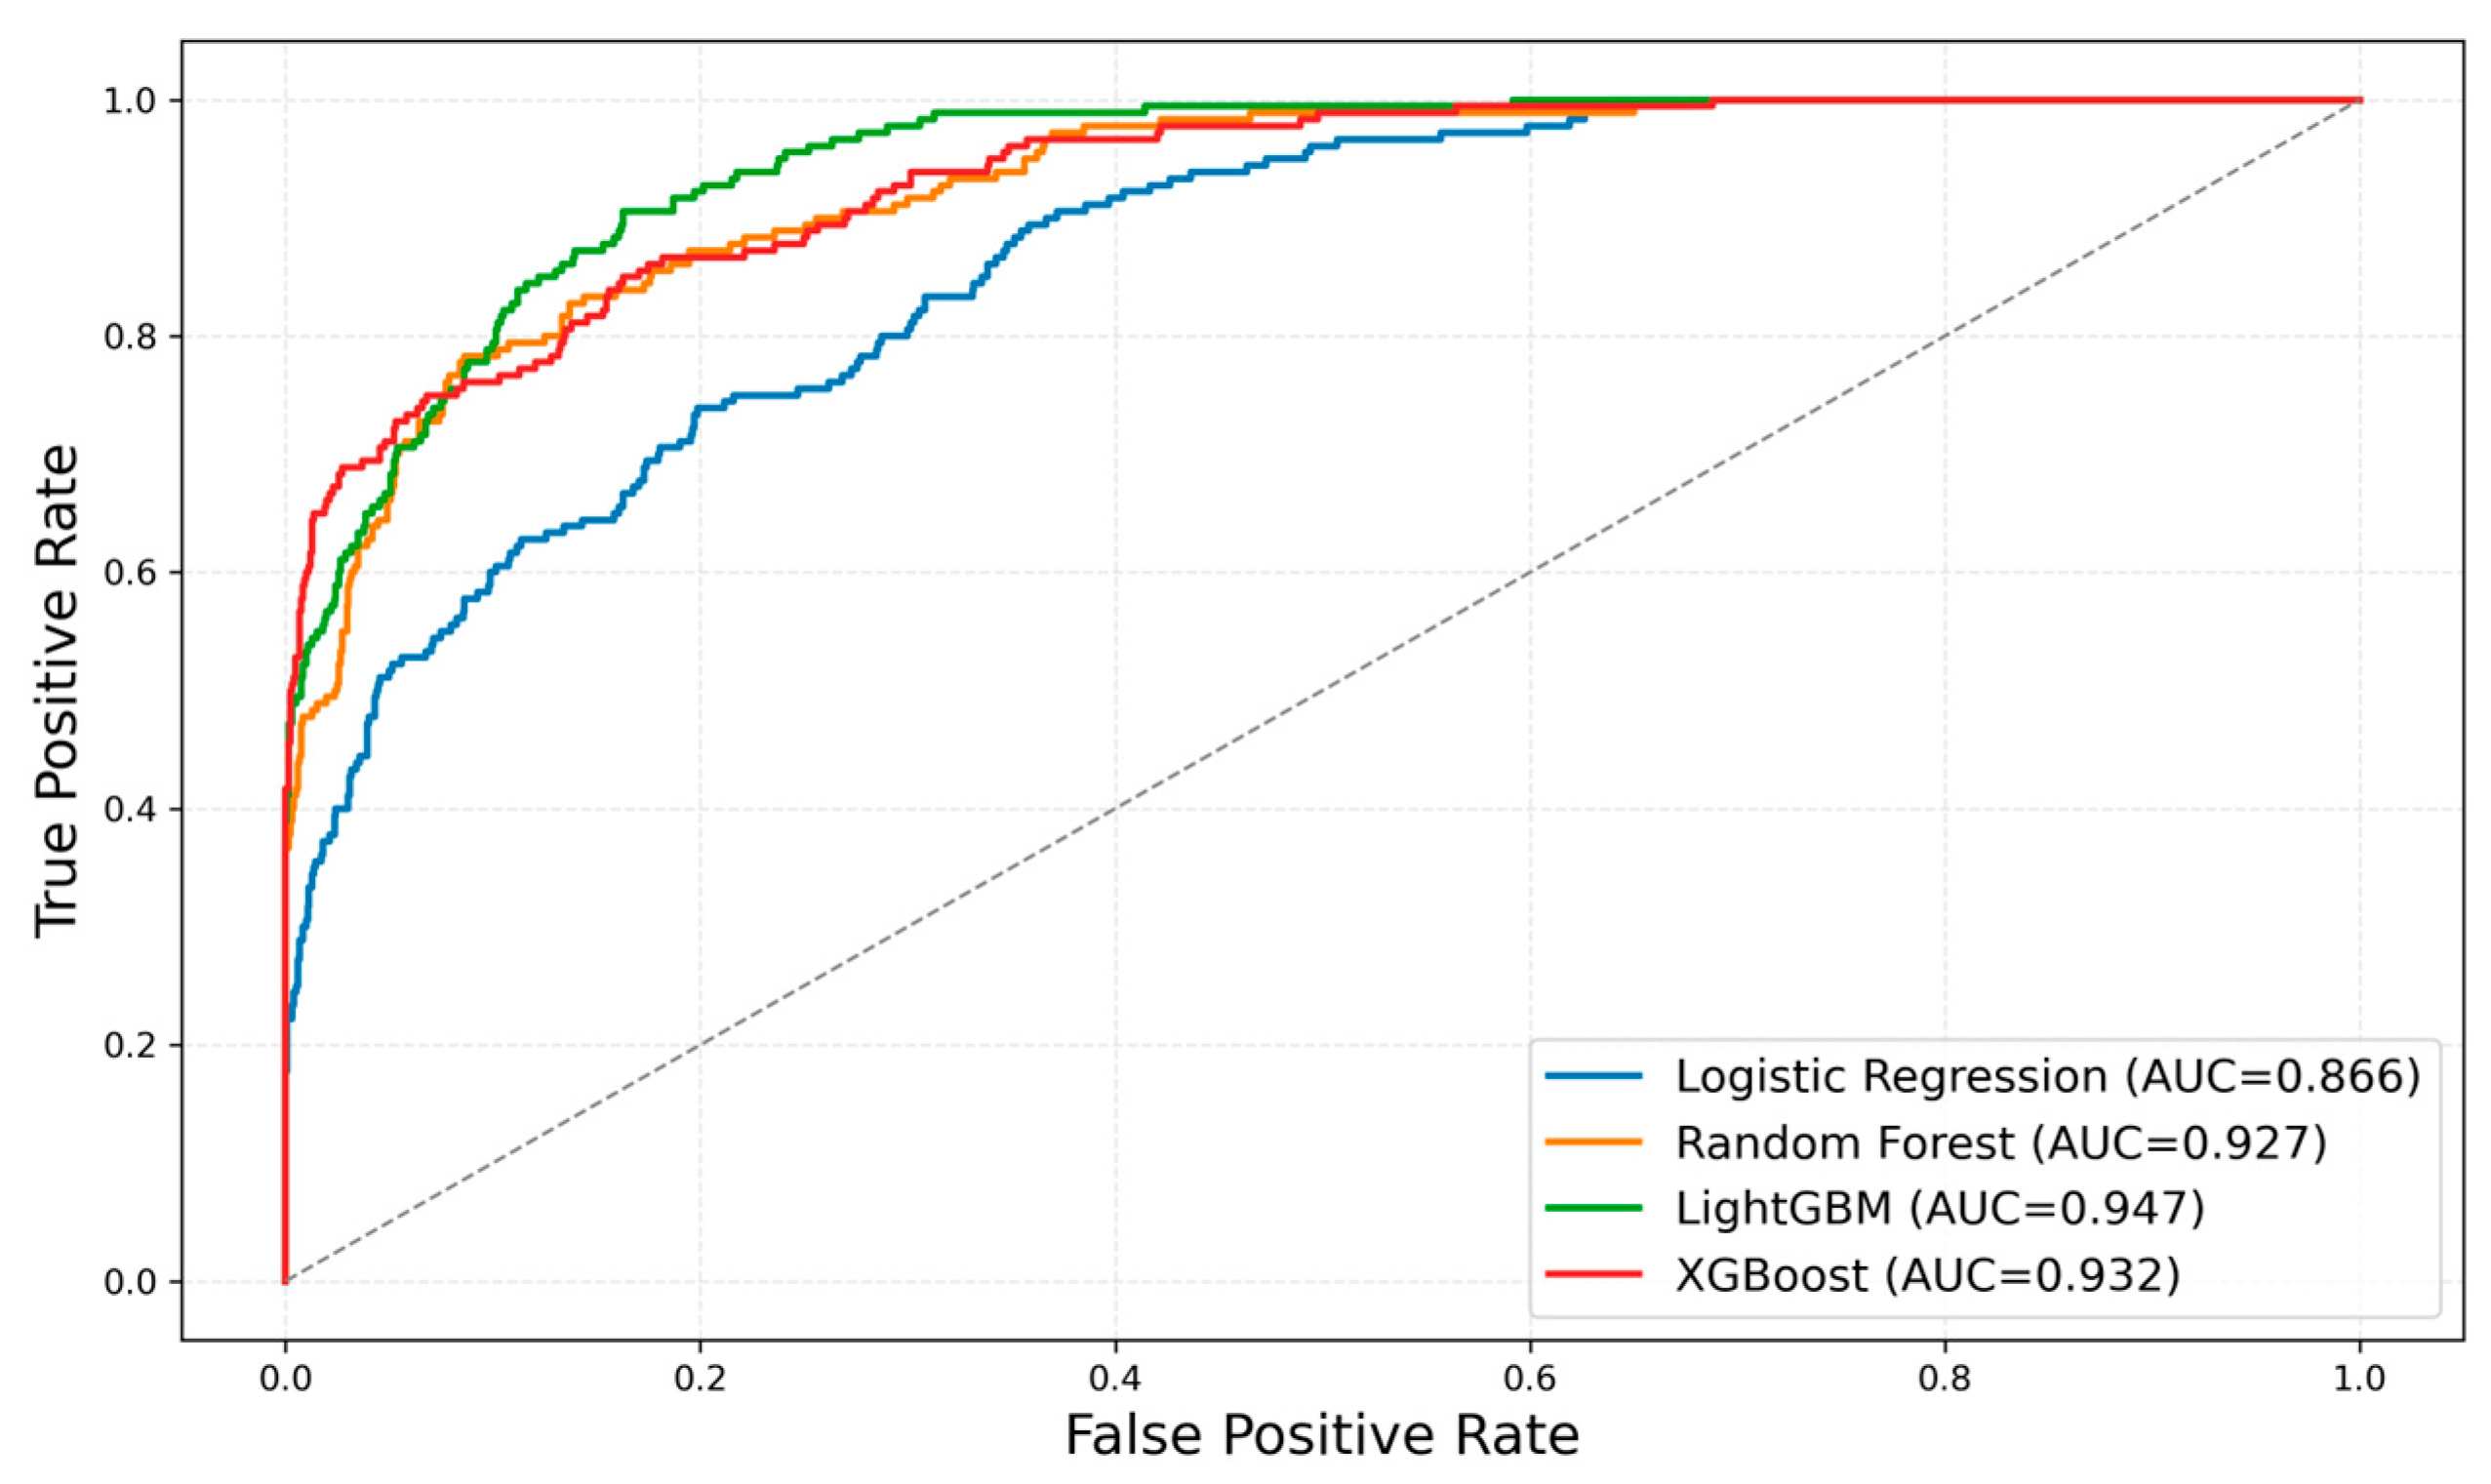
Figure 7.
Precision–Recall curves of baseline and ensemble models.
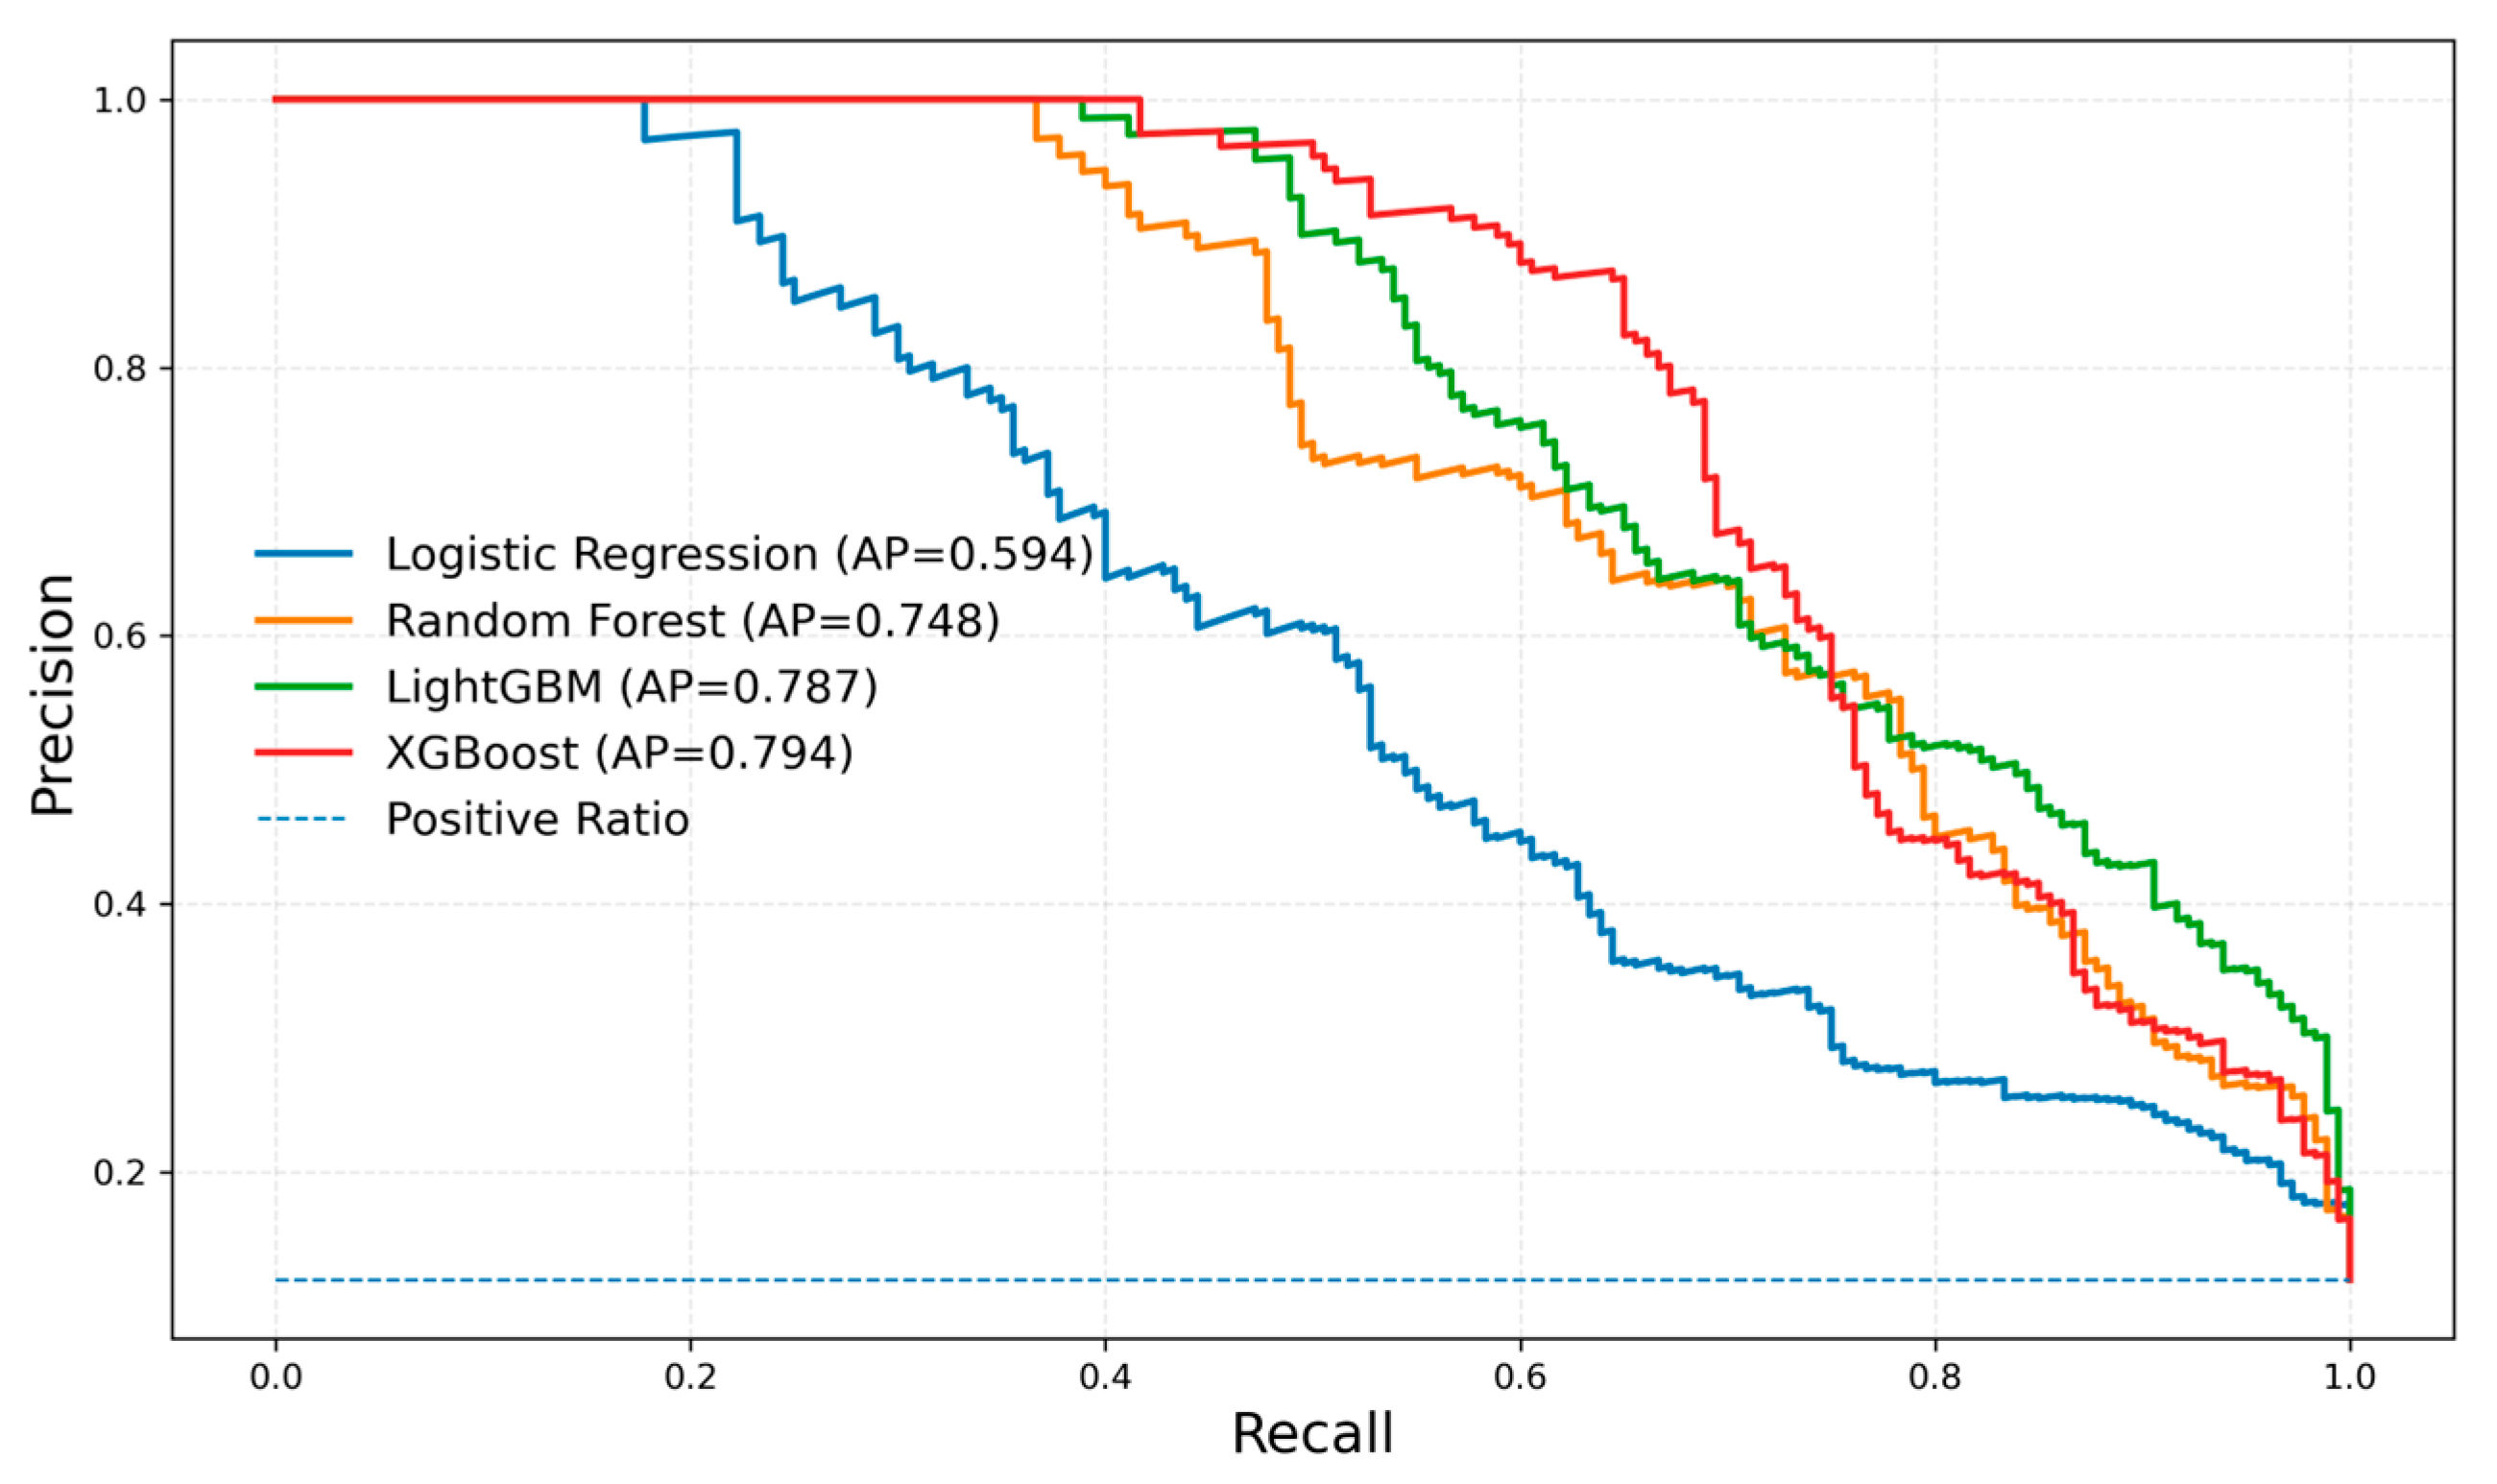
Figure 8.
Performance comparison of baseline and ensemble models.
3.3. Early Warning Capability
This section systematically evaluates the practical application capability of the ensemble learning early warning system from three aspects: threshold optimization, improved early warning stability, and the model’s lead time in real outbreak events. The results show that the multi-strategy combination proposed in this study significantly enhances the sensitivity and stability of the model in the early identification of brucellosis in high-altitude pastures, providing a practically valuable technical tool for risk management.
3.3.1. Threshold Optimization
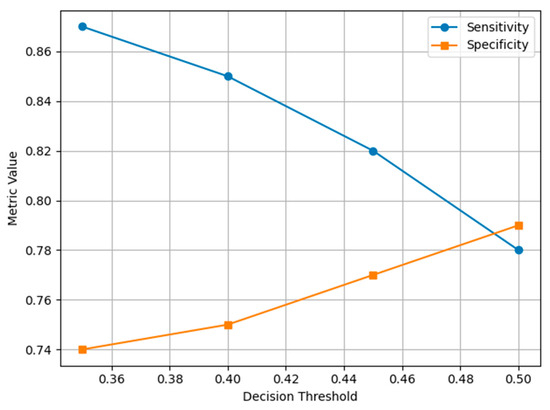
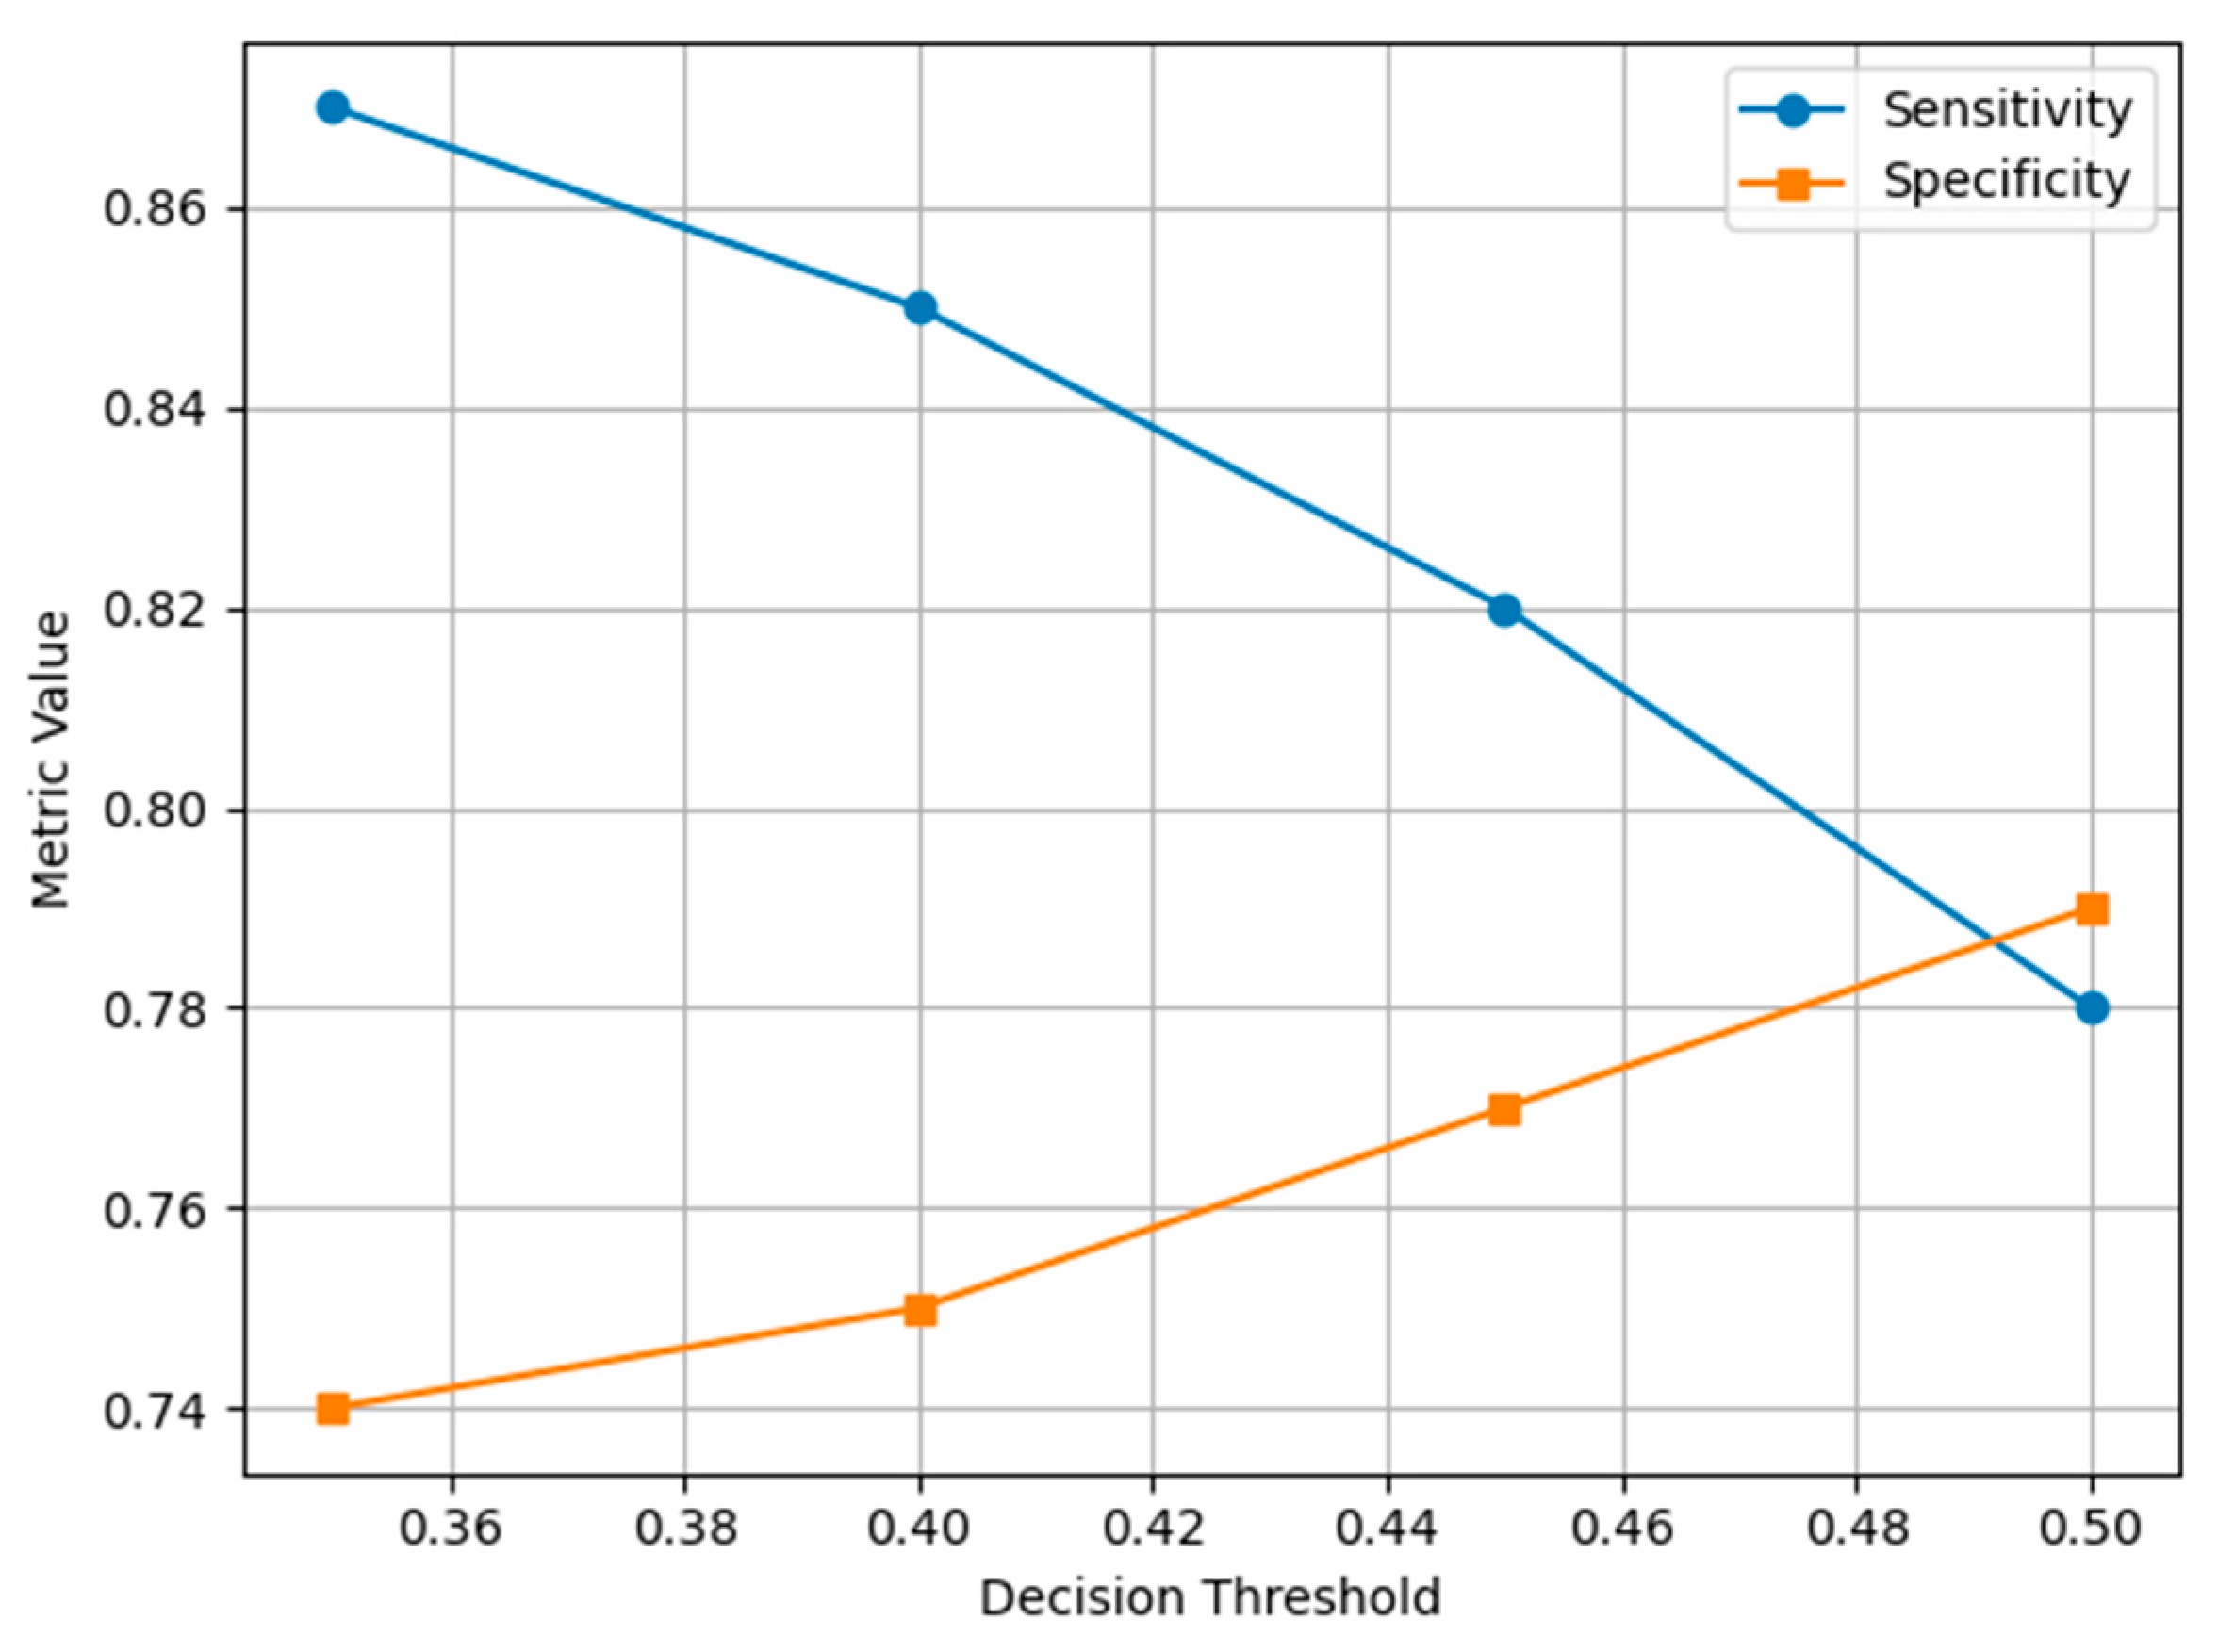
Considering the strong demand of early warning systems for minimizing false negatives, this study systematically adjusted the decision threshold of the ensemble model. When the default threshold was lowered from 0.50 to 0.35, the model’s sensitivity increased substantially from 0.78 to 0.87, enabling the identification of a larger proportion of potentially at-risk individuals. In contrast, specificity exhibited only a modest decline to 0.74, indicating that the increase in false positives remained within an acceptable range.
As illustrated in Figure 9, decreasing the decision threshold results in a clear improvement in sensitivity, which is critical for early warning applications, while the corresponding reduction in specificity is relatively limited. These findings suggest that, compared with conventional diagnostic systems that primarily emphasize high specificity, a sensitivity-oriented threshold strategy is more appropriate for brucellosis early warning in pastoral settings, where the consequences of missed detections are considerably more severe than those of false alarms. Accordingly, the threshold range of 0.35–0.40 represents a practical balance between timely risk identification and operational feasibility. The detailed differences in sensitivity and specificity under different threshold settings are summarized in Table 4.
Figure 9.
Sensitivity–specificity trade-off under different decision thresholds of the ensemble early-warning model.
Table 4.
Comparison of sensitivity and specificity under different threshold settings.
3.3.2. Early Warning Stability
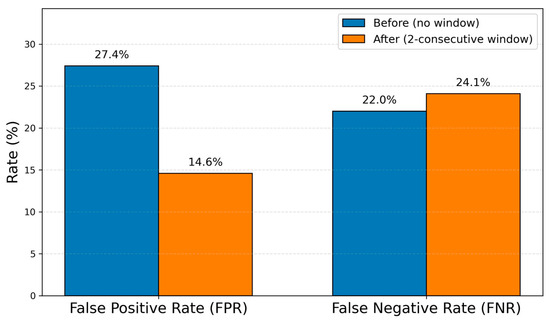
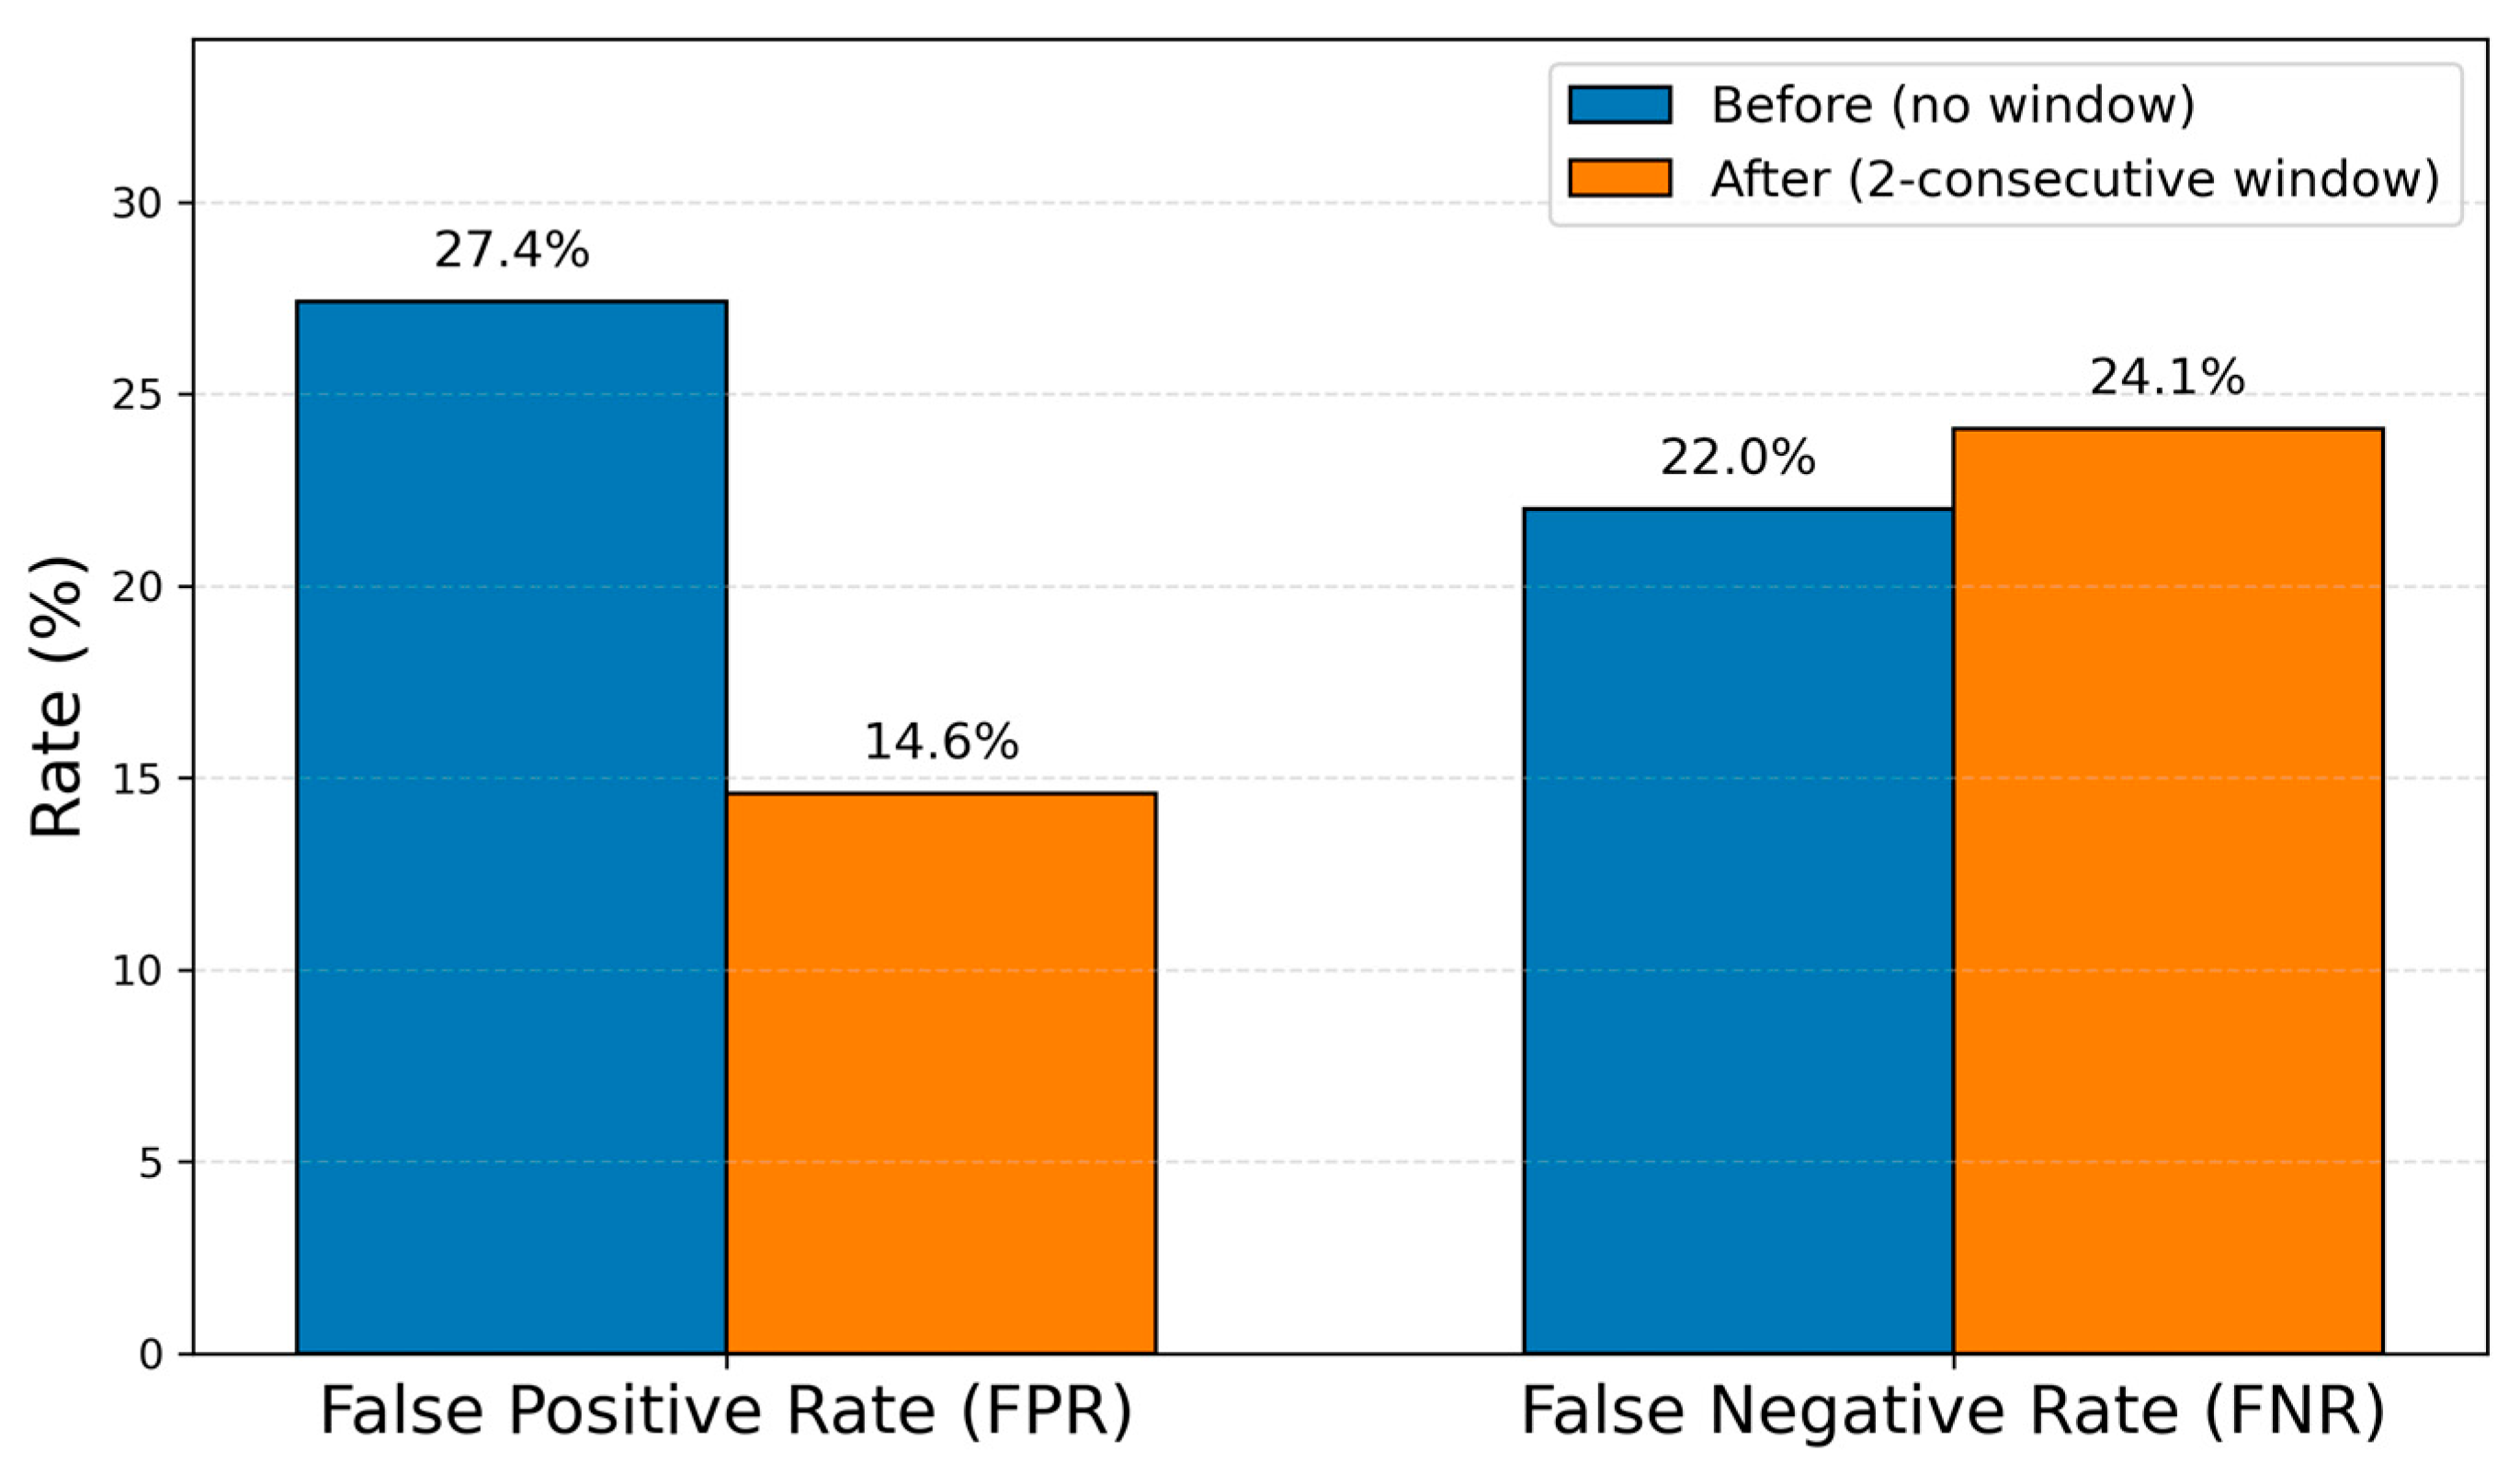
Based on the short-term noise fluctuations in pasture monitoring data, this study designed an early warning stabilization strategy to clean up transient abnormal signals: the system only triggers an early warning when the risk probability of two consecutive predictions is higher than a specified threshold. After introducing a time window, the model performance showed significant improvement. The false alarm rate (FPR) and false negative rate (FNR) were calculated at the daily monitoring level across the entire validation period, ensuring consistency in the evaluation of early-warning stability. The false alarm rate decreased from 27.4% to 14.6%, effectively reducing invalid alarms and lowering the unnecessary workload of grassroots veterinarians; meanwhile, the false negative rate only increased by 2.1%, remaining within an acceptable range. The window strategy makes the overall early warning signal smoother, avoiding unnecessary intervention due to single-day abnormal data, and significantly improving the robustness of the system in actual deployment and long-term operation. Its performance changes are shown in Figure 10, a comparison of false alarm rates before and after the early warning window strategy.
Figure 10.
Comparison of FPR and FNR before and after the window strategy.
3.3.3. Outbreak Lead Time
To evaluate the effectiveness of the proposed model in a real-world prevention and control environment, this study assessed the early warning performance of the ensemble model in 12 confirmed brucellosis outbreaks. Table 5 shows that the ensemble model successfully issued early warnings for all outbreaks, with an average warning time of 12 days, indicating its ability to capture emerging risk trends before the onset of clinical symptoms or laboratory confirmation. Furthermore, due to the earlier accumulation of environmental and management-related risk factors under high-altitude climate conditions and grazing methods, the warning time was extended to 13–16 days in pastures above 3800 m in altitude. It is worth noting that there were no cases of complete underreporting in any of the 12 outbreaks. In other words, there was no difference between the high-risk periods detected by the model and the confirmed cases officially recorded by the monitoring system in the same period. This indicates that the model is robust and reliable in the real environment, thus providing time for grassroots veterinarians to implement early intervention measures in pastoral areas.
Table 5.
Early warning lead time for 12 brucellosis outbreak events.
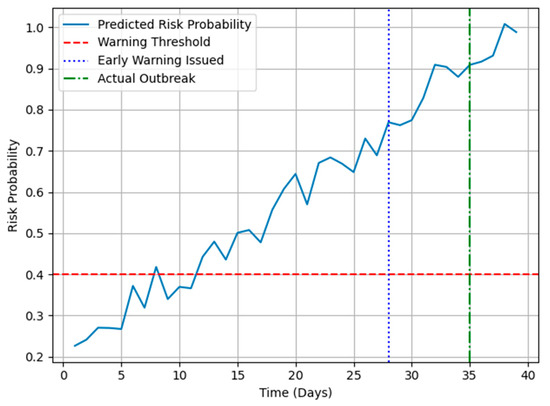
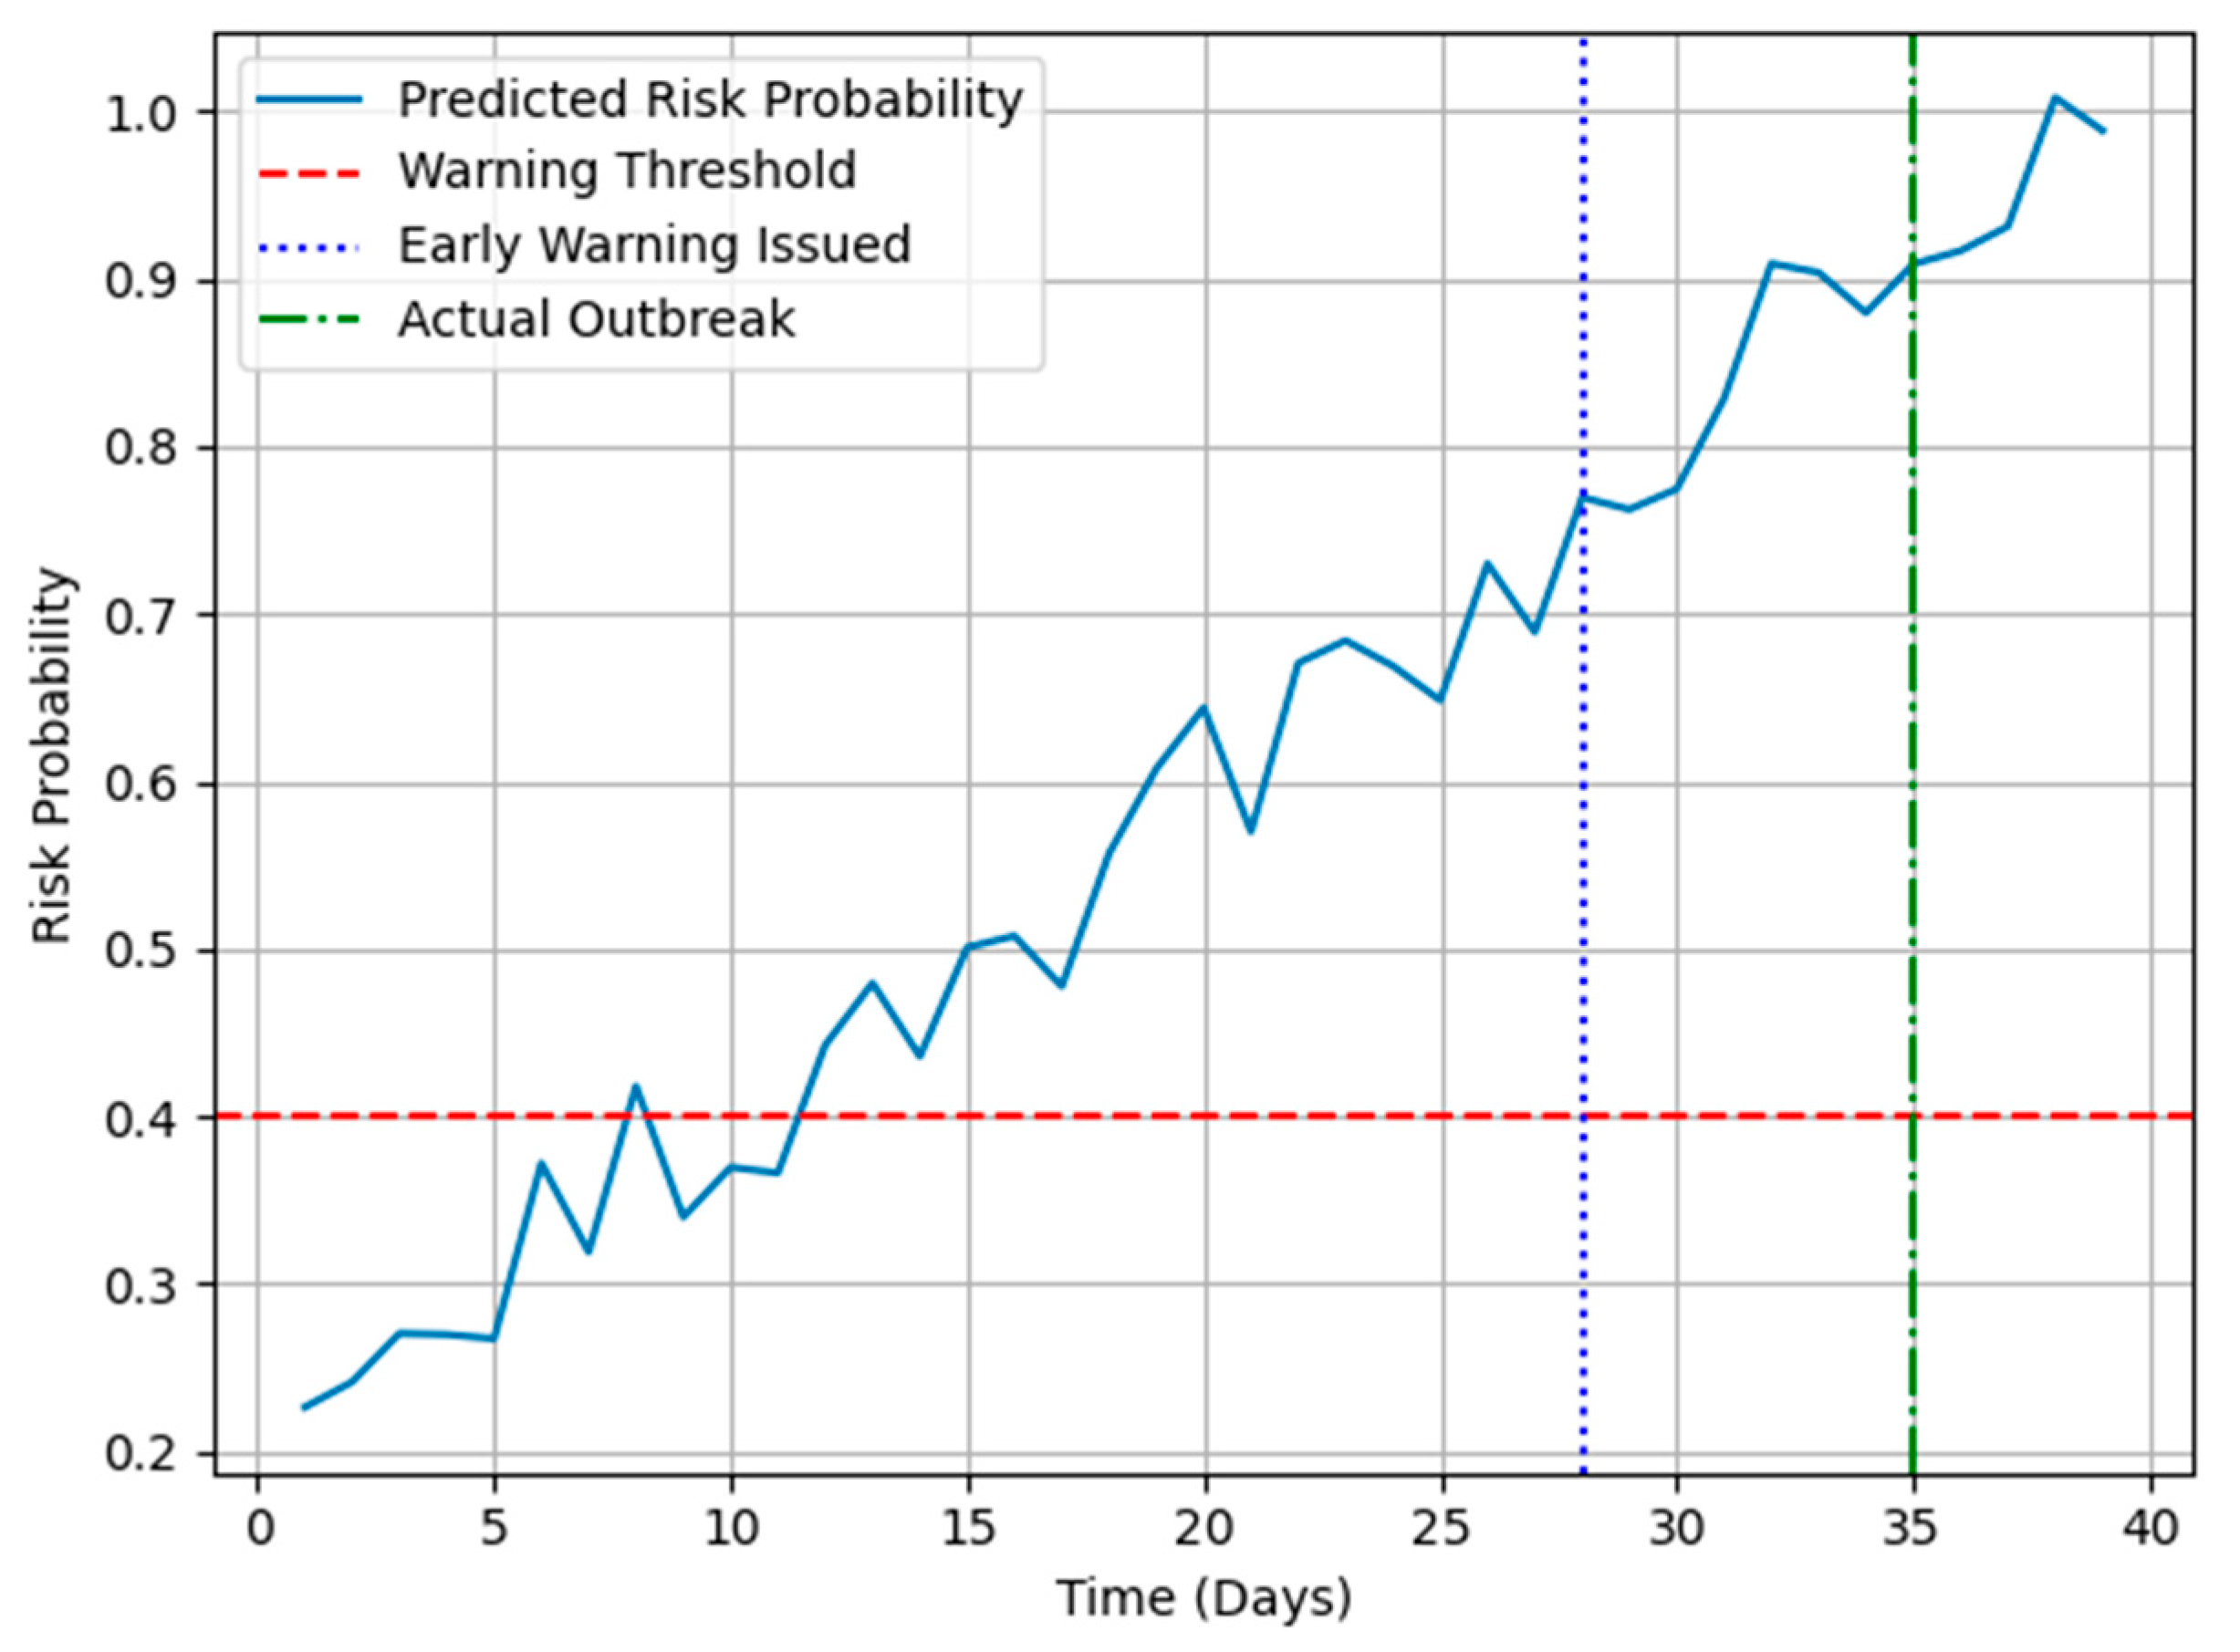
Figure 11 shows the change in predicted outbreak risk over time for a typical brucellosis event, as well as the time of confirmed outbreak. The figure shows that the predicted risk probability steadily increased before the outbreak, exceeding the warning threshold for several consecutive days. This predictive trend allows pastoral areas to proactively issue early warnings, rather than reacting passively. Although the warning time varies for different events due to differences in environmental conditions, herd structure and contact dynamics, the overall pattern consistently demonstrates the robustness of the proposed warning framework.
Figure 11.
Time-series early warning signals for representative brucellosis outbreak events.
3.4. Explanation of Key Risk Factors
SHapley Additive exPlanations (SHAP) analysis was conducted on the final ensemble model to improve interpretability and identify key risk drivers. Because the proposed model is a weighted soft-voting ensemble, SHAP values were first computed separately for each base learner (Random Forest, XGBoost, and LightGBM) using the TreeSHAP algorithm. The final SHAP values for the ensemble model were obtained by aggregating the SHAP values of individual base learners according to their corresponding voting weights. This model-wise aggregation approach ensures that feature attribution accurately reflects the contribution of each component model while preserving the fidelity of the ensemble prediction.
This study systematically explained the key features of the integrated model based on the SHAP method to reveal the main driving factors of brucellosis risk. The results showed that epidemiological variables, high-altitude environmental stress, and contact network structure all significantly affected the model’s predictions, constituting a comprehensive risk mechanism involving the combined effects of “biological–environment–behavior.”
3.4.1. Core Epidemiological Features
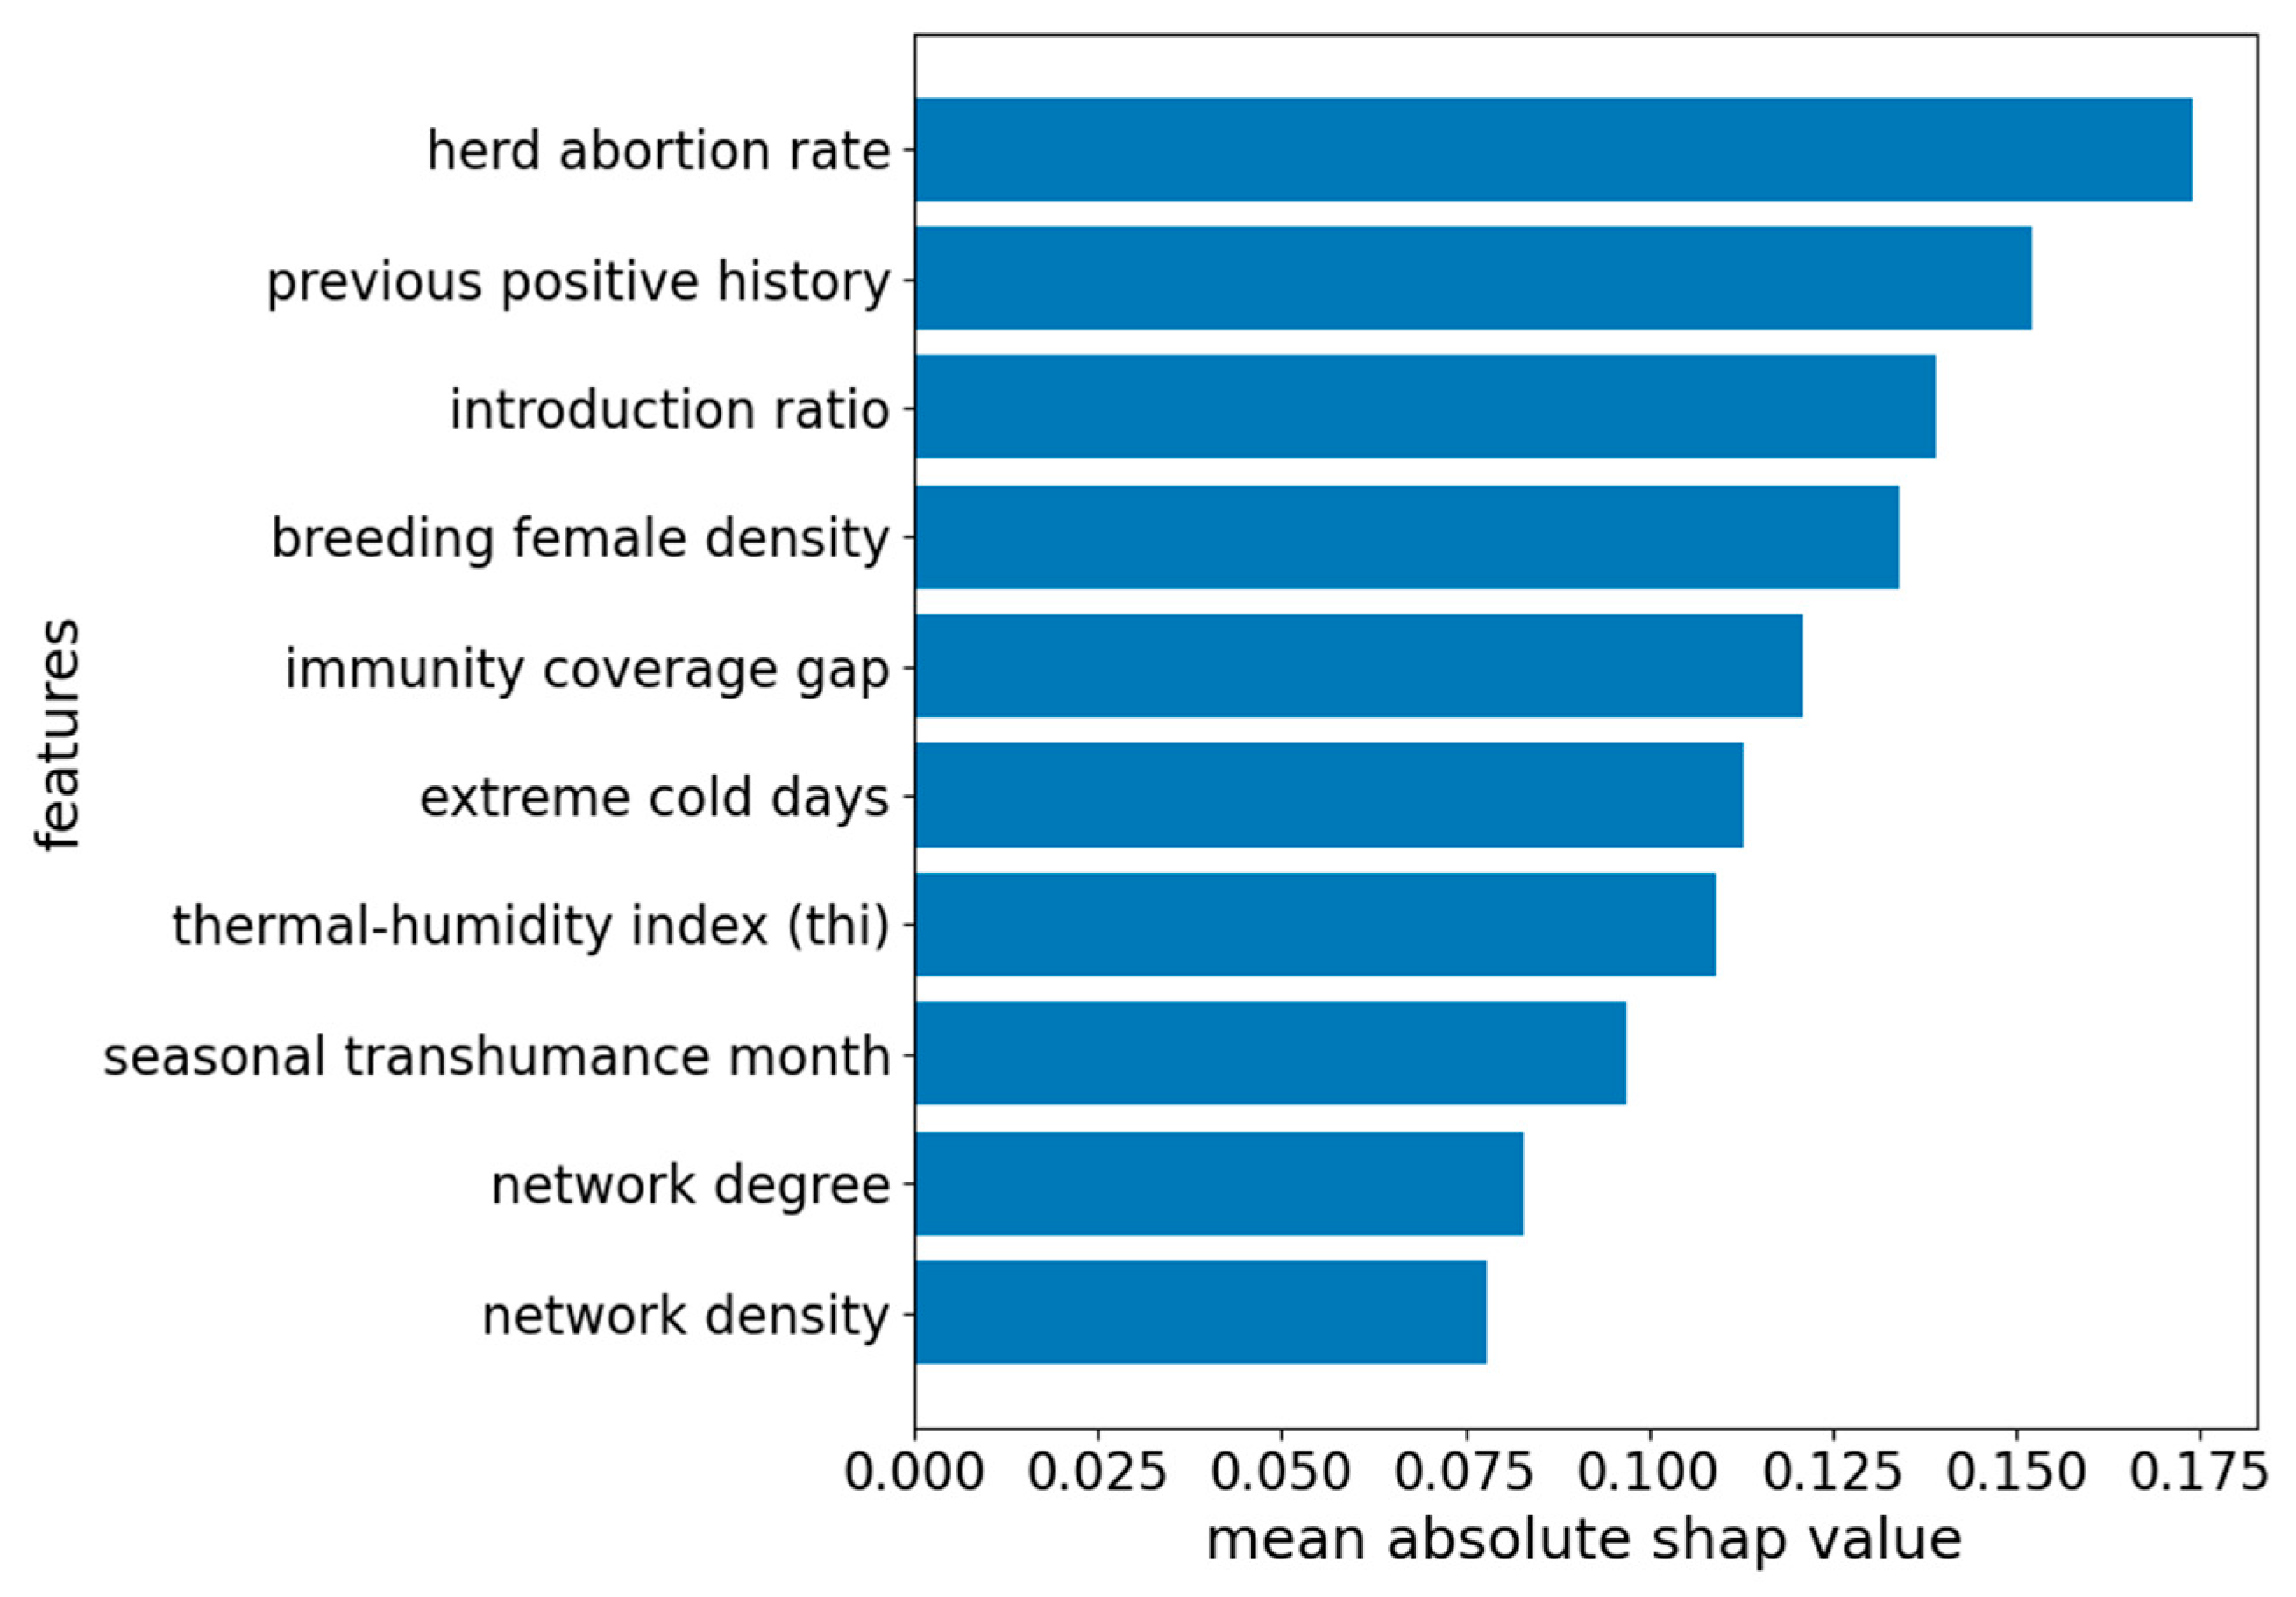
The SHAP value ranking indicates that epidemiological indicators remain the most influential variables for predicting brucellosis outbreak risk. The five most important features identified by the ensemble model were herd abortion rate, previous positive infection history, animal introduction rate, breeding stock density, and vaccination coverage gap.
Among these factors, the herd abortion rate was the primary contributor to risk prediction. Its predominantly positive SHAP value distribution indicates a strong correlation between increased abortion events and elevated outbreak risk. The history of prior positive infections showed a stable cumulative effect, suggesting that herds previously exposed to brucellosis are more susceptible to recurrent infections, especially under environmental or management-related stress conditions.
Furthermore, the introduction rate also showed a consistently positive contribution, reflecting that frequent animal movement increases the likelihood of introducing exogenous pathogens. Breeding stock density was another key factor, as higher density increases contact frequency and transmission potential, maintaining high importance across all samples. Meanwhile, gaps in vaccination coverage were directly related to herd immunity; insufficient vaccination coverage significantly increased the predicted risk of outbreaks.
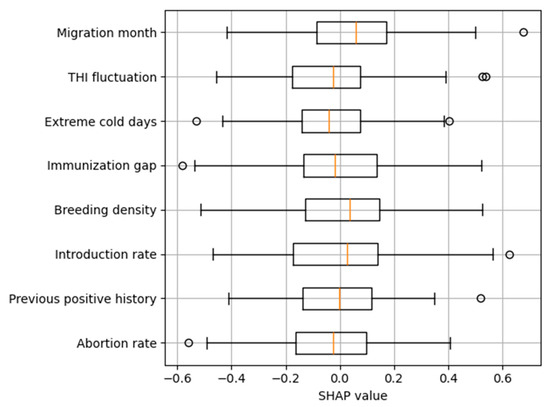
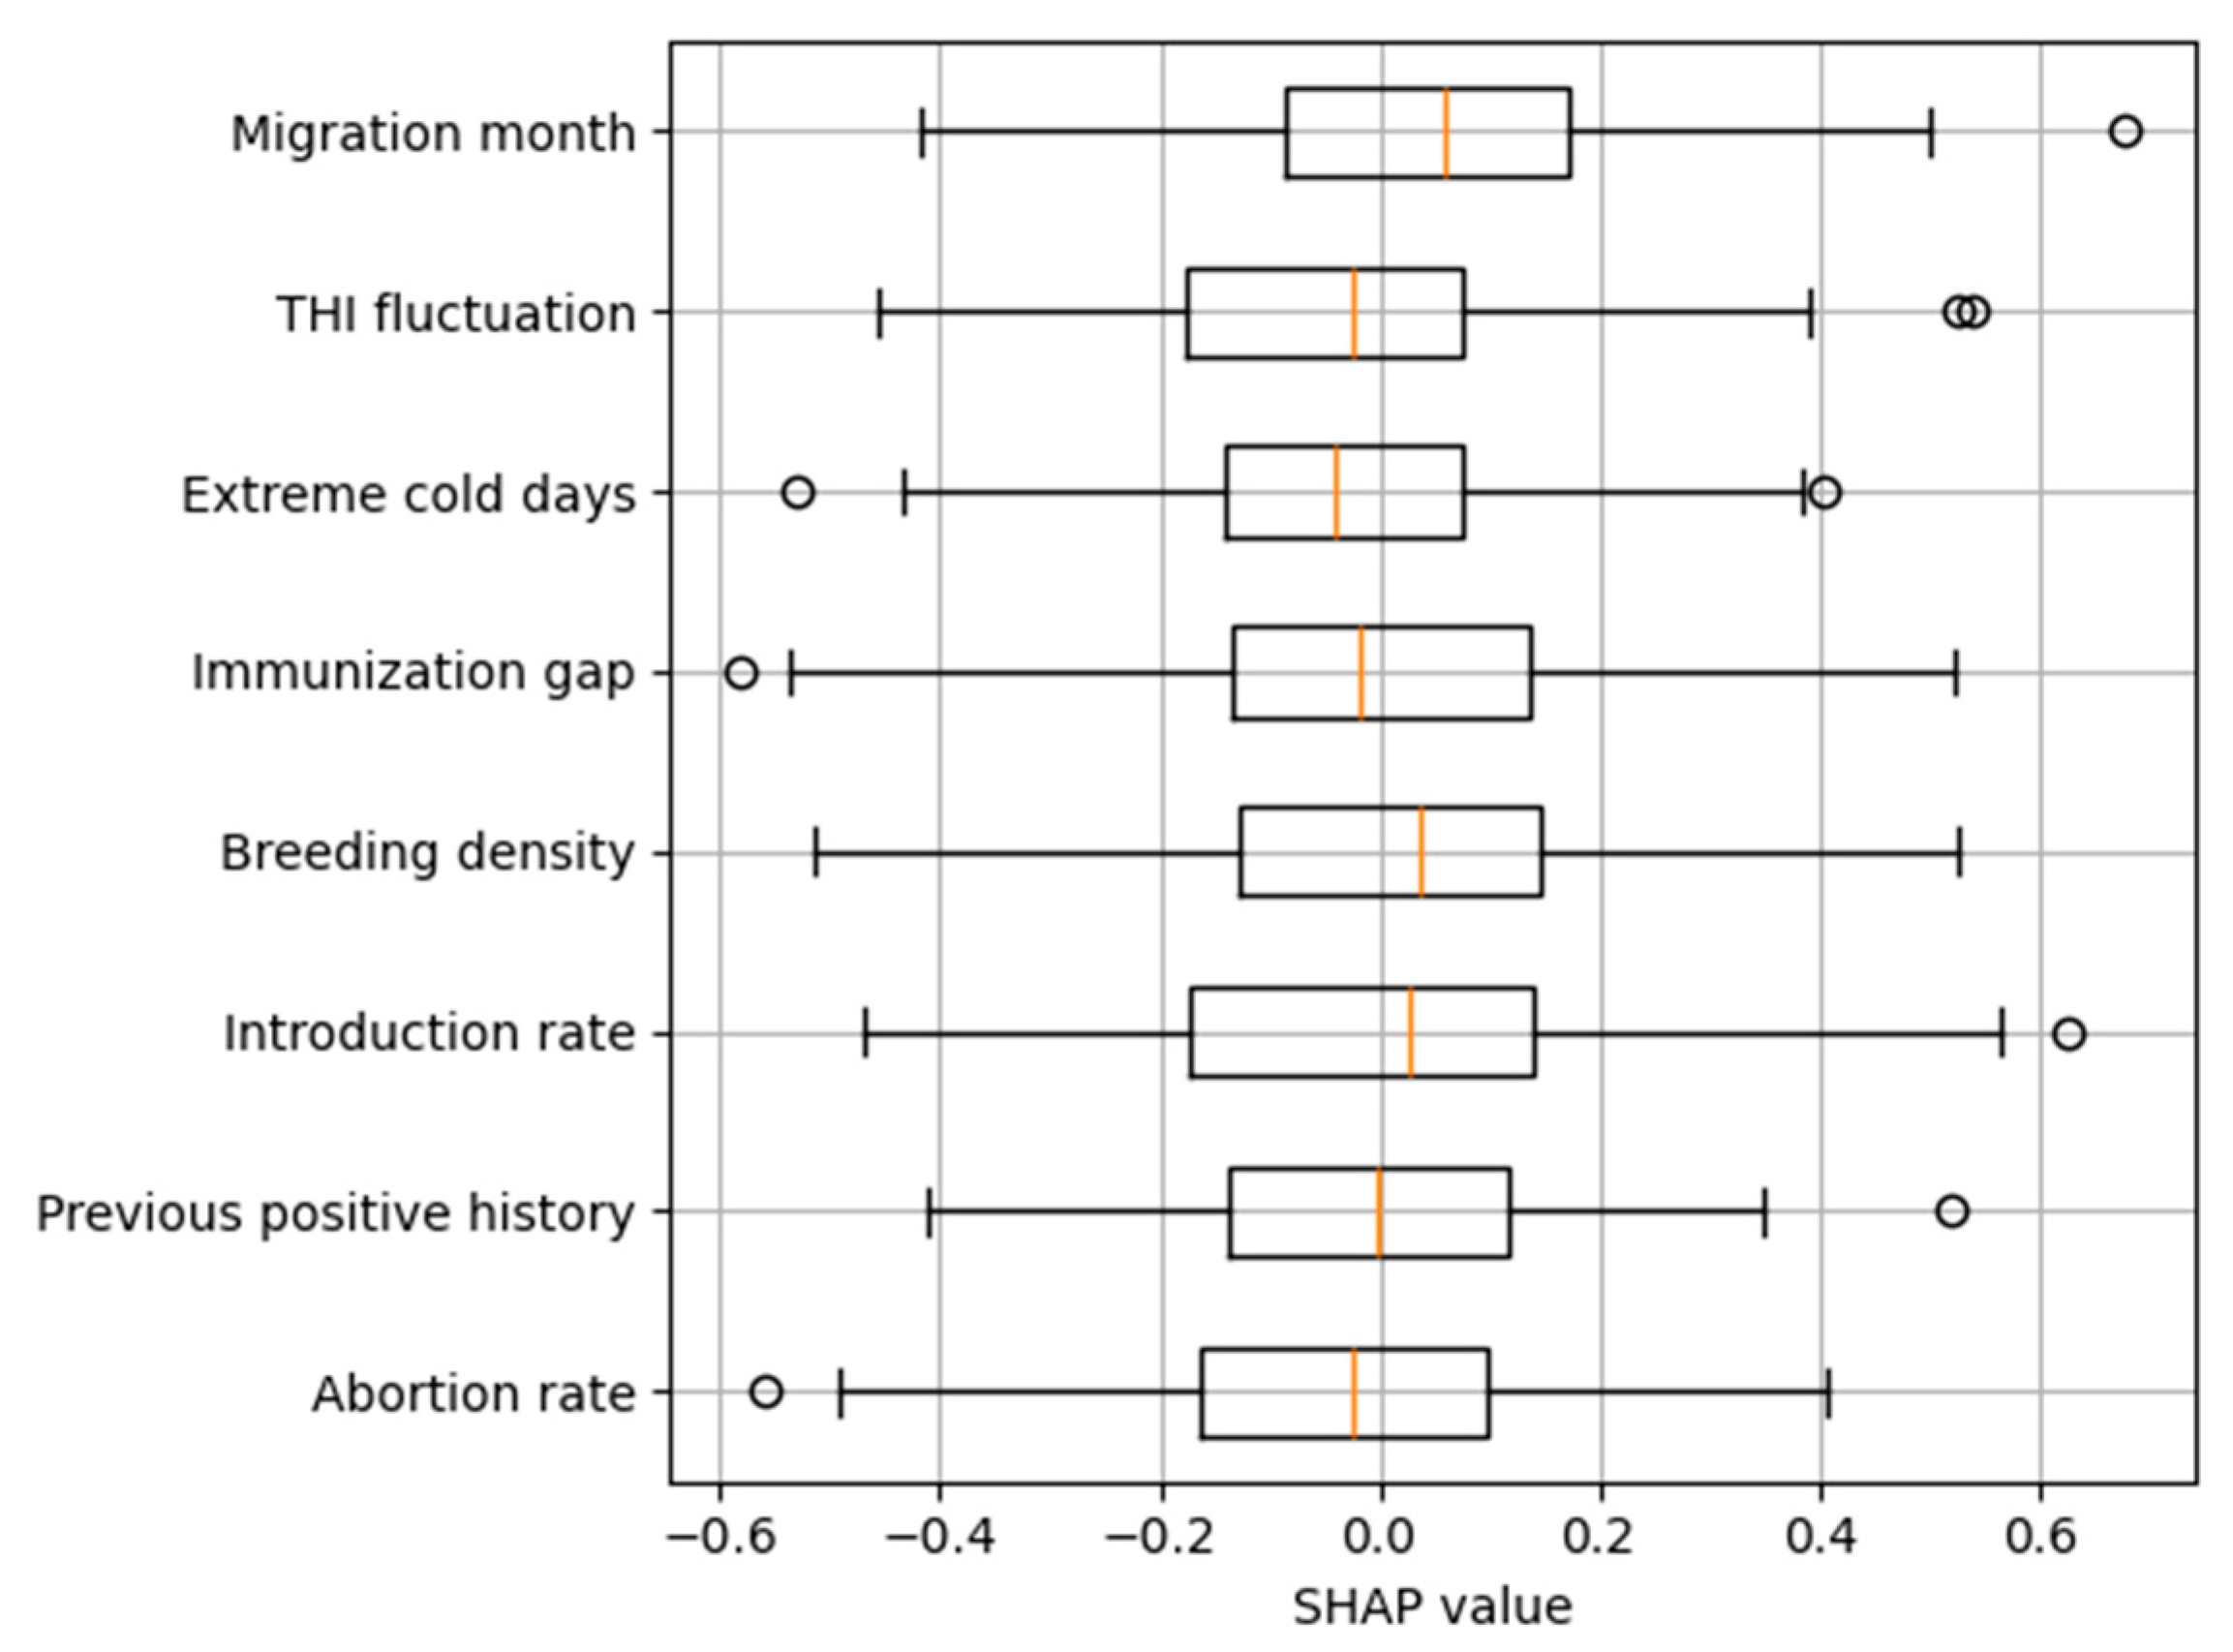
Figure 12 presents the SHAP summary plot illustrating the global importance of input variables in the ensemble early-warning model. Features are ranked according to their mean absolute SHAP values, reflecting their overall contributions to model predictions. Each point represents an individual sample, with color indicating the corresponding feature value from low to high. Positive SHAP values denote an increased predicted outbreak risk, whereas negative values indicate a reduced risk.
Figure 12.
Simulated SHAP summary plot illustrating global feature contributions to outbreak risk prediction.
3.4.2. High-Altitude Environmental Factors Make a Significant Contribution
After incorporating high-altitude ecological variables, the model’s explanatory power for brucellosis risk is further enhanced. Several environmental indicators ranked among the top ten in SHAP importance, reflecting the key role of high-altitude environmental stress in disease outbreaks. Key variables include the number of extreme cold days, the heat stress index, and the month of seasonal migration.
Among these, the number of extreme cold days has a significant positive impact on risk by increasing metabolic stress and reducing immune function. Although the heat stress index is generally low in high-altitude areas, its drastic fluctuations can still induce immunosuppression, thereby increasing susceptibility. Seasonal migration months are associated with herd mixing, environmental changes, and transportation stress, with their SHAP values significantly increasing in the pre-outbreak phase.
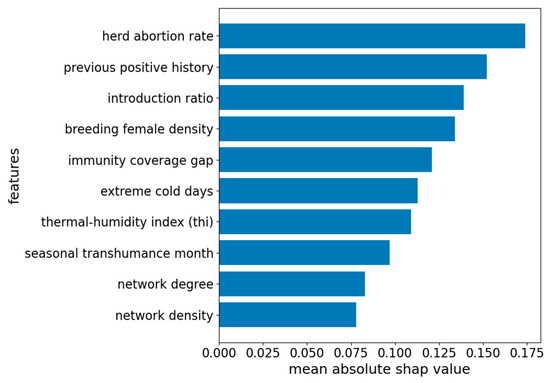
As shown in Figure 13, these environmental indicators exhibit a strong correlation with risk changes, further illustrating that high-altitude ecological stress is a key driver influencing brucellosis outbreak sensitivity.
Figure 13.
Shape importance of major risk factors.
3.4.3. Significant Role of Contact Network Characteristics
The contribution of contact network structure to the model is equally prominent, reflecting the important role of herd behavior patterns in brucellosis transmission. Three main indicators include nodal degree, network density, and shortest transmission path length.
First, higher nodal degree indicates more potential transmission chains between individuals, thus the SHAP value of this feature often shows a sustained positive contribution. Second, network density increases significantly during grazing, winter confinement, and supplementary feeding, and its SHAP value trend is highly synchronized with the positivity rate. Finally, the shorter the shortest transmission path length, the faster the pathogen spreads within the population, and the SHAP weight of this variable increases significantly in high-risk samples.
4. Discussion
The feature importance analysis indicates that the proposed ensemble learning model successfully identifies key risk factors that are biologically and epidemiologically relevant to brucellosis transmission in high-altitude pastoral systems. As shown in Table 6, the top-ranked variables are highly consistent with established knowledge on transmission pathways, host susceptibility, and environmental persistence, supporting the validity of the model and its applicability as a quantifiable indicator system for disease surveillance and early warning.
Among all features, abortion incidence emerges as the most influential predictor, reflecting the characteristic reproductive pathology of brucellosis and its role as a sensitive early signal of covert transmission, given the high bacterial shedding associated with abortion events. Several high-ranking variables further highlight the importance of contact structure and herd management. Mixed grazing frequency and the introduction of animals from unknown sources substantially increase inter-herd contact and pathogen import risk, reinforcing the role of management-driven transmission in extensive grazing systems.
Environmental factors are another important moderating element in disease outbreak risk. In high-altitude areas, low temperatures and snowfall can affect pathogen survival and livestock aggregation, leading to prolonged Brucella survival. Indicators related to pasture density and supplemental feeding point concentration further reflect the prevalence of spatial aggregation during winter feeding. Furthermore, abnormal lamb birth rates reflect cumulative reproductive damage and can serve as an early indicator of subclinical infection. Management-related variables such as disinfection frequency and pasture availability demonstrate the protective role of biosecurity measures and resource allocation in reducing environmental contamination and contact transmission.
Table 6.
Top Ten Features Ranked by Importance.
Importantly, these findings demonstrate that the proposed ensemble learning framework captures a multidimensional risk mechanism involving host physiology, environmental stress, and management-driven contact networks. This integrated representation enables the model to detect early-stage transmission signals that may not be identifiable through conventional single-factor surveillance approaches, highlighting its practical value as a proactive early warning tool.
Regarding the generalizability of the proposed model, this study was conducted in a representative high-altitude pastoral region characterized by extensive grazing practices, seasonal aggregation, and environmental stress conditions typical of plateau ecosystems. Although specific parameter values and feature distributions may vary across regions, the core risk drivers identified in this study, such as reproductive indicators, animal introduction patterns, environmental stress, and contact structure, represent fundamental epidemiological determinants of brucellosis transmission. Therefore, the proposed modeling framework is transferable to other pastoral settings, provided that model retraining or calibration is performed using local surveillance data. Nevertheless, differences in herd management practices, ecological environments, and surveillance intensity may affect model performance, and future external validation across multiple regions will further enhance the robustness and applicability of the proposed framework.
Potential temporal changes in environmental conditions and management practices, such as climate variability, grazing intensity adjustment, and evolving biosecurity measures, may also influence the long-term stability of predictive relationships. However, the use of temporally aligned features, time-based validation, and rolling-origin evaluation in this study helps ensure that the model captures stable risk patterns rather than transient correlations. Periodic model updating using newly collected surveillance data can further mitigate potential performance drift and maintain operational reliability.
Vaccination policies represent another potential confounding factor in brucellosis surveillance. Changes in vaccination coverage or implementation timing may influence both the incidence of infection and the observed clinical indicators. In this study, vaccination-related variables were explicitly incorporated into the model input feature system, enabling the model to account for variations in herd immunity status and vaccination intensity. This integration reduces the likelihood that vaccination-related changes introduce systematic bias into the risk prediction process. Furthermore, the model focuses on early risk signals derived from multi-source environmental, reproductive, and management indicators, which are less sensitive to short-term fluctuations in vaccination policy.
From an operational perspective, early warning systems inherently involve a trade-off between sensitivity and specificity. While lowering the decision threshold may increase false positive alerts, the practical consequences of false alarms in pasture management are relatively limited, typically involving low-cost preventive actions such as increased observation frequency, targeted diagnostic testing, temporary isolation, or precautionary disinfection. These measures are substantially less costly than delayed detection, which can lead to large-scale herd infection, reproductive losses, and prolonged quarantine measures. Therefore, prioritizing sensitivity with an acceptable level of false positives represents a rational and cost-effective strategy in brucellosis prevention and control.
5. Conclusions
This paper proposes an early warning framework for brucellosis outbreaks in high-altitude pastoral areas based on ensemble learning. By integrating multi-source animal health data, environmental information, and livestock movement information, it systematically models the outbreak risk from a veterinary epidemiological perspective. By introducing core features with clear epidemiological significance, environmentally sensitive indicators, and simplified contact network features, this framework can identify potential risk signals that are difficult to detect in a timely manner using traditional periodic monitoring methods. Compared with single models, the ensemble model demonstrates superior discriminative ability and early warning sensitivity and can provide quantifiable early warning time before the emergence of confirmed cases in the field, indicating its practical application potential in early risk identification in high-altitude pastoral areas. Furthermore, this framework fully utilizes existing routine monitoring data and incorporates an adaptive risk threshold design suitable for high-altitude ecological conditions, improving its feasibility for widespread application in grassroots veterinary systems and providing decision support for proactive monitoring, precise intervention, and vaccination strategy optimization.
However, it should be noted that the model’s construction and validation are primarily based on data from specific high-altitude pastoral areas, and its generalization ability under different ecological environments, feeding patterns, or management systems still needs further testing in a wider range of regions. Secondly, information on livestock movement and contact networks still relies on manual surveys in some pastures, which may affect the accuracy and timeliness of the data. Therefore, future research can further improve the robustness and practical value of the model by introducing higher-resolution spatiotemporal data and cross-regional validation.
Author Contributions
Conceptualization, L.X. and F.F.A.J.; methodology, L.X.; software, L.X.; validation, L.X., F.F.A.J. and B.T.P.; formal analysis, L.X.; investigation, L.X.; resources, E.L.T.C.; data curation, L.X.; writing—original draft preparation, L.X.; writing—review and editing, F.F.A.J. and M.A.M.L.; visualization, L.X.; supervision, F.F.A.J.; project administration, F.F.A.J.; funding acquisition, F.F.A.J. All authors have read and agreed to the published version of the manuscript.
Funding
This research received no external funding.
Institutional Review Board Statement
Not applicable.
Informed Consent Statement
Not applicable.
Data Availability Statement
The original contributions presented in this study are included in the article. Further inquiries can be directed to the corresponding author.
Conflicts of Interest
The authors declare no conflicts of interest.
Abbreviations
The following abbreviations are used in this manuscript:
| SMOTE | Synthetic Minority Over-sampling Technique |
| SMOTEENN | Synthetic Minority Over-sampling Technique combined with Edited Nearest Neighbors |
| THI | Temperature–Humidity Index (THI) |
| KNN | K-nearest neighbor |
| RBPT | Rose Bengal Plate Test |
| ELISA | Enzyme-Linked Immunosorbent Assay |
| SHAP | SHapley Additive exPlanations |
| RF | Random Forest |
| FAR | False Alarm Rate |
| FNR | False Negative Rate |
References
- Corbel, M.J. Brucellosis in Humans and Animals; World Health Organization: Geneva, Switzerland, 2006.
- Corbel, M.J. Brucellosis: Epidemiology and prevalence worldwide. In Brucellosis; CRC Press: Boca Raton, FL, USA, 2020; pp. 25–40. [Google Scholar]
- Qureshi, K.A.; Parvez, A.; Fahmy, N.A.; Abdel Hady, B.H.; Kumar, S.; Ganguly, A.; Atiya, A.; Elhassan, G.O.; Alfadly, S.O.; Parkkila, S.; et al. Brucellosis: Epidemiology, pathogenesis, diagnosis and treatment—A comprehensive review. Ann. Med. 2023, 55, 2295398. [Google Scholar] [CrossRef] [Scilit] [PubMed]
- McDermott, J.; Grace, D.; Zinsstag, J. Economics of brucellosis impact and control in low-income countries. Rev. Sci. Tech. 2013, 32, 249–261. [Google Scholar] [CrossRef] [Scilit] [PubMed]
- Shang, D.; Xiao, D.; Yin, J. Epidemiology and control of brucellosis in China. Vet. Microbiol. 2002, 90, 165–182. [Google Scholar]
- Wang, Y.; Xu, C.; Zhang, S.; Wang, Z.; Zhu, Y.; Yuan, J. Temporal trends analysis of human brucellosis incidence in mainland China from 2004 to 2018. Sci. Rep. 2018, 8, 15901. [Google Scholar] [CrossRef] [Scilit] [PubMed]
- Tao, Z.; Chen, Q.; Chen, Y.; Li, Y.; Mu, D.; Yang, H.; Yin, W. Epidemiological characteristics of human brucellosis—China, 2016–2019. China CDC Wkly. 2021, 3, 114. [Google Scholar]
- Mishra, C. High Altitude Survival: Conflicts Between Pastoralism and Wildlife in the Trans-Himalaya; Wageningen University and Research: Wageningen, The Netherlands, 2001. [Google Scholar]
- Wu, T. The Qinghai–Tibetan plateau: How high do Tibetans live? High Alt. Med. Biol. 2001, 2, 489–499. [Google Scholar] [CrossRef] [Scilit]
- Niu, X.; Ding, Y.; Chen, S.; Gooneratne, R.; Ju, X.J.A. Effect of immune stress on growth performance and immune functions of livestock: Mechanisms and prevention. Animals 2022, 12, 909. [Google Scholar] [CrossRef] [Scilit]
- Godfroid, J.; Scholz, H.; Barbier, T.; Nicolas, C.; Wattiau, P.; Fretin, D.; Whatmore, A.; Cloeckaert, A.; Blasco, J.; Moriyon, I.; et al. Brucellosis at the animal/ecosystem/human interface at the beginning of the 21st century. Prev. Vet. Med. 2011, 102, 118–131. [Google Scholar] [CrossRef] [Scilit]
- Lavazza, A.; Capucci, L. Lagovirus europaeus infection (rabbit hemorrhagic disease). In Manual of Diagnostic Tests and Vaccines for Terrestrial Animals; World Organisation for Animal Health: Paris, France, 2018; pp. 355–398. [Google Scholar]
- Aslam, M.; Mehnaz, S.; Fatima, T.; Ather, A.; Tehreem, A.; Haq, S.; Rafique, M.N.; Javed, S.; Rahman, M.; Iqbal, A. Brucellosis: A global challenge. Zoonosis 2023, 4, 432–442. [Google Scholar]
- Herrick, J.A.; Lederman, R.J.; Sullivan, B.; Powers, J.H.; Palmore, T.N. Brucella arteritis: Clinical manifestations, treatment, and prognosis. Lancet Infect. Dis. 2014, 14, 520–526. [Google Scholar] [CrossRef] [Scilit]
- George, J.; Häsler, B.; Mremi, I.; Sindato, C.; Mboera, L.; Rweyemamu, M.; Mlangwa, J. A systematic review on integration mechanisms in human and animal health surveillance systems with a view to addressing global health security threats. One Health Outlook 2020, 2, 11. [Google Scholar] [CrossRef] [Scilit] [PubMed]
- Cowie, C.E.; Marreos, N.; Gortázar, C.; Jaroso, R.; White, P.C.; Balseiro, A. Shared risk factors for multiple livestock diseases: A case study of bovine tuberculosis and brucellosis. Res. Vet. Sci. 2014, 97, 491–497. [Google Scholar] [CrossRef] [Scilit] [PubMed]
- Cabatuan, M.; Manguerra, M. Machine learning for disease surveillance or outbreak monitoring: A review. In Proceedings of the 2020 IEEE 12th International Conference on Humanoid, Nanotechnology, Information Technology, Communication and Control, Environment, and Management (HNICEM), Manila, Philippines, 3–7 December 2020; IEEE: New York, NY, USA, 2020; pp. 1–6. [Google Scholar]
- Folasole, A. Data analytics and predictive modelling approaches for identifying emerging zoonotic infectious diseases: Surveillance techniques, prediction accuracy, and public health implications. Int. J. Eng. Technol. Res. Manag. 2023, 7, 292. [Google Scholar]
- Chen, T.; Guestrin, C. XGBoost: A Scalable Tree Boosting System. In Proceedings of the 22nd Acm Sigkdd International Conference on Knowledge Discovery and Data Mining, San Francisco, CA, USA, 13–17 August 2016. [Google Scholar]
- Kuhn, M.; Johnson, K. Applied Predictive Modeling; Springer: New York, NY, USA, 2013. [Google Scholar]
- Dietterich, T.G. Ensemble methods in machine learning. In International Workshop on Multiple Classifier Systems; Springer: New York, NY, USA, 2000; pp. 1–15. [Google Scholar]
- Zhou, Z.-H. Ensemble Methods: Foundations and Algorithms; CRC Press: Boca Raton, FL, USA, 2025. [Google Scholar]
- Meckawy, R.; Stuckler, D.; Mehta, A.; Al-Ahdal, T.; Doebbeling, B.N. Effectiveness of early warning systems in the detection of infectious diseases outbreaks: A systematic review. BMC Public Health 2022, 22, 2216. [Google Scholar] [CrossRef] [Scilit]
- Hoinville, L.; Alban, L.; Drewe, J.; Gibbens, J.; Gustafson, L.; Häsler, B.; Saegerman, C.; Salman, M.; Stärk, K. Proposed terms and concepts for describing and evaluating animal-health surveillance systems. Prev. Vet. Med. 2013, 112, 1–12. [Google Scholar] [CrossRef] [Scilit]
- Keeling, M.J.; Rohani, P. Modeling Infectious Diseases in Humans and Animals; Princeton University Press: Princeton, NJ, USA, 2008. [Google Scholar]
- Sordillo, L.M.; Contreras, G.; Aitken, S.L. Metabolic factors affecting the inflammatory response of periparturient dairy cows. Anim. Health Res. Rev. 2009, 10, 53–63. [Google Scholar] [CrossRef] [Scilit]
- McDermott, J.J.; Arimi, S. Brucellosis in sub-Saharan Africa: Epidemiology, control and impact. Vet. Microbiol. 2002, 90, 111–134. [Google Scholar] [CrossRef] [Scilit]
- Redkar, R.; Rose, S.; Bricker, B.; DelVecchio, V. Real-time detection of Brucella abortus, Brucella melitensis and Brucella suis. Mol. Cell. Probes 2001, 15, 43–52. [Google Scholar] [CrossRef] [Scilit]
- Chawla, N.V.; Bowyer, K.W.; Hall, L.O.; Kegelmeyer, W.P. SMOTE: Synthetic minority over-sampling technique. J. Artif. Intell. Res. 2002, 16, 321–357. [Google Scholar] [CrossRef] [Scilit]
- Husain, G.; Nasef, D.; Jose, R.; Mayer, J.; Bekbolatova, M.; Devine, T.; Toma, M. SMOTE vs. SMOTEENN: A study on the performance of resampling algorithms for addressing class imbalance in regression models. Algorithms 2025, 18, 37. [Google Scholar] [CrossRef] [Scilit]
- Saito, T.; Rehmsmeier, M. The precision-recall plot is more informative than the ROC plot when evaluating binary classifiers on imbalanced datasets. PLoS ONE 2015, 10, e0118432. [Google Scholar] [CrossRef] [Scilit]

Disclaimer/Publisher’s Note: The statements, opinions and data contained in all publications are solely those of the individual author(s) and contributor(s) and not of MDPI and/or the editor(s). MDPI and/or the editor(s) disclaim responsibility for any injury to people or property resulting from any ideas, methods, instructions or products referred to in the content. |
© 2026 by the authors. Licensee MDPI, Basel, Switzerland. This article is an open access article distributed under the terms and conditions of the Creative Commons Attribution (CC BY) license.