


Abstract
Heart variability series exhibit complex behavior best understood through nonlinear dynamical techniques. This research evaluates the utility of three Hurst exponent estimators for assessing persistence and antipersistence in RR time series from healthy subjects and those with congestive heart failure (CHF) across varying conditions, including sleep and wakefulness. Healthy young subjects display persistent RR series, whereas both CHF patients exhibit antipersistent RR series. Overall, the results support the use of Hurst exponent methodologies as information-based biomarkers that can reveal relevant aspects of physiological status and potentially contribute to risk assessment, classification, and monitoring strategies in chronic disease research.
1. Introduction
Nonlinear dynamics techniques have greatly advanced biomedical signal analysis by enabling the interpretation of complex physiological patterns [1]. The cardiovascular system is especially complex. Heart rate variability (HRV) is measured using RR intervals from electrocardiograms (ECGs) and reflects physiological adaptations through neuroautonomic modulation. These modulations are normal but can change with disease. HRV indicates autonomic balance, blood pressure, gas exchange, and other factors. The variability in nonlinear systems supports adaptation to changing environments, and optimal HRV is associated with health and adaptability [2].
Heart disease remains a leading cause of death worldwide and congestive heart failure (CHF) involves impaired blood pumping. Circadian oscillations, synchronized with sleep–wake cycles, influence physiology [2]. RR interval fluctuations in healthy individuals exhibit self–similar structures due to cardiac control and long-range correlations, which change with disease, sleep–wake states, and exercise [3].
The Hurst exponent is a measure of autocorrelation in a sequence and serves as an indicator of the long-term memory of a time series. If H is in the interval , then the time series has long-term positive self-correlations or persistence. This means that there is a high probability that a high value in the series can be followed by another high value. A value in the range indicates that there is a high probability that a high value can be followed by a low value, and the subsequent value can be high again; this phenomenon is known as antipersistence. A value of indicates a completely uncorrelated series (white noise) [4].
The primary objective of this study is to assess the effectiveness of three Hurst exponent estimators in distinguishing between different cardiac states, using heartbeat time series from healthy individuals and patients with CHF in various conditions. By applying these estimators to data from sleep and wake periods, we assess the utility of the Hurst exponent as a diagnostic indicator. This analysis seeks to directly inform health status based on clearly observed changes in Hurst exponent values.
2. Materials and Methods
2.1. Methods to Estimate Hurst Exponents
The Hurst exponent, also known as the rescaled range or analysis, was proposed by the British scientist Harold E. Hurst to address a problem in hydrology [4]. Hurst’s analysis is obtained from the range of partial sums of sequence deviations from its mean, and rescaled by its standard deviation. So, for an n-dimensional vector, and for an m-dimensional sample sub-vector, , where , with . The statistic is estimated by the sub-sample mean:
The sequence from partial summations is
The range , and the rescaled range , where the sample standard deviation is given by:
The rescaled range is estimated with sub-vectors at different scales. Then, it is averaged over a relatively large number of different values over the whole fractal domain n. If the stochastic process of is scaling over a certain domain , the statistics follows the power-law where H is the Hurst scaling exponent, and a is a constant; these values can be obtained through the plot of as a function of the scale s, which showed a linear tendency of the data with slope H [4].
Scale analysis methods offer advantages and disadvantages for the implementation and precision of the estimation. For instance, the quality of the Hurst exponent estimates is often influenced by the amount of input data and its sampling rate [5]; it is also shown that various variants are possible depending on the way in which they are defined and differ greatly in their performance. Various modifications to the analysis have been proposed to improve performance while trying to maintain an easy implementation. For example, one of the most used methods is based on the discrete second-order derivative (DSOD) [6] and the Wavelet-adapted discrete second-order derivative (WDSOD) [7].
The three methods used in this work to estimate the H-values from this point are as follows:
- Method 1: Original method developed by Hurst [4].
- Method 2: Method based on DSOD [6].
- Method 3: Method based on WDSOD [7].
2.2. RR Time Series: Healthy Subjects and CHF Patients
These time series were obtained from the following PhysioNet databases [8]:
- Fifty-four recordings with 24 h ECG signals of subjects in normal sinus rhythm (30 men, 28.5 to 76 years old, and 24 women, 58 to 73 years old).
- Fifteen ECG recordings of subjects with severe congestive heart failure (NYHA classes III–IV). The participants were as follows: 11 men, 22–71 years old, and 4 women, 54–63 years old.
- Twenty-nine recordings of subjects aged 34–79 years, with CHF (NYHA classes I, II, and III).
In total, there are records of 54 healthy subjects and 44 patients with congestive heart failure (CHF). One of the objectives is to study the differences when the subjects are awake carrying out their normal activities and when they are asleep; hence, from the 24-h records, heartbeat time series were obtained and separated to obtain subseries of 6 h for each state: awake and asleep.
3. Results
PhysioNet Heartbeat Time Series
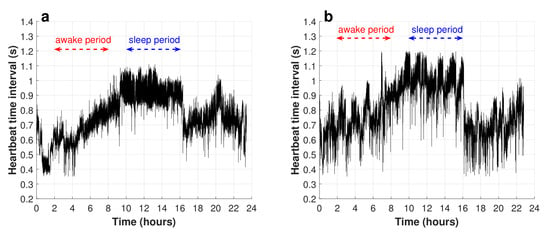
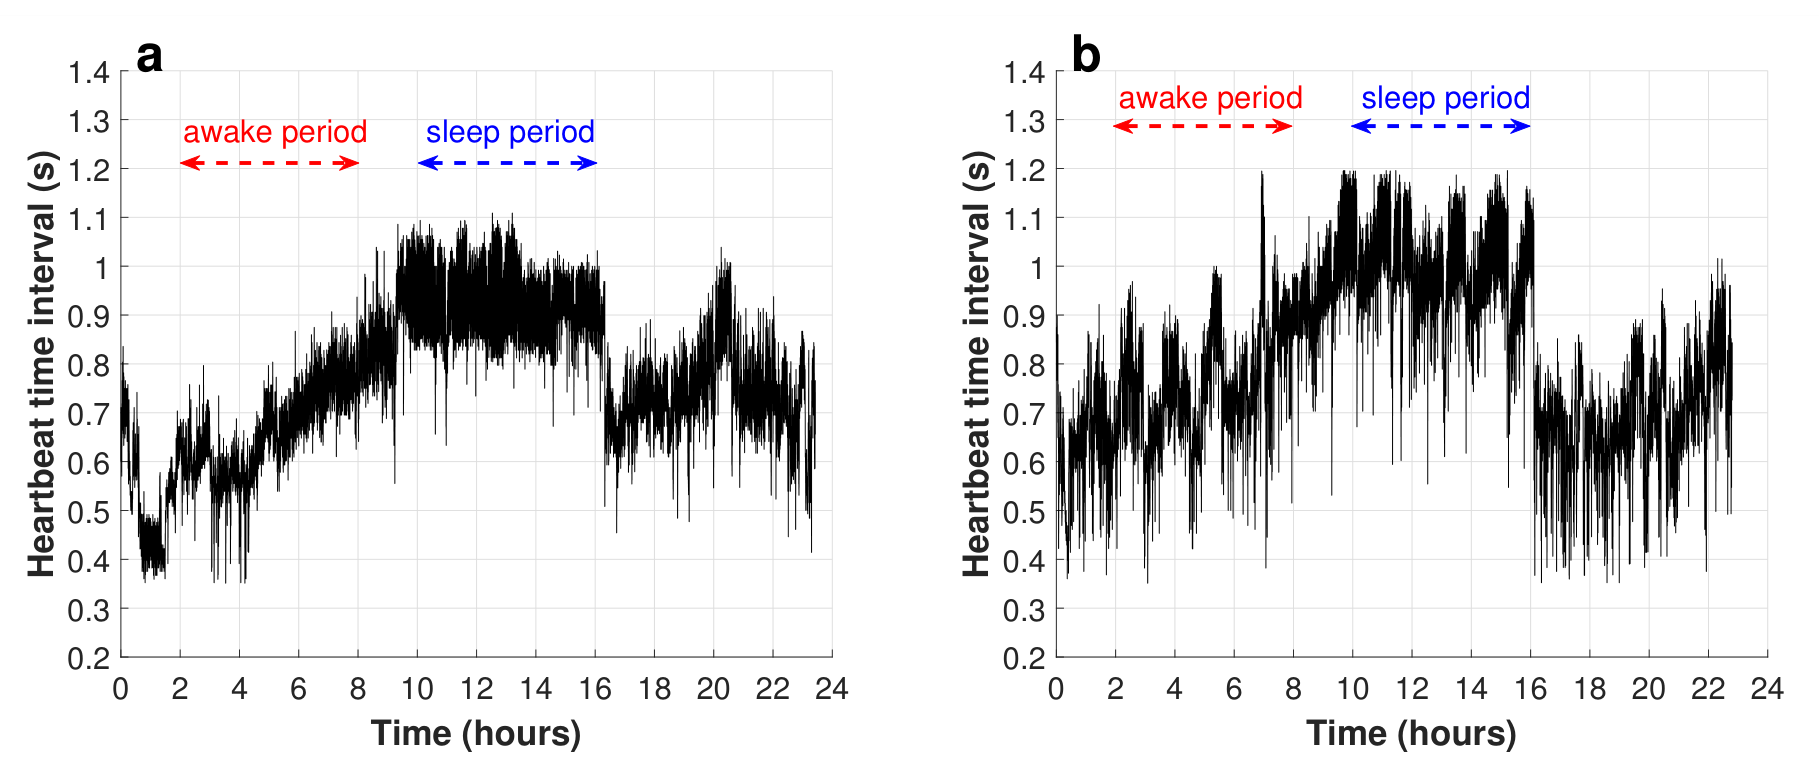
This section of this work consisted of the analysis of the heartbeat time series obtained from the ECG records of the PhysioNet database of healthy subjects and CHF patients [8]. Figure 1a displays an example of one tachogram of a healthy subject, and Figure 1b shows this graph from the CHF subject.
Figure 1.
Typical heartbeat time interval series obtained from (a) a healthy subject and (b) a CHF patient.
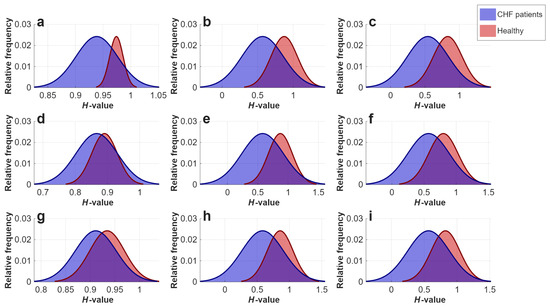
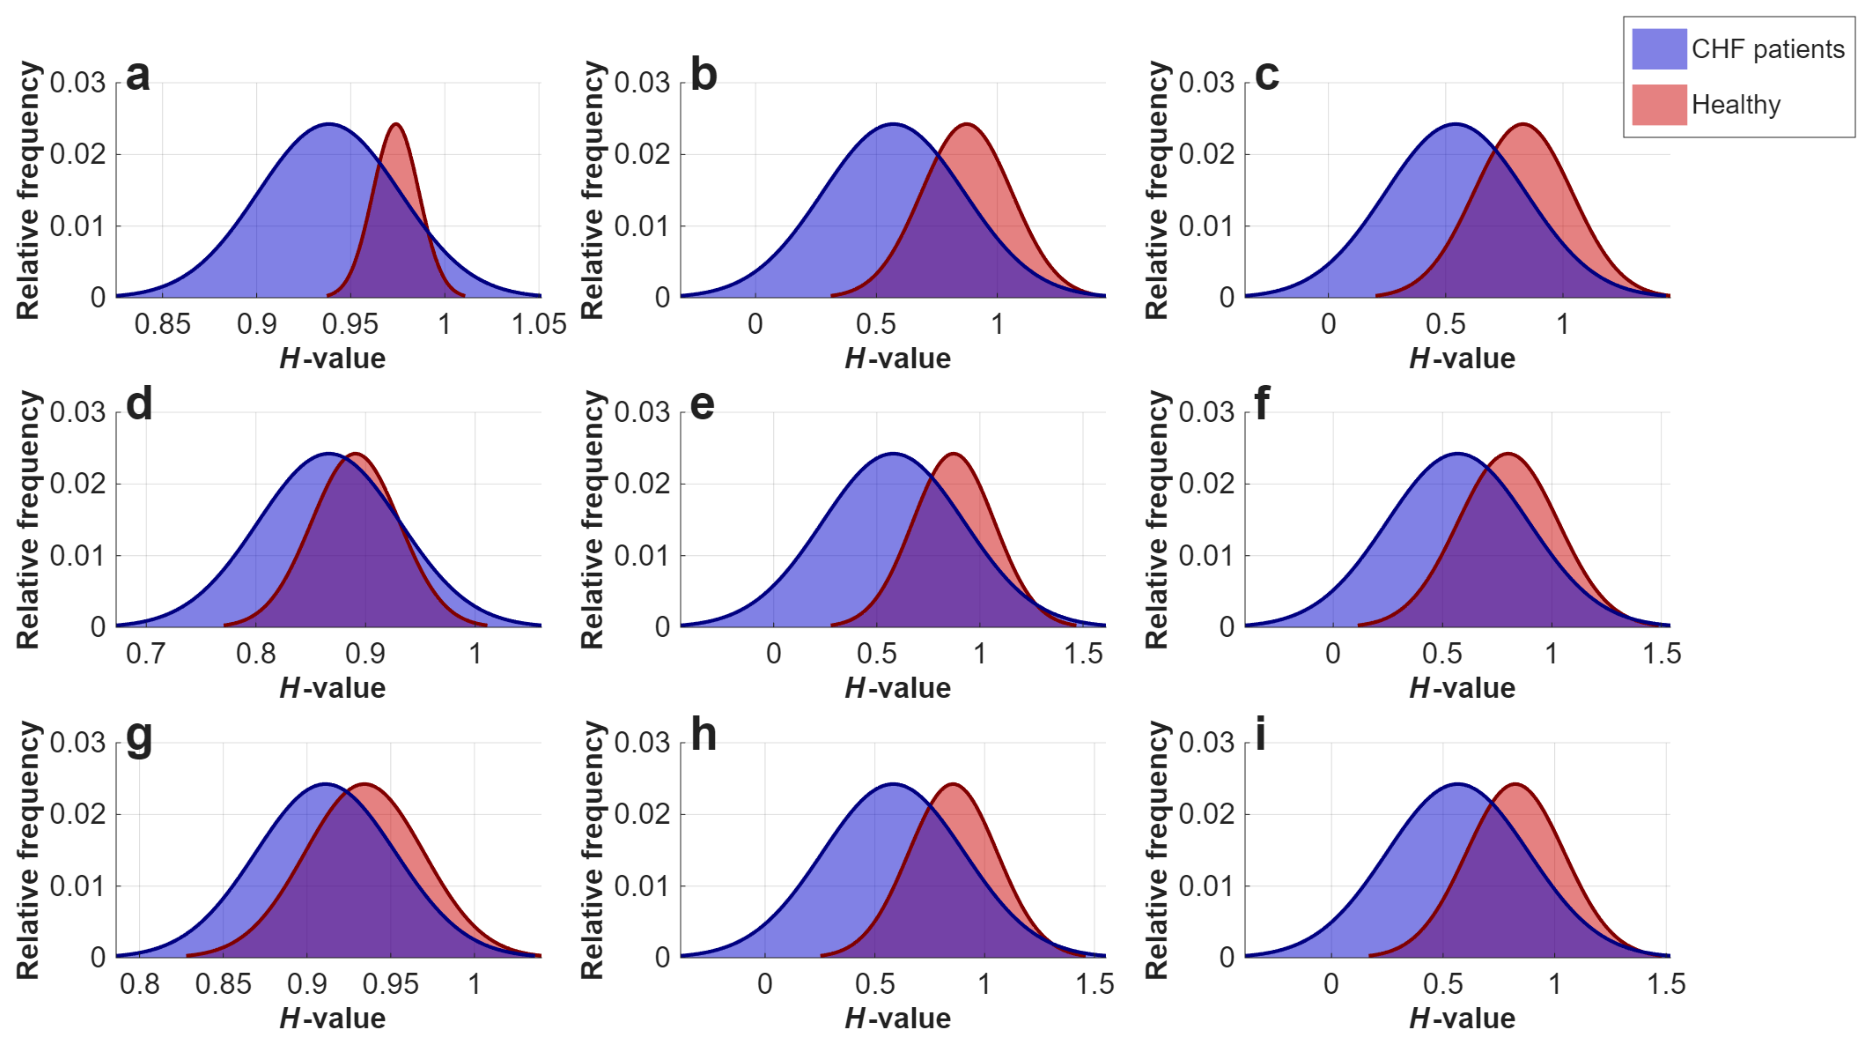
As mentioned above, PhysioNet has heartbeat time series of 54 healthy subjects and 44 CHF patients. First, we analyzed the 24-h time series, and we obtained 6-h subseries when the subjects were awake and 6-h subseries when they were sleeping, which is also represented in Figure 1. We calculated the H-values with the mentioned methods. In the first stage of the 24 h, Figure 2a–c show the variations in the Hurst exponent values estimated with the three methods and comparisons of the physical health statuses of the studied subjects (healthy and CHF). The average H-values of healthy and ill subjects for each method can be observed in Table 1. It is worth mentioning that for the three methods, on average, the heartbeat time series of healthy subjects have long-range correlations and are persistent according to the interpretations of the H-values. Conversely, 24 h heartbeat time series of CHF patients have Hurst exponent values closest to white noise, so there is a loss of long-range correlations. These findings are also consistent with the results previously reported by [9]. In order to analyze the difference in H from series of healthy and ill subjects, Student’s t-test was used, which indicated that H-values calculated using methods 1, 2, and 3 showed significant differences with .
Figure 2.
Histograms of H-values obtained for the complete series of healthy subjects and CHF patients. (a) Results from method 1, (b) method 2, and (c) method 3. H-values calculated from the 6-h asleep period using (d) method 1, (e) method 2, and (f) method 3. Values obtained from the 6-h awake period using (g) method 1, (h) method 2, and (i) method 3.
Table 1.
H-values calculated for series from Physionet of healthy and CHF subjects.
Similarly, H-value estimation was applied to the 6-h RR time series of healthy subjects and CHF patients in the two corresponding phases (sleep and wakefulness). Figure 2d–f show the H-value histogram of sleeping series in both health conditions calculated using the three methods. In addition, the average and standard deviation can be observed in Table 2. It is worth mentioning that these new results showed significant differences for methods 1, 2 and 3 (method 1: ; methods 2 and 3: ).
Table 2.
H-values calculated for series of healthy and CHF subjects during asleep and awake 6-h periods.
On the other hand, Figure 2g–i show the H-values of awake series for both populations, calculated using three methods. The average and standard deviation of these values are presented in Table 2. When performing the statistical analysis, we found that the difference between the H-values of healthy individuals and those with congestive heart failure is statistically significant (method 1: ; methods 2 and 3: ). In addition, it is worth noting that, on average, both in the waking phase and the sleep phase, the series exhibit a loss of long-range correlations. These results are in agreement with those previously reported by [9].
4. Discussion
The H-value estimations were applied to the HRV time series for healthy and CHF subjects, and we obtained insights into the health status of each subject. We can see in Figure 2a–c that the H-values of healthy subjects showed that there is persistence in their RR series and antipersistence for congestive subjects. This allows us to determine that the H-value can serve as an indicator to evaluate an individual’s physical health status, which is consistent with the work published by Gorshkov et al. [10]. Time series were analyzed in the sleep and wake phases. In Figure 2d–i, we observed that, in healthy subjects, the H-value corresponds to persistent time series in both phases.
On the other hand, in CHF patients, it has been found that there are no significant changes in H-value between sleep and wakefulness. This means that the series are antipersistent; that is, the disease is associated with a loss in long-range autocorrelations. These results suggest that patients with CHF experience the same symptoms both asleep and awake; that is, their condition does not improve even when resting. Hence, the results suggest that methods 1–3 for estimating the Hurst exponent were effective in analyzing this type of series.
Finally, when comparing the results obtained in this study with other references, we observed that other measurements based on complexity techniques, such as entropy, the slope of the connectivity (k) vs. magnitude (M) graph, and the multifractal spectrum, have also shown promising results for the analysis of tachograms under various conditions. It is essential to highlight that the findings indicated a relationship between the loss of persistence in heart rate variability series caused by illness, a decrease in complexity in the multifractal spectrum [11], a reduction in entropy [12], and an increase in the kM slope value [3].
5. Conclusions
The Hurst exponent, regardless of the estimation methodology employed, may serve as a useful auxiliary tool for the analysis of heartbeat time series and the characterization of physiological dynamics associated with cardiovascular health. In this study, three different approaches were used to estimate the Hurst exponent: the conventional method, DSOD, and WDSOD. The DSOD and WDSOD methods produced highly consistent results across all analyzed conditions, while the conventional method showed some quantitative differences. Nevertheless, all three approaches were able to identify significant differences in the complete RR series as well as in the awake and sleep segments. The results indicate that persistent tachograms are generally associated with healthy subjects, whereas antipersistent behavior is observed in patients with congestive heart failure. Overall, these findings demonstrate the robustness of Hurst exponent analysis for distinguishing physiological states and suggest that persistence measures may provide valuable information for assessing cardiovascular function and physiological alterations associated with an increased risk of chronic diseases.
Author Contributions
Conceptualization, A.M.-D. and P.O.-V.; methodology, A.M.-D., P.O.-V., and J.A.Z.-J.; software, J.A.Z.-J.; validation, A.M.-D. and J.L.D.-R.-C.; formal analysis, A.M.-D. and J.L.D.-R.-C.; writing—original draft preparation, A.M.-D. and J.A.Z.-J.; writing—review and editing, A.M.-D. and J.A.Z.-J.; supervision, A.M.-D. All authors have read and agreed to the published version of the manuscript.
Funding
This study was funded by the Secretaria de Investigacion de Posgrado (SIP) under the following grants: PRORED-2026-0077 and IND-2026-0170.
Institutional Review Board Statement
The study was conducted in accordance with the Declaration of Helsinki, and approved by the Ethics Committee of Faculty of Higher Studies Iztacala, UNAM (protocol code CE/FESI/022020/1348), for studies involving humans.
Informed Consent Statement
Informed consent was obtained from all subjects involved in the study.
Data Availability Statement
The data that support the findings of this study are available from the corresponding author upon reasonable request.
Conflicts of Interest
The authors declare no conflicts of interest.
References
- Goldberger, A.L.; Amaral, L.A.N.; Hausdorff, J.M.; Ivanov, P.C.; K Peng, C.; Stanley, H.E. Self-Organized Complexity in the Physical, Biological, and Social Sciences; National Academies Press: Washington, DC, USA, 2002. [Google Scholar]
- Ivanov, P.C.; Hu, K.; Hilton, M.F.; Shea, S.A.; Stanley, H.E. Endogenous circadian rhythm in human motor activity uncoupled from circadian influences on cardiac dynamics. Appl. Phys. Sci. 2007, 104, 20702–20707. [Google Scholar] [CrossRef] [Scilit] [PubMed]
- Muñoz-Diosdado, A.; Solís-Montufar, E.E.; Zamora-Justo, J.A. Visibility Graph Analysis of Heartbeat Time Series: Comparison of Young vs. Old, Healthy vs. Diseased, Rest vs. Exercise, and Sedentary vs. Active. Entropy 2023, 25, 677. [Google Scholar] [CrossRef] [Scilit] [PubMed]
- Hurst, H.E. Long-Term Storage Capacity of Reservoirs. Trans. Am. Soc. Civ. Eng. 1951, 116, 770–799. [Google Scholar] [CrossRef] [Scilit]
- Dlask, M.; Kukal, J. Hurst exponent estimation from short time series. Signal Image Video Process. 2019, 13, 263–269. [Google Scholar] [CrossRef] [Scilit]
- Istas, J.; Lang, G. Quadratic variations and estimation of the local Hölder index of a Gaussian process. Ann. L’institut Henri Poincare (B) Probab. Stat. 1997, 33, 407–436. [Google Scholar] [CrossRef] [Scilit]
- Abry, P.; Flandrin, P.; Taqqu, M.; Veitch, D. Self-Similarity and Long-Range Dependence Through the Wavelet Lens. In Theory and Applications of Long-Range Dependence; Birkhäuser: Boston, MA, USA, 2003; pp. 527–556. [Google Scholar]
- Goldberger, A.L.; Amaral, L.A.N.; Glass, L.; Hausdorff, J.M.; Plamen; Ivanov, C.; Mark, R.G.; Mietus, J.E.; Moody, G.B.; Peng, C.K.; et al. PhysioBank, PhysioToolkit, and PhysioNet Components of a New Research Resource for Complex Physiologic Signals. Circulation 2000, 101, e215–e220. [Google Scholar] [CrossRef] [Scilit] [PubMed]
- Ivanov, P.C.; Bunde, A.; Amaral, L.A.N.; Havlin, S.; Fritsch-Yelle, J.; Baevsky, R.M.; Stanley, H.E.; Goldberger, A.L. Sleep-wake differences in scaling behavior of the human heartbeat: Analysis of terrestrial and long-term space flight data-Biological and medical physics: General theory and mathematical aspects. Europhys. Lett. 1999, 48, 594–600. [Google Scholar]
- Gorshkov, O.; Ombao, H. Evaluation of monofractal and multifractal properties of inter-beat (R-R) intervals in cardiac signals for differentiation between the normal and pathology classes. IET Signal Process. 2019, 13, 798–805. [Google Scholar] [CrossRef] [Scilit]
- Aguilar-Molina, A.M.; Zamora-Justo, J.A.; Angulo-Brown, F.; Muñoz-Diosdado, A. Heart rate variability series during physical activity analyzed with multifractal techniques. J. Phys. Complex. 2024, 5, 045006. [Google Scholar] [CrossRef] [Scilit]
- Solís-Montufar, E.E.; Gálvez-Coyt, G.; Muñoz-Diosdado, A. Entropy Analysis of RR-Time Series From Stress Tests. Front. Physiol. 2020, 11, 981. [Google Scholar] [CrossRef] [Scilit] [PubMed]

Disclaimer/Publisher’s Note: The statements, opinions and data contained in all publications are solely those of the individual author(s) and contributor(s) and not of MDPI and/or the editor(s). MDPI and/or the editor(s) disclaim responsibility for any injury to people or property resulting from any ideas, methods, instructions or products referred to in the content. |
© 2026 by the authors. Licensee MDPI, Basel, Switzerland. This article is an open access article distributed under the terms and conditions of the Creative Commons Attribution (CC BY) license.