


Abstract
This paper proposes a dynamic profit maximization model for a monopolistic provider of AI infrastructure under conditions of market saturation and technological depreciation of infrastructure. The model is formulated within an optimal control framework and links the firm’s investment effort, the expansion of AI infrastructure in the relevant market, and discounted profit within a single analytical structure. The objective function is specified as the maximization of discounted profit subject to a dynamic constraint governing the expansion of AI infrastructure. The paper analyzes three scenarios—a baseline scenario, a high-barrier scenario, and a high-opportunity scenario—and complements the analytical results with numerical simulation analysis. The results show that the optimal investment trajectory depends on the effectiveness of investment effort, the cost intensity of investment, and the rate of infrastructure depreciation. A more favorable environment supports earlier and more intensive investment, whereas stronger barriers lead to a more cautious investment strategy and slower expansion of AI infrastructure. The contribution of the paper lies in linking dynamic optimization with the economic interpretation of investment in AI infrastructure under concentrated market conditions. By generating time-dependent trajectories under alternative parametric regimes, the model also operates as a structural, scenario-based forecasting framework for the conditional projection of AI infrastructure expansion.
1. Introduction
The development of artificial intelligence is increasingly tied not only to the availability of algorithms and data, but also to the infrastructural capacities on which such solutions can be built, operated, and further scaled. In this sense, AI infrastructure is becoming an important prerequisite for technological development, the scaling of solutions, and long-term competitiveness. Its importance is reflected not only at the level of firm decision making, but also in public policy strategy documents. The document Vízia AI pre Slovensko [Vision for AI in Slovakia] explicitly identifies infrastructure and data as key priorities for the further development of artificial intelligence and emphasizes the need to build computational and data capacities [1].
At the same time, investment in AI infrastructure cannot be understood as a simple one-off decision. It is a process in which the firm faces high investment requirements, technological dynamics, market uncertainty, and the need for the gradual expansion of infrastructural capacities. A publicly available text from the AI-ImpactSK project points out that, in the Slovak context, significant barriers to AI adoption include high implementation costs, infrastructural limitations, insufficient data availability, and a lack of qualified human capital [2].
The available literature devotes considerable attention to technological, regulatory, and governance aspects of artificial intelligence. Research on responsible AI governance focuses mainly on principles, governance frameworks, and the operationalization of responsible AI implementation in organizations [3]. Similarly, studies on AI governance and regulation emphasize the need for a consistent regulatory environment and appropriate governance arrangements for successful and responsible AI adoption [4]. By contrast, less attention has been paid to formal dynamic modeling of investment decision making in the expansion of AI infrastructure in the market.
While the optimal control framework for investment with convex adjustment costs is well established [5,6,7], its application to AI infrastructure as a saturating state variable, under joint depreciation and a monopoly benchmark, remains limited. The contribution of this paper is threefold: (i) it adapts the dynamic profit maximization apparatus to AI infrastructure expansion, characterized by high fixed costs, scale advantages, and rapid depreciation of compute capital; (ii) it combines logistic-type market saturation, depreciation, and a monopoly benchmark within a tractable optimal control structure; and (iii) it uses the resulting time-dependent trajectories of the state, control, and shadow-value variables as conditional, scenario-based projections of infrastructure expansion.
Although grounded in optimal control rather than reduced-form statistical time-series methodology, the model generates explicit time-dependent trajectories under alternative parametric regimes. It therefore belongs to the family of structural, scenario-based forecasting tools that complement empirical time-series approaches and provide conditional projections of infrastructure expansion under alternative economic environments. This positions the paper within the broader scope of time-dependent modeling and forecasting addressed at the conference.
The aim of this paper is to propose a dynamic profit maximization model for a monopolistic provider of AI infrastructure and to analyze how investment effectiveness, investment cost intensity, and infrastructure depreciation affect the optimal investment trajectory and market expansion of AI infrastructure. The paper applies optimal control and formulates a model with a dynamic constraint governing AI infrastructure expansion under fixed market saturation.
2. Theoretical Foundations and Conceptual Framework
In this paper, the monopoly benchmark is not used as a literal description of the entire AI market, but as an analytical framework for a firm investing in specialized AI infrastructure within a narrowly defined segment of the digital market. Such segments are associated with high fixed investment costs, significant economies of scale, capital intensity, and entry barriers that support market concentration. In the context of cloud computing, Kushida et al. [8] point out that global cloud services are provided by only a small number of multinational firms and that competing with them without meaningful differentiation is extremely difficult given the cost pressure associated with large-scale provision. In a follow-up study, the same authors emphasize that cloud computing is based on the massive sharing of hardware infrastructure and on an architecture of abundant computing resources that increases the importance of scale and capital-intensive infrastructure [9]. More specifically for AI infrastructure, Zheng [10] argues that control over data and computational resources increases entry barriers, supports vertical integration, and reinforces the dominant position of established actors. For this reason, the monopoly benchmark in our model is understood as an analytical simplification suitable for examining the optimal trajectory of investment effort, the expansion of AI infrastructure, and firm profit over time.
The expansion of AI infrastructure in the market may be understood as a process of gradual adoption whose pace depends on investment effort, the existing level of expansion, and the absorptive capacity of the environment. The empirical literature on digital technologies shows that the adoption of cloud computing and related digital solutions is conditioned by a combination of technological, organizational, and environmental factors and does not occur as an instantaneous shift, but rather as a process of expansion over time [11,12]. At the same time, this is a naturally bounded process. Research on the relationship between the adoption of new technologies and additions to network infrastructure documents nonlinear stock effects, suggesting that as the existing level of infrastructure increases, the dynamics of further expansion also change [13]. For modeling AI infrastructure, it is therefore appropriate to assume that investment effort supports its expansion, but that this effect gradually weakens as the process approaches the limit of market saturation. The dynamic nature of the analyzed problem is further reinforced by the fact that infrastructural solutions are subject to depreciation, technological obsolescence, and the need for continuous renewal. For this reason, it is appropriate to model the expansion of AI infrastructure as a state variable whose development is, on the one hand, supported by the firm’s investment effort, but, on the other hand, is dampened by market saturation and infrastructure depreciation over time. This provides a natural theoretical bridge between the economic interpretation of the problem and the optimal control framework used in the following section.
3. A Dynamic Profit Maximization Model Under Monopoly Conditions
We consider a monopolistic firm providing specialized AI infrastructure in a narrowly defined segment of the digital market. The objective of the firm is to determine a trajectory of investment effort into AI infrastructure that maximizes its discounted profit over time.
The monopolistic firm maximizes total discounted profit over the time interval [0,T] subject to a dynamic constraint on the expansion of AI infrastructure in the relevant market. The objective function is formulated as the difference between the revenue effect of AI infrastructure expansion and the costs of investment effort directed to AI infrastructure. A similar type of objective function with a quadratic cost component is commonly used in dynamic investment models with adjustment costs [5,7].
The objective function is therefore written as follows:
where x(t) denotes the extent of AI infrastructure expansion in the relevant market at time t, u(t) represents the firm’s investment effort into AI infrastructure, parameter p > 0 captures the contribution of the extent of AI infrastructure expansion to the firm’s revenues, c > 0 reflects the cost intensity of investment effort, r > 0 denotes the discount rate, and T is the finite time horizon of the model. The chosen form of the objective function assumes that the growth of AI infrastructure expansion in the market increases the firm’s revenue potential, whereas investment effort is associated with increasing costs. The quadratic cost component captures the convex nature of investment costs, which is commonly used in dynamic investment models to represent adjustment costs [5,7]. In the context of AI infrastructure, such a specification is also consistent with the high capital intensity and scale requirements of cloud and computational infrastructures [8,9,10]. In the terminology of optimal control, x(t) is the state variable describing the cumulative extent of AI infrastructure expansion, while u(t) is the control variable representing the firm’s investment effort. The logistic-type saturation term () in Equation (2) follows the diffusion logic introduced by Bass [14], adapted to the infrastructural context.
The dynamics of the model are based on the assumption that the expansion of AI infrastructure in the relevant market is a gradual process supported by the firm’s investment effort, but at the same time bounded by market saturation. For this reason, we consider the following dynamic constraint of the model:
where α > 0 expresses the effectiveness of investment effort in expanding AI infrastructure in the market, K > 0 denotes the maximum level of market expansion, and δ > 0 captures the rate of depreciation, obsolescence, or decline in the use of AI infrastructure over time. The first term in Equation (2) expresses that the firm’s investment effort supports the expansion of AI infrastructure in the market. This effect, however, decreases as the level of x(t) rises, because as the process approaches the limit of market saturation, the room for further expansion gradually diminishes. The second term captures the fact that, without continuous renewal and additional investment, the relative importance of infrastructure may decline, for example, due to technological obsolescence, customer attrition, or the growth of competing alternatives outside the considered segment. The chosen dynamic specification makes it possible to capture the basic logic of the analyzed problem without introducing more complex diffusion mechanisms.
Hamiltonian and optimality conditions: For the solution of the optimal control problem, we formulate the current-value Hamiltonian as follows:
where μ(t) is the adjoint variable representing the shadow value of a change in the extent of AI infrastructure expansion in the relevant market.
The first-order condition with respect to the control variable leads to the optimal trajectory of investment effort:
where u*(t) denotes the optimal investment effort at time t.
This relationship implies that optimal investment effort increases with the shadow value of further expansion of AI infrastructure and decreases as the market approaches its saturation limit. Economically, this means that the firm has the strongest incentive to invest when additional infrastructure expansion is still valuable and there remains sufficient room in the market for further growth.
The state equation of the model is given by Equation (2), while the costate equation is given by
Under a finite time horizon and a free terminal state, the transversality condition is
μ(T) = 0.
The transversality condition in Equation (6) has a clear economic interpretation. Since μ(t) represents the shadow value of an additional unit of AI infrastructure expansion, this condition implies that at the terminal time T, a marginal increase in infrastructure expansion no longer contributes to the firm’s discounted profit. As a consequence, the optimal investment effort declines toward the end of the planning horizon. Given the first-order condition in Equation (4), the model therefore implies a front-loaded investment trajectory: the strongest incentive to invest arises in earlier phases, when the shadow value of infrastructure expansion is still high and there remains sufficient time to generate returns from accumulated infrastructure. This pattern is consistent with the general logic of finite-horizon optimal control models without terminal salvage value [5].
4. Scenario Analysis of the Model
To illustrate the behavior of the model, we consider three scenarios that differ in the values of parameters α, c, and δ, while parameter K remains fixed across all scenarios. Such a setup makes it possible to analyze how the optimal trajectory of investment effort and the dynamics of AI infrastructure expansion change under different levels of investment effectiveness, investment cost intensity, and infrastructure depreciation.
Baseline scenario: The baseline scenario represents the reference setting of the model in which the parameters take the values (α,c,δ) = (α0,c0,δ0). This scenario serves as a benchmark for comparing alternative market and investment conditions.
High-barrier scenario: The high-barrier scenario is defined by the conditions α < α0, c > c0, and δ > δ0. Such a setup captures a situation in which investment effort is translated into the expansion of AI infrastructure less effectively, investment is more costly, and infrastructure depreciates more rapidly. From Equation (4), it follows that a decline in parameter α and an increase in parameter c, other things being equal, reduce the optimal intensity of investment effort. From Equation (2), it also follows that a higher value of parameter δ weakens the dynamics of AI infrastructure expansion. The model therefore implies slower growth of x(t) and a lower trajectory of optimal investment effort in this scenario.
High-opportunity scenario: The high-opportunity scenario is defined by the conditions α > α0, c < c0, and δ < δ0. This scenario represents an environment in which investment effort is translated into AI infrastructure expansion more effectively, investment is relatively less costly, and infrastructure depreciates more slowly. From Equation (4), it follows that an increase in parameter α and a decrease in parameter c raise the optimal intensity of investment effort. From Equation (2), it also follows that a lower value of parameter δ supports the growth of the extent of AI infrastructure expansion in the market. In this scenario, the model therefore implies a higher trajectory of u*(t) and faster expansion of AI infrastructure compared to the baseline scenario.
These stylized scenarios admit an empirically motivated reading. The high-opportunity regime is consistent with the position of global hyperscalers such as Amazon Web Services, Microsoft Azure, and Google Cloud, which combine high investment effectiveness with large-scale and comparatively long-lived backbone infrastructure [8,9,10]. The baseline regime corresponds more closely to specialized AI compute providers and mid-sized cloud operators, which translate investment into capacity with moderate effectiveness and face non-trivial cost intensity. The high-barrier regime captures regional or national AI infrastructure providers operating in narrowly defined markets with limited scale, higher unit costs, and faster effective obsolescence—a setting that is directly relevant for emerging-market and small-country AI strategies, including the Slovak context outlined by the Ministry of Investment, Regional Development and Informatization of the Slovak Republic [1] and Banda et al. [2].
5. Numerical Results and Simulation Analysis
To complement the analytical results, the model was solved numerically as a two-point boundary value problem subject to the initial condition for the state variable and the terminal transversality condition for the costate variable. The numerical solution was obtained using a collocation-based boundary value solver, which makes it possible to compute the joint trajectories of the state and control variables under alternative parameter settings.
The numerical simulation serves two complementary purposes. First, it visualizes the joint time paths of x(t), u*(t), μ(t), and the discounted profit flow, which cannot be obtained in closed form because the costate Equation (5) contains the bilinear term . Second, it allows quantitative comparison of scenarios that share the same qualitative structure but differ in parameter magnitudes.
The parameter values reported in Table 1 are illustrative rather than empirically calibrated. The discount rate r = 0.05 is a standard reference value in dynamic investment analysis. The depreciation rate δ in the range 0.05 to 0.15 deserves explicit comment: Doms et al. [15] estimated annual economic depreciation rates of approximately 30 percent for personal computers, while the European Commission’s Ecodesign preparatory study reports an average economic lifetime of three to five years for servers used by primary users [16]. The baseline value δ = 0.10 used here is therefore a conservative choice consistent with longer-lived backbone server infrastructure, while δ = 0.15 in the high-barrier scenario is closer to the lower end of the empirically observed range. The cost intensity parameter c and the effectiveness parameter α are normalized so that the baseline trajectory remains within an economically admissible range; the comparative-statics conclusions below depend on the relative ordering of the parameters across scenarios rather than on their specific numerical levels.
Table 1.
Model parameters and scenario specification.
The baseline scenario serves as the reference case, while the high-barrier and high-opportunity scenarios are defined by lower or higher investment effectiveness, different cost intensities of investment, and different rates of infrastructure depreciation. In all scenarios, the market saturation parameter remains fixed.
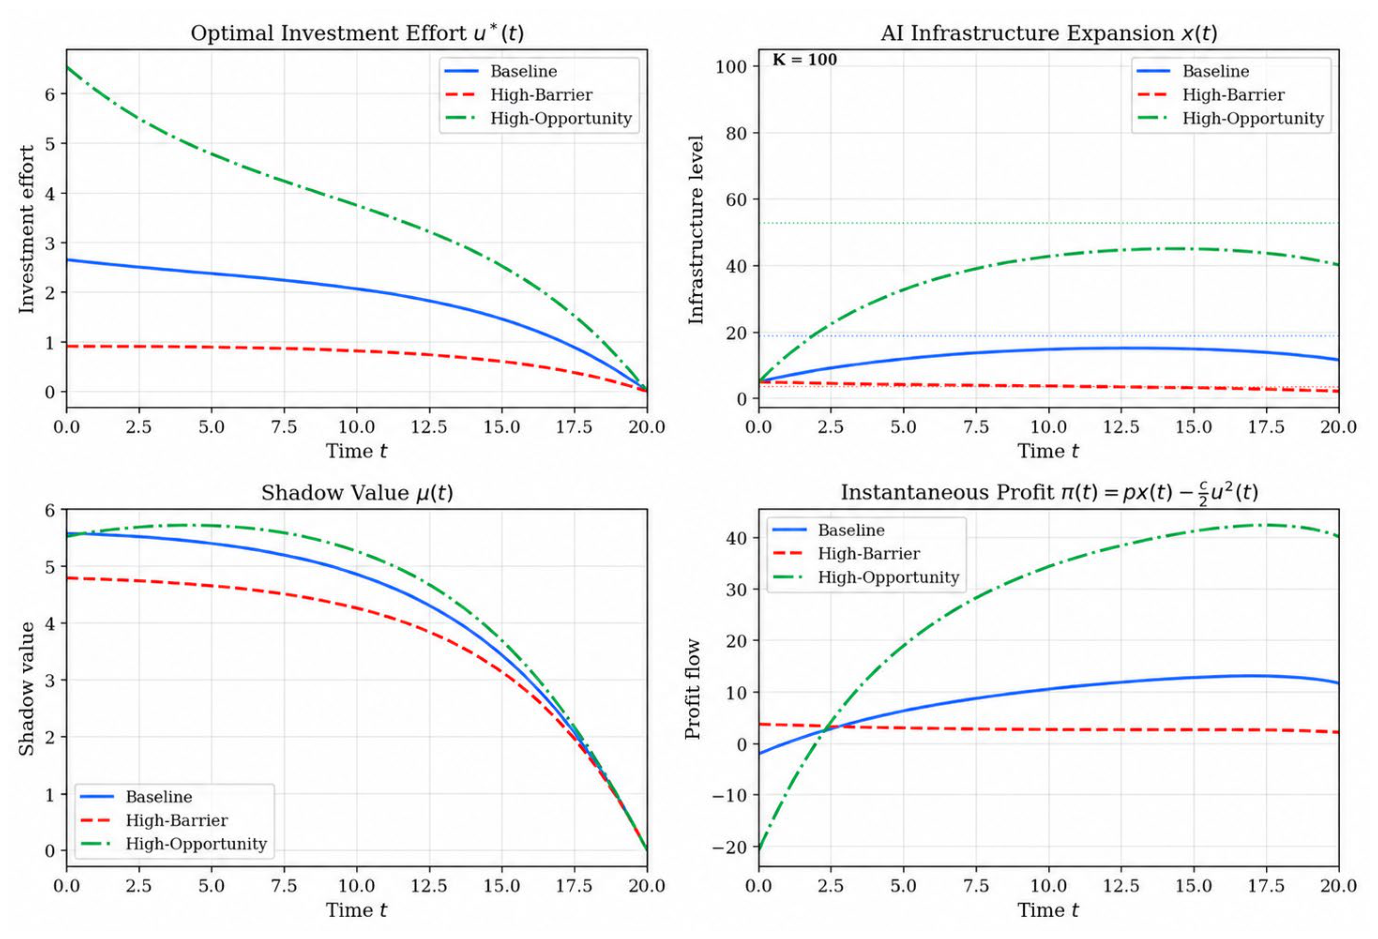
The baseline scenario produces a moderate expansion path of AI infrastructure and an intermediate level of discounted profit. By contrast, the high-barrier scenario yields substantially weaker performance, with lower optimal investment effort, slower infrastructure expansion, and lower discounted profit. The high-opportunity scenario produces the strongest outcome, with the highest discounted profit and the largest terminal extent of AI infrastructure expansion. The main numerical results for the three scenarios are summarized in Table 2.
Table 2.
Numerical results of the scenario analysis.
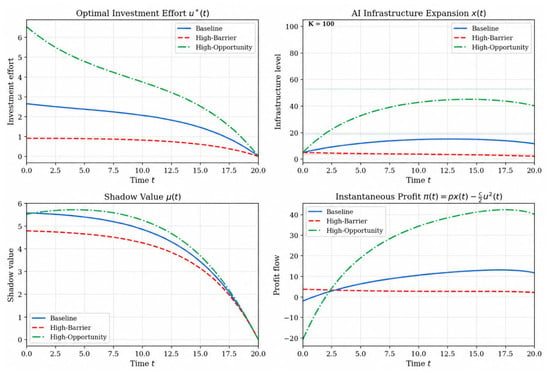
These differences are clearly visible in Figure 1, which plots the trajectories of the state variable x(t) and the optimal control u*(t) across the three scenarios. In the baseline scenario, investment effort is initially positive and gradually decreases as the market approaches saturation. In the high-barrier scenario, the trajectory of investment remains lower throughout the horizon, and the expansion of AI infrastructure is markedly slower. In the high-opportunity scenario, investment effort is strongest in the early phase, leading to the fastest expansion path and the highest level of market penetration at the end of the time horizon.
Figure 1.
Trajectories of the state variable x(t) and the optimal control u*(t) under the baseline, high-barrier, and high-opportunity scenarios.
The numerical results therefore confirm the analytical implications of the model. Higher investment effectiveness and lower cost intensity support stronger early investment and faster infrastructure expansion, whereas lower effectiveness, higher costs, and faster depreciation lead to more cautious investment behavior and weaker market expansion.
The qualitative pattern of the optimal solution is not driven by the specific terminal date. Solving the baseline scenario numerically with T = 40 yields a higher terminal level x(t) ≈ 12.56 (versus 11.68 at T = 20) and a higher peak level max x(t) ≈ 18.25 (versus 15.19), while preserving the front-loaded shape of u*(t) [u*(0) ≈ 2.71 versus 2.65] and the terminal decline implied by the transversality condition. Shortening the horizon to T = 10 compresses the same pattern into a lower-amplitude profile [u*(0) ≈ 2.30, x(T) ≈ 8.93]. The economic logic—investment intensity guided by the shadow value of expansion and dampened by saturation and depreciation—is therefore robust to the planning horizon.
Comparative-statics analysis of the steady state of the model confirms the qualitative ordering of the scenarios at the parameter level as well. Holding the remaining parameters at their baseline values, the steady-state level x* is monotonically increasing in the effectiveness parameter α (e.g., x* rises from about 6.9 at α = 0.5 to about 37.4 at α = 2.0) and monotonically decreasing in both the depreciation rate δ (from about 54.6 at δ = 0.02 to about 7.9 at δ = 0.20) and the cost intensity c (from about 27.7 at c= 1.0 to about 11.9 at c = 4.0). The scenario ranking obtained from the finite-horizon BVP solution therefore reflects a stable structural ordering rather than an artifact of the specific numerical levels chosen.
6. Discussion
The numerical analysis reinforces the central implication of the model: investment in AI infrastructure should be understood as a dynamic decision problem rather than a one-off strategic choice. From Equation (4), it follows that optimal investment effort increases with the effectiveness of investment effort and decreases with the cost intensity of investment. At the same time, it declines as the market approaches its saturation limit, because the room for further expansion of AI infrastructure diminishes. From Equation (2), it also follows that a higher value of parameter δ slows down the expansion of AI infrastructure even when the firm invests. Under the natural assumptions of the model, optimal investment effort remains non-negative and the extent of AI infrastructure expansion remains within an economically admissible interval.
The comparison of scenarios shows that the high-barrier scenario leads to a lower optimal trajectory of investment effort, slower growth in the extent of AI infrastructure expansion, and lower discounted profit. By contrast, the high-opportunity scenario implies higher investment intensity, faster expansion of AI infrastructure, and higher discounted profit. The model thus shows that the optimal investment strategy depends on the combination of the effectiveness of investment effort, the cost intensity of investment, and the rate of infrastructure depreciation.
The broader contribution of the model lies in providing an analytical framework that connects the economic interpretation of AI infrastructure investment with a formal dynamic optimization structure. Since the model generates time-dependent trajectories of investment effort and AI infrastructure expansion under alternative parameter settings, it can also serve as a basis for planning and conditional projections of AI infrastructure development. In this sense, the paper adds a microeconomic perspective to a field that is often discussed primarily in technological, regulatory, or strategic terms.
The monopoly benchmark adopted in this paper is a deliberate analytical simplification. The global market for AI infrastructure is more accurately described as a concentrated oligopoly dominated by a small number of hyperscalers [10]. The framework is therefore most directly applicable to (i) regional or segment-specific providers operating in narrowly defined niches with limited direct rivalry, and (ii) as an upper-bound benchmark against which oligopolistic dynamics can be compared. An explicit dynamic oligopoly formulation, in the spirit of differential games, is a natural next step.
The decline of optimal investment effort towards the terminal date is a mechanical consequence of the transversality condition μ(T)= 0 in a finite-horizon problem without terminal salvage value. Economically, it reflects a project-horizon interpretation under which the firm has no incentive to leave additional infrastructure behind at T. In actual AI infrastructure markets, investment is typically conducted under rolling horizons or with an explicit continuation value attached to the installed base. The model can be naturally extended to (i) an infinite-horizon stationary formulation in which u*(t) converges to a steady state, or (ii) a finite horizon augmented with a salvage term φ(x(T)) capturing the continuation value of installed infrastructure.
The infinite-horizon stationary analog of the model provides a useful reference point. Solving the stationarity conditions 0 and 0 for the baseline parameterization yields x* ≈ 18.95, μ* ≈ 5.77, and u* ≈ 2.34, with the corresponding values for the high-barrier (x* ≈ 3.61) and high-opportunity (x* ≈ 52.99) regimes. The finite-horizon trajectories computed in Section 5 are projections of this stationary structure onto a bounded planning horizon: as T grows, the peak level of x(t) approaches x*, while u*(t) approaches the stationary investment intensity over most of the interior of the horizon before declining to zero at T because of the transversality condition.
From a managerial perspective, the model supports a front-loaded investment strategy when investment effectiveness is high, cost intensity is low, and depreciation is moderate, whereas a high-barrier parameter mix calls for a more cautious and smoother investment profile. From a policy perspective, the comparative statics imply that interventions reducing the effective cost intensity c (e.g., investment incentives, accelerated depreciation, joint infrastructure programs) or improving the translation of effort into capacity α (e.g., interconnection standards, shared compute platforms) have a stronger leverage effect on infrastructure expansion than direct support to the state variable. This is directly relevant for the operationalization of national strategies such as Vízia AI pre Slovensko [1].
7. Conclusions
This paper proposes a dynamic profit maximization model for a monopolistic provider of AI infrastructure under conditions of market saturation and technological depreciation of infrastructure. The proposed framework links the firm’s investment effort, the expansion of AI infrastructure in the relevant market, and discounted profit into one consistent optimal control problem.
The contribution of the paper lies in interpreting investment in AI infrastructure as a dynamic process whose optimal trajectory depends on the effectiveness of investment effort, the cost intensity of investment, and the rate of infrastructure depreciation. The scenario analysis further shows that a more favorable environment supports earlier and more intensive investment, whereas stronger barriers lead to a more cautious investment trajectory and slower expansion of AI infrastructure.
A limitation of the paper is that the model remains at the level of analytical and scenario-based specification and has not yet been calibrated using data from a specific market segment. Future research may therefore focus on sector-specific parameterization, numerical extensions, and empirical validation of the model in selected AI infrastructure markets.
Empirical operationalization could proceed along several lines: the effectiveness parameter α may be identified from firm-level investment-to-capacity elasticities; the cost intensity c from accounting CapEx adjustment costs [6,7]; the depreciation rate δ from industry depreciation schedules for server and ICT capital [15,16]; and the saturation level K from sector-specific compute-capacity outlooks. A natural further step is the extension to dynamic oligopoly competition that captures strategic interaction among large infrastructure providers.
Author Contributions
Conceptualization, methodology, software, validation, formal analysis, investigation, resources, data curation: N.G. and P.Š.; writing—original draft preparation, N.G.; writing—review and editing, P.Š.; visualization, N.G. and P.Š.; supervision, P.Š.; project administration, N.G.; funding acquisition, N.G. All authors have read and agreed to the published version of the manuscript.
Funding
This research was funded by EU NextGenerationEU through the Recovery and Resilience Plan for Slovakia under project No. 09I05-03-V02-00003/2025/VA (AI-impactSK); 100% share.
Institutional Review Board Statement
Not applicable. This study did not involve human participants.
Informed Consent Statement
Not applicable.
Data Availability Statement
No new empirical data were created or analyzed in this study. The paper is based on analytical modeling and numerical simulation.
Conflicts of Interest
The authors declare no conflicts of interest. The funders had no role in the design of the study; in the analyses or interpretation of the results; in the writing of the manuscript; or in the decision to publish the results.
References
- Ministry of Investment, Regional Development and Informatization of the Slovak Republic. Vízia AI pre Slovensko [Vision for AI in Slovakia]. 2025. Available online: https://mirri.gov.sk/aktuality/splnomocnenec-vlady-pre-ai/vizia-ai-pre-slovensko/ (accessed on 21 March 2026).
- Banda, F.; Bolek, V.; Hamranová, A. Barriers to AI Adoption: Why Slovak Companies Face a Steep Climb. AI-ImpactSK, 2025. Available online: https://www.ai-impact.sk/news/barriers-to-ai-adoption-why-slovak-companies-face-a-steep-climb/ (accessed on 21 March 2026).
- Papagiannidis, E.; Mikalef, P.; Conboy, K. Responsible artificial intelligence governance: A review and research framework. J. Strateg. Inf. Syst. 2025, 34, 101885. [Google Scholar] [CrossRef] [Scilit]
- Erdélyi, O.J.; Goldsmith, J. Regulating artificial intelligence: Proposal for a global solution. Gov. Inf. Q. 2022, 39, 101748. [Google Scholar] [CrossRef] [Scilit]
- Abel, A.B.; Eberly, J.C. Optimal investment with costly reversibility. Rev. Econ. Stud. 1996, 63, 581–593. [Google Scholar] [CrossRef] [Scilit]
- Hayashi, F. Tobin’s Marginal q and Average q: A Neoclassical Interpretation. Econometrica 1982, 50, 213–224. [Google Scholar] [CrossRef] [Scilit]
- Cooper, R.W.; Haltiwanger, J.C. On the Nature of Capital Adjustment Costs. Rev. Econ. Stud. 2006, 73, 611–633. [Google Scholar] [CrossRef] [Scilit]
- Kushida, K.E.; Murray, J.; Zysman, J. Diffusing the Cloud: Cloud Computing and Implications for Public Policy. J. Ind. Compet. Trade. 2011, 11, 209–237. [Google Scholar] [CrossRef] [Scilit]
- Kushida, K.E.; Murray, J.; Zysman, J. Cloud Computing: From Scarcity to Abundance. J. Ind. Compet. Trade 2015, 15, 5–19. [Google Scholar] [CrossRef] [Scilit]
- Zheng, K. Antitrust in Artificial Intelligence Infrastructure—Between Regulation and Innovation in the EU, the US, and China. Comput. Law Secur. Rev. 2025, 59, 106211. [Google Scholar] [CrossRef] [Scilit]
- Oliveira, T.; Thomas, M.; Espadanal, M. Assessing the determinants of cloud computing adoption: An analysis of the manufacturing and services sectors. Inf. Manag. 2014, 51, 497–510. [Google Scholar] [CrossRef] [Scilit]
- Nicoletti, G.; von Rüden, C.; Andrews, D. Digital technology diffusion: A matter of capabilities, incentives or both? Eur. Econ. Rev. 2020, 128, 103513. [Google Scholar] [CrossRef] [Scilit]
- van Dijk, J.; Delacrétaz, N.; Lanz, B. Technology Adoption and Early Network Infrastructure Provision in the Market for Electric Vehicles. Environ. Resour. Econ. 2022, 83, 631–679. [Google Scholar] [CrossRef] [Scilit] [PubMed]
- Bass, F.M. A New Product Growth for Model Consumer Durables. Manag. Sci. 1969, 15, 215–227. [Google Scholar] [CrossRef] [Scilit]
- Doms, M.E.; Dunn, W.E.; Oliner, S.D.; Sichel, D.E. How Fast Do Personal Computers Depreciate? Concepts and New Estimates. Tax. Policy Econ. 2004, 18, 37–79. [Google Scholar] [CrossRef] [Scilit][Green Version]
- Bayramoglu, S.; Berwald, A.; Faninger, T.; Mudgal, S.; Nissen, N.; Stobbe, L.; Tinetti, B. Ecodesign Preparatory Study on Enterprise Servers and Data Equipment; European Commission, Directorate-General for Internal Market, Industry, Entrepreneurship and SMEs: Berlin, Germany; Deloitte: Sydney, Australia; Fraunhofer IZM: Berlin, Germany, 2014. [Google Scholar] [CrossRef] [PubMed]

Disclaimer/Publisher’s Note: The statements, opinions and data contained in all publications are solely those of the individual author(s) and contributor(s) and not of MDPI and/or the editor(s). MDPI and/or the editor(s) disclaim responsibility for any injury to people or property resulting from any ideas, methods, instructions or products referred to in the content. |
© 2026 by the authors. Licensee MDPI, Basel, Switzerland. This article is an open access article distributed under the terms and conditions of the Creative Commons Attribution (CC BY) license.