


Abstract
The rise of 3D cell culture systems—including organoids, spheroids, and organ-on-a-chip models—has transformed our understanding of tumor biology, disease pathology, and tissue development. However, accurately analyzing spatial phenotypic content within these complex architectures remains a formidable challenge. While contemporary protocols strive for precise protein localization, their reliability is frequently undermined by technical artifacts and the structural degradation of the 3D matrices. These distortions are often induced by invasive harvesting, harsh clearing agents, and frequent sample transfers. To bridge the gap between complex 3D tissue architectures and reliable assay readouts, this study establishes a systematic troubleshooting framework for whole-mount 3D immunofluorescence staining. Utilizing a diverse panel of 24 distinct antibodies targeting membrane, cytoplasmic, and nuclear proteins across human airway organoids and liver cancer spheroids, we executed comprehensive mono-, double-, and triple-labeling configurations. To evaluate workflow boundaries, we conducted a series of controlled whole-mount experiments where specific, common technical mistakes were deliberately introduced. By documenting the exact imaging artifacts, structural distortions, and aberrant signal profiles generated by these intentional procedural errors, this study provides a unique visual “atlas of failure” paired directly with validated methodological solutions. The study offers a practical, high-throughput diagnostic resource to eliminate technical error and experimental noise for whole-mount immunofluorescence labeling experiments, thereby facilitating high-quality imaging and consistent phenotypic validation.
1. Introduction
Organoids, spheroids and assembloids have become increasingly valuable for drug discovery, disease modeling, and tissue engineering and represent a cornerstone of New Approach Methodologies (NAMs; also referred to as non-animal models) [1,2,3,4,5,6,7,8]. A significant paradigm shift is currently underway as laboratories ranging from multinational pharmaceutical companies to small academic research groups transition from traditional 2D cell monolayers to these 3D culture technologies. This growing global acceptance is heavily reinforced by recent landmark policy advancements, such as the US Food and Drug Administration (FDA) Modernization Act 2.0 and the European Chemicals Agency’s (ECHA) commitment to transitioning toward an animal-free regulatory framework, both of which actively promote and incentivize the adoption of NAMs.
NAMs—including human-derived 3D organoids, microphysiological systems, and 3D bioprinting—faithfully recapitulate human genetics, receptor profiles, and pathophysiology [8,9,10]. By natively preserving human-specific cellular backgrounds and metabolic pathways, these platforms offer patient-specific paradigms that effectively circumvent the translational limitations and inter-species discrepancies frequently encountered when transferring preclinical data from animal models (e.g., rodents) to human clinical outcomes [7,8,9,10,11].
The predictive power of data-driven computational NAMs, such as artificial intelligence (AI) and machine learning, depends heavily on the fidelity of baseline in vitro data. Despite the utility of non-destructive, label-free modalities (e.g., phase-contrast, brightfield, or holographic imaging paired with deep learning networks) for real-time monitoring of living 3D cultures, morphological inference alone cannot resolve subcellular or multi-protein dynamics [12,13,14,15,16,17,18]. Dense 3D macro-structures cause significant light scattering and optical occlusion, preventing label-free systems from distinguishing morphologically identical cells undergoing distinct intracellular signaling cascades. To conclusively validate cellular identity, protein conformation, and multiplexed spatial distribution within dense microenvironments, whole-mount immunofluorescence (WMIF) labeling remains the definitive benchmark. Label-free computer vision and WMIF therefore function as complementary toolsets: the former preserves sample longevity for continuous kinetic screening, while the latter delivers high-fidelity molecular and spatial validation. Consequently, extensive studies have focused on optimizing WMIF protocols to achieve the highest quality imaging and data resolution [19,20,21,22,23,24,25,26,27,28,29,30,31,32,33,34,35,36,37,38,39,40].
Similarly, evaluating the extracellular matrix (ECM) requires a hybrid approach. While Second Harmonic Generation (SHG) microscopy provides non-destructive imaging of structural collagen alignment, WMIF is essential to characterize matrix proteins [12,17,18].
Transitioning from 2D monolayers to 3D architectural models has introduced a critical “visibility gap” in spatial proteomics. While automated, AI-driven image analysis can segment thousands of cells simultaneously to eliminate human bias, the widespread adoption of high-throughput WMIF is bottlenecked by severe technical hurdles.
As compiled in Table 1, most WMIF methods are constrained by laborious, multi-step protocols that demand significant time, labor, and material resources [19,21,22,23,24,25,26,27,28,29,30,33,36,37,38,39,40].
Table 1.
Summary of recently published peer-reviewed articles describing optimized whole-mount immunofluorescence (WMIF) labeling protocols. * HS: Harvesting Solution; PB: Permeabilization Buffer; SB: Staining Buffer; BB: Blocking Buffer; DB: Diluting Buffer; WB: Washing Buffer; CA: Clearing Agent.
Table 1 presents a comparative analysis of contemporary WMIF labeling technologies. Key parameters, including the number of experimental steps, reagents prepared, and the overall experimental duration, are highlighted. This table reveals that many existing methods are defined by laborious multi-step protocols, various reagents, and extended incubation periods that impose significant time and resource demands. Furthermore, these techniques often incorporate harmful steps—such as invasive harvesting and aggressive clearing—that necessitate the handling of multiple solutions, thereby heightening the risk of human error and inconsistent antibody penetration [20,21,22,31,32]. The efficacy of those methods is often compromised by structural deformities introduced during harvesting and multi-step clearing procedures. Additionally, those processes necessitate the preparation and handling of numerous solutions, increasing the risk of human error. Moreover, the physical manipulation involved in these methods can disrupt the delicate 3D architecture of organoids and spheroids, leading to sample loss and potentially compromising the accuracy of experimental results. This multi-step nature introduces significant variability and increases the risk of human error, leading to inconsistent antibody penetration. This multi-step nature not only increases the risk of human error during solution preparation but also introduces significant variability that complicates the standardization of results across different laboratories. Standardizing these immunofluorescence experiments is essential to reducing procedural artifacts and enabling the acquisition of high-fidelity, large-scale spatial data.
Those methods and harvesting the organoids/spheroids from their environment frequently suffer from an inability to provide the entire data set; the physical and chemical stress of multi-step protocols often leads to structural deformation—including sample shrinkage, wrinkling, and the collapse of delicate surface features like cancer cell blebs or neurites. These harmful steps not only distort the 3D architecture but can also mask or destroy the very proteins researchers aim to localize. This inherent variability and the high procedural burden not only risk sample integrity but also complicate the standardization of results across different laboratories, highlighting a critical need for more streamlined and reliable methodologies.
Loss or damage of organoids and spheroids, a high background signal, and clumping of organoids are common problems in conventional methods [19,21,22]. For conventional spheroid staining, flattening of the spheroids after transfers and deformation of the shapes of the spheroids are other common problems [25]. Traditional immunofluorescence protocols for 3D cultures often involve multiple steps, including washes and reagent changes, which can result in a significant loss of organoids and spheroids, typically exceeding 25% of the initial population [28]. Furthermore, these procedures often involve centrifugation, which can compromise the structural integrity of 3D cultures [19,22,28]. The disruption of the native 3D architecture of organoids and spheroids can have severe consequences. These include conformational changes of proteins, modifications of antigenic sites, and protein loss, ultimately compromising the accuracy and reliability of experimental data.
Preparation of the solutions/reagents takes additional time that needs to be added to the protocols and results in another time-consuming period. For example, preparation of clearing medium took 16 h in the method published by Genenger et al. [25]. Permeabilization buffer, blocking buffer, antibody dilution buffer, and washing buffer are common solutions for conventional workflows, and they are prepared by the labs most of the time even though there are commercially available products [25]. Preparation of those solutions requires the time and budget, and consumes some plastic materials, like pipettes, centrifuge tubes, wells, gloves, etc.
Another problem is labeling spheroids and organoids in various commercial or customized hydrogels. The limited penetration depth of reagents and the high background noise associated with traditional methods further complicate the analysis of 3D cultures. Clearing is used to prevent the noise caused by the gels located close to those 3D structures. Adding a clearing step to the immunofluorescence labeling process is another reason for damage to the 3D architecture and loss of actual data. These factors can compromise the quality of immunofluorescence staining and the accuracy of subsequent data interpretation [33,34,35].
These variations underscore why method specificity is fundamental when evaluating protein dynamics in a 3D landscape. While a validated antibody can be universally deployed to detect a target protein across these diverse models, the absolute expression levels, specific sub-cellular compartments, and macro-scale distribution patterns will fluctuate drastically based on the model’s chronological age, its differentiation zones, and the specific composition of the surrounding extracellular hydrogel matrix.
In summary, incredibly rich, high-fidelity information can be gathered from WMIF labeling experiments. However, it is vital to acknowledge that every single experiment will be entirely unique and heavily dependent on numerous intersecting variables. By eliminating the variables inherent in complex, multi-reagent workflows, standardization becomes the essential bridge to reducing experimental noise and enabling the acquisition of the high-fidelity, large-scale spatial data required for accurate, high-volume analysis.
While WMIF labeling has gained significant traction for its ability to provide comprehensive spatial biology data, the technique is frequently hampered by systemic challenges that compromise experimental results. Issues such as inadequate antibody penetration, high background noise, and structural instability in 3D environments often lead to inconsistent labeling.
The priority of this study is to provide a systematic troubleshooting guide to overcome the universal technical challenges of WMIF labeling techniques. Accordingly, our experimental design leveraged highly characterized, commercially verified antibodies that feature extensive manufacturer validation and a strong citation history within peer-reviewed literature. We also standardized the microenvironment in the experiments using the most widely adopted, commercially established hydrogels available to eliminate matrix-induced variability. We targeted 24 distinct proteins distributed across key subcellular compartments—including the plasma membrane, cytoplasm, and nucleus—to comprehensively evaluate the labeling efficiency of the workflow. In addition to mono-labeling experiments, we performed multiplexed double- and triple-labeling assays to evaluate the specific technical challenges inherent to multi-target spatial detection. We ran a series of controlled WMIF labeling experiments where specific, common technical mistakes were deliberately introduced.
This study establishes a clear analytical framework to evaluate labeled 3D samples and confirm workflow success. By documenting the imaging artifacts, structural distortions, and abnormal signal profiles caused by these intentional errors, this study provides a unique visual ‘atlas of failure’ paired with validated methodological solutions. Ultimately, our goal is to use these comparative case studies to help researchers eliminate experimental noise, reduce technical errors, and achieve high-quality, reproducible imaging of 3D cultures.
2. Materials and Methods
2.1. Generation of Liver Cancer Spheroids
HepG2 cells (American Type Culture Collection, Manassas, VA, USA), a cell line derived from human hepatocellular carcinoma, were used to generate liver cancer spheroids. Spheroids were generated using the method described previously [37]. Commercially available hydrogels (Geltrex LDEV-Free Reduced Growth Factor Basement Membrane Matrix (Thermo Fisher Scientific, Grand Island, NY, USA), Matrigel Matrix (Corning, Corning, NY, USA), and Cultrex Stem Cell Qualified Reduced Growth Factor Basement Membrane Extract (R&D Systems, Minneapolis, MN, USA) were used to seed HepG2 cells to form liver cancer spheroids. A total of 30–35 µL of 100% hydrogel was added to the 35 mm glass-bottomed dishes (Thermo Fisher Scientific, USA) or CellO-Ms (Cellorama LLC, Mansfield, MA, USA) to form a gel drop, and 10,000 HepG2 cells were placed in the center of the top of each gel drop. The gel drops containing cells were incubated at 37 °C for 15 min. Then, each hydrogel drop was covered with 200 µL of Dulbecco’s Modified Eagle Medium (DMEM) containing 10% Fetal Bovine Serum (FBS). The cells were cultured by feeding with 200 µL of DMEM containing 10% FBS every two days. Spheroids began to form approximately within 5 days. Spheroids in the gels were fixed on 10th day for immunolabeling experiments.
2.2. Generation of Human Airway Organoids
Primary human bronchial epithelial cells (hAECB) were obtained from Epithelix (EP51AB, Geneva, Switzerland) and cultured according to the manufacturer’s instructions. Lung organoids were generated utilizing the PneumaCult Airway Organoid Kit (STEMCELL Technologies, Vancouver, BC, Canada, Cat # 05060) in accordance with the manufacturer’s instructions. Briefly, 2500 primary human BECs were inoculated in a Matrigel (Corning Inc., Tewksbury, MA, USA, Cat # 354230) dome and incubated for 7 days in PneumaCult Airway Organoid Seeding Medium. The organoids were subsequently rinsed with DMEM/F12 and maintained for three weeks in PneumaCult Airway Organoid Differentiation Medium. The organoids in the gel were fixed after three weeks.
2.3. Immunofluorescence Labeling of Spheroids and Organoids
The whole-mount immunofluorescence labeling protocol described previously was used for staining of liver cancer spheroids grown in Geltrex (Thermo Fisher Scientific, Waltham, MA, USA), Matrigel (Corning, NY, USA), or Cultrex (R&D Systems, Minneapolis, MN, USA) and lung organoids grown in Matrigel (Corning, NY, USA). Matrix-embedded organoids and spheroids were labeled as described [36,37]. Organoids or spheroids were grown in CellO-Ms (multi-purpose cell culture dishes, Cellorama LLC, USA), labeled and then imaged directly under a confocal microscope. To improve penetration of the reagents, a horizontal shaker at 20 rpm is used at each step. Samples were kept in the oven at 37 °C during the incubation periods.
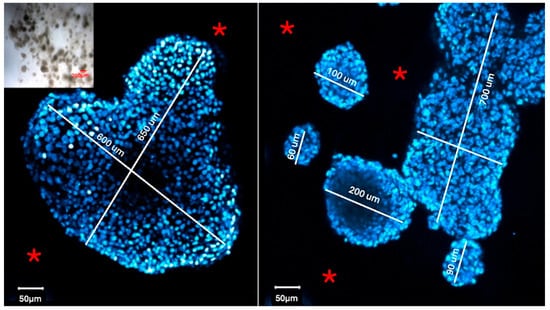
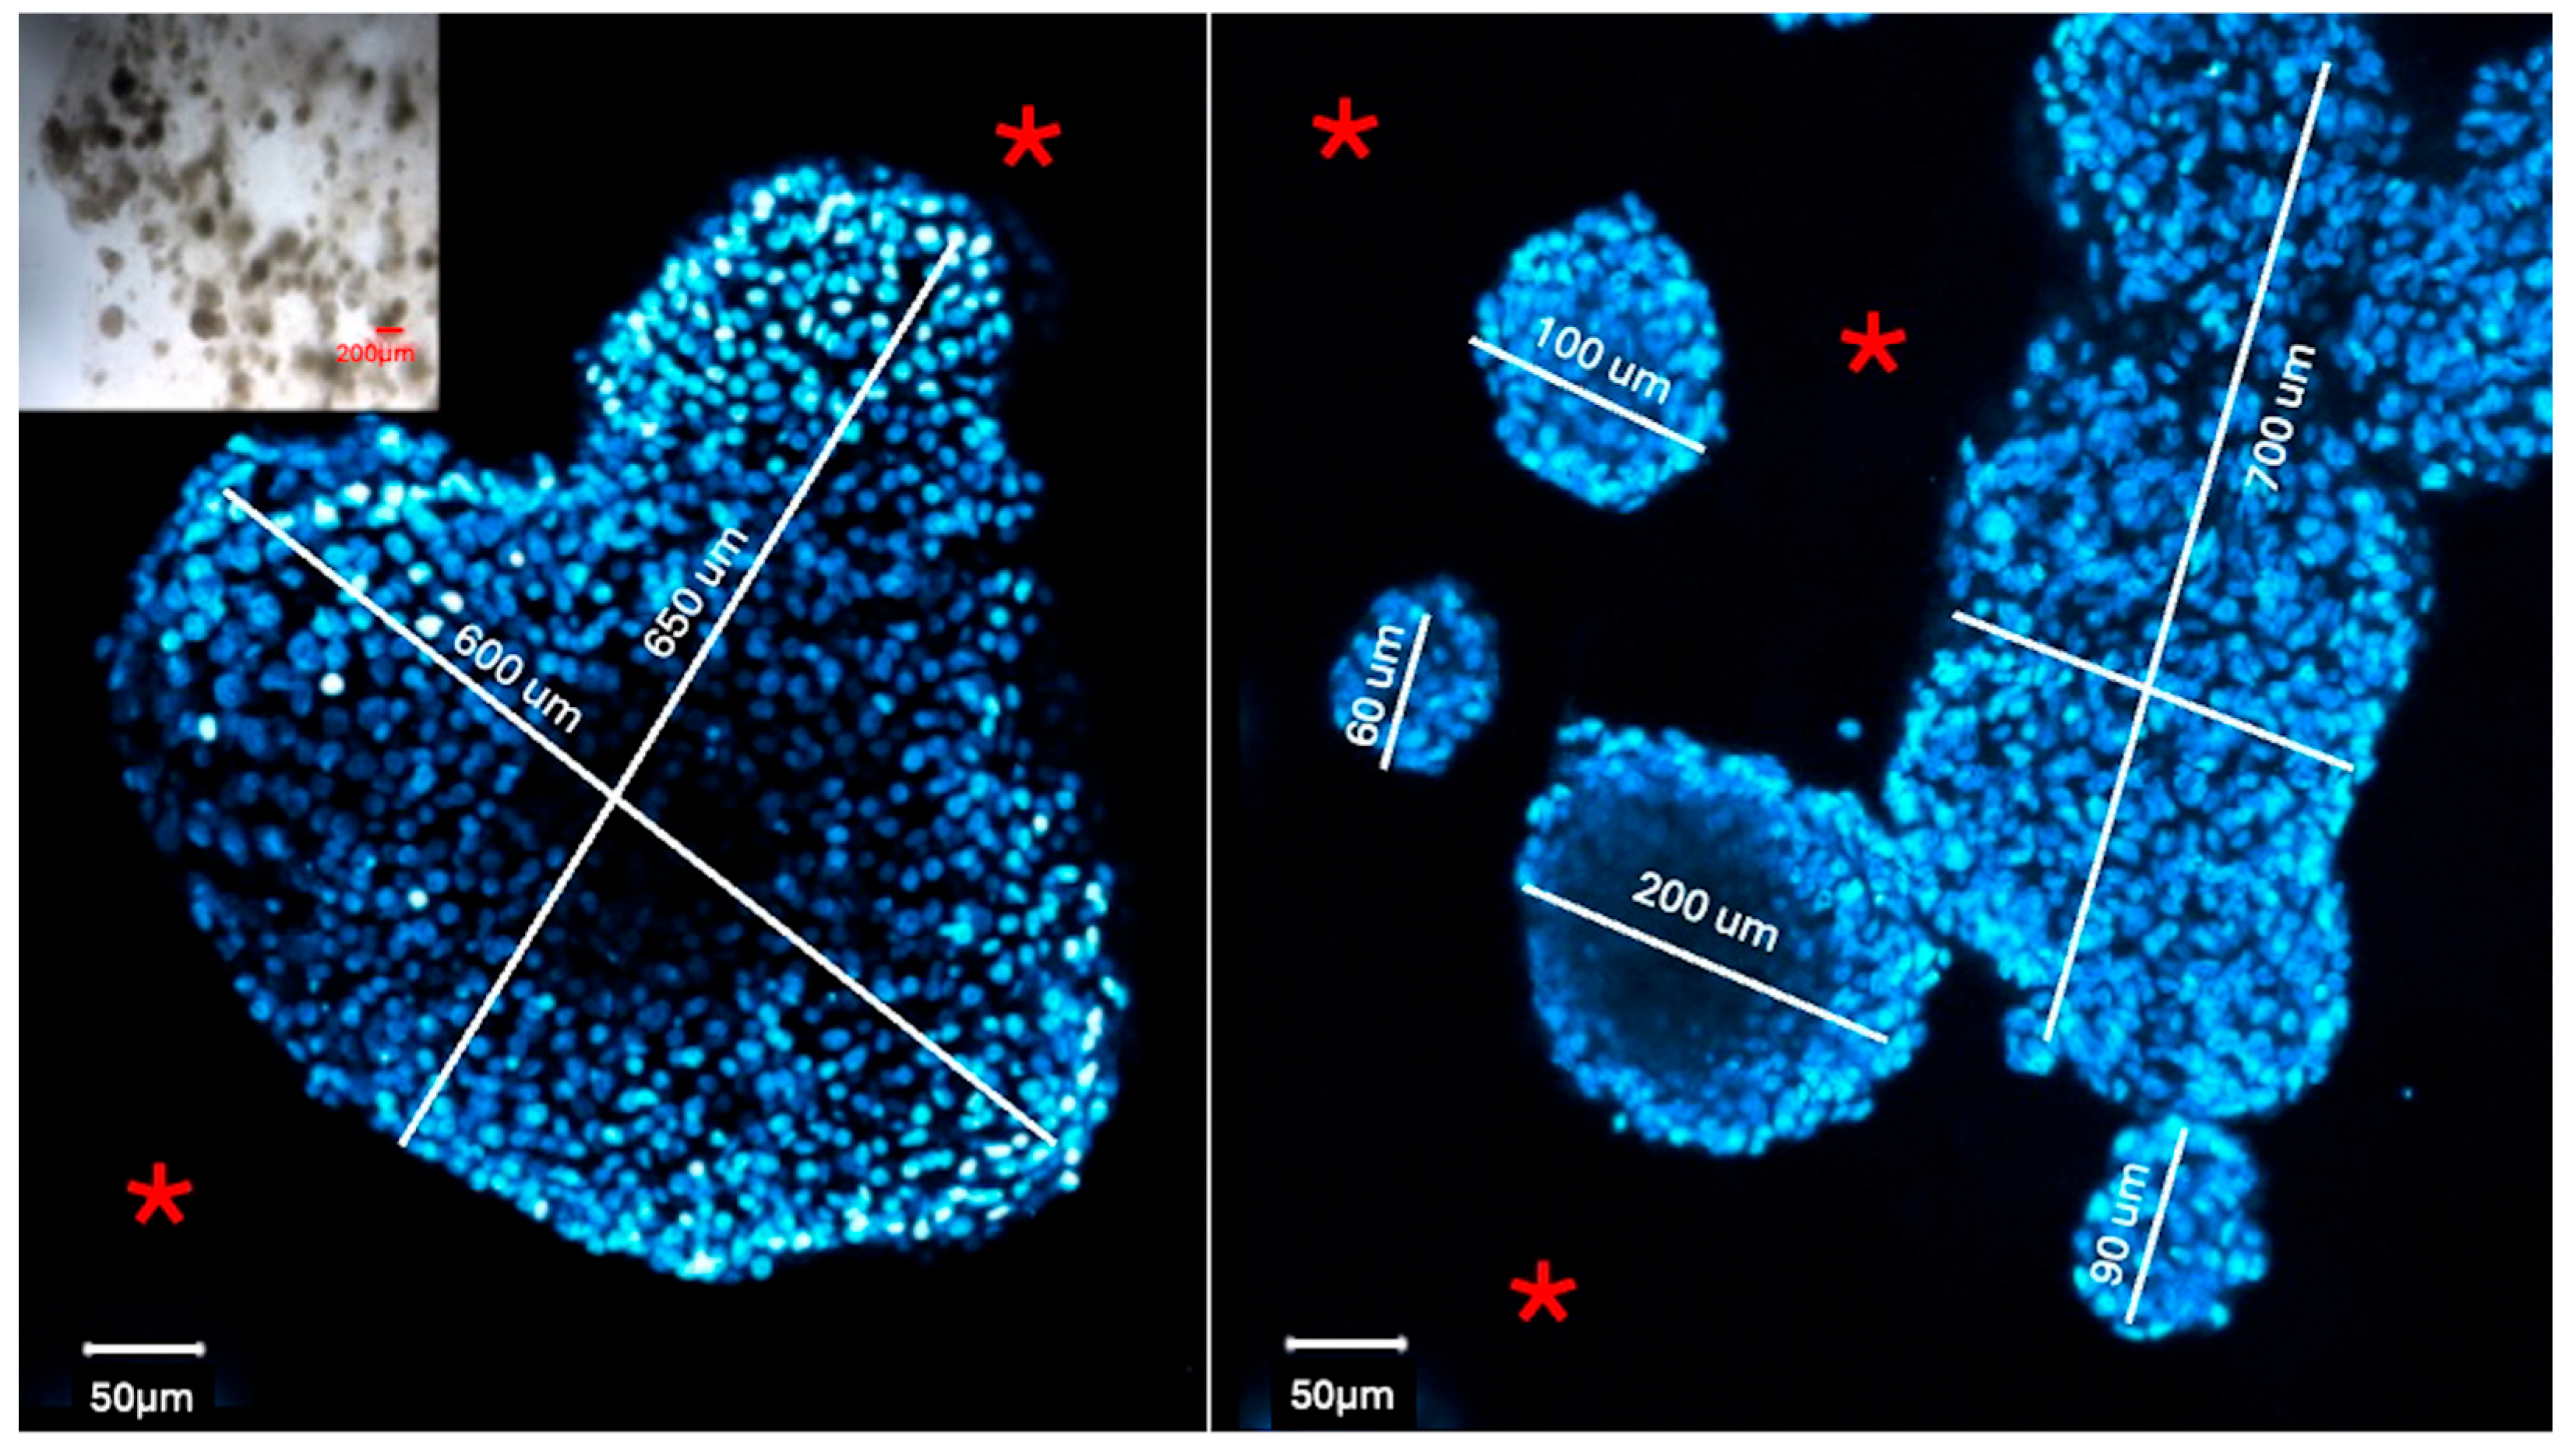
We analyzed the organoids and spheroids directly inside the hydrogel droplets (Figure 1). Each biological sample contained multiple individual spheroids and organoids. The size of these organoids and spheroids varied across the samples.
Figure 1.
Representative microscopic images of a 3D culture sample. Confocal images show spheroids labeled with a nuclear stain (DAPI) and surrounded by the hydrogel matrix (*). Note the clear background marked by the asterisk. Inset: An overview image showing multiple individual spheroids of various sizes that were successfully labeled while still inside the hydrogel droplet. The sizes of the spheroids shown in these panels range between 60 and 700 microns. However, as seen in the inset, the complete sample includes a broader mix of both smaller and larger spheroids.
To validate the broad applicability of that novel method, we conducted a comprehensive study using 24 primary antibodies to label lung organoids or liver spheroids (Table 2). For examination of the ability of the method to target proteins in various cellular compartments, we chose antibodies for labeling proteins that are located in the cell membrane, cytoplasm, or nucleus (Table 2). Matching secondary antibodies conjugated to Alexa Fluor 488, 568, and 647 were applied simultaneously within the CellO-IF3. We also performed mono-, double-, and triple-labeling experiments.
Table 2.
List of primary antibodies successfully validated for the immunofluorescent labeling of liver cancer spheroids or airway organoids. This selection includes antibodies for the proteins located in the cell membrane, cytoplasm, or nuclei.
2.3.1. The Following Experiments Were Performed as Controls to Eliminate False-Negative and False-Positive Staining
Validation of the Antibodies with 2D Cell Culture Experiments
Primary antibodies are validated on 2D cell culture to ensure specific staining. The primary purpose of utilizing conventional 2D monolayer cultures as a control is to establish a positive technical control for antibody specificity and baseline epitope availability. In a 2D monolayer, potential effects of physical diffusion barriers, light scattering, and the matrix are absent. When optimizing a WMIF 3D labeling protocol, a weak or absent fluorescent signal inside an organoid can stem from two entirely different issues: either the antibody is physically failing to penetrate the dense 3D hydrogel matrix, or the antibody itself is defective/non-specific to that target protein. Therefore, successful 2D staining serves as our definitive biochemical proof that the antibody lot is highly functional and capable of binding to the target epitope under ideal, unhindered conditions and demonstrates the efficiency of the antibodies independent from 3D cultures.
Primary Antibody Omission
A control sample is incubated without the primary antibody treatment to rule out non-specific binding. The secondary-antibody-only control (omitting the primary antibody) is an indispensable negative control for whole-mount 3D imaging. Thick, macro-structure tissues and the commercial hydrogels (like extracellular matrices) used to encapsulate them are highly prone to two main optical artifacts: high baseline autofluorescence and the physical trapping of large fluorophore-conjugated secondary antibodies within the dense matrix meshwork. Running a parallel 3D sample through the exact same processing pipeline—but omitting the primary antibody—allows us to precisely quantify the background threshold. This control ensures that the intense fluorescent signals visualized in our experimental groups are the result of true, targeted primary-secondary antibody complexes, rather than non-specific secondary sticking or matrix-induced light scattering.
Secondary Antibody Omission
A control sample is incubated without the secondary antibody treatment to assess autofluorescence. This control allows us to view the sample under identical laser configurations to measure the exact baseline autofluorescence of the dense cell masses and surrounding hydrogel matrices.
2.4. Troubleshooting Development: Experimental Stress-Testing of Protocol Variables
To establish a robust technical troubleshooting guide, we systematically evaluated the critical parameters of the protocol and conducted a systematic series of tests alongside a control group. Our experimental design focused on identifying the primary drivers of suboptimal results by intentionally introducing procedural deviations across three core phases: fixation, incubation, and antibody titration. The control samples were processed using the standardized protocol with identical primary and secondary antibody concentrations to provide a baseline for optimal signal-to-noise ratios.
To this end, we introduced the following procedural deviations to evaluate the common laboratory errors and performed the experiments according to the following six distinct experimental groups:
Group 1: Optimal Control Cohort—Samples labeled according to the optimized protocol parameters to establish the gold-standard benchmark for high-quality staining and an optimal signal-to-noise ratio.
Group 2: Fixation Duration Cohort—Two experimental subgroups have been designed to test the short- and long-term effects of fixation. Group 2-A: Short-term Fixation Cohort: Samples fixed for a severely restricted duration of 5 min to evaluate the structural impact and physical vulnerability of insufficient tissue stabilization. Group 2-B: Long-term Fixation Cohort: Samples fixed for an elongated period of 3 h to characterize the visual artifacts and signal attenuation induced by excessive chemical cross-linking, tissue hardening, and epitope masking.
Group 3: Wash Cycle Cohort—Samples subjected to only a single wash cycle instead of the standardized multiple washing steps to visualize the accumulation of non-specific background noise and signal saturation.
Group 4: Incubation Period Cohort—Two experimental subgroups has been designed to test the short- and long-term incubation with the antibodies. Group 4-A: Short Incubation Cohort: Samples incubated in primary antibody solutions for 10 min to demonstrate the effects of incomplete reagent diffusion and shallow core penetration. Group 4-B: Extended Incubation Cohort: Samples incubated in primary antibody solutions for 3 h to monitor background accumulation and tissue core saturation.
Group 5: Antibody Titration Cohort—Samples processed using primary antibodies at dilutions significantly below the manufacturer’s recommended operational threshold to stress-test the protocol’s susceptibility to low-affinity molecular interactions and premature signal fading.
Group 6: Thermal Effects Cohort—Samples processed at a stabilized room temperature (20–24 °C), intentionally bypassing the standardized incubator requirement to evaluate the effects of a non-incubated setting on the WMIF method.
For each distinct experimental condition, a minimum of four independent hydrogel samples (droplets per group, each containing hundreds of cellular aggregates) were processed, labeled, and systematically examined. The high-resolution images selected for display in the manuscript are highly representative of the overall morphological and structural patterns observed across these multiple independent trials. Figure 1 demonstrates the widespread size distribution and density of the spheroids and organoids evaluated across our experimental groups. As shown in the low-magnification inset of Figure 1, each intact hydrogel droplet natively contains hundreds of individual spheroids or organoids of varying dimensions.
Throughout these controlled deviations, we documented specific phenotypic challenges that affect staining quality. During our experiments, we also encountered challenges including uneven fluorophore distribution (patchiness), complete signal failure (non-staining), and morphological artifacts resulting from sample dehydration. By correlating these specific failures with the experimental deviations listed above, we developed a comprehensive troubleshooting guide.
2.5. Confocal Microscopy
Samples were imaged with a Zeiss LSM 700 confocal microscope under the following settings (Figure S1): Magnification: 20X Resolution: 2048 × 2048 px. Scan speed: 800 Hz. Z-step size: 2 μm. Laser Line (405 nm): Intensity: 1.0%. Laser Line (488 nm): Intensity: 5.0%. Laser Line (561 nm): Intensity: 2.5%. Sensor for 405 nm: PMT. Sensors for 488 nm and 561 nm: HyD, Gate Start: 0.5 ns, Gate End: 8 ns. Images were processed with Zeiss ZEN software 3.13.
3. Results
3.1. Control Cohort
3.1.1. Efficacy of the Protocol on Subcellular Multi-Compartment Protein Localization
The efficacy of the protocol in precisely localizing proteins across diverse cellular compartments was evaluated using mono-, double-, and triple-labeling experiments.
Mono-Labeling and Target Validation
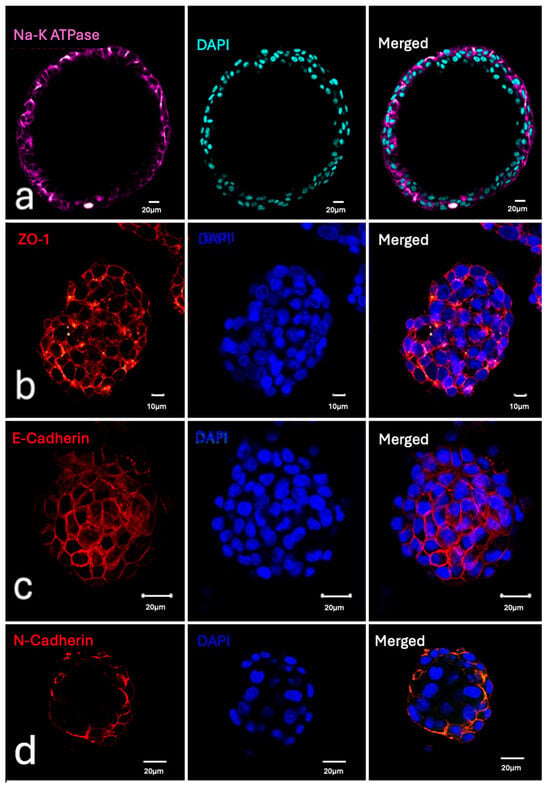
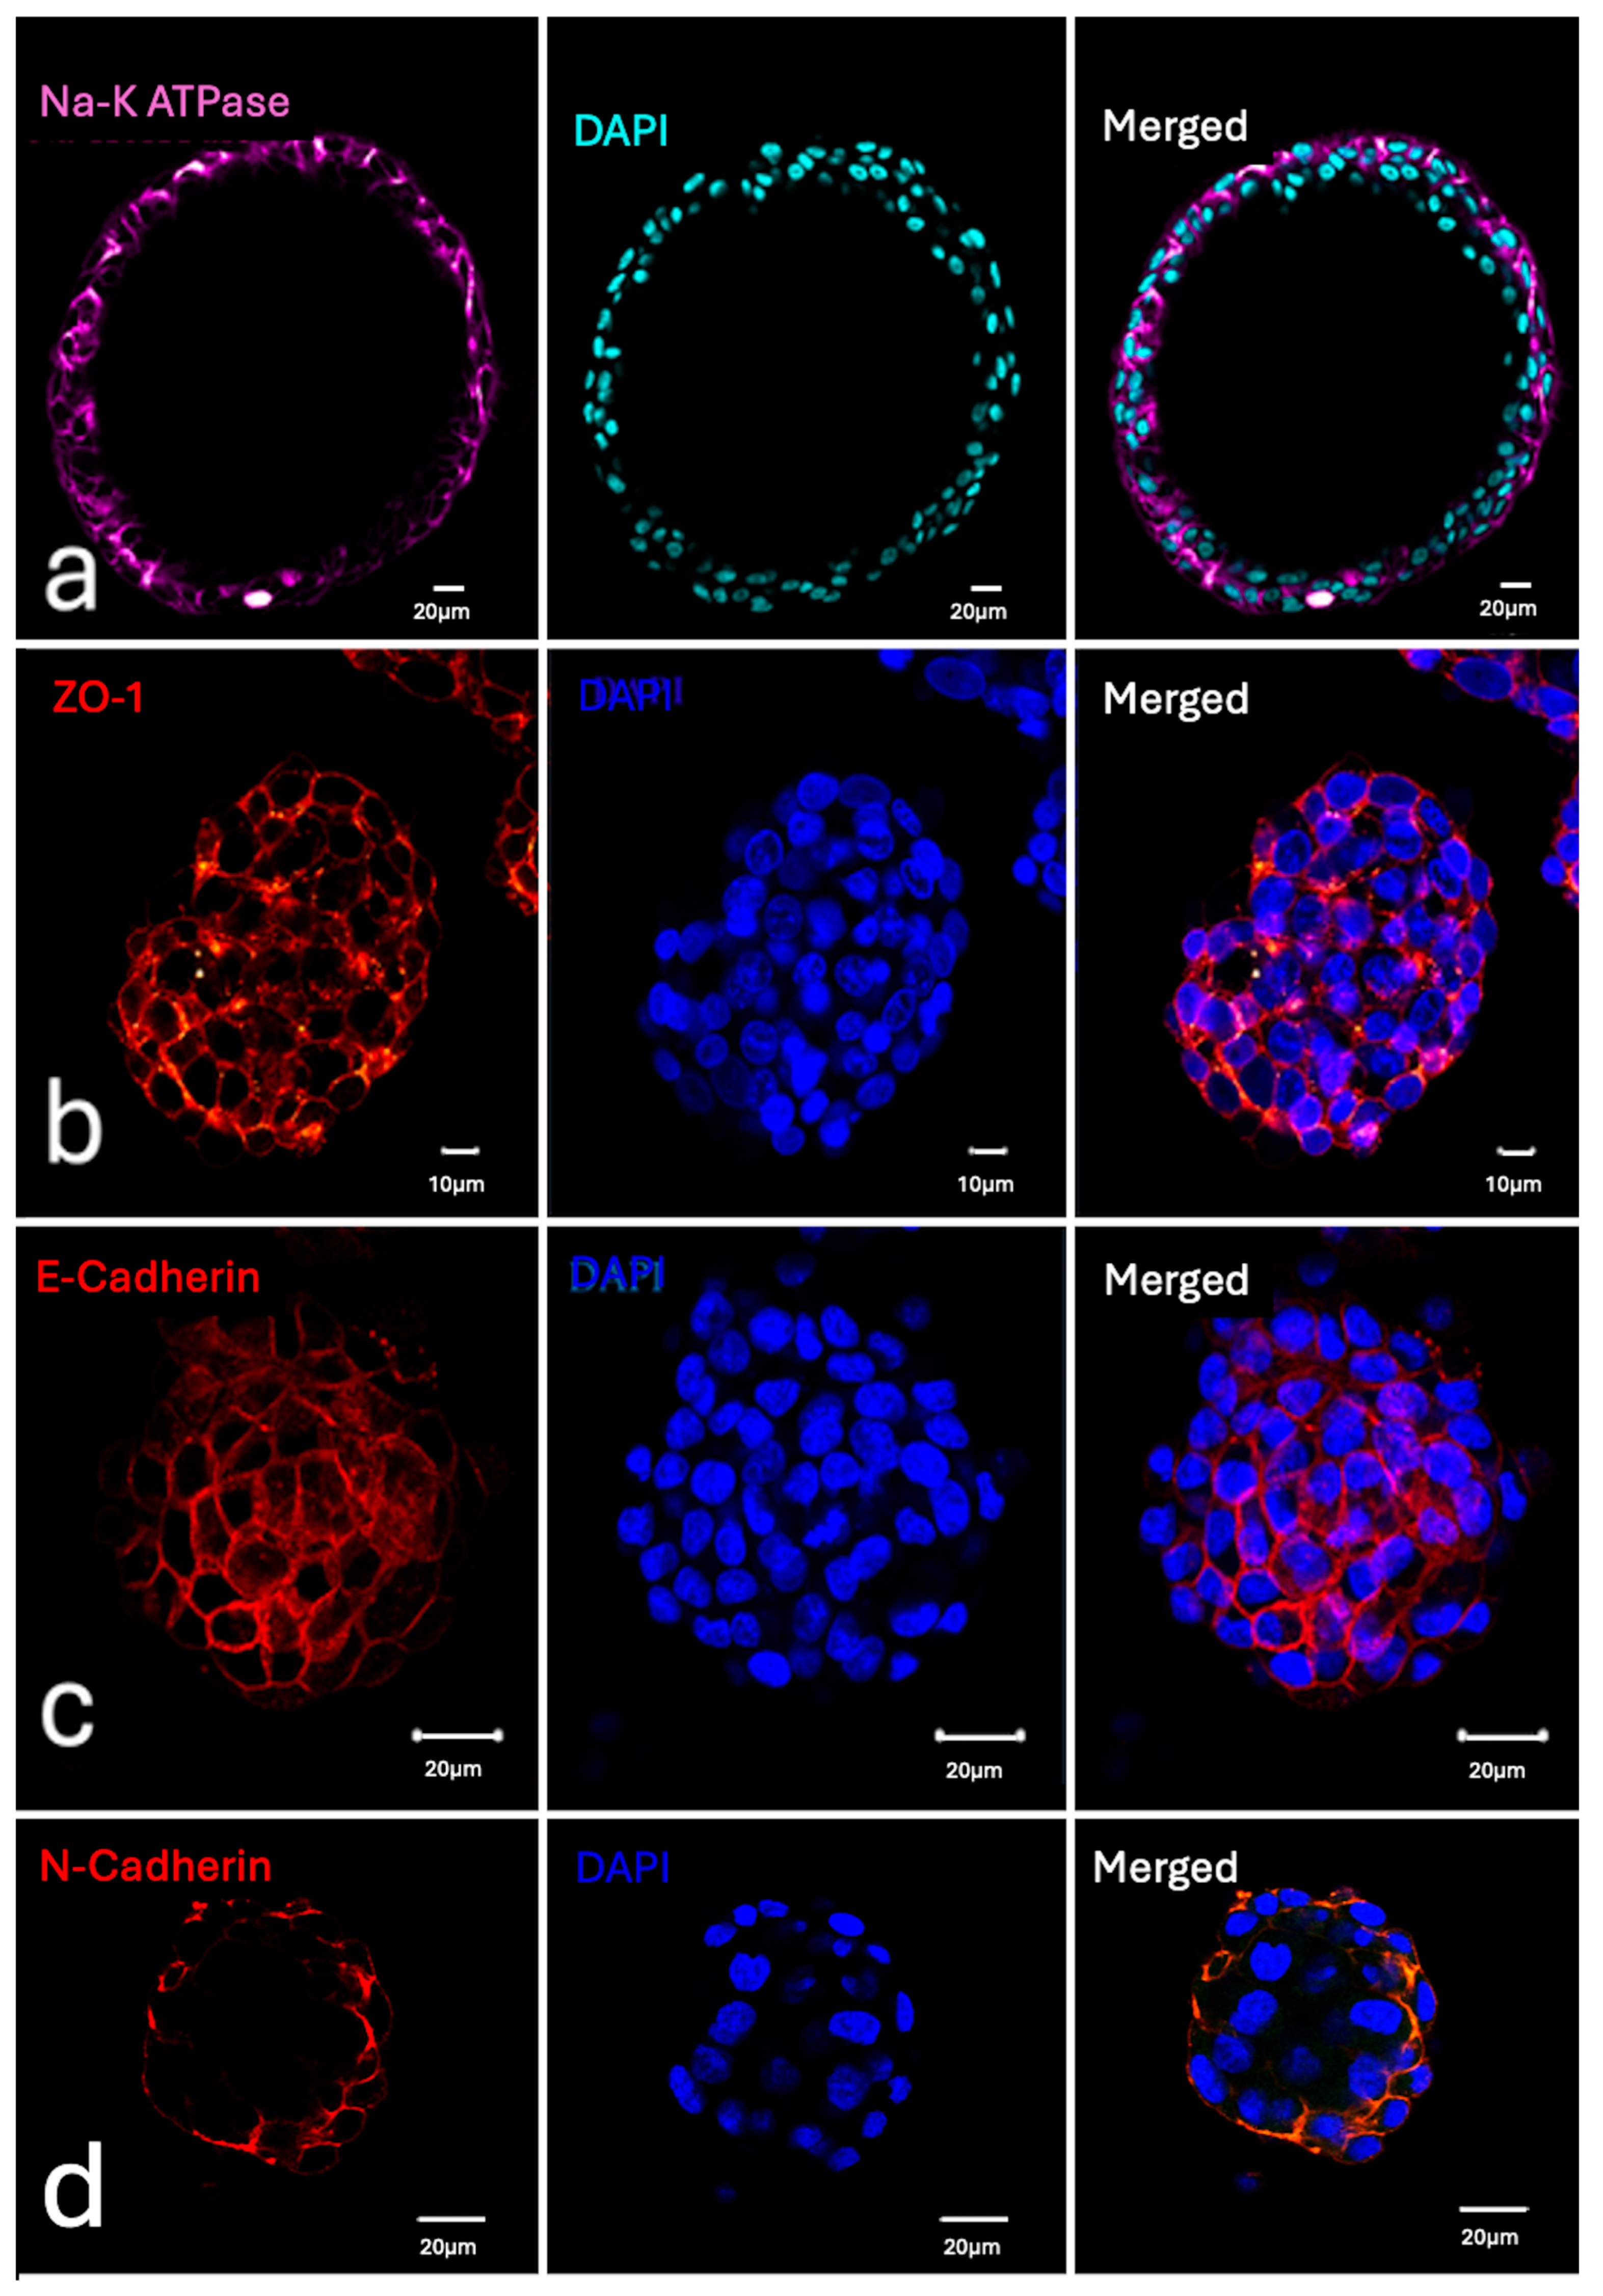
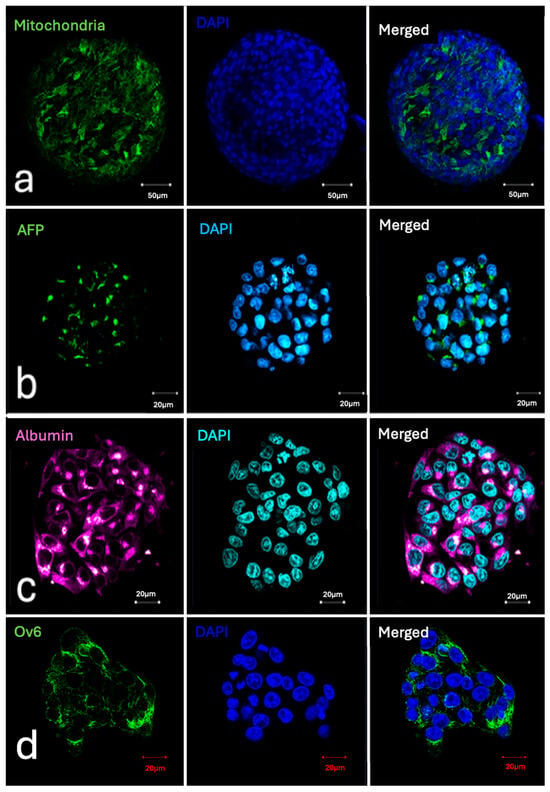
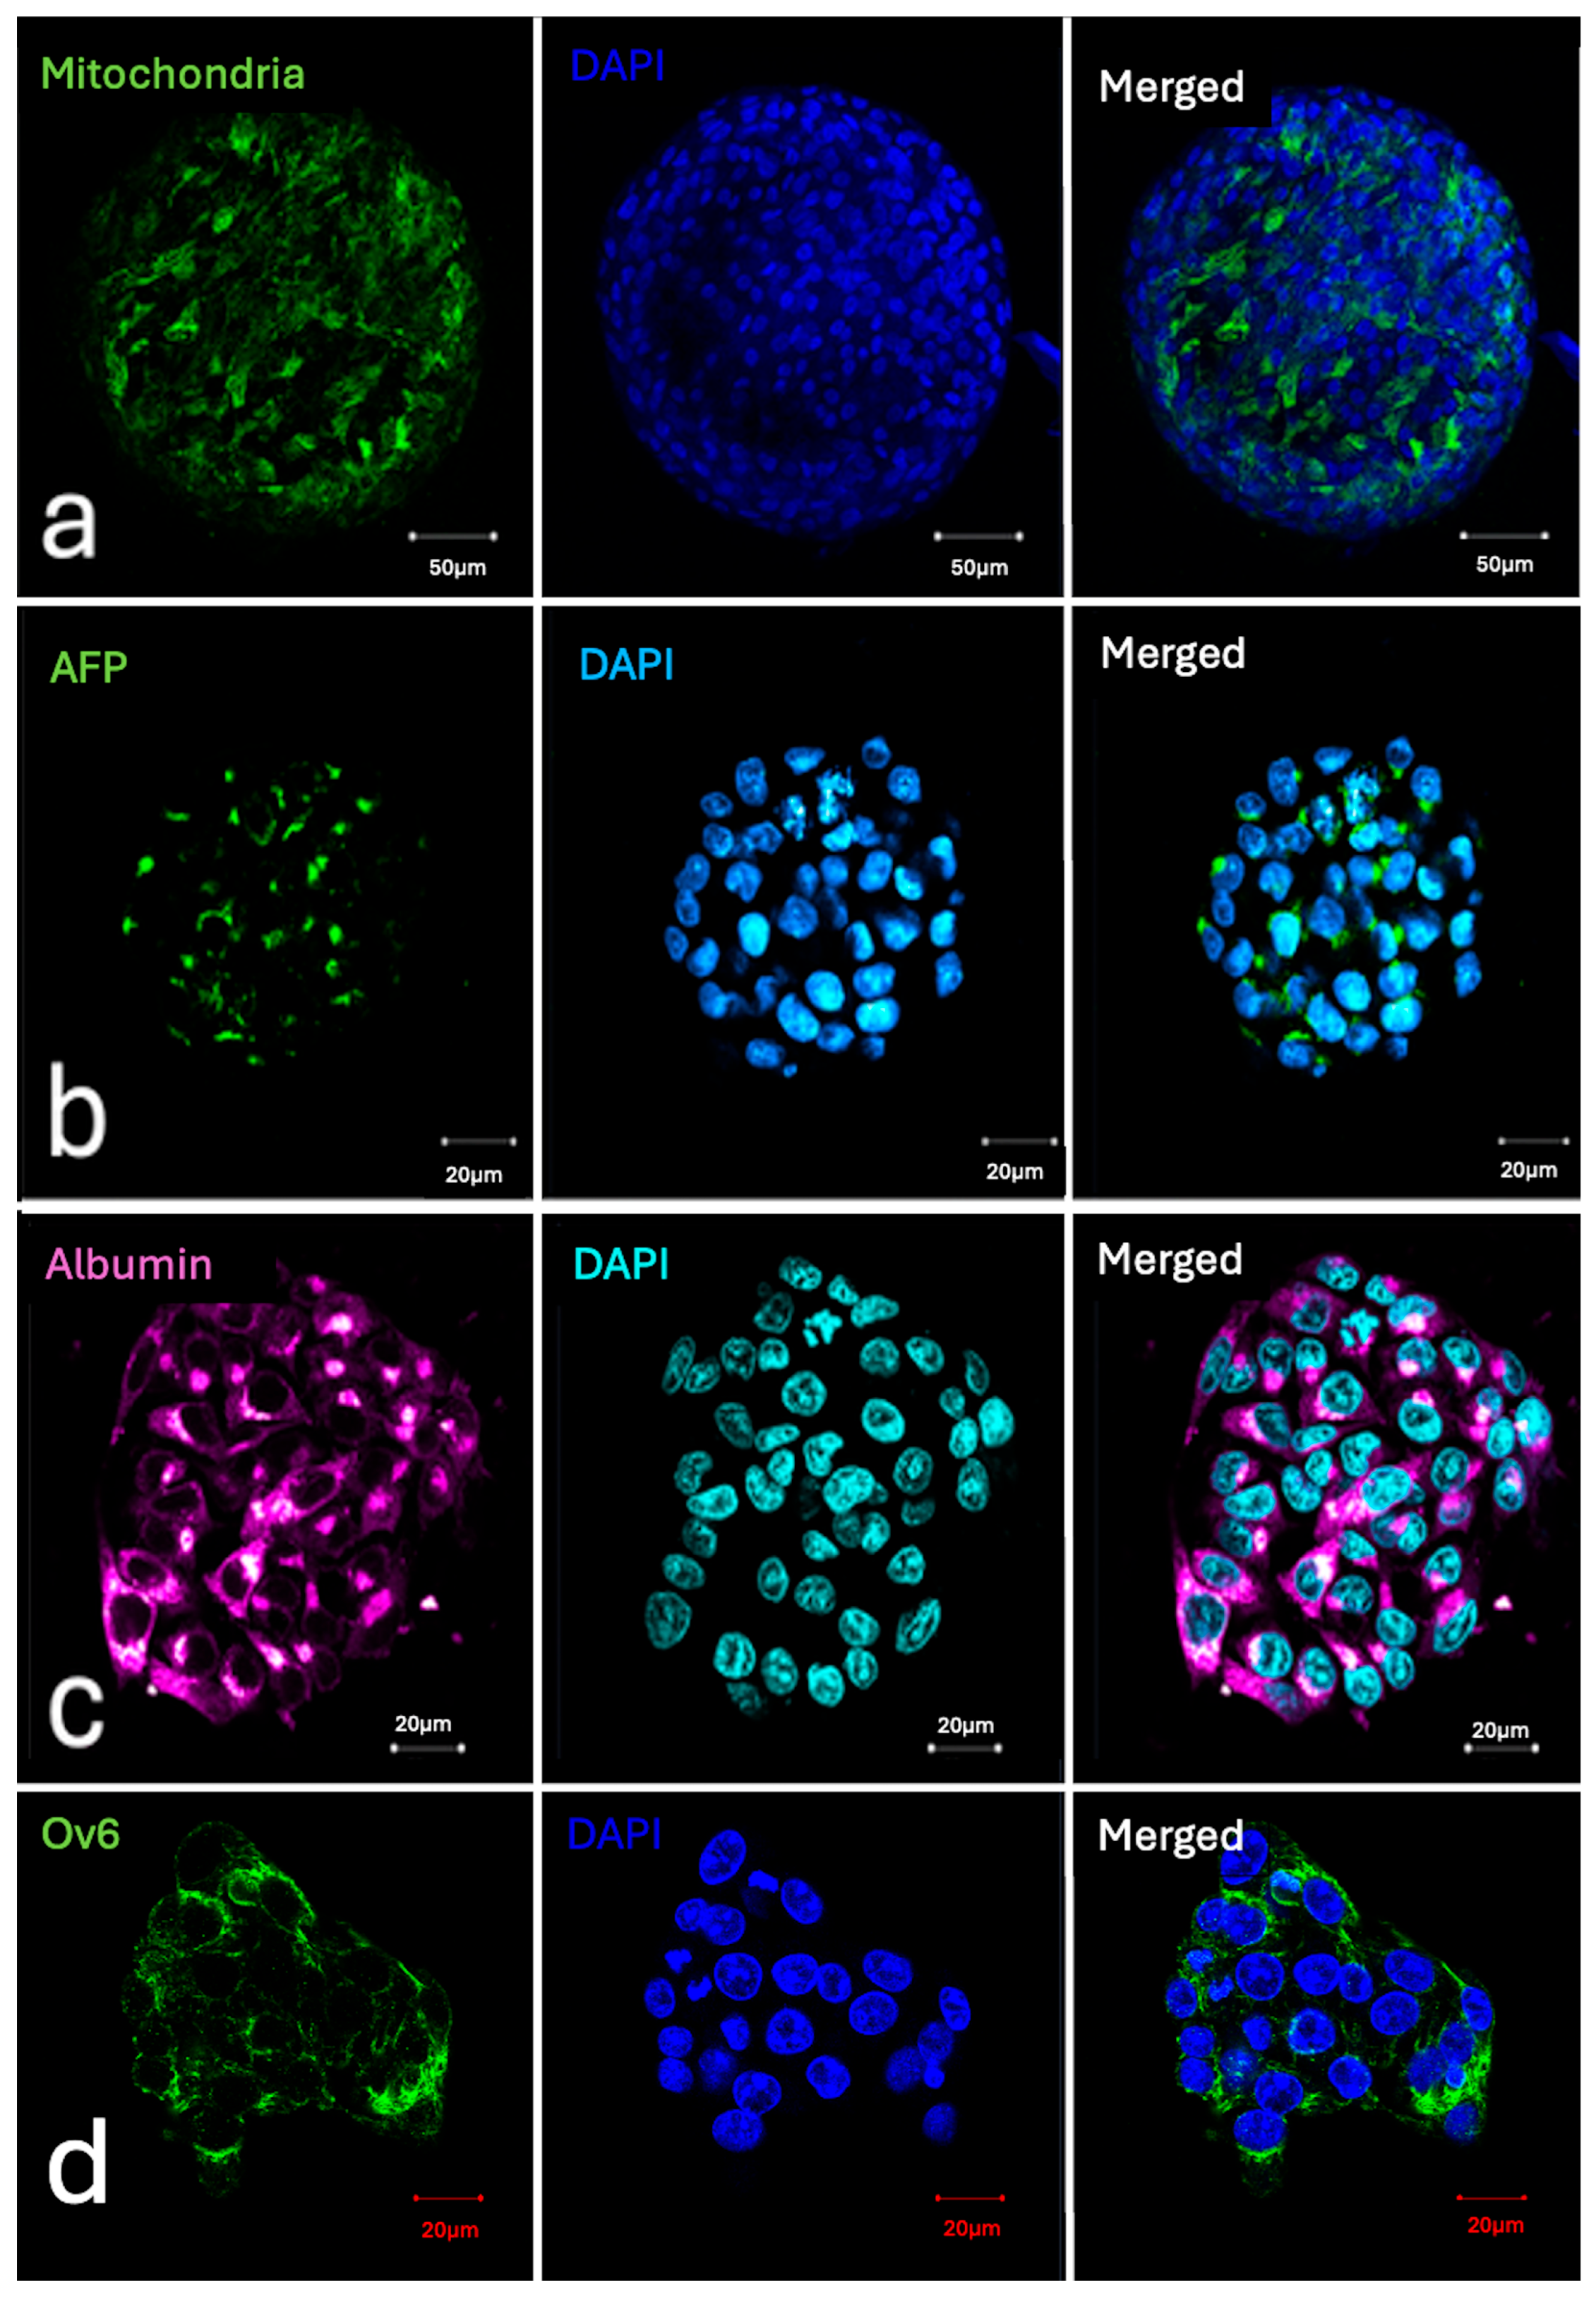
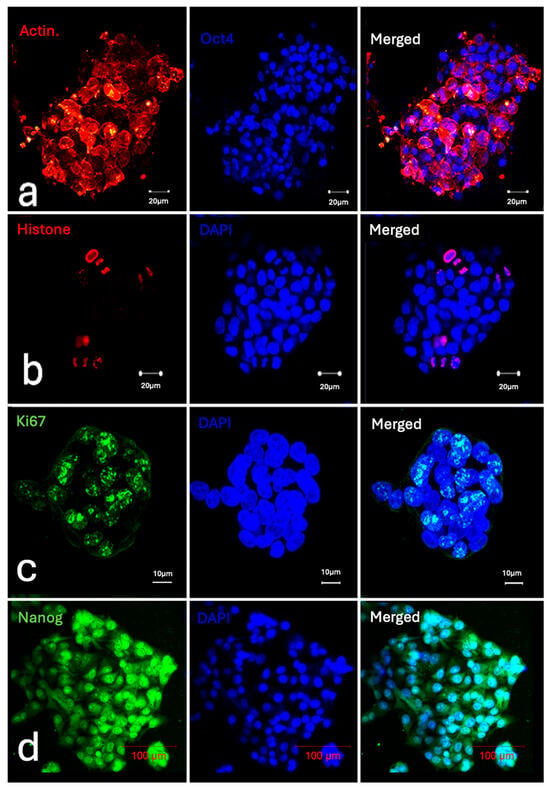
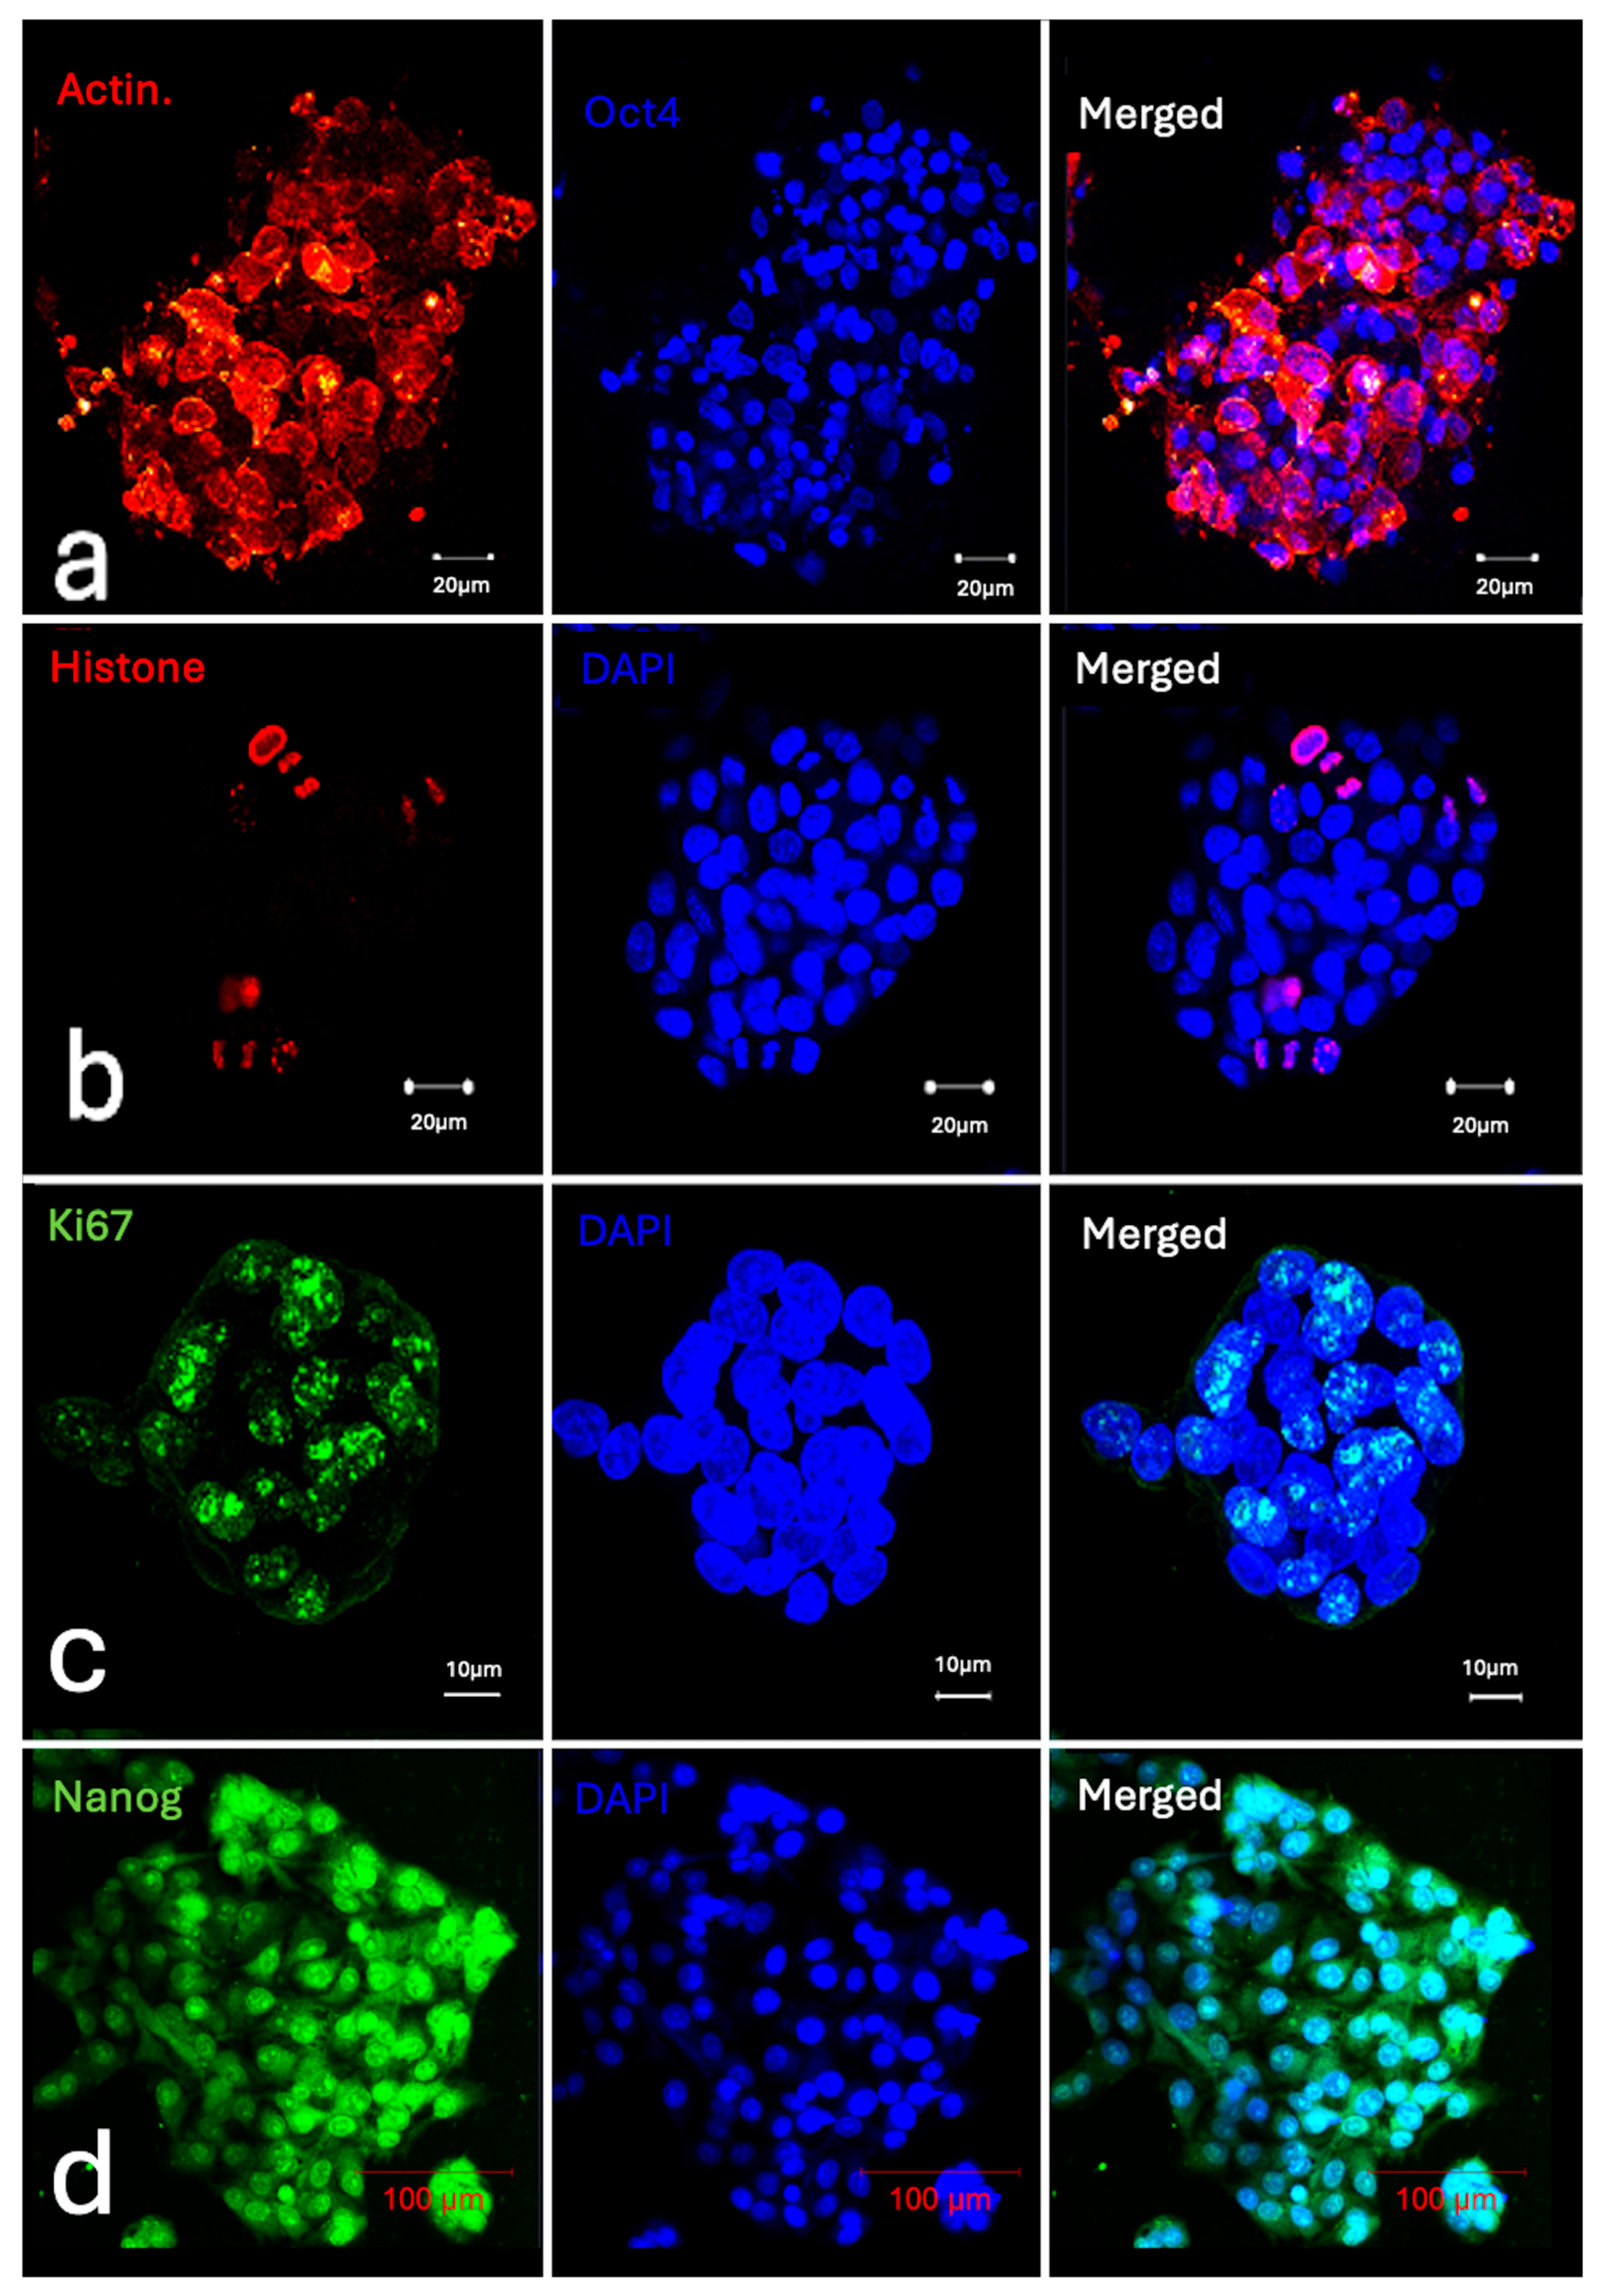
The specific localization of target proteins within the cell membrane, cytosol, or nuclei was clearly demonstrated (Figure 2, Figure 3 and Figure 4, and Supplementary Figure S2). Antibody-specific staining was consistently evident across both the organoid and spheroid models. Notably, a clear background was maintained (Figure 1, Figure 2, Figure 3, Figure 4, Figure 5, Figure 6, Figure 7 and Figure 8, Supplementary Figure S2 and Supplementary Video S2). Successful labeling was achieved for the 24 targets listed in Table 2, with representative data for both 2D and 3D cell culture samples provided in Figure 2, Figure 3 and Figure 4 and Supplementary Figures S1 and S2. Sequential optical sectioning via confocal microscopy confirmed the preservation of intense, specific fluorescent signals across multiple deep Z-planes (Supplementary Video S1).
Figure 2.
Representative confocal microscopic images of cell membrane protein expression in whole-mount labeled 3D specimens. (a) Na-K ATPase expression in the cell membrane (purple) with DAPI-labeled nuclei (green) in a human airway organoid. (b) ZO-1 localization (red) with DAPI-labeled nuclei (blue) in a liver cancer spheroid. (c) E-cadherin expression in the cell membrane (red) with DAPI-labeled nuclei (blue) in a human airway organoid. (d) E-cadherin expression in the cell membrane (red) with DAPI-labeled nuclei (blue) in a liver cancer spheroid.
Figure 3.
Representative confocal microscopic images of cytoplasmic and organelle protein expression in whole-mount labeled 3D specimens. (a) Mitochondria localized in the cytoplasm (green) and nuclei labeled with DAPI (blue) in a liver cancer spheroid. (b) Alpha-fetoprotein (AFP) expression (green) in the cytoplasm and nuclei labeled with DAPI (blue) in a liver cancer spheroid. (c) Albumin expression (purple) in the cytoplasm and nuclei labeled with DAPI (green) in a liver cancer spheroid. (d) Ov6 expression (green) in the cytoplasm and nuclei labeled with DAPI (blue) in a liver cancer spheroid.
Figure 4.
Representative confocal microscopic images of nuclear protein expression in whole-mount labeled 3D specimens. (a) Actin expression in the cytoplasm (red) and Oct4 expression in nuclei (blue) in a liver cancer spheroid. (b) Histone expression (red) and nuclei labeled with DAPI (blue) in a liver cancer spheroid. (c) Ki67 expression (green) and nuclei labeled with DAPI (blue) in a liver cancer spheroid. (d) Nanog expression (green) and nuclei labeled with DAPI (blue) in a liver cancer spheroid.
Figure 5.
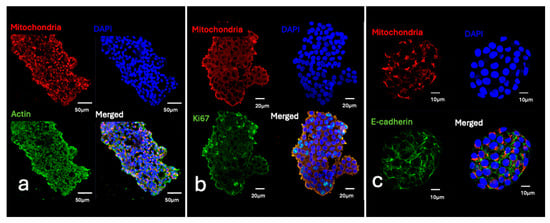
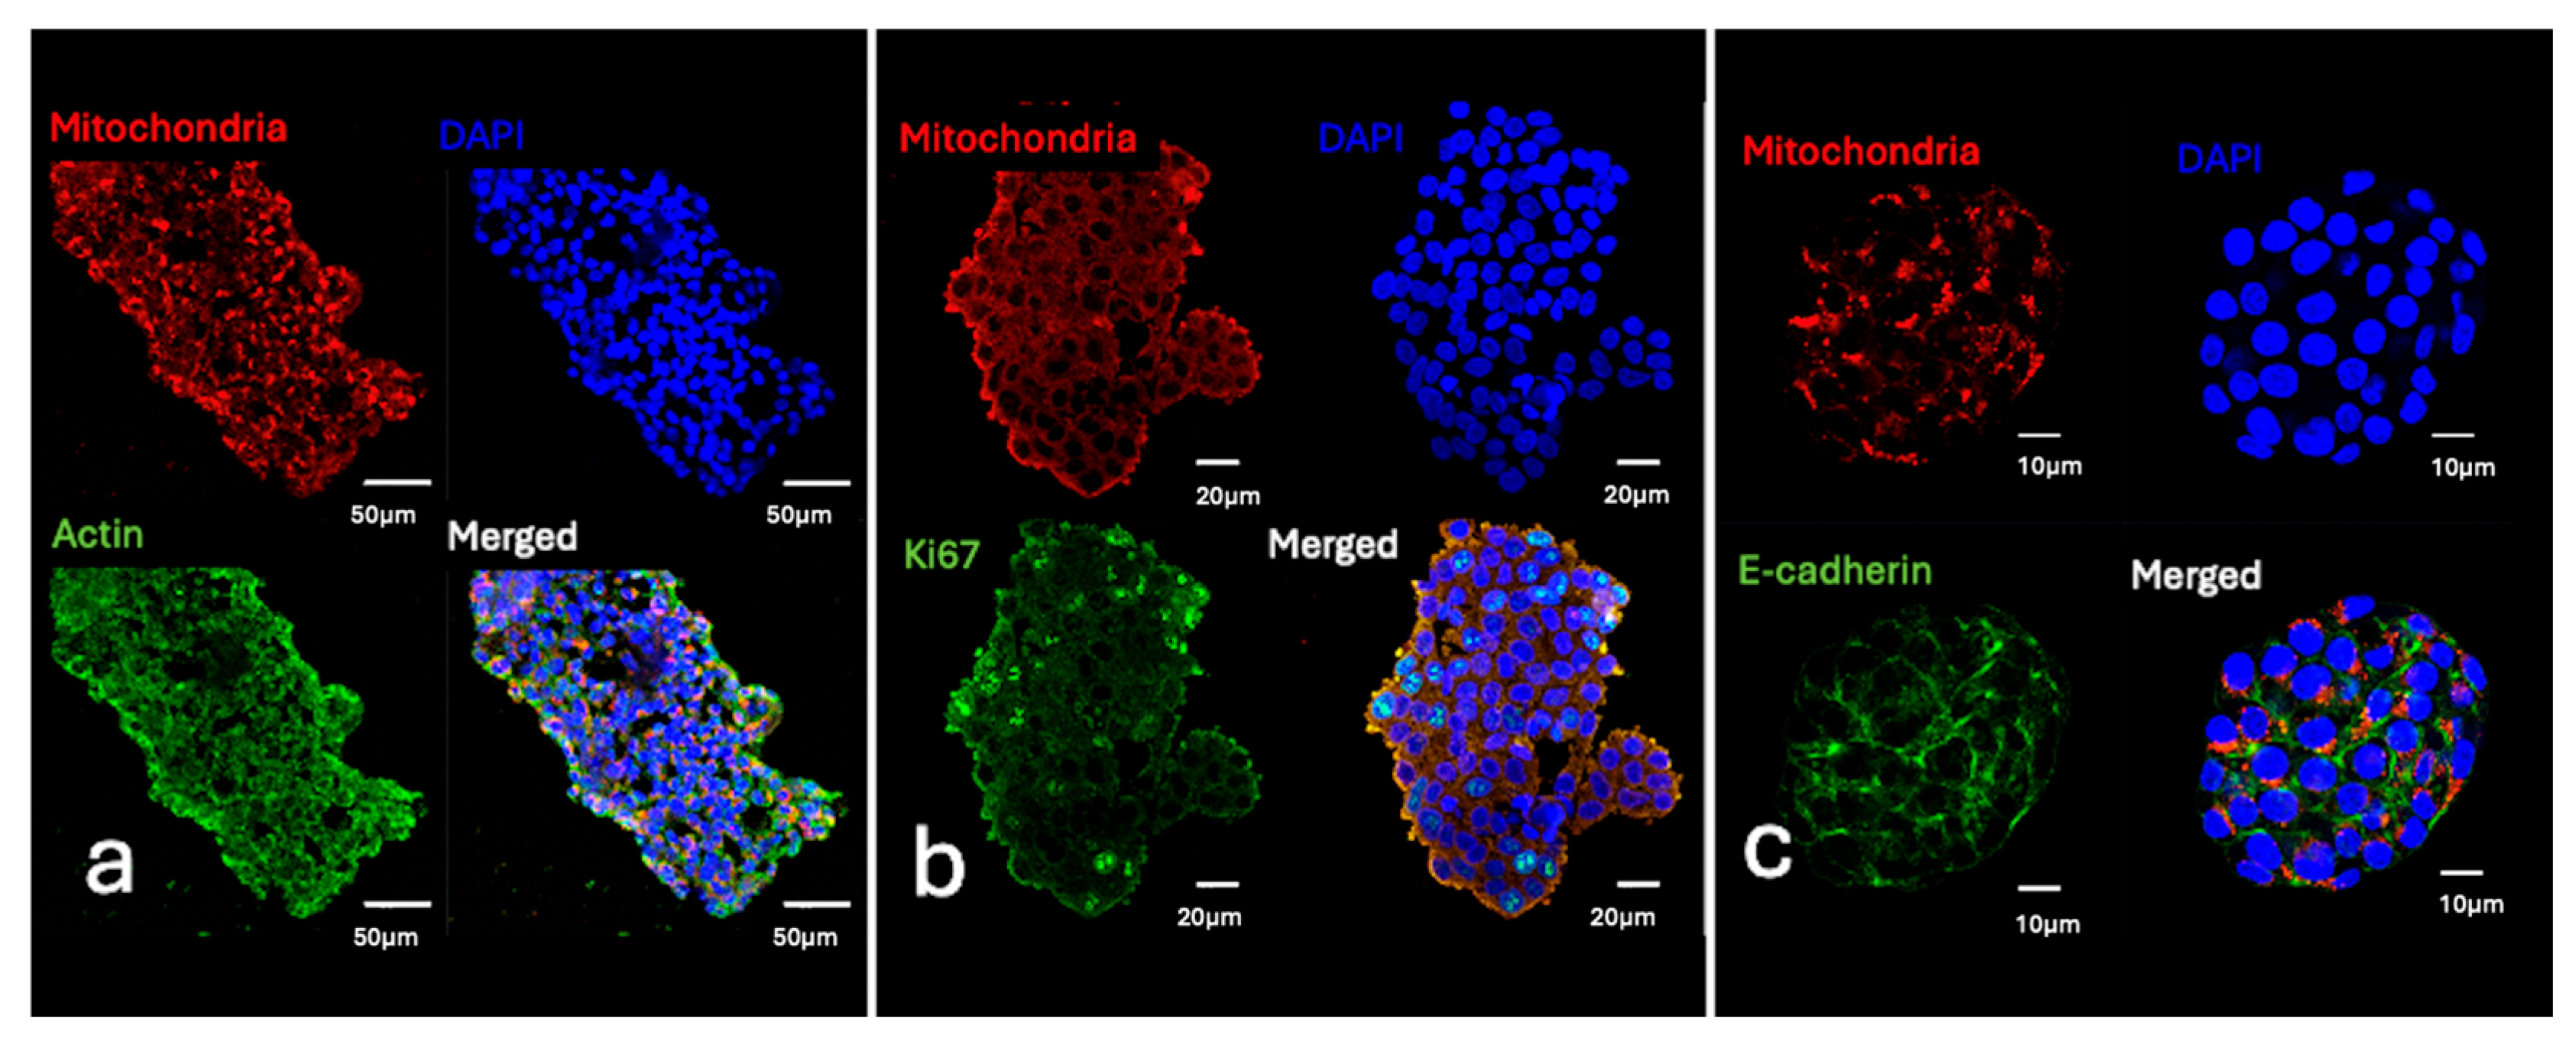
Representative confocal microscopic images of double-labeling experiments performed according to the protocol. Mitochondria and another protein in the cytoplasm or nuclei labeled to demonstrate specificity of double-staining. (a) In lung organoids, FITC Phalloidin staining (green) visualized the organization of the actin cytoskeleton, while AMA staining (red) identified mitochondrial distribution. (b) AMA staining (red) highlighted the mitochondrial distribution, while Ki67 staining (green) was in nuclei in liver spheroids. (c) In liver spheroids, AMA staining (red) marked mitochondrial distribution, and E-Cadherin (green) staining visualized junctions in the cell membrane.
Figure 6.
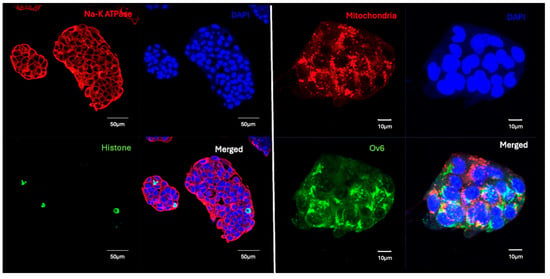
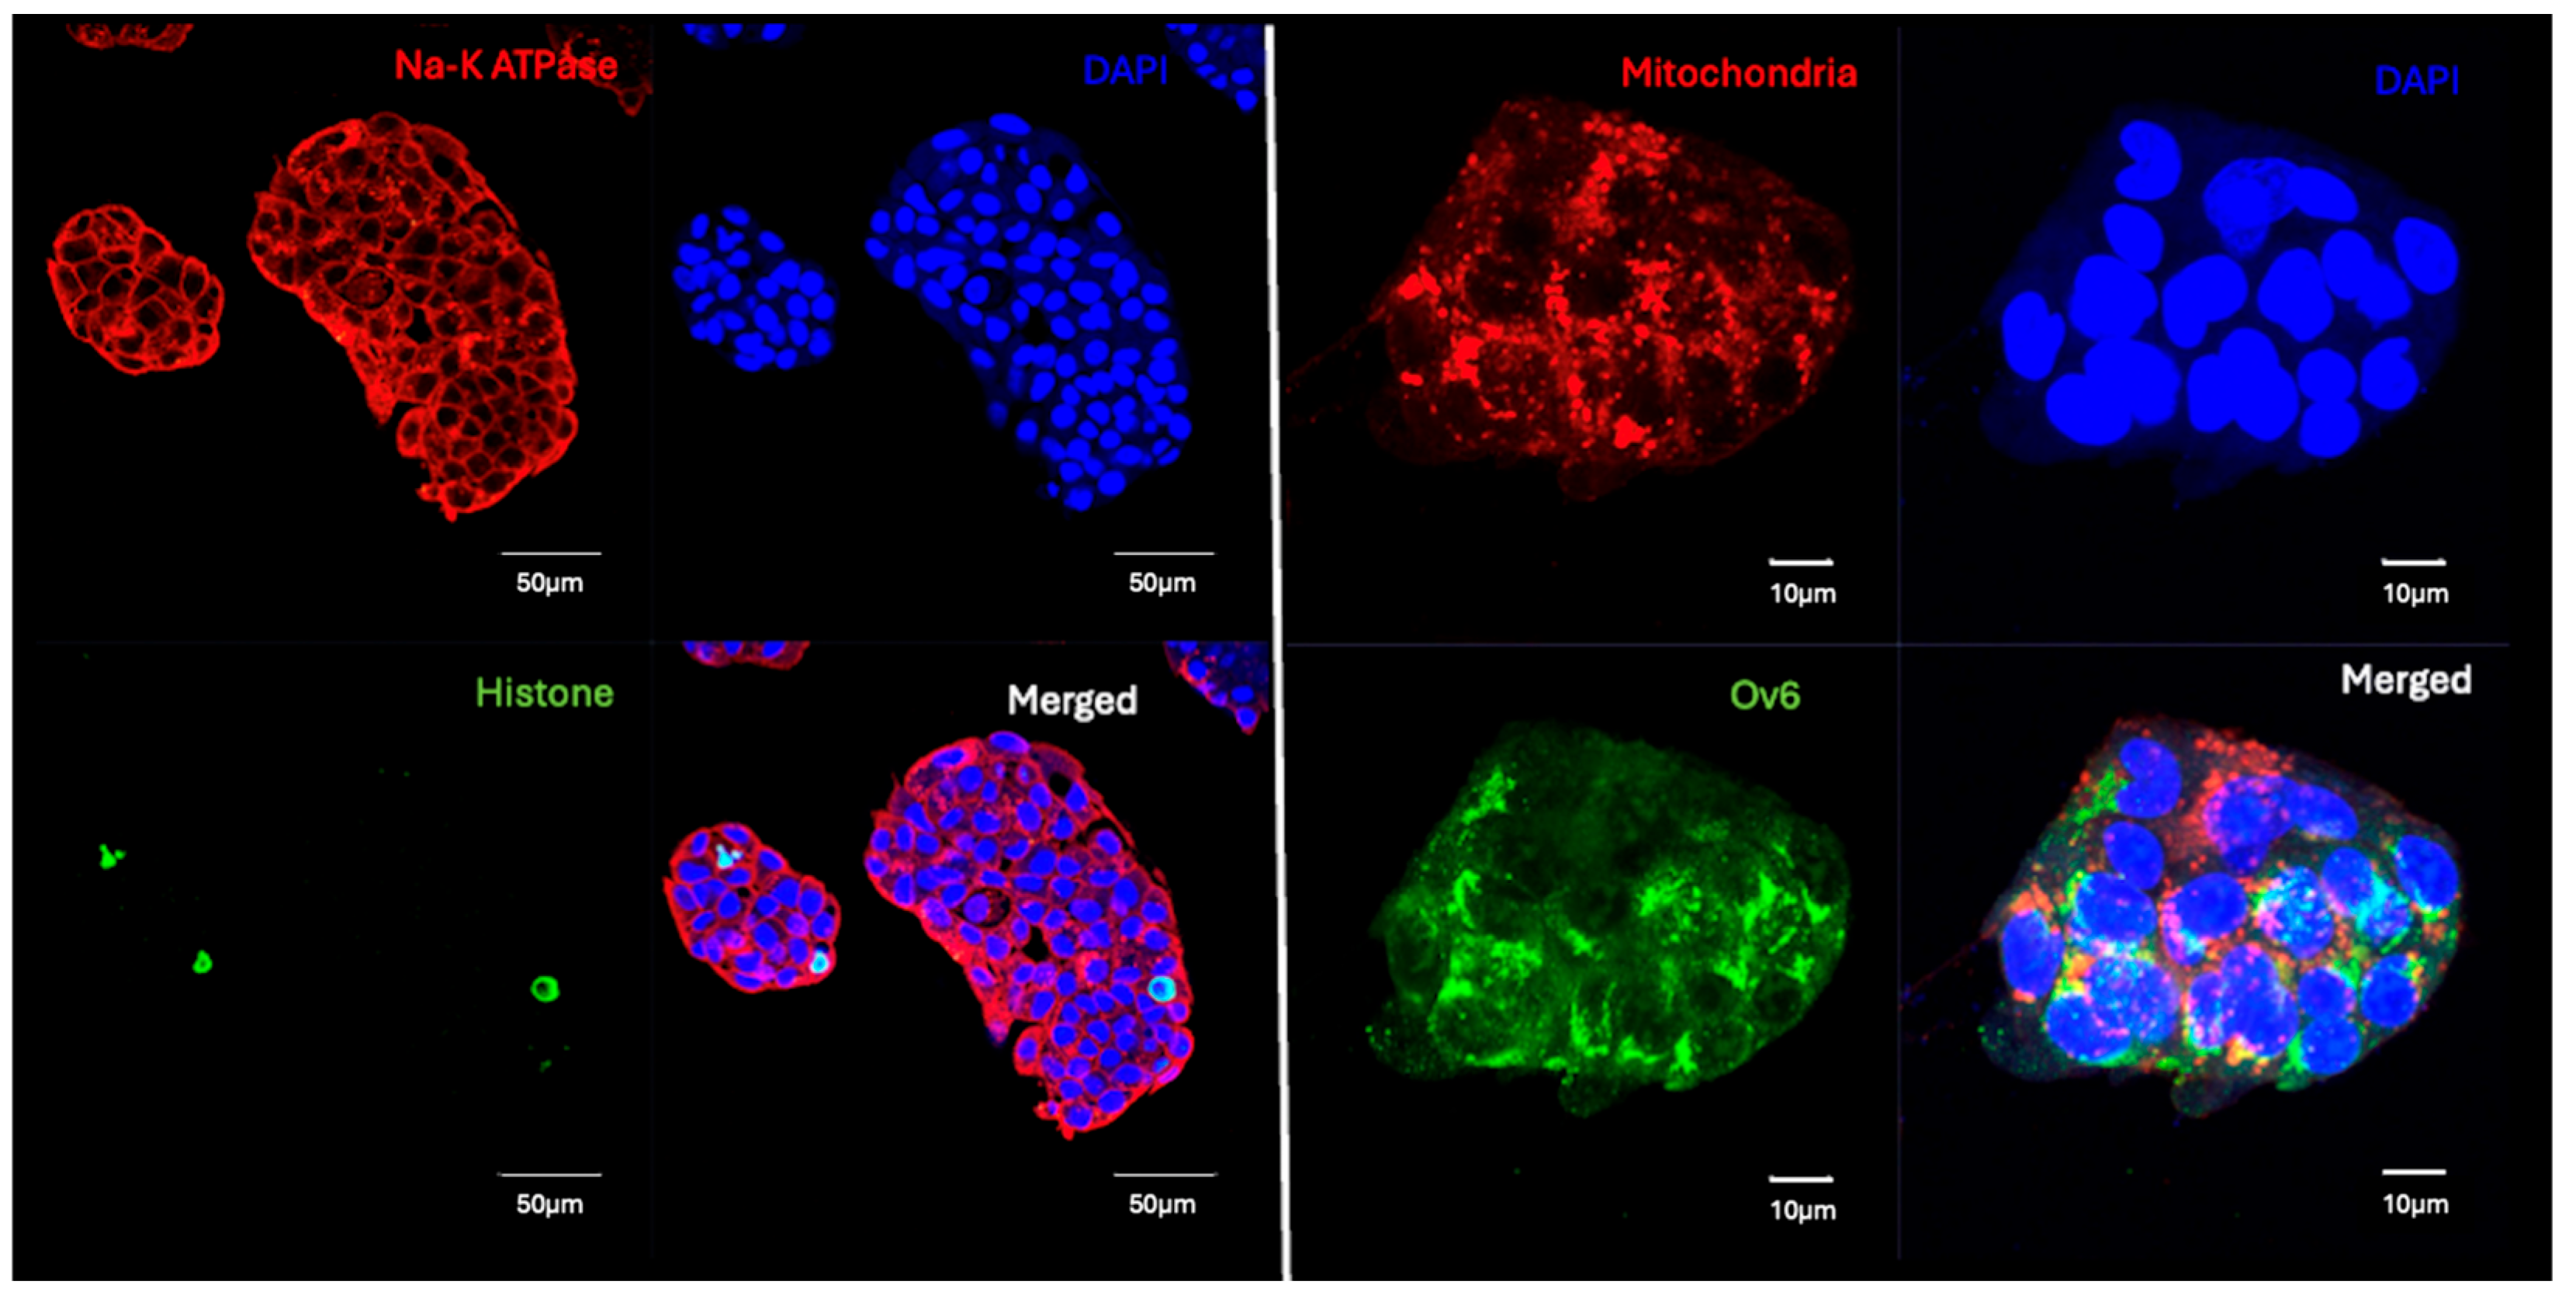
Confocal micrographs of liver cancer spheroids, demonstrating the utility of the whole-mount labeling protocol for double-labeling experiments. The images highlight the preservation of the 3D cytoarchitecture and the specific localization of markers within different cellular compartments. The first image shows simultaneous labeling of Na-K ATPase (red, located in the cell membrane) and Histone (green, in nuclei). The second image highlights co-labeling for mitochondria (red) and the hepatic progenitor marker OV6 (green), both located in the cytoplasm. DAPI (blue) was used as a general nuclear counterstain in both panels.
Figure 7.
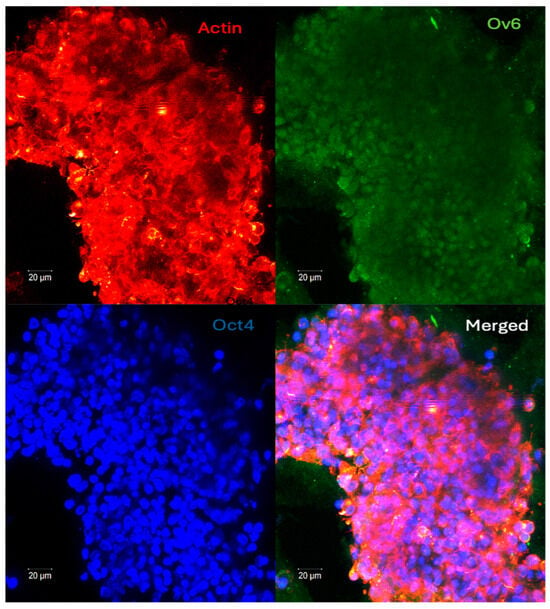
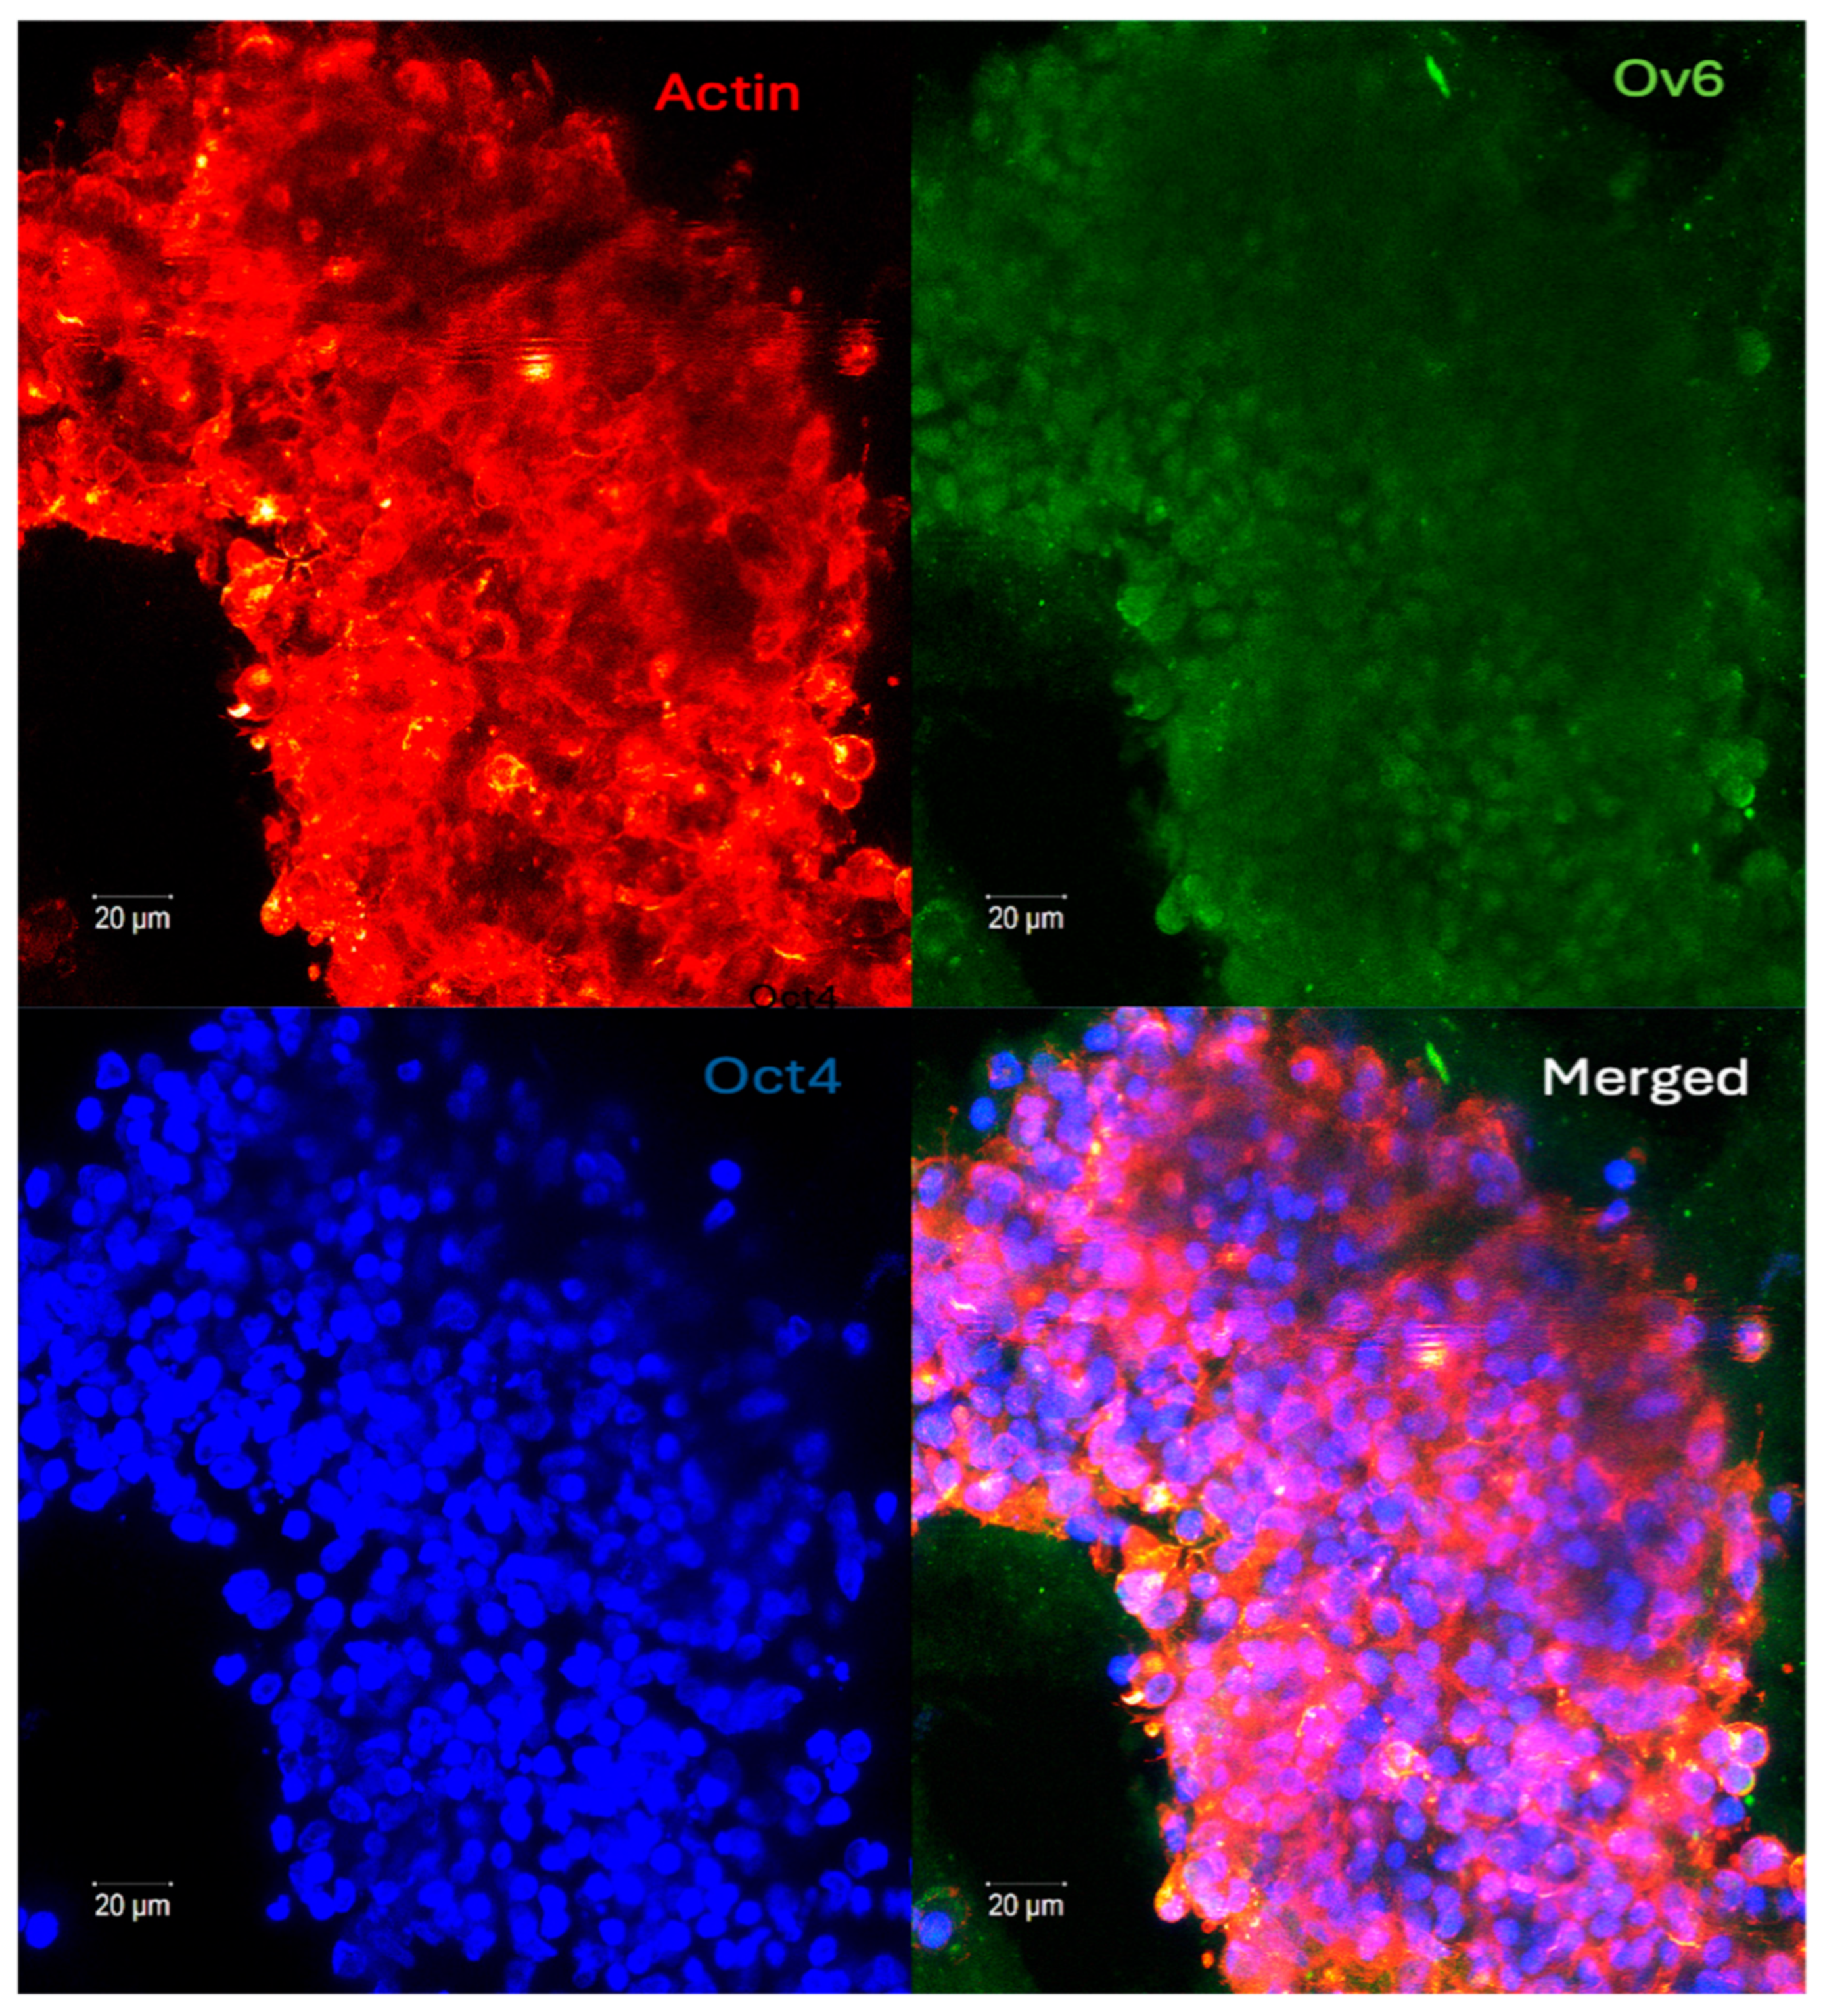
Triple-target protein visualization in a large liver cancer spheroid. Confocal microscopy reveals the F-actin cytoskeleton labeled with Rhodamine-phalloidin (red), the progenitor marker OV6 (green) localized within the cytoplasm, and the transcription factor Oct4 (blue) localized in the nuclei. Note: DAPI counterstaining was intentionally omitted to prevent spectral interference and ensure the clear visualization of nuclear Oct4.
Figure 8.
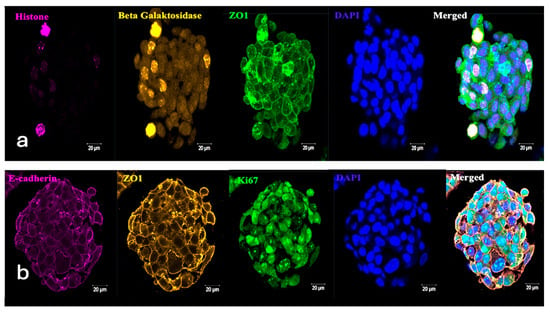
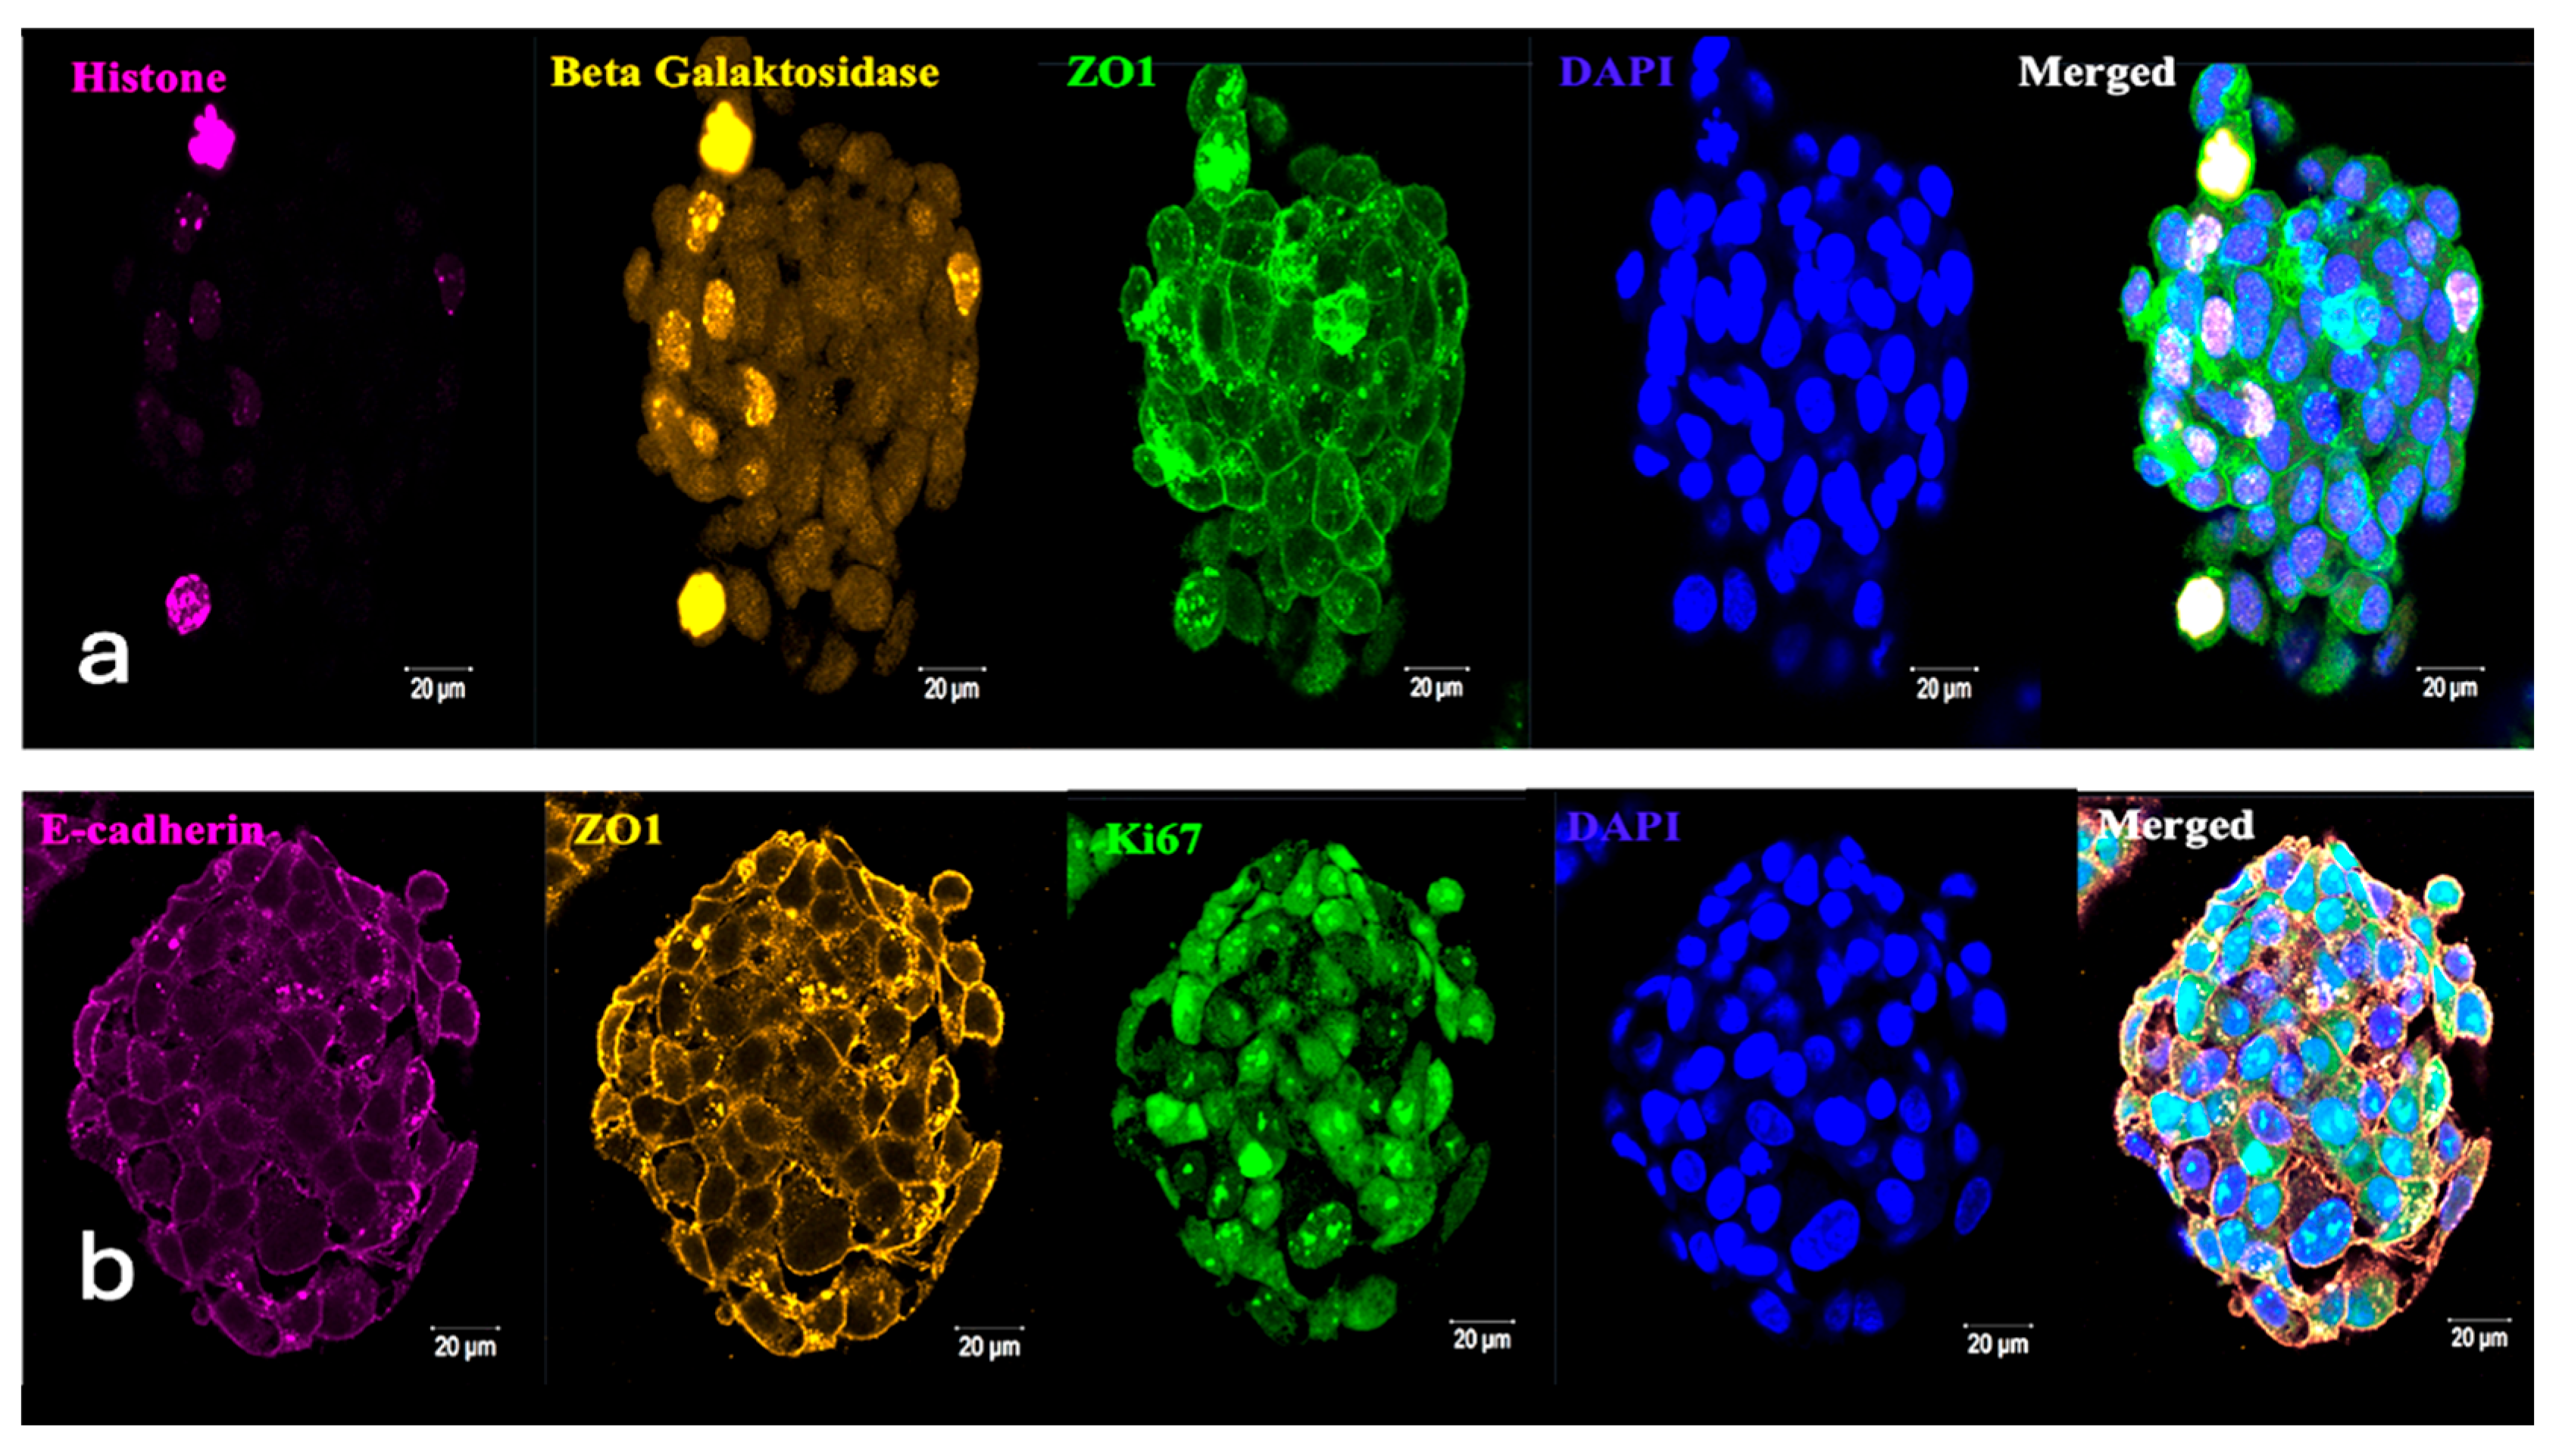
Representative confocal microscopic images of triple-labeling experiments of liver cancer spheroids. (a) ZO-1 in the cell membrane (green), Beta Galactosidase in cytoplasm (yellow), histone in nuclei (pink), DNA in nuclei (blue), (b) E-Cadherin in cell membranes (pink), ZO-1 in cell membrane, Ki-67 in nuclei (green), and DNA in nuclei (blue).
Dual-Target Protein Visualization via Double-Labeling
The results of dual-staining experiments confirm the protocol’s ability to achieve precise spatial resolution across distinct cellular compartments—nucleus, cytoplasm, and membrane—within the intact 3D environment. (Figure 5 and Figure 6, Supplementary Video S2).
Simultaneous Detection of Three Distinct Protein Markers via Triple-Labeling
3.2. Fixation Kinetics Cohort
3.2.1. Short-Term Fixation (5 min)
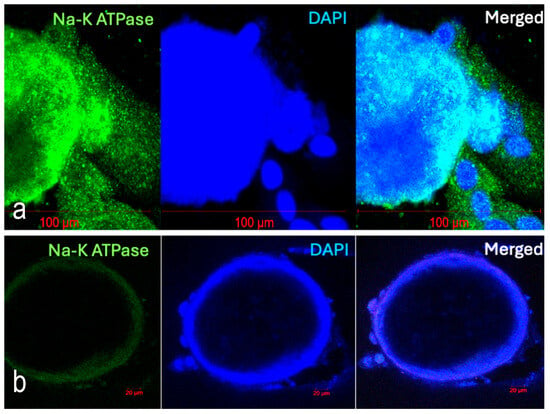
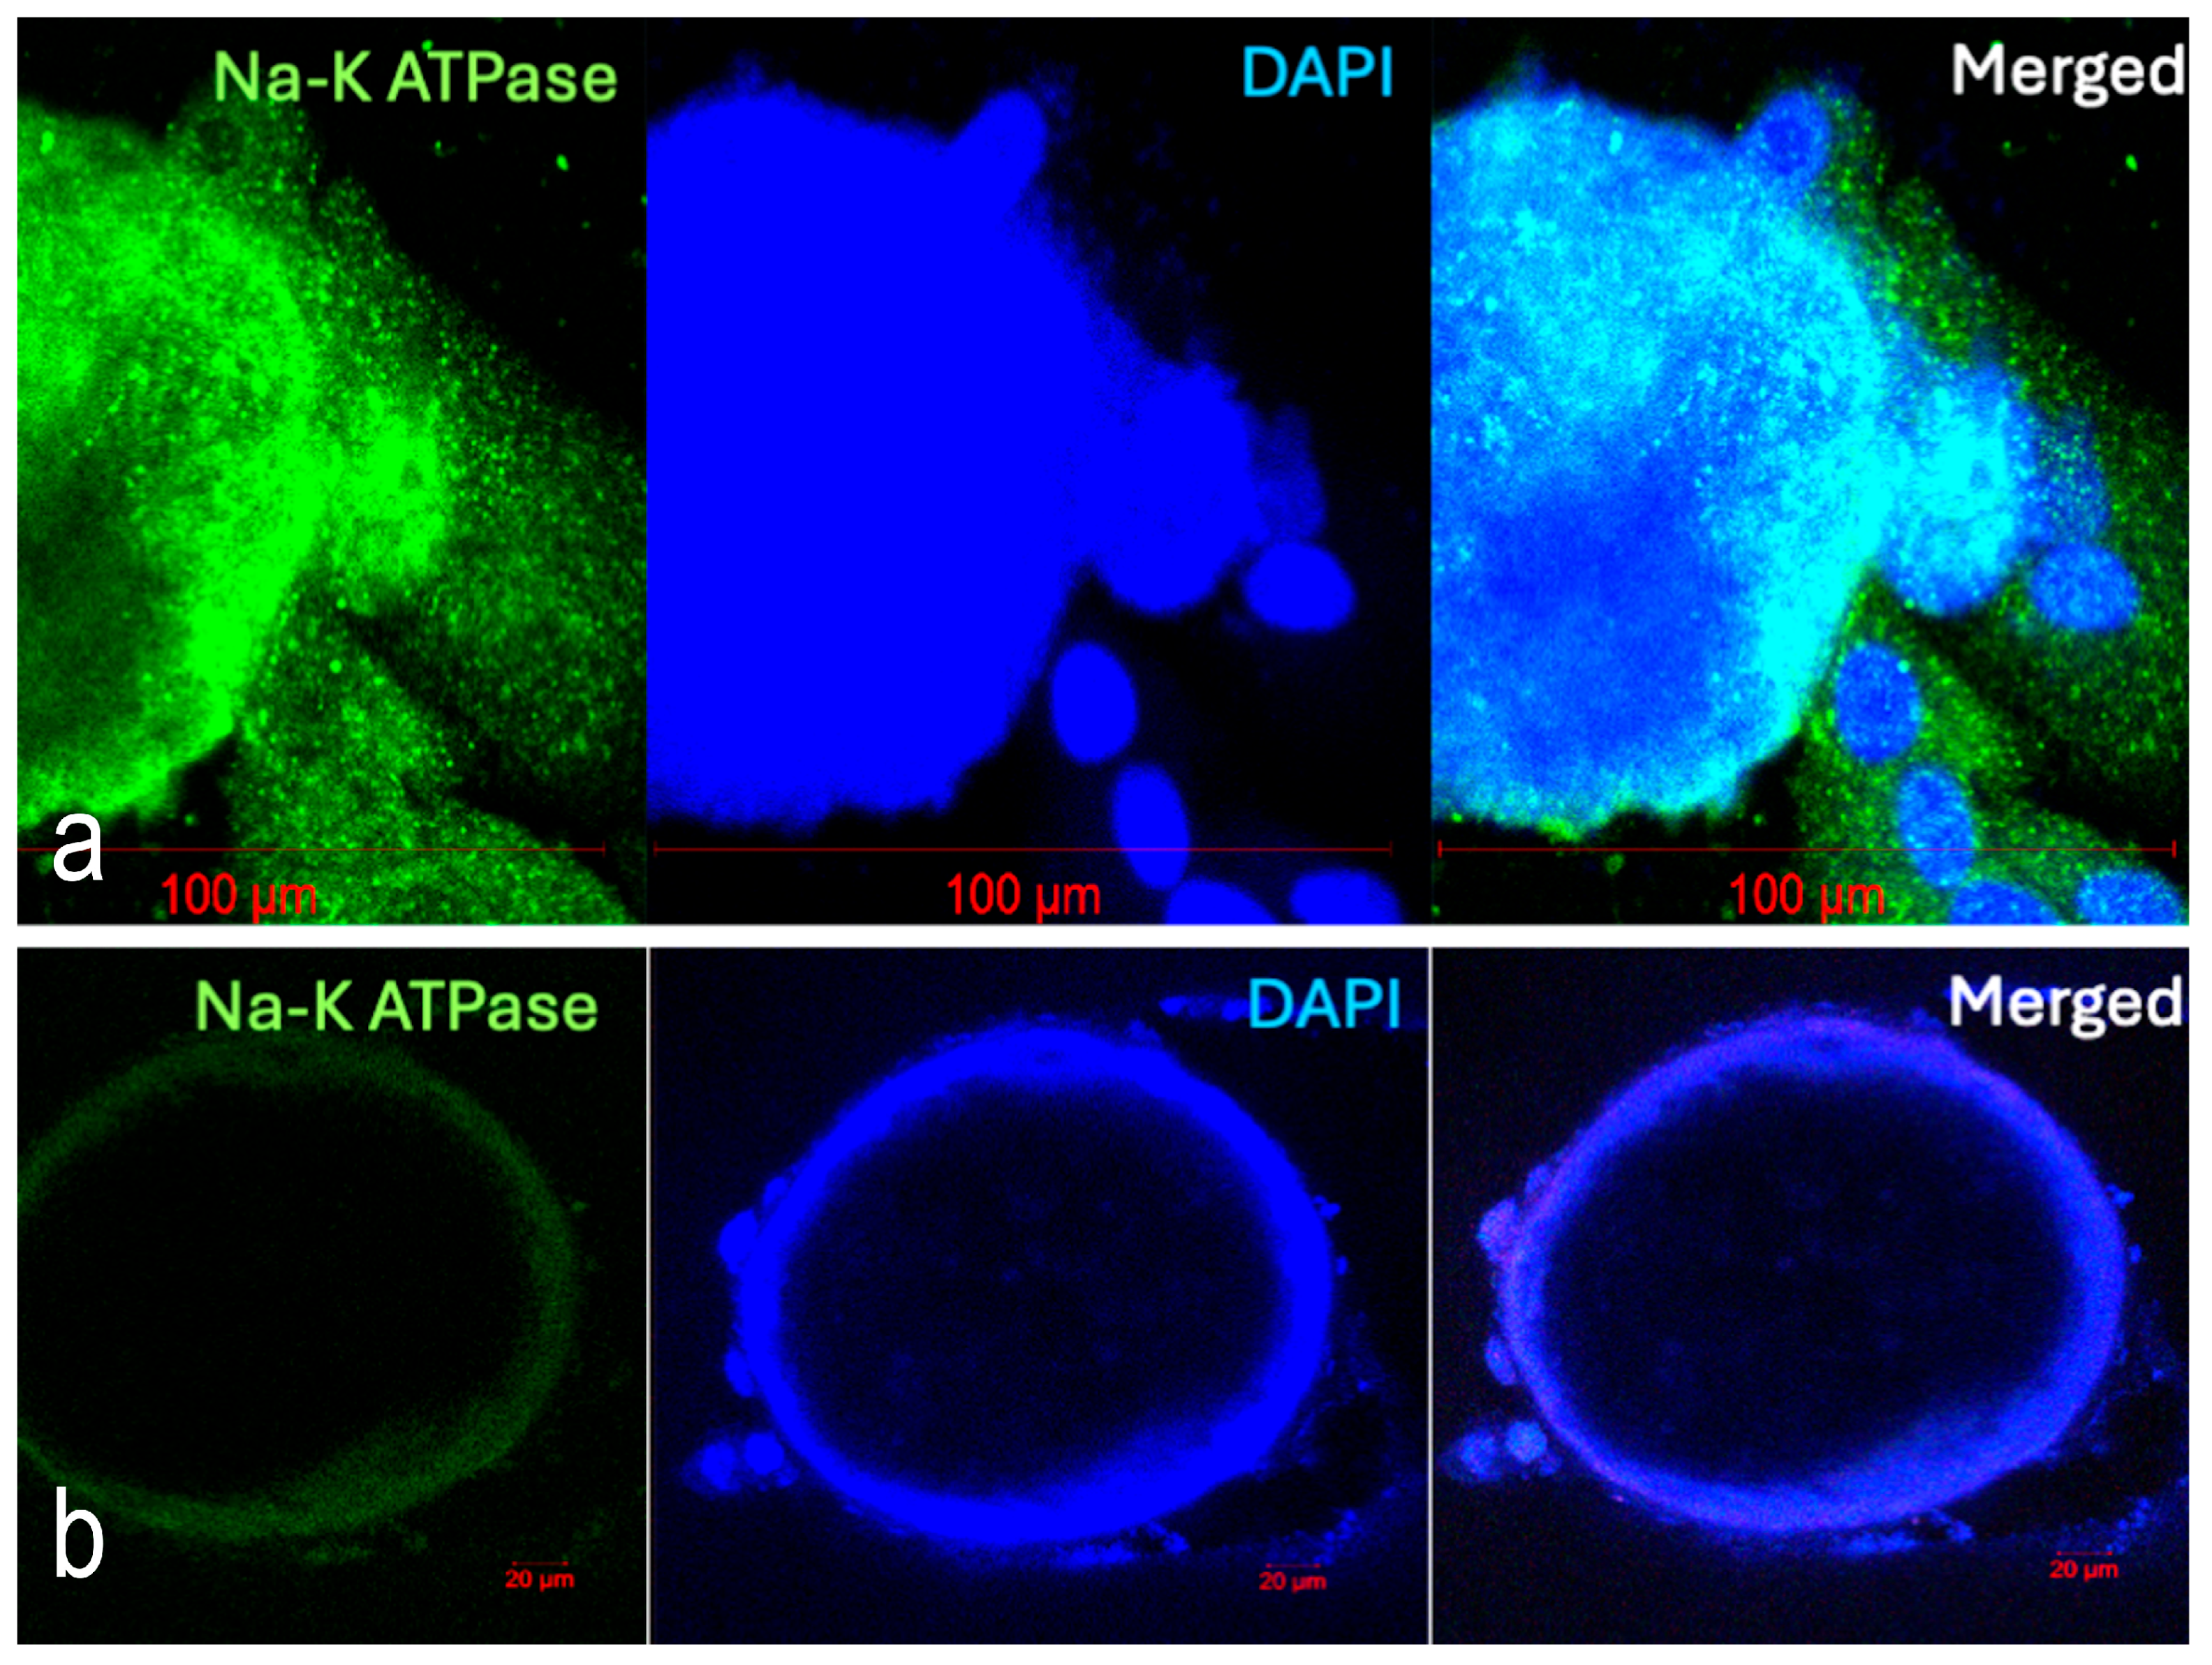
Significant morphological degradation and poorly defined cellular boundaries were clear. The lack of adequate cross-linking led to “fuzzy” signal localization, as cytoplasmic proteins were not sufficiently stabilized before labeling (Figure 9a).
Figure 9.
Representative confocal microscopic images of airway organoids fixed for 5 min (a) and 3 h (b) and then labeled with the antibody specific for Na-K ATPase (green). DNA in nuclei labeled with DAPI (blue). Morphological degradation and non-specific labeling is clear. The nuclei of the cells cannot be seen clearly.
3.2.2. Long-Term Fixation (3 h)
Fixation for a longer duration caused epitope masking, characterized by a marked decrease in fluorescence intensity. It resulted in significant morphological degradation and poorly defined cellular boundaries. The results confirm that over-fixation can create irreversible cross-linking that prevents penetration of reagents (Figure 9b).
3.3. Wash Cycle Efficiency Cohort
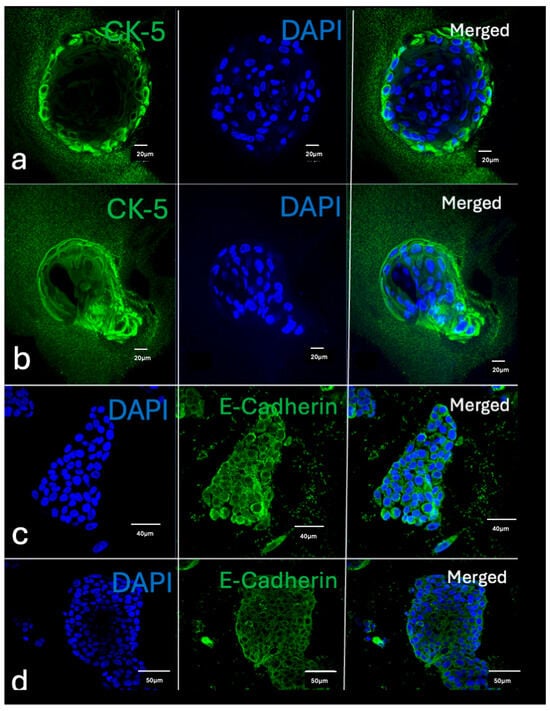
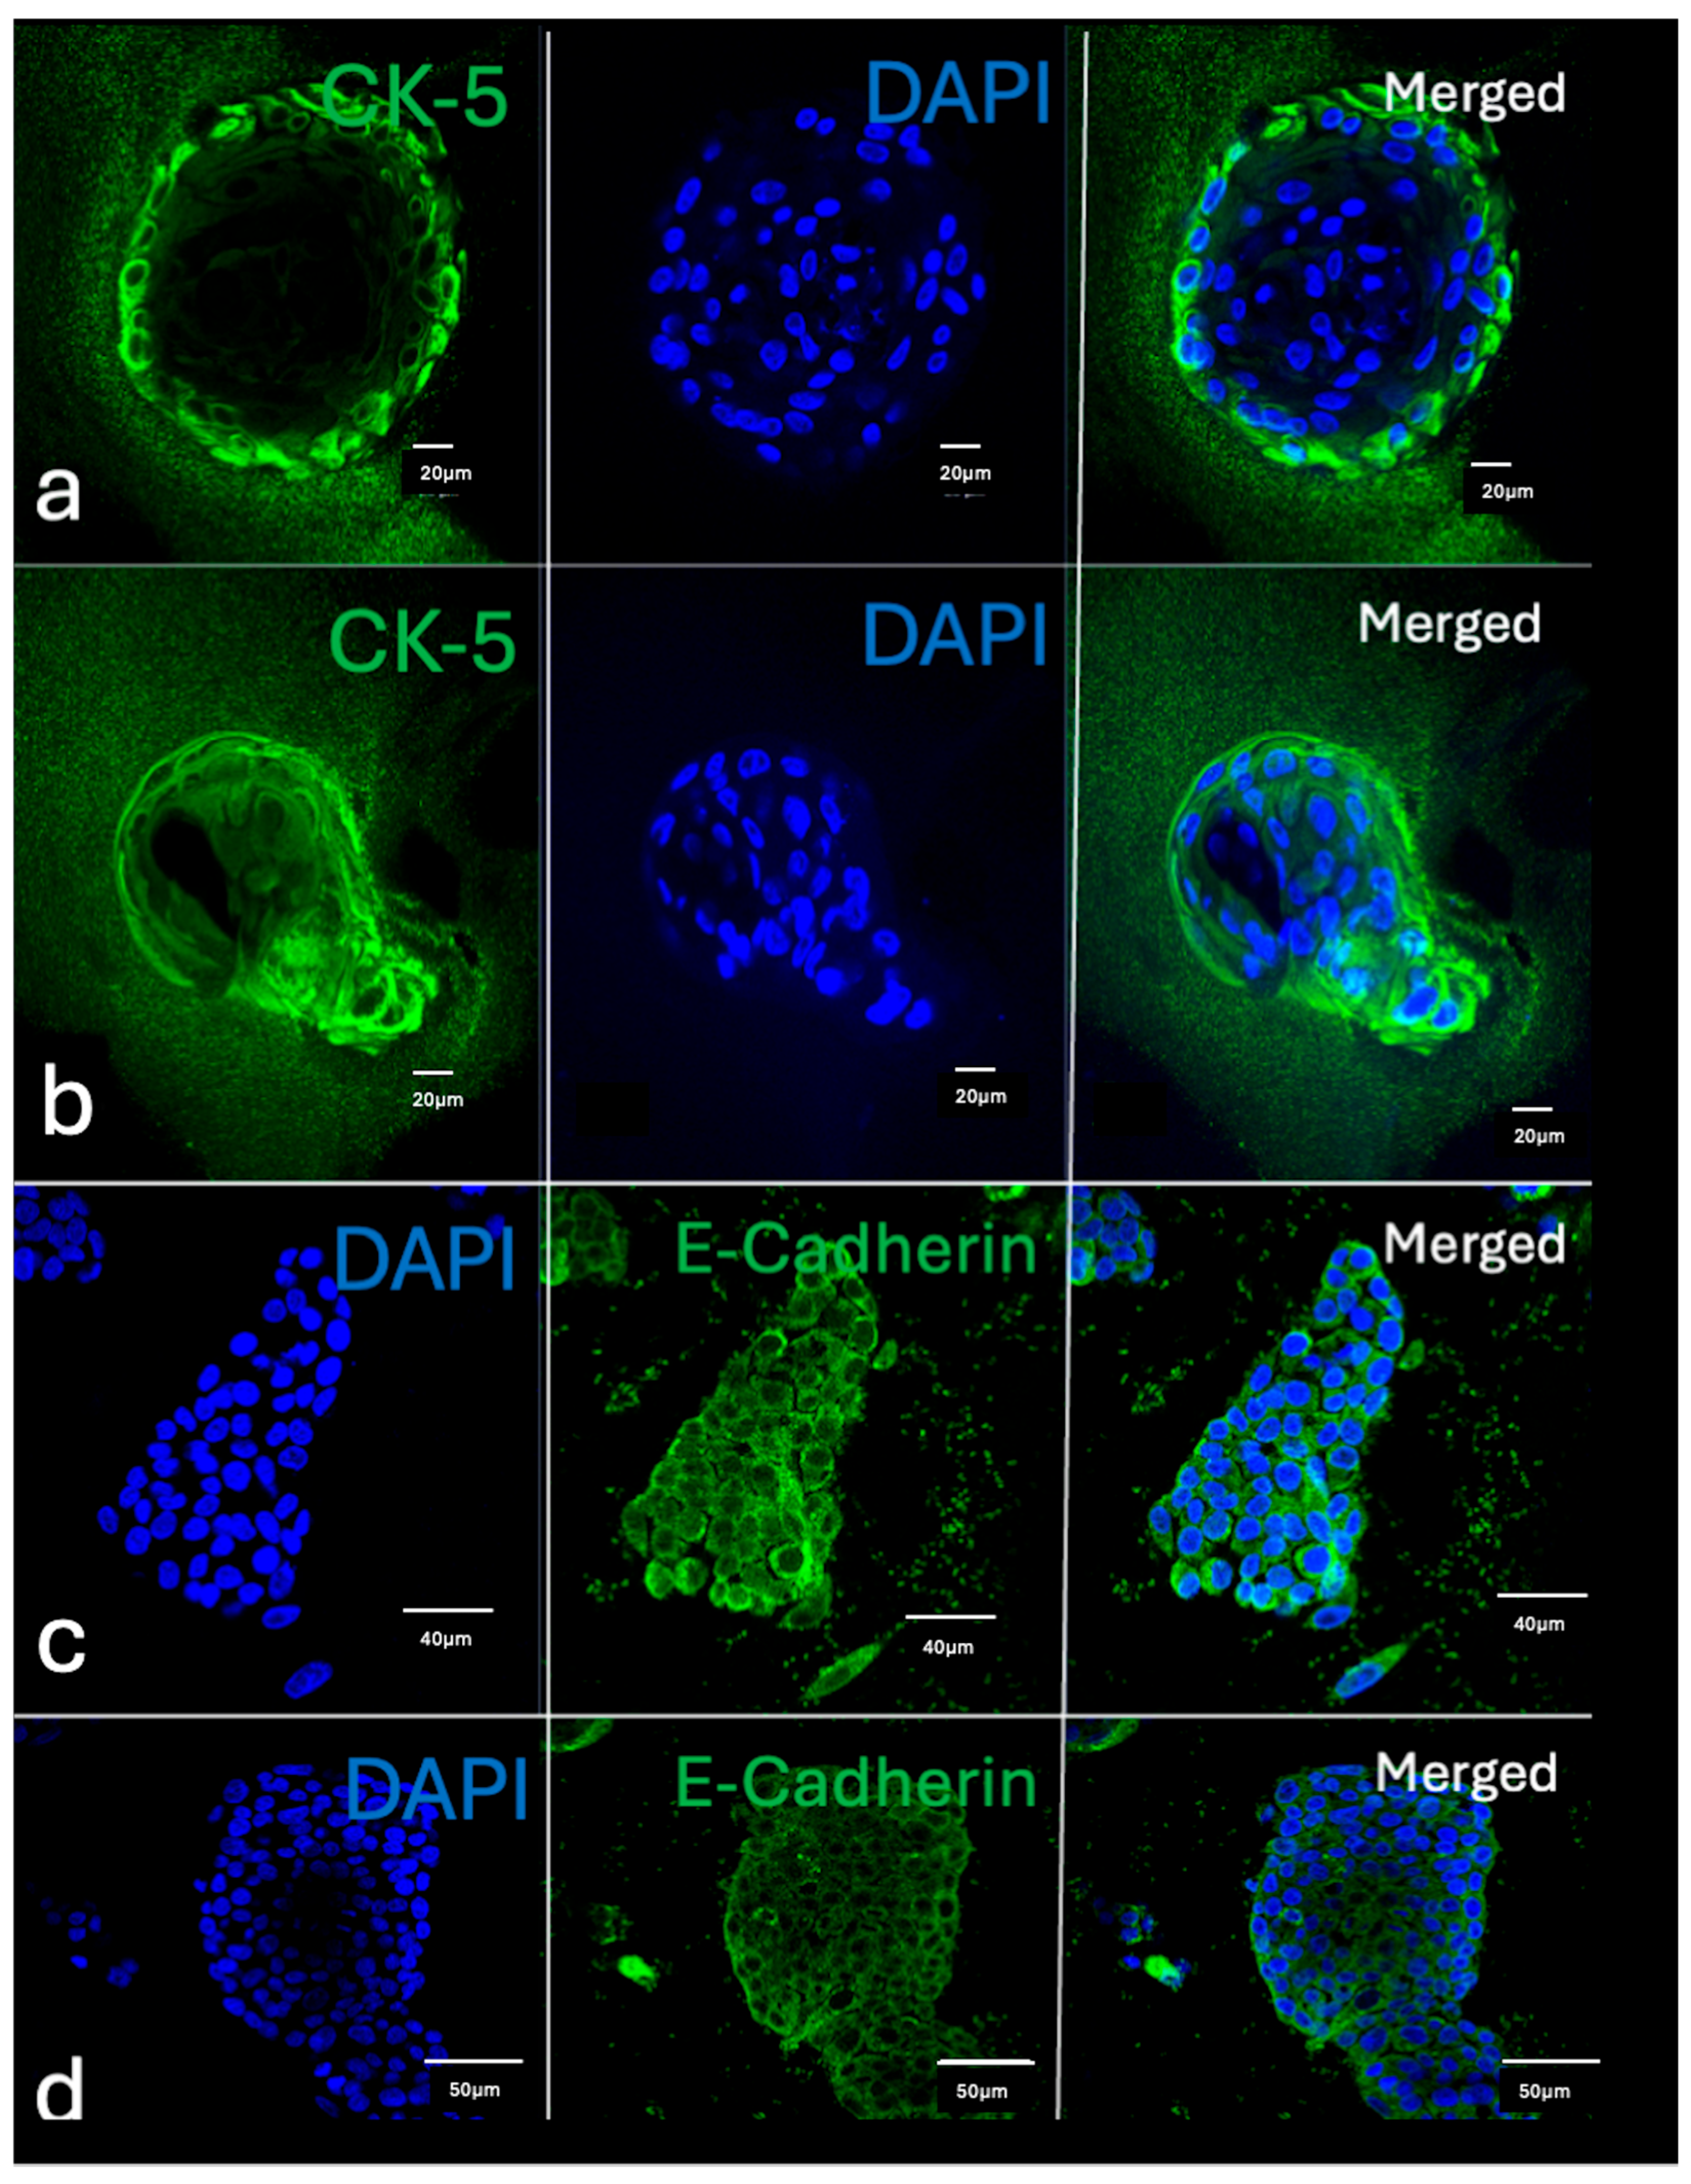
Reduced Wash Cycles (1 cycle) produced high background noise and non-specific speckling across the specimen (Figure 10). A low signal-to-noise ratio obscured fine structural details. The single wash was insufficient to remove unbound fluorophores, resulting in a low signal-to-noise ratio that obscured fine structural details.
Figure 10.
Impact of Wash Cycle Frequency on Background Signal in 3D Whole-Mount Imaging. Representative confocal microscopic images demonstrate the consequences of reduced washing stringency in (a,b) airway organoids and (c,d) liver cancer spheroids. Specimens were subjected to only a single wash step instead of the three cycles prescribed by the standardized protocol. Airway organoids (a,b) were labeled for CK-5 (green), and liver cancer spheroids (c,d) were labeled for E-Cadherin (green); all nuclei were counterstained with DAPI (blue). Significantly high background staining and non-specific signal retention are evident within the extracellular matrix and hydrogel surroundings, highlighting the necessity of optimized washing parameters for high-contrast 3D visualization.
3.4. Incubation Dynamics Cohort
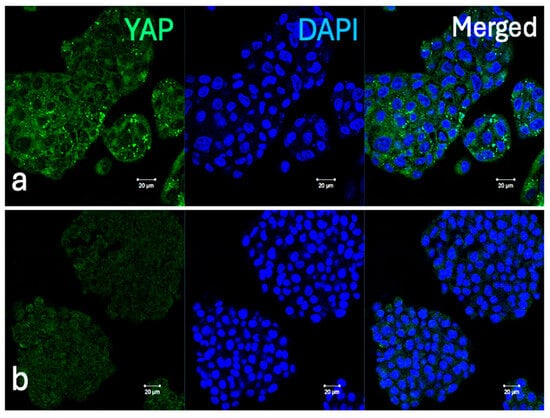
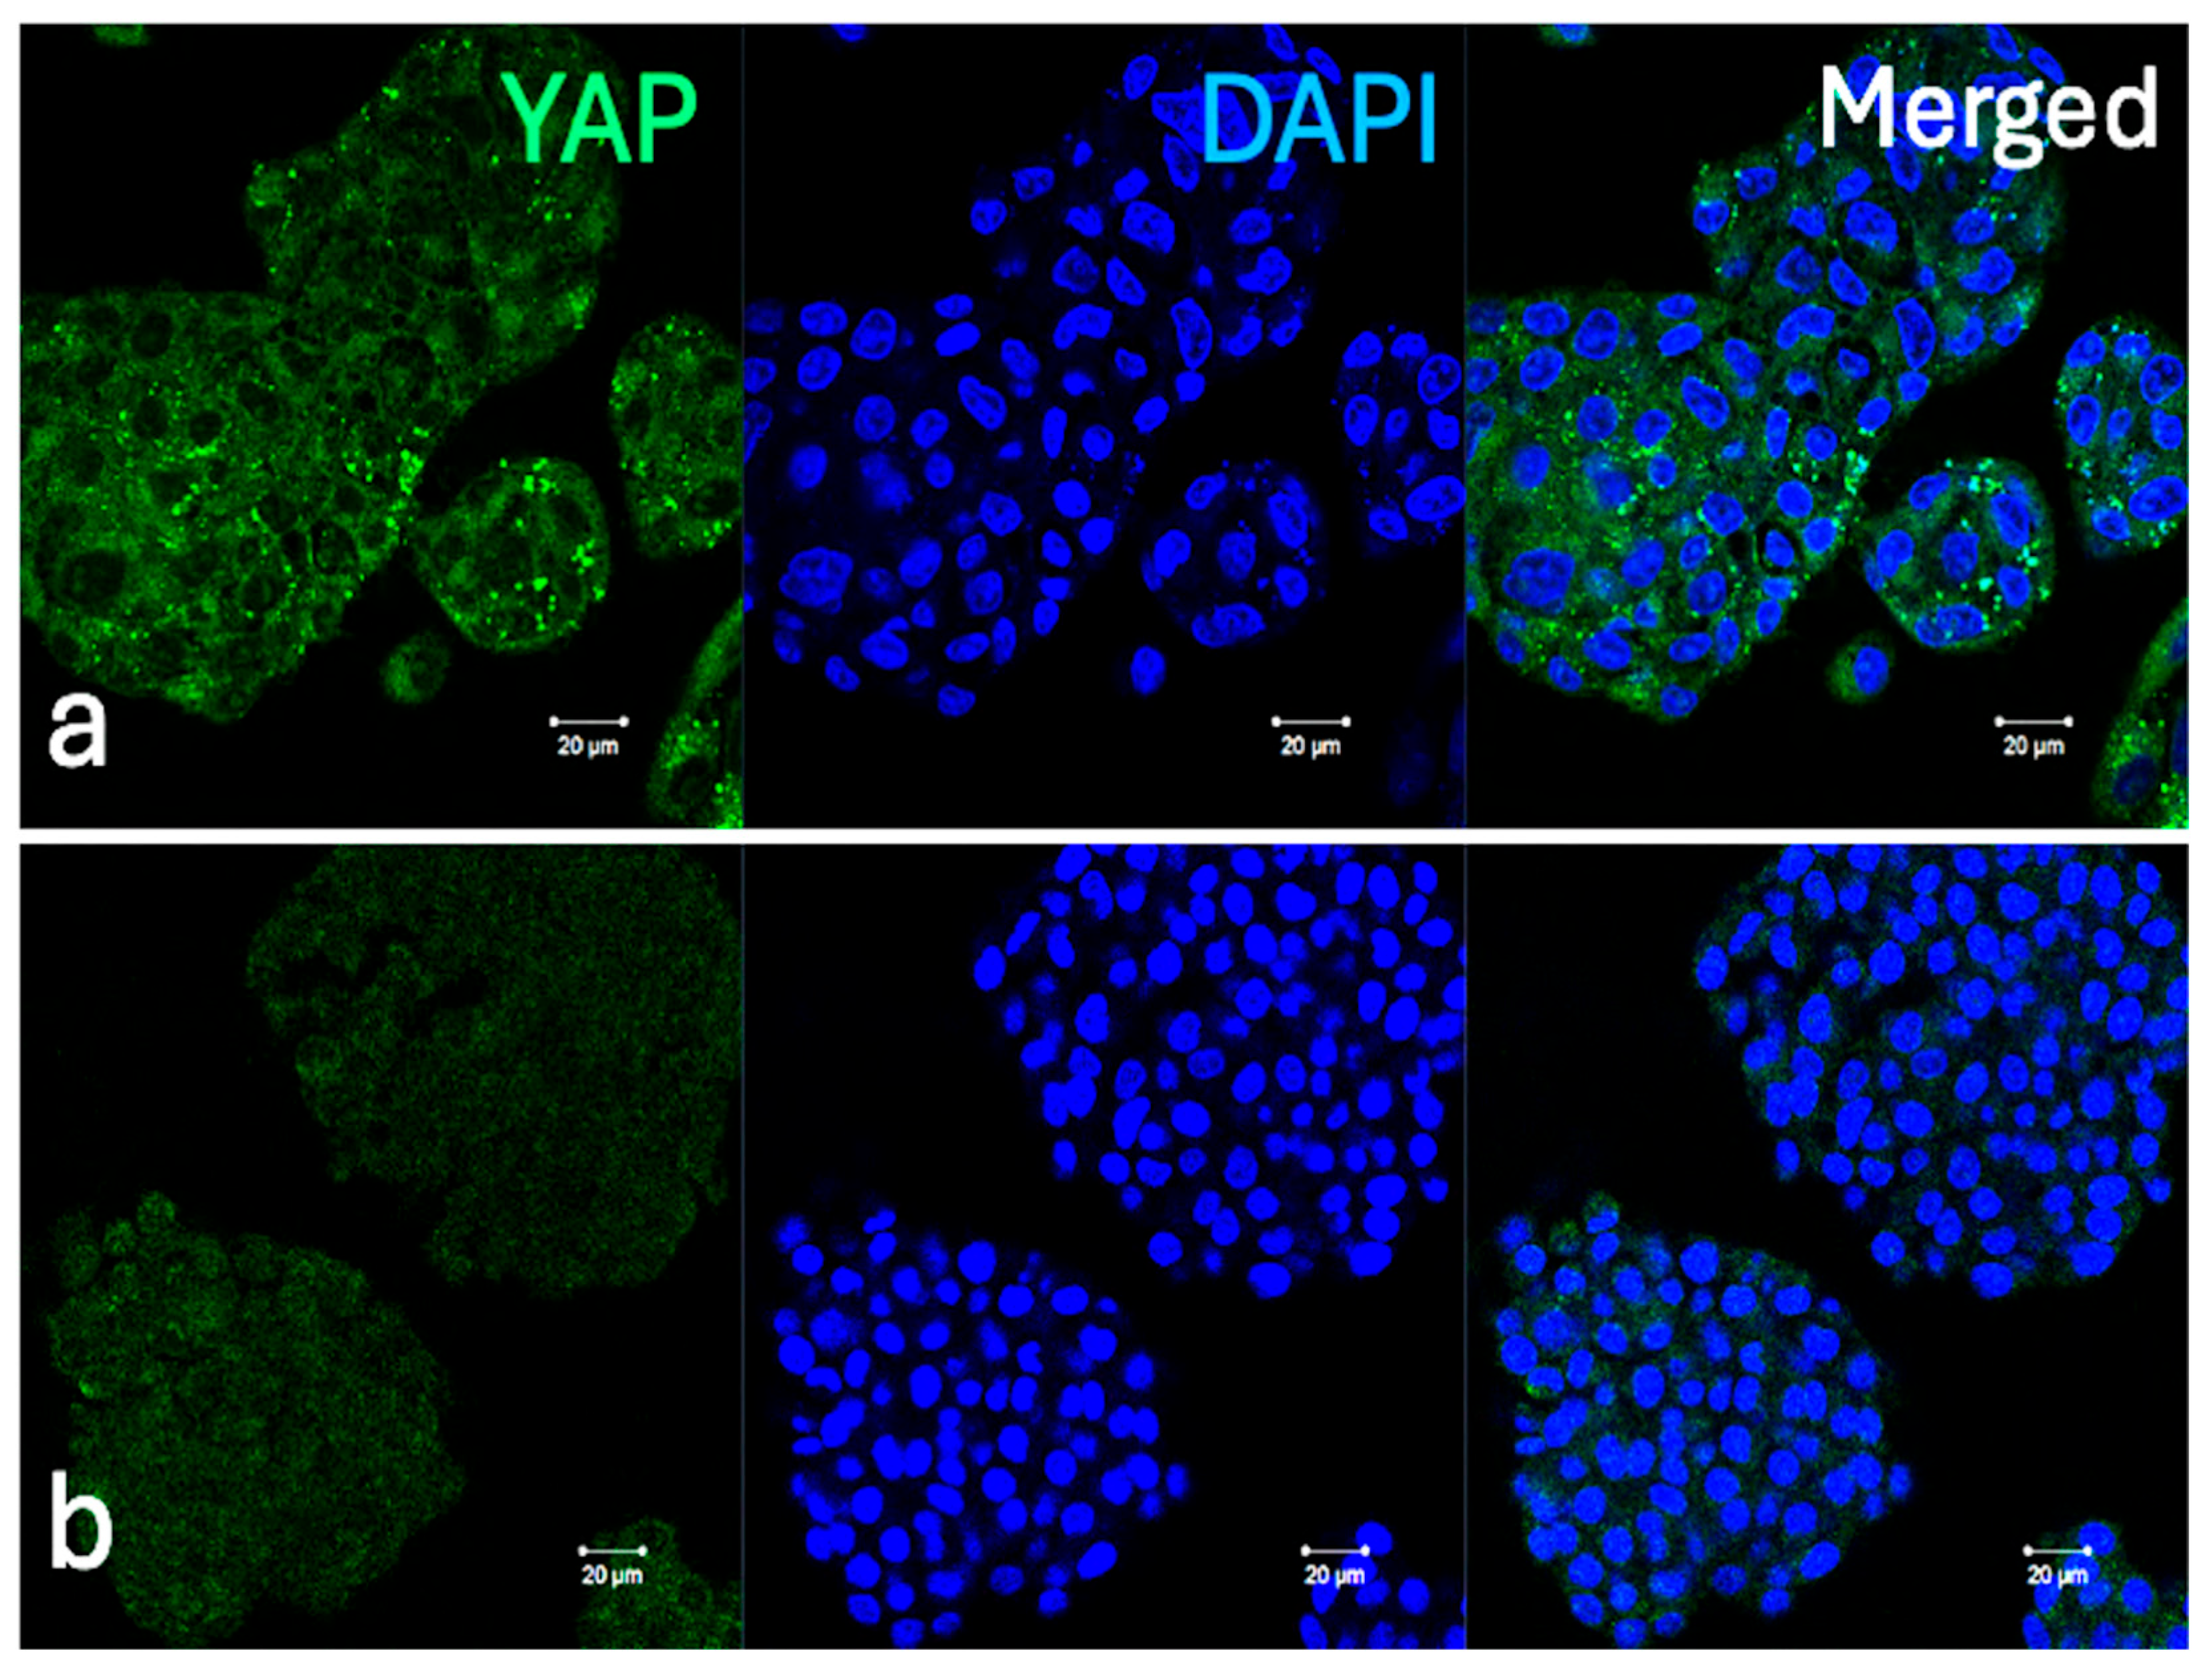
Sub-optimal Incubation (10 min) with primary antibody resulted in faint or inconsistent staining, particularly in the deeper layers of 3D models (organoids/spheroids) (Figure 11).
Figure 11.
Representative confocal microscopy images of liver cancer spheroids targets YAP protein (green), with DAPI-labeled nuclei (blue). (a) Optimal cytoplasmic localization of YAP is achieved using the recommended incubation time for primary antibody. (b) Complete loss of signal is observed when the incubation with the primary antibody is reduced to 10 min.
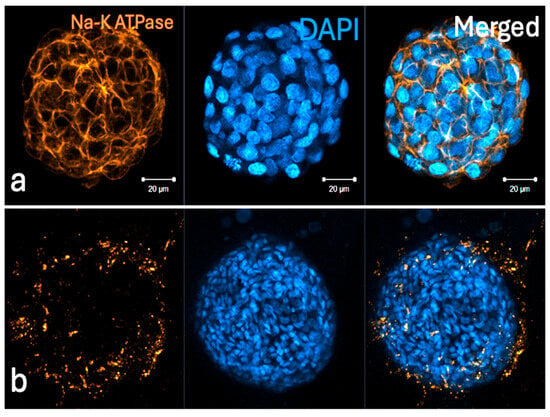
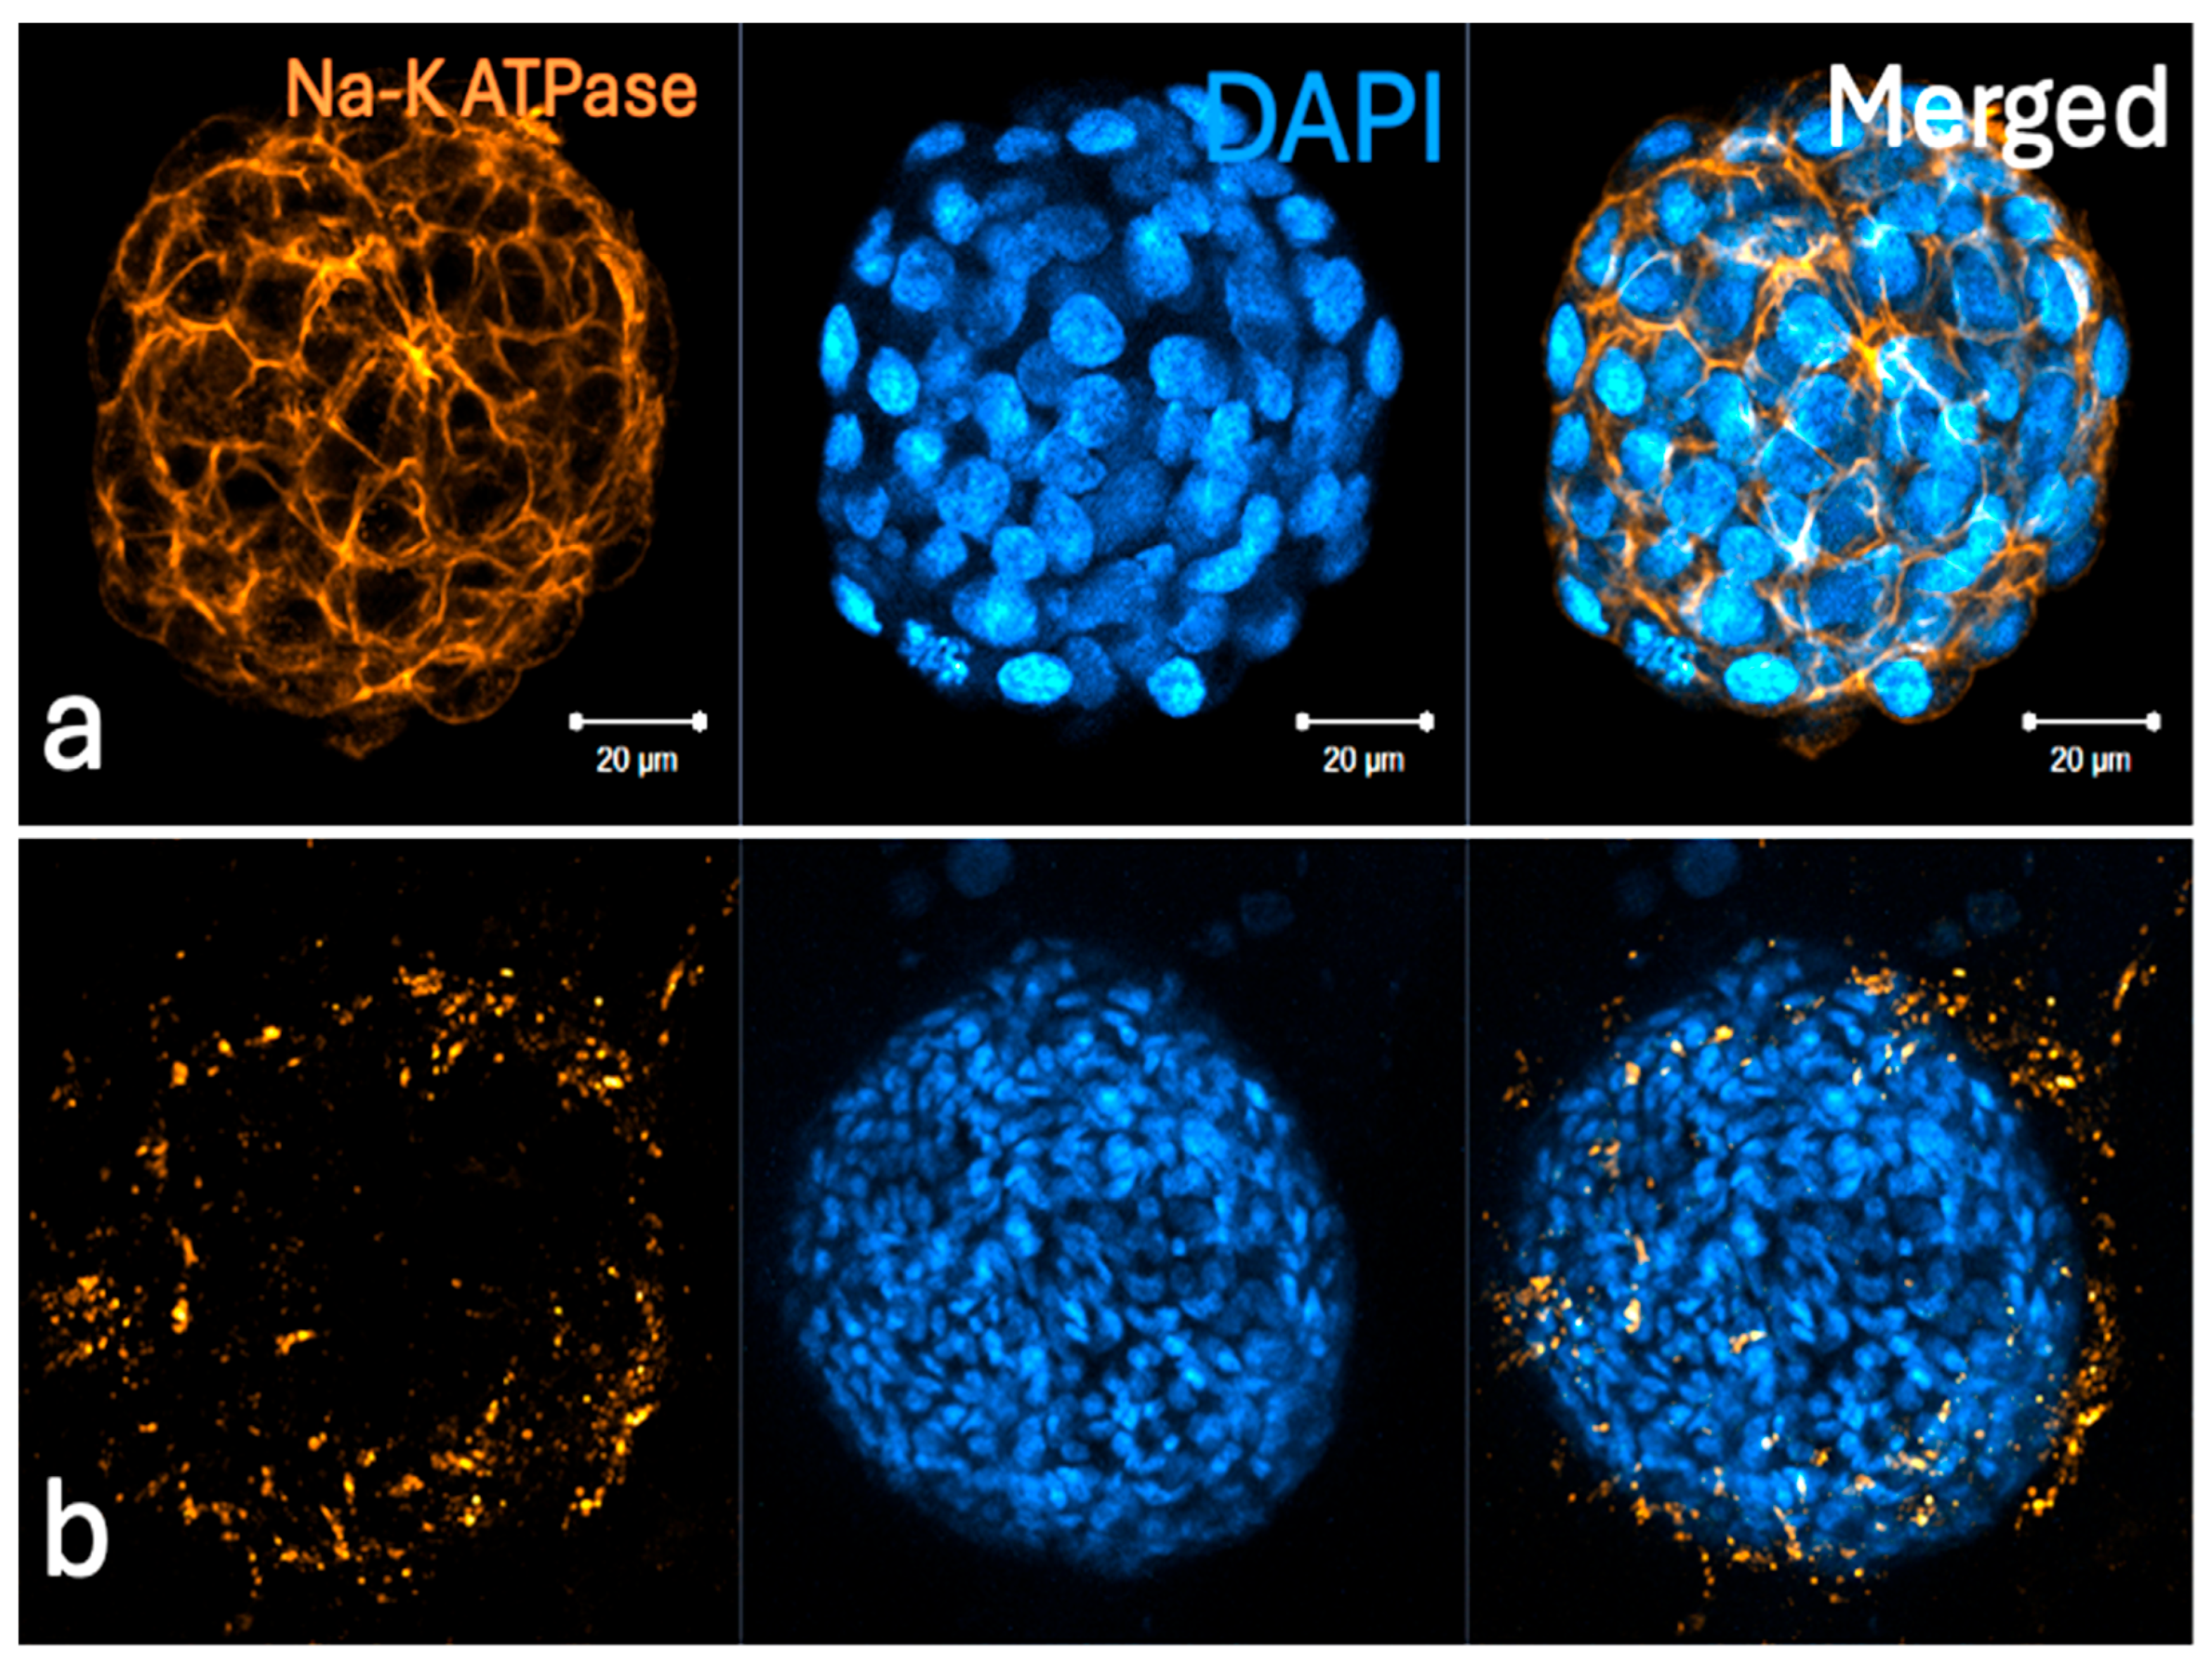
Extended (longer, 3 h) incubation periods resulted in unexpected staining patterns and deficiency in structural preservation (Figure 12).
Figure 12.
Representative confocal microscopy images of airway organoids showing Na-K ATPase (gold/yellow) and DAPI-labeled nuclei (blue). (a) Specific labeling of Na-K ATPase is localized strictly to the cell membrane under optimized protocol conditions. (b) Signal diffusion occurs when the primary antibody incubation is extended to 3 h.
3.5. Thermal Stability Cohort
The results revealed that changes in temperature lead to inconsistent labeling and reduced contrast (Figure 13).
Figure 13.
Representative confocal microscopic image of an airway organoid processed at room temperature (20–24 °C). In contrast to the standardized 37 °C protocol, sub-physiological temperatures result in inconsistent and attenuated signal localization across all non-nuclear targets. The observed increase in high-frequency background noise and poor signal-to-noise ratio underscores the critical requirement for a stable temperature to ensure robust reagent kinetics and specific epitope binding in 3D architectures.
3.6. Antibody Titration Cohort
Low antibody titrations below the manufacturer’s recommended range led to signal dropout, leading to false-negative interpretations of low-expression markers (Figure 14).
Figure 14.
Representative confocal micrograph of an airway organoid showing the effects of sub-optimal antibody titration. Na-K ATPase (green) expression is visualized alongside DAPI-labeled nuclei (blue). In contrast to optimized conditions, a reduction in the primary antibody titration below the established threshold results in a complete loss of specific membrane signaling. These results highlight the necessity of maintaining optimal concentrations to ensure specific labeling throughout the dense 3D architecture of the organoid.
4. Discussion
The landscape of drug discovery and personalized medicine is undergoing a profound transformation. Traditional 2D cell cultures and animal models, while useful, often fail to replicate the complex physiology of human tissue, leading to high attrition rates in drug development. Today, a powerful convergence of NAMs including 3D cell cultures, spatial biology, and artificial intelligence (AI) is bridging this gap, offering unprecedented insights into human health and disease. By accurately replicating human drug responses, toxicities, and disease mechanisms, 3D NAMs are making drug screening significantly more predictive and enabling true personalized medicine, where a patient’s own cells can be used to test therapies before they are administered. Understanding which cells are present in a tissue is no longer enough; we must understand where they are located. Spatial biology preserves the geographical context of tissue architecture, revealing how cells interact within their microenvironment. A protein’s precise localization and its dynamic shifts within a 3D growth environment is fundamental to deciphering the intricate interactions between cells and their surrounding niches. Consequently, the development of advanced technologies that facilitate the visualization of intact, 3D architectures of samples has become crucial for obtaining a comprehensive understanding of cellular behavior and tissue organization. To fully complement spatial omics and 3D modeling, researchers rely on WMIF labeling methods. Unlike traditional methods that require slicing tissues into thin, 2D sections—which destroys structural continuity—WMIF allows for the imaging of intact, large-scale 3D specimens. This methodology provides high-resolution visualization of exactly where proteins localize, how they relocate, and how their expression changes across complex 3D spaces in response to experimental drugs. This allows researchers to peer deep into intact specimens to study the interactions between cells and their microenvironments.
As highlighted in the introduction, standardizing whole-mount immunofluorescence (WMIF) protocols is an essential step toward achieving reliable and reproducible 3D spatial data. However, optimizing these workflows is inherently challenging due to the highly dynamic nature of protein expression profiles and spatial topographies, which fluctuate based on the specific 3D model utilized (e.g., iPSCs, patient-derived primary tissues, or transformed cell lines) and surrounding microenvironmental cues. Subcellular localization shifts dramatically as 3D cultures mature [41,42,43,44,45]. For instance, the plasma membrane marker Na-K-ATPase undergoes exponential upregulation and distinct membrane localization as organoids age [45]. Similarly, the nuclear structural protein Lamin A/C exhibits stark spatial gradients driven by structural and mechanical contexts [41,42,43,44]. In healthy tissue organoids, Lamin A/C is heavily upregulated as cells migrate away from the stem cell niche, polarize, and differentiate around a central lumen. Conversely, in multicellular tumor spheroids, mechanotransduction forces generate a clear gradient of Lamin A/C expression extending from the highly stressed periphery to the hypoxic core, whereas cancer stem cell (CSC) spheroids display a uniformly downregulated profile that aligns with its role as a hallmark of pluripotency and stemness. These multi-dimensional changes in protein distribution complicate data interpretation. Consequently, adopting streamlined, reproducible WMIF labeling methodologies in tandem with complementary orthogonal verification is vital to generating the high-fidelity baseline data required to accelerate downstream drug discovery. Furthermore, alterations in the cellular microenvironment have been shown to modulate both three-dimensional structural architecture and the expression profile of the target proteins [46,47]. High-plex technologies, such as spatial transcriptomics and proteomics, enable investigators to map RNA expression and protein abundance directly within their native tissue coordinates [48,49,50]. This spatial resolution unlocks the ability to monitor how localized cell populations evolve during the progression of complex pathologies like cancer or fibrosis. However, the massive, intricate datasets generated by these spatial omics platforms require advanced computational frameworks for meaningful interpretation. Artificial intelligence (AI) algorithms are uniquely suited to identify hidden molecular patterns, classify distinct cellular neighborhoods, and predict disease outcomes—effectively transforming raw spatial architecture into actionable therapeutic insights.
While scientists continue to develop and refine WMIF methodologies to preserve and visualize intact 3D biological architectures, they frequently encounter complex technical challenges [50,51,52,53,54]. Transitioning from traditional 2D sectioning to thick, intact 3D specimens introduces unique variables—such as antibody penetration depth, tissue autofluorescence, and optical clearing inefficiencies. Harvesting, which is the physical manipulation of the delicate 3D structures to remove them from the environment, typically disrupts 3D architectures. A major hurdle in 3D imaging is the background noise generated by the surrounding hydrogel, which traditional methods attempt to solve via chemical clearing. However, clearing often leads to data loss and structural deformation. The physical and chemical stress introduced by these repetitive fluid changes routinely compromises sample integrity, often resulting in sample loss exceeding 25% of the initial cell population [28]. For that reason, Tratnjek et al. developed a protocol including those steps and recommended processing 20–30% excess spheroids beyond experimental requirements to compensate for potential losses [51]. Mechanical centrifugation and pipetting can cause severe structural deformities, including sample shrinkage, organoid/spheroid/cell flattening, and the catastrophic collapse of delicate surface structures like organoids, spheroids, neurites or cancer blebs [8,11,14,17] At the molecular level, this structural disruption induces conformational changes in target proteins, alters delicate antigenic sites, and leads to localized protein loss—ultimately yielding inconsistent antibody penetration, high background noise, and compromised experimental data [8,10,11].
For researchers entering this space, navigating these subtle procedural hurdles can lead to inconsistent results, making a robust troubleshooting framework highly valuable for their upcoming studies.
Because these biological models are inherently complex and variable, it is critically important to utilize a WMIF labeling methodology that minimizes technical or procedural variables. Minimizing technically demanding or highly variable protocol steps significantly enhances experimental standardization, thereby yielding superior reproducibility and more reliable data. In other words, the elimination of multi-step buffer transitions, chemical harvesting stresses, and unpredictable clearing protocols directly helps to establish a standardized and controlled experimental environment. Standardizing the foundational steps of the labeling process of WMIF labeling ensures that the resulting high-volume spatial datasets are reliable, reproducible, and robust enough to support accurate phenotypic analysis.
The whole-mount immunofluorescence protocol used in this study offers distinct technical and operational advantages over conventional 3D imaging workflows. By utilizing a single, standardized reagent throughout the entire experimental sequence, this approach minimizes multi-step buffer transitions and mitigates potential human errors associated with manual reagent preparation [36,37,46,47]. Crucially, the workflow circumvents the traditional requirement for harvesting, enabling high-fidelity labeling in situ while the organoids and spheroids remain undisturbed within their native hydrogel matrix. Additionally, the protocol eliminates the need for harsh optical clearing procedures, which frequently introduce structural artifacts or quench endogenous fluorescence signals.
As demonstrated across Figure 1, Figure 2, Figure 3, Figure 4, Figure 5, Figure 6, Figure 7 and Figure 8, this streamlined labeling method consistently achieves highly specific target visualization alongside exceptionally clear, low-background signal profiles. The spatial distribution and staining patterns of the investigated target proteins strongly correlate with previously published literature, confirming the specificity of our findings [44,45,52,53,54,55]. These results collectively demonstrate that ultra-sharp resolution and deep optical penetration can be achieved concurrently without sacrificing sample structural integrity through harvesting or traditional clearing.
From a practical standpoint, the experimental setup relies entirely on standard laboratory incubators without requiring specialized, high-cost instrumentation. This makes the methodology highly accessible and cost-effective for a wide range of research laboratories. Moreover, removing these technically demanding processing steps drastically compresses the experimental timeline, allowing researchers to generate high-volume, reliable data within a single day. Ultimately, establishing a highly standardized, reproducible experimental environment was the primary rationale for adopting this protocol, reinforcing its potential utility for high-throughput phenotypic screening and New Approach Methodologies (NAMs).
The primary goal of this study was to establish a definitive, practical troubleshooting guide designed to anticipate and resolve these common procedural failures using the WMIF method described in previous articles. To create the guide, we systematically introduced intentional deviations into this workflow. By modifying specific critical steps—such as fixation times, antibody titrations, incubation times and temperature—we simulated the experimental errors that scientists face in the laboratory.
To maximize the translational utility of this troubleshooting framework, we sought to standardize our methodology to yield highly reproducible protocols adaptable across diverse WMIF labeling platforms. To ensure broad accessibility, we selected two gold-standard cellular models: a lung organoid system and a liver cancer spheroid model. Both architectures are widely adopted within the scientific community, allowing readers to easily benchmark our findings against existing literature. This commitment to standardization extended to our selection of established, commercially validated extracellular matrices and widely cited antibodies. Furthermore, to eliminate chemical variability introduced by multi-component buffers, we implemented this streamlined workflow utilizing a single reagent throughout the entire experimental pipeline. This approach significantly reduces technical noise and provides a robust, standardized baseline for troubleshooting.
Drawing from our iterative experiments and hands-on experience with spheroid and organoid models, we present the summary of potential technical hurdles. It outlines the common challenges encountered during WMIF labeling, the underlying reasons for these obstacles, and the strategic solutions developed to ensure experimental success.
The results show that the absence or weakness of a specific signal is a common problem of imbalanced conditions. The following actions might solve the problem if the weak or absent staining is related to the antibodies used in the experiment:
i. Optimize antibody concentrations. Refer to the antibody datasheet for recommended dilutions. If necessary, increase the antibody concentrations. Optimize the protocol for your specific target and sample type.
ii. The subcellular location of the protein is critical. Due to their accessibility, membrane-bound proteins typically require shorter incubation periods. In contrast, nuclear targets necessitate extended durations for each procedural step to ensure the reagents effectively bypass cytoplasmic density and reach the nuclear matrix.
iii. Consider using a different batch of the antibody, antibody clone or host species. Avoiding repeated freeze–thaw cycles of antibodies is vital for maintaining epitope-binding stability and specific labeling. Proper storage of reagents and antibodies at required temperatures maintains their stability. The users should store the reagent and antibodies according to manufacturer guidelines to prevent degradation and avoid repeated freeze–thaw cycles by warming only the required amount for each experiment.
iv. Include appropriate positive and negative controls. Confirm that the primary antibody targets the protein of interest.
v. Ensure the secondary antibody is compatible with the host species of the primary antibody.
vi. Recheck the fixation time. Short-term fixation fails to stabilize epitopes, while over-fixation can mask them.
vii. Suboptimal results might also stem from restricted antibody access to the sample. We recommend increasing incubation times and employing gentle agitation (orbital shaker) to facilitate deep tissue penetration.
One of the most difficult challenges in whole-mount imaging is ensuring the center of a large organoid/spheroid is as well-labeled as the periphery. The quality of nuclear labeling is a reliable diagnostic tool. If nuclear staining is weak throughout the entire spheroid, the primary cause is likely fixation failure. However, if staining is bright at the periphery but weak only in the center, the issue is insufficient incubation time, preventing the reagents from reaching the core (Figure 15). This is also known as the “hollow-core” effect, where DAPI/Hoechst and specific protein stains are bright on the outside edge but weak or missing in the center. This artifact shows that while the chemical staining is working well on the surface, the reagents simply need more time to completely penetrate to the core of larger 3D structures (Figure 15). It can also mean that a short fixation time failed to properly fix the cells located deep in the center, blocking proper labeling. To resolve this, increasing the incubation times with the antibodies, rechecking if the fixation time was long enough, or both strategies are recommended. Without extending these treatment times, a researcher might look at a dark center and mistakenly conclude that the core is “dead” or contains no cells, simply because the nuclear stain could not reach it. Figure 15 proves that the cells are actually there; they were just left unlabeled. These results show that giving your antibodies and dyes enough time to diffuse is critical to avoid “false-negative” mistakes in the center of organoids and spheroids, ensuring your 3D images accurately show the true structural and metabolic state of the core.
Figure 15.
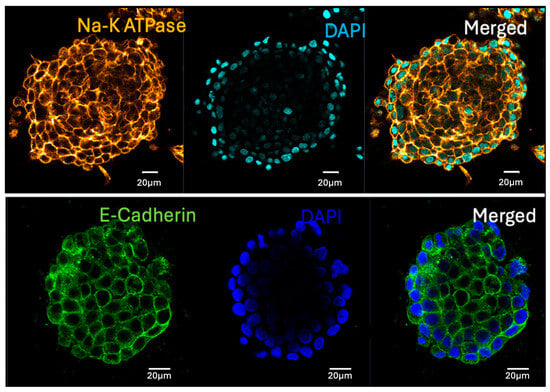
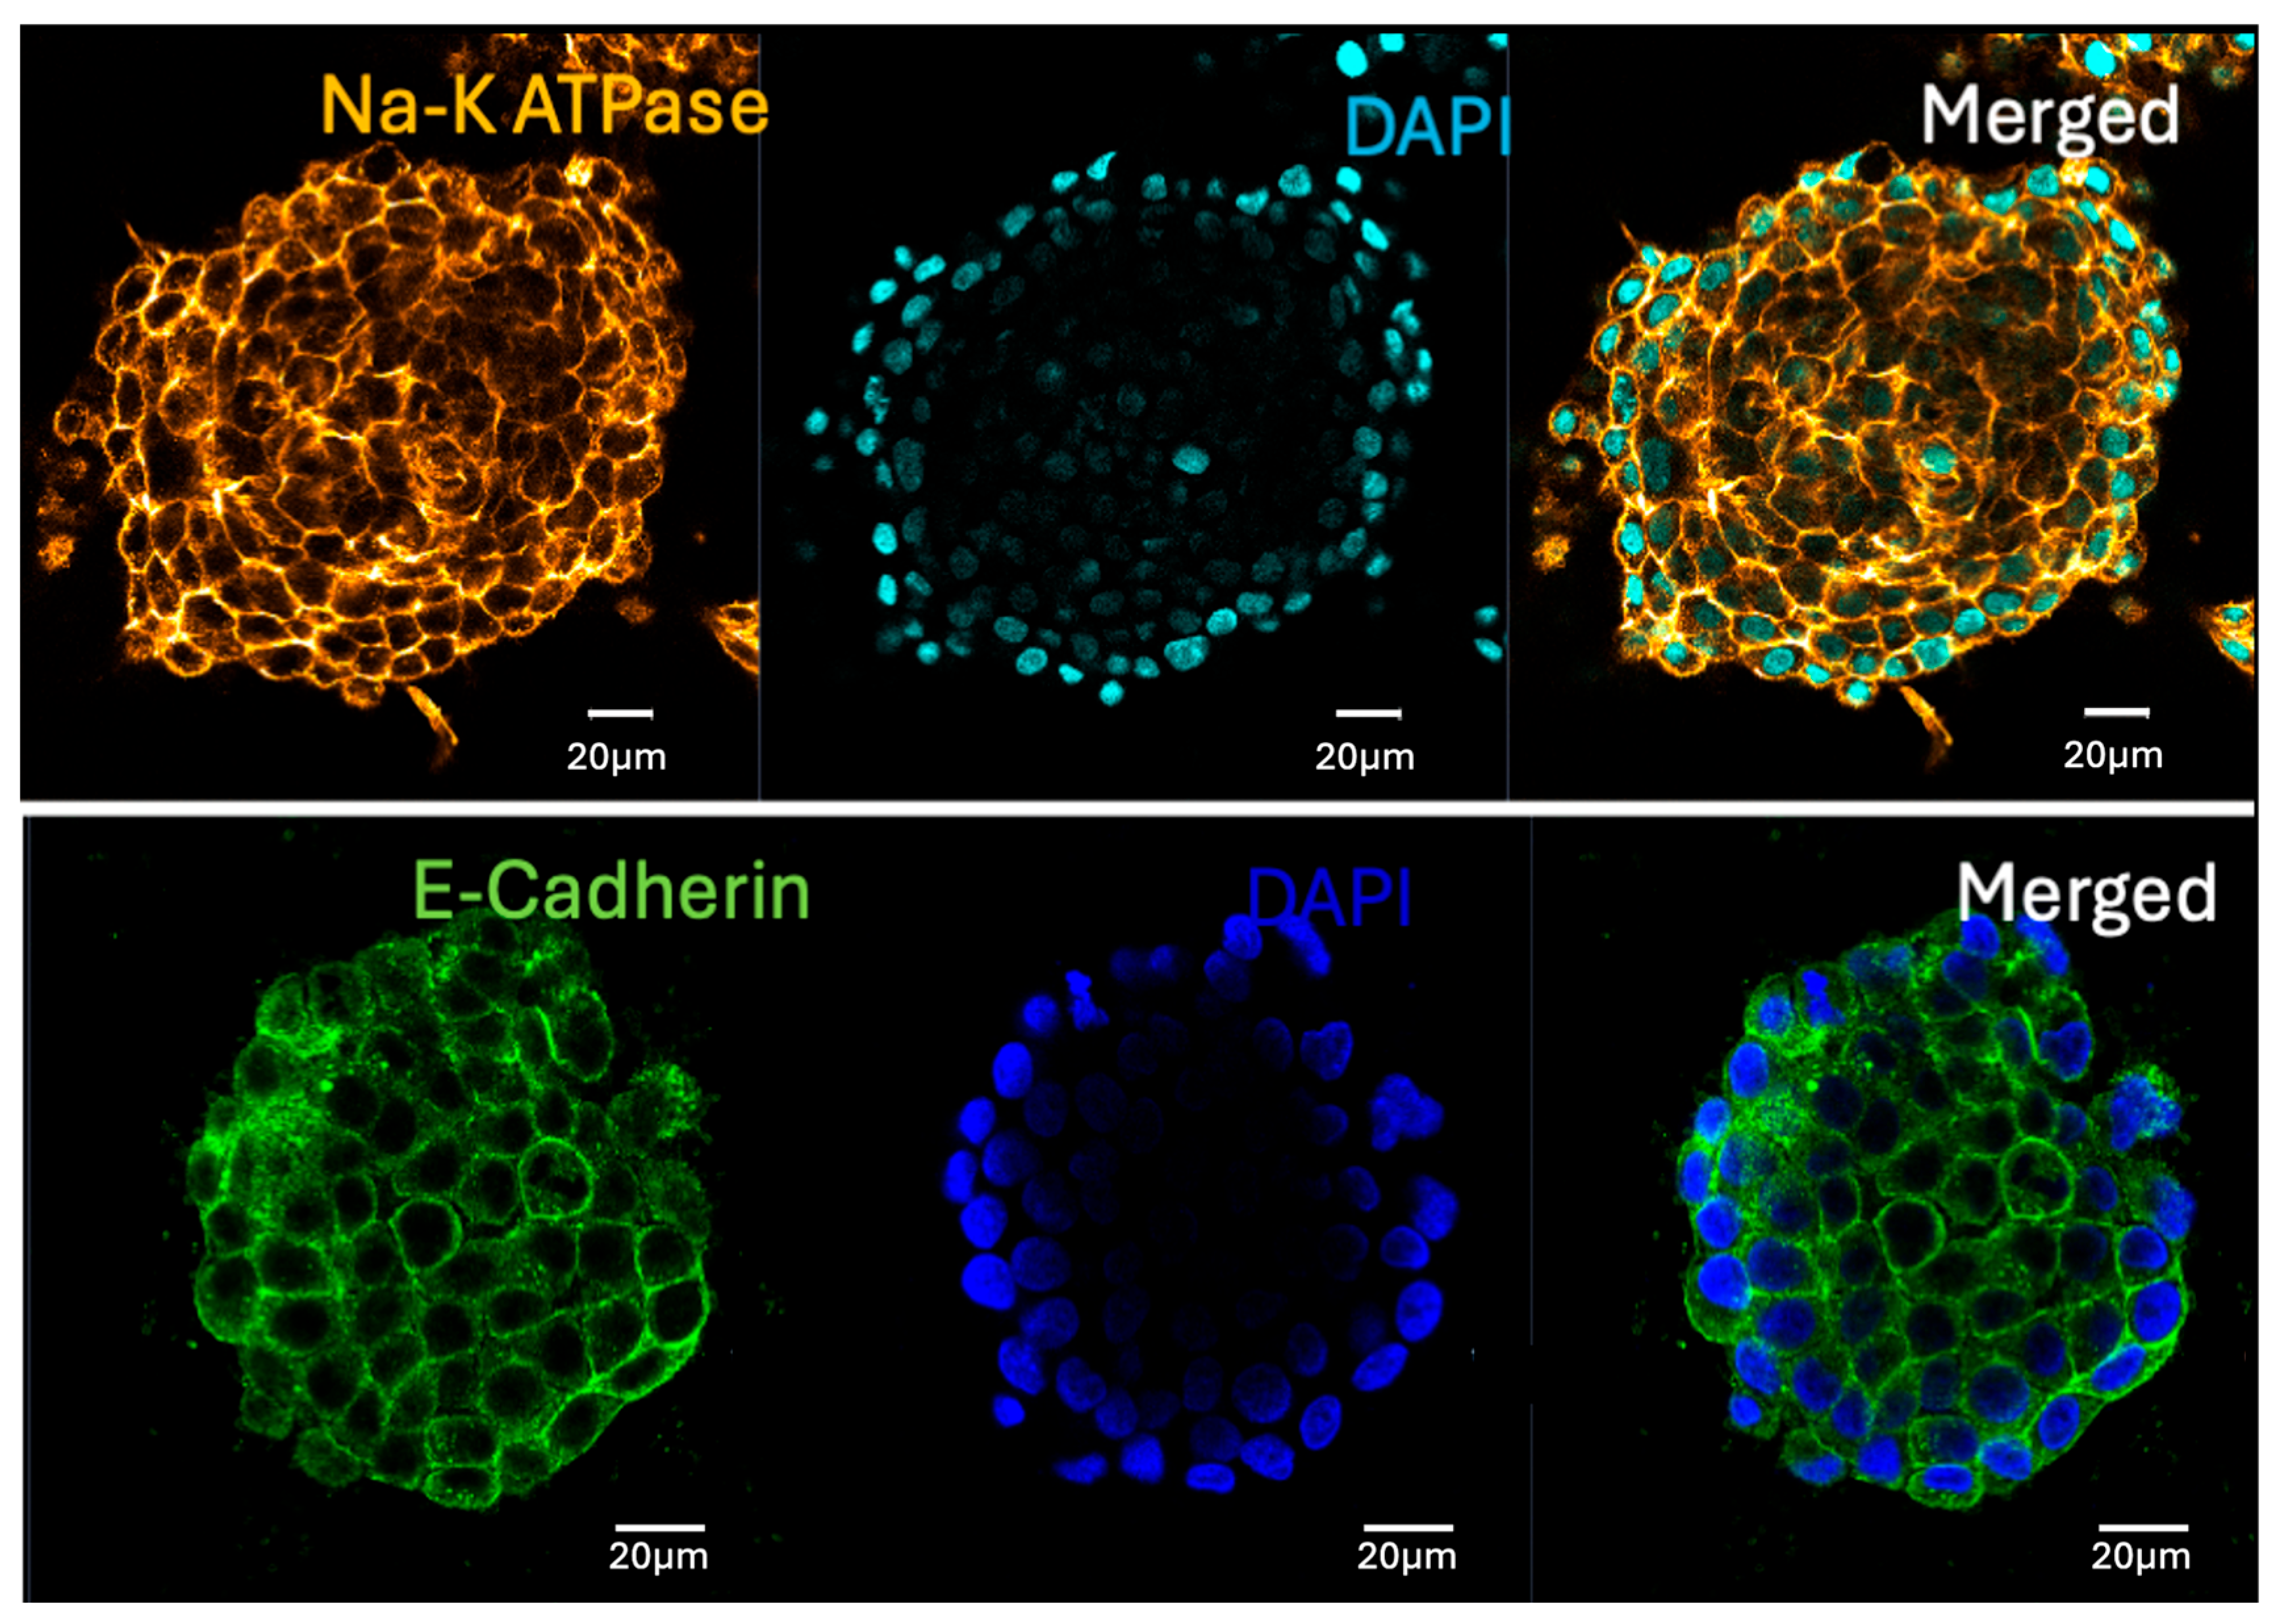
Representative confocal sections from two independent experiments illustrating the “hollow effect”—a common artifact in 3D immunofluorescence resulting from incomplete probe penetration. While DAPI staining (blue) is clear at the periphery of the liver cancer spheroids, there is a marked absence of signal toward the core. This lack of internal nuclear labeling confirms that the incubation times for DAPI in those experiments are insufficient for passive diffusion of the fluorochrome through the dense 3D cellular mass. In contrast, after applying an extended duration of treatment, successful labeling can be achieved throughout the entire volume. This is evidenced by the clear Na-K ATPase (gold/yellow) and E-Cadherin (green) expression in the cells located deep within the center of the spheroids.
It is also important to note that a stain appearing only at the edge or center might simply be due to the natural behavior of that protein.
Temperature consistency is another critical issue during labeling of the sample. Fluctuations can significantly alter staining quality.
Preventing the samples from drying out during staining is crucial to ensure proper antibody coverage and minimize non-specific binding; using an orbital shaker during these incubation steps can be highly helpful to maintain uniform coverage. Additionally, if a sample—such as a large organoid—is too close to the edge of the culture vessel, it can restrict fluid penetration and result in weak or inaccurate signals along those boundaries.
Since this protocol omits harvesting, maintaining the integrity of the extracellular matrix (ECM) is paramount. While immediate imaging is possible, we observed that delaying acquisition for 24 h might yield superior brightness in nuclear staining in thick hydrogel drops or large organoids or as it allows fluorophores to reach an optimal equilibrium within the dense nuclear matrix. Hydrogel thickness, droplet volume, and specific commercial matrix formulations might alter both nuclear stains and reagent penetration. Another issue is pre-warming reagents to 37 °C. This prevents the thermal shock that leads to hydrogel dissolution. Partial hydrogel dissolution can occasionally be used as a tool. Chilling the sample on ice for 2 min prior to starting the protocol loosens the matrix, potentially enhancing reagent access without compromising the overall 3D architecture. Therefore, we recommend that in this step especially, the user works with large hydrogel drops.
In summary, a critical outcome of this study is the establishment of a robust troubleshooting framework engineered to systematically resolve the most frequent technical hurdles encountered in 3D WMIF labeling workflows. By deliberately contrasting high- and low-quality imaging outcomes, this study visually documents the precise artifacts and procedural failures that researchers encounter in the laboratory. Because every 3D biological model presents unique architectural and biochemical properties, protocol optimization cannot rely on a one-size-fits-all approach. Rather, researchers must evaluate the experimental workflow as a holistic, interconnected system. By encouraging a methodical, step-by-step re-evaluation of each procedural phase, the framework presented herein provides a valuable diagnostic roadmap to resolve common bottlenecks in WMIF labeling, ultimately enhancing reproducibility and accelerating future discoveries in spatial biology and 3D-level imaging.
5. Technical Limitations and Future Directions
Our extensive testing revealed specific technical constraints:
Fixation: Most of the WMIF methods are optimized for fixation with 4% PFA (Paraformaldehyde). While 4% PFA remains the established global gold standard for preserving the structural and antigenic integrity of 3D cell culture models, it is important to note that the chemical kinetics of alternative fixation methods may vary.
Researchers utilizing specialized fixatives—such as Glutaraldehyde, which introduces higher autofluorescence and denser cross-linking, or Methanol, which acts via dehydration and protein precipitation—may encounter different diffusion profiles. While the core principles of the protocol remain applicable, these alternative fixation methods may necessitate additional optimization to ensure optimal reagent penetration and epitope accessibility within the 3D matrix. Future studies will expand this framework to include standardized parameters for these alternative chemical stabilizers.
Specimen Size and Density: Passive molecular diffusion rates of reagents used during WMIF labeling are naturally limited by the total size and cell density of the 3D structure. Previous publications have already shown that the current method successfully labels structures ranging from 50 to 1000 micron [41,44]. In this study, we also successfully labeled spheroids and organoids within a similar size range (Figure 1). Structures exceeding 1000 micron will require specialized, customized incubation times based on the density and size of the 3D model. As NAMs continue to evolve and generate larger, more complex tissue models, future studies will be necessary to optimize how solutions penetrate these macroscopic structures. This will ensure researchers can achieve the same high level of deep-tissue visualization that we show in our current 3D experiments.
Matrix Compatibility: Highly concentrated or opaque matrices (such as exceptionally opaque or hyper-cross-linked synthetic scaffolds) may interfere with the refractive index matching, potentially leading to light scattering at deeper planes. Unusual or highly dense synthetic matrices may restrict antibody diffusion. It should be noted that the texture of the hydrogel might affect the labeling quality and may result in increased background noise or light scattering at deeper focal planes. Further studies are needed to clarify optimal scaffold compositions and identify any underlying biochemical constraints. As the volume of publications increases, the findings will be helpful to define optimal scaffold architectures and mitigate potential biochemical interference.
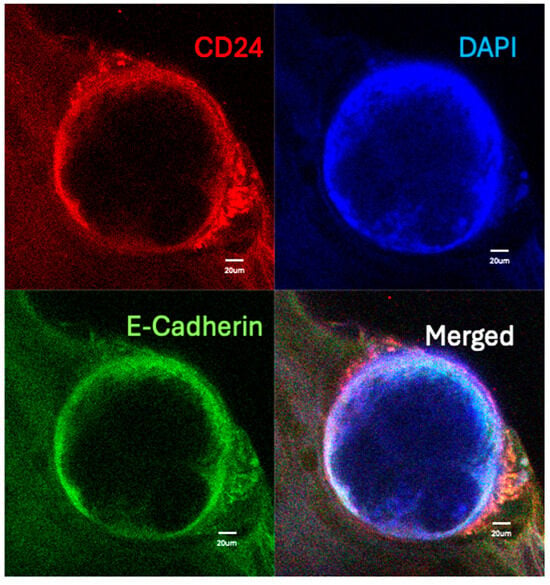
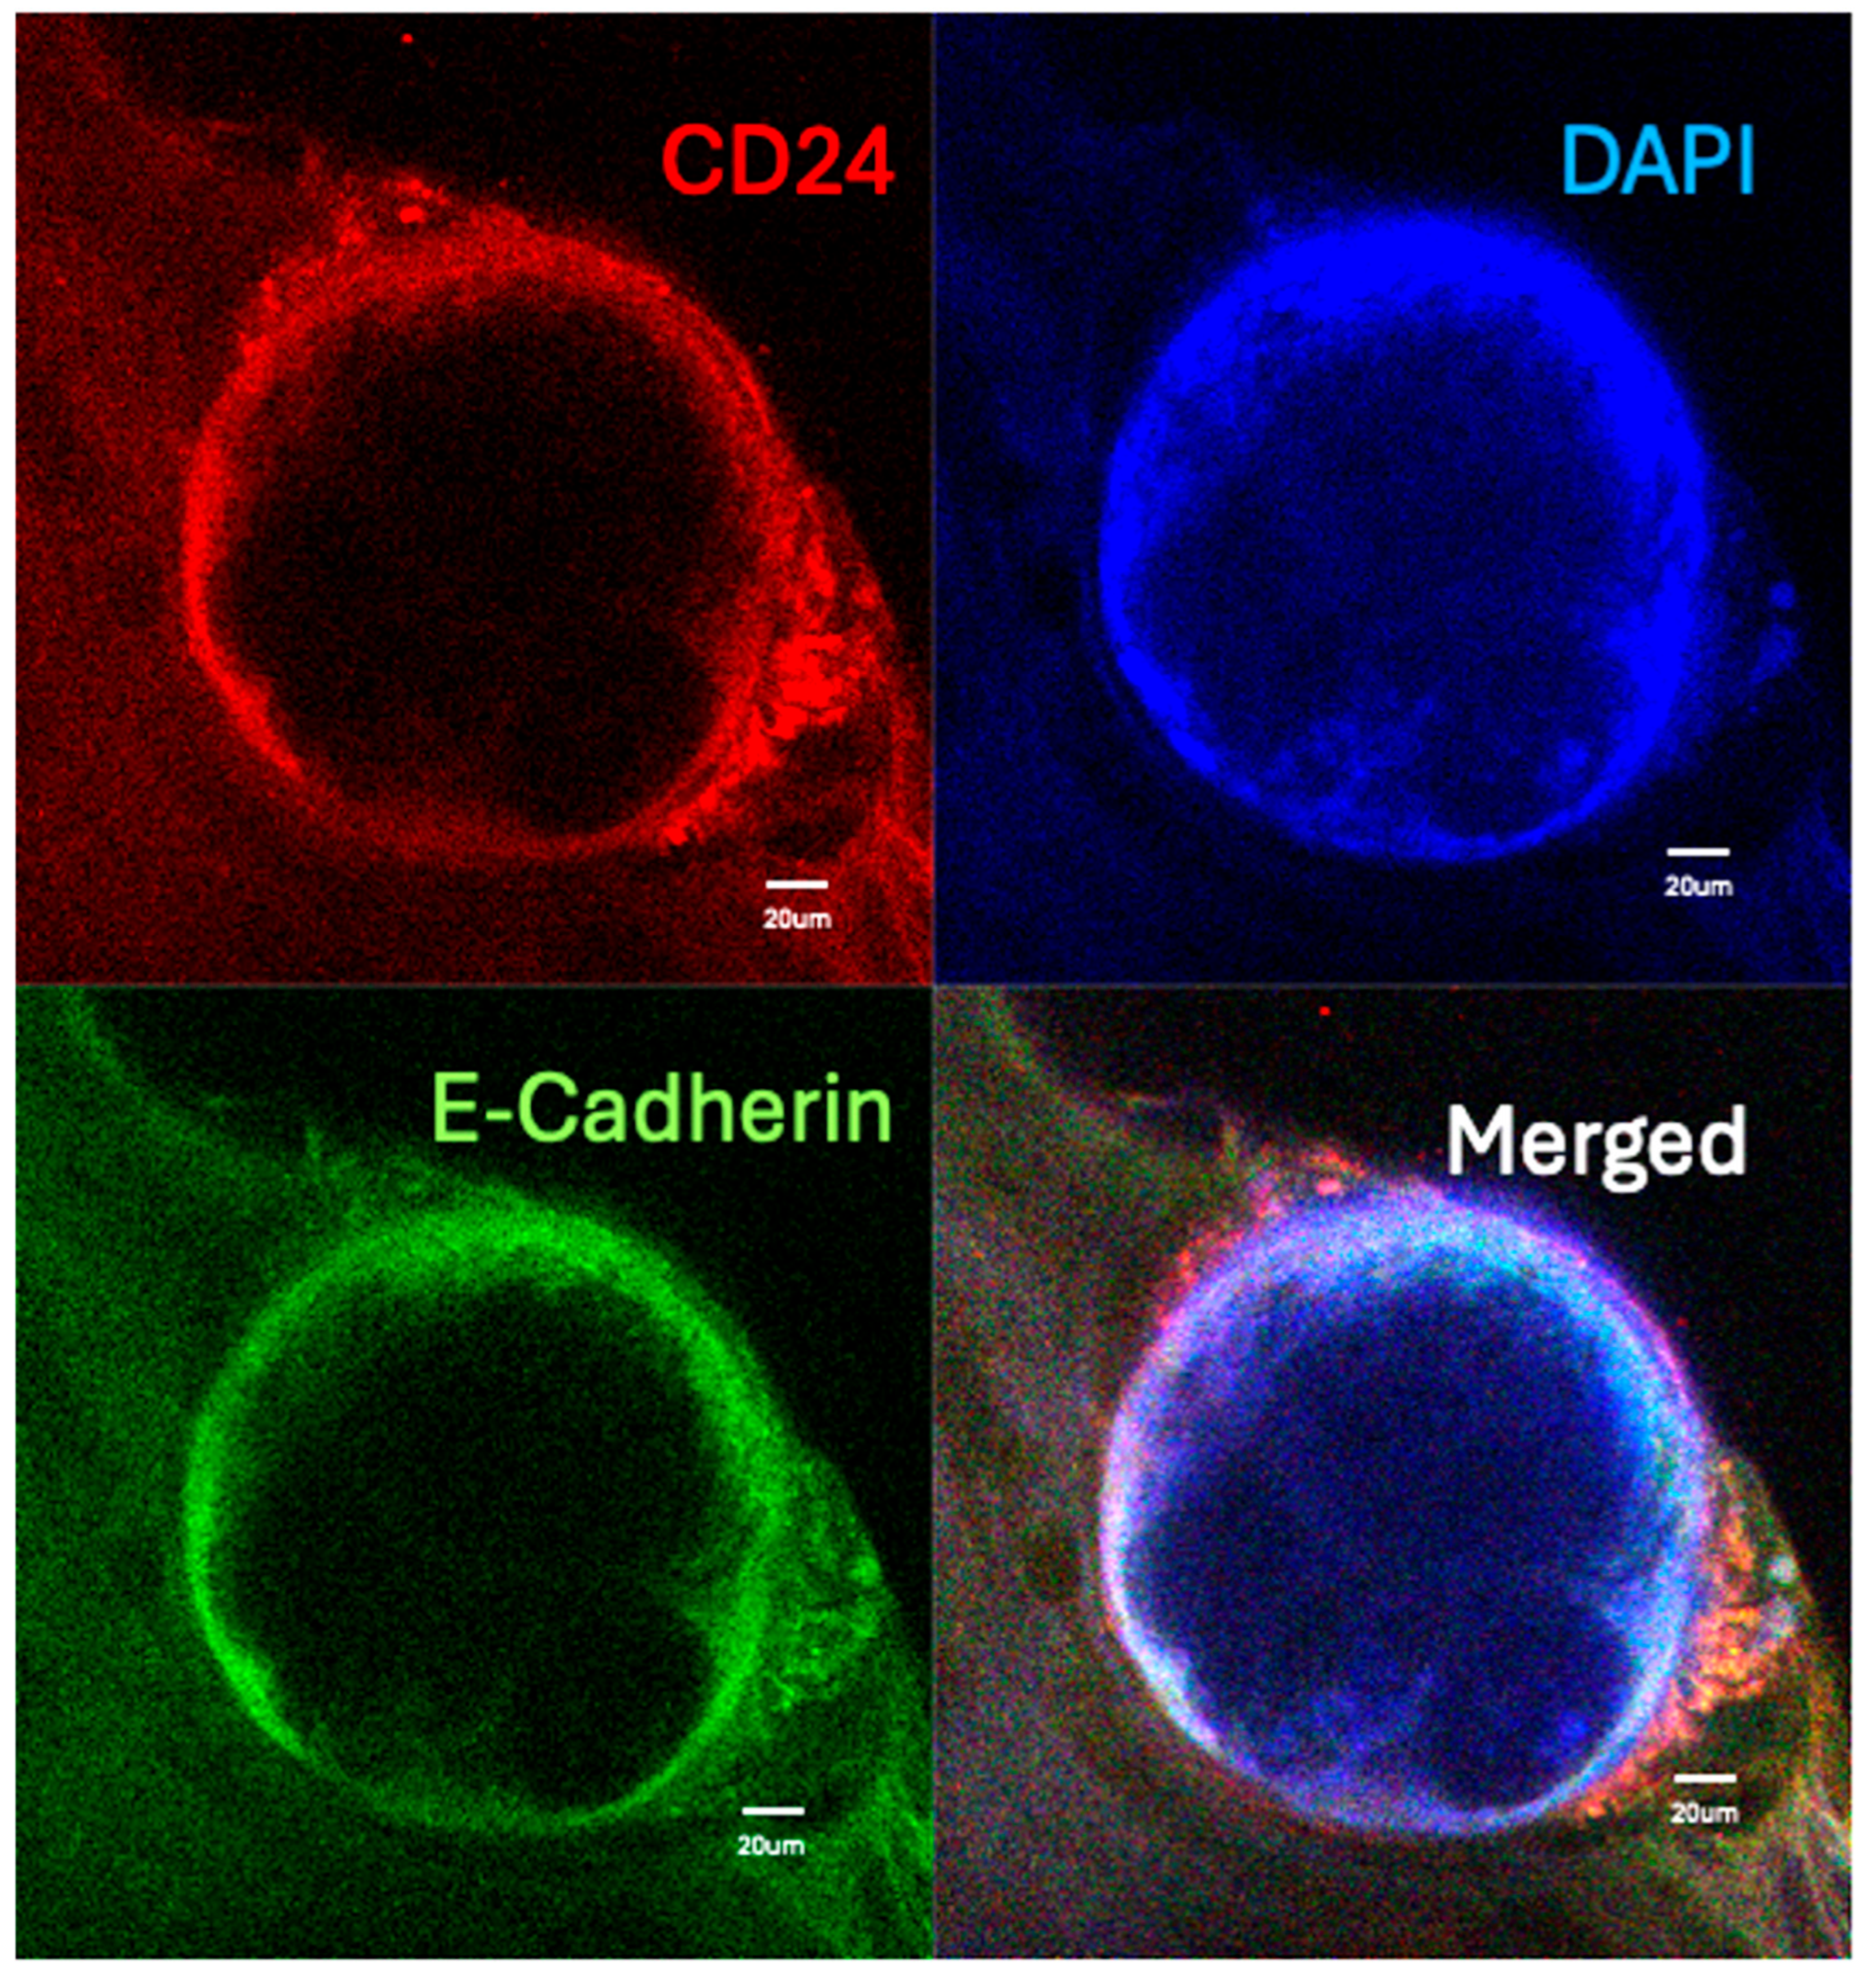
Antibody Compatibility: During our preliminary evaluations, certain proteins lacked robust literature or established reference data to confirm their baseline labeling patterns, and a complete absence of a specific signal was observed for several CD markers. This lack of detection likely stems from two distinct possibilities: either these specific markers are not biologically expressed in our experimental models, or the current protocol limits successful antibody delivery and labeling via this specific method. Certain epitopes may require individualized titration or specialized buffers to expose binding sites that the standardized solution may not fully reveal. When a definitive conclusion cannot be drawn from imaging alone and a targeted antibody yields no labeling within an intact 3D matrix, it is highly recommended to employ complementary orthogonal methods—such as Western blotting or RT-qPCR—to evaluate total protein and gene expression levels independent of spatial architecture. This allows investigators to verify baseline target expression before extensively troubleshooting the physical diffusion parameters of the imaging protocol.
Fluorophore Selection: Because this method eliminates traditional clearing steps to preserve the 3D architecture, the use of high-intensity, stable fluorophores is highly recommended. Standard or older-generation dyes may not provide sufficient signal-to-noise ratios when imaging through the thicker, unsectioned volumes of organoids/spheroids.
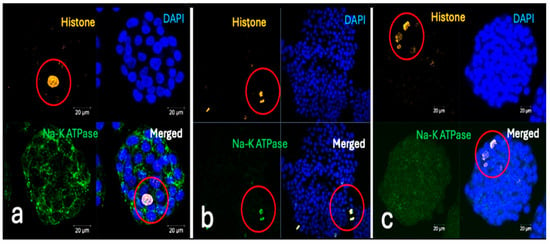
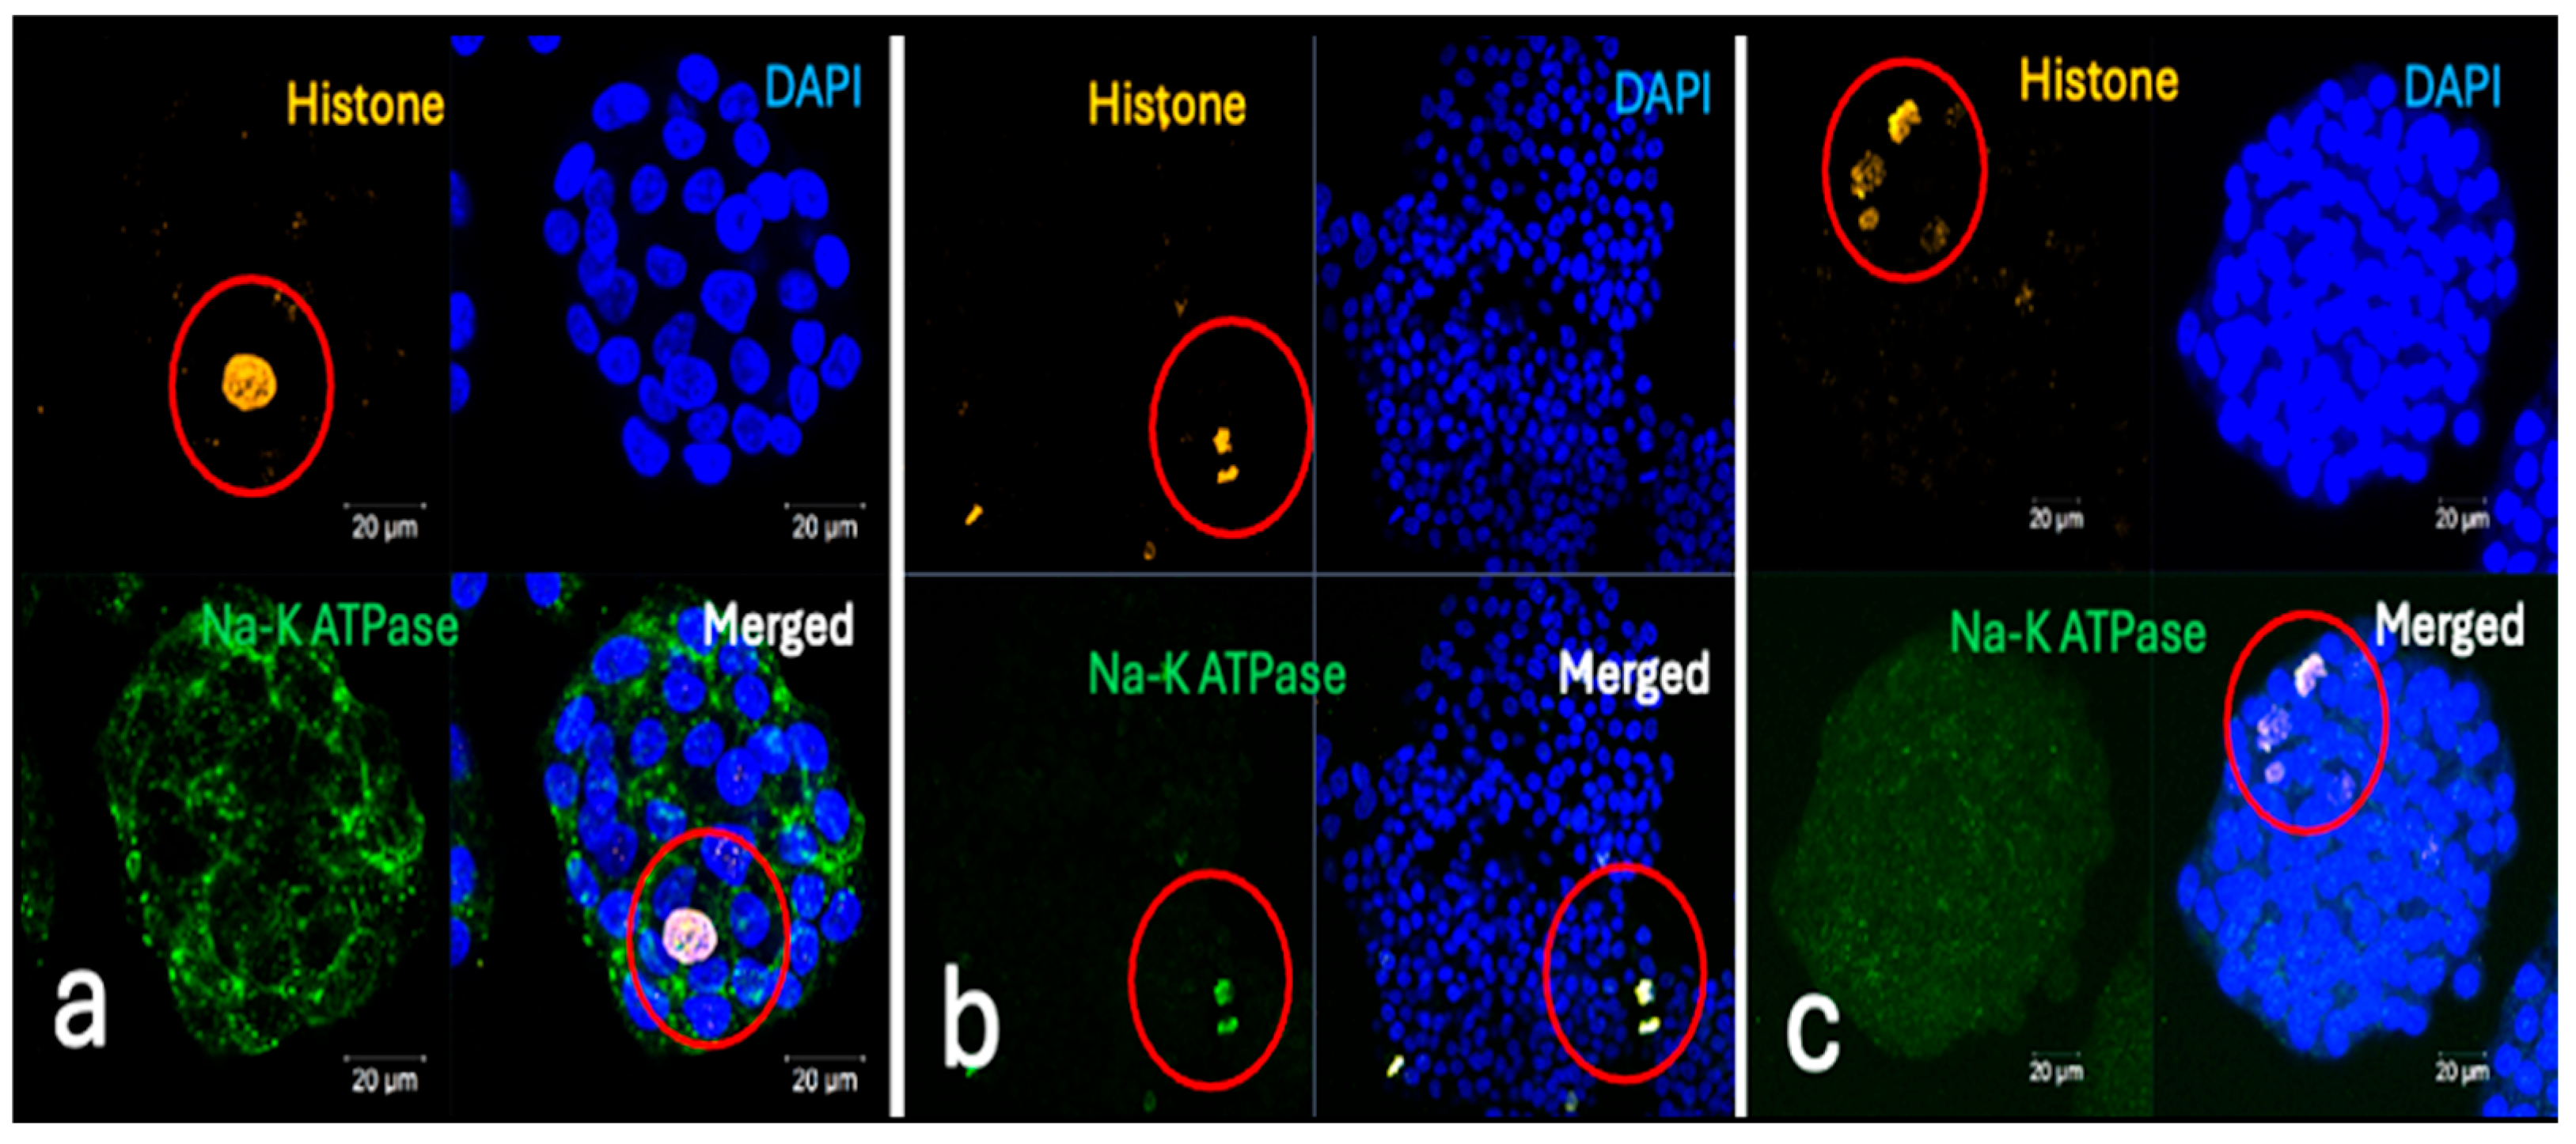
Challenges in Multiplexed Labeling: In our experiments, double labeling was highly successful using this new method. However, we found that triple-labeling can be more challenging to perform. As is common in imaging, using multiple labels simultaneously may be technically challenging because the colors of the fluorescent dyes can overlap (spectral overlap) (Figure 16). This requires careful selection and optimization of antibody combinations to ensure each one can be seen clearly. We have not yet tested the protocol with four different antibodies at the same time.
Figure 16.
Representative confocal micrographs from three independent double-labeling experiments demonstrating the spectrum of labeling outcomes during the optimization of the Na-K ATPase (membrane) and Histone (nucleus) co-staining protocol. (a) Validated Spatial Resolution (Optimal Results): The protocol successfully resolves distinct cellular compartments. Na-K ATPase (green) is localized exclusively to the cell membranes, while Histone (red; indicated by red circles) is precisely confined to the nuclei. This demonstrates a high signal-to-noise ratio and maintains structural fidelity within the dense 3D architecture. (b) Signal Overlap and Spectral Interference: A suboptimal outcome characterized by a lack of compartmental specificity. A nearly identical staining pattern is observed for both antibodies (red circles), resulting in complete signal overlap. This suggests technical artifacts such as insufficient washing of primary/secondary antibodies, cross-reactivity, or spectral bleed-through, which obscure the distinction between membrane and nuclear boundaries. (c) Differential Antibody Penetration and Epitope Masking: This panel illustrates a failure in membrane labeling despite successful nuclear access. While Histone effectively labels the nuclei of internal cells (red circles), there is no specific labeling for Na-K ATPase. This indicates that while the nuclear epitopes remained accessible, the membrane-bound epitopes may have been masked by over-fixation or compromised during the permeabilization phase.
While the current study validates the high fidelity of double- and triple-staining, the simultaneous multiplexing of four or more protein targets remains a primary objective for subsequent technical iterations.
Autofluorescence: Since the protocol is bypassing the harsh bleaching or extensive washing steps, highly pigmented tissues (like those with high melanin) might retain some background autofluorescence.
Because every 3D biological model presents unique structural and chemical traits, these technical constraints underscore that the experiments and the workflows must be viewed as an interconnected system rather than a rigid, one-size-fits-all protocol.
6. Conclusions
To provide researchers with real-time problem-solving capabilities, we have compiled our experimental ‘limit tests’ and methodological solutions into this comprehensive study. This work serves as a visual and technical benchmark for identifying common procedural errors. By documenting specific failure modes, this framework allows users to easily match poor imaging results with exact mistakes made during fixation, washing, or incubation steps. In summary, this analysis identifies critical challenges and provides practical, actionable solutions for 3D whole-mount immunofluorescence labeling studies, supporting the consistent phenotypic validation of NAMs.
Supplementary Materials
The following supporting information can be downloaded at https://www.mdpi.com/article/10.3390/organoids5030021/s1: Video S1: Spatial Distribution of Alpha-Fetoprotein (AFP) in Liver Cancer Spheroid. Three-dimensional reconstruction of a liver cancer spheroid following whole-mount immunofluorescence labeling; Video S2: Spatial Distribution of Histone and ZO-1 in Liver Cancer Spheroids; Figure S1. Immunofluorescence labeling of 2D HepG2 cell cultures. (A–F) Two-dimensional (2D) growing HepG2 cells labeled with the respective 24 antibodies listed in Table 1; nuclei were counterstained with DAPI as a control. Figure S2. Expression profiling of the 12 target proteins listed in Table 1 across standard experimental conditions in 3D cell culture models. (A–C) Nuclei were counterstained with DAPI (blue) for visualization.
Author Contributions
Conceptualization, R.G.A.; Data curation, R.G.A., O.E.T. and G.D.; Formal analysis, R.G.A. O.E.T., G.D. and O.K.; Funding acquisition, R.G.A., O.E.T., H.B. and O.K.; Investigation, R.G.A., O.E.T., G.D., O.K., N.K. and H.B.; Methodology, R.G.A.,O.E.T. G.D., O.K. and N.K.; Project administration, R.G.A. and O.E.T.; Resources, R.G.A., O.E.T., O.K., N.K. and H.B. Supervision, R.G.A.; Validation, R.G.A., O.E.T., G.D., O.K., N.K. and H.B. Writing—original draft, R.G.A. and O.E.T.; Writing—review and editing, R.G.A., O.E.T., G.D., O.K., N.K. and H.B. All authors have read and agreed to the published version of the manuscript.
Funding
This research received no external funding. The authors gratefully acknowledge Istanbul Medipol University, Koç University, and Maltepe University for providing the laboratory space and equipment necessary to conduct these experiments.
Data Availability Statement
The airway organoids were generated at Koc University, while spheroids were generated at Maltepe University. Immunofluorescence labeling experiments and the data supporting the findings of this study were generated at the laboratories of Medipol University and Maltepe University. Raw data are available from the corresponding author [R.G.A.] upon reasonable request.
Conflicts of Interest
CellO-IF3 and CellO-M used for the research in this publication are the subject of the following patent applications owned by R.G.A.: PCT/TR2024/050763 and PCT/TR2021/05111, 18/555,046-21963442.5. R.G.A. is the scientific founder of Cellorama LLC. O.E.T and G.D have performed R&D studies for Cellorama LLC. The remaining authors have no conflicts of interest to declare.
References
- Baker, B.M.; Chen, C.S. Deconstructing the third dimension-how 3D culture microenvironments alter cellular cues. J. Cell Sci. 2012, 125, 3015–3024. [Google Scholar] [PubMed]
- Herms, A.; Fernandez-Antoran, D.; Alcolea, M.P.; Kalogeropoulou, A.; Banerjee, U.; Piedrafita, P.; Abby, E.; Valverde-Lopez, J.A.; Ferreira, I.S.; Caseda, I.; et al. Self-sustaining long-term 3D epithelioid cultures reveal drivers of clonal expansion in esophageal epithelium. Nat. Genet. 2024, 56, 2158–2173. [Google Scholar] [PubMed]
- Wang, Z.; Wang, J.; Zhao, Y.; Jin, J.; Si, W.; Chen, L.; Zhang, M.; Zhou, Y.; Mao, S.; Zheng, C.; et al. 3D live imaging and phenotyping of CAR-T cell mediated-cytotoxicity using high-throughput Bessel oblique plane microscopy. Nat. Commun. 2024, 15, 6677. [Google Scholar] [PubMed]
- Harane, S.E.; Zidi, B.; Harane, N.E.; Krause, K.H.; Matthes, T.; Preynat-Seauve, O. Cancer Spheroids and Organoids as Novel Tools for Research and Therapy: State of the Art and Challenges to Guide Precision Medicine. Cells 2023, 12, 1001. [Google Scholar] [CrossRef] [Scilit] [PubMed]
- Ohguro, H.; Watanabe, M.; Sato, T.; Nishikiori, N.; Umetsu, A.; Higashide, M.; Yano, T.; Suzuki, H.; Miyazaki, A.; Takada, K.; et al. Application of Single Cell Type-Derived Spheroids Generated by Using a Hanging Drop Culture Technique in Various In Vitro Disease Models: A Narrow Review. Cells 2024, 13, 1549. [Google Scholar] [CrossRef] [Scilit] [PubMed]
- Roman, V.; Mihaila, M.; Radu, N.; Marineata, S.; Diaconu, C.C.; Bostan, M. Cell Culture Model Evolution and Its Impact on Improving Therapy Efficiency in Lung Cancer. Cancers 2023, 15, 4996. [Google Scholar] [CrossRef] [Scilit] [PubMed]
- Ahluwalia, A.; Fletemeyer, B.; Chirico, G.; Elezovic, A.; Neuhaus, W.; Smith, A.J.; Bajramovic, J.J.; Wilfingseder, A. What’s in a NAM? Lab Anim. 2026, 55, 1–6. [Google Scholar] [CrossRef] [Scilit] [PubMed]
- Khan, F.; Verma, P.; Singh, A.; Kumar, M.; Gupta, J.; Patel, G.K.; Singh, S.; Kumar, V.; Yadav, A.K.; Verma, V. Next-Generation In Vitro Pulmonary Platforms for Respiratory Disease Modelling and Therapeutic Development: Current Advances and Future Prospects. Medicina 2026, 62, 859. [Google Scholar] [CrossRef] [Scilit] [PubMed]
- Sani, J.; Yi, B.; Xi, Y. The Organoid Decade: Leveraging 3D Patient-Derived Organoids to Bridge the Translational Gap in Triple-Negative Breast Cancer: A Systematic Review. Cells 2026, 15, 922. [Google Scholar] [CrossRef] [Scilit] [PubMed]
- Airola, C.; Pallozzi, M.; Cesari, E.; Cerrito, L.; Stella, L.; Sette, C.; Giuliante, F.; Gasbarrini, A.; Ponziani, F.R. Hepatocellular-Carcinoma-Derived Organoids: Innovation in Cancer Research. Cells 2024, 13, 1726. [Google Scholar] [CrossRef] [Scilit] [PubMed]
- Mou, X.; Dale, N.; Ramnarine, K.; Cipriani, F. Automated stem cell-derived organoid platforms for disease modeling. Trends Biotechnol. 2026, 44. [Google Scholar] [CrossRef] [Scilit] [PubMed]
- Melanthota, S.K.; Gopal, D.; Chakrabarti, S.; Kashyap, A.A.; Radhakrishnan, R.; Mazumder, N. Deep learning-based image processing in optical microscopy. Biophys. Rev. 2022, 14, 463–481. [Google Scholar] [CrossRef] [Scilit] [PubMed] [PubMed Central]
- Moon, I.; Javidi, B. AI-driven digital holographic microscopy for label-free quantitative cellular analysis: Toward low-cost and field-deployable platforms. Biomed. Opt. Express 2026, 17, 2349–2370. [Google Scholar] [CrossRef] [Scilit] [PubMed]
- Luo, X.; Chen, M.; Shan, H.; Yu, X.; Lin, Q.; Tao, Q.; Wei, X.; Lv, C.; Chen, Z.; Zhuo, F.; et al. Label-Free 3D Photoacoustic Imaging of Tumor Organoids for Volumetric Drug Screening. Adv. Sci. 2025, 12, e17226. [Google Scholar] [CrossRef] [Scilit] [PubMed] [PubMed Central]
- Serafini, C.; Charles, S.; Casteleiro Costa, P. Non-invasive label-free imaging analysis pipeline for in situ characterization of 3D brain organoids. Sci. Rep. 2024, 14, 22331. [Google Scholar] [CrossRef] [Scilit] [PubMed]
- Kok, R.; Spoelstra, W.; Betjes, M.; van Zon, J.S.; Tans, S.J. Label-free cell imaging and tracking in 3D organoids. Cell Rep. Phys. Sci. 2025, 6, 102522. [Google Scholar] [CrossRef] [Scilit]
- Rouède, D.; Schaub, E.; Bellanger, J.J. Determination of extracellular matrix collagen fibril architectures and pathological remodeling by polarization dependent second harmonic microscopy. Sci. Rep. 2017, 7, 12197. [Google Scholar] [CrossRef] [Scilit] [PubMed]
- Zoumi, A.; Tromberg, B.J.A. Imaging cells and extracellular matrix in vivo by using second-harmonic generation and two-photon excited fluorescence. Proc. Natl. Acad. Sci. USA 2002, 99, 11014–11019. [Google Scholar] [CrossRef] [Scilit] [PubMed]
- Bergdorf, K.N.; Phifer, C.J.; Bechard, M.; Lee, M.A.; McDonald, O.G.; Lee, E.; Weiss, V.L. Immunofluorescent staining of cancer spheroids and fine-needle aspiration-derived organoids. STAR Protoc. 2021, 2, 100578. [Google Scholar] [CrossRef] [Scilit] [PubMed]
- Masselink, W.; Reumann, D.; Murawala, P.; Pasierbek, P.; Taniguchi, Y.; Bonnay, F.; Meixner, K.; Knoblich, J.A.; Tanaka, E.M. Broad applicability of a streamlined ethyl cinnamate-based clearing procedure. Development 2019, 146, dev166884. [Google Scholar] [CrossRef] [Scilit] [PubMed]
- Dekkers, J.F.; Alieva, M.; Wellens, L.M.; Ariese, H.C.R.; Jamieson, P.R.; Vonk, A.M.; Amatngalim, G.D.; Hu, H.; Oost, K.C.; Snippert, H.J.G.; et al. High-resolution 3D imaging of fixed and cleared organoids. Nat. Protoc. 2019, 14, 1756–1771. [Google Scholar] [CrossRef] [Scilit] [PubMed]
- Renner, H.; Otto, M.; Grabos, M.; Schöler, H.R.; Bruder, J.M. Fluorescence-based single-cell analysis of whole-mount-stained and cleared microtissues and organoids for high throughput screening. Bio Protoc. 2021, 11, e4050. [Google Scholar] [CrossRef] [Scilit] [PubMed]
- van Biljon, L.; Fashemi, B.; Rodriguez, J.; Graham, O.; Compadre, A.; Fuh, K.; Khabele, D.; Mullen, M. Visualizing DNA Damage Repair Proteins in Patient-Derived Ovarian Cancer Organoids via Immunofluorescence Assays. J. Vis. Exp. 2023, 192. [Google Scholar] [CrossRef] [Scilit] [PubMed] [PubMed Central]
- Martinez-Ordoñez, A.; Cid-Diaz, T.; Duran, A.; Han, Q.; Moscat, J.; Diaz-Meco, M.T. Whole-mount staining of mouse colorectal cancer organoids and fibroblast-organoid co-cultures. STAR Protoc. 2023, 4, 102243. [Google Scholar] [CrossRef] [Scilit] [PubMed]
- Genenger, B.; McAlary, L.; Perry, J.R.; Ashford, B.; Ranson, M. Protocol for the generation and automated confocal imaging of whole multi-cellular tumor spheroids. STAR Protoc. 2023, 4, 102331. [Google Scholar] [CrossRef] [Scilit] [PubMed] [PubMed Central]
- Beşikcioğlu, H.E.; Yurteri, Ü.; Ye, L.; Zhang, F.; Moretti, A.; Gürcinar, I.H.; Dogruöz, A.; Karakas, D.; Friess, H.; Ceyhan, G.O.; et al. Protocol for whole-mount immunofluorescence staining of ECM gel-embedded innervated pancreatic organoids. STAR Protoc. 2024, 5, 103132. [Google Scholar] [CrossRef] [Scilit] [PubMed] [PubMed Central]
- Haspels, B.; Kuijten, M.M.P. Protocol for formation, staining, and imaging of 3D breast cancer models using MicroTissues mold systems. STAR Protoc. 2024, 5, 103250. [Google Scholar] [CrossRef] [Scilit] [PubMed] [PubMed Central]
- Gonzalez, A.L.; Luciana, L.; Le Nevé, C.; Valantin, J.; Francols, L.; Gadot, N.; Vanbelle, C.; Davignon, L.; Broutier, L. Staining and High-Resolution Imaging of Three-Dimensional Organoid and Spheroid Models. J. Vis. Exp. 2021, 169, 1–16. [Google Scholar] [CrossRef] [Scilit] [PubMed]
- Weiswald, L.B.; Guinebretière, J.M.; Richon, S.; Bellet, D.; Saubaméa; Dangles-Marie, V. In situ protein expression in tumour spheres: Development of an immunostaining protocol for confocal microscopy. BMC Cancer 2010, 10, 106. [Google Scholar] [CrossRef] [Scilit] [PubMed] [PubMed Central]
- Alve, S.; Gramolelli, S.; Ojala, P.M. An Approach to Study Melanoma Invasion and Crosstalk with Lymphatic Endothelial Cell Spheroids in 3D Using Immunofluorescence. Methods Mol. Biol. 2021, 2265, 141–154. [Google Scholar] [CrossRef] [Scilit] [PubMed]
- Charlet-Faure, C.; Thulesen, A.P.; Rogowska-Wrzesinska, A. Advancements in 3D spheroid imaging: Optimised cryosectioning and immunostaining techniques. MethodsX 2023, 11, 102415. [Google Scholar] [CrossRef] [Scilit] [PubMed] [PubMed Central]
- Wrzesinski, K.; Frandsen, H.S.; Calitz, C.; Gouws, C.; Korzeniowska, B.; Fey, S.J. Clinostat 3D Cell Culture: Protocols for the Preparation and Functional Analysis of Highly Reproducible, Large, Uniform Spheroids and Organoids. Methods Mol. Biol. 2021, 2273, 17–62. [Google Scholar] [CrossRef] [Scilit] [PubMed]
- Sharpe, B.; Nazlamova, L.; Johnston, D.; Fenton, T. Patient-derived tumor organoid and fibroblast assembloid models for interrogation of the tumor microenvironment in esophageal adenocarcinoma. Cell Rep. Methods 2024, 4, 100909. [Google Scholar] [CrossRef] [Scilit] [PubMed]
- Kim, K.; Lee, K.; Kang, T. A novel protein-preserving passive tissue clearing approach using sodium cholate and urea for whole-organ imaging. Exp. Mol. Med. 2025, 57, 2292–2304. [Google Scholar] [CrossRef] [Scilit] [PubMed]
- Brenna, C.; Simioni, C.; Varano, G.; Conti, I.; Costanzi, E.; Melloni, M.; Neri, L.M. Optical tissue clearing associated with 3D imaging: Application in preclinical and clinical studies. Histochem. Cell Biol. 2022, 157, 497–511. [Google Scholar] [CrossRef] [Scilit] [PubMed] [PubMed Central]
- Demirel, G.; Tok, O.E.; Aktas, R.G. A Simplified and Robust Immunofluorescence Labeling Method for Complex 3D Cell Cultures: Minimizing Manipulation and Maximizing Data in Whole-Mount Analysis of Organoids, Spheroids, and Co-culture Models. In Organoids; Turksen, K., Ed.; Methods in Molecular Biology; Humana: New York, NY, USA, 2025; Volume 2951. [Google Scholar] [CrossRef] [Scilit] [PubMed]
- Tok, O.E.; Demirel, G.; Saatci, Y.; Akbulut, Z.; Kayalar, O.; Aktas, R.G. Culturing, Freezing, Processing, and Imaging of Entire Organoids and Spheroids While Still in a Hydrogel. J. Vis. Exp. 2022, 190, e64563. [Google Scholar] [CrossRef] [Scilit] [PubMed]
- Cunquero, M.; Isla-Magrané, H.; Marsal, M.; Zufiaurre-Seijo, M.; García-Arumí, J.; Zapata, M.Á.; Duarri, A.; Loza-Alvarez, P. Whole-mount Retinal Organoid Visualization with Cellular Resolution. J. Vis. Exp. 2025, 220, e68384. [Google Scholar] [CrossRef] [Scilit] [PubMed]
- Rezanejad, H.; Lock, J.H.; Sullivan, B.A.; Bonner-Weir, S. Generation of Pancreatic Ductal Organoids and Whole-Mount Immunostaining of Intact Organoids. Curr. Protoc. Cell Biol. 2019, 83, e82. [Google Scholar] [CrossRef] [Scilit] [PubMed]
- Blaauw, M.A. Optimizing Fluorescent Immunostaining for Retinal Organoids. Bachelor’s Thesis, University of Twente, Enschede, The Netherlands, 2024. [Google Scholar]
- Roncato, F.; Regev, O.; Feigelson, S.W.; Yadav, S.K.; Kaczmarczyk, L.; Levi, N.; Drago-Garcia, D.; Ovadia, S.; Kizner, M.; Addadi, Y.; et al. Reduced Lamin A/C Does Not Facilitate Cancer Cell Transendothelial Migration but Compromises Lung Metastasis. Cancers 2021, 13, 2383. [Google Scholar] [CrossRef] [Scilit] [PubMed] [PubMed Central]
- Jeon, S.; Park, C.S.; Hong, J.; Kim, J.; Lee, Y.J.; Hur, J.K.; Lee, J.Y. Patient-Derived Cortical Organoids Reveal Senescence of Neural Progenitor Cells in Hutchinson-Gilford Progeria Syndrome. Aging Cell 2025, 24, e70143. [Google Scholar] [CrossRef] [Scilit] [PubMed]
- Foglini, C.; Scotlandi, K.; Pasello, M. Lamin A/C as a Molecular Link Between Nuclear Organization, Chromatin Dynamics, and Tumor Progression. Cells 2026, 15, 501. [Google Scholar] [CrossRef] [Scilit] [PubMed]
- Fatehullah, A.; Appleton, P.L.; Näthke, I.S. Cell and tissue polarity in the intestinal tract during tumourigenesis: Cells still know the right way up, but tissue organization is lost. Philos. Trans. R. Soc. Lond. B Biol. Sci. 2013, 368, 20130014. [Google Scholar] [CrossRef] [Scilit] [PubMed]
- Silva, C.I.; Gonçalves-de-Albuquerque, C.F.; de Moraes, B.P.T.; Garcia, D.G.; Burth, P. Na/K-ATPase: Their role in cell adhesion and migration in cancer. Biochimie 2021, 185, 1–8. [Google Scholar] [CrossRef] [Scilit] [PubMed]
- Demirel, G.; Cakıl, Y.D.; Koltuk, G.; Aktas, R.G.; Caliskan, M. The use of hyaluronic acid in a 3D biomimetic scaffold supports spheroid formation and the culture of cancer stem cells. Sci. Rep. 2024, 14, 19560. [Google Scholar] [CrossRef] [Scilit] [PubMed]
- Demirel, G.; Kaya, C.; Aktas, R.G. Sucrose fuels liver cancer cell growth and spheroid formation: New insights from 2D and 3D cell culture models. Med. Int. 2026, 6, 27. [Google Scholar] [CrossRef] [Scilit] [PubMed]
- Baker, J.S.; Joseph, N.I.; Lao, A.; Vlassakis, J. Single-Cell Protein Assays in Context: From 2D to 3D and In Situ Analysis. Annu. Rev. Anal. Chem. 2026, 19, 95–120. [Google Scholar] [CrossRef] [Scilit] [PubMed] [PubMed Central]
- Groeneveld, K.; Mrowka, R. Combining Proteomics and Organoid Research to Unravel the Multifunctional Complexity of Kidney Physiology Enhances the Need for Controlled Organoid Maturation. Organoids 2025, 4, 28. [Google Scholar] [CrossRef] [Scilit]
- Wang, M.; Yu, H.; Zhang, T.; Cao, L.; Du, Y.; Xie, Y.; Ji, J.; We, J. In-Depth Comparison of Matrigel Dissolving Methods on Proteomic Profiling of Organoids. Mol. Cell. Proteom. 2022, 21, 100181. [Google Scholar] [CrossRef] [Scilit] [PubMed] [PubMed Central]
- Tratnjek, L.; Janev, A.; Resnik, N.; Cerkvenik, U.; Kreft, M.E. Integrated light and electron microscopy workflow for morphological, molecular and ultrastructural analysis of spheroids. PLoS ONE 2026, 21, e0342659. [Google Scholar] [CrossRef] [Scilit] [PubMed]
- Edwards, S.J.; Carannante, V.; Kuhnigk, K.; Ring, H.; Tararuk, T.; Hallböök, F.; Blom, H.; Önfelt, B.; Brismar, H. High-Resolution Imaging of Tumor Spheroids and Organoids Enabled by Expansion Microscopy. Front. Mol. Biosci. 2020, 7, 208. [Google Scholar] [CrossRef] [Scilit] [PubMed]
- Hao, X.; Du, L.; Liu, G.; Li, Z.; Wang, S. Human retinal organoids for modelling dry age-related macular degeneration and screening drugs. Genes Dis. 2025, 12, 101593. [Google Scholar] [CrossRef] [Scilit] [PubMed]
- Wang, Z.; Stewart, S.; Kumagai, M.; Wang, E.; Ou, W.; Lu, Y.; Meng, T.; Xu, C.; Hong, Y.; Ren, S.; et al. High-Yield Convenient Mass Production of High-Quality Homogenous Human Induced Pluripotent Stem Cell Spheroids under Rho-Associated Kinase Inhibitor-Free 3D Culture Enabled by Micropatterning and Cold-Triggered Chemical-Free Cell Detachment. Small Sci. 2025, 5, 2500201. [Google Scholar] [CrossRef] [Scilit] [PubMed]
- Balahmar, R.M.; Boocock, D.J.; Coveney, C.; Ray, S.; Vadakekolathu, J.; Regad, T.; Ali, S.; Sivasubramaniam, S. Identification and characterisation of NANOG+/OCT-4high/SOX2+ doxorubicin-resistant stem-like cells from transformed trophoblastic cell lines. Oncotarget 2018, 9, 7054–7065. [Google Scholar] [CrossRef] [Scilit] [PubMed]

Disclaimer/Publisher’s Note: The statements, opinions and data contained in all publications are solely those of the individual author(s) and contributor(s) and not of MDPI and/or the editor(s). MDPI and/or the editor(s) disclaim responsibility for any injury to people or property resulting from any ideas, methods, instructions or products referred to in the content. |
© 2026 by the authors. Licensee MDPI, Basel, Switzerland. This article is an open access article distributed under the terms and conditions of the Creative Commons Attribution (CC BY) license.