


Abstract
This study examines customer retention intention in neobanking environments using a theory-informed explainable machine learning framework. Existing digital banking research typically relies on linear modelling approaches to explain retention behaviour, potentially overlooking nonlinear, value-range-dependent, and interaction-based predictive patterns. Using a publicly available survey of 305 neobank users, this study compares regularized linear models, a partial least squares structural equation modelling (PLS-SEM)-inspired benchmark, and XGBoost (version 3.2.0) under repeated nested cross-validation. SHapley Additive exPlanations (SHAP)-based explainability, SHAP interaction analysis, generalized additive model (GAM) diagnostics, construct-level aggregation, and construct-sensitivity checks are used to interpret model behaviour and assess robustness. The results show that XGBoost substantially outperforms the linear benchmarks, achieving the lowest average RMSE and highest average R2 across 100 out-of-sample test-fold estimates. Trust-related indicators provide the largest share of model-based predictive importance, followed by perceived security and switching costs. SHAP and GAM diagnostics suggest that trust and switching costs may contribute to retention intention in heterogeneous and nonlinear ways, while perceived security displays a more stable positive predictive pattern. Age-related nonlinearities appear weak and should be interpreted cautiously given the young sample profile. The analysis also suggests possible non-additive relationships between trust and perceived security. The study contributes to digital banking and FinTech research by showing how explainable machine learning can complement theory-driven retention models, identify potentially nonlinear predictive patterns, and preserve interpretability. The findings offer practical insight for trust-building, visible security assurance, and retention diagnostics in neobanking contexts.
Keywords:
neobanking; customer retention; trust; perceived security; switching costs; explainable artificial intelligence; XAI JEL Classification:
G21; G23; C45; C53; M31; L86
1. Introduction
The rapid expansion of financial technology (FinTech) has fundamentally transformed the global retail financial services landscape. Among the most prominent manifestations of this transformation is the emergence of neobanks, fully digital financial institutions that operate without physical branch infrastructure and deliver services exclusively through mobile platforms and cloud-based ecosystems. Global neobank customers exceeded 140 million users worldwide in 2021 and are expected to reach 350 million users in 2026, reflecting one of the fastest adoption rates observed in modern financial services [1]. Market projections suggest that the global neobanking sector will surpass USD 2 trillion in transaction value by 2030, supported by increasing digital payment penetration and declining reliance on traditional branch-based banking models [2].
Unlike conventional banks, neobanks operate entirely through digital interfaces, relying on mobile applications, algorithmic decision systems, and cloud-based infrastructures to deliver financial services. While this digital-first architecture enables lower operational costs, rapid onboarding, and enhanced accessibility, it simultaneously intensifies customer sensitivity to psychological and institutional risk factors. Surveys indicate that over 60% of digital banking users identify security concerns and institutional trust as primary determinants of continued platform usage, exceeding the importance of pricing or functional convenience [3]. In the absence of face-to-face interaction, physical reassurance mechanisms, or established institutional legacy, customers must rely almost exclusively on perceived trustworthiness, platform security, and technological reliability. Consequently, customer retention in neobanking environments is shaped not merely by transactional efficiency but by complex psychological and structural mechanisms governing perceived risk and confidence [4].
Trust has long been recognized as a foundational determinant of relationship continuity in digital environments. In online financial contexts, trust reduces perceived uncertainty, mitigates perceived vulnerability, and facilitates long-term relational commitment. This role becomes particularly critical in digital-only banking ecosystems, where financial transactions involve sensitive personal and monetary information transmitted through intangible technological channels. However, trust in digital banking is unlikely to operate through simple linear increments. Behavioural decision theory suggests that individuals respond asymmetrically to perceived gains and losses in confidence. Empirical evidence from digital platform markets shows that negative trust shocks, such as perceived data breaches or service disruptions, generate disproportionately large customer attrition relative to equivalent positive improvements in service quality [5]. Accordingly, extremely low trust may sharply suppress retention, whereas high trust may disproportionately accelerate loyalty formation. Trust may therefore function as a nonlinear retention accelerator rather than a uniformly additive predictor.
Closely intertwined with trust is perceived security, defined as the belief that financial information and transactions are adequately protected against fraud, misuse, or unauthorized access. Cybersecurity concerns have become increasingly salient as digital financial adoption expands. Global financial cybercrime losses exceeded USD 10 billion annually in 2023, reinforcing consumer awareness of digital vulnerability [6]. Perceived security provides institutional assurance that reduces perceived transaction risk and stabilizes user confidence in technology-mediated financial interactions. Unlike relational trust, which may exhibit asymmetric or threshold effects, security perceptions may operate more steadily by producing incremental reductions in perceived vulnerability. Importantly, trust and security are conceptually complementary constructs: trust reflects relational confidence in institutional intentions, whereas security signals technological competence and systemic reliability. It is therefore plausible that the effect of trust on retention strengthens when security perceptions are high, implying interaction-driven complementarity rather than purely additive influence.
Beyond relational and institutional drivers, switching costs represent structural constraints capable of stabilizing customer retention. In digital banking ecosystems, switching barriers arise from procedural complexity, habit formation, ecosystem integration, automated payment arrangements, and platform personalization. Industry evidence suggests that digitally integrated users linking payroll deposits, subscriptions, and investment services exhibit significantly lower churn probabilities than users employing standalone banking functions [7]. Unlike trust, which promotes voluntary commitment, switching costs discourage exit through behavioural inertia. Behavioural economics further suggests that switching costs may operate through threshold mechanisms, preventing churn only when perceived exit barriers exceed a meaningful level rather than generating gradual loyalty increases across all users.
Despite extensive research examining trust, security, and retention in digital finance, most empirical investigations rely on linear structural equation modelling frameworks that assume additive, symmetric, and constant marginal effects. Such approaches implicitly presume that incremental improvements in trust or security produce proportionally equivalent retention responses across customers. However, digital financial behaviour may inherently involve nonlinear response patterns, behavioural tipping points, and cross-construct amplification effects. For instance, high trust may fail to translate into sustained usage when security perceptions remain weak, while strong technological security alone may be insufficient in the absence of relational confidence.
The dataset used in this study was originally analysed by a prior study, who developed a stimulus-organism-response (S-O-R) mediation model in which perceived financial security operates as the stimulus, trust functions as the organism, and customer retention and switching costs represent behavioural responses [8]. Using PLS-SEM and bootstrapping, their study showed that perceived financial security positively affects trust and retention, while trust mediates the relationships between perceived financial security and both retention and switching costs. The present study acknowledges and complements this prior research by extending the analysis beyond conventional linear mediation frameworks. More broadly, existing neobanking and digital banking retention studies have predominantly relied on regression- and SEM-based linear approaches, which may overlook heterogeneous, nonlinear, and interaction-based predictive structures. Building on this literature, the present study examines whether neobanking retention intention contains nonlinear, value-range-dependent, and interaction-driven predictive patterns that are not directly observable from linear path coefficients alone.
To address this extension, this study uses explainable machine learning methods within the broader Explainable Artificial Intelligence (XAI) framework. Specifically, it evaluates neobanking retention intention using regularized linear benchmarks, a PLS-SEM-inspired benchmark, nonlinear gradient-boosted modelling, and SHapley Additive exPlanations (SHAP)-based explainability. This integrated approach enables out-of-sample validation while providing exploratory diagnostic insight into possible nonlinear functional relationships and interaction structures beyond traditional additive assumptions. Thus, by integrating behavioural theory with explainable predictive modelling, this study offers a cautious and methodologically extended account of how psychological, institutional, and structural forces may jointly shape retention intention within rapidly evolving FinTech-driven neobanking ecosystems.
1.1. Research Objective
This study is guided by three interrelated research objectives, each examined through a corresponding set of hypotheses developed in Section 3.
The first objective is to examine whether customer retention intention in neobanking environments is better captured by nonlinear predictive structures than by conventional linear specifications. This objective responds to an important methodological limitation in the existing literature, where retention drivers are commonly modelled as additive and constant in effect. To address this issue, the study compares the out-of-sample predictive performance of regularized linear models, a PLS-SEM-inspired benchmark, and a nonlinear XGBoost (version 3.2.0) model using repeated nested cross-validation. This objective is formalised through Hypothesis 1, which predicts that the nonlinear model will achieve stronger predictive performance than linear alternatives.
The second objective is to examine the relative predictive importance and functional behaviour of the main retention determinants, namely trust, perceived security, switching costs, and demographic characteristics. Rather than focusing only on whether these variables are statistically associated with retention intention, the study investigates how their predictive contributions vary across observations and value ranges. Specifically, the study explores whether trust-related variables emerge as the strongest predictors of retention intention, whether trust exhibits nonlinear predictive behaviour, whether perceived security displays a more stable positive pattern, whether switching costs show value-range-dependent effects, and whether demographic characteristics display heterogeneous predictive variation. These issues are explored through Hypotheses 2 to 6 using SHAP-based interpretation, generalized additive model (GAM) diagnostics, and robustness analyses.
The third objective is to examine whether trust-related and security-related perceptions jointly contribute to retention-intention prediction in neobanking environments. The theoretical argument is that trust reflects relational confidence, whereas perceived security reflects institutional and technological assurance. Accordingly, the study explores whether the predictive contribution of trust becomes stronger when perceived security is high. This objective is examined through Hypothesis 7 using SHAP interaction analysis and retention-surface interpretation. However, because some trust indicators overlap conceptually with perceived security, the interaction findings are interpreted cautiously as exploratory model-based evidence rather than causal confirmation of behavioural complementarity.
1.2. Findings, Contribution and Paper Structure
This study reports several important findings. First, the nonlinear XGBoost model consistently outperforms the linear benchmarks under repeated nested cross-validation, suggesting that retention-intention prediction in neobanking environments may involve nonlinear and interaction-based structure beyond standard additive specifications. Second, trust-related indicators emerge as the most influential contributors to model-based retention predictions, although this interpretation is qualified by conceptual overlap between trust and perceived security measures. Third, the explainable machine learning analyses reveal heterogeneous predictive patterns across trust, perceived security, switching costs, and demographic variables, including possible nonlinear and interaction-based relationships that are not fully captured by linear path-based approaches.
This research contributes to the digital banking and FinTech literature in four main ways. First, it extends the existing S-O-R/PLS-SEM literature by examining whether retention-intention prediction contains nonlinear and interaction-based patterns beyond conventional linear mediation structures. Second, it demonstrates how repeated nested cross-validation, SHAP interpretation, GAM diagnostics, construct-level benchmarking, and construct-sensitivity analysis can be integrated into a theory-informed explainable machine learning framework. Third, it provides exploratory evidence that trust-related and security-related perceptions may jointly contribute to retention-intention prediction, while also explicitly addressing conceptual overlap concerns through robustness analyses. Fourth, the study illustrates how explainable machine learning can complement theory-driven digital finance research by identifying potentially nonlinear predictive patterns while maintaining interpretability and transparency.
From a practical perspective, the findings suggest that neobanking retention may depend not only on transactional convenience but also on trust-building, visible security assurance, and ecosystem integration. More broadly, the study demonstrates how explainable predictive modelling can support customer segmentation, retention diagnostics, and theory-informed FinTech analytics while still requiring cautious interpretation regarding causality and behavioural mechanisms.
2. Literature Review
Customer retention is a critical determinant of firm performance in service industries [9]. In financial services, retention is particularly important because of high customer lifetime value, cross-selling opportunities, and switching frictions. In digital banking, retention depends not only on economic utility but also on customers’ psychological confidence in the platform [10,11]. Neobanks differ from traditional banks because they operate without physical branches, face-to-face interaction, or tangible reassurance mechanisms [12,13]. As a result, customer retention in neobanking is strongly shaped by trust, perceived security, switching costs, and demographic heterogeneity.
Prior research in e-commerce, FinTech, and online banking consistently identifies trust and perceived risk as central determinants of continued usage intention [14,15]. However, digital financial behaviour may involve nonlinear responses, threshold mechanisms, and interaction effects, particularly because financial decisions involve perceived risk, uncertainty, and sensitive personal data [16,17,18,19]. This review therefore synthesises the main behavioural and technological drivers of customer retention in neobanking and identifies the need for explainable nonlinear predictive modelling.
2.1. The Centrality and Nonlinearity of Trust in Digital Finance
Trust is widely conceptualised as a multidimensional construct reflecting confidence in a provider’s integrity, reliability, and competence [20]. In relationship marketing, trust is regarded as a cornerstone of long-term exchange continuity, especially in uncertain and risky environments [21,22]. It reduces perceived vulnerability by simplifying complex decisions and limiting concerns about opportunistic behaviour.
Trust becomes especially important in digital finance because online exchange is characterised by information asymmetry, spatial separation, and limited physical reassurance [23,24]. This role is amplified in financial services, where monetary transactions and personal data increase perceived vulnerability [25]. For neobanks, trust reflects confidence in the institution’s ability to fulfil promises, safeguard assets, and act with integrity. This confidence supports continued interaction [26].
The relationship between trust and retention may not be strictly linear. Prospect Theory suggests that individuals are more sensitive to losses than to equivalent gains [27,28]. Therefore, a decline in trust may produce a stronger negative retention response than an equivalent increase produces a positive response. Trust may also need to exceed a threshold before it meaningfully reduces risk perceptions and supports loyalty [29]. Prior digital finance studies confirm the importance of trust in mobile payments, digital payments, and e-payment services [30,31,32]. However, these studies mostly examine average linear relationships, leaving the nonlinear and value-range-dependent role of trust underexplored.
2.2. Perceived Security: Institutional Assurance and Relational Complementarity
Perceived security is closely related to trust but conceptually distinct from it. Trust reflects relational confidence in a provider’s intentions and integrity, whereas perceived security reflects the user’s belief that a digital platform has adequate safeguards to protect financial data, prevent fraud, and ensure transaction integrity [24]. In neobanking, where financial assets and personal data are managed entirely through digital channels, perceived security is a central customer concern.
Prior research shows that perceived security reduces perceived risk and strengthens confidence in the provider’s institutional competence [33,34]. Customers who believe that a bank maintains robust security are more likely to view the institution as reliable and well intentioned [35]. Perceived security may therefore function as a “hygiene factor”: it may not automatically create loyalty, but weak security perceptions can trigger dissatisfaction, distrust, and customer exit [36,37,38,39].
Security and trust may also operate complementarily. Institutional security can provide the foundation on which relational trust is built and translated into retention [40,41]. A customer may trust a neobank’s intentions, but weak perceived security may undermine continued use. Conversely, strong technical security may be insufficient if the customer doubts the bank’s honesty or reliability.
In contemporary FinTech environments, perceived security extends beyond technical safeguards to include data privacy, regulatory compliance, cybersecurity governance, and institutional accountability. Consumers assess banking applications through cues such as secure authentication, fraud monitoring, consent management, transparency of data use, and privacy protection. This is particularly important in AI-enabled financial platforms, where customer data are used for fraud detection, credit assessment, personalisation, and risk monitoring. This broader view is consistent with recent banking research showing that data privacy and cybersecurity are major challenges in digital banking adoption [42], and with mobile banking adoption evidence showing that perceived ease of use and perceived security can act as key barriers or enablers of adoption [43].
Recent studies confirm that perceived security and trust influence FinTech adoption, mobile banking adoption, decentralized FinTech usage, mobile payments, and digital financial stability [33,44,45,46,47]. However, their joint and potentially nonlinear predictive contribution to neobanking retention remains insufficiently examined.
2.3. Switching Costs and Retention Stability
Switching costs represent structural and economic constraints that bind customers to a service provider [48]. They refer to the perceived effort, inconvenience, disruption, or loss associated with changing from one provider to another [49,50]. In neobanking, switching costs may include closing an account, opening a new one, updating bill payments, transferring salary deposits, reconnecting subscriptions, and losing familiarity with a personalised app interface [51].
Switching costs differ conceptually from trust and security. Trust encourages voluntary relational commitment, whereas switching costs discourage exit through inertia and structural barriers. A customer may remain with a neobank not because of strong trust, but because leaving appears too inconvenient. Switching costs are therefore widely recognised as a retention mechanism because they create inertia and discourage defection even when satisfaction declines [52].
The influence of switching costs may also be threshold-based. Minor inconveniences may not prevent switching when a competing offer is attractive. However, once the perceived effort, risk, or disruption of switching reaches a critical level, switching costs may become a genuine deterrent to exit [53,54]. Prior studies show that switching costs influence retention, switching intention, and loyalty in FinTech lending, internet-only banking, digital banking, and service contexts [55,56,57,58,59]. Yet their possible nonlinear and threshold-based role in neobanking retention remains underdeveloped.
2.4. Demographic Heterogeneity in Digital Adoption
Demographic characteristics, especially age, are important in technology adoption and customer retention research, yet digital banking studies often treat age, gender, income, and education mainly as linear control variables rather than as potentially nonlinear predictors of retention [60,61]. Younger users generally have higher digital literacy, greater familiarity with mobile interfaces, and lower anxiety toward technology-mediated transactions [62], making them more likely to adopt neobanking services and conduct frequent mobile transactions [63]. However, adoption does not necessarily imply retention, as younger users may also show lower brand loyalty, higher price sensitivity, and greater willingness to switch providers [64,65]. Older users may initially face stronger adoption barriers, including perceived complexity, lower self-efficacy, and higher risk perceptions [66,67], but once they adopt a platform, they may display stronger retention due to habit persistence, loyalty to trusted providers, lower exploratory switching, and higher perceived switching costs [68,69]. These opposing mechanisms suggest that age–retention relationships may be nonlinear. Consumer behaviour studies report both stronger loyalty among older consumers [64,70] and evidence that older consumers do not necessarily prefer older or established brands [71]. Financial risk tolerance research similarly documents U-shaped age patterns [72,73], while overconfidence may partly explain risk-taking among older adults [74]. Technology adoption research also shows complex age moderation [68], although internet-only banking studies report non-significant age effects under linear models [56]. Preliminary neobanking evidence further suggests possible U-shaped churn patterns [75]. Overall, treating demographics only as linear controls may obscure U-shaped, threshold-based, or interaction-based relationships [56,71,76,77].
2.5. Artificial Intelligence, Trust, and Customer Behaviour in Digital Decision Systems
Recent computing and information systems research highlights the growing role of artificial intelligence in digital decision-making, customer analytics, and trust management. Explainable artificial intelligence can improve decision accuracy and behavioural trust in AI-supported decision tasks, although self-reported trust may not necessarily increase [78]. AI-based trust and security mechanisms have also been developed for digital networks, including graph neural network-based trust evaluation and trust-driven federated learning architectures [79,80].
Machine learning is increasingly used in customer analytics and marketing intelligence. Prior research has applied deep learning and ensemble methods to customer churn prediction, segmentation, brand equity evaluation, and creditworthiness assessment [81,82,83,84]. These studies show that machine learning can identify complex patterns in customer behaviour. However, limited attention has been given to the use of explainable machine learning for identifying nonlinear retention dynamics in neobanking, particularly across trust, perceived security, switching costs, and demographic heterogeneity.
Explainable machine learning can address this gap by combining predictive flexibility with interpretability. Gradient boosting models can capture nonlinear and interaction-based structures, while SHAP-based analysis decomposes feature contributions, nonlinear dependence patterns, and interaction effects. This allows researchers to examine whether retention is better understood through heterogeneous, value-range-dependent, and non-additive predictive patterns rather than through additive linear relationships alone.
2.6. Limitations of Linear Modelling Approaches
Most prior retention research relies on structural equation modelling or linear regression. These approaches are theoretically useful, but they usually assume additive effects, constant marginal influence, symmetric responses, and linear interactions. Digital financial decision-making, however, may involve nonlinear acceleration, threshold effects, asymmetric risk responses, and interaction-driven complementarity.
Recent advances in explainable machine learning allow researchers to identify nonlinear functional forms while preserving interpretability. Gradient boosting models can capture complex predictive structures, while SHAP-based analysis decomposes feature contributions, nonlinear dependence patterns, and interaction effects. Despite these advantages, relatively few studies integrate theory-driven retention frameworks with explainable nonlinear predictive modelling.
2.7. Research Gap and Study Contribution
This study addresses three related gaps in the digital banking literature. First, prior studies establish the importance of trust, perceived security, switching costs, and demographics in digital financial behaviour, but they mainly examine these factors through additive or linear specifications. This limits understanding of whether retention in neobanking involves nonlinear, threshold-based, or heterogeneous predictive patterns.
Second, limited research examines the functional behaviour of retention predictors across observed value ranges. Rather than asking only whether trust, security, switching costs, and demographics matter, this study investigates how their predictive contributions vary across users. SHAP-based interpretation, GAM diagnostics, and construct-level robustness checks are used to assess whether the fitted models learn nonlinear, asymmetric, or heterogeneous patterns. These analyses are interpreted as exploratory model-based diagnostics rather than causal or confirmatory tests.
Third, limited attention has been given to possible non-additive predictive relationships between trust and perceived security. Prior studies often model trust and security as sequential, parallel, or linearly moderated constructs. This study examines their relationship using SHAP interaction values and predicted retention surfaces. Because some trust indicators overlap conceptually with perceived security, the interaction findings are interpreted cautiously and supplemented with construct-sensitivity checks.
Overall, this study extends existing neobanking retention research by integrating theory-informed constructs with explainable nonlinear predictive modelling. It does not replace theory-driven linear models; rather, it examines whether robust and interpretable machine learning can identify additional nonlinear and interaction-based predictive information relevant to customer retention in digital banking environments.
3. Hypotheses Development
3.1. Nonlinear Predictive Structure in Digital Retention
Customer retention in digital financial services is shaped by complex behavioural and psychological mechanisms. Unlike traditional linear models that assume constant effects, digital banking decisions often involve asymmetric responses, thresholds, and interactions among trust, security, and switching costs. Consequently, nonlinear models are expected to better capture retention dynamics and deliver superior predictive performance.
Hypothesis 1 (H1).
A nonlinear predictive model demonstrates superior out-of-sample performance in explaining customer retention relative to linear additive specifications.
3.2. Trust as the Primary Retention Driver
Trust represents confidence in the reliability, integrity, and competence of a digital financial provider. In environments characterized by information asymmetry and absence of physical reassurance, trust reduces perceived risk and enhances relational commitment. Relationship marketing theory posits that trust forms the foundation of long-term exchange continuity, particularly in service contexts involving financial vulnerability. Given the fully digital nature of neobanking platforms, where interactions are mediated by technology rather than physical presence, trust is expected to exert a dominant influence on customer retention relative to other constructs.
Hypothesis 2 (H2).
Trust constitutes the strongest predictor of customer retention in neobanking environments.
3.3. Nonlinear and Threshold Effects of Trust
While trust is expected to positively influence retention, its functional form may not be linear. Prospect theory and risk asymmetry arguments suggest that losses (e.g., very low trust) exert stronger behavioural impact than equivalent gains. Extremely low trust may dramatically increase churn risk, whereas high trust may accelerate loyalty formation disproportionately.
Thus, trust may operate as a retention accelerator rather than a simple additive predictor.
Hypothesis 3 (H3).
The relationship between trust and customer retention is nonlinear and convex, such that retention gains accelerate at high levels of trust and decline sharply at low levels.
3.4. Perceived Security as a Monotonic Driver
Perceived security reflects users’ assessment of data protection, fraud prevention, and transaction integrity. In digital banking, security perceptions reduce uncertainty and perceived vulnerability. Unlike relational trust, which may exhibit asymmetry and threshold effects, institutional security signals may operate more uniformly by steadily increasing confidence and reducing perceived risk. Accordingly, security perceptions are expected to exert a consistently positive influence on retention.
Hypothesis 4 (H4).
Perceived security has a positive and predominantly monotonic relationship with customer retention.
3.5. Switching Costs as a Stabilization Mechanism
Switching costs refer to the perceived effort, complexity, or inconvenience associated with changing service providers. Unlike trust and security, which foster positive relational commitment, switching costs operate through inertia and exit barriers. Behavioural economics suggests that switching barriers may not gradually increase loyalty but instead prevent defection once a certain threshold is reached. In digital financial ecosystems, integration with payment systems and established routines may create stabilizing effects only when perceived switching burdens exceed a meaningful level.
Hypothesis 5 (H5).
Switching costs influence customer retention through a threshold mechanism, such that retention increases meaningfully only when switching barriers exceed a critical level.
3.6. Demographic Nonlinearity
Demographic influences on digital service adoption are often heterogeneous rather than linear. Age-related differences in technology familiarity, financial risk tolerance, and platform preferences may produce nonlinear retention patterns. Middle-aged users may exhibit different engagement sensitivities relative to younger or older users. Thus, demographic variables may demonstrate nonlinear retention effects.
Hypothesis 6 (H6).
Age exhibits a nonlinear (U-shaped) relationship with customer retention.
3.7. Complementarity Between Trust and Security
Trust and perceived security are conceptually distinct but theoretically complementary constructs. Trust reflects relational confidence in the provider, while security reflects institutional assurance regarding platform safety. Complementarity theory suggests that when two factors reinforce each other, the marginal effect of one increases as the level of the other increases. In digital-only financial contexts, users may require both relational trust and institutional security to sustain long-term commitment. High trust may not fully convert into retention when security perceptions are weak, and strong security alone may be insufficient without relational confidence. Therefore, a positive cross-partial interaction is expected between trust and security.
Hypothesis 7 (H7).
Trust-related and perceived-security-related indicators exhibit a positive non-additive predictive interaction in customer retention prediction, such that predicted retention is highest when both trust and perceived security are high.
4. Data and Methodology
This study adopts a predictive modelling design rather than a causal identification strategy. The purpose is to examine whether nonlinear and interaction-based predictive structures improve out-of-sample retention-intention prediction and to interpret how the trained models allocate predictive importance across theoretically relevant variables. Accordingly, SHAP values, SHAP interaction values, and GAM diagnostics are interpreted as model-based explanatory tools, not as causal estimates. The findings should therefore be understood as predictive and exploratory rather than confirmatory evidence of behavioural causality.
The objective is not to replace theory with algorithmic modelling, but to validate and extend theoretically derived relationships using explainable machine learning. This approach enables detection of nonlinearities, threshold effects, and synergistic interactions that traditional linear models may fail to capture.
4.1. Data Description
The dataset used in this study originates from a structured survey on neobanking behaviour initially collected by a prior study in the context of Mexico [8]. Subsequently, it was made publicly available on the Kaggle database under the Creative Commons Attribution–Non-commercial–Share Alike 4.0 (CC BY-NC-SA 4.0) license. The dataset captures users’ perceptions of digital financial platforms, focusing on key behavioural constructs including Trust (T), Perceived Security (PS), Ease of Payment (EP), Switching Costs to Traditional Banks (SCTB), and Customer Retention (CR), as well as demographic characteristics such as age, gender, and educational level.
During the original data collection process, questionnaires were administered both directly in commercial areas of the cities of Puebla and Mexico City and indirectly through social media platforms, including email, WhatsApp, and Facebook. Participation in the survey was voluntary, and respondents required approximately 8–10 min to complete the questionnaire. Fieldwork was conducted between September and November 2023.
The dataset contains 305 observations, representing individuals who reported holding an account with at least one neobank. To avoid brand-related bias and prevent potential promotional implications, the specific financial institutions used by respondents were not recorded in the dataset. The survey instrument measures five behavioural constructs using multiple indicators evaluated on a five-point Likert scale ranging from 1 (strongly disagree) to 5 (strongly agree).
User perceptions of neobanking services were assessed using measurement scales derived from established studies in the digital finance and service marketing literature. Trust and customer retention were operationalised using previously validated instruments [85]. Ease of Payment and Perceived Security were measured using established service-quality and digital commerce scales [86]. Switching costs associated with migrating from a neobank to a traditional banking institution were measured using a previously developed switching-cost scale [87].
Each construct is measured using multiple indicators evaluated on a five-point Likert scale ranging from 1 (strongly disagree) to 5 (strongly agree). In total, the dataset contains 23 behavioural indicators, including five items measuring Ease of Payment (EP1–EP5), five items measuring Switching Costs to Traditional Banks (SCTB1–SCTB5), three items measuring Customer Retention (CR1–CR3), four items measuring Trust (T1–T4), and five items measuring Perceived Security (PS1–PS5). A detailed description of the measurement items is provided in Table 1.
Table 1.
Survey measurement items.
In addition, the dataset includes demographic variables such as age, gender, and educational level. Age is recorded as a numerical variable, while gender and educational level are categorical variables coded using ordinal scales. The coding scheme for demographic variables is presented in Table 2.
Table 2.
Coding of demographic variables.
Table 3 presents the descriptive statistics of the study variables, summarizing their central tendency and dispersion across the sample. The average age of respondents is 26.99 years (SD = 10.58), indicating that the sample is relatively young. This profile is consistent with the user base of digital banking and neobanking services, but it limits the extent to which age-related findings can be generalised to older customer segments. Consequently, age-related nonlinear patterns are interpreted cautiously and treated as exploratory. Gender has a mean of 1.56 (SD = 0.50), suggesting a fairly balanced distribution between male and female respondents. The mean education level is 3.86 (SD = 0.69), indicating that most respondents possess at least a high school or bachelor-level education.
Table 3.
Descriptive statistics of study variables.
Among the behavioural constructs, Ease of Payment records the highest mean value (4.32, SD = 0.88), suggesting that respondents generally perceive neobanking platforms as convenient and user-friendly. Trust and Perceived Security also exhibit relatively high average scores (4.27 and 4.20, respectively), indicating strong user confidence in the reliability and security of the digital banking services. Customer Retention shows a high mean of 4.15 (SD = 1.01), reflecting a generally strong intention among users to continue using and recommending the neobank services. In contrast, Switching Costs display a comparatively lower mean (3.02, SD = 1.44), suggesting that perceived barriers to switching to traditional banks are moderate and more heterogeneous among respondents. Overall, the descriptive statistics indicate generally favourable perceptions of neobanking services, particularly in terms of usability, trust, and security, while switching barriers appear less uniformly perceived across users.
4.2. Measurement Reliability and Validity
Table 4 confirms strong measurement reliability and validity. The Kaiser–Meyer–Olkin (KMO) value (0.92) indicates excellent sampling adequacy, while Cronbach’s alpha values above 0.70 demonstrate high internal consistency across constructs. Factor loadings support convergent validity, and minor overlap between Trust and Customer Retention items reflects their expected theoretical linkage. Tests for common method bias suggest (CMB) no dominant single-factor influence, indicating limited CMB concerns, although residual bias typical of cross-sectional survey data cannot be fully ruled out.
Table 4.
Reliability and construct validity assessment.
4.3. Predictive Modelling Strategy
This study employs a predictive modelling framework suited to a structured tabular survey dataset with a moderate sample size (N = 305). Although the sample is smaller than those typically used in large-scale machine learning studies, tree-based ensemble methods such as XGBoost can perform effectively in structured tabular settings when supported by appropriate regularisation, validation, and out-of-sample testing.
To improve generalisability and reduce overfitting, the modelling strategy incorporates several safeguards. These include regularised linear benchmark models, cross-validation, early stopping during boosting, repeated nested cross-validation, and evaluation on an untouched hold-out test set. SHAP-based explainability is also used to interpret model behaviour and assess whether the predictive patterns are consistent with the study’s theoretical expectations.
The dependent variable is a continuous customer retention score, calculated as the arithmetic mean of the three retention indicators:
To prevent target leakage, CR1–CR3 were excluded from the predictor set in all models.
The predictors included Age, Gender, education level, and all non-retention item indicators: EP1–EP5, PS1–PS5, T1–T4, and SCTB1–SCTB5. The modelling strategy was organised into five phases. Phases 1 and 2 test H1. Phase 3 examines H2–H6. Phase 4 examines H7. Phase 5 provides robustness analysis for H1–H7.
Because the study uses structured tabular survey data rather than unstructured text, large language models and NLP-oriented architectures were not used as the main benchmark models. Instead, model selection was aligned with the data type and prediction task. In tabular prediction settings, regularised linear models and tree-based boosting remain strong and widely used benchmarks. Therefore, XGBoost was compared with Ridge, Lasso, and Elastic Net using the same predictor set, preprocessing procedure, train–test split, and evaluation metrics. This ensured a fair out-of-sample comparison across models. The benchmark comparison is based on direct implementation within the present dataset rather than on performance values reported in prior studies.
4.3.1. Phase 1: Linear Baseline Estimation
To establish a benchmark for nonlinear model performance and test H1, three regularised linear regression models were estimated: Ridge (L2), Lasso (L1), and Elastic Net (L1/L2). Regularised estimation was preferred to ordinary least squares for two reasons. First, regularisation reduces overfitting by shrinking coefficient estimates, which is important given the moderate sample size relative to the number of predictors. Second, Lasso and Elastic Net provide implicit feature selection, improving model parsimony and helping identify influential additive predictors.
To allow direct comparison with the original theory-driven S-O-R specification, a PLS-SEM-inspired linear benchmark was also included [8]. The benchmark used construct-level scores for ease of payment, perceived security, and trust to predict customer retention intention.
The dataset was divided into 70% training and 30% test subsets. All preprocessing steps, including centring and scaling of continuous predictors, were fitted only on the training data and then applied to the test data. This procedure avoided data leakage. For each regularised model, the optimal tuning parameters were selected through 5-fold cross-validation on the training set by minimising cross-validated root mean squared error (RMSE). The tuned models were then evaluated on the untouched hold-out test set using RMSE, MAE, and R2. This ensured that model comparisons reflected genuine out-of-sample predictive performance rather than in-sample fit.
To examine whether the hold-out findings were sensitive to a single train–test split, repeated nested cross-validation was then conducted for the regularised linear models and the PLS-SEM-inspired benchmark. The outer evaluation used repeated 10-fold cross-validation, with 10 folds repeated 10 times, producing 100 out-of-sample test-fold estimates for each model. Within each outer training fold, an inner 5-fold cross-validation procedure was used for hyperparameter tuning. Uncertainty was estimated by reporting standard deviations and 95% confidence intervals across the 100 resamples. Statistical comparisons were conducted using pairwise Wilcoxon signed-rank tests and win-rate comparisons across resampled folds.
4.3.2. Phase 2: Nonlinear Gradient Boosting
To capture potential nonlinearities and interactions that linear models cannot accommodate, an XGBoost regression model was estimated [4,88]. XGBoost is an ensemble learning method that sequentially adds decision trees, with each tree correcting the prediction errors of earlier trees. It has shown strong predictive performance across many structured-data applications.
The same 70/30 train–test split was used to ensure comparability with the linear benchmarks. XGBoost hyperparameters, including learning rate, maximum tree depth, subsampling ratio, column sampling ratio, minimum child weight, and L2 regularisation, were tuned using grid search with 5-fold cross-validation applied only to the training data. The number of boosting rounds was capped at 1,000. To reduce the risk of overfitting, early stopping was applied using a separate validation subset comprising 20% of the training data. Training stopped when validation RMSE failed to improve for 30 consecutive boosting rounds. The 30% test set remained untouched throughout tuning and early stopping and was used only for final model evaluation. This procedure reduced the risk of fitting noise rather than meaningful predictive structure.
To further assess robustness and reduce sensitivity to a favourable single split, XGBoost was also evaluated using the repeated nested cross-validation framework. In this procedure, the outer repeated 10-fold cross-validation generated out-of-sample test-fold estimates, while hyperparameters were selected within each outer training fold using inner 5-fold cross-validation. The tuning procedure used exhaustive grid search, and the optimisation criterion was RMSE. As shown in Table 5, n_estimators was set to 1,000 as an upper limit, with the effective number of boosting rounds selected through early stopping. Early stopping was applied with 30 rounds using validation data drawn only from the relevant training fold. Thus, the outer test folds remained untouched during both hyperparameter tuning and early stopping. This evaluation also included uncertainty estimation and 95% confidence intervals across the outer-fold results.
Table 5.
XGBoost Hyperparameter Search Space.
4.3.3. Phase 3: SHAP-Based Interpretability
Although XGBoost provides strong predictive performance, its ensemble tree structure does not allow direct coefficient-based interpretation. To address this limitation, SHAP was used as a model-interpretability framework [4,89,90]. SHAP is based on cooperative game theory and explains each prediction by assigning contribution values to individual features.
For each observation and feature , the SHAP value represents the contribution of feature to the deviation of prediction from the expected model output . Formally:
SHAP values therefore provide local explanations of individual predictions and, when aggregated across observations, enable global assessment of feature importance.
Three complementary SHAP-based analyses were conducted:
Mean Absolute SHAP Importance
Overall predictor importance was assessed using mean absolute SHAP values across all observations. This metric captures the average magnitude of each feature’s contribution, regardless of direction. It also avoids cancellation between positive and negative contributions.
Signed SHAP Directional Analysis
Mean signed SHAP values were calculated to examine directional tendencies. Because positive and negative values can offset each other, signed SHAP values were not interpreted as measures of importance. Instead, they were used to indicate whether a feature tended, on average, to increase or decrease predicted retention relative to the baseline prediction.
SHAP Dependence Plots
SHAP dependence plots were used to examine functional relationships between predictors and retention. These plots display SHAP values against corresponding feature values across observations. They help reveal nonlinear patterns, threshold-like behaviour, and potential interactions. Locally weighted scatterplot smoothing was used only for visualisation and not as a formal statistical test.
4.3.4. Phase 4: Construct-Level Aggregation and SHAP Interaction Analysis
To assess the relative importance of theoretical constructs rather than individual indicators, item-level SHAP values were aggregated to the construct level. For each observation, construct-level SHAP contributions were calculated by summing the SHAP values of all indicators belonging to the same construct. Mean absolute construct-level SHAP values were then computed across observations. Each construct’s relative share of predictive importance was calculated by dividing its mean absolute SHAP value by the total across all constructs.
SHAP interaction values were used to examine potential interaction patterns, particularly the hypothesised complementarity between trust and security. The SHAP interaction value represents the joint contribution of features j and k to the prediction for observation i, beyond their individual main effects. The interaction value is symmetric, such that:
The contribution of feature can therefore be decomposed as:
where denotes the main effect independent of interactions. Mean absolute SHAP interaction values were computed across observations to identify important model-based interaction patterns. Particular attention was given to Trust × Security interactions. To visualise their joint predictive contribution, a three-dimensional retention response surface was generated. Model predictions were calculated across a grid of Trust (T4) and Perceived Security (PS2) values, while all remaining features were held at their median levels.
4.3.5. Phase 5: Robustness Check via Binary Classification
To assess whether the predictive structure generalises beyond continuous regression, retention was reformulated as a binary classification problem. Observations in the bottom 40% of the retention distribution were classified as Low Retention (0), while observations in the top 40% were classified as High Retention (1). The middle 20% were excluded to create clearer separation between groups and reduce classification ambiguity.
This robustness check tests whether the model can distinguish high-retention from low-retention users in a segmentation-based framework that is more closely aligned with managerial targeting applications.
An XGBoost binary classifier was estimated using the same train–test partition and early stopping procedure used for the regression model. The classifier used the binary:logistic objective function. Performance was evaluated on the hold-out test set using AUC, precision, recall, and F1-score. Strong classification performance would suggest that the nonlinear relationships identified in the continuous model are robust to an alternative outcome specification and are not artefacts of distributional assumptions.
4.4. Preliminary Statistical Analysis
Prior to model estimation, preliminary statistical analyses were conducted to examine associations among study constructs and to assess the potential presence of multicollinearity among predictors. Correlation analysis provides an initial understanding of relationships between behavioural variables, while variance inflation factor (VIF) diagnostics evaluate whether predictor interdependence may adversely affect subsequent modelling procedures.
Correlation Analysis
Pearson correlation coefficients were calculated using construct-level composite scores, derived by averaging the measurement items for each construct. Table 6 reports the correlations among Ease of Payment, Switching Costs, Customer Retention, Trust, and Perceived Security.
Table 6.
Correlation Matrix of Study Constructs.
All constructs show positive and statistically significant correlations. Trust has the strongest association with Customer Retention (r = 0.762, p < 0.001). Perceived Security and Ease of Payment also show notable positive correlations with Customer Retention, whereas Switching Costs display relatively weaker associations. None of the correlations exceed the common multicollinearity threshold of r > 0.90, suggesting adequate separation among the predictors.
5. Empirical Results
5.1. Model Comparison and Repeated Cross-Validation
5.1.1. Hold-Out Model Comparison
Table 7 reports the initial hold-out model comparison based on the 70/30 train-test split. The regularized linear models achieved moderate predictive performance, with R2 values ranging from 0.592 for Lasso to 0.622 for Ridge. The PLS-SEM-inspired benchmark achieved a higher R2 of 0.598, suggesting that the theory-driven construct specification captures meaningful predictive information. However, XGBoost produced the strongest hold-out performance, with the lowest RMSE of 0.516, the lowest MAE of 0.388, and the highest R2 of 0.70. This initial result suggests that nonlinear boosting may capture additional predictive structure beyond both regularized item-level linear specifications and the theory-driven construct-level benchmark.
Table 7.
Model Comparison.
5.1.2. Repeated Nested Cross-Validation
The repeated nested cross-validation results (see Table 8) show that XGBoost consistently outperforms all linear benchmarks. XGBoost achieved the lowest average RMSE of 0.5033, compared with 0.5851 for Ridge, 0.5863 for Elastic Net, 0.5885 for the PLS-SEM-inspired benchmark, and 0.5916 for Lasso. It also produced the lowest MAE of 0.3697 and the highest average R2 of 0.6809. The PLS-SEM-inspired benchmark performed similarly to the regularized linear models, suggesting that the theory-driven linear structure captures meaningful predictive information but does not match the predictive accuracy of the nonlinear boosting model. Overall, the confidence intervals show a clear separation between XGBoost and the linear specifications, indicating that the improvement is not driven by a favourable single split. This supports the view that nonlinear modelling provides incremental predictive value beyond both generic regularized linear models and the original S-O-R-inspired linear structure.
Table 8.
Repeated nested cross-validated model performance.
Learning-Curve Diagnostic
Learning-curve analysis (Figure 1) shows that the early-stopped XGBoost model achieves consistent improvement as the training sample increases from 18% to 90% of the total data. The gap between training and test RMSE narrows from 0.04 to 0.01, suggesting that overfitting is reasonably controlled under the early-stopping and regularisation strategy. The absence of a clear plateau at 90% indicates that additional observations may further improve predictive stability, supporting the case for expanded data collection in future longitudinal or larger-scale studies.
Figure 1.
Learning curve diagnostic for early-stopped XGBoost Model.
5.1.3. Pairwise Predictive Accuracy Comparison
Pairwise Wilcoxon signed-rank tests were conducted using fold-level RMSE values to compare XGBoost with each regularized linear benchmark. Table 9 reports the mean RMSE differences and win rates across the 100 resamples.
Table 9.
Pairwise RMSE comparison between XGBoost and linear baselines.
The pairwise comparisons show that XGBoost significantly reduces prediction error relative to all three regularized linear models. The mean RMSE reduction ranges from 0.0817 to 0.0883, and the Wilcoxon signed-rank tests are statistically significant at the 1% level. XGBoost also outperformed Ridge, Lasso, and Elastic Net in 87%, 91%, and 88% of the resamples, respectively. Overall, these results provide robust support for H1, indicating that nonlinear boosting offers incremental predictive value over additive linear specifications. However, the result should be interpreted as evidence of improved predictive performance rather than causal confirmation of nonlinear behavioural mechanisms.
5.1.4. Predictive Interpretation
Overall, the repeated nested cross-validation results provide robust support for H1. Across 100 out-of-sample test-fold estimates, XGBoost consistently outperformed the regularized linear models in terms of RMSE, MAE, and R2. The pairwise Wilcoxon signed-rank tests further indicate that the predictive improvement of XGBoost over Ridge, Lasso, and Elastic Net is statistically significant. These findings suggest that nonlinear specifications capture predictive structure that is not fully represented by additive linear models. However, the results should be interpreted as evidence of improved predictive performance rather than causal confirmation of nonlinear behavioural mechanisms. Accordingly, the subsequent SHAP-based analysis is treated as an exploratory interpretation of model-learned patterns rather than a confirmatory test of causal nonlinear effects.
5.2. Linear Baseline Structure (Lasso Selection)
The Lasso model provides insight (see Table 10 below) into the dominant additive predictors under a linear specification. Trust indicators (particularly T4 and T3) exhibit the largest coefficients, followed by Switching Costs and Security items. This confirms that trust and security perceptions are central drivers of retention even within an additive framework. However, as shown in Table 7 and Table 8, the nonlinear boosted model substantially outperforms the linear baselines, suggesting that additive effects alone are insufficient to fully capture retention behaviour. The next section examines these nonlinear dynamics using SHAP-based analysis.
Table 10.
Top Lasso-Selected Predictors.
5.3. Mean Absolute SHAP Ranking
To assess the relative importance of constructs, SHAP values were computed. Table 11 reports feature importance based on mean absolute SHAP values, representing the average magnitude of each variable’s contribution to predicted retention across all observations. Trust indicators dominate the ranking, with T4 emerging as the single most influential predictor, followed by T1, T2, and T3. This confirms that trust perceptions constitute the primary driver of customer retention in the model. This finding is consistent with H2. Security indicators (PS2, PS4, and PS1) appear prominently, indicating that perceived platform security plays a substantial secondary role. Switching cost items also contribute meaningfully, suggesting that retention is partially reinforced by perceived barriers to switching. Ease of payment indicators exhibit moderate but consistent influence, while demographic factors, particularly age, display non-trivial heterogeneity effects. Overall, the ranking indicates that retention is primarily trust-driven, reinforced by security perceptions and switching barriers, with convenience and demographics playing supportive roles.
Table 11.
Top 15 Features Ranked by Mean Absolute SHAP Values.
5.4. SHAP Construct Aggregation
To assess how the trained XGBoost model allocated predictive importance across theoretical constructs, item-level SHAP values were aggregated at the construct level. Table 12 reports the mean absolute SHAP values and relative shares. Trust-related indicators accounted for the largest share of model-based predictive importance (37.7%), followed by perceived security (21.4%) and switching costs (19.0%). Ease of payment and demographics contributed smaller shares of predictive influence.
Table 12.
Construct-Level SHAP Aggregation.
These results suggest that the XGBoost model relied most heavily on trust-related information when predicting retention intention. However, the findings should be interpreted as model-based importance rankings rather than causal or confirmatory evidence. Importantly, the most influential “trust” item, T4, refers to whether the application is safe to use, which overlaps conceptually with perceived security. Therefore, the dominance of trust is interpreted cautiously and further assessed through construct-sensitivity robustness checks. Overall, the SHAP aggregation results are consistent with H2 in a predictive sense, indicating that trust-related indicators provide the strongest contribution to the model’s retention-intention predictions.
5.5. Directional Effects (Signed SHAP)
Mean signed SHAP values (reported in Table 13 below) were examined to assess the overall directional tendency of each variable across the full sample. Because SHAP values are centred around the model’s expected prediction, positive and negative contributions across observations tend to offset each other, resulting in mean signed values that are close to zero. Consequently, mean signed SHAP values should not be interpreted as measures of variable importance, but rather as indicators of net directional influence relative to the baseline prediction. The results indicate that higher Trust items generally exert a positive directional effect on retention, while higher Perceived Security perceptions similarly contribute to upward retention predictions. Switching cost indicators exhibit positive but comparatively moderate directional tendencies. Age displays a nonlinear pattern (discussed in the following section), which explains its near-zero average signed contribution despite meaningful predictive importance. Importantly, no major predictor demonstrates a strong negative average directional effect, supporting theoretical consistency across constructs and indicating that the model does not produce substantively contradictory signals relative to established retention theory.
Table 13.
Mean Signed SHAP Values (Directional Tendency).
Table 14 contrasts mean absolute SHAP values with mean signed SHAP values to clarify the distinction between importance magnitude and directional tendency. Trust exhibits the largest absolute contribution (0.510), accounting for approximately 37.7% of total model-based predictive signal, yet its mean signed SHAP value is slightly negative. This does not imply that trust reduces retention intention. Rather, it suggests that trust-related variables contribute differently across observations, depending on their value range and interaction context. In contrast, security variables display both substantial absolute SHAP values (0.290) and slightly positive signed means, suggesting a more consistently positive directional pattern in the fitted model. Switching costs exhibit meaningful absolute importance (0.258) but mixed signed tendencies, indicating that their contribution may vary across users. Ease of payment contributes more modestly (0.171), while demographic variables show smaller but non-zero model-based influence.
Table 14.
Absolute vs. Signed SHAP Comparison.
Overall, the contrast between absolute and signed SHAP values provides useful diagnostic evidence that the fitted XGBoost model may be capturing heterogeneous and potentially nonlinear predictive patterns. This is broadly consistent with the predictive logic underlying H1, H3, H5, and H7. However, these results should not be interpreted as causal or confirmatory evidence of nonlinear retention dynamics, threshold effects, or trust-security complementarity. Instead, they provide exploratory model-based indications that are further examined through SHAP dependence plots, GAM robustness analysis, and construct-sensitivity checks.
5.6. SHAP Dependence Analysis
The SHAP dependence analysis provides exploratory insight into how the fitted XGBoost model uses key predictors when generating retention-intention predictions. The patterns should be interpreted as model-based explanations rather than causal or confirmatory evidence.
Trust (T4) appears to be one of the most influential predictors and displays a nonlinear pattern (Figure 2). Lower trust values are associated with negative SHAP contributions, while higher trust values are associated with stronger positive contributions to predicted retention intention. This pattern is consistent with H3 in a predictive sense, suggesting that trust may contribute more strongly once it reaches higher levels. However, this should not be interpreted as confirmation of a causal threshold effect.
Figure 2.
SHAP dependence plot for Trust (T4).
Perceived Security (PS2) shows a generally positive and more stable pattern (Figure 3). Higher perceived security values tend to increase predicted retention intention, which is broadly consistent with H4. Compared with trust, the security pattern appears less asymmetric and more consistently positive across the observed range.
Figure 3.
SHAP dependence plot for Perceived Security (PS2).
Switching Costs (SCTB5) also show evidence of nonlinear variation (Figure 4). The SHAP pattern suggests that switching costs may contribute differently across value ranges, with stronger positive contributions at higher levels. This is consistent with H5 in an exploratory predictive sense, although the evidence should be described as threshold-like rather than as confirmation of a clear threshold mechanism.
Figure 4.
SHAP dependence plot for Switching Cost (SCTB5).
Ease of Payment (EP2) displays a generally positive relationship with predicted retention intention (Figure 5), although its contribution appears smaller than that of trust and perceived security. This suggests that payment convenience supports retention prediction but is not the dominant driver in the fitted model.
Figure 5.
SHAP dependence plot for Ease of Payment (EP).
Finally, age shows possible nonlinear heterogeneity in the SHAP dependence plot (Figure 6). However, because the sample is concentrated among younger respondents, this pattern should be interpreted cautiously at this stage. Rather than treating the SHAP pattern as confirmation of a U-shaped age effect, it is more appropriate to view it as exploratory evidence of possible age-related variation in predicted retention intention. This pattern is therefore further examined through the GAM robustness analysis reported in the subsequent section.
Figure 6.
SHAP dependence plot for Age.
Overall, the SHAP dependence plots suggest that the XGBoost model captures heterogeneous and potentially nonlinear predictive patterns across trust, perceived security, switching costs, ease of payment, and age. These findings are broadly consistent with H3, H4, H5, and H6 in a model-based predictive sense, but they should not be interpreted as causal or confirmatory evidence of nonlinear behavioural mechanisms.
Table 15 provides an exploratory functional interpretation of the SHAP dependence plots by summarising how model-based contributions vary across low, medium, and high predictor ranges. The results suggest that several predictors contribute differently across the observed value spectrum. Trust (T4) shows a nonlinear pattern, with lower values associated with negative SHAP contributions and higher values associated with positive contributions. This pattern is broadly consistent with H3 in a predictive sense, although it should not be interpreted as confirmation of a causal threshold effect. Switching Costs (SCTB5) also show value-range heterogeneity, suggesting that their contribution to predicted retention intention may become more positive at higher levels. Perceived Security (PS2) and Ease of Payment (EP2) display more consistently positive patterns across their ranges. Age appears to show nonlinear variation, but this result should be treated as exploratory given the sample’s concentration among younger respondents. Overall, the table suggests that the fitted XGBoost model captures heterogeneous predictor patterns that may not be fully represented by additive linear coefficients.
Table 15.
Detailed Functional Interpretation.
5.7. Binary Retention Classification Robustness
Following the methodology in Section 4.3.5, the binary retention classification provided a sample that is well balanced (53.7% low vs. 46.3% high retention), eliminating the need for resampling techniques and enabling stable classification without class imbalance bias. Table 16 shows the result of the predictive robustness with strong hold-out performance, with an AUC of 0.886, indicating high discriminatory ability between high- and low-retention users. Precision (0.775) and recall (0.795) demonstrate accurate identification of high-retention customers, while the F1-score (0.785) confirms balanced and stable classification performance.
Table 16.
Hold-Out Test Performance.
Figure 7 presents the ROC curve for the XGBoost classifier. The curve remains substantially above the random-classifier diagonal across thresholds, confirming robust predictive segmentation performance. The AUC of 0.886 reflects strong separability between high- and low-retention users in the hold-out test set. The binary classification robustness analysis primarily supports H1 by demonstrating that the nonlinear predictive structure remains stable under an alternative segmentation-based formulation, while also confirming the robustness and generalizability of the behavioural relationships underlying H2–H7.
Figure 7.
ROC-AUC Curve.
5.8. SHAP Interaction Analysis
To investigate non-additive effects, SHAP interaction values were computed from the trained gradient-boosted model. The resulting interaction tensor has dimensions 215 × 23 × 23, corresponding to 215 observations and 23 predictors. Table 17 reports the strongest Trust–Security interaction pairs ranked by mean absolute SHAP interaction values. These results indicate that interaction effects are concentrated in specific trust–security item combinations rather than being uniformly distributed across constructs. Several important patterns emerge. First, T4 appears in four of the top ten interaction pairs, including the two strongest interactions (T4 × PS2 and T4 × PS4). This indicates that the most influential trust dimension is also the one most strongly amplified by perceived security. Similarly, PS2 and PS4 repeatedly appear among the strongest interaction partners, suggesting that specific security dimensions act as enabling mechanisms that intensify the effect of trust on retention.
Table 17.
Strongest Trust–Security Interaction Pairs.
Second, the block-level mean Trust × Security interaction is 0.00575, which is the highest among all cross-construct interaction blocks (Table 18). Importantly, the strongest item-level interaction (T4 × PS2 = 0.01687) is approximately 2.93 times larger than this construct-level average. This indicates that interaction effects are not diffusely distributed but instead concentrated in specific trust–security dimensions that drive synergistic reinforcement.
Table 18.
Cross-Construct SHAP Interaction Strength.
Importantly, the interpretation of Trust × Security interactions requires caution because the most influential trust indicator, T4 (“This company’s application is safe to use”), conceptually overlaps with perceived security. The prominence of T4 in several leading interaction pairs may therefore partly reflect measurement proximity between safety-related trust perceptions and security evaluations, rather than a fully distinct cross-construct complementarity mechanism. For this reason, the Trust × Security interaction findings should be interpreted as preliminary model-based evidence. The robustness of this interpretation is further examined in the construct-sensitivity analysis reported later, where T4 is excluded from trust and alternatively reclassified as a security-related item.
As shown in Table 19, the Trust–Security interaction is nearly twice as strong as other cross-construct interactions.
Table 19.
Relative Dominance.
These findings provide model-based support for H7 in a predictive sense, which posits that perceived security positively moderates the relationship between trust and customer retention. The dominance of Trust × Security interaction magnitudes indicates that the model assigns larger joint predictive contributions when trust and security are jointly high. In other words, the joint contribution of trust and security is consistent with a non-additive predictive association.
If trust and security operated purely additively, interaction values would be negligible and uniformly small across constructs. Instead, the results reveal:
- Concentrated high-magnitude item-level interactions
- Dominant block-level Trust × Security synergy
- Amplification of trust effects under strong security conditions
Overall, the SHAP interaction results are broadly consistent with H7 in a predictive sense, suggesting that trust-related and security-related indicators may jointly contribute to retention-intention predictions. However, because T4 overlaps conceptually with perceived security, these findings should not be interpreted as definitive confirmation of trust-security complementarity. Instead, they provide exploratory evidence of possible non-additive predictive structure, which is evaluated more cautiously through the subsequent construct-sensitivity robustness checks.
5.9. Predicted Retention Surface Analysis
Figure 8 illustrates the fitted XGBoost model’s predicted retention-intention surface across Trust (T4) and Perceived Security (PS2). The surface suggests that predicted retention intention is highest when both trust and perceived security are high. Conversely, predicted retention is lower when either trust or security is weak, with the lowest predictions occurring when both are low. This pattern is broadly consistent with H7 in a predictive sense, as it suggests that trust-related and security-related perceptions may jointly contribute to retention-intention predictions.
Figure 8.
Predicted Retention Surface for Trust and Perceived Security.
However, the surface should be interpreted cautiously. T4 refers to whether the application is safe to use, which overlaps conceptually with perceived security. Therefore, the apparent Trust × Security interaction may partly reflect shared safety-related measurement content rather than a fully distinct complementarity mechanism. Accordingly, Figure 8 is treated as exploratory visual evidence of possible non-additive predictive structure, rather than confirmatory evidence of synergistic reinforcement. This interpretation is further examined through the construct-sensitivity robustness analysis reported later.
Table 20 provides a quadrant-based summary of the Trust × Security prediction surface. The table indicates that predicted retention intention is lowest when both trust and perceived security are low, while the highest predicted retention occurs when both are high. The intermediate quadrants suggest that high trust or high security alone may not produce the same level of predicted retention as their joint presence. This pattern is consistent with the possibility of complementarity between trust and security, but it should not be interpreted as causal evidence. Rather, it provides a model-based summary of how the fitted XGBoost model combines trust-related and security-related information when predicting retention intention.
Table 20.
Quadrant Interpretation of Trust × Security Surface.
5.10. Robustness Check
5.10.1. Generalized Additive Model (GAM) Robustness Analysis
To avoid relying exclusively on SHAP-based interpretation, a generalized additive model (GAM) was estimated using construct-level predictors. GAMs provide a transparent nonlinear modelling framework by estimating smooth functional relationships between predictors and retention intention. Specifically, smooth functions were estimated for ease of payment, perceived security, trust, switching costs, and age. This analysis serves as a robustness check to determine whether the nonlinear patterns identified by XGBoost and SHAP remain observable under a more interpretable nonlinear specification.
Table 21 reports the GAM estimation results. The model achieved a pseudo R2 of 0.7256, indicating predictive performance comparable to the XGBoost model. Among the smooth terms, trust exhibited the strongest nonlinear effect and was highly statistically significant (p < 0.001). Perceived security also showed a statistically significant nonlinear relationship with retention intention (p < 0.01), while switching costs displayed weaker but still statistically meaningful nonlinear effects (p < 0.05). In contrast, the smooth terms for ease of payment and age were not statistically significant.
Table 21.
Generalized additive model (GAM) robustness analysis.
Overall, the GAM results provide additional support for the importance of trust and perceived security in explaining retention intention and offer qualified support for nonlinear switching-cost effects. Importantly, the absence of a significant nonlinear age effect suggests that the previously observed age-related SHAP pattern should be interpreted cautiously and treated as exploratory rather than confirmatory. Accordingly, nonlinear findings are interpreted as meaningful only when they appear consistently across multiple diagnostic approaches, including SHAP and GAM analysis.
Because smoothing parameters are estimated during GAM fitting, the associated p-values may be anti-conservative. Therefore, the GAM results are interpreted as robustness diagnostics rather than formal confirmatory hypothesis tests.
GAM Smooth Function for Trust
Figure 9 presents the GAM smooth function for trust. The estimated smooth curve suggests a nonlinear positive relationship between trust and retention intention. At lower trust levels, the marginal effect on retention intention is weak or negative; however, the relationship becomes increasingly positive as trust increases, particularly beyond moderate trust levels. This pattern is broadly consistent with the SHAP dependence analysis and suggests that retention intention may respond more strongly once users develop relatively high levels of trust in the neobank platform. Importantly, the result should be interpreted as exploratory evidence of a model-learned nonlinear relationship rather than causal confirmation of a threshold mechanism.
Figure 9.
GAM smooth function for trust and retention intention.
GAM Smooth Function for Switching Costs
Figure 10 presents the GAM smooth function for switching costs. The estimated curve suggests a nonlinear and non-monotonic relationship between switching costs and retention intention. At lower switching-cost levels, the marginal effect appears weak or slightly negative, while moderate switching-cost levels are associated with stronger positive effects on retention intention. However, the relationship does not follow a simple monotonic pattern, as the marginal contribution weakens across some intermediate ranges before becoming positive again at higher switching-cost levels. This result is broadly consistent with the SHAP-based interpretation that switching costs may influence retention differently across user segments. Nevertheless, the pattern should be interpreted cautiously as exploratory evidence of heterogeneous nonlinear behaviour rather than confirmation of a single threshold mechanism.
Figure 10.
GAM smooth function for switching costs and retention intention.
GAM Smooth Function for Age
Figure 11 presents the GAM smooth function for age. The estimated curve suggests some variation in the marginal contribution of age across different age ranges; however, the smooth term was not statistically significant. Although the pattern appears nonlinear, the evidence does not support a robust age-related nonlinear effect on retention intention within the present sample. This result contrasts with the more pronounced age pattern observed in the SHAP analysis and suggests that the apparent age-related nonlinearities may be sensitive to modelling approach and sample composition. Given the relatively young user profile of the dataset and the likely limited number of older respondents, the age-related findings should be interpreted as exploratory rather than conclusive.
Figure 11.
GAM smooth function for age.
5.10.2. Construct-Sensitivity Robustness Analysis
Because T4 (“This company’s application is safe to use”) conceptually overlaps with perceived security, additional construct-sensitivity analyses were conducted. Two alternative specifications were estimated. First, T4 was excluded from the trust construct, with trust measured only using T1–T3. Second, T4 was reclassified as a perceived-security item, with trust again measured using T1–T3 and perceived security measured using PS1–PS5 plus T4. XGBoost was then re-estimated using repeated nested cross-validation under both specifications.
The results (see Table 22 below) indicate that predictive performance remains strong under both alternative construct specifications. Excluding T4 from the trust construct reduces performance relative to the original XGBoost model, but the model still achieves a mean R2 of 0.6677. Reclassifying T4 as a security item improves performance slightly compared with excluding it, producing a mean R2 of 0.6826. These findings suggest that the original predictive results are not solely driven by the inclusion of T4 within the trust construct. However, the reduction in performance relative to the original specification also indicates that safety-related perceptions embedded in T4 contribute meaningfully to the prediction of retention intention. Therefore, the interpretation of trust dominance and trust-security complementarity should be made cautiously, acknowledging conceptual overlap between trust and perceived security in neobanking contexts.
Table 22.
Construct-sensitivity analysis: T4 exclusion and reclassification.
5.10.3. Construct-Level Composite Robustness Analysis
The preceding analyses already incorporate construct-level composite specifications through the PLS-SEM-inspired benchmark, the GAM robustness analysis, and the T4 construct-sensitivity tests. In these specifications, ease of payment, perceived security, trust, switching costs, and retention intention were operationalised as composite scores, reducing item-level noise and aligning the analysis more closely with the original S-O-R/PLS-SEM framework.
Overall, the construct-level evidence supports the stability of the main predictive conclusions. The PLS-SEM-inspired benchmark shows that the theory-driven linear structure explains a meaningful share of variation in retention intention, while the GAM and XGBoost construct-level robustness models indicate that nonlinear predictive structure remains present after aggregation to the construct level. At the same time, the T4 sensitivity results show that predictive performance is somewhat affected by how trust and perceived security are operationalised. Thus, the construct-level analyses suggest that the nonlinear findings are not merely driven by individual item-level noise, but they also reinforce the need to interpret trust-related effects cautiously because of conceptual overlap between trust and perceived security.
5.10.4. Age-Distribution Transparency Analysis
To provide transparency regarding the age-related nonlinear findings, Table 23 reports the age-group distribution of the sample. The distribution indicates that the sample is concentrated primarily among younger users, with approximately 61% of respondents aged between 18 and 24 years. In contrast, only 8.85% of respondents were aged 45 years or above. This imbalance is important when interpreting the exploratory age-related nonlinear patterns identified in the SHAP analysis. Consistent with the GAM results, the relatively limited representation of older respondents suggests that the apparent age-related nonlinearities should be interpreted cautiously and not treated as conclusive evidence of a stable age-based retention pattern.
Table 23.
Age-group distribution of respondents.
5.11. Discussion of Empirical Findings
This study examines customer retention in neobanking using a theory-informed explainable machine learning framework. The results suggest that retention-intention prediction is shaped by trust-related perceptions, perceived security, switching barriers, and demographic heterogeneity, with evidence of nonlinear and non-additive predictive patterns.
XGBoost consistently outperformed the regularized linear benchmarks under repeated nested cross-validation, supporting H1 in a predictive sense. This indicates that neobanking retention may involve nonlinear and interaction-based structure beyond additive linear specifications. Trust-related indicators provided the largest share of model-based predictive importance, supporting H2. However, this result should be interpreted cautiously because the most influential trust item, T4, refers to whether the application is safe to use and therefore overlaps conceptually with perceived security.
The SHAP dependence and GAM analyses suggest that trust may contribute to retention prediction in a nonlinear manner, with higher trust values associated with stronger positive predictive contributions. This provides exploratory support for H3. Perceived security showed a more stable and generally positive predictive pattern, supporting H4 and reinforcing its role as an institutional assurance mechanism. Switching costs displayed value-range-dependent patterns, with stronger contributions at higher levels, providing qualified support for H5.
The evidence for age-related nonlinearity was weaker. Although SHAP suggested possible age-related variation, the sample was concentrated among younger respondents and the GAM smooth term was not statistically significant. Therefore, H6 receives only limited exploratory support. The interaction analysis suggested possible non-additive predictive structure between trust and security, particularly involving T4, PS2, and PS4. However, because T4 overlaps with perceived security, H7 is interpreted cautiously as model-based evidence of possible predictive interdependence rather than causal behavioural complementarity.
Overall, the findings show that explainable machine learning can complement theory-driven retention models by identifying potentially nonlinear and interaction-based patterns. However, SHAP, GAM, and interaction diagnostics explain model behaviour rather than causal mechanisms. The results should therefore be interpreted as exploratory predictive evidence that requires further validation using larger samples, longitudinal data, and more distinct measurement of trust and perceived security.
6. Implications, Limitations, and Conclusions
6.1. Theoretical Implications
This study makes four distinctive contributions that differentiate it from existing research:
6.1.1. Extension of Relationship Marketing Theory
While relationship marketing theory [21] establishes trust as central to exchange continuity, it implicitly assumes linear, additive effects. Our findings extend this framework by demonstrating that trust operates through nonlinear acceleration in digital contexts. The convex trust-retention relationship (Figure 1) reveals that trust functions as a behavioural threshold mechanism: improvements at low trust levels yield minimal retention gains, whereas equivalent improvements at high trust levels produce disproportionately stronger loyalty responses. This aligns with prospect theory’s loss aversion [27] but extends it to positive domains, suggesting that trust-building investments exhibit increasing returns to scale beyond critical thresholds.
6.1.2. Refinement of Trust-Security Complementarity
Prior research models trust and security as sequential or parallel drivers [33]. Our SHAP interaction analysis reveals an interesting relationship: synergistic complementarity where the model assigns larger joint predictive contributions when trust and security are jointly high. Retention increases substantially when moving from low to high security perceptions. This finding reframes security not merely as an antecedent to trust but as an enabling condition that amplifies trust’s behavioural impact. Theoretically, this suggests that institutional assurances (security) and relational confidence (trust) are not substitutes but mutually reinforcing mechanisms requiring joint optimisation.
6.1.3. Switching Costs as Value-Range-Dependent Predictors
The findings also contribute to research on switching costs by suggesting that their predictive contribution may vary across value ranges. Rather than showing a simple linear effect, the SHAP and GAM results indicate that switching-cost perceptions may matter more under certain conditions or at higher levels. This is broadly consistent with behavioural arguments that switching barriers may not influence all users equally. However, the evidence does not conclusively establish a single threshold mechanism. Therefore, switching costs are interpreted as heterogeneous and value-range-dependent predictors of retention intention.
6.1.4. Demographic Nonlinearity in Digital Adoption
While technology adoption research acknowledges age differences [68], the dominant practice of linear demographic controls obscures nonlinear patterns. The SHAP analysis suggests possible nonlinear age-related variation in predicted retention intention. However, the sample is concentrated among younger respondents, and the GAM robustness analysis does not provide strong support for a statistically meaningful nonlinear age effect. Therefore, this study does not claim to confirm a U-shaped age-retention relationship. Instead, it highlights age as a potentially heterogeneous demographic factor that requires further investigation using more age-balanced samples.
6.1.5. Methodological Contribution to Information Systems and FinTech Research
Methodologically, this study demonstrates how explainable machine learning can complement theory-driven digital finance research. By combining repeated nested cross-validation, a PLS-SEM-inspired benchmark, SHAP interpretation, GAM diagnostics, and construct-sensitivity checks, the study shows how predictive modelling can be used to explore nonlinear and interaction-based patterns while retaining theoretical interpretability. This contribution is methodological and diagnostic rather than causal: explainable machine learning is used to identify patterns that may inform future confirmatory research.
6.2. Managerial Implications
6.2.1. Trust Diagnostics and Trust Recovery
Managers should monitor trust-related customer indicators together with security, privacy, and service-recovery signals. In neobanking, trust is not built only through smooth transactions; it also depends on whether users believe that the platform protects their data, responds transparently to problems, and complies with responsible digital-banking practices. Therefore, trust diagnostics should include customer perceptions of platform reliability, data privacy, fraud protection, authentication safety, and transparency in the use of personal information.
Practical actions include:
- clear dispute-resolution procedures;
- fast response to failed or delayed transactions;
- transparent explanation of fees, data use, and account conditions;
- visible service-recovery channels within the app;
- proactive communication after outages, fraud alerts, or security incidents;
- clear privacy notices explaining how customer data are collected, stored, and used;
- visible security features, such as multi-factor authentication, transaction alerts, and fraud-monitoring notifications;
- regular communication about cybersecurity improvements and regulatory compliance.
These actions can help neobanks convert trust from an abstract brand perception into a visible assurance mechanism. In AI-enabled banking environments, this is particularly important because customers may be concerned about automated decision-making, data sharing, fraud detection, and personalised financial recommendations. Transparent communication about privacy protection, cybersecurity governance, and responsible data use can therefore support trust recovery and strengthen customer retention.
6.2.2. Security as a Visible Confidence Signal
Neobanks should ensure that security is not only technically robust but also visible, understandable, and institutionally credible. Practical measures include clear communication about multi-factor authentication, fraud monitoring, encryption, privacy protection, consent management, dispute-resolution procedures, and incident-response processes [91]. In AI-enabled banking applications, customers may also need reassurance about how personal data are collected, processed, and used for automated decision-making or fraud detection. Therefore, security communication should be integrated with privacy-by-design, regulatory compliance, and broader trust-building strategies. This approach treats perceived security as a visible confidence signal rather than a hidden backend technical function.
6.2.3. Retention Diagnostics Using Explainable AI
Neobanks can use explainable models as diagnostic tools to identify customers whose predicted retention is sensitive to trust, security, or switching-cost perceptions. However, these tools should support human decision-making rather than replace managerial judgement.
6.2.4. Ecosystem Integration Without Harmful Lock-In
Switching-cost findings should not be interpreted as a recommendation to create artificial friction. Instead, managers should focus on value-adding integration:
- payroll deposits;
- bill payments;
- budgeting tools;
- savings goals;
- investment features;
- subscription management.
6.2.5. Segment-Sensitive Retention Strategies
Because demographic findings are exploratory, managers should not over-target age groups. Instead, they should test whether different users respond differently to trust-building, security reassurance, and platform-integration strategies.
6.2.6. Predictive Analytics Implementation
The repeated cross-validation results suggest that nonlinear models can improve retention-intention prediction relative to linear benchmarks. For neobanks, explainable predictive models may support customer segmentation, early warning systems, and targeted retention diagnostics. However, implementation should include model monitoring, fairness checks, construct validation, and human oversight. Explainability tools such as SHAP should be used to support managerial interpretation, not to replace substantive judgement or causal testing.
6.3. Limitations and Future Research
Despite its contributions, this study has several limitations. First, the analysis relies on cross-sectional survey data, which limits the ability to infer causal relationships or examine changes in user behaviour over time. Future research could employ longitudinal data to investigate how trust, security perceptions, and retention evolve as users gain experience with digital financial platforms. Although repeated nested cross-validation, regularisation, early stopping, and learning-curve diagnostics were used to reduce overfitting concerns, the sample size remains modest for gradient-boosted modelling. The findings should therefore be interpreted as evidence of predictive feasibility rather than definitive population-level model performance. Future research should replicate the analysis using larger, more diverse, and preferably longitudinal neobanking datasets to evaluate whether the nonlinear and interaction-based patterns remain stable across customer segments and market contexts.
Second, the dataset represents neobank users in Mexico, which may limit the generalizability of the findings to other institutional or cultural contexts. Digital banking adoption patterns may differ across countries with varying financial infrastructures and regulatory environments.
Third, although explainable machine learning provides valuable insights into nonlinear relationships, the predictive models rely on self-reported perceptions rather than observed behavioural data. Future studies could combine survey data with transaction-level information to examine actual usage patterns.
The age-related findings should be interpreted with particular caution. Although the model suggests some nonlinear demographic variation, the sample is concentrated among younger users. Therefore, the evidence is insufficient to make strong claims about older neobank customers. Future research should replicate the analysis using a more age-balanced sample or administrative customer data.
Finally, future research may explore additional psychological or behavioural drivers of retention, such as perceived financial benefits, service personalization, or platform usability, to develop a more comprehensive understanding of customer loyalty in digital banking ecosystems.
6.4. Conclusions
This study examines customer retention in neobanking environments using a theory-informed explainable machine learning framework. The findings suggest that retention-intention prediction in digital financial services may involve heterogeneous and potentially nonlinear relationships that are not fully captured by traditional linear models. Across the analyses, trust-related indicators emerge as the strongest contributors to model-based retention predictions, while perceived security and switching costs also provide meaningful predictive influence.
By integrating behavioural theory with explainable predictive modelling, the study offers a more comprehensive understanding of customer retention in digital banking contexts. At the same time, the findings are interpreted cautiously as predictive and exploratory rather than causal or confirmatory evidence. The results highlight the potential importance of trust-building practices, visible security assurance, and ecosystem integration strategies in supporting long-term user engagement with digital banking platforms. More broadly, the study demonstrates how explainable machine learning methods can complement theory-driven FinTech research by identifying potentially nonlinear and interaction-based predictive patterns that warrant further investigation.
Author Contributions
Conceptualization, I.B. and T.B.; methodology, I.B.; software, H.A.; validation, A.H., T.B. and H.A.; formal analysis, I.B.; investigation, I.B.; resources, T.B.; data curation, A.H.; writing—original draft preparation, I.B.; writing—review and editing, T.B.; visualization, H.A.; supervision, T.B. All authors have read and agreed to the published version of the manuscript.
Funding
This research received no external funding.
Institutional Review Board Statement
Not applicable.
Informed Consent Statement
Not applicable.
Data Availability Statement
The raw data supporting the conclusions of this article will be made available by the authors on request.
Conflicts of Interest
Author Haseeb Ahmed was employed by Neurospheric Pty Ltd. The authors declare no conflicts of interest.
References
- Bhalla, P. Neobank Statistics and Facts by Market Size, Growth, Revenue, User Demographics, Trends and Insights. 2025. Electro IQ 2025. Available online: https://electroiq.com/stats/neobank-statistics/ (accessed on 1 March 2026).
- Grand View Research. Neobanking Market Size, Share and Industry Report, 2021–2028. Grand View Research 2023. Available online: https://www.grandviewresearch.com/industry-analysis/neobanking-market (accessed on 1 March 2026).
- Mossburg, E.; Blatchford, I.; Belkhelladi, A.; Wirnsperger, P.J.; van de Vorle, N.; Lara, C.M.; Amjad, A.; Gordon, T.; von Spreti, M. Digital Trust Maturity Survey. Deloitte 2024. Available online: https://www.deloitte.com/global/en/services/consulting-risk/perspectives/earning-and-building-greater-digital-trust-through-cyber.html (accessed on 1 March 2026).
- Ali, M.H.; Manhosh, M.M.; Pokale, N.B.; Abdul, M.; Almsibawi, A.A.; Amen, R.S.; Mhd, Z.M.; Divekar, N.; Sekhar, R. Customer churn prediction in digital banking platforms using hybrid ensemble learning with multi-dimensional behavioral analytics. In 2025 3rd International Conference on Cyber Resilience (ICCR); IEEE: Piscataway, NJ, USA, 2025; pp. 1–7. [Google Scholar]
- Boehm, J.; Grennan, L.; Singla, A.; Smaje, K. Digital Trust: Why It Matters for Businesses. McKinsey & Company 2022. Available online: https://www.mckinsey.com/capabilities/quantumblack/our-insights/why-digital-trust-truly-matters (accessed on 1 March 2026).
- Federal Trade Commission. New FTC Data Show a Big Jump in Reported Losses to Fraud to $12. 5 Billion in 2024. Federal Trade Commission 2025. Available online: https://www.ftc.gov/news-events/news/press-releases/2025/03/new-ftc-data-show-big-jump-reported-losses-fraud-125-billion-2024 (accessed on 1 March 2026).
- Accenture. Banking on AI Banking Top 10 Trends for 2024. Accenture 2024. Available online: https://www.accenture.com/content/dam/accenture/final/industry/banking/document/Accenture-Banking-Top-10-Trends-2024.pdf (accessed on 1 March 2026).
- Puente, D.; Cavazos-Arroyo, J.; Puente-Díaz, R. The impact of perceived financial security in neobanks on customer retention and the cost of switching to a traditional bank: The mediating role of trust in neobanks. Rev. Bus. Manag. 2025, 27, 1–19. [Google Scholar] [CrossRef] [Scilit]
- Qiwen, J.; Taasim, S.I.B.; Jumaat, N.J.B.; Johari, S.B. Intangible resource influence on sustainable firm performance: A qualitative analysis of Chinese firms. Perinat. J. 2026, 34, 1077–1096. [Google Scholar] [CrossRef] [Scilit]
- Levy, S. Brand bank attachment to loyalty in digital banking services: Mediated by psychological engagement with service platforms and moderated by platform types. Int. J. Bank Mark. 2022, 40, 679–700. [Google Scholar] [CrossRef] [Scilit]
- Naeem, M.; Jawaid, S.T.; Mustafa, S. Intention-retention phenomenon for online banking services in Pakistan: An application of technology acceptance model and expectation continuance theory. J. Model. Manag. 2026, 21, 826–875. [Google Scholar] [CrossRef] [Scilit]
- Indra, S.; Mohan, R. The missing links in neobanks. In AI and Business, and Innovation Research: Understanding the Potential and Risks of AI for Modern Enterprises; Springer Nature: Cham, Switzerland, 2023; pp. 403–418. [Google Scholar]
- Bolar, K.; Kv, A.; Nambiar, B. Customer service excellence in banking: A learning framework integrating 3Cs and digital feedback. Learn. Organ. 2026, 33, 470–485. [Google Scholar] [CrossRef] [Scilit]
- Dewi, R.P.L.; Ketut, R.I. The role of trust in mediating the effect of perceived risk and subjective norm on continuous usage intention on gopay users in denpasar. Russ. J. Agric. Soc.-Econ. Sci. 2020, 108, 69–80. [Google Scholar]
- Bergmann, M.; Maçada, A.C.G.; Sánchez, M.A.; Medeiros, M.M.D. Determinants of continuance intention to use fintechs in the Brazilian context: An expectation factors perspective. Int. J. Bank Mark. 2026, 1–21. [Google Scholar] [CrossRef] [Scilit]
- Alnoor, A.; Al-Abrrow, H.; Al Halbusi, H.; Khaw, K.W.; Chew, X.; Al-Maatoq, M.; Alharbi, R.K. Uncovering the antecedents of trust in social commerce: An application of the non-linear artificial neural network approach. Compet. Rev. 2022, 32, 492–523. [Google Scholar] [CrossRef] [Scilit]
- Rana, M.S.; Chouksey, A.; Hossain, S.; Sumsuzoha, M.; Bhowmik, P.K.; Hossain, M.; Rabby, M.F.; Gurung, N.; Zeeshan, M.A.F. AI-driven predictive modeling for banking customer churn: Insights for the US financial sector. J. Ecohumanism 2025, 4, 3478–3497. [Google Scholar] [CrossRef] [Scilit]
- Harris, H. Predictive customer retention models for fintech using cloud AI tool chains. Famous J. Artif. Intell. Eng. 2025, 3, 50–56. [Google Scholar]
- Liao, M.; Gu, Q.; Liu, X. Tourist mobility in digital age: A multi-dimensional analysis of cyber human activity and physical factors. Inf. Geogr. 2026, 2, 100043. [Google Scholar] [CrossRef] [Scilit]
- Dikaoui, O. Impact evaluation of the transparency on the perceived trust: The case of Moroccan commercial banks. Manag. Sci. Adv. 2026, 3, 142–157. [Google Scholar] [CrossRef] [Scilit]
- Morgan, R.M.; Hunt, S.D. The commitment-trust theory of relationship marketing. J. Mark. 1994, 58, 20–38. [Google Scholar] [CrossRef] [Scilit]
- Arruda Filho, E.J.M.; Carneiro, M.P.; Poleto, T. Balancing privacy and prestige: Exploring trust and technological adoption in the digital era. J. Res. Interact. Mark. 2026, 1–28. [Google Scholar] [CrossRef] [Scilit]
- Zhu, T.; Zhang, Y. Streamer characteristics and brand identification in livestream commerce: Evidence from time-honored brands. J. Theor. Appl. Electron. Commer. Res. 2026, 21, 85. [Google Scholar] [CrossRef] [Scilit]
- Wusko, A.U. Security, trust, and transaction convenience in mobile banking: A moderated mediation model of usage decision and satisfaction. Glob. Rev. Tour. Soc. Sci. 2026, 2, 191–206. [Google Scholar]
- Junior Ladeira, W.; Hasan Jafar, S.; de Oliveira Santini, F. A meta-analysis of technological adoption of financial services: Investigating risk and trust perception effects. Int. J. Bank Mark. 2026, 44, 393–421. [Google Scholar] [CrossRef] [Scilit]
- Zhou, T. Understanding users’ initial trust in mobile banking: An elaboration likelihood perspective. Comput. Hum. Behav. 2012, 28, 1518–1525. [Google Scholar] [CrossRef] [Scilit]
- Kahneman, D.; Tversky, A. Prospect theory: An analysis of decision under risk. In Handbook of the Fundamentals of Financial Decision Making: Part I; World Scientific: Singapore, 2013; pp. 99–127. [Google Scholar]
- Zheng, Y.; Jiang, H.; Yang, Z. When effort fuels risk: Cognitive exertion increases risk-taking for gains but reduces it for losses. Cogn. Affect. Behav. Neurosci. 2026, 26, 469–483. [Google Scholar] [CrossRef] [Scilit]
- Jamil, K.; Anwar, A.; Mustafa, S. How humanoid chatbot interaction quality builds trust and loyalty in hospitality? A mixed-method approach. J. Hosp. Mark. Manag. 2026, 35, 518–557. [Google Scholar] [CrossRef] [Scilit]
- Mondego, D.Y.; Gide, E. Exploring the factors that have impact on consumers’ trust in mobile payment systems in Australia. J. Inf. Syst. Technol. Manag. 2020, 17, e202017009. [Google Scholar] [CrossRef] [Scilit]
- Sa’diyah, M.H.; Soegoto, D.S. The effect of perceived security towards intention to use digital payment through a trust. In Proceeding of the International Conference on Business, Economics, Social Sciences, and Humanities; Universitas Komputer: Bandung, Indonesia, 2021; Volume 4, pp. 233–238. [Google Scholar]
- Poudel, O.; Acharya, P.; Simkhada, D. Customers’ trust in e-payment: The influence of security and privacy. J. Sci. Res. 2023, 6, 97–112. [Google Scholar] [CrossRef] [Scilit]
- Almaiah, M.A.; Al-Otaibi, S.; Shishakly, R.; Hassan, L.; Lutfi, A.; Alrawad, M.; Qatawneh, M.; Alghanam, O.A. Investigating the role of perceived risk, perceived security and perceived trust on smart m-banking application using SEM. Sustainability 2023, 15, 9908. [Google Scholar] [CrossRef] [Scilit]
- Basurto-Cedeno, E.; Pennington-Gray, L. The double-edged role of institutional trust in crisis management: From protective mechanism to risk amplifier. J. Contingencies Crisis Manag. 2026, 34, e70130. [Google Scholar] [CrossRef] [Scilit]
- Chen, Q.; Xu, T.; Guo, Z. Greenwashing versus genuine green: An evolutionary game of corporate strategy, investor trust, and ESG regulation. Complexity 2026, 2026, 5544315. [Google Scholar] [CrossRef] [Scilit]
- Herzberg, F. Work and the Nature of Man; Crowell Company: Washington, DC, USA, 1966. [Google Scholar]
- Simon, J.V.; Hamedani, S.S.; Aslam, S.; Akbar, M. What keeps clients coming back? Rethinking loyalty through the lens of service superiority. Veredas Direito 2025, 22, e223522. [Google Scholar] [CrossRef] [Scilit]
- Rosenbaum, M.S.; Baniya, R.; Passyn, K.A. From loss prevention to customer loss: Shopper responses to caged servicescapes. Int. Rev. Retail Distrib. Consum. Res. 2025, 1–20. [Google Scholar] [CrossRef] [Scilit]
- Yu, Y.; Davis, F. An approach-avoidance model of user satisfaction and dissatisfaction. J. Comput. Inf. Syst. 2025, 1–18. [Google Scholar] [CrossRef] [Scilit]
- Greulich, M.; Lins, S.; Pienta, D.; Thatcher, J.B.; Sunyaev, A. Exploring contrasting effects of trust in organizational security practices and protective structures on employees’ security-related precaution taking. Inf. Syst. Res. 2024, 35, 1586–1608. [Google Scholar] [CrossRef] [Scilit]
- Chang, H.C.; Lund, B.D.; Beuerlein, E.; Mote, C. Investigating the symbiotic relationship between artificial intelligence and blockchain to promote zero-trust cybersecurity in an evolving information ecosystem. Inf. Discov. Deliv. 2025. [Google Scholar] [CrossRef] [Scilit]
- Wang, S.; Asif, M.; Shahzad, M.F.; Ashfaq, M. Data privacy and cybersecurity challenges in the digital transformation of the banking sector. Comput. Secur. 2024, 147, 104051. [Google Scholar] [CrossRef] [Scilit]
- Addula, S.R. Analysis of Perceived Ease of Use and Security on the Mobile Banking Adoption. Doctoral Dissertation, University of the Cumberlands, Williamsburg, KY, USA, 2024. [Google Scholar]
- Zhang, W.; Siyal, S.; Riaz, S.; Ahmad, R.; Hilmi, M.F.; Li, Z. Data security, customer trust and intention for adoption of Fintech services: An empirical analysis from commercial bank users in Pakistan. SAGE Open 2023, 13, 21582440231181388. [Google Scholar] [CrossRef] [Scilit]
- Hassan, M.S.; Mai, N.H.; Wahab, N.S.A.; Amin, M.B.; Hassan, M.M.; Oláh, J. Decentralized fintech platforms adoption intention in cyber risk environment among GenZ: A dual-method approach using PLS-SEM and necessary condition analysis. Comput. Hum. Behav. Rep. 2025, 18, 100687. [Google Scholar] [CrossRef] [Scilit]
- Tan, K.L.; Leong, C.M.; Richter, N.F. Navigating trust in mobile payments: Using necessary condition analysis to identify must-have factors for user acceptance. Int. J. Hum.-Comput. Interact. 2025, 41, 3325–3339. [Google Scholar] [CrossRef] [Scilit]
- Zeng, F.; Hu, B. The impact of social trust on the development of digital finance. Int. J. Financ. Stud. 2025, 13, 232. [Google Scholar] [CrossRef] [Scilit]
- Chen, J.; Syed Shah, S.A.; Zhu, T. Reducing switching costs to promote competition: The case of mobile number portability. Rev. Ind. Organ. 2026, 1–28. [Google Scholar] [CrossRef] [Scilit]
- Jose, A.; Mathew, S.; Gilde, R.; Chacko, D.P.; Thomas, A.K. The role of switching cost in the e-service recovery framework among banking customers. Int. J. Qual. Serv. Sci. 2022, 14, 86–109. [Google Scholar] [CrossRef] [Scilit]
- Bağcı, R.B. Investigating price premiums for sustainable product–service systems: A behavioral reasoning perspective on the perceived benefits and switching costs. Bus. Strategy Environ. 2026; in press.
- Xu, L.; Sun, Y.; Hsu, Y.T.; Chiu, Y.L. The effects of personalized recommendations on perceived switching costs: The mediation roles of customer satisfaction and habits. Electron. Mark. 2025, 35, 80. [Google Scholar] [CrossRef] [Scilit]
- Ribeiro, H.; Barbosa, B.; Moreira, A.C.; Rodrigues, R.G. Determinants of churn in telecommunication services: A systematic literature review. Manag. Rev. Q. 2024, 74, 1327–1364. [Google Scholar] [CrossRef] [Scilit]
- Lin, J.S.C.; Lin, C.Y.; Wu, C.Y. The hidden power of anticipated regret: How it shapes switching barrier-based service retention decisions. J. Serv. Mark. 2026, 1–19. [Google Scholar] [CrossRef] [Scilit]
- Ouyang, L.; Mak, J. Examining how switching barriers moderate the link between customer satisfaction and repurchase intention in the health and fitness club sector. Asia Pac. J. Mark. Logist. 2026, 38, 529–547. [Google Scholar] [CrossRef] [Scilit]
- Afandi, M.A. Switching intentions among millennial banking customers to fintech lending. Int. J. Islam. Econ. Financ. 2020, 3, 283–304. [Google Scholar] [CrossRef] [Scilit]
- Yoon, C.; Lim, D. Customers’ intentions to switch to internet-only banks: Perspective of the push-pull-mooring model. Sustainability 2021, 13, 8062. [Google Scholar] [CrossRef] [Scilit]
- Tanuwijaya, E.; Oktavia, T. Analysis of the factors influencing customer switching behaviour of the millennials in digital banks. J. Syst. Manag. Sci. 2023, 13, 122–133. [Google Scholar] [CrossRef] [Scilit]
- Ngau, C.M.; Zins, A.H.; Rengasamy, D. Why do bank customers switch? A systematic literature review. Int. J. Bank Mark. 2023, 41, 1308–1329. [Google Scholar] [CrossRef] [Scilit]
- Mackay, A.C.; Zuo, L.; Kebe, I.A. Driving customer loyalty in digital banking: The mediating role of engagement and the moderating role of switching costs. S. Afr. J. Bus. Manag. 2025, 56, 5112. [Google Scholar] [CrossRef] [Scilit]
- Dwivedi, Y.K.; Rana, N.P.; Jeyaraj, A.; Clement, M.; Williams, M.D. Re-examining the unified theory of acceptance and use of technology (UTAUT): Towards a revised theoretical model. Inf. Syst. Front. 2019, 21, 719–734. [Google Scholar] [CrossRef] [Scilit]
- Malik, M.; Zhengmeng, C.; Hussain, M.; Hussain, S. Exploring customer retention dynamics: A comparative investigation of factors affecting customer retention in the banking sector using mediation-moderation approach. Heliyon 2024, 10, e36919. [Google Scholar] [CrossRef] [Scilit]
- Menon, V.A.; Kumar, S.; Shivani, A. Technology usage attitude and internet of behavior: A study of Chinese social media apps in Kerala. In Conflict and Representation in Online Communication; IGI Global Scientific Publishing: Hershey, PA, USA, 2026; pp. 41–62. [Google Scholar]
- Aliakhbar, I.H.; Anshari, M.; Masri, M. Digital wallets as enablers of sustainable digital finance for ESG integration and global sustainability goals. S. Asian J. Bus. Stud. 2026, 1–22. [Google Scholar] [CrossRef] [Scilit]
- Lambert-Pandraud, R.; Laurent, G. Why do older consumers buy older brands? The role of attachment and declining innovativeness. J. Mark. 2010, 74, 104–121. [Google Scholar] [CrossRef] [Scilit]
- Shrestha, R.M.; Adhikari, R.; Adhikari, S. Customer loyalty and switching behavior in banking services: A primary survey of Kathmandu valley bank customers. Acad. J. Res. Innov. 2026, 2, 16–44. [Google Scholar] [CrossRef] [Scilit]
- Liu, Y.; Ahmad, M.K. Digital stress and psychological outcomes in digital natives and digital immigrants: A systematic literature review. J. Intercult. Commun. 2026, 26, 1–18. [Google Scholar] [CrossRef] [Scilit]
- Yu, Y.; He, L.; Lai, C.Y.; Hong, W.F. Bridging the older adult digital divide through the digital habitus. J. Aging Res. 2026, 2026, 6656355. [Google Scholar] [CrossRef] [Scilit]
- Morris, M.G.; Venkatesh, V. Age differences in technology adoption decisions: Implications for a changing work force. Pers. Psychol. 2000, 53, 375–403. [Google Scholar] [CrossRef] [Scilit]
- Moxley, J.; Sharit, J.; Czaja, S.J. The factors influencing older adults’ decisions surrounding adoption of technology: Quantitative experimental study. JMIR Aging 2022, 5, e39890. [Google Scholar] [CrossRef] [Scilit] [PubMed]
- Xu, J.; Prayag, G.; Song, H. The effects of consumer brand authenticity, brand image, and age on brand loyalty in time-honored restaurants: Findings from SEM and fsQCA. Int. J. Hosp. Manag. 2022, 107, 103340. [Google Scholar] [CrossRef] [Scilit]
- Phua, P.; Kennedy, R.; Trinh, G.; Page, B.; Hartnett, N. Examining older consumers’ loyalty towards older brands in grocery retailing. J. Retail. Consum. Serv. 2020, 52, 101893. [Google Scholar] [CrossRef] [Scilit]
- Grable, J.; Lytton, R.H. Financial risk tolerance revisited: The development of a risk assessment instrument. Financ. Serv. Rev. 1999, 8, 163–181. [Google Scholar] [CrossRef] [Scilit]
- Finke, M.S.; Huston, S.J. The brighter side of financial risk: Financial risk tolerance and wealth. J. Fam. Econ. Issues 2003, 24, 233–256. [Google Scholar] [CrossRef] [Scilit]
- Frank, C.C.; Mottola, G.R.; Chen, M.; Yu, L.; Boyle, P.A.; Samanez-Larkin, G.R.; Seaman, K.L. Overconfidence and financial risk tolerance in older age. J. Gerontol. Ser. B 2025, 80, gbaf032. [Google Scholar] [CrossRef] [Scilit] [PubMed]
- CIGI. CIGI-Ipsos Global Survey on Internet Security and Trust. Centre for International Governance Innovation 2019. Available online: https://www.cigionline.org/cigi-ipsos-global-survey-internet-security-and-trust/ (accessed on 1 March 2026).
- Haans, R.F.; Pieters, C.; He, Z.L. Thinking about U: Theorizing and testing U-and inverted U-shaped relationships in strategy research. Strategy Manag. J. 2016, 37, 1177–1195. [Google Scholar] [CrossRef] [Scilit]
- Aiken, L.S.; West, S.G.; Reno, R.R. Multiple Regression: Testing and Interpreting Interactions; Sage: Sauzende Oaks, CA, USA, 1991. [Google Scholar]
- Wang, P.; Ding, H. The rationality of explanation or human capacity? Understanding the impact of explainable artificial intelligence on human-AI trust and decision performance. Inf. Process. Manag. 2024, 61, 103732. [Google Scholar] [CrossRef] [Scilit]
- Cheng, M.; Xu, T.; Chen, W.; Fang, W.; Yao, M.; Liu, J.; Wang, Z. DLGTrust: Graph neural network-based trust evaluation using dynamic line graph. Inf. Process. Manag. 2026, 63, 104455. [Google Scholar] [CrossRef] [Scilit]
- Chahoud, M.; Mourad, A.; Otrok, H.; Bentahar, J.; Guizani, M. Trust driven On-Demand scheme for client deployment in Federated Learning. Inf. Process. Manag. 2025, 62, 103991. [Google Scholar] [CrossRef] [Scilit]
- Pustokhina, I.V.; Pustokhin, D.A.; Rh, A.; Jayasankar, T.; Jeyalakshmi, C.; Díaz, V.G.; Shankar, K. Dynamic customer churn prediction strategy for business intelligence using text analytics with evolutionary optimization algorithms. Inf. Process. Manag. 2021, 58, 102706. [Google Scholar] [CrossRef] [Scilit]
- Wang, C. Efficient customer segmentation in digital marketing using deep learning with swarm intelligence approach. Inf. Process. Manag. 2022, 59, 103085. [Google Scholar] [CrossRef] [Scilit]
- Xu, Z.; Zhu, G.; Metawa, N.; Zhou, Q. Machine learning based customer meta-combination brand equity analysis for marketing behavior evaluation. Inf. Process. Manag. 2022, 59, 102800. [Google Scholar] [CrossRef] [Scilit]
- van Braak, B.; Osterrieder, J.R.; Machado, M.R. How can consumers without credit history benefit from the use of information processing and machine learning tools by financial institutions? Inf. Process. Manag. 2025, 62, 103972. [Google Scholar] [CrossRef] [Scilit]
- Islam, J.U.; Shahid, S.; Rasool, A.; Rahman, Z.; Khan, I.; Rather, R.A. Impact of website attributes on customer engagement in banking: A solicitation of stimulus-organism-response theory. Int. J. Bank Mark. 2020, 38, 1279–1303. [Google Scholar] [CrossRef] [Scilit]
- Harris, L.C.; Goode, M.M. Online servicescapes, trust, and purchase intentions. J. Serv. Mark. 2010, 24, 230–243. [Google Scholar] [CrossRef] [Scilit]
- Clemes, M.D.; Gan, C.; Zhang, D. Customer switching behaviour in the Chinese retail banking industry. Int. J. Bank Mark. 2010, 28, 519–546. [Google Scholar] [CrossRef] [Scilit]
- Chen, T.; Guestrin, C. XGBoost: A scalable tree boosting system. In Proceedings of the 22nd ACM SIGKDD International Conference on Knowledge Discovery and Data Mining, San Francisco, CA, USA, 13–17 August 2016; pp. 785–794. [Google Scholar]
- Lundberg, S.M.; Lee, S.I. A unified approach to interpreting model predictions. Adv. Neural Inf. Process. Syst. 2017, 4768–4777. [Google Scholar]
- Perwej, A.; Supreeth, B.R.; Chopra, P.; Najar, A.M.; Manikandan, G.; Tiwari, M. Deep Neural Networks for Real-Time Customer Retention Forecasting in Digital Banking Platforms. In 2025 Tenth International Conference on Science Technology Engineering and Mathematics (ICONSTEM); IEEE: Piscataway, NJ, USA, 2025; pp. 1–9. [Google Scholar]
- NIST. The NIST Cybersecurity Framework (CSF) 2.0; National Institute of Standards and Technology: Gaithersburg, MD, USA, 2024. [CrossRef] [Scilit]
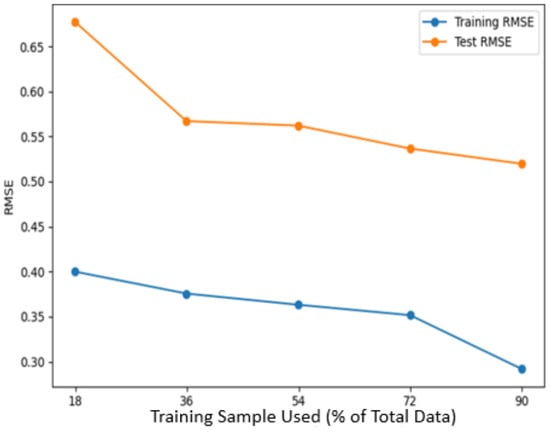
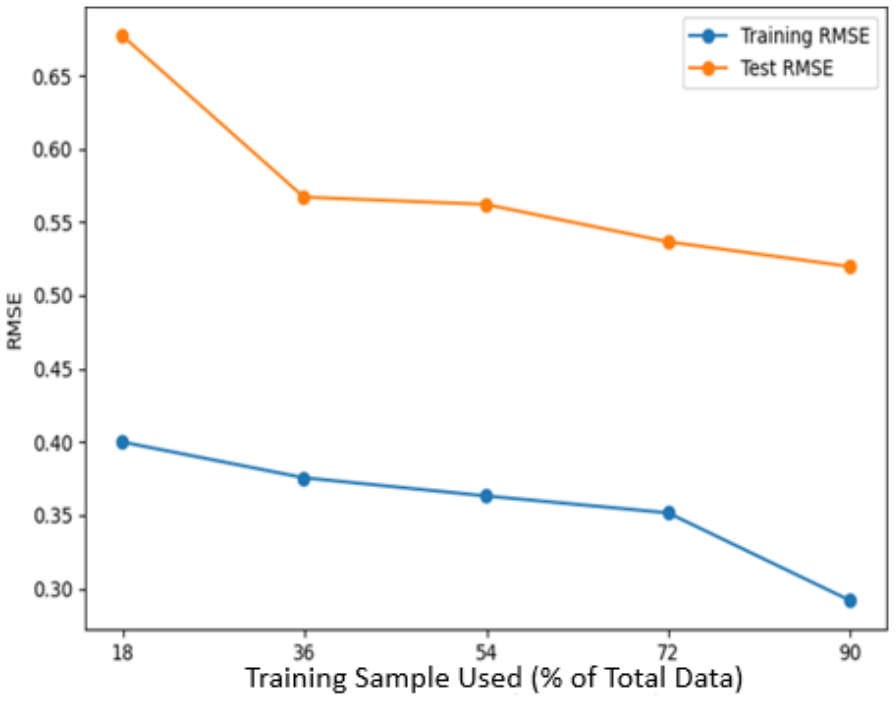
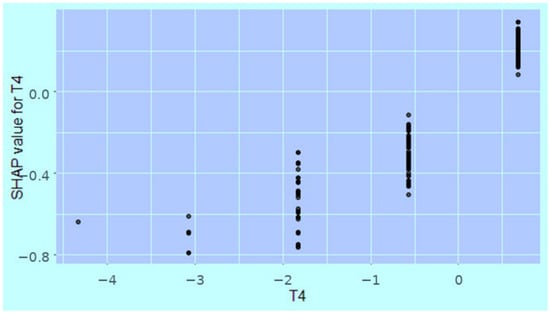
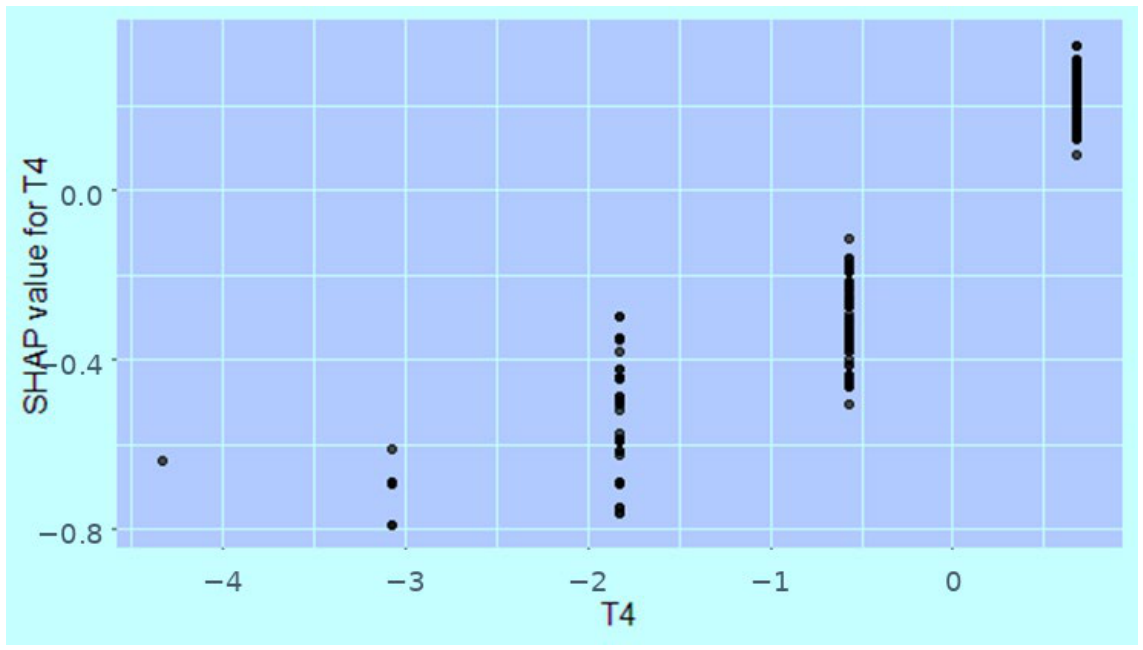
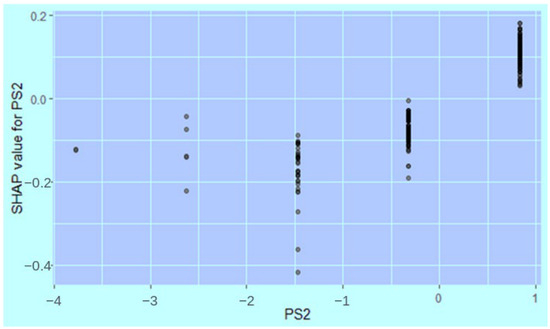
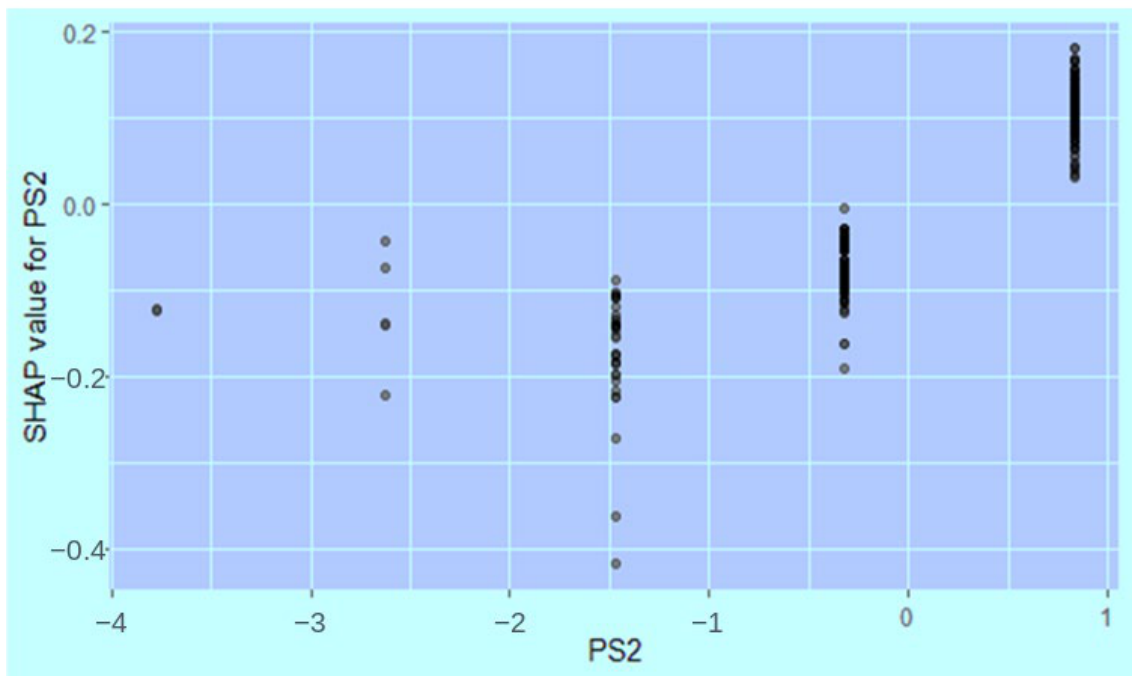
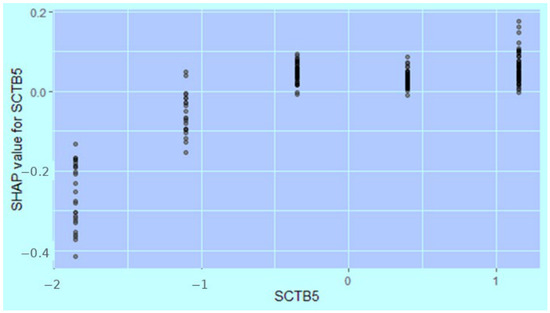
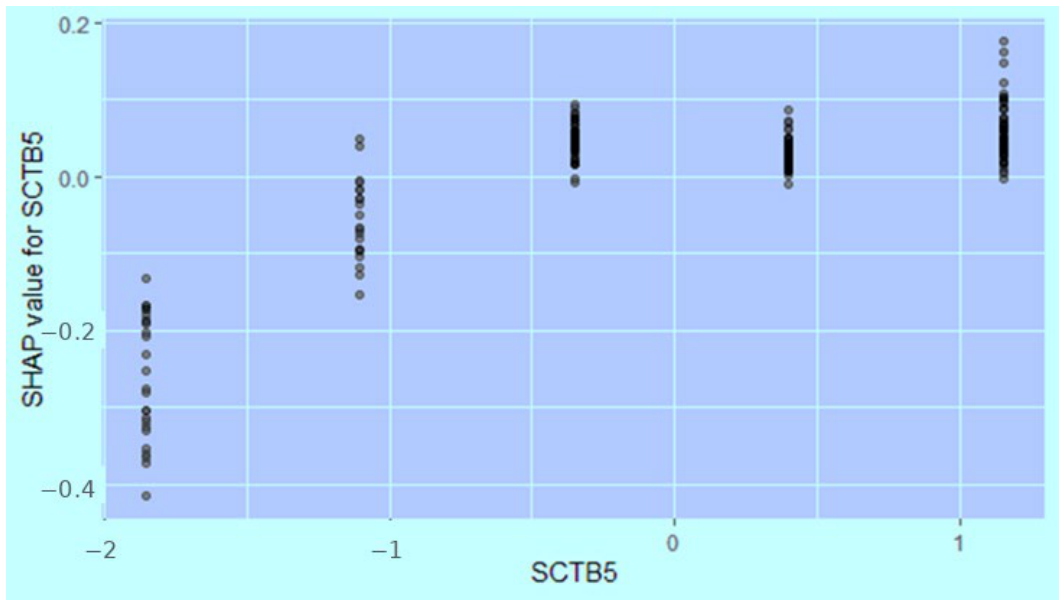
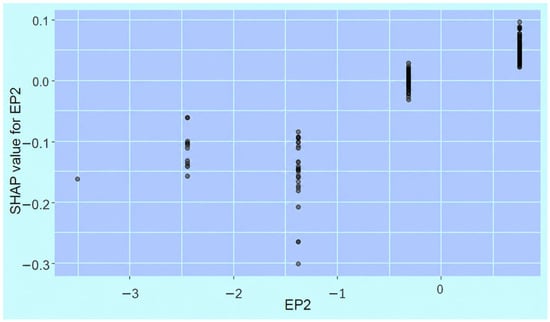
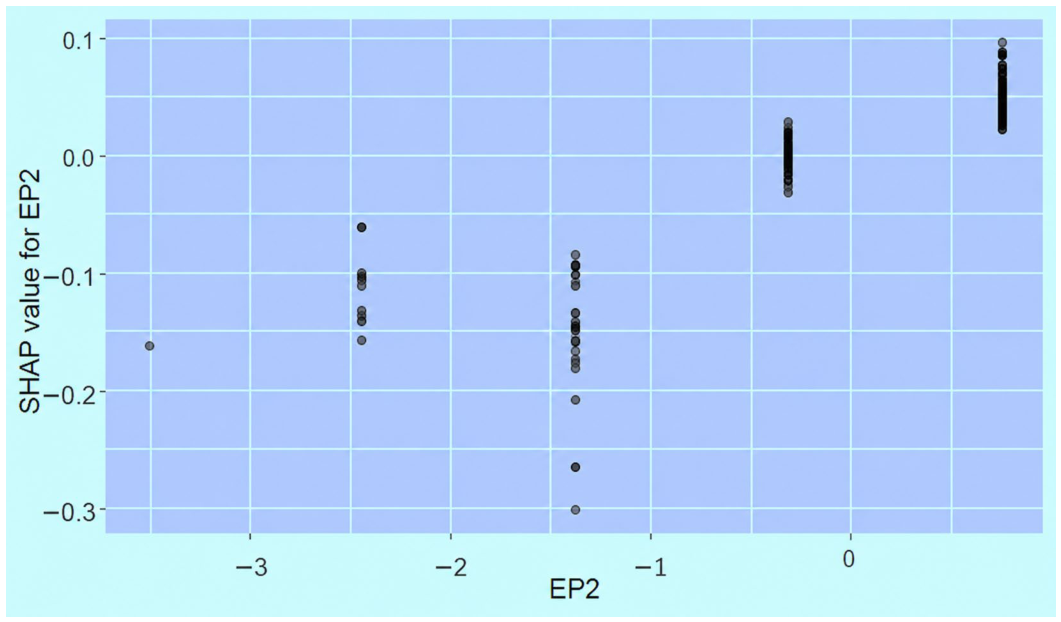
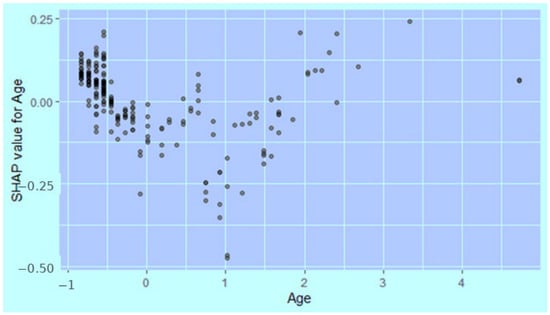
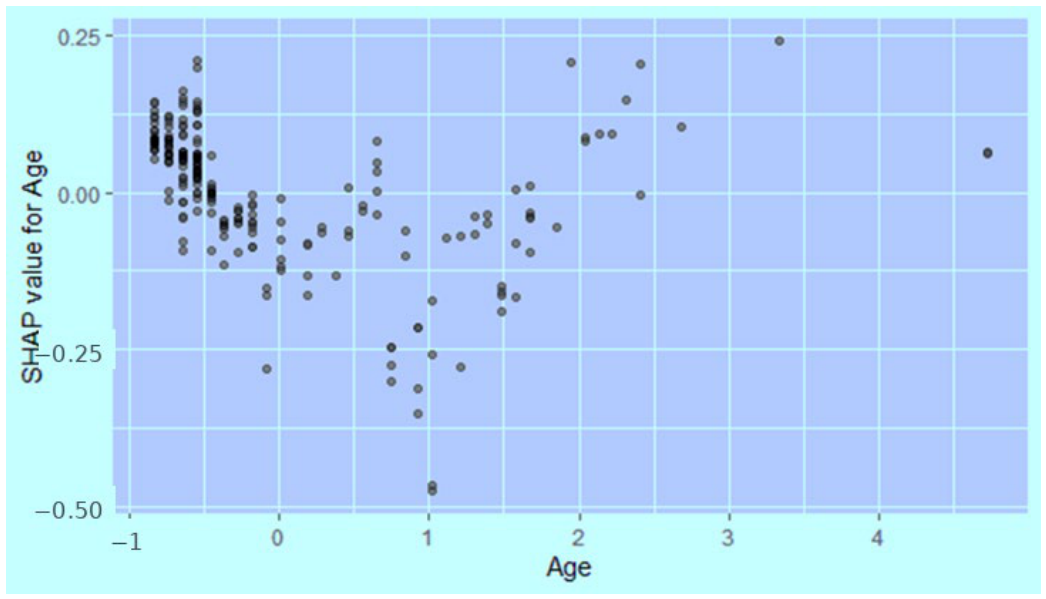
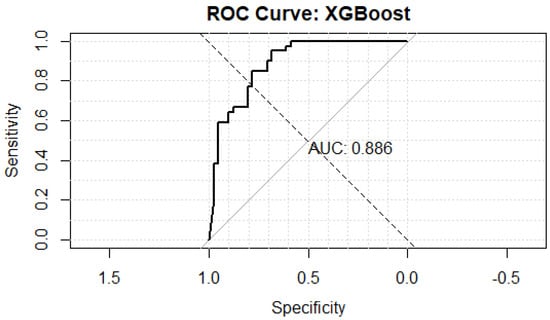
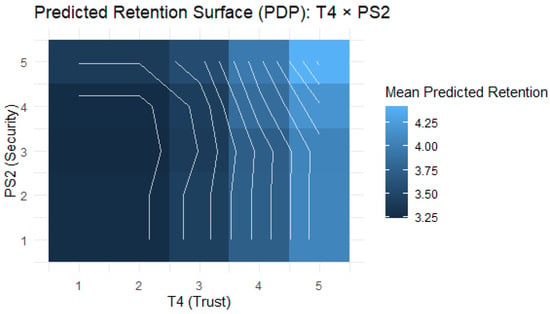
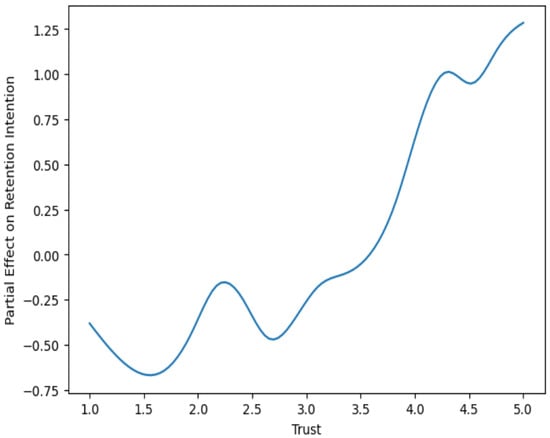
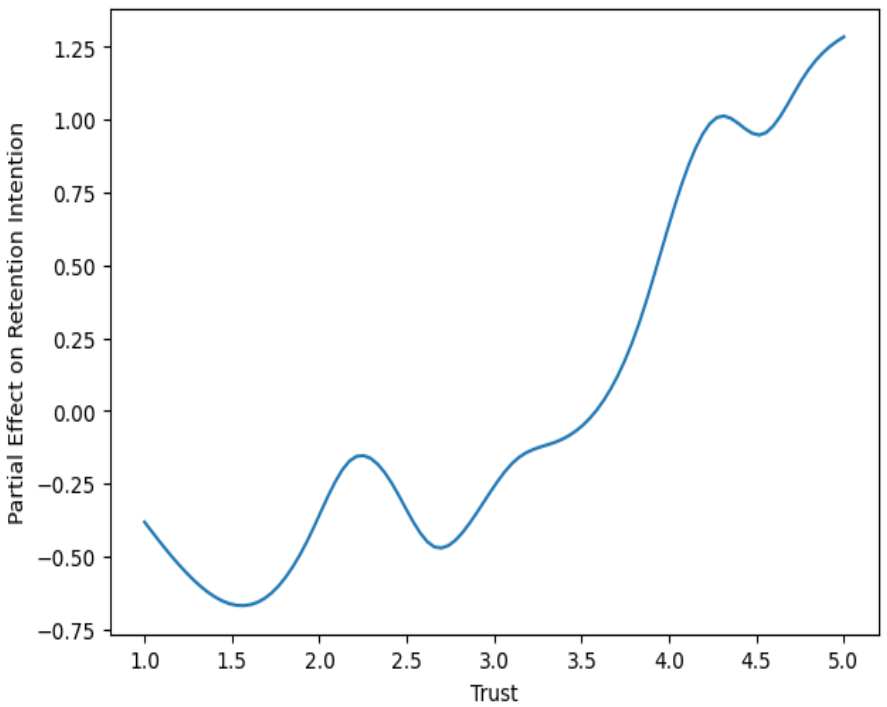
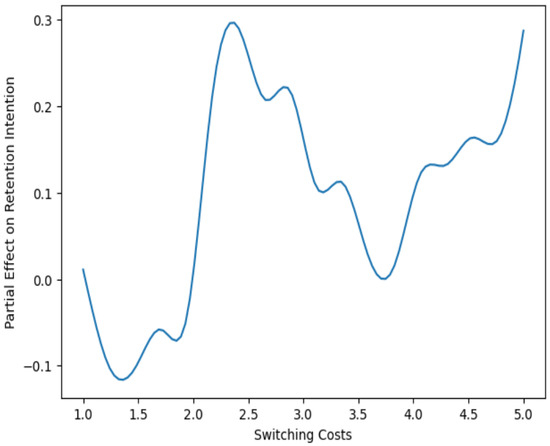
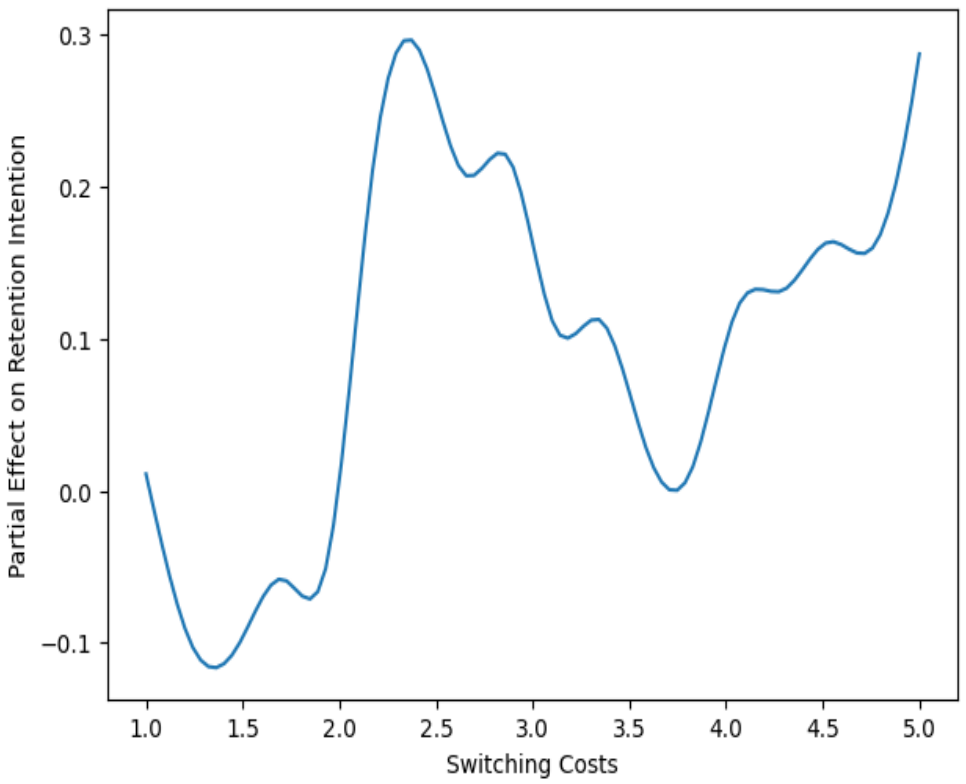
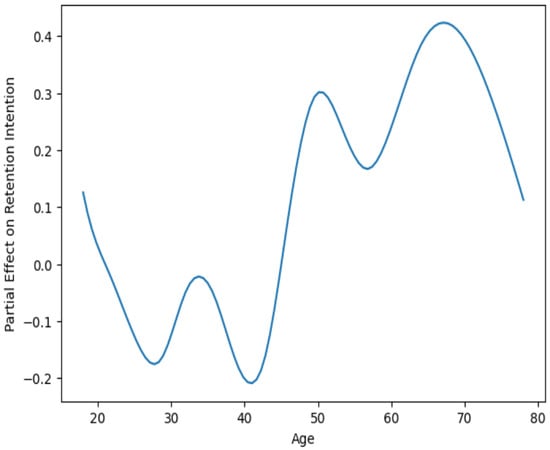
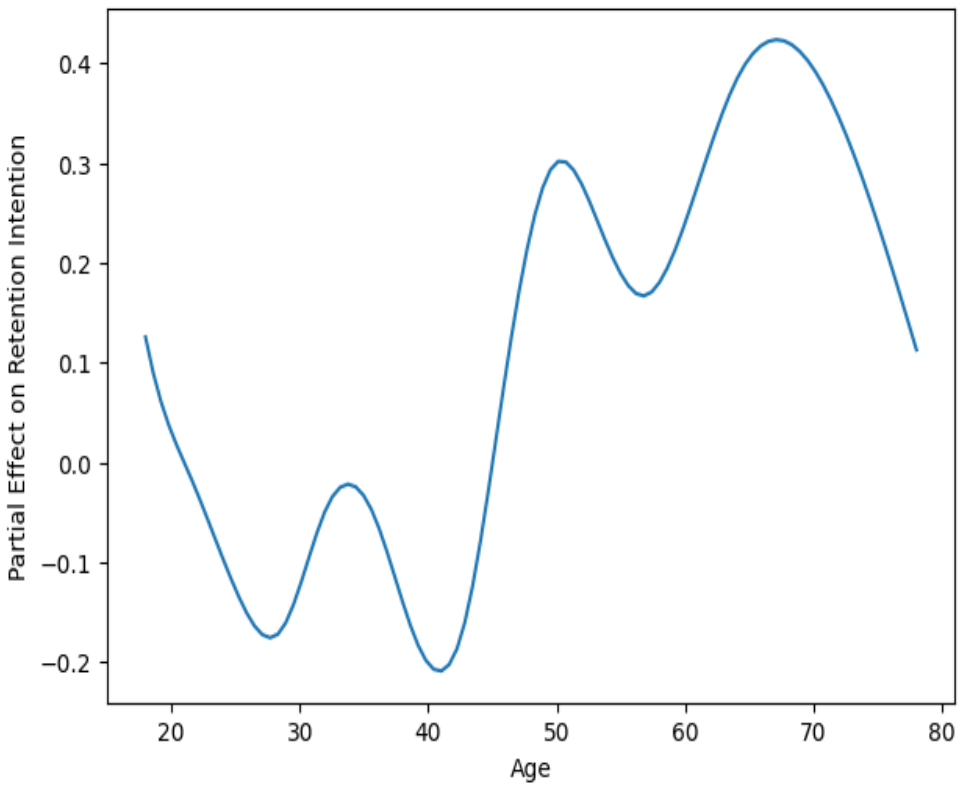

Disclaimer/Publisher’s Note: The statements, opinions and data contained in all publications are solely those of the individual author(s) and contributor(s) and not of MDPI and/or the editor(s). MDPI and/or the editor(s) disclaim responsibility for any injury to people or property resulting from any ideas, methods, instructions or products referred to in the content. |
© 2026 by the authors. Licensee MDPI, Basel, Switzerland. This article is an open access article distributed under the terms and conditions of the Creative Commons Attribution (CC BY) license.