


Abstract
High-entropy alloys (HEAs) show excellent mechanical properties, but their enormous compositional space makes experimental and computational exploration expensive. This study predicts the Vickers hardness (HV) of HEAs from nominal elemental compositions (at.%) using a composition-based stacking ensemble machine learning approach without the use of handcrafted descriptors. A dataset of 120 vacuum arc-melted (VAM) HEAs containing 15 constituent elements (Re, Ru, Al, Si, Ti, Cr, Fe, Co, Ni, Zr, Nb, Mo, Hf, Ta, and W) was compiled. Four baseline models, k-nearest neighbors (KNN), support vector regression (SVR), extreme gradient boosting (XGB), and artificial neural networks (ANN), were evaluated. SVR achieves the highest baseline performance (R2 = 0.90). Stacking ensembles with the SVR meta-learner improved the weaker base learner performance by 17.20% and 12.50% for KNN-SVR and ANN-SVR respectively, relative to their base models. The best-performing stacking ensemble, XGB-SVR, only results in a minimal improvement of 2.90% compared to SVR. Ru, Re, and Al as the strongest positive contributors to hardness, as well as Fe, Co, and Ni as the strongest negative contributors, are identified with an interpretability test using permutation feature importance (PFI) and Shapley additive explanations (SHAP). Validation on the held-out compositions showed prediction errors below 7%. This study indicates that the composition-only models could form the basis for an effective and interpretable approach for rapid HEAs hardness screening. However, the investigated stacking strategy offers limited benefit compared to the best-performing baseline model.
1. Introduction
Development of advanced engineering materials increasingly depends on the development of alloys that combine multiple elements to improve mechanical performance and functional properties. Conventional alloys focus on a single main element with minor alloying additions. This causes their limitations in balancing different properties [1]. To address these challenges, several principal elements are mixed in similar amounts to obtain new compounds known as high-entropy alloys (HEAs). The definitive meaning of HEAs could be described according to elemental configuration or thermodynamic conditions [2,3]. According to the compositional perspective, HEAs could be defined as a type of alloys with five or more principal elements, where each element consists of up to 5–35 at.% of the whole composition. However, additional minor alloying elements might be present to improve final mechanical properties. Meanwhile, from the thermodynamic condition, unique features of HEAs are defined according to the high configurational entropy of the whole system. This configuration comes from the random distribution of various constituent elements that form the crystal lattice, which later favors the formation of stable single-phase or dual-phase solutions, rather than brittle intermetallic ones [4]. This configuration is also responsible for HEAs’ corrosion resistance [5], thermal stability [6], and a balanced strength and hardness combination [7], which makes them highly regarded in the development of advanced materials. All these advantages make HEAs a promising option for various challenging applications, such as aerospace [8], energy [9], and hydrogen technologies [10,11].
The performance of HEAs has been investigated by numerous studies to enhance their capabilities, one of which is by varying the composition of the multi-principal-element systems. However, as the compositional space of HEAs could reach up to 1078, trial-and-error experimental exploration proved to be expensive and difficult [12]. Conventional material exploration involves experimentation and characterization that are impractical with the growing costs for each sample and the need for specialized equipment that is not always available in resource-limited environments [13]. This is especially relevant in HEA’s fabrication method, such as vacuum arc melting (VAM) [14]. The use of computational screening techniques is thus encouraged by prioritizing promising compositions before the actual experiment is performed, rather than blindly searching the compositional space. Some of the traditional computational approaches include density functional theory (DFT), calculation of the phase distribution (CALPHAD), and molecular dynamics (MD). These techniques are widely employed to predict the thermodynamic, structural, electronic, and mechanical properties of high-entropy alloys with physics-based simulations as they are relatively accurate and physically interpretable [4,15,16,17]. Even so, conventional computational methods have been widely recognized as computationally demanding, especially with the multicomponent nature of HEA systems. These approaches are also specific to the corresponding alloy compositions and thermodynamic conditions considered. Repeated simulations are required to explore new design spaces. Therefore, large-scale screening and optimization of HEAs become computationally expensive and time-intensive.
Machine learning (ML) approaches in materials design and discovery have recently gained significant attention to address the limitations of conventional computational methods [18,19,20,21]. Predictive ML models do not require explicit physics-based simulations, as they achieve this by mapping nonlinear relationships between material descriptors and target properties. The efficiency and adaptability of such an approach allow for rapid and effective screening of HEAs across their vast compositional spaces. Numerous studies have successfully demonstrated the use of ML algorithms to predict the mechanical properties of HEAs. Yang et al. [22] developed a machine learning design system to predict the hardness of HEA, reaching an R2 value of 0.94, and employed Shapley Additive explanations (SHAP) analysis to identify five key features related to its properties. Ren et al. [23] combined interpretable ML methods with solid-solution-strengthening theory to predict HEAs’ hardness that achieved R2 of 0.97 under leave-one-out validation, and further coupled the predictor with a particle swarm optimization algorithm to design high-hardness compositions. Bhandari et al. [24] used a random forest (RF) regressor to predict the yield strength of various HEAs at specified temperatures. Bakr et al. [25] predicted HEAs’ phase and hardness using a neural network (NN) that yields 93.4% classification accuracy and R2 of 0.88.
Numerous studies represent HEAs using a set of engineered descriptors derived from their constituent elements. These descriptors are usually handcrafted composition-based feature vector (CBFV) that consists of their constituent elemental properties, such as atomic mass, density, atomic number, and atomic radius [12,22]. These features are then coupled with the thermodynamic and phase-related parameters, including valence electron concentration (VEC), atomic size difference (δ), enthalpy of mixing (ΔHmix), entropy of mixing (ΔSmix), mean melting temperature (Tm), and the solid-solution formation parameter (Ω). The combination of these descriptors incorporates physical information relevant to alloy behavior. However, it also poses the risk of redundancy that increases the risk of overfitting while reducing computational efficiency [26]. Not to mention, these descriptors possess several limitations. CBFV descriptors are calculated from alloy compositions using tabulated elemental properties and semi-empirical formulations. The calculation for enthalpy of mixing (ΔHmix), for example, using the Miedema model, might deviate from experimental measurements [17,26]. Engineered descriptors are not directly related to the variables for alloy design purposes. Therefore, an additional inverse-design or optimization procedure is required to identify the influence of each input feature. However, these limitations do not necessarily imply that composition-only representation is preferable.
In this study, stacking ensemble machine learning models are developed to predict the Vickers hardness of HEAs directly from their nominal elemental compositions (at.%). The key novelty of this work is shown in the use of composition-based representation to quantify how much of the accuracy it could keep without engineered descriptors while giving a practical approach for rapid HEA composition screening and design. This composition-based representation is chosen for its simplicity and its direct link to alloy design. To keep the composition–hardness relationship free from processing-route effects, the dataset is restricted to alloys produced by vacuum arc melting (VAM) and compiled from previously published experimental studies. The resulting dataset consisted of 15 constituent elements (Re, Ru, Al, Si, Ti, Cr, Fe, Co, Ni, Zr, Nb, Mo, Hf, Ta, and W) with a broad compositional space. Four machine learning models, namely KNN, SVR, XGB, and ANN, were first established as baseline predictors. Later, a series of stacking ensemble models, including KNN-SVR, SVR–SVR, XGB–SVR, and ANN–SVR architectures, were developed to investigate whether hierarchical integration of base learners could improve predictive accuracy and robustness. The best-performing model is interpreted using both PFI and SHAP analysis such that the elements most strongly associated with hardness could be identified. Further examination is performed through case studies that test how specific elemental additions affect the predicted hardness. This study aims to analyze whether a composition-only model can serve as a low-barrier screening tool while still recovering physically consistent element–hardness relationships.
2. Materials and Methods
2.1. Dataset Characteristics
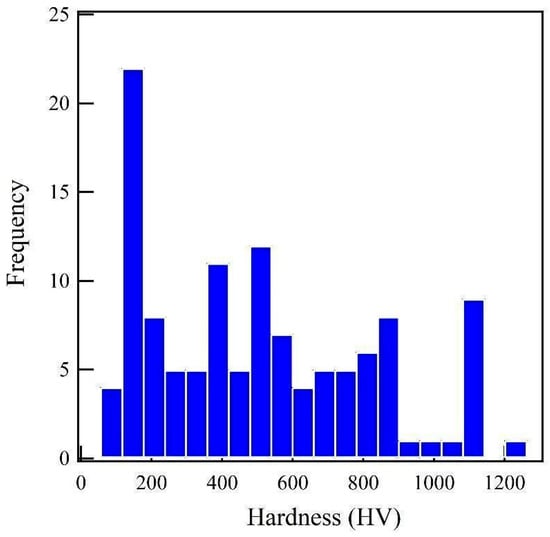
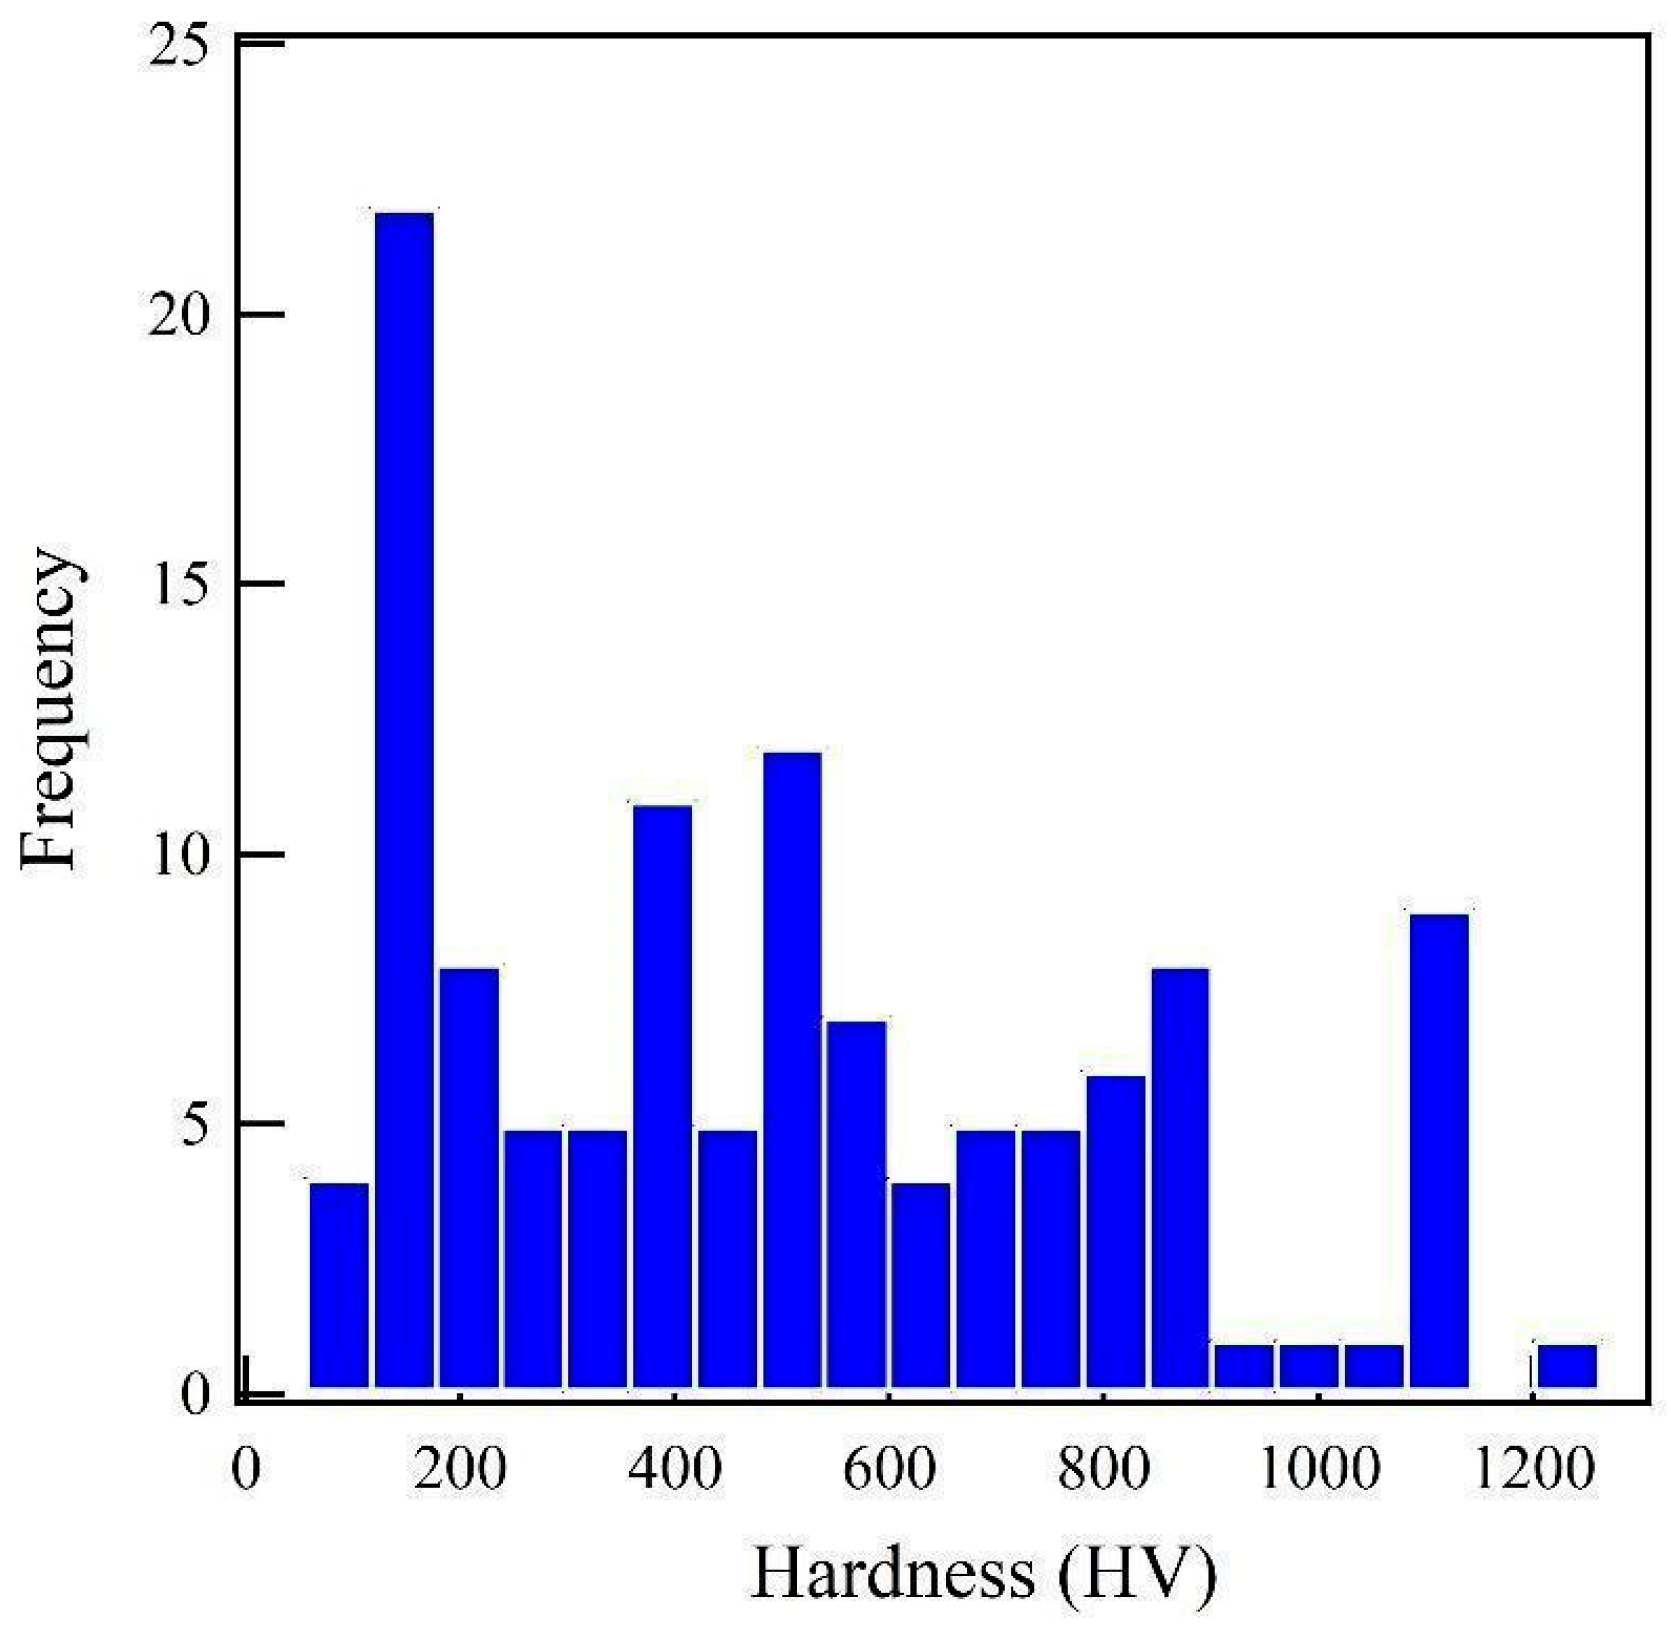
The Vickers hardness (HV) of the HEA dataset was obtained from various literature sources [27,28]. The cleaned dataset has 120 data points with 15 input features, exclusively composition parameters (Re, Ru, Al, Si, Ti, Cr, Fe, Co, Ni, Zr, Nb, Mo, Hf, Ta, W), and one output feature of HV. No processing parameter was used, since the data consisted only of a vacuum arc melting process. Although other processing parameters may influence hardness, it is later indicated that the composition features could support a reasonable prediction within the represented alloy families of the dataset. However, the dataset itself might carry uncertainty that is not directly accounted by the model. This uncertainty, for one, might come from the Vickers hardness measurements, which can vary between samples of the same alloy. Likewise, the composition’s nominal value might also deviate from the actual alloy through evaporative losses during melting. These effects add scatter that could weaken the model’s prediction and the composition–hardness relationship. Despite the limitations, the obtained level of accuracy remains consistent as the intended role of ML model as a rapid screening tool. The statistical information of the HEA dataset and the distribution of HV values are shown in Table 1 and Figure 1, respectively. As shown, the hardness is distributed unevenly with multiple local maxima, meaning various distinct hardness regimes in the dataset. This uneven distribution represents the available compositional families in the compiled sources. The lower mode is populated with transition-metal-alloys based on Fe, Co, Ni, and Cr constituents. Meanwhile, upper mode is dominated by refractory alloys that contain Re, Ru, Mo, Hf, Ta, and W. The correlation heatmap and reduced pairwise plot are provided in the Supplementary Information (Figures S1 and S2) to highlight the correlation between each compositional feature and the target HV values.
Table 1.
Statistical information of the HEA dataset features.
Figure 1.
Data distribution regarding the hardness of the HEAs.
2.2. Machine Learning Algorithms
The HV prediction for HEAs was performed using both baseline ML models and stacked ensemble ML architectures. The types of ML algorithms used significantly affect their predictive performance and interpretability. Therefore, widely adopted regression algorithms were investigated and later compared to obtain the best-performing algorithm in both configurations. The models evaluated in this study are KNN, SVR, XGB, and ANN. Ensemble ML is a modeling strategy of integrating multiple individual learning algorithms in order to obtain better prediction accuracy and generalization performance compared to a single model [29]. This study used stacked generalization technique as a strategy that utilizes two levels of learners, base learners and a meta-learners. The base learner is first trained on the original input data to capture the underlying relationships and generate initial predictions. These predictions are later used as inputs to the meta-learner to produce a final prediction with enhanced performance. Meanwhile, the meta-learner is placed after the prediction of each base learner in the stacking ensemble to improve the results by utilizing meta-learner’s superior performance. In this study, SVR is selected as the meta-learner because it achieves the highest predictive performance among the baseline models evaluated in Section 3.1. This selection is made using the same five-fold partition subsequently used to evaluate the stacking configurations.
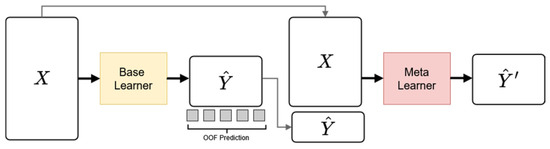
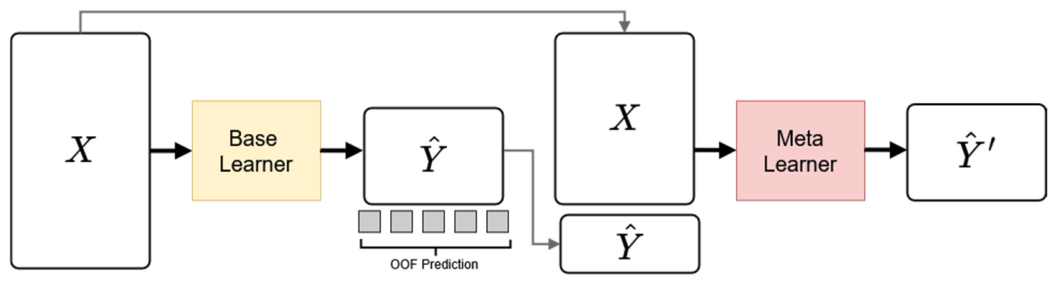
The generalized stacking model used in this study modifies Wolpert’s stacked generalization by supplying the meta-learner with the original composition features alongside the base learner’s OOF predictions to reduce the information loss by passing the prediction only. This is illustrated in Figure 2. The dataset is partitioned into k = 5 folds with a fixed random seed. In each iteration the base learner is trained on k−1 folds and used to predict the held-out fold, so that every alloy receives a prediction from a model that did not observe it. These OOF predictions are appended to the 15 composition inputs and passed to the meta-learner. The hyperparameters of both levels were optimized by grid search over the ranges given in Table S1, under the same five-fold partition subsequently used to generate the OOF predictions and to report performance. Predictive performance is reported as the coefficient of determination (R2) together with mean absolute error (MAE) and root mean squared error (RMSE), both in HV, with values quoted as mean ± standard deviation across the five folds.
Figure 2.
Architecture of the generalized stacking model in this study.
2.3. Interpretability Assessment Method
The relationship between composition and hardness is explained using three complementary techniques, namely PFI and SHAP. Assessment of PFI ranks the composition features according to the reduction in the diminishing prediction accuracy when each of those features was permuted. This is later strengthened using SHAP by calculating the contribution value of each individual feature, as well as the direction, and whether the corresponding feature increases or decreases the model’s prediction [30]. SHAP calculation for a single prediction works by averaging the contribution of feature i over all possible subsets of features that is weighted by the number of orderings that each subset can be formed in. Mathematically, this is represented as in Equation (1).
where ϕi is the SHAP value for feature i, F is the full set of features, S is a subset of features excluding i, f(S) denotes the model’s prediction using only the features in S, and the term f(S ∪ {i}) − f(S) represents the marginal contribution of feature i when added to subset S. A positive SHAP value indicates that feature i increases a model’s prediction above the average prediction of the available features, while a negative SHAP value decreases a model’s prediction. In this study, interpretability is measured using the OOF predictions from the same five-fold partition described in Section 2.2. For each fold, the model is fitted on the four training folds and both PFI and SHAP are computed on the held-out fold, so that every data point contributes the importance value from a model that did not observe it.
3. Results and Analysis
3.1. HV Prediction on the Baseline Model
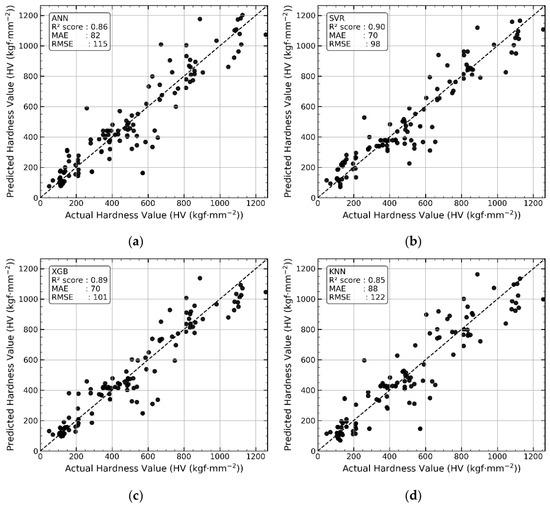
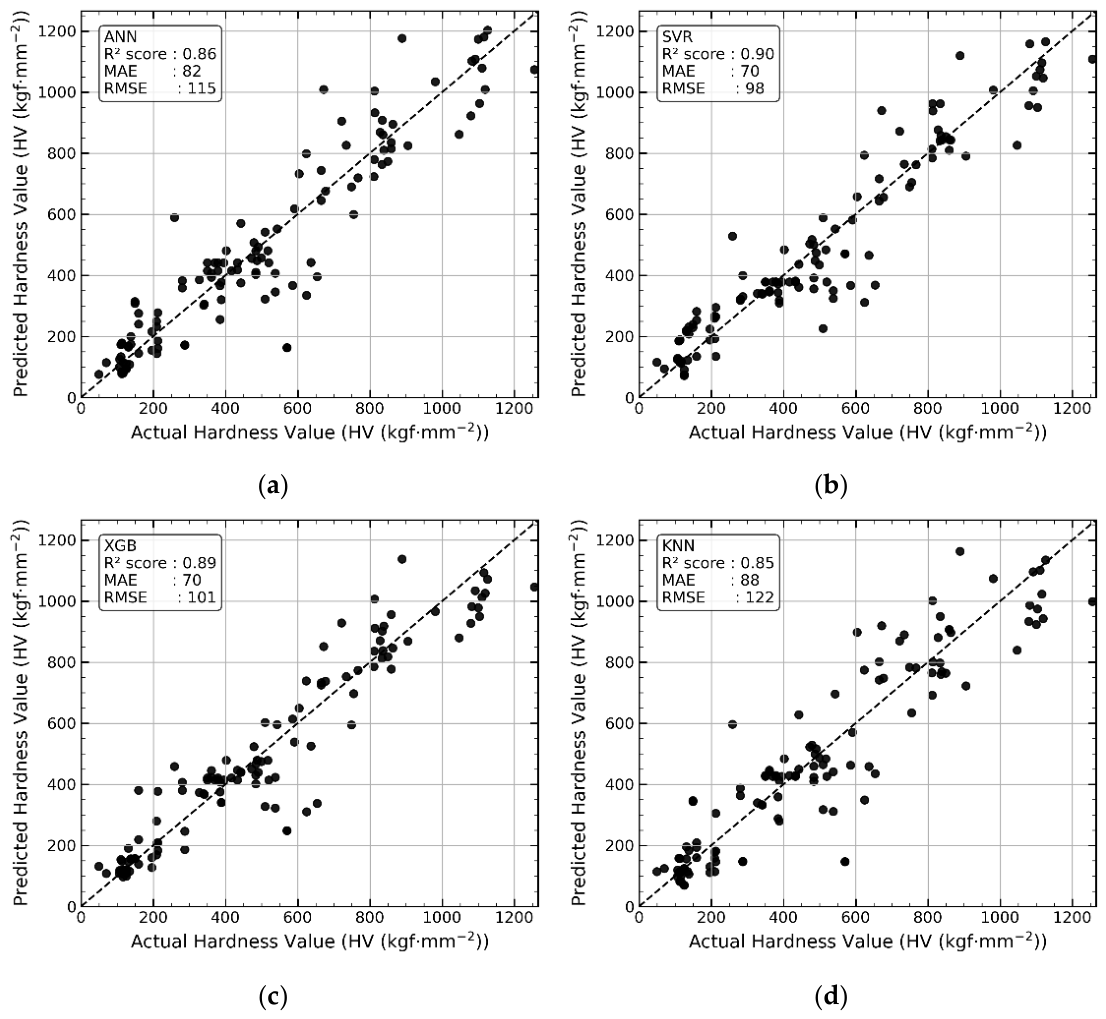
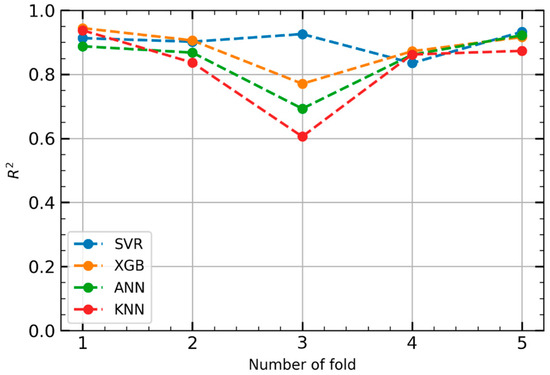
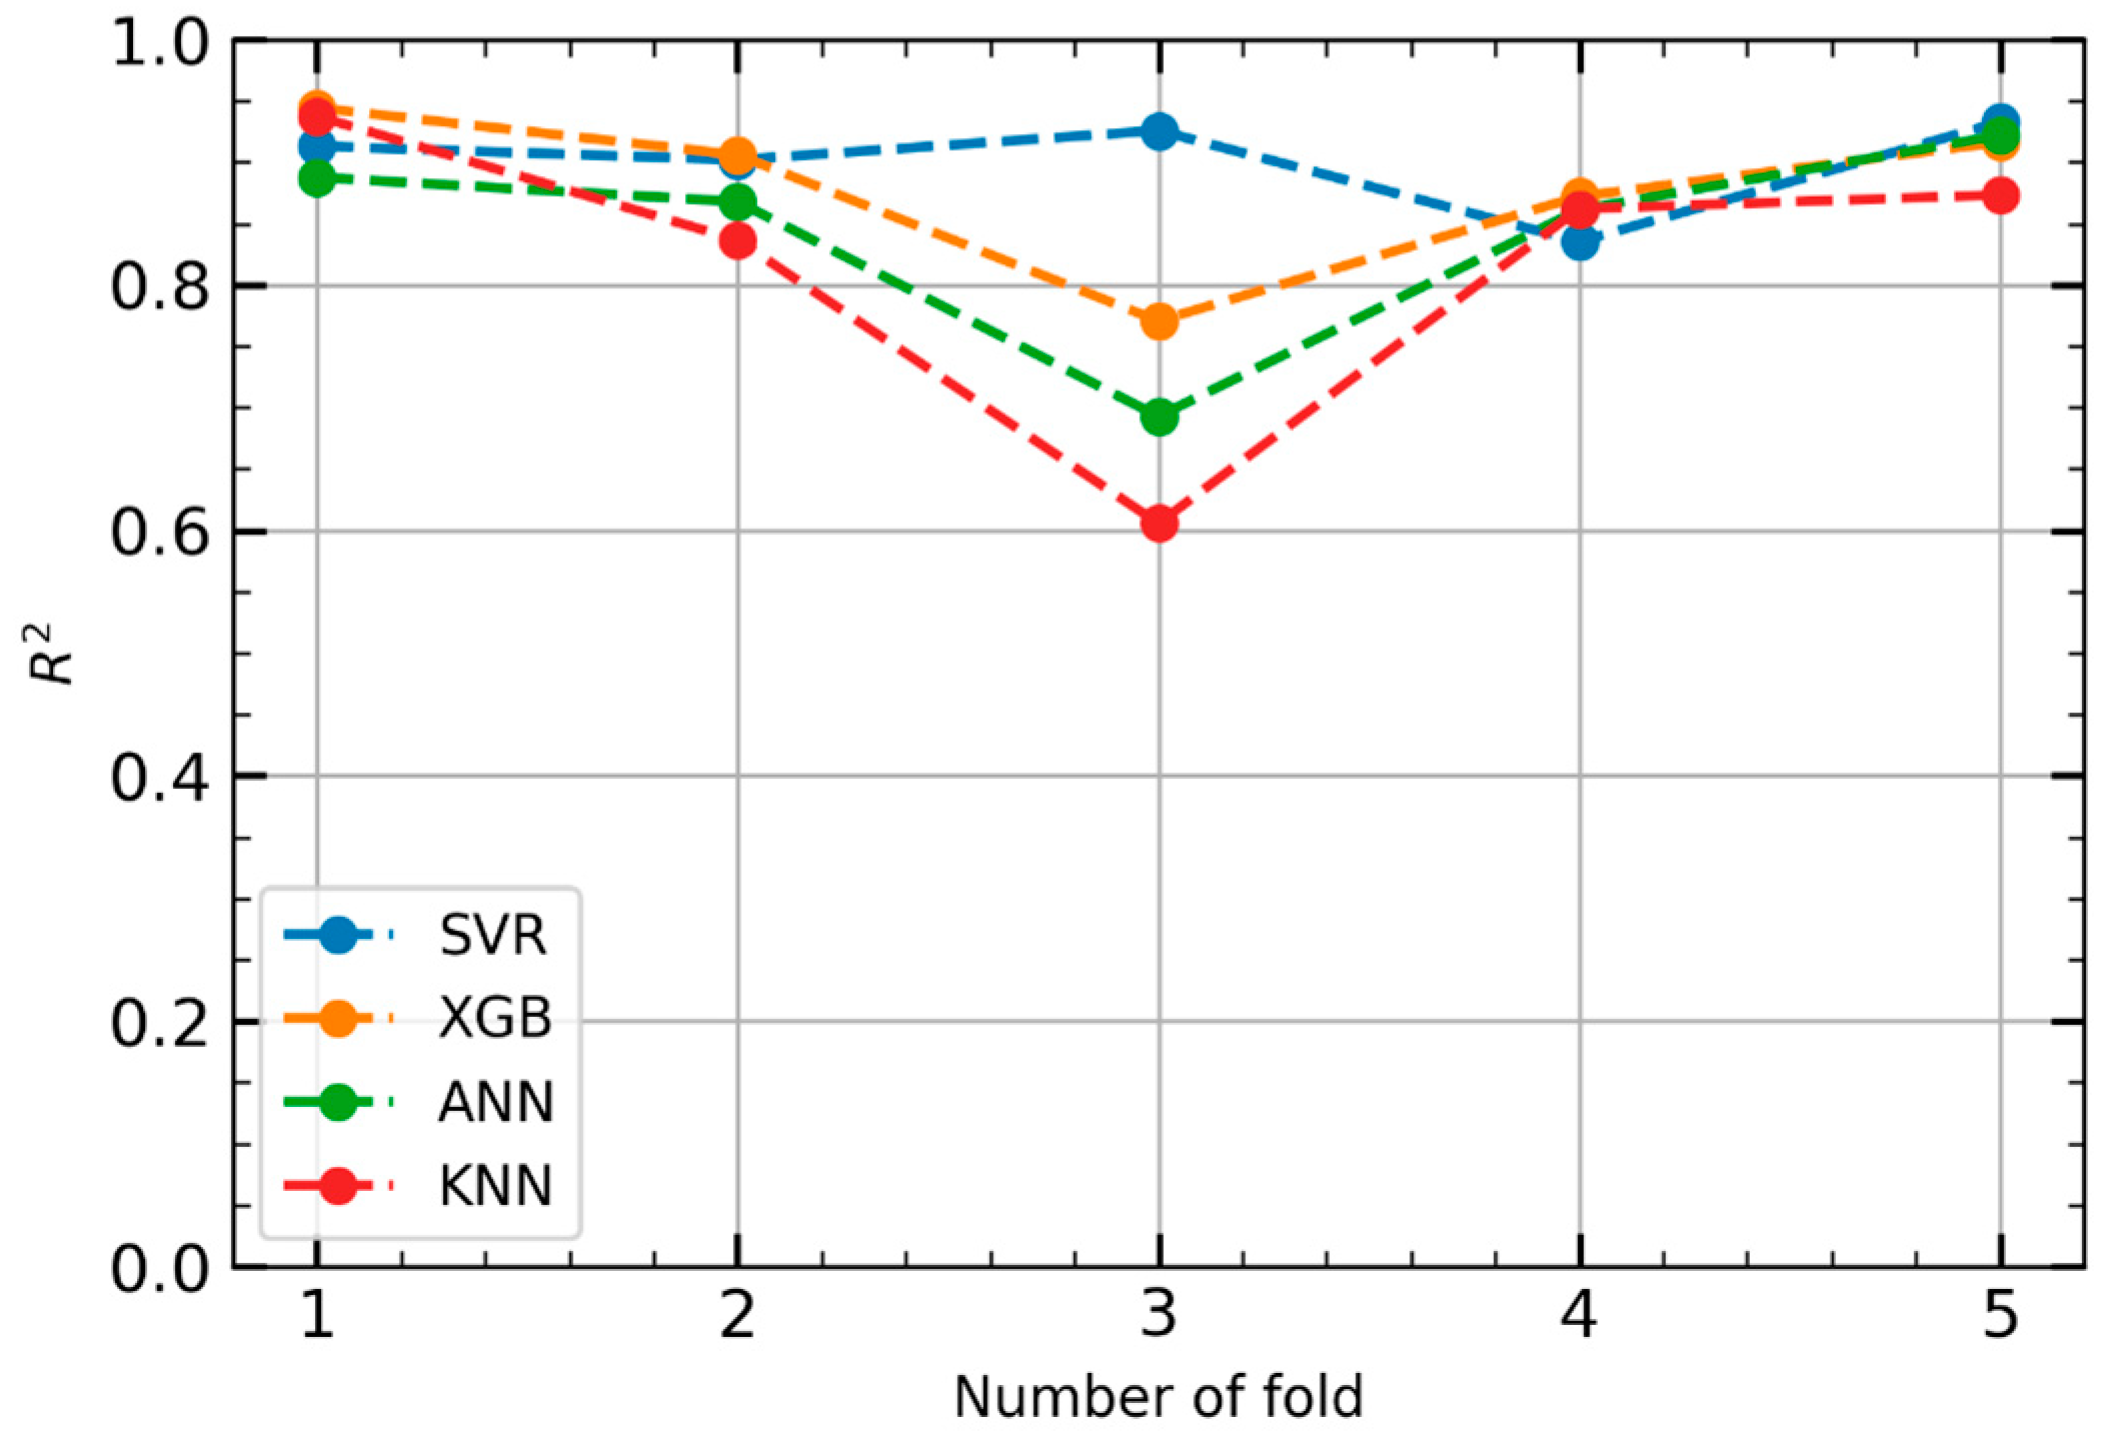
Four models are used in this study with KNN and SVR for simple ML methods—ANN to represent the deep learning approach, and XGB for a gradient-boosted ML algorithm. The KNN process of inference involves the utilization of a distance metric to make a prediction by identifying the most similar training examples [31]. SVR works by fitting a function within a defined tolerance range [32]. The ANNs algorithm processes inputs through layers of interconnected neurons that are equipped with weighted sums and nonlinear activation functions [33]. XGB builds its predictions using decision trees constructed sequentially, of which each new tree corrects the previous branch’s error [34]. Each algorithm is implemented using the scikit-learn library and optimized using grid search hyperparameter tuning. Figure 3 shows the parity plot of out-of-fold (OOF) predictions of the baseline performance while Figure 4 shows the determination coefficient across each cross-validation fold. The optimized hyperparameters are provided in Table S1.
Figure 3.
Parity plot of the OOF HV prediction for HEA using the ML model of (a) ANN, (b) SVR, (c) XGB, and (d) KNN.
Figure 4.
Per-fold R2 scores of the SVR, XGB, ANN, and KNN models across 5-fold cross-validation.
Overall, all models demonstrate OOF R2 scores above 0.80. The highest predictive performance is achieved using the SVR model, with the R2 score reaching 0.90. All models appear to have a difficulty predicting alloy hardness in the range of 500–700 Vickers. Greater compositional diversity within this range could be the main reason of such difficulty. Following the assessment, the stability and robustness of the model are shown with relatively small variations in the evaluation metrics of Figure 4. This is more apparent in SVR where it has the lowest variation in R2 across folds compared to the rest of the baseline models, especially in the third fold. The reduced predictive performance observed in this fold is linked to the multimodal hardness distribution, as shown in Figure 1, that comprises numbers of distinct alloy families. This causes a random partitioning call during per-fold analysis that might produce a distributional mismatch between the training and testing set when a family is sparsely represented. Liu et al. [35] demonstrated that partitioning the datasets into a physically motivated subgroup could improve the model’s performance and interpretability on the model’s behavior. Therefore, additional fold analysis is performed based on the compositional families.
The dataset was separated into four families defined by their dominant solid-solution chemistry: (i) FCC-stabilized CoCrFeNi alloys with dilute Nb/Mo additions (n = 16), (ii) FeCoNi-based alloys with BCC/B2- or intermetallic-forming additions of Al, Si or Ti (n = 55), (iii) group IV–VI refractory alloys (Ti–Zr–Hf–Nb–Ta–Mo–W, n = 13), and (iv) Re/Ru-bearing refractory alloys (n = 36). An SVR model, as the best-performing algorithm found in the previous analysis, was trained on the remaining families while each family was held out in turn. The outcome of this analysis is shown in Figure S3. Under the fold analysis by holding out each compositional family, predictive performance collapses across all groups (R2 between −0.23 and −4.57). This shows the systematic limitation of the compositional-based representation as each distinct family requires the model to extrapolate beyond its represented range in the training data. The random-split metrics of Section 3 describe the interpolation within represented families where the composition-only representation does not fare well to predict an alloy family beyond the training. Therefore, SVR is considered to provide the highest prediction accuracy within the available alloy family in the dataset. The advantages of SVR in the current study could be explained by the radial basis function (RBF) kernel’s capability to capture complex nonlinear relationships in higher dimensional space while resisting overfitting [36,37,38]. This advantage does not extend to unrepresented families, as the family-holdout results above indicate.
3.2. HV Prediction on the Stacking Ensemble Configuration
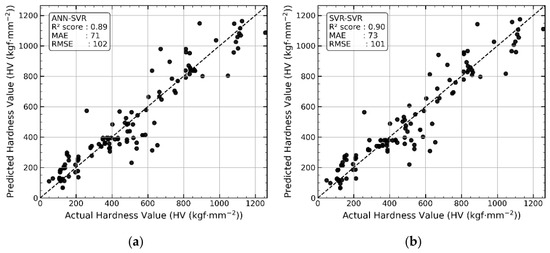
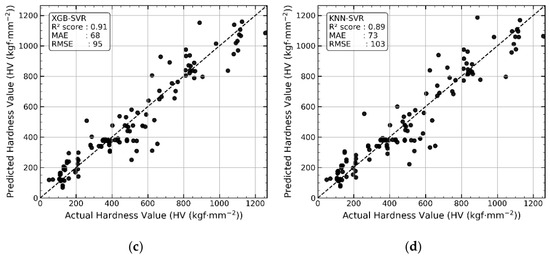
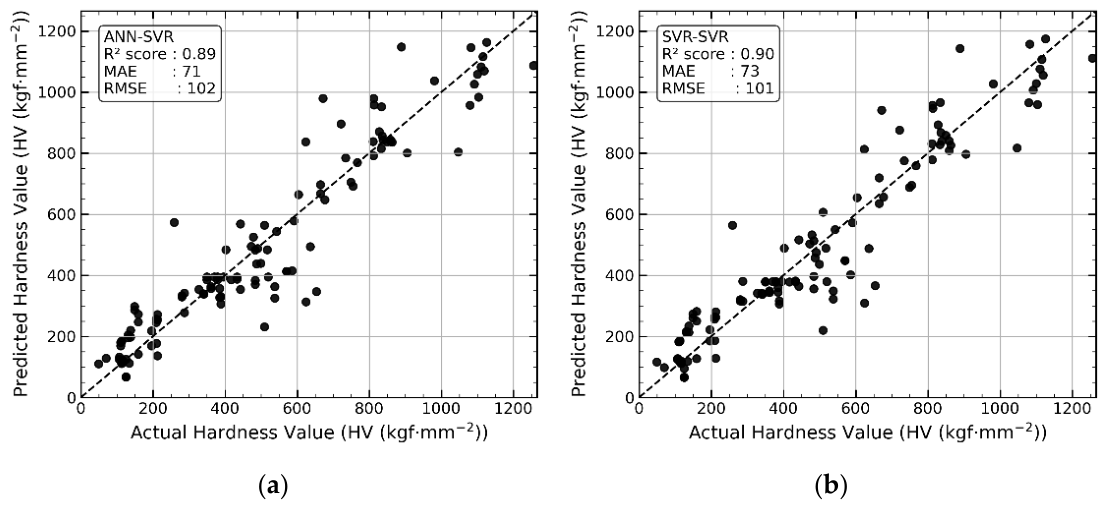
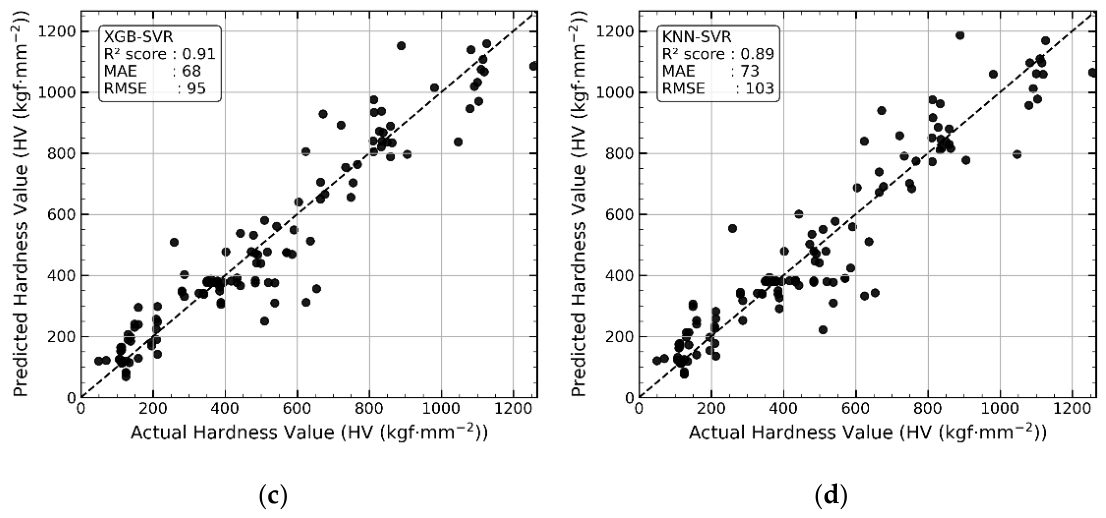
The SVR model serves as the meta-learner in the following analysis of the stacking ensemble’s predictive performance. The base models are constructed using the same architecture described in the previous section, with four stacking configurations formed by varying the base learner (ANN, SVR, KNN, and XGB); meanwhile, the meta-model is fixed to be SVR. This results in four different ensemble configurations. The predictive behavior of each ensemble setup is investigated to compare the ensemble configuration. Figure 5 presents the parity plot of out-of-fold (OOF) predictions obtained from the stacking ensemble while Figure 6 reports the coefficient of determination (R2) across the cross-validation folds.
Figure 5.
Parity plot of the OOF HV prediction for HEA using the stacking ensemble configurations of (a) ANN-SVR, (b) SVR-SVR, (c) XGB-SVR, and (d) KNN-SVR.
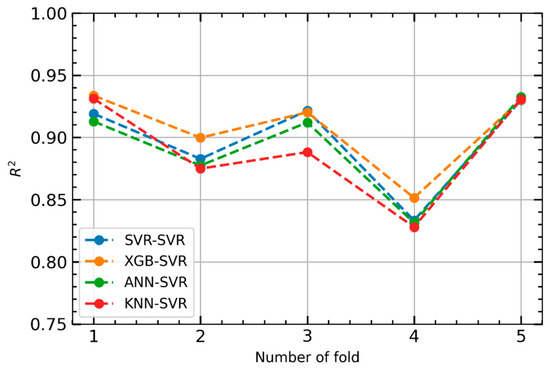
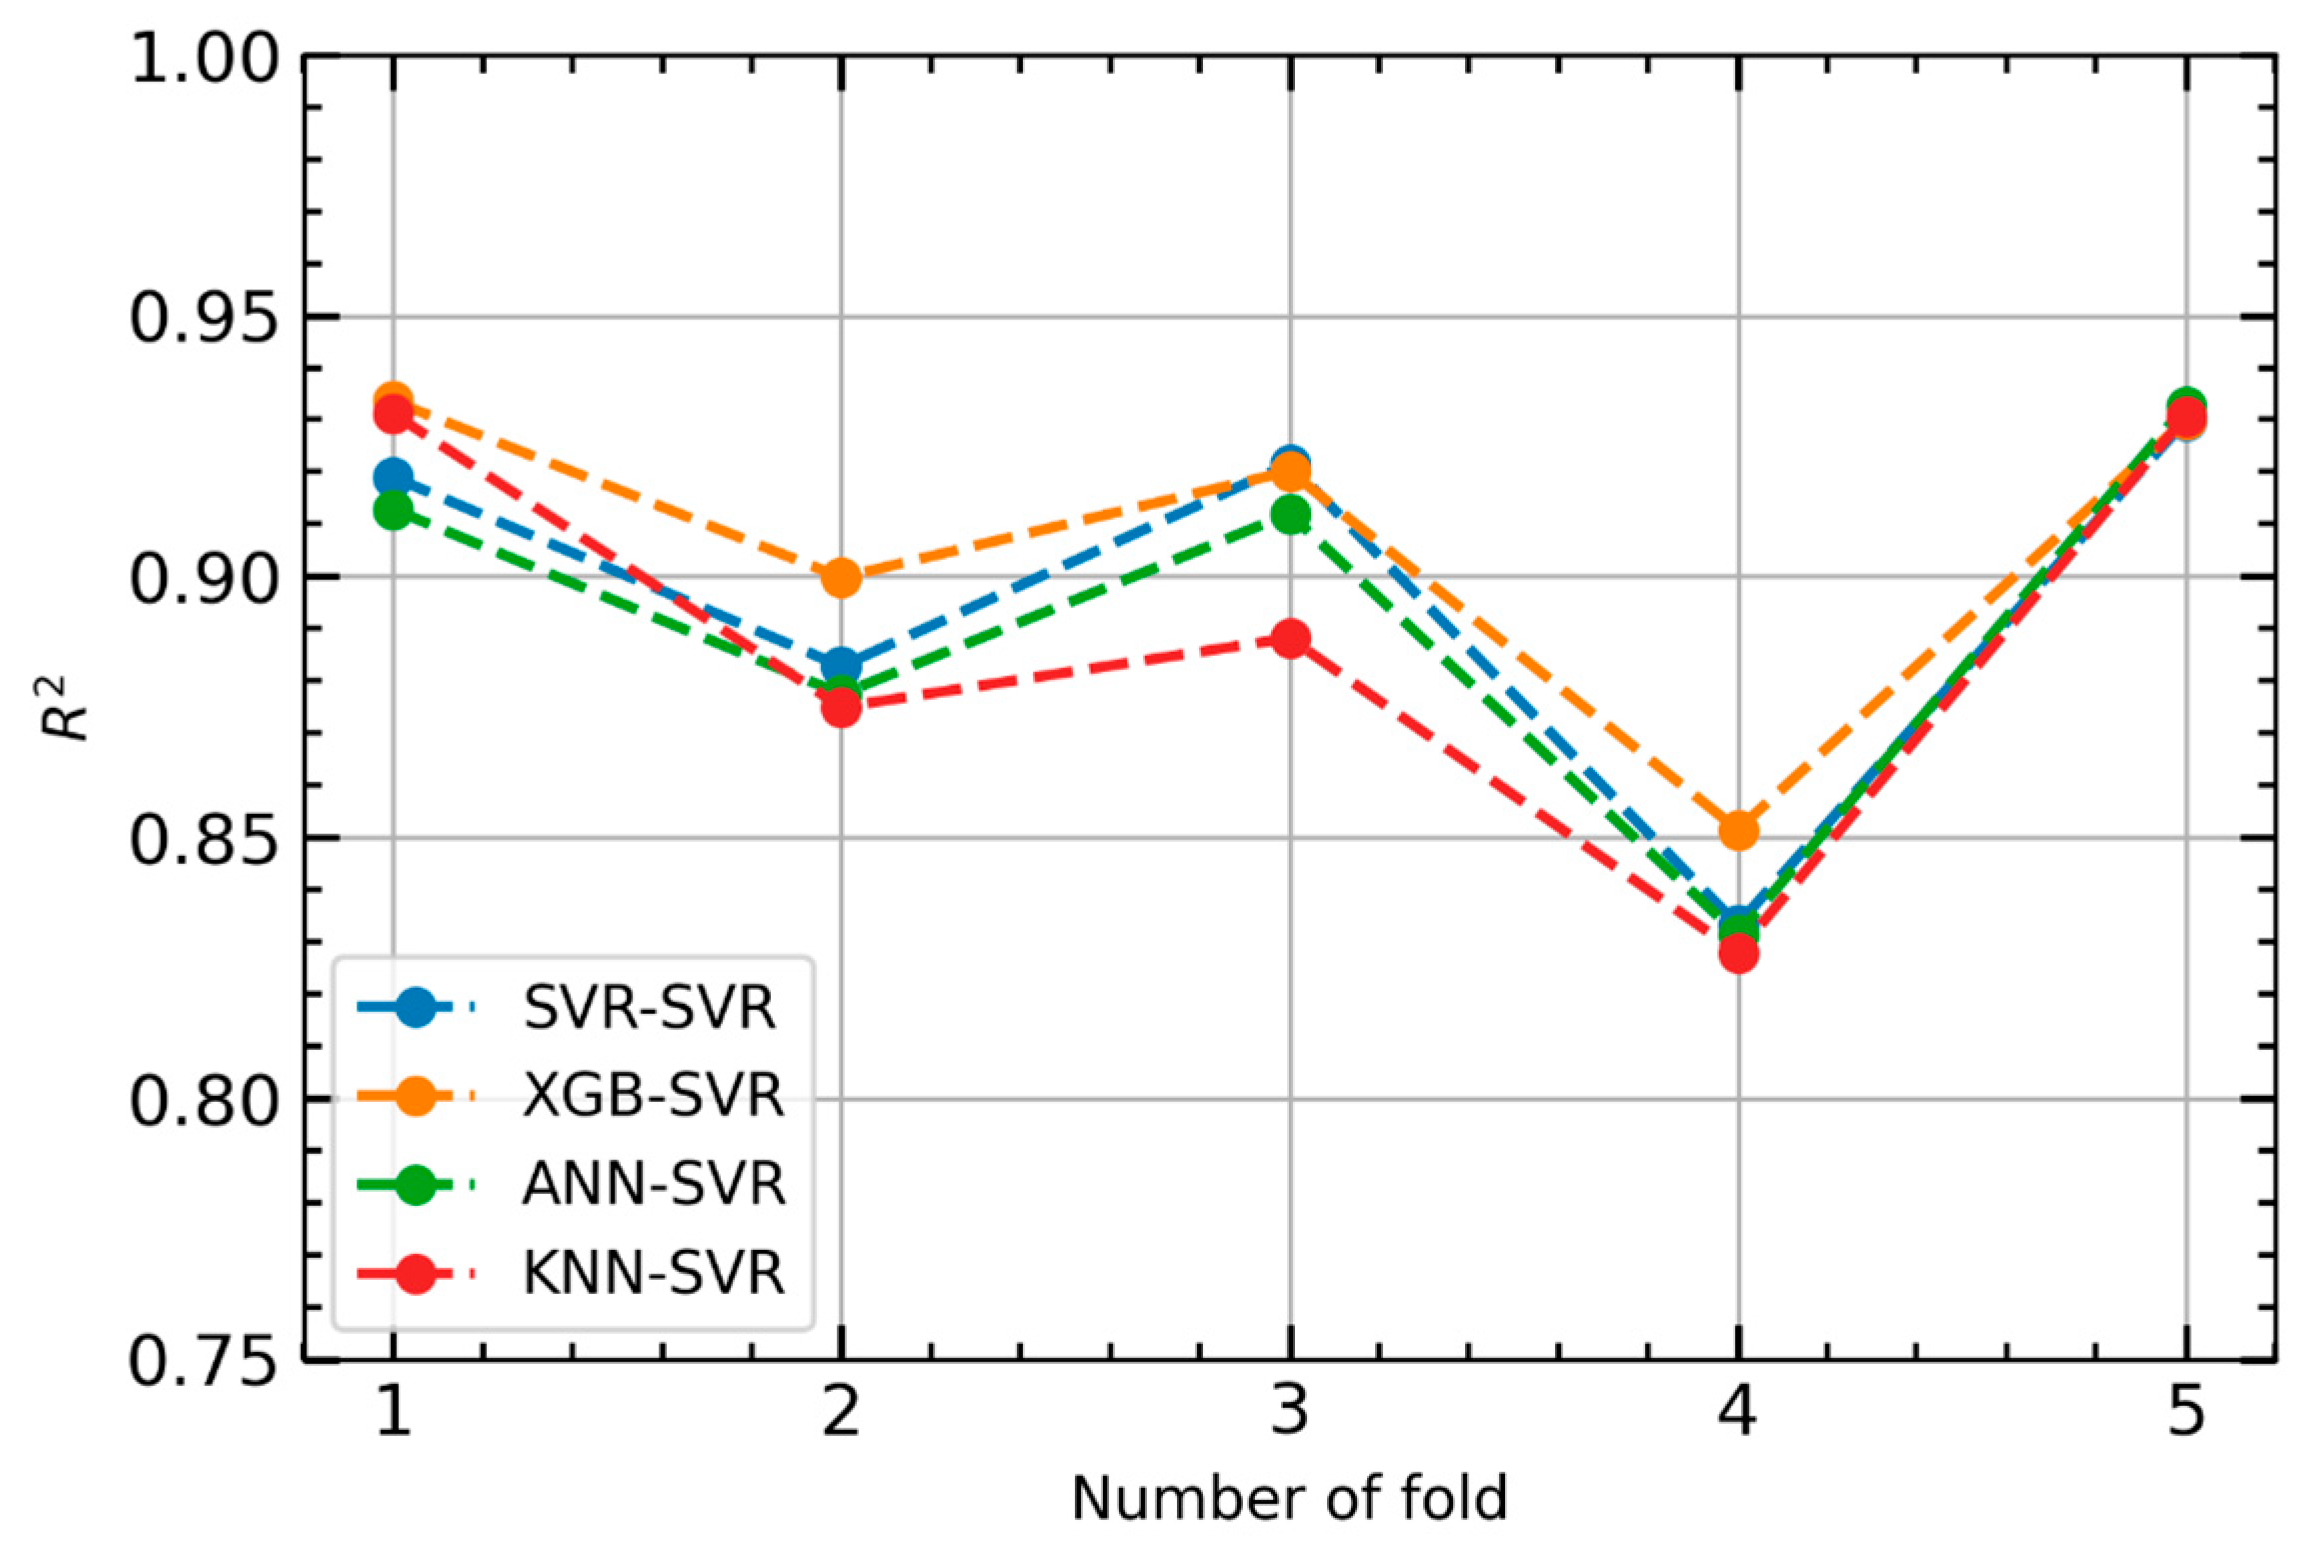
Figure 6.
Per-fold R2 scores of the SVR-SVR, XGB-SVR, ANN-SVR, and KNN-SVR stacking ensemble configurations across 5-fold cross-validation.
The performance of each model shows a different characteristic compared to their baseline. KNN-SVR and ANN-SVR configurations show an improved accuracy with their error metrics reduced by 17.2% and 12.5% relative to their own baseline. Meanwhile, XGB-SVR improves by 2.85% MAE and SVR-SVR’s prediction does not change much. However, against the SVR baseline, three of the four stacked configurations performed worse (SVR-SVR −4.37%, KNN-SVR −4.33%, ANN-SVR −2.35% MAE) and only XGB-SVR improved by 2.90%, only as a small margin inside the five-fold dispersion. This is further shown in Figure 6 where the per-fold readings of the stacking configurations look very similar to the SVR baseline counterparts.
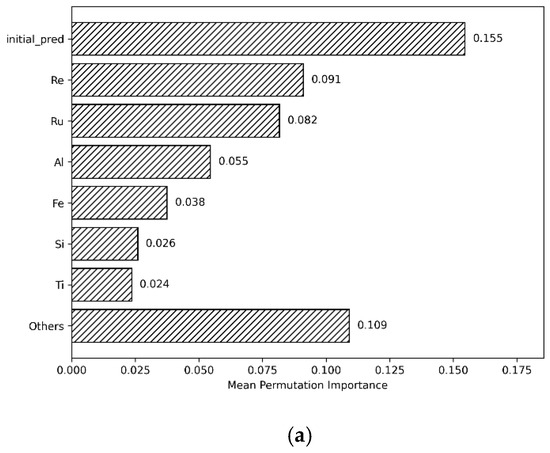
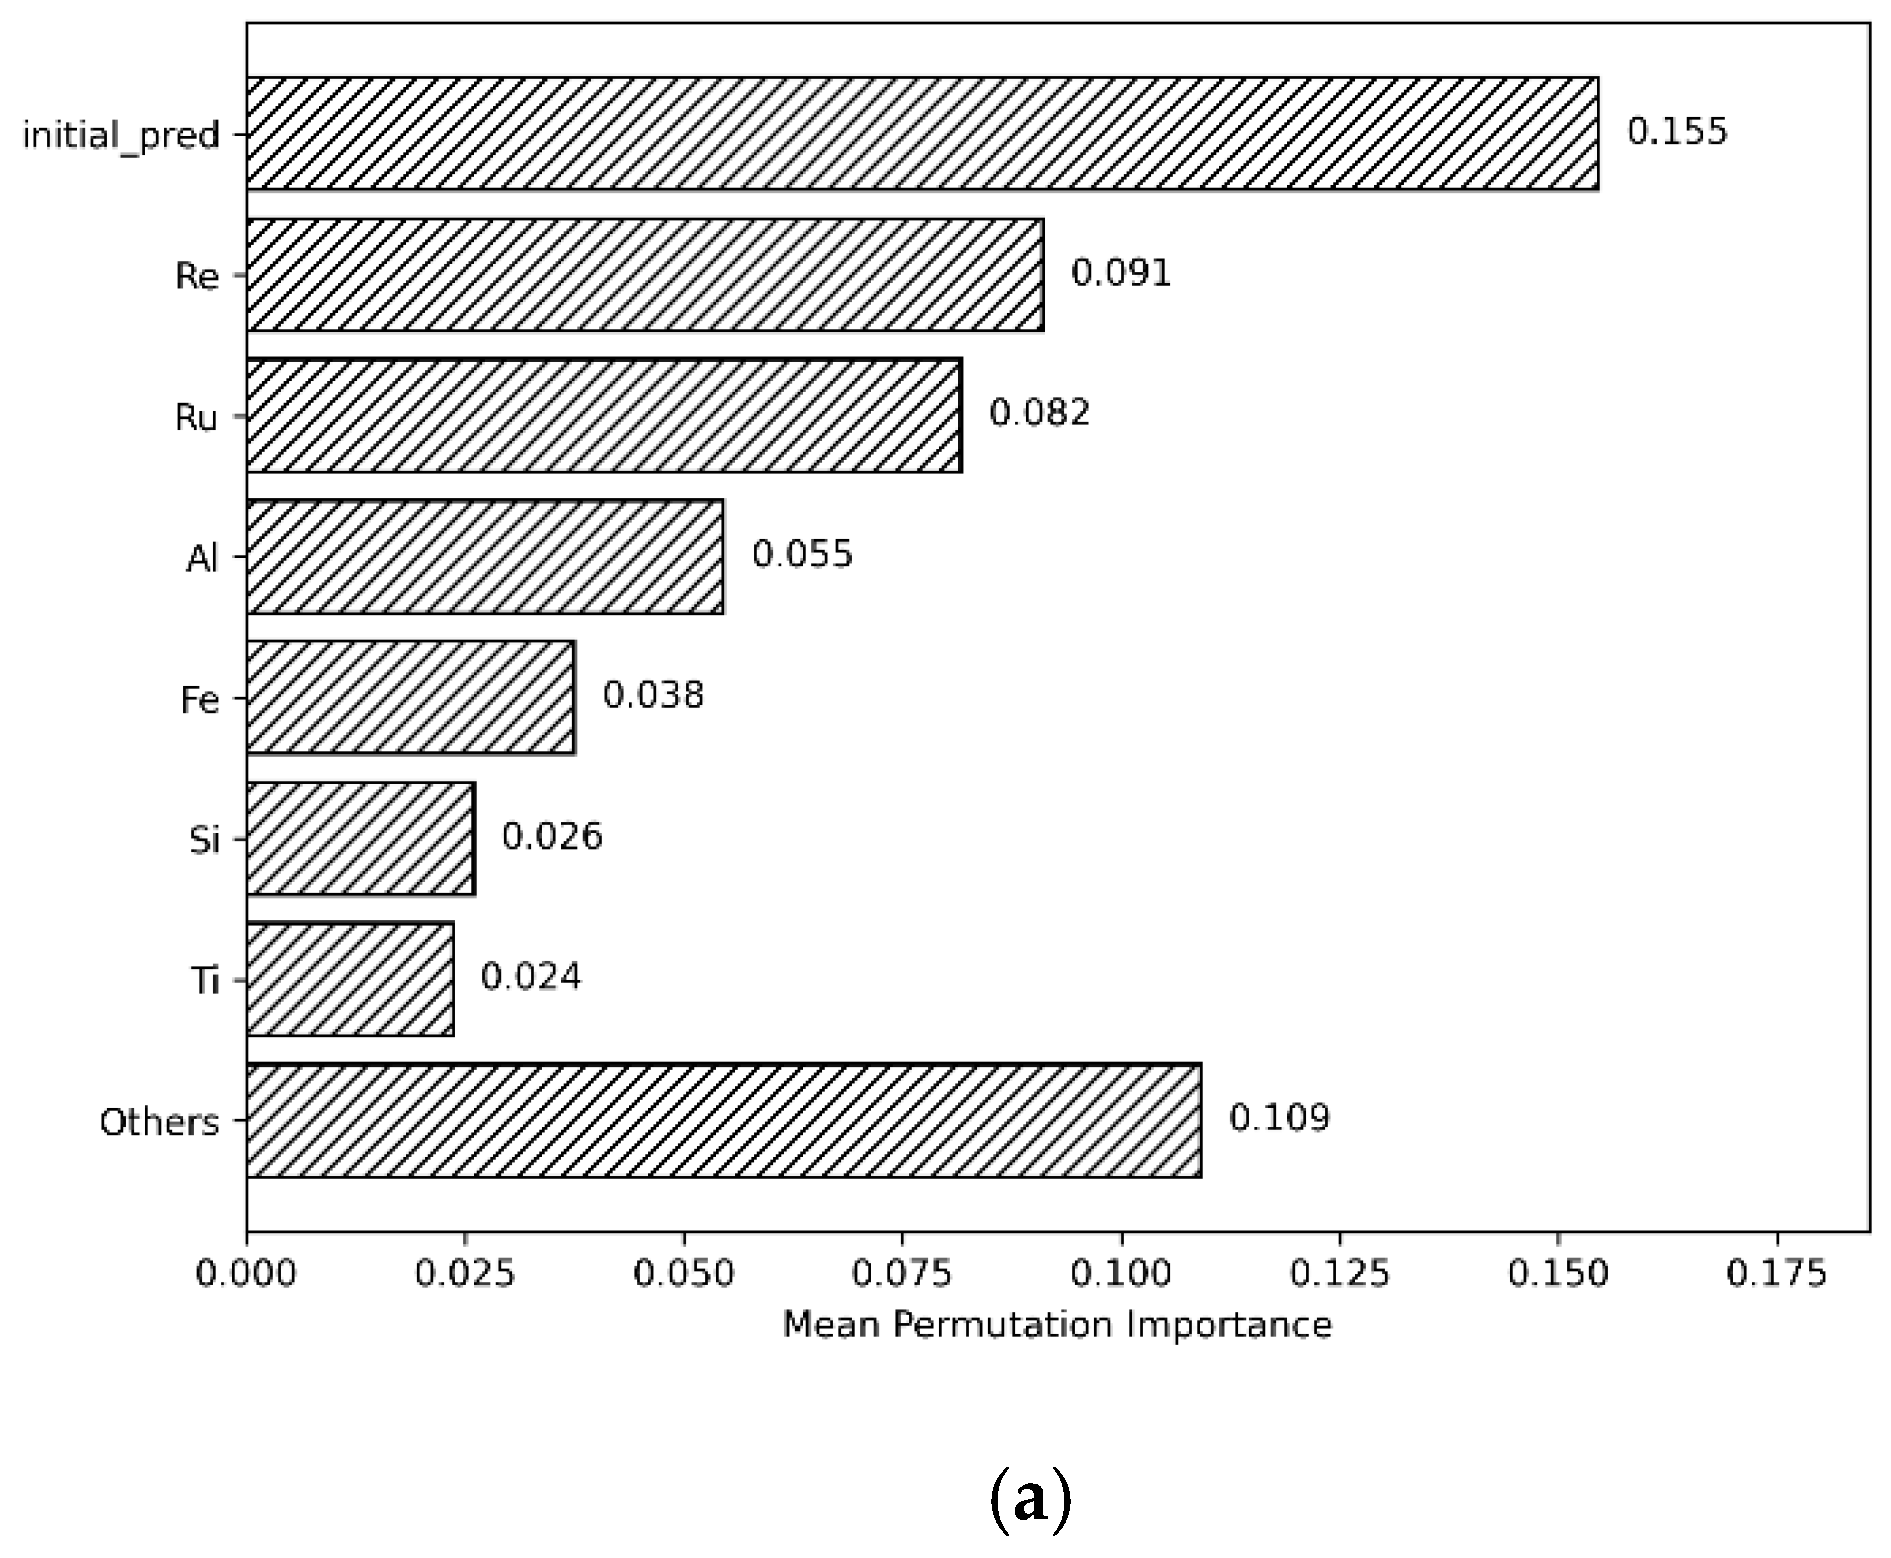
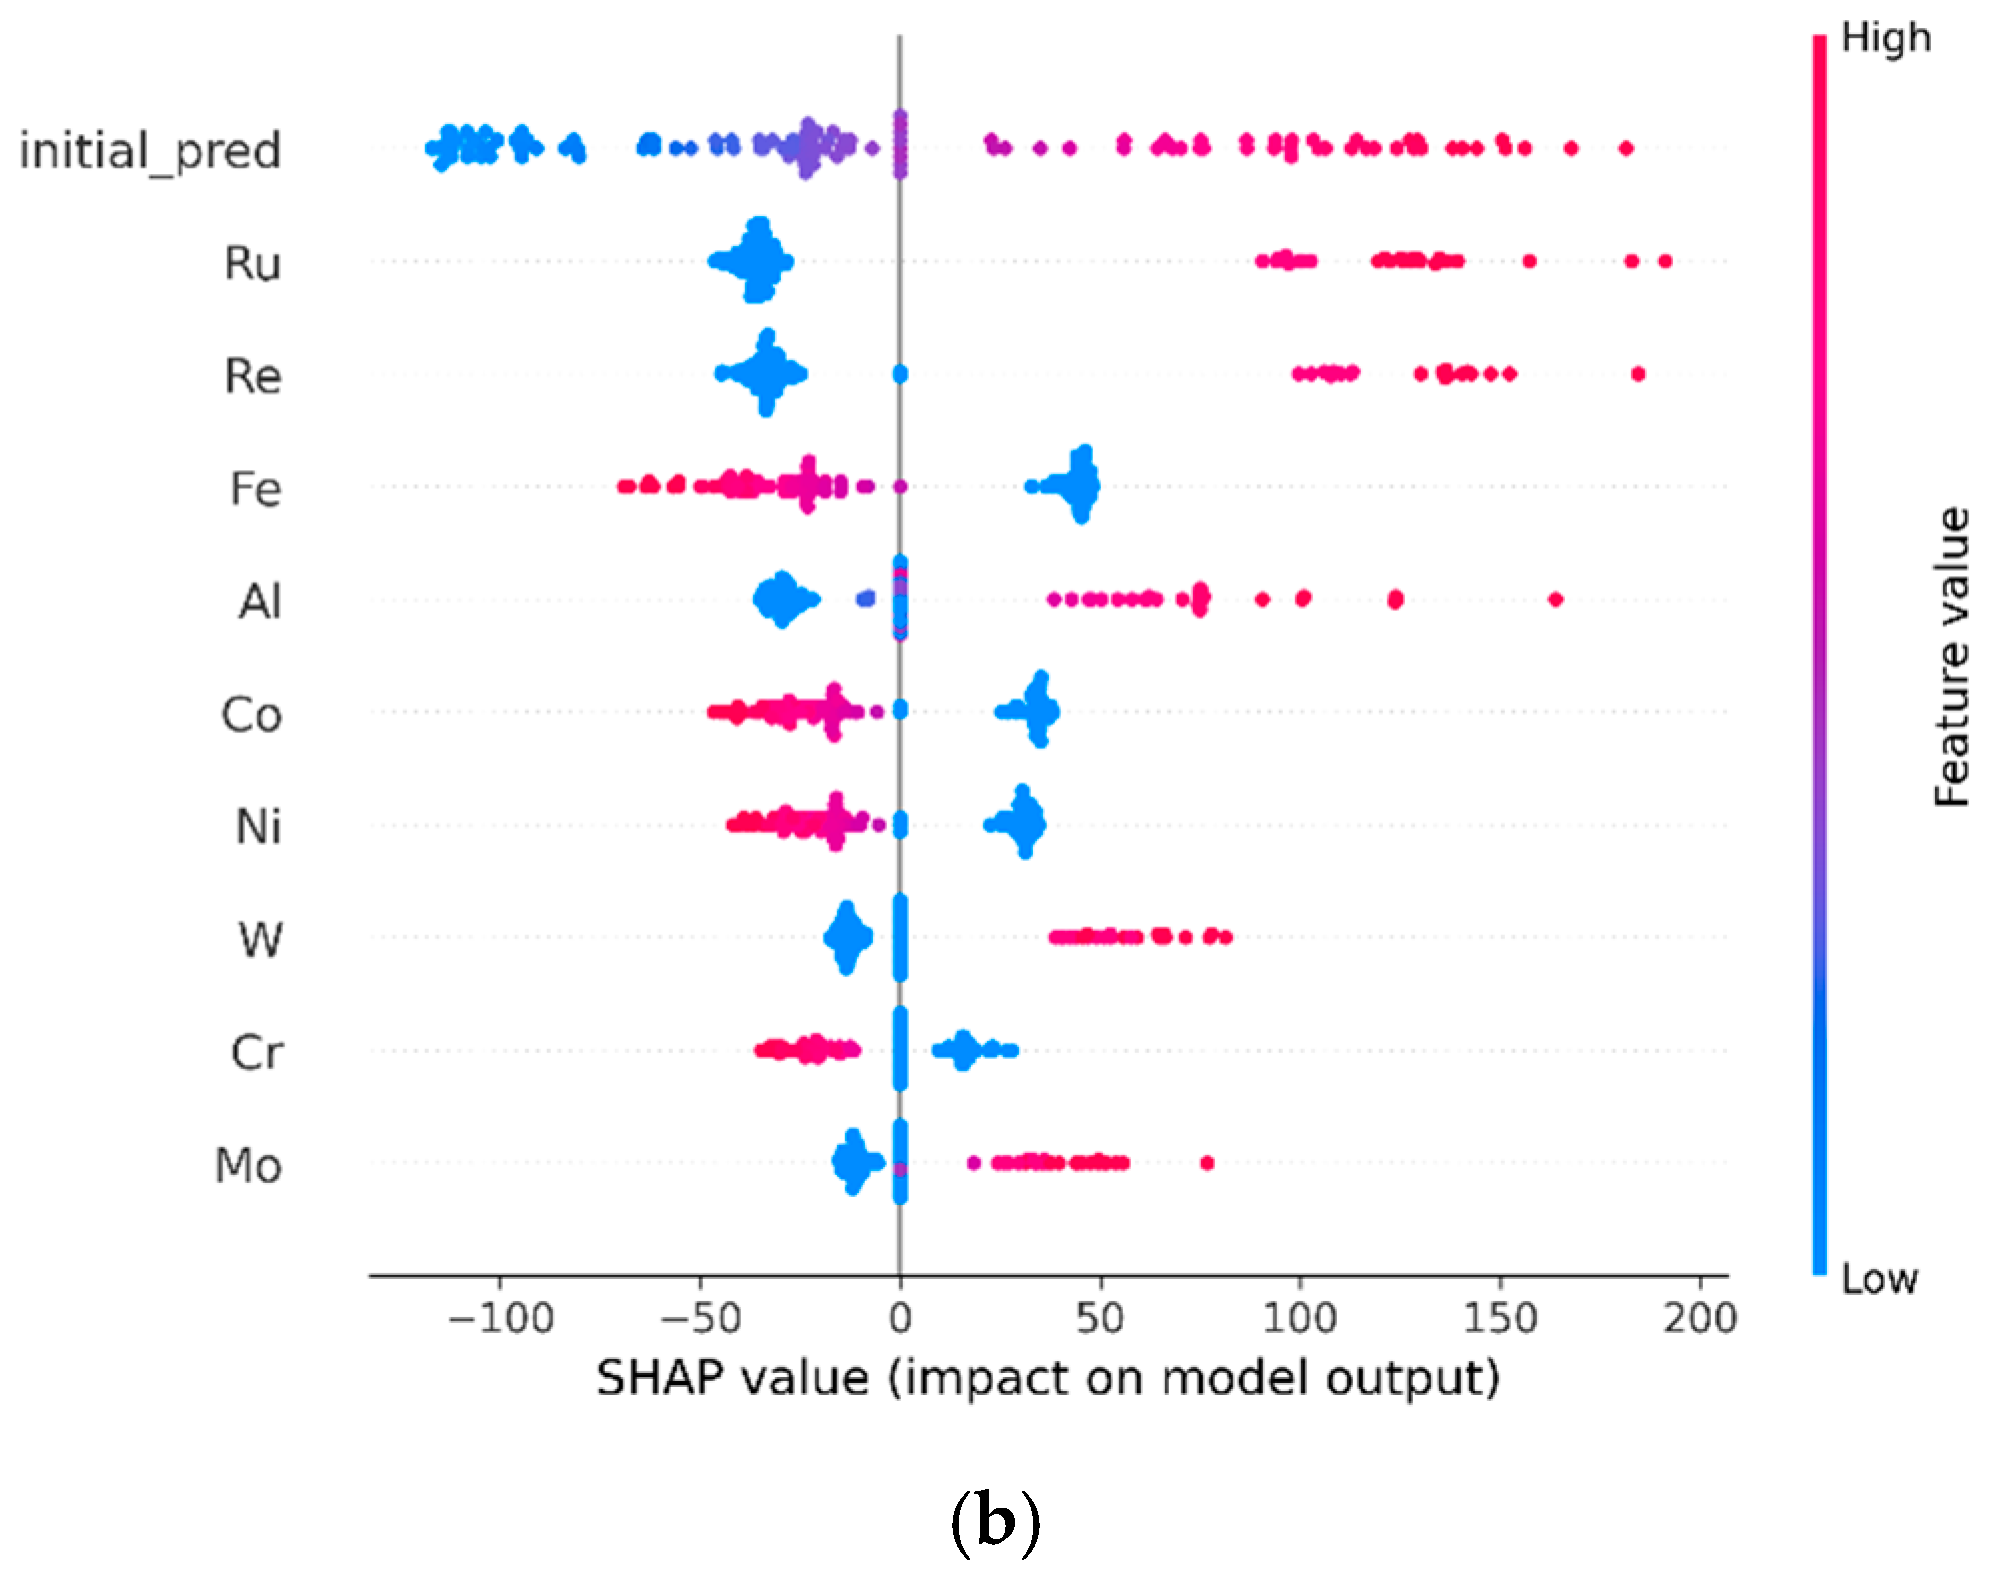
The stacking configuration of SVR-SVR is intended as the control for the augmented design. This configuration compares SVR trained on [X, OOF] (15 compositional features and OOF base-model prediction) against an SVR configuration trained solely on [X]. This analysis is intended to isolate the contribution of the OOF features and how much the base model would improve after passing their prediction. However, it is found that there is no measurable change in accuracy between the baseline SVR with [X] compared to SVR-SVR stacking configuration with [X, OOF] inputs. Meanwhile, looking at the PFI and SHAP analysis figure of the meta-learner in the interpretability assessment section, the base-learner prediction (initial_pred) appears as the most influential feature in the best-performing stacking model (XGB-SVR), with the remaining elemental feature loses importance at this level. This behavior shows that the OOF prediction is heavily used by the meta-learner. However, since the [OOF] values are a deterministic function of the same fifteen composition features, and since including it produces no significant accuracy gain, the information becomes redundant compared to the meta-learner’s [X] inputs.
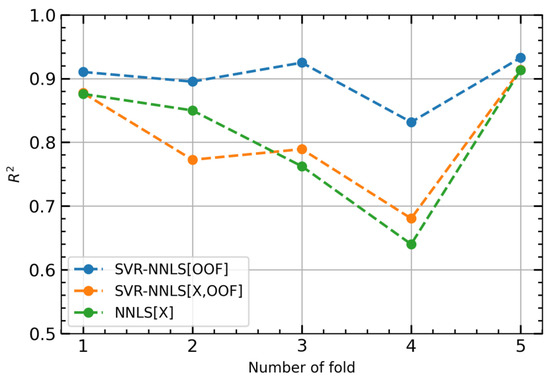
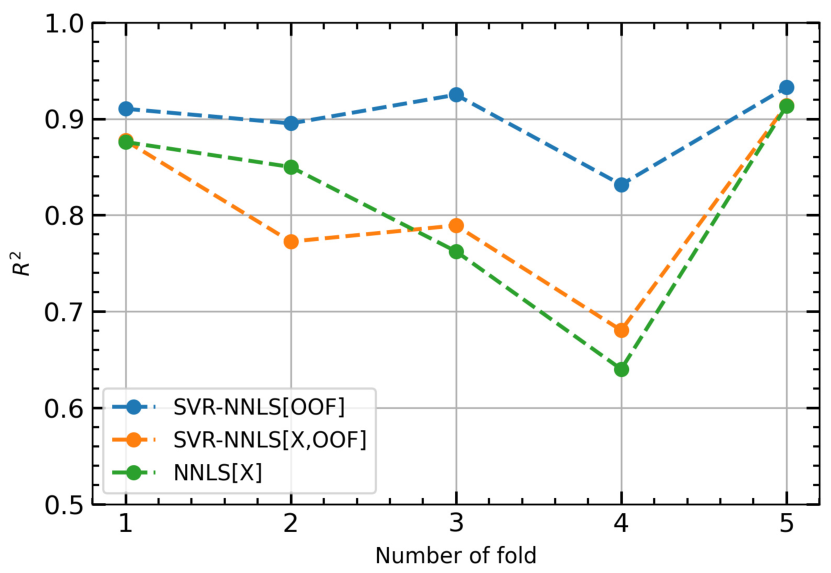
To evaluate whether the lack of improvement is caused by the lack of headroom from well-tuned SVR base or the overfitted meta learner, low-capacity meta-learners were used. Non-negative least squares (NNLS) is adapted with SVR base learners to be evaluated twice, first on the OOF feature (SVR-NNLS[OOF]), and second on the augmented feature set (SVR-NNLS[X,OOF]). In this configuration, any failure to improve will not be caused by meta-level overfitting as NNLS does not have any tuned hyperparameter. This additional evaluation is performed such that the OOF prediction can be read directly against the assigned weight of the compositional features. The per-fold results are shown in Figure 7. The [OOF] configuration achieves a mean R2 of 0.90 ± 0.0, while the augmented configuration only achieves 0.80 ± 0.1. The [OOF] variant shows a higher performance in every fold, so the addition of [X] features results in the degradation of the model’s performance. During the [OOF]-only learning configuration, the meta learner is limited to rescale the base prediction by reproducing the accuracy of baseline SVR. This confirms that the lack of improvement in the SVR-SVR stacking ensemble configuration is due to the meta learner being unable to improve the preexisting base SVR prediction. Meanwhile, the degradation of SVR-NNLS once [X] is introduced follows from the same redundancy with SVR-SVR. In the former configuration, the meta-learner is flexible enough to reproduce the base prediction and results in unchanged performance. With NNLS, the [X] features are misspecified at the meta level and draw weight away from the well-calibrated base prediction. This confirms that the OOF features only contribute a small fraction from the information encoded in [X].
Figure 7.
Per-fold R2 scores of the SVR-NNLS stacking ensemble with [X] training data and [X,OOF] training data across 5-fold cross-validation.
3.3. Interpretability Assessment
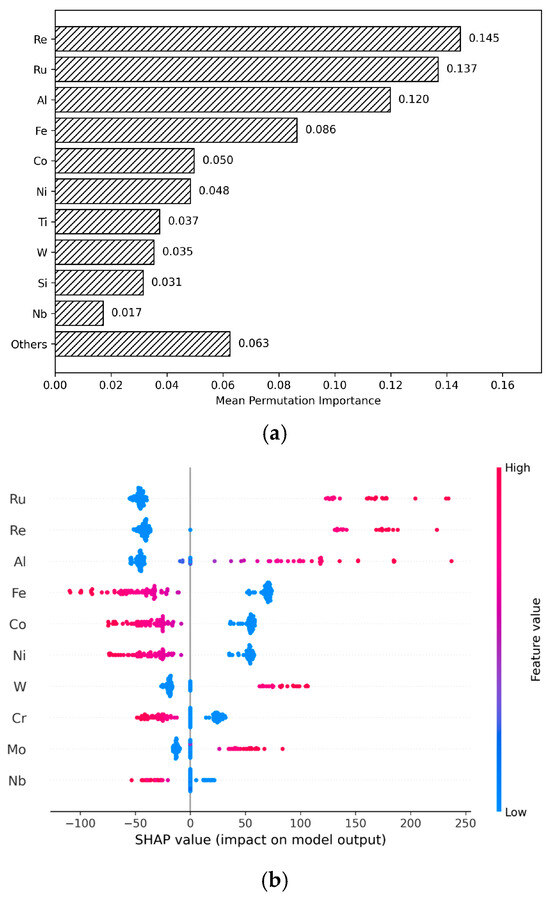
The interpretability assessment was performed using PFI and SHAP as the two methods that are commonly used to determine the direct influence of each variable on the model’s predictions. PFI provides a ranking metric of how strongly a feature affects the model’s prediction by measuring the increase in prediction error after the values of that feature are randomly permuted. SHAP supports PFI by giving a numerical contribution and its direction towards a model’s prediction. A high SHAP value corresponds to positive contribution towards the model prediction, while a low SHAP value corresponds to negative contribution. The assessment was performed on the best-performing standalone model, namely SVR, with the results shown in Figure 8, limited to the 10 most important features. Meanwhile, the assessment of the meta-model in the stacking ensemble configuration is provided in Figure 9 to analyze how the stacking configuration obtains the composition–hardness relationships and how much the OOF features redistribute the importance from the elemental inputs.
Figure 8.
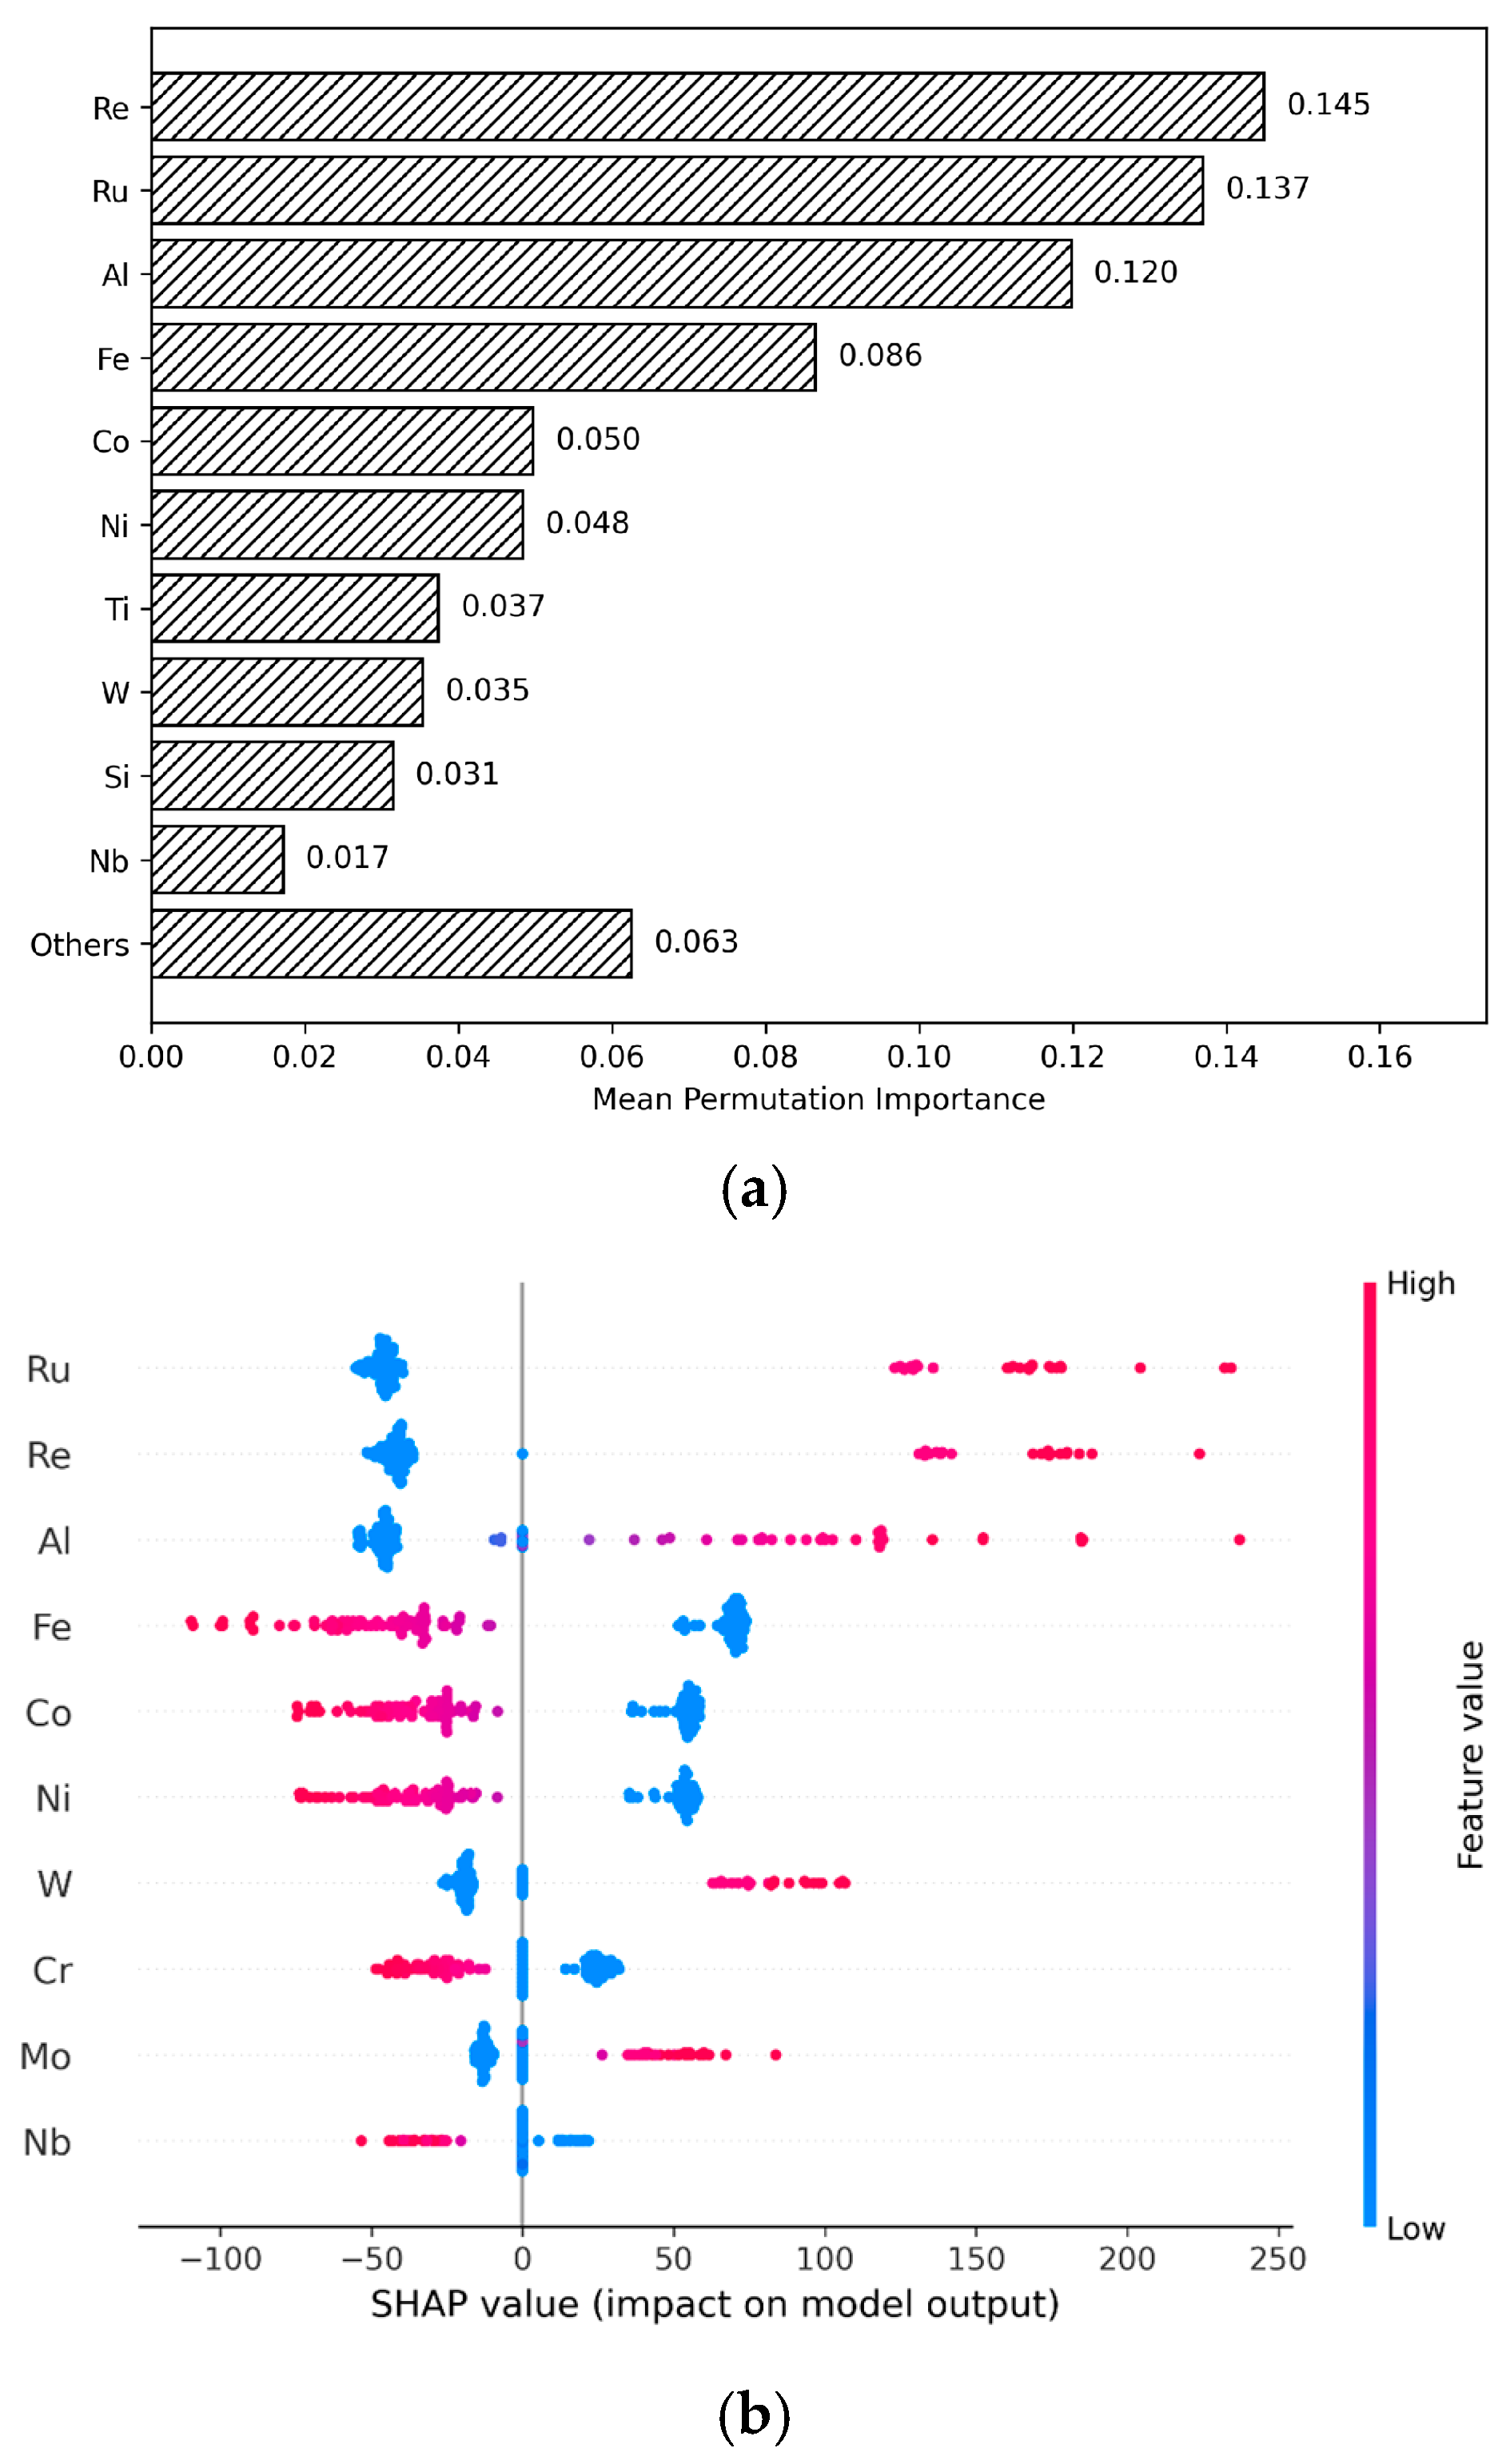
Interpretability assessment of the best-performing base model (SVR) via (a) PFI, (b) SHAP.
Figure 9.
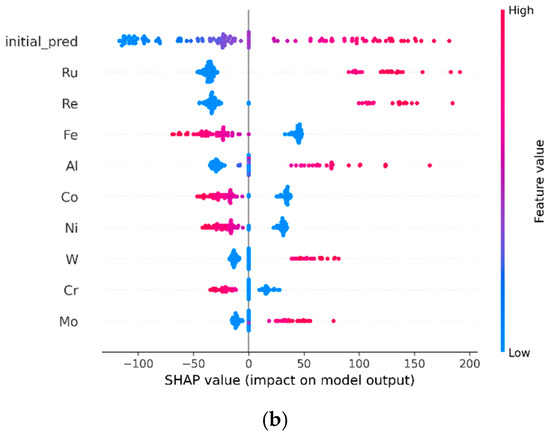
Interpretability assessment of the meta-model (a) XGB-SVR’s PFI; (b) XGB-SVR’s SHAP.
Both the PFI and SHAP analyses agree on the six most influential features in the HEA alloying behavior towards its hardness predictions: Ru, Re, Al, Fe, Co, and Ni. As shown in the PFI ranking, Ru, Re, and Al exhibit the highest mean permutation importance, followed by Fe, Co, and Ni with comparatively lower yet still notable contributions. The SHAP summary plot provides further insight into the direction of each feature’s contribution. Ru, Re, and Al tend to drive the model’s hardness prediction in the positive direction, whereas Fe, Co, and Ni push it in the negative direction. Moreover, these contributions appear proportional to the feature magnitude. Higher concentrations of Ru, Re, and Al are associated with larger positive SHAP values. Conversely, higher values of Fe, Co, and Ni correspond to larger negative SHAP values.
The directional contributions identified by the SHAP analysis can be interpreted with how they interact to resist the localized plastic deformation. Ruthenium and rhenium are one of the dense refractory elements known to enhance the mechanical performance of a system via solid-solution strengthening with slow diffusion kinetics. These features could influence the alloy’s resistance towards dislocation motion and their stability on the high-temperature operation [39,40,41,42]. Ruthenium and rhenium’s large atomic sizes also contribute to generating substantial local lattice strain when substituted into the matrix. This strain produces solid-solution strengthening that raises the stress required to move dislocations [43,44]. Zhang et al., for example, showed that minor additions of Re and Ru (1 at%) to the L12-strengthened Ni29Co27Fe27Cr3Al7Ti7 HEA enhanced the coarsening resistance of the L12 precipitates by decelerating diffusion. In addition, Ru increases the microhardness by raising the volume fraction and refining the size of the L21 phase [45].
For aluminum, its positive contribution comes from its role in solid solution strengthening and the promotion of the ordered strengthening phases. Aluminum distorts the matrix lattice during its solute phase and encourages the formation of ordered intermetallic phase. Both effects hinder dislocation movement and enhance resistant behavior to indentation [46,47]. This is supported in Bała et al., where a CoNiFe-based medium-entropy alloy, combined with Al and Ti additions, raised the hardness by roughly 40 HV through solid-solution and γ′ precipitation strengthening [48]. Korir et al. found that the dislocation motion of the Al-containing Al–Co–Cr–Fe–Ni HEAs were slowed down due to the increased hardness [49]. This is also consistent with Yang et al., who observed improved hardness in Al- and Mo-containing HEAs due to the relatively low valence electron concentration (VEC) of these alloying elements [22].
Meanwhile, Fe, Co, and Ni drive the predicted hardness in the negative direction with increasingly negative SHAP values as the concentration increases. The contributions of these elements could be explained by their tendency to stabilize face-centered cubic (FCC) structures, which generally exhibit lower hardness than body-centered cubic (BCC) structures [50,51]. This is exemplified by the Fe–Co–Ni–Cr–Mn Cantor alloy that displays very low yield strength even though it has the superior ductility at room temperature [52]. However, this negative contribution could also be read as a differing contrast towards the more potent strengthening elements, as described earlier.
The change in the importance of values and the SHAP analysis of the meta-model, as shown in Figure 9, are apparent when compared with the base-model. Base learner prediction (initial_pred) [OOF] receives the highest importance, as it is a direct estimate to the target. However, the relative ranking of the [X] compositional features is preserved between the base model and the meta model. This indicates that the meta-learner continues to read the composition–hardness relationships in the similar manner as the baseline SVR. Therefore, the [OOF] column seems to reencode the available information in [X] rather than contributing an independent signal, making the high importance value become redundancy instead of an added predictive value.
3.4. Case Study
Case studies are conducted to evaluate the best-performing model, which is XGB-SVR in this study. Held out composition data provided by Detor et al. [27] was used to evaluate the influence of rhenium (Re) and ruthenium (Ru) on the Vickers hardness of HEAs. These alloying elements are chosen as both were identified as the most prominent features by PFI and SHAP analyses. The first case study, showcased in Table 2, compares the addition of 20% Re and 20% Nb to the 20% Mo, 20% Hf, 20% Ta, and 20% W base alloy. Experimentally, the addition of Re increased the hardness value up to 40.2% relative to Nb. This trend is reflected in the XGB-SVR model’s estimates with only 2.1% and 6.44% prediction errors, respectively. Meanwhile, the second case study, as shown in Table 3, evaluates the base alloy of 20% Re, 20% Mo, 20% Hf, and 20% W with the fifth alloying element being either 20% Ru or 20% Nb. The Ru-containing alloy surpassed its Nb counterpart with up to 30.7% increased hardness. Similar with the earlier case study, the model accurately predicted the hardness values, yielding prediction errors of only 0.3% and 1.5%, respectively. These results demonstrate that the model is capable of capturing the hardness-enhancing effects of Re and Ru in compositions that were not included in the training dataset. However, the alloys taken from the dataset sources fall in the high-hardness refractory regime, where a large denominator flatters the percentage error and the training data are relatively dense. Therefore, this case study verifies that the model could replicate the elemental effects within a known compositional range.
Table 2.
First study case of Vickers hardness prediction: Re vs. Nb.
Table 3.
Second study case of Vickers hardness prediction: Ru vs. Nb.
3.5. Limitation
This study is constrained by various limitations. First is the limited amount of data with 120 compiled alloys, to ensure that the composition–hardness relation is not confounded by the processing path. This restricts the prediction model to the alloy families contained within the data. As a result, a well-trained base learner at this sample size leaves little headroom for a meta-learner to exploit, so the stacking configurations do not improve much on the base model. This is further compounded with the hyperparameters of both the base learner and the meta-learner that were optimized over the same five-fold partition that was subsequently used to generate the out-of-fold predictions and to report performance, making the reported metrics dependent on the tuning procedure. The dataset also contains uncertainty that is not captured by the model. Vickers hardness measurements vary from between sample and from laboratories for supposedly equivalent alloys. This leads to scatter that is not predictable by any model, weakening the composition–hardness connection and the accuracy of the model prediction. However, the model still functions as expected as a rapid screening tool to gain general understanding of a specific alloy.
4. Conclusions
In this study, a composition-based stacking ensemble machine learning was developed to predict the Vickers hardness of VAM HEAs directly from their nominal elemental compositions (at.%) without relying on the engineered descriptors or processing parameters. A dataset of 120 experimental data points was compiled across 15 constituent elements. Four models were used as the baseline predictors, KNN, SVR, XGB, and ANN. Among the trained models, SVR achieved the highest predictive performance, reaching OOF R2 of 0.90. SVR was later adopted as the meta-learner. With respect to the baseline model, KNN-SVR and ANN-SVR configurations reduced prediction error by 17.2% and 12.5% respectively. XGB-SVR shows an increased accuracy by 2.9%, and SVR-SVR is unchanged. However, comparing SVR on compositional feature against SVR trained on augmented data of composition and OOF prediction returned identical accuracy. This indicates the redundancy of OOF and that a well-tuned base learner leaves little headroom at this dataset size. Interpretability analyses using PFI and SHAP identified Ru, Re, and Al as the strongest positive contributors and Fe, Co, and Ni as negative contributors, consistent with established metallurgical strengthening mechanisms. Validation on four held-out compositions reported by Detor et al. gave prediction errors below 7%. Several limitations should be addressed in future work. The model runs on elemental composition, while the processing variables are excluded by restricting the variables to the VAM pathway. Future work should integrate processing parameters and expand the dataset. The subgrouping of chemically heterogenous alloy families should also be explored further as it could offer much greater coverage than the current data volume.
Supplementary Materials
The following supporting information can be downloaded at https://www.mdpi.com/article/10.3390/alloys5040026/s1, Figure S1: Correlation heatmap over the dataset features; Figure S2. Reduced pair plot of the highest importance elemental inputs and Vicker hardness target prediction. Figure S3. Out-of-compositional-family cross-validation performance of the SVR model, evaluated using R2 metric score for each held-out compositional family, with each family is given in (i)–(iv) as shown in the inset; Table S1: The optimized hyperparameters for standalone models (KNN, SVR, XGBoost, and ANN).
Author Contributions
A.P.P.K.: Conceptualization, Methodology, Software, Investigation, Visualization, Writing—Original Draft; R.S.P.K.: Data curation, Validation, Methodology, Formal analysis, Writing—Original Draft; A.F.: Data curation, Investigation, Resources, Writing—Review and Editing; A.F.P.: Project administration, Writing—Review and Editing; C.S.W.P.: Validation, Writing—Review and Editing; J.F.F.: Conceptualization, Supervision, Writing—Review and Editing. All authors have read and agreed to the published version of the manuscript.
Funding
This research received no external funding.
Data Availability Statement
The data presented in this study are openly available in the GitHub repository HEA-EnsembleMLPrediction (https://github.com/NdokiA/HEA-EnsembleMLPrediction (accessed on 1 October 2026)).
Conflicts of Interest
The authors declare that they have no known competing financial interests or personal relationships that could have appeared to influence the work reported in this paper.
References
- Balaji, V.; Xavior, A. Development of High Entropy Alloys (HEAs): Current Trends. Heliyon 2024, 10, e26464. [Google Scholar] [CrossRef] [Scilit] [PubMed]
- Shahi, R.R.; Gupta, A.K.; Kumari, P. Perspectives of High Entropy Alloys as Hydrogen Storage Materials. Int. J. Hydrogen Energy 2023, 48, 21412–21428. [Google Scholar] [CrossRef] [Scilit]
- Zhang, Y.; Li, R. New Advances in High-Entropy Alloys. Entropy 2020, 22, 1158. [Google Scholar] [CrossRef] [Scilit] [PubMed]
- Poulia, A.; Karantzalis, A.E. Latest Advancements and Mechanistic Insights into High-Entropy Alloys: Design, Properties and Applications. Materials 2025, 18, 5616. [Google Scholar] [CrossRef] [Scilit] [PubMed]
- Shi, Y.; Yang, B.; Liaw, P.K. Corrosion-Resistant High-Entropy Alloys: A Review. Metals 2017, 7, 43. [Google Scholar] [CrossRef] [Scilit]
- Xie, X.; Li, N.; Liu, W.; Huang, S.; He, X.; Yu, Q.; Xiong, H.; Wang, E.; Hou, X. Research Progress of Refractory High Entropy Alloys: A Review. Chin. J. Mech. Eng. 2022, 35, 142. [Google Scholar] [CrossRef] [Scilit]
- Zhang, Z.; Mao, M.; Wang, J.; Gludovatz, B.; Zhang, Z.; Mao, S.X.; George, E.P.; Yu, Q.; Ritchie, R.O. Nanoscale Origins of the Damage Tolerance of the High-Entropy Alloy CrMnFeCoNi. Nat. Commun. 2015, 6, 10143. [Google Scholar] [CrossRef] [Scilit] [PubMed]
- Dixit, S.; Rodriguez, S.; Jones, M.R.; Buzby, P.; Dixit, R.; Argibay, N.; DelRio, F.W.; Lim, H.H.; Fleming, D. Refractory High-Entropy Alloy Coatings for High-Temperature Aerospace and Energy Applications. J. Therm. Spray. Technol. 2022, 31, 1021–1031. [Google Scholar] [CrossRef] [Scilit]
- Chen, D.; Huan, Y.; Ma, G.; Ma, M.; Wang, X.; Xie, X.; Leng, J.; Hu, X.; Wei, T. High-Entropy Alloys FeCoNiCuX (X = Al, Mo)-Ce0.8Sm0.2O2 as High-Performance Solid Oxide Fuel Cell Anodes. ACS Appl. Energy Mater. 2023, 6, 1076–1084. [Google Scholar] [CrossRef] [Scilit]
- Marques, F.; Balcerzak, M.; Winkelmann, F.; Zepon, G.; Felderhoff, M. Review and Outlook on High-Entropy Alloys for Hydrogen Storage. Energy Environ. Sci. 2021, 14, 5191–5227. [Google Scholar] [CrossRef] [Scilit]
- Zlotea, C.; Bouzidi, A.; Montero, J.; Ek, G.; Sahlberg, M. Compositional Effects on the Hydrogen Storage Properties in a Series of Refractory High Entropy Alloys. Front. Energy Res. 2022, 10, 991447. [Google Scholar] [CrossRef] [Scilit]
- Ren, W.; Zhang, Y.-F.; Wang, W.-L.; Ding, S.-J.; Li, N. Prediction and Design of High Hardness High Entropy Alloy through Machine Learning. Mater. Des. 2023, 235, 112454. [Google Scholar] [CrossRef] [Scilit]
- Fatriansyah, J.F.; Orihara, H. Electric-Field-Induced Flow-Aligning State in a Nematic Liquid Crystal. Phys. Rev. E 2015, 91, 042508. [Google Scholar] [CrossRef] [Scilit] [PubMed]
- Arun, S.; Radhika, N.; Saleh, B. Advances in Vacuum Arc Melting for High Entropy Alloys: A Review. Vacuum 2024, 226, 113314. [Google Scholar] [CrossRef] [Scilit]
- Pei, Z.; Zhao, S.; Detrois, M.; Jablonski, P.D.; Hawk, J.A.; Alman, D.E.; Asta, M.; Minor, A.M.; Gao, M.C. Theory-Guided Design of High-Entropy Alloys with Enhanced Strength-Ductility Synergy. Nat. Commun. 2023, 14, 2519. [Google Scholar] [CrossRef] [Scilit] [PubMed]
- Poonia, A.; Kishor, M.; Ayyagari, K.P.R. Designing of High Entropy Alloys with High Hardness: A Metaheuristic Approach. Sci. Rep. 2024, 14, 7692. [Google Scholar] [CrossRef] [Scilit] [PubMed]
- Chen, C.; Ma, L.; Zhang, Y.; Liaw, P.K.; Ren, J. Accelerating the Design of High-Entropy Alloys with High Hardness by Machine Learning Based on Particle Swarm Optimization. Intermetallics 2023, 154, 107819. [Google Scholar] [CrossRef] [Scilit]
- Montoya, J.H.; Aykol, M.; Anapolsky, A.; Gopal, C.B.; Herring, P.K.; Hummelshøj, J.S.; Hung, L.; Kwon, H.-K.; Schweigert, D.; Sun, S.; et al. Toward Autonomous Materials Research: Recent Progress and Future Challenges. Appl. Phys. Rev. 2022, 9, 011405. [Google Scholar] [CrossRef] [Scilit]
- Xu, D.; Zhang, Q.; Huo, X.; Wang, Y.; Yang, M. Advances in Data-Assisted High-Throughput Computations for Material Design. Mater. Genome Eng. Adv. 2023, 1, e11. [Google Scholar] [CrossRef] [Scilit]
- Fatriansyah, J.F.; Surip, S.N.; Hartoyo, F. Mechanical Property Prediction of Poly(Lactic Acid) Blends Using Deep Neural Network. Evergreen 2022, 9, 141–144. [Google Scholar] [CrossRef] [Scilit]
- Fatriansyah, J.F.; Rafi Aqila, M.; Suhariadi, I.; Federico, A.; Iman Ajiputro, D.; Febrian Pradana, A.; Andreano, Y.; Ali Yafi Rizky, M.; Dhaneswara, D.; Lockman, Z.; et al. Machine Learning Assisted Tensile Strength Prediction and Optimization of Ti Alloy. IEEE Access 2024, 12, 119660–119670. [Google Scholar] [CrossRef] [Scilit]
- Yang, C.; Ren, C.; Jia, Y.; Wang, G.; Li, M.; Lu, W. A Machine Learning-Based Alloy Design System to Facilitate the Rational Design of High Entropy Alloys with Enhanced Hardness. Acta Mater. 2022, 222, 117431. [Google Scholar] [CrossRef] [Scilit]
- Ren, J.-T.; Chen, L.; Wang, H.-Y.; Yuan, Z.-Y. High-Entropy Alloys in Electrocatalysis: From Fundamentals to Applications. Chem. Soc. Rev. 2023, 52, 8319–8373. [Google Scholar] [CrossRef] [Scilit] [PubMed]
- Bhandari, U.; Rafi, M.R.; Zhang, C.; Yang, S. Yield Strength Prediction of High-Entropy Alloys Using Machine Learning. Mater. Today Commun. 2021, 26, 101871. [Google Scholar] [CrossRef] [Scilit]
- Bakr, M.; Syarif, J.; Hashem, I.A.T. Prediction of Phase and Hardness of HEAs Based on Constituent Elements Using Machine Learning Models. Mater. Today Commun. 2022, 31, 103407. [Google Scholar] [CrossRef] [Scilit]
- Gao, S.; Gao, Z.; Zhao, F. Machine Learning and Visualization Assisted Solid Solution Strengthening Phase Prediction of High Entropy Alloys. Mater. Today Commun. 2023, 35, 105894. [Google Scholar] [CrossRef] [Scilit]
- Detor, A.; Oppenheimer, S.; Casey, R.; Crawford, C. Refractory High Entropy Alloy Dataset with Room Temperature Ductility Screening. Data Brief 2022, 45, 108582. [Google Scholar] [CrossRef] [Scilit] [PubMed]
- He, J.Y.; Liu, W.H.; Wang, H.; Wu, Y.; Liu, X.J.; Nieh, T.G.; Lu, Z.P. Effects of Al Addition on Structural Evolution and Tensile Properties of the FeCoNiCrMn High-Entropy Alloy System. Acta Mater. 2014, 62, 105–113. [Google Scholar] [CrossRef] [Scilit]
- Wolpert, D.H. Stacked Generalization. Neural Netw. 1992, 5, 241–259. [Google Scholar] [CrossRef] [Scilit]
- Marcílio, W.E.; Eler, D.M. From Explanations to Feature Selection: Assessing SHAP Values as Feature Selection Mechanism. In Proceedings of the 2020 33rd SIBGRAPI Conference on Graphics, Patterns and Images (SIBGRAPI); IEEE: Piscataway, NJ, USA, 2020; pp. 340–347. [Google Scholar]
- Song, Y.; Liang, J.; Lu, J.; Zhao, X. An Efficient Instance Selection Algorithm for k Nearest Neighbor Regression. Neurocomputing 2017, 251, 26–34. [Google Scholar] [CrossRef] [Scilit]
- Parveen, N.; Zaidi, S.; Danish, M. Development of SVR-Based Model and Comparative Analysis with MLR and ANN Models for Predicting the Sorption Capacity of Cr (VI). Process Saf. Environ. Prot. 2017, 107, 428–437. [Google Scholar] [CrossRef] [Scilit]
- Wu, Y.; Feng, J. Development and Application of Artificial Neural Network. Wirel. Pers. Commun. 2018, 102, 1645–1656. [Google Scholar] [CrossRef] [Scilit]
- Chen, T.; Guestrin, C. Xgboost: A Scalable Tree Boosting System. In Proceedings of the 22nd Acm Sigkdd International Conference on Knowledge Discovery and Data Mining, San Francisco, CA, USA, 13–17 August 2016; 2016, pp. 785–794. [Google Scholar]
- Liu, G.; Sohn, S.; O’Hern, C.S.; Gilbert, A.C.; Schroers, J. Effective Subgrouping Enhances Machine Learning Prediction in Complex Materials Science Phenomena: Inoue’s Subgrouping in Discovering Bulk Metallic Glasses. Acta Mater. 2024, 265, 119590. [Google Scholar] [CrossRef] [Scilit]
- Ahmad, M.S.; Adnan, S.M.; Zaidi, S.; Bhargava, P. A Novel Support Vector Regression (SVR) Model for the Prediction of Splice Strength of the Unconfined Beam Specimens. Constr. Build. Mater. 2020, 248, 118475. [Google Scholar] [CrossRef] [Scilit]
- Chen, D.; Liu, Y.; Feng, W.; Wang, Y.; Hu, Q.; Lv, G.; Zhang, S.; Guo, S. In-Situ Prediction of α-Phase Volume Fraction in Titanium Alloy Using Laser Ultrasonic with Support Vector Regression. Appl. Acoust. 2021, 177, 107928. [Google Scholar] [CrossRef] [Scilit]
- Wang, L.; Li, L.; Zhang, Z. Accurate Descriptions of Hot Flow Behaviors across β Transus of Ti-6Al-4V Alloy by Intelligence Algorithm GA-SVR. J. Mater. Eng. Perform. 2016, 25, 3912–3923. [Google Scholar] [CrossRef] [Scilit]
- Neumeier, S.; Pyczak, F.; Göken, M. Influence of Rhenium and Ruthenium on the Local Mechanical Properties of the γ and Γ′ Phases in Nickel-Base Superalloys. Philos. Mag. 2011, 91, 4187–4199. [Google Scholar] [CrossRef] [Scilit][Green Version]
- Zohrevand, M.; Mokhtare, M.; Momeni, A.; Sadeghpour, S.; Somani, M. Effect of Re Addition on Microstructure, Properties, and Performance of AlMo0.5NbTa0.5TiZr Refractory High Entropy Alloy. Intermetallics 2024, 168, 108257. [Google Scholar] [CrossRef] [Scilit]
- Song, W.; Wang, X.; Li, J.; Ye, L.; Hou, G.; Yang, Y.; Liu, J.; Liu, J.; Pei, W.; Zhou, Y.; et al. Effect of Ruthenium on Microstructure and High-Temperature Creep Properties of Fourth Generation Ni-Based Single-Crystal Superalloys. Mater. Sci. Eng. A 2020, 772, 138646. [Google Scholar] [CrossRef] [Scilit]
- Zhao, C.; Lu, H.; Wang, H.; Tang, F.; Nie, H.; Hou, C.; Liu, X.; Song, X.; Nie, Z. Solid-Solution Hardening of WC by Rhenium. J. Eur. Ceram. Soc. 2020, 40, 333–340. [Google Scholar] [CrossRef] [Scilit]
- Yue, E.-L.; Yu, T.; Wang, Y.-J.; Wang, C.-Y. Synergistic Strengthening Mechanisms of Rhenium in Nickel-Based Single Crystal Superalloys. Intermetallics 2021, 132, 107133. [Google Scholar] [CrossRef] [Scilit]
- Rettig, R.; Singer, R. Influence of Ruthenium on Topologically Close Packed Phase Precipitation in Single-Crystal Ni-Based Superalloys: Numerical Experiments and Validation. Superalloys 2012, 2012, 205–214. [Google Scholar] [CrossRef] [Scilit]
- Zhang, K.; He, F.; Yang, Z.; Cui, D.; Li, J.; Yang, Z.; Wang, J.; Wang, Z. Effect of Re and Ru on the Phase Stability and Coarsening Kinetics of L12 Phase in a Ni29Co27Fe27Cr3Al7Ti7 High Entropy Alloy. J. Alloys Compd. 2021, 866, 158904. [Google Scholar] [CrossRef] [Scilit]
- Jin, C.; Li, X.; Kang, J.; Wang, H. Achieving Excellent Strength-Ductility Balance in the Lightweight Refractory High-Entropy Alloy by Incorporating Aluminum. Mater. Sci. Eng. A 2024, 915, 147248. [Google Scholar] [CrossRef] [Scilit]
- Wang, W.; Zhang, Z.; Niu, J.; Wu, H.; Zhai, S.; Wang, Y. Effect of Al Addition on Structural Evolution and Mechanical Properties of the AlxHfNbTiZr High-Entropy Alloys. Mater. Today Commun. 2018, 16, 242–249. [Google Scholar] [CrossRef] [Scilit]
- Bała, P.; Górecki, K.; Dziurka, R.; Kozieł, T. The Effect of Al and Ti Additions on Solid Solution Strengthening and Precipitation Hardening in CoNiFe Medium-Entropy Alloys. Materials 2023, 16, 6297. [Google Scholar] [CrossRef] [Scilit] [PubMed]
- Korir, R.C.; Kenedy, G.R.; Cheng, W.-C.; Chen, S.-H. Sequential Spinodal Decompositions and Ordering Reactions in an As-Quenched Cr39Co18Fe18Ni18Al7 High-Entropy Alloy. Materials 2025, 18, 5364. [Google Scholar] [CrossRef] [Scilit] [PubMed]
- Zhang, T.; Xin, L.; Wu, F.; Zhao, R.; Xiang, J.; Chen, M.; Jiang, S.; Huang, Y.; Chen, S. Microstructure and Mechanical Properties of FexCoCrNiMn High-Entropy Alloys. J. Mater. Sci. Technol. 2019, 35, 2331–2335. [Google Scholar] [CrossRef] [Scilit]
- Zherebtsov, S.; Stepanov, N.; Ivanisenko, Y.; Shaysultanov, D.; Yurchenko, N.; Klimova, M.; Salishchev, G. Evolution of Microstructure and Mechanical Properties of a CoCrFeMnNi High-Entropy Alloy during High-Pressure Torsion at Room and Cryogenic Temperatures. Metals 2018, 8, 123. [Google Scholar] [CrossRef] [Scilit]
- Hu, M.; Cao, Q.; Wang, X.; Zhang, D.; Jiang, J.-Z. Tuning Nanostructure and Mechanical Property of Fe–Co–Ni–Cr–Mn High-Entropy Alloy Thin Films by Substrate Temperature. Mater. Today Nano 2021, 15, 100130. [Google Scholar] [CrossRef] [Scilit]

Disclaimer/Publisher’s Note: The statements, opinions and data contained in all publications are solely those of the individual author(s) and contributor(s) and not of MDPI and/or the editor(s). MDPI and/or the editor(s) disclaim responsibility for any injury to people or property resulting from any ideas, methods, instructions or products referred to in the content. |
© 2026 by the authors. Licensee MDPI, Basel, Switzerland. This article is an open access article distributed under the terms and conditions of the Creative Commons Attribution (CC BY) license.