


Abstract
Lake-effect snow (LES) has traditionally been studied from a mesoscale perspective, with comparatively less attention devoted to the role of synoptic-scale forcing. This study quantifies the prevalence and magnitude of synoptic forcing during 116 heavy LES events affecting the eastern shore of Lake Michigan between 1997 and 2024. Events were identified from the NOAA Storm Events Database and classified into five storm-track categories: Alberta Clippers (ACs), Colorado Lows (COs), East Coast Lows (ECs), Great Lakes Lows (GLLs), and anticyclones (HIs). ERA5 reanalysis data extracted at each event onset were composited by storm track to evaluate 500 mb vorticity advection, 850 mb temperature advection, 700 mb Q-vector divergence, 700 mb omega, sea-level pressure, lake index, and specific humidity. Cohen’s d and a resampling bootstrapping procedure were used to quantify and evaluate differences among storm tracks. AC, CO, and GLL events consistently exhibited the strongest synoptic-scale forcing, characterized by enhanced cyclonic vorticity advection, Q-vector convergence, and upward vertical motion, whereas HI events displayed minimal dynamical forcing despite producing heavy LES. Conversely, GLL and HI events exhibited the greatest thermodynamic instability, while CO and EC events contained the highest ambient moisture. These results demonstrate that heavy LES develops through multiple pathways, with some storm tracks featuring prevalent synoptic forcing and others exceptionally favorable thermodynamic conditions.
1. Introduction
Research on lake-effect snow (LES) has historically focused on processes conventionally classified as mesoscale following [1], including those governing event development and intensity. The term mesoscale is used herein as a descriptive meteorological classification rather than as a formal characterization of atmospheric scaling (see [2]). Numerous studies have examined the mesoscale thermodynamic and kinematic conditions favorable for LES, including lake–air temperature differences, boundary layer instability, moisture availability, inversion height, fetch length, and wind shear [3]. As a result, the fundamental mesoscale mechanisms responsible for LES initiation, organization, and maintenance are generally well understood. In contrast, comparatively less attention has been devoted to the role of synoptic-scale, again classified following [1], forcing in LES events. While previous studies have documented the large-scale weather patterns commonly associated with LES, including the presence of an upper-level low geopotential height anomaly centered over and linked to a surface cyclone–anticyclone couplet (referred to as “dipole”) [4], fewer investigations have explicitly analyzed the role of the synoptic-scale dynamic forcing accompanying these events. However, there have been studies that have noted a concurrence between certain synoptic features/processes and intense LES. Among these, shortwave troughs accompanied by cyclonic vorticity advection (CVA) have been the most frequently noted in the literature [5,6,7,8]. Shortwave troughs that form embedded within the longwave flow are thought to enhance LES intensity by elevating the height of the capping inversion, thereby allowing deeper convective growth and leading to higher snowfall totals. Additionally, shortwave trough forcing can contribute to downstream cyclogenesis, further reinforcing a synoptic environment favorable for LES development and altering where LES sets up. That said, much of the evidence from these studies supporting these connections is largely empirical, based primarily on qualitative assessments and individual case studies and often not the primary research objective.
More recently, Ref. [9] performed a seven-year climatology of shortwave troughs over the Great Lakes Basin (GLB) during the cold season (October–March). In that study they investigated how frequently days that featured these shortwave troughs also featured lake-effect clouds utilizing a preexisting repository developed by [10]. These pockets of energy were often present over the GLB for over 24 h, more than enough time to induce large-scale vertical forcing over areas where LES could initiate. Lake Michigan featured the highest concurrence of lake-effect clouds followed by Lake Superior, Lake Huron, Lake Ontario, and Lake Erie. Additionally, Ref. [11] featured a preliminary evaluation of the influence of quasi-geostrophic (QG) forcing between LES and non-LES associated Alberta Clippers via Q-vector analysis. Q-vector convergence, indicative of synoptic-scale ascent, was observed over the GLB during LES episodes but was largely absent in non-LES cases. This contrast suggests a strong relationship between synoptic-scale forcing and the development of LES events. While these recent studies have increasingly acknowledged the role of synoptic-scale forcing in LES development, the prevalence and contributions of synoptic-scale ascent associated with dynamic forcing mechanisms have yet to be thoroughly investigated.
This study builds on previous work by quantifying and assessing the magnitude of synoptic-scale dynamic forcing (i.e., QG forcing mechanisms) during heavy LES events affecting the eastern shoreline of Lake Michigan. Given that different cyclone tracks produce distinct synoptic environments resulting in various distributions of dynamic forcing, cold-air advection (CAA), and moisture transport across the GLB, examining LES events within the context of North American storm tracks may provide insight into why some events experience greater forcing and produce more significant snowfall impacts than others. Thus, the primary objective of this study was to evaluate variability in synoptic-scale dynamic forcing according to major North American storm tracks. Additionally, the variability in mesoscale thermodynamic forcing support and overall LES characteristics between the storm tracks was also explored. In the present study, thermodynamic forcing refers specifically to diabatic processes associated with lake–atmosphere energy and moisture exchange, particularly sensible and latent heat fluxes that modify lower-tropospheric stability and buoyancy. Section 2 describes the data and methodology, including the development of an LES case repository, the classification of associated cyclone tracks, the diagnostic variables used to evaluate synoptic-scale dynamic forcing, mesoscale thermodynamic forcing, and LES characteristics, and the statistical analyses used to compare between storm tracks. Section 3 presents the results, organized according to the analysis framework. A summary of results and the conclusions, including the overall contributions of QG forcing to total large-scale ascent and how synoptic dynamic forcing compares to mesoscale thermodynamic forcing, is contained in Section 4.
2. Materials and Methods
2.1. LES Case Set
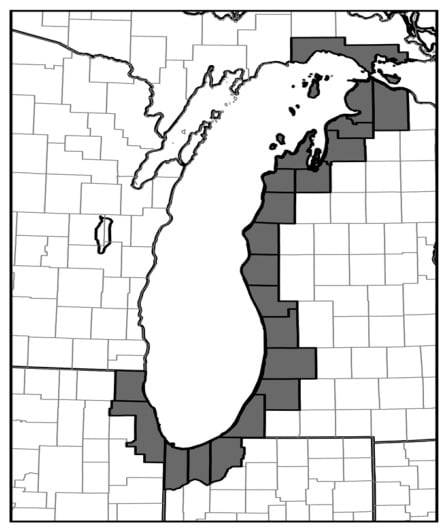
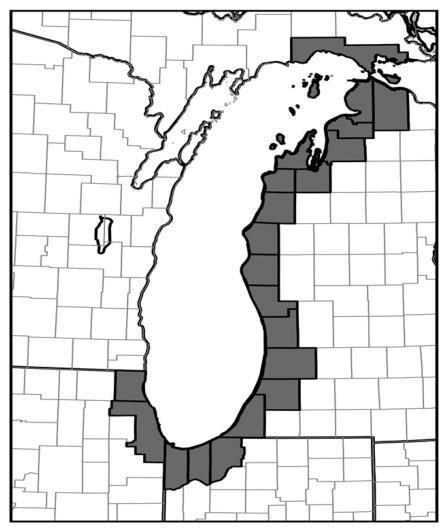
Heavy LES events were identified using reports obtained from the NOAA Storm Events Database (NSED). NSED classifies an LES event as “convective snow bands that occur in the lee of large bodies of water when relatively cold air flows over warm water” [12] and records the following attributes for each event: start and end dates (i.e., duration), storm report source(s), county, state, Weather Forecasting Office (WFO), direct/indirect injuries and deaths, and property/agricultural damage (US dollars), and includes a general synopsis of the event which includes peak snowfall (inches). In addition to these attributes, daily average Lake Michigan surface temperatures were obtained for each case from the Great Lakes Surface Environmental Analysis (GLSEA) to assess lake surface temperature influences on low-level stability profiles [13]. For this study, LES reports were collected for 21 counties located along the northern and eastern shoreline of Lake Michigan, encompassing regions frequently impacted by LES (Figure 1). Individual reports classified as LES within the database are grouped by county and were initially treated as separate events. To reduce duplication associated with spatially overlapping or temporally continuous LES episodes, events were consolidated using a temporal overlap criterion used in previous research [4]. Specifically, any LES reports with start times occurring within six hours of one another were considered part of the same LES event. The six-hour window was selected to accommodate county-to-county differences in the reported onset of the same evolving LES episode while remaining substantially shorter than the typical event duration, thereby limiting the likelihood that distinct LES episodes were merged. Additionally, for the purposes of this study, “heavy” LES refers to events formally documented within the NSED under the Lake-Effect Snow event category. No additional snowfall, duration, or impact threshold was imposed by the authors. This terminology reflects the event-selection requirements of NWS Storm Data rather than a newly defined intensity category.
Figure 1.
Counties along the northern and eastern shores of Lake Michigan used for LES event identification in NSED.
2.2. Reanalysis Data and Diagnostic Variables
Atmospheric reanalysis data used in this study were obtained from the fifth-generation European Centre for Medium-Range Weather Forecasts (ECMWF) atmospheric reanalysis (ERA5). ERA5 provides hourly estimates of atmospheric variables on a global domain using a combination of model output and data assimilation techniques [14]. The dataset has a horizontal grid spacing of approximately 0.25° latitude–longitude and contains atmospheric fields on both pressure levels and single levels from 1940 to the present. ERA5 was selected due to its relatively high spatial and temporal resolution, which is well suited for resolving the synoptic-scale environments associated with LES events. However, it should be acknowledged that as with all reanalysis products, ERA5 contains biases associated with the underlying forecast model and data-assimilation system, including documented temperature and thermodynamic biases. These limitations may influence the absolute magnitude of individual ERA5-derived quantities, particularly lower-tropospheric thermodynamic variables. That said, the primary analyses presented here emphasize tropospheric synoptic-scale structure and relative differences among storm-track classifications using a common dataset and methodology. Consequently, systematic ERA5 biases are not expected to materially alter the principal comparative conclusions of this study, although absolute values should be interpreted with appropriate caution. Furthermore, ERA5 is used here to characterize the environmental conditions supporting LES rather than to explicitly resolve individual lake-effect convective bands, whose spatial scales may be considerably smaller than the ERA5 grid spacing. For each LES case identified from the NSED, ERA5 data were extracted at the reported event start time. Following data extraction, LES events were manually grouped according to associated North American storm-track classifications. Storm-track classification followed the methodology developed by [4] and was based principally on the cyclogenesis region and subsequent propagation of the dominant synoptic system influencing Lake Michigan during LES development. Cyclogenesis was identified by the appearance of an evident local sea-level pressure minimum and/or closed cyclonic circulation that persisted or strengthened during the subsequent 24 h. The evolution of each system was then manually tracked through successive Weather Prediction Center surface analyses rather than classified solely from its position at LES onset. The storm-track classifications examined in this study include the Alberta Clipper (AC), Colorado Low (CO), Great Lakes Low (GLL), East Coast Low (EC), and Anticyclone (HI). ACs developed in the lee of the Canadian Rocky Mountains and generally tracked east to southeast toward and along the United States–Canada border. COs developed in the lee of the central United States Rocky Mountains and typically propagated eastward or east-southeastward before recurving northeastward toward the Great Lakes. ECs developed near the Gulf of Mexico or western Atlantic and subsequently tracked northward along the eastern United States. GLLs developed within the upper Midwest, major river valleys, or Great Lakes region and generally propagated northward or northeastward. HI events were defined by the absence of a cyclone serving as the dominant synoptic influence, with an anticyclone instead governing the large-scale circulation affecting Lake Michigan during LES development. GLB regional composite analyses were then constructed for each storm-track category by averaging the atmospheric fields from all LES events within a given classification. These composites were used to identify recurring synoptic-scale patterns and to compare the prevalence and magnitude of dynamical forcing among different storm-track regimes. Cases for which the cyclogenesis region or subsequent track could not be confidently determined, or for which multiple synoptic systems prevented attribution to a single dominant circulation, were considered indeterminate and were excluded from storm-track-specific analyses. For more information on the storm track classification process, please refer to [4].
Several atmospheric variables and derived diagnostics were extracted from the ERA5 reanalysis dataset to evaluate both dynamical and thermodynamical contributions to LES development across storm track types. Particular emphasis was placed on assessing QG forcing mechanisms and their relationship to observed vertical motion during LES events. In the present study, QG diagnostics are employed specifically to characterize the larger-scale balanced forcing associated with vertical motion rather than to resolve the full dynamics of individual LES bands or provide a complete description of atmospheric motions across all scales, particularly where strongly ageostrophic, convective, or turbulent processes dominate [15]. At the synoptic scale, 500 mb geopotential height fields were analyzed to identify the large-scale flow patterns associated with each storm-track classification, including the position and amplitude of longwave troughs, shortwave disturbances, and regions of cyclonic curvature. In conjunction with the height fields, 500 mb absolute vorticity and vorticity advection were examined to evaluate the contribution of vorticity advection to synoptic-scale ascent. To complement the upper-level dynamical analysis, 850 mb temperature and temperature advection fields were also evaluated to assess lower-tropospheric baroclinicity and the contribution of thermal forcing to vertical motion. In the context of LES, strong CAA is closely linked to destabilization over the relatively warm lake surface and can therefore contribute to lake-induced instability.
Although individual vorticity and thermal advection terms provide useful insight into synoptic forcing processes, direct interpretation can be complicated by the potential conflicts between forcing mechanisms within the QG framework. To address this limitation, 700 mb Q-vector convergence/divergence was analyzed as a more complete representation of total QG forcing. Regions of Q-vector convergence are associated with synoptic-scale ascent and provide a compact diagnostic of the combined forcing contributions from differential vorticity advection and thermal advection [16]. The 700 mb level was selected because it typically resides near the middle troposphere and often captures the layer of strongest synoptic ascent associated with winter cyclones (i.e., near level of non-divergence). To directly evaluate the total atmospheric vertical motion, 700 mb omega fields were also examined. Omega fields were then compared with Q-vector divergence patterns to assess the degree to which observed ascent during heavy LES events could be attributed to synoptic-scale QG forcing. This comparison enabled an assessment of whether enhanced upward motion coincided with regions of strong synoptic-scale forcing or whether ascent was more strongly tied to mesoscale lake-induced processes.
Because LES development is inherently dependent upon lower-tropospheric thermodynamic conditions, additional analyses focused on low-level moisture and static stability. Mean specific humidity within the 1000–850 mb layer was analyzed to characterize the depth and magnitude of low-level moisture available to support LES band development. Enhanced low-level moisture can contribute to deeper convective boundary layers and more efficient snow production within lake-effect bands [17]. Additionally, static stability over Lake Michigan was evaluated using a lake index (LI) parameter defined as the temperature difference between the lake surface and the 850 mb level. This parameter serves as a proxy for lake-induced instability and is commonly used to assess the thermodynamic favorability for LES development with 13 °C generally considered the minimum threshold needed for lake-induced convection [18]. Larger lake–850 mb temperature differences correspond to steeper low-level lapse rates and establish thermodynamic conditions favorable for enhanced lake-to-atmosphere sensible heat exchange and boundary-layer destabilization. When accompanied by relatively dry over-lake air, these conditions may also favor enhanced latent heat exchange; however, turbulent heat fluxes were not calculated directly in this study. Lastly, sea-level pressure (SLP) was also explored to look for potential relationships to LES events.
2.3. Statistical Analysis Methods
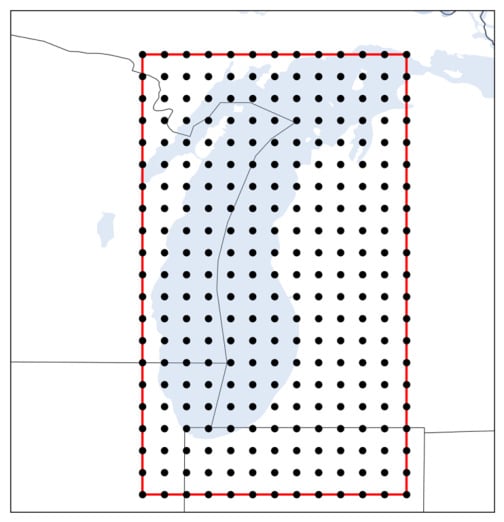
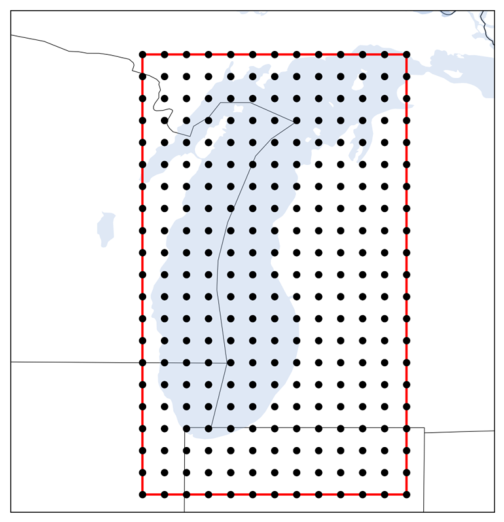
To assess potential differences in the dynamic and thermodynamic environments associated with the various storm tracks, Cohen’s d effect sizes were calculated for all pairwise comparisons between tracks. Effect sizes provide a standardized measure of the magnitude of differences between groups and are commonly used to assess the practical significance of observed relationships [19]. For each LES event, a fixed 13 × 21 gridpoint domain (Figure 2) was used to extract the atmospheric variables of interest from the ERA5 reanalysis, resulting in a total of 273 grid points per field. This domain was selected to capture the primary dynamic and thermodynamic environments influencing LES development over Lake Michigan, while also capturing downstream inland regions where LES bands commonly extend and produce impacts. Instead of treating individual grid points as independent samples, which would artificially inflate the effective sample size and violate assumptions of independence due to spatial autocorrelation, each LES event was treated as a single independent atmospheric realization. To achieve this, domain-averaged values were calculated for each variable over the analysis region for individual events, resulting in a single scalar representative mean value for every variable–LES event combination. The case-mean values were then grouped according to storm-track classification. Cohen’s d was then computed as the difference between the means of two storm-track samples divided by their pooled standard deviation, providing a standardized measure of the magnitude of separation between groups. Unlike traditional significance tests, which evaluate the likelihood that differences arise from random sampling variability, Cohen’s d quantifies the practical magnitude of those differences independent of sample size. Pairwise effect sizes were calculated for all storm-track combinations with values near zero indicating little separation between groups, while larger absolute values indicate increasingly distinct environments.
Figure 2.
ERA5 grid points used for statistical analysis in this study. Atmospheric variables extracted from these locations were used to calculate average fields and evaluate differences among storm-track classifications using Cohen’s d effect size metrics and bootstrapping.
To further evaluate environmental differences between storm tracks, a regional nonparametric bootstrap resampling methodology similar to [4] was applied to the calculated mean ERA5 reanalysis values of the gridpoint domain. The bootstrapping technique was applied independently to each storm-track sample to generate empirical distributions of the mean environmental conditions. For each bootstrap iteration, 5000 resamples were generated, and the resulting distributions were used to derive 95 percent confidence intervals. These confidence intervals characterize uncertainty in the group means and support exploratory comparisons between the different storm tracks. It is important to note that these comparisons do not represent formal tests of statistical significance. Rather, Cohen’s d was used as the principal quantitative measure of the magnitude of pairwise differences. Furthermore, no formal adjustment for multiple comparisons was applied. This methodology was also used to explore differences in LES characteristics (duration and peak snowfall) between the different storm tracks.
3. Results
3.1. LES Repository
3.1.1. Seasonal Climatology
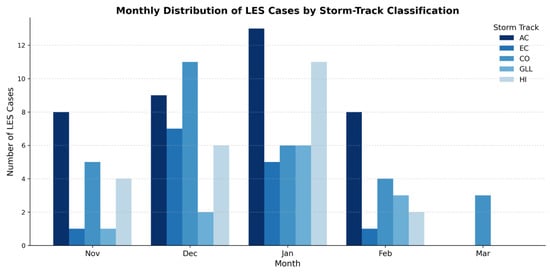
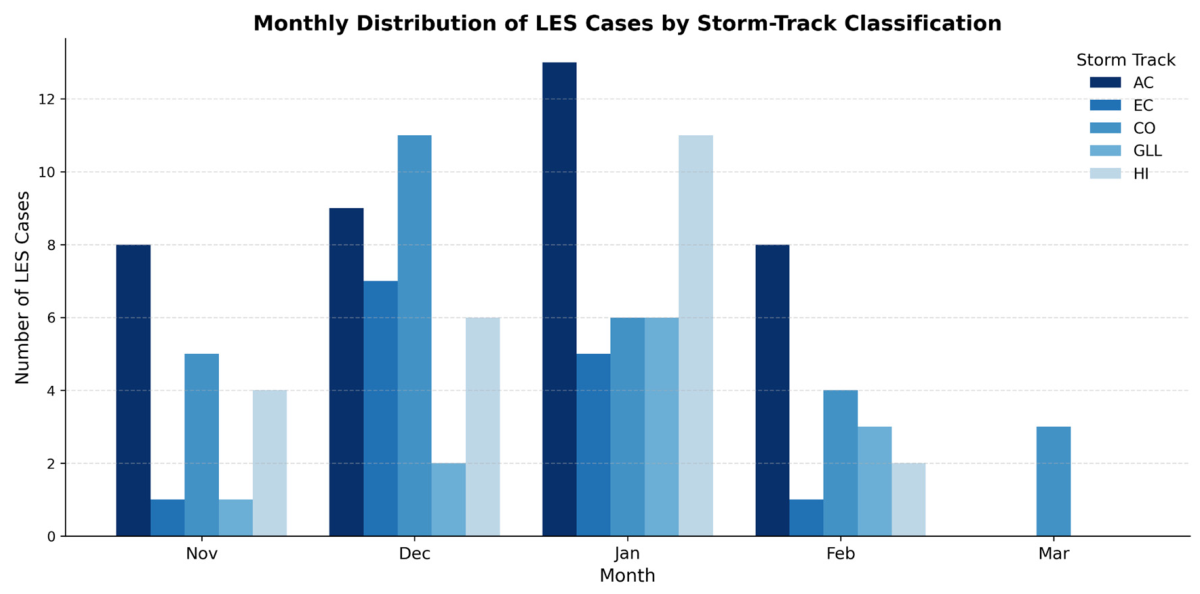
Following quality control and event consolidation, a total of 116 unique LES cases were identified that spanned the cool season months from November through March (Figure 3). Collectively, the storm-track climatology demonstrates a pronounced midwinter maximum in heavy LES occurrence across nearly all storm-track classifications, with January representing the dominant month for four of the five tracks. March events were notably rare, occurring exclusively within the CO classification. CO events exhibited the broadest seasonal distribution, occurring during every month from November through March. December contained the highest frequency (11 cases), although events remained common in January (six), February (four), and March (three). This broad distribution suggests that CO systems can generate favorable LES environments across a wide range of seasonal lake conditions and synoptic configurations. AC events were confined to November–February and peaked during January (13 cases), with secondary maxima in December (nine) and November (eight). Their midwinter preference is consistent with the climatological frequency of fast-moving continental cyclones and strong CAA during this period. The absence of March cases likely reflects the declining frequency and intensity of clipper systems as the baroclinic zone shifts poleward. HI events also displayed a pronounced midwinter maximum, with nearly half of all cases occurring during January (11). November and December accounted for four and six cases, respectively, while only two cases occurred in February. EC events were less frequent overall and concentrated primarily during December (seven cases) and January (five cases). Only isolated cases occurred during November and February, with no March events identified. This limited seasonal distribution likely reflects the requirement for favorable phasing between eastern US cyclogenesis and sufficiently cold post-cyclonic flow over the GLB, while the relatively low event frequency is consistent with the greater distance of EC cyclone tracks from the GLB. GLL events were among the least common storm-track categories and were largely confined to the core winter months. January contained the most cases (six), while November, December, and February accounted for only one, two, and three cases, respectively. The narrow seasonal distribution suggests that GLL events require a combination of strong synoptic forcing and sufficiently cold air masses that are most prevalent during midwinter.
Figure 3.
Monthly distribution of LES cases by storm-track classification.
3.1.2. Duration and Impacts
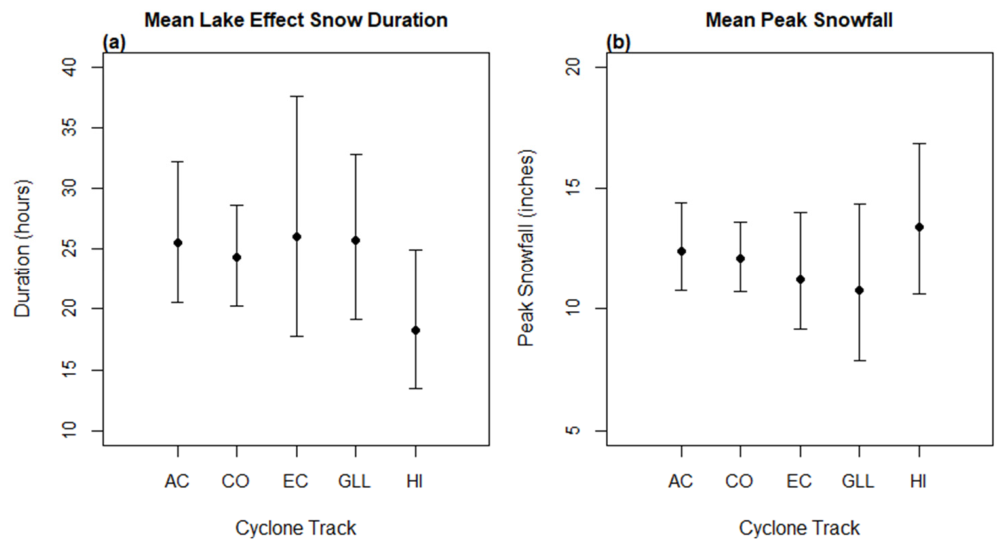
Table 1 presents the mean LES duration and peak snowfall values along with their corresponding mean z-scores to display values in terms of standard deviations. To obtain the mean z-scores, individual z-scores were first calculated for each LES event by comparing the event-specific mean of a given variable to the overall mean of that variable across all LES cases. The resulting z-scores were then averaged within each track to produce the track-level mean z-scores. AC, CO, EC, and GLL events exhibited remarkably similar mean durations, ranging from 24.4 to 26.5 h (Table 1). Correspondingly, duration z-scores for these storm tracks were all near or slightly above the dataset mean, with EC events exhibiting the longest average duration (26.54 h; z = 0.16). In contrast, HI events were notably shorter, averaging only 18.40 h in duration and producing the lowest duration z-score (−0.35). Despite their shorter duration, HI events produced the greatest average peak snowfall (13.47 inches) and were one of two storm-track categories to exhibit a positive snowfall z-score (0.21), with AC (0.03) being the other. This likely reflects both the tendency for HI events to produce above-average snowfall totals and the influence of two extreme cases that generated 32 and 35 inches of snowfall, which likely contributed to an elevated class mean. Conversely, GLL events produced the lowest average peak snowfall (10.84 inches; z = −0.25), while EC events also exhibited below-average snowfall totals (11.30 inches; z = −0.17). AC and CO events produced intermediate snowfall amounts, averaging 12.46 and 12.12 inches, respectively, with snowfall z-scores near zero.
Table 1.
Mean LES event duration (hours), duration z-score, mean peak snowfall (inches), and snowfall z-score for each storm-track classification. Positive (negative) z-scores indicate values above (below) the mean of all 116 LES events included in this study.
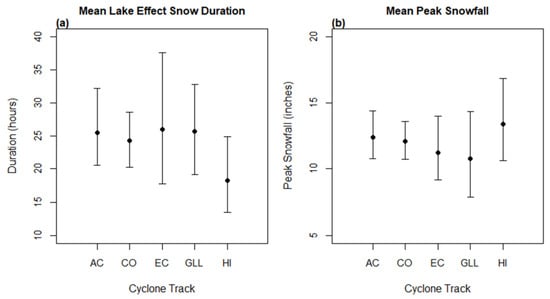
Although differences in event duration and peak snowfall were observed among the storm-track classifications, the bootstrapping technique revealed that only a subset of these differences were particularly noteworthy within the context of the exploratory analysis. For event duration (Figure 4a), HI events were found to be shorter than both AC and GLL events, consistent with the substantially lower mean duration observed for the HI category. No other pairwise duration comparisons were considered to be notable, suggesting that the durations associated with the cyclone-driven storm tracks were generally comparable despite modest differences in their mean values. Meanwhile, bootstrap testing resulted in no discernible differences in peak snowfall among the storm-track categories (Figure 4b). Although HI events were associated with the highest mean snowfall and GLL events with the lowest, substantial within-class variability precluded notable differences in mean snowfall among storm-track classes.
Figure 4.
Ninety-five percent bootstrapped confidence intervals for different storm tracks to compare (a) mean LES duration (hours) and (b) mean peak snowfall (inches).
3.2. Composite Analysis
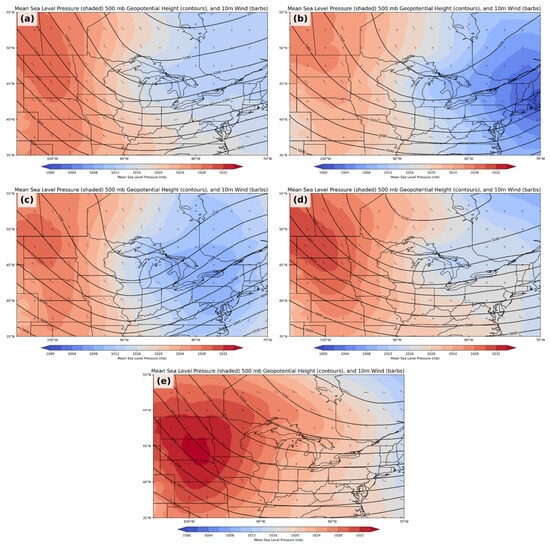
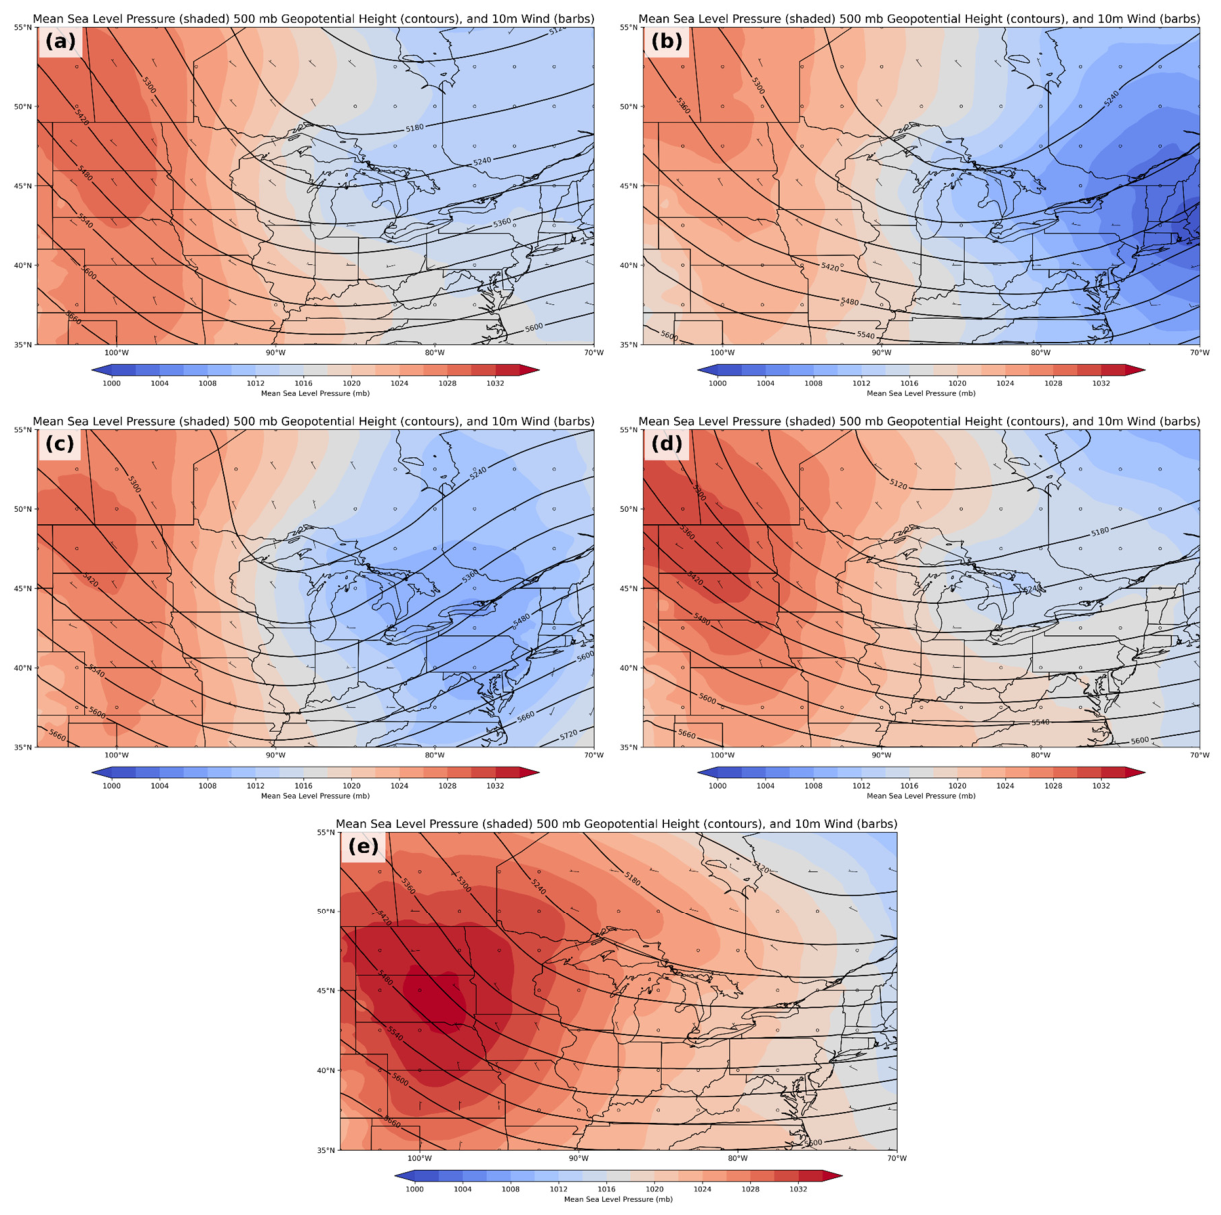
Prior to evaluating the specific forcing mechanisms associated with each storm-track classification, an examination of the composite synoptic environments is warranted. All five composite environments displayed the canonical synoptic environment associated with significant LES (Figure 5). Specifically, all composites were characterized by an upstream 500 mb trough and an associated mature surface cyclone positioned east of the Great Lakes, producing post-cyclonic north-northwesterly flow across Lake Michigan. This large-scale configuration has long been recognized as the preferred synoptic setting for heavy LES, as it facilitates CAA, long over-water fetch, and sustained boundary layer destabilization [20]. However, each storm-track classification exhibited subtle yet distinct differences in the placement and intensity of these two features. For example, AC (Figure 5a) and GLL (Figure 5d) tracks featured the surface cyclone over the GLB (specifically Lake Superior) which resulted in 10 m winds being northwesterly, while EC (Figure 5b) tracks featured the cyclone centered over eastern New England which resulted in 10 m winds having a more northerly component. This northerly component of 10 m winds could possibly result in air parcels having a longer residence time over Lake Michigan causing more favorable conditions for higher snowfall rates. At 500 mb, EC (Figure 5b) and CO (Figure 5c) tracks were the most dynamically active having displayed the strongest and most amplified low geopotential height anomalies coinciding with both of these tracks also featuring the strongest surface cyclones. HI synoptic composites deviated the most, displaying only subtle 500 mb cyclonic curvature upstream with near zonal flow present over most of the GLB (Figure 5e). Additionally, HI featured predominantly northerly flow over Lake Michigan, which may have increased air-parcel residence time over the lake and produced conditions more favorable for lake–atmosphere heat and moisture exchange.
Figure 5.
Composite average sea-level pressure (mb), 500 mb geopotential height (m) and 10 m winds (m s−1) for heavy LES events associated with (a) AC, (b) EC, (c) CO, (d) GLL, and (e) HI storm tracks. Composites were constructed using ERA5 reanalysis fields at the reported start time of each LES event.
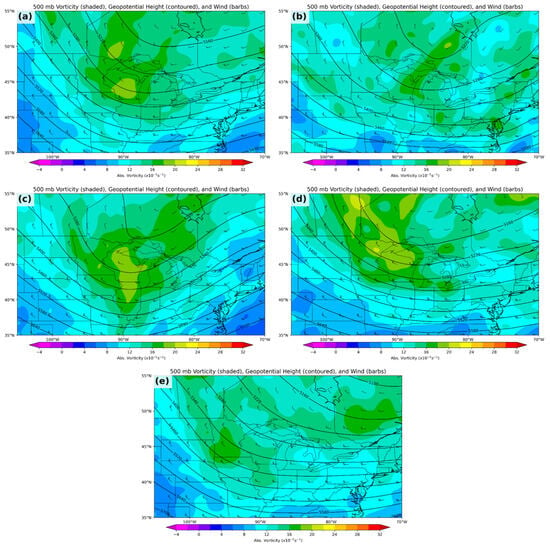
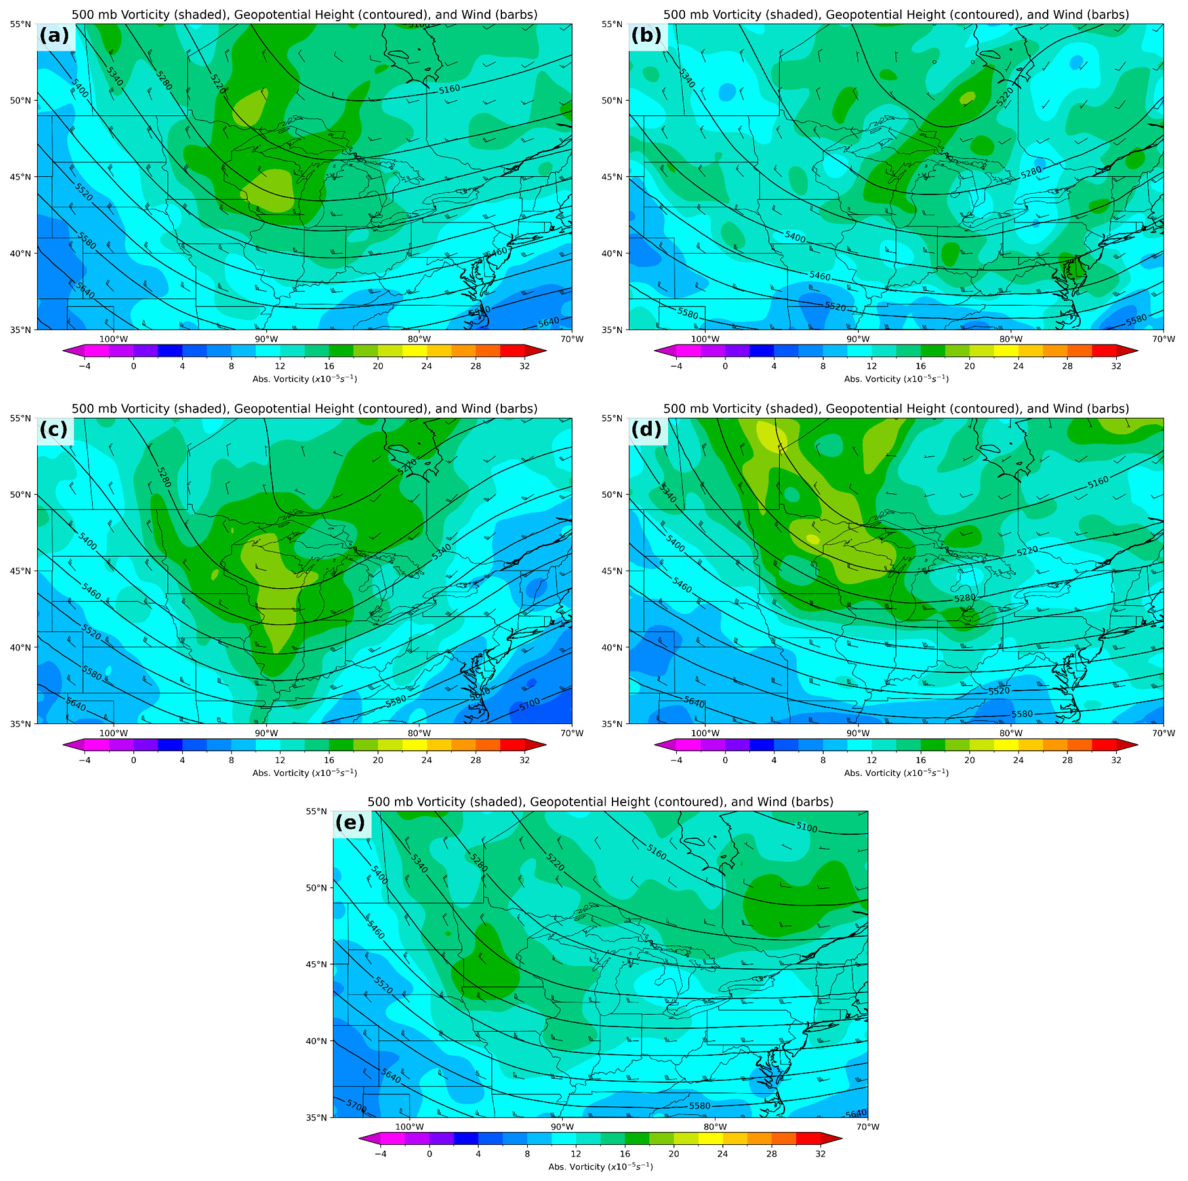
Vorticity advection (Figure 6) was the first synoptic forcing diagnostic examined as it represents a fundamental mechanism through which large-scale atmospheric motions influence vertical motion under the QG theory framework (i.e., QG omega equation). For this study, vorticity advection was only analyzed at 500 mb as it is generally assumed that wind speeds typically increase with height through the troposphere, allowing cyclonic (anticyclonic) vorticity advection at this level to serve as a useful proxy for positive (negative) differential vorticity advection. Additionally, it should be noted that 500 mb vorticity advection was calculated and analyzed directly for all events and was included in the domain-averaged and statistical analyses. However, because the composite vorticity-advection fields were spatially noisy and visually difficult to interpret, this manuscript presents composite absolute-vorticity fields together with geopotential height and wind vectors instead. This combination provides a clearer depiction of the location and relative strength of the vorticity maxima and the associated flow responsible for the diagnosed vorticity-advection patterns. AC (Figure 6a), CO (Figure 6c), and to a lesser extent GLL (Figure 6d) featured prominent CVA over Lake Michigan. This result was attributed to two factors: (1) each of these three tracks featured evident vorticity maximums (20–24 × 10−5 s−1) not found in the other track composites as a result of more amplified cyclonic flow and (2) the dominant 500 mb trough was positioned just upstream of Lake Michigan centered over Wisconsin/Minnesota.
Figure 6.
Same as Figure 5 for 500 mb vorticity (10−5 s−1), geopotential height (m), and winds (m s−1) for (a) AC, (b) EC, (c) CO, (d) GLL, and (e) HI storm tracks.
Similar findings were observed when averaging vorticity advection over the Lake Michigan domain as AC, CO, and GLL featured the highest raw means, with the AC (2.46 10−10 s−2; z = 0.10) and CO (2.59 10−10 s−2; z = 0.12) tracks having positive z-scores. Additionally, EC (0.85 10−10 s−2; z = −0.15) and HI (0.57 10−10 s−2; z = −0.19) tracks featured the two lowest mean z-scores (Table 2). The stronger CVA observed in the AC and CO composites therefore reflect not only the great amplitude and upstream placement of their upper-level troughs, but also possibly the presence of embedded shortwave disturbances. Such disturbances are capable of augmenting synoptic forcing via CVA during LES episodes over the GLB, a phenomenon previously observed empirically [9]. Despite EC tracks exhibiting an upper-level trough (Figure 5b) and CVA (Figure 6b), the magnitude of vorticity advection was comparatively weaker, owing in part to reduced cyclonic flow associated with a weaker geopotential height gradient over the GLB. Furthermore, the vorticity maximum was displaced eastward, extending from Lake Michigan across the Lower Peninsula of Michigan toward the western shore of Lake Huron. Not surprisingly, HI track composites featured the weakest CVA signal due to the primarily zonal flow over the GLB and a weak vorticity maximum (16–18 × 10−5 s−1) evident over southwestern Minnesota.
Table 2.
Same as Table 1 for 700 mb Q-vector divergence (10−18 Pa m−2 s−1), 700 mb omega (μbar s−1), 500 mb vorticity advection (10−10 s−2), and 850 mb temperature advection (10−5 °C s−1).
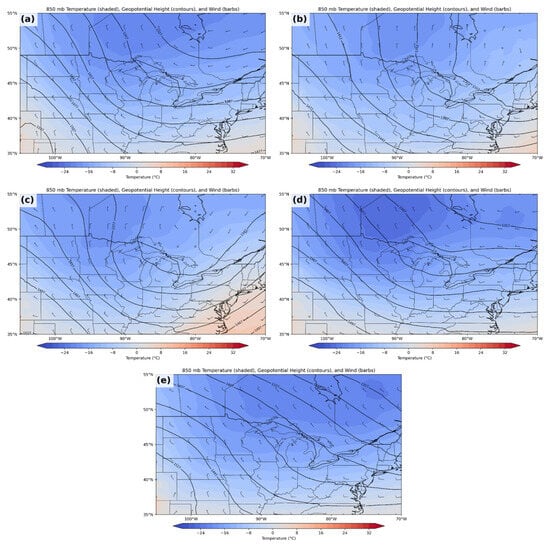
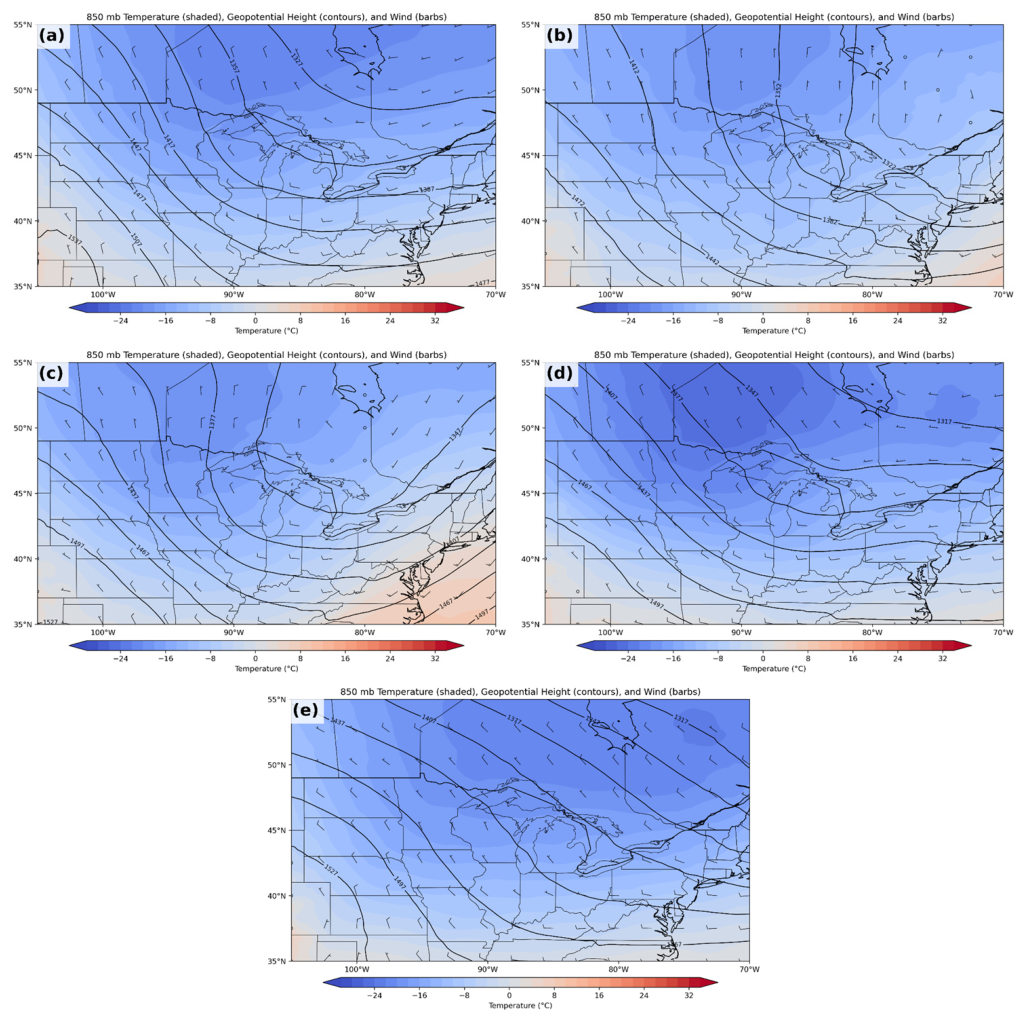
Temperature advection was examined as a second measure of synoptic-scale forcing because horizontal thermal gradients play a fundamental role in the generation of vertical motion according to the QG omega equation. Analysis focused on 850 mb temperature advection, as this level is located above the immediate influence of the surface while remaining representative of the lower-tropospheric thermal environment. According to QG theory, warm air advection (WAA) is associated with synoptic-scale ascent, while CAA is associated with subsidence. In the context of LES, CAA is actually considered to be favorable for lift via the generation of lake-induced thermodynamic instability, even though it corresponds to subsidence in the QG framework. All tracks exhibited CAA across Lake Michigan and over much of the GLB consistent with conducive LES environments. Additionally, they featured very similar thermal fields characterized by a temperature minimum (−18 °C to −24 °C) located over western Ontario, Canada (Figure 7). The only exception to this was HI tracks (Figure 7e) which still featured CAA, but a temperature minimum over central Quebec, Canada. This finding suggests that large-scale CAA is a persistent process observed during heavy LES over Lake Michigan, despite working against vertical forcing from a QG framework.
Figure 7.
Same as Figure 5 for 850 mb temperature (°C), geopotential height (m), and winds (m s−1) for (a) AC, (b) EC, (c) CO, (d) GLL, and (e) HI storm tracks.
Domain-averaged 850 mb temperature advection values (Table 2) further quantified the differences observed in the composite fields. The CO and AC storm tracks exhibited the strongest raw mean CAA, averaging −0.91 10−5 °C s−1 and −0.80 10−5 °C s−1, respectively. This resulted in these tracks having the lowest z-scores of −0.22 and −0.13. In contrast, the EC (−0.52 10−5 °C s−1; z = 0.10) and GLL (−0.50 10−5 °C s−1; z = 0.11) composites displayed more moderate CAA, while the HI composite exhibited the weakest domain-averaged CAA (−0.17 10−5 °C s−1) and the largest positive temperature advection z-score (0.38). These domain averages are consistent with the composite fields, which showed widespread CAA across all storm-track classifications but with the strongest magnitudes associated with the AC and CO environments and the weakest forcing occurring during HI events.
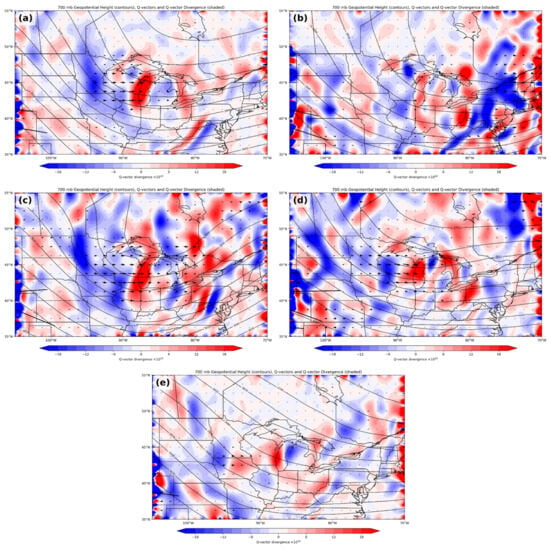
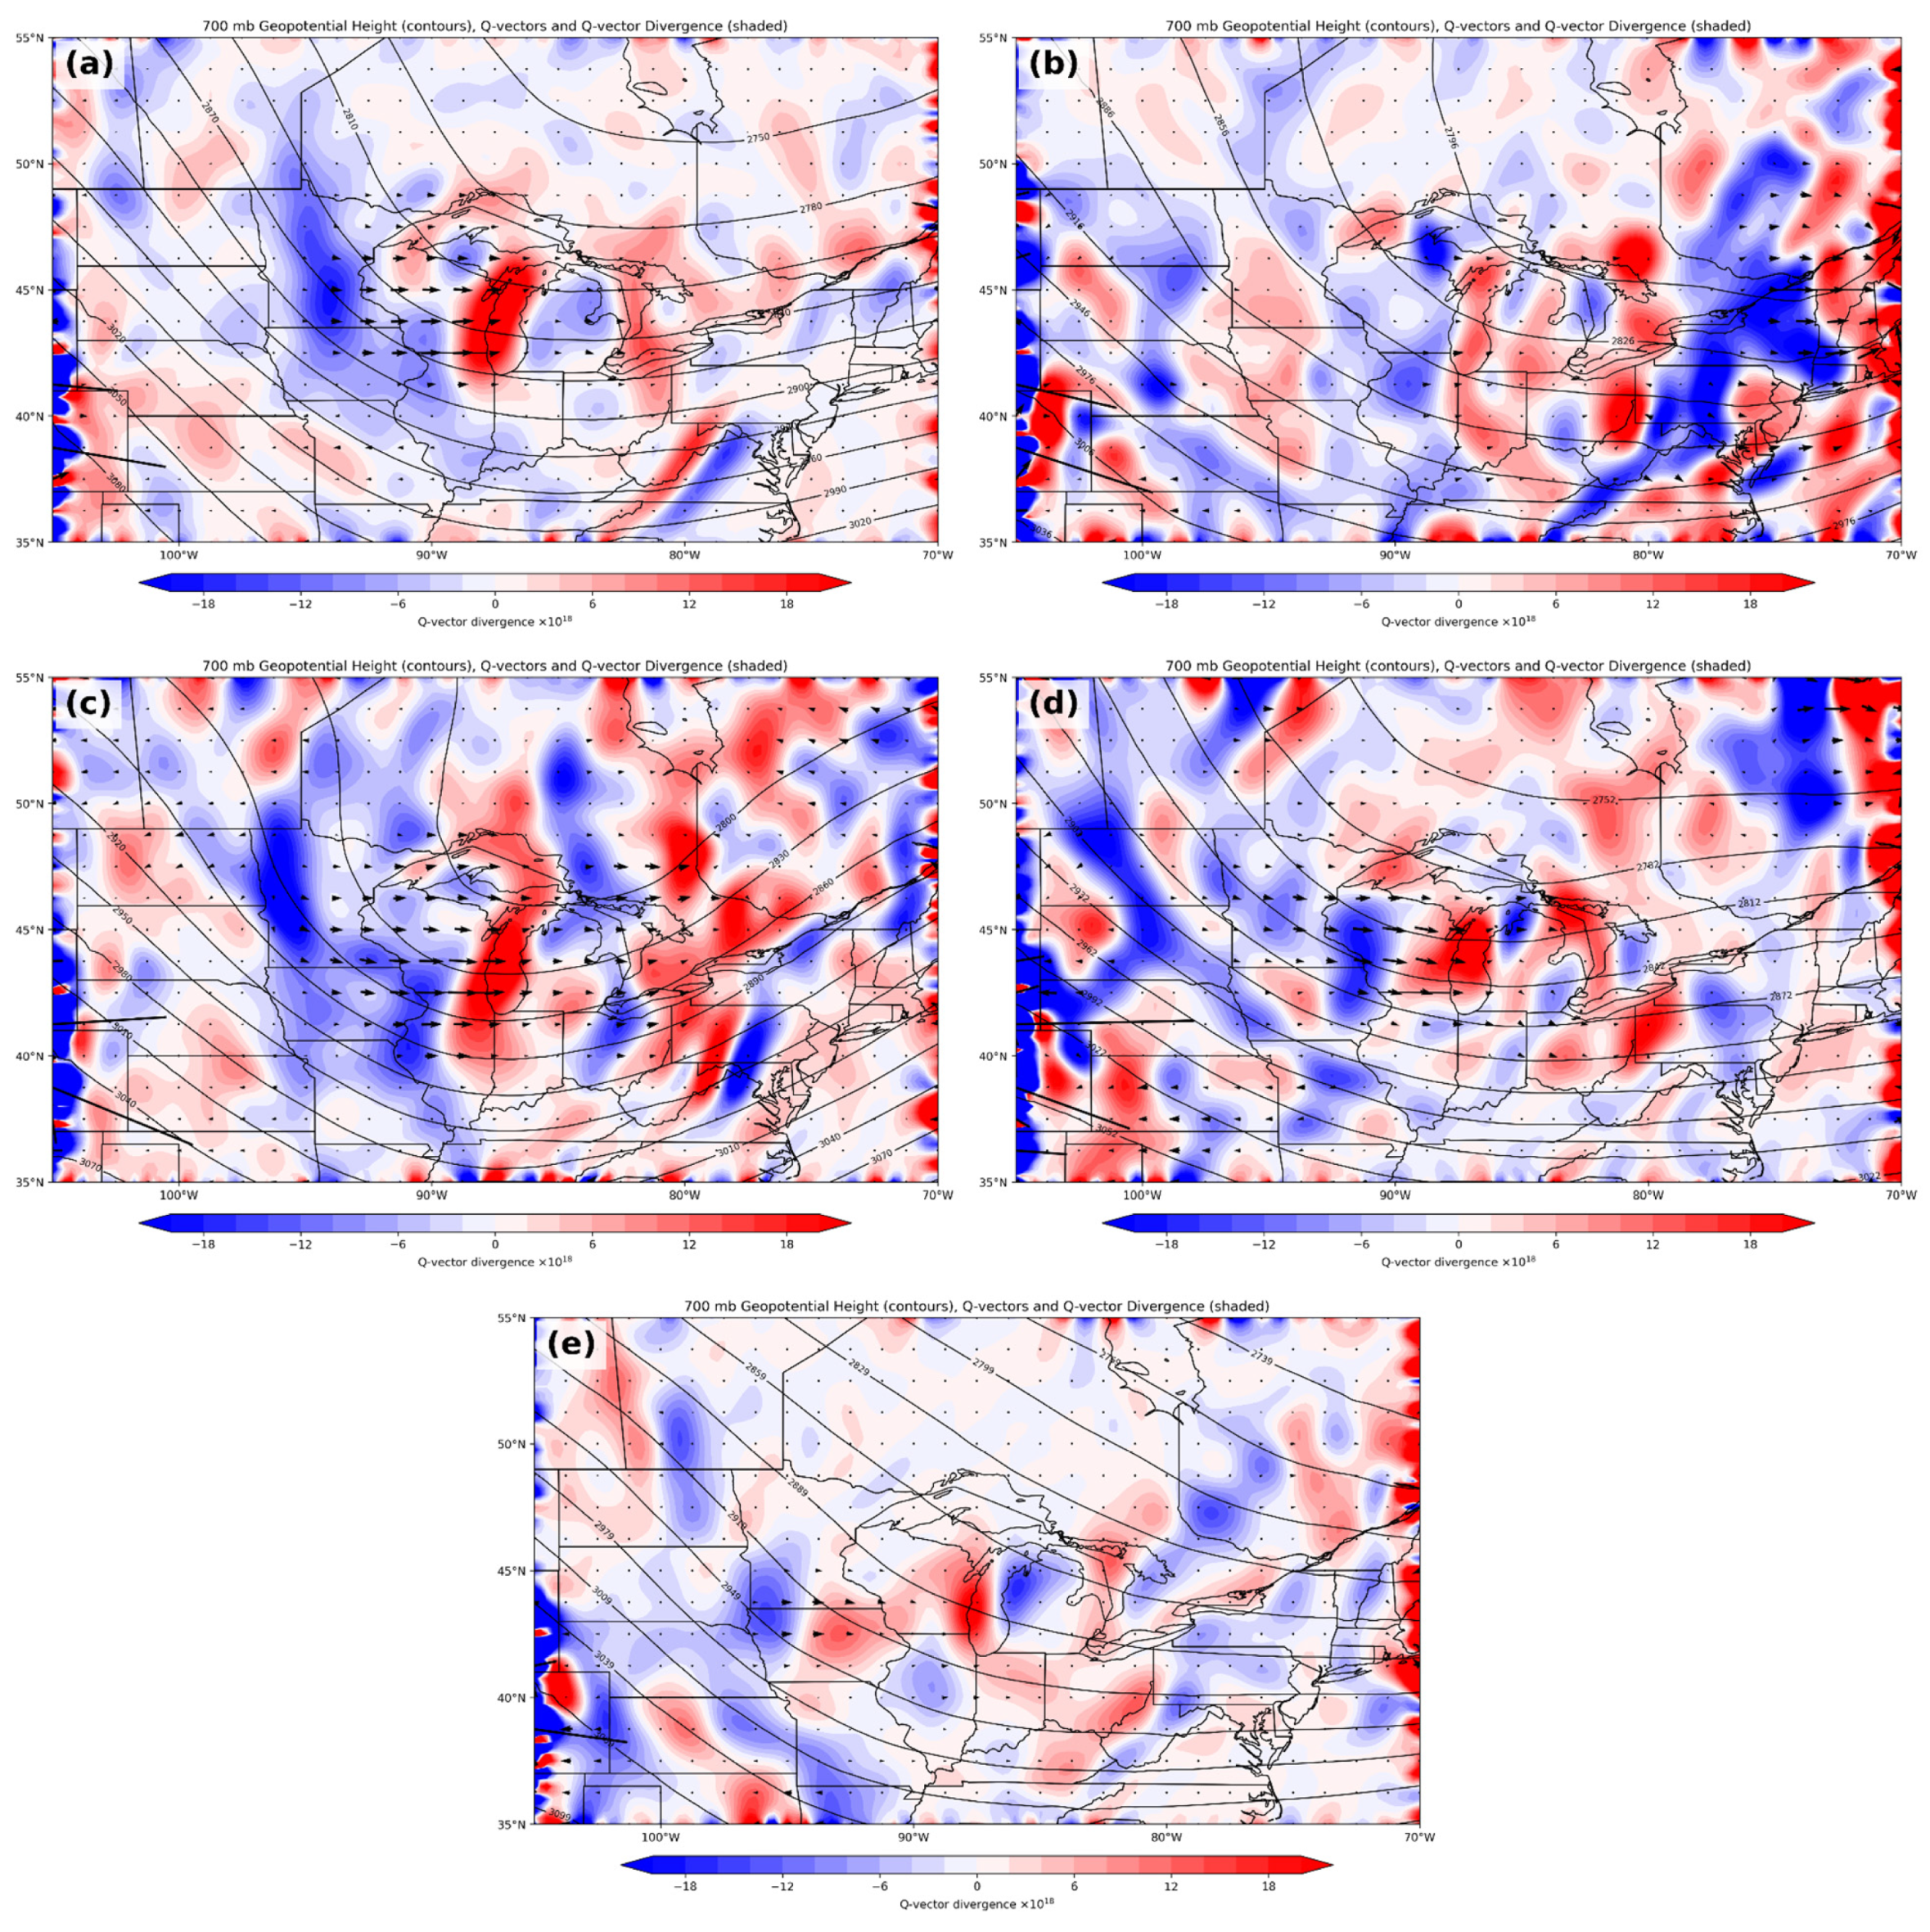
The 700 mb Q-vector diagnostics were examined as a more comprehensive measure of synoptic-scale forcing because they combine the effects of both differential vorticity advection and horizontal temperature advection into a single framework. For this study, the overall Q-vector term (−2∇∙Q) from the QG equation was used, rather than raw Q-vector convergence/divergence values. Thus, positive (negative) values indicated convergence (divergence). Overall, the AC, CO, and GLL composites exhibited broad regions of moderate to locally strong Q-vector convergence (Figure 8a, Figure 8c, and Figure 8d, respectively), with peak values approaching 16–18 × 10−18 m kg−1 s−1, indicative of appreciable synoptic-scale forcing for ascent. The EC composite also exhibited Q-vector convergence over Lake Michigan (Figure 8b); however, the magnitude of the forcing was considerably weaker, with peak values generally ranging from only 6 to 8 × 10⁻¹⁸ m kg−1 s−1. The HI composite displayed little to no appreciable Q-vector convergence across Lake Michigan (Figure 8e), indicating a near absence of synoptic-scale forcing for ascent. The spatial distribution and magnitude of the Q-vector convergence fields closely mirrored the previously examined 500 mb height and vorticity advection composites. The AC, CO, and GLL storm tracks, which featured the most amplified and upstream-displaced 500 mb troughs along with the strongest CVA, also exhibited the greatest Q-vector convergence over and immediately upstream of Lake Michigan. This consistency among the upper-level geopotential height, vorticity advection, and Q-vector analyses provides compelling evidence that the strength and placement of the mid-tropospheric wave pattern largely govern the distribution of synoptic-scale ascent associated with heavy LES.
Figure 8.
Same as Figure 5 for 700 mb geopotential height (m), Q-vectors, and Q-vector divergence term (10−18 Pa m−2 s−1) for (a) AC, (b) EC, (c) CO, (d) GLL, and (e) HI storm tracks.
Domain-averaged 700 mb Q-vector divergence term values (Table 2) similarly reinforced the patterns identified in the composite analyses. The CO storm track exhibited the strongest mean Q-vector convergence (15.76 Pa m−2 s−1; z = 0.21), followed by the AC (11.43 Pa m−2 s−1; z = 0.07) and GLL (6.79 Pa m−2 s−1; z = −0.09) composites. In contrast, the EC composite displayed substantially weaker convergence (4.54 Pa m−2 s−1; z = −0.16), while the HI composite exhibited the weakest domain-averaged convergence (2.37 Pa m−2 s−1) and the largest negative z-score (−0.23). Collectively, the domain-averaged values further demonstrate that the most amplified and upstream-displaced troughs were associated with the strongest synoptic-scale forcing for ascent.
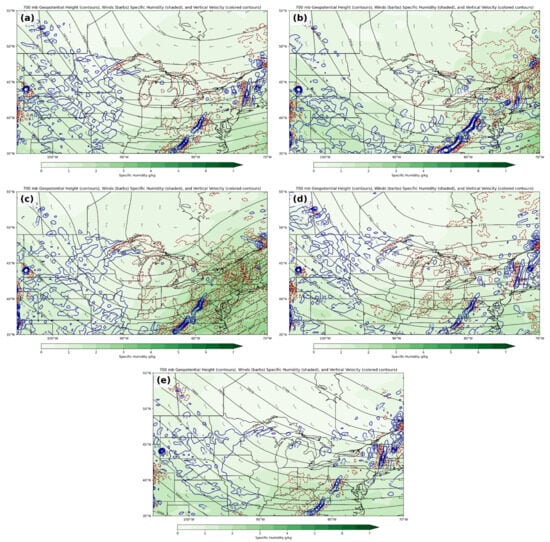
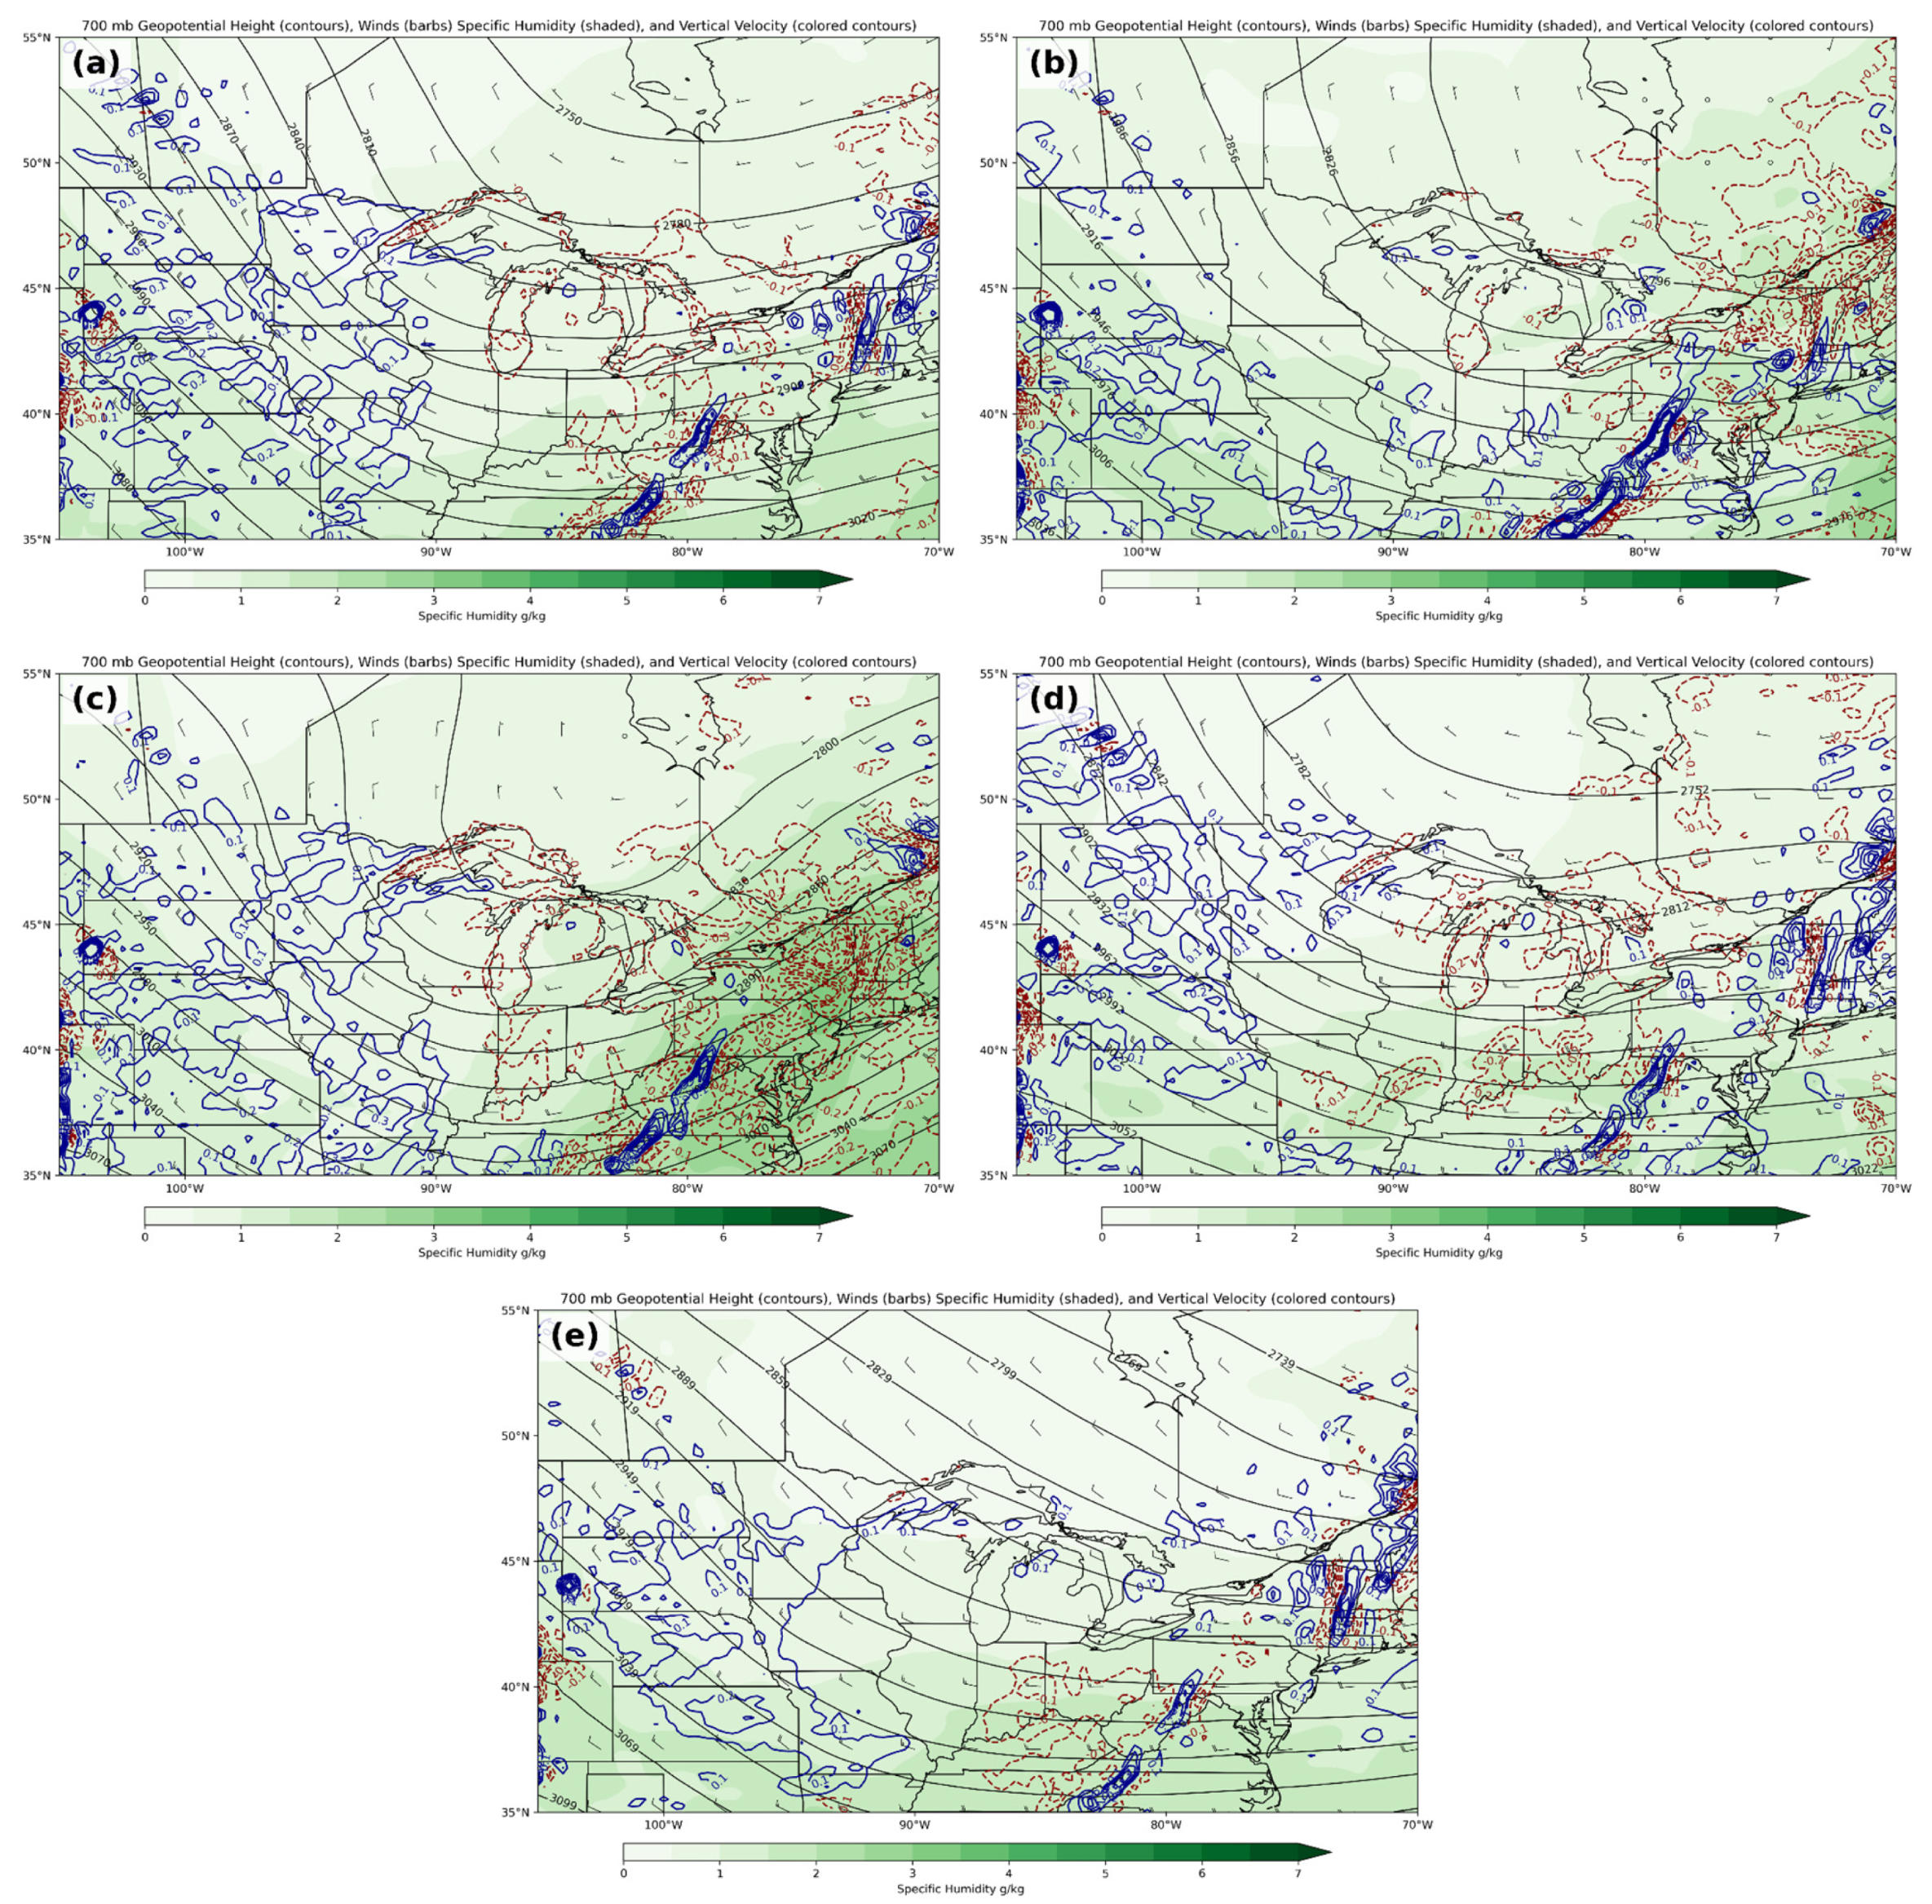
Vertical velocity, represented by 700 mb omega, was examined to determine whether the synoptic-scale forcing identified through the previous QG diagnostics translated into appreciable large-scale ascent during heavy LES events. The 700 mb level was selected because it is commonly used to assess vertical motion at this scale and is frequently located near the layer of maximum ascent associated with midlatitude cyclones. Furthermore, this level is sufficiently removed from near-surface influences. Consistent with the vorticity advection and Q-vector analyses, the AC, CO, and GLL storm tracks exhibited the strongest upward vertical motion over Lake Michigan (Figure 9a,c,d), with broad regions of ascent exceeding −0.1 μb s−1 and localized pockets approaching −0.2 μb s−1. These regions of ascent were spatially collocated with the strongest CVA and Q-vector convergence, indicating that the enhanced dynamical forcing associated with these storm tracks translated into notable synoptic-scale upward motion. The EC composite also exhibited ascent over Lake Michigan (Figure 9b), though the signal was noticeably weaker and largely confined to isolated pockets of approximately −0.1 μb s−1. This reduced magnitude is consistent with the more downstream placement of the upper-level trough identified in the composite 500 mb height analyses, which shifted the strongest dynamical forcing east of the GLB and limited the extent of large-scale ascent over Lake Michigan. In contrast, the HI composite displayed no vertical motion across the study region (Figure 9e), reflecting the absence of meaningful synoptic-scale forcing beneath the broad upper-level ridge and expansive surface anticyclone.
Figure 9.
Same as Figure 5 for 700 mb geopotential heights (m), winds (m s−1), omega (μbar s−1), and specific humidity (g kg−1) for (a) AC, (b) EC, (c) CO, (d) GLL, and (e) HI storm tracks.
Domain-averaged 700 mb omega values (Table 2) further supported the composite analyses by quantifying differences in the magnitude of synoptic-scale ascent among the storm-track classifications (Table 2). The CO composite exhibited the strongest mean upward vertical motion (−0.09 μb s−1; z = −0.24), followed closely by the GLL (−0.08 μb s−1; z = −0.14) and AC (−0.06 μb s−1; z = −0.01) storm tracks. In contrast, the EC composite displayed weaker mean ascent (−0.04 μb s−1; z = 0.15), while the HI composite exhibited the weakest upward motion overall (−0.02 μb s−1) and the largest positive z-score (0.30). These domain-averaged values are consistent with the composite omega fields, which showed widespread ascent across Lake Michigan during the AC, CO, and GLL storm tracks, weaker and more localized ascent during EC events, and little to no appreciable upward motion associated with the HI composite. The close agreement between the composite patterns and the domain-averaged statistics further supports the conclusion that storm tracks characterized by stronger upper-level dynamical forcing produce more robust synoptic-scale ascent, whereas HI events occur within environments where vertical motion is governed predominantly by mesoscale lake-induced processes rather than large-scale forcing.
While the previous analyses focused on synoptic-scale dynamic forcing mechanisms capable of enhancing or suppressing vertical motion, thermodynamic conditions also play a critical role in determining the intensity and organization of LES. In particular, the magnitude of lake-induced instability and the availability of atmospheric moisture strongly influence convective depth, snowfall rates, and overall event impacts. Therefore, the analysis now shifts from dynamical forcing diagnostics to an examination of the thermodynamic environment associated with each storm-track classification.
Composite maps (Figure 5) of SLP showed that EC (Figure 5b) and CO (Figure 5c) tracks resulted in the lowest average SLPs across both the GLB domain and the broader northeastern region relative to the other storm-track types. The domain-averaged values (Table 3) further quantified the synoptic environments identified in the composite maps. The CO composite exhibited the lowest GLB domain mean SLP (1012.43 mb; z = −0.46), followed by the EC (1013.58 mb; z = −0.34) and AC (1015.92 mb; z = −0.08) storm tracks, consistent with the presence of mature extratropical cyclones located downstream of the Great Lakes. Although EC exhibited the lowest overall mean SLP on the composite maps, centered off the coast of New England, its higher Lake Michigan gridpoint domain raw mean and z-score compared to CO suggest that the cyclone center was, on average, positioned farther from the lakes. The GLL composite displayed slightly above-average SLP (1017.83 mb; z = 0.13), while the HI composite exhibited substantially greater pressures (1024.45 mb; z = 0.85), reflecting the expansive surface anticyclone that dominated these events. Overall, these domain-averaged values closely correspond to the composite average SLP composite fields presented earlier, which illustrated progressively stronger cyclonic influence from the EC and CO storm tracks.
Table 3.
Same as Table 1 for sea-level pressure (mb), specific humidity (g kg−1), and lake index (°C).
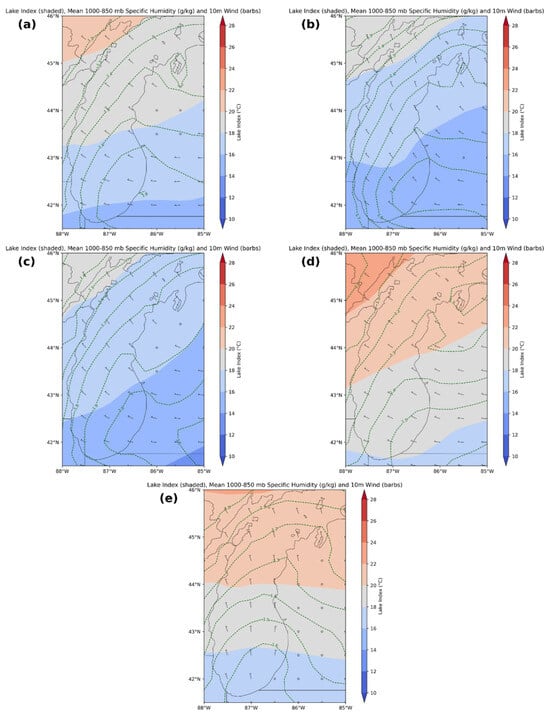
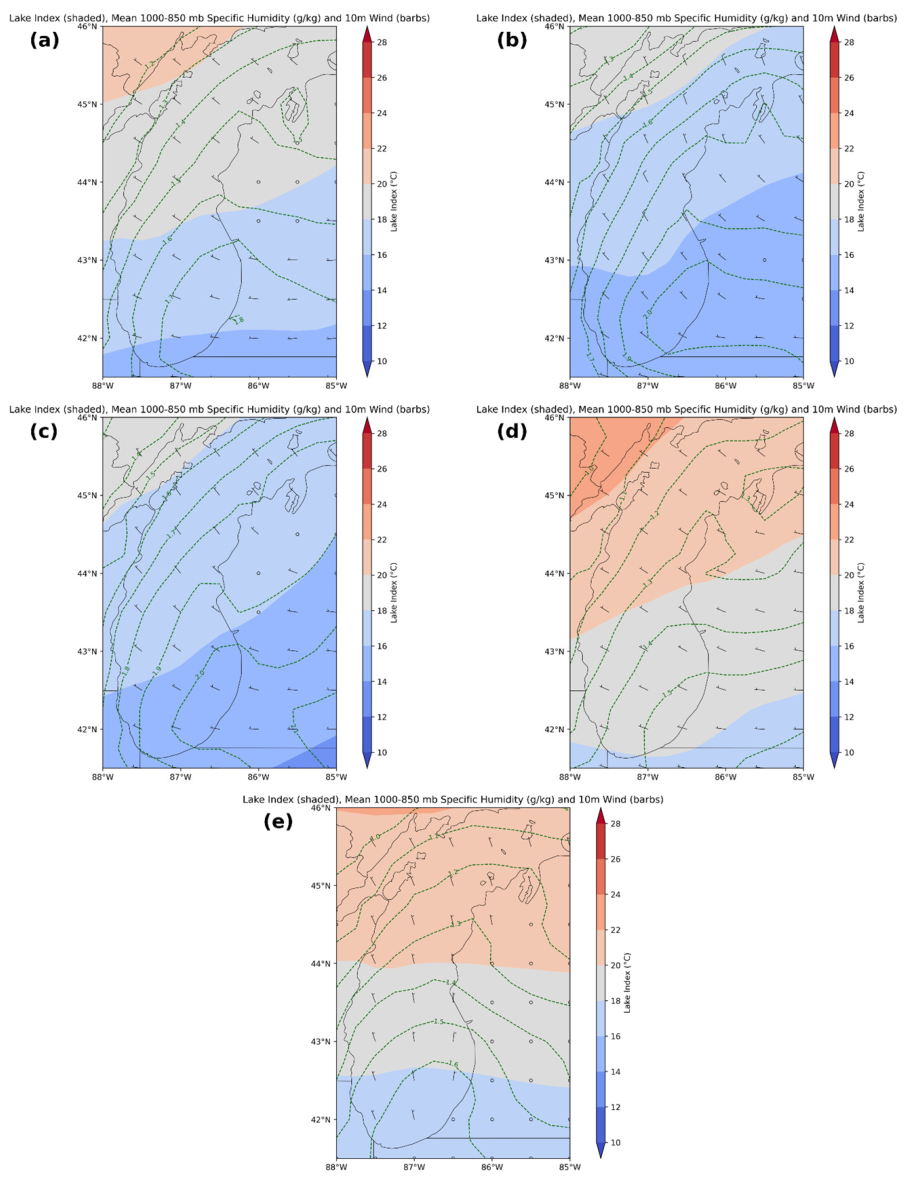
Composite maps with specific humidity showed that the CO and EC (Figure 10b,c) storm tracks displayed the greatest low-level moisture availability, with 850 mb specific humidity values generally ranging from 1.6 to over 2.0 g kg−1. The AC composite (Figure 10a) exhibited intermediate moisture content, with values of approximately 1.3–1.8 g kg−1, while the GLL and HI storm tracks (Figure 10d,e) featured the driest environments, with specific humidity generally ranging from 1.1 to 1.6 g kg−1. These differences are consistent with the synoptic evolution of each storm track, as the CO and EC environments maintain a closer connection to the relatively warm, moist air associated with mature cyclones, whereas the GLL and HI composites are characterized by colder continental air masses of Arctic origin.
Figure 10.
Same as Figure 5 for LI (°C) and mean 1000–850 mb specific humidity (g kg−1) for (a) AC, (b) EC, (c) CO, (d) GLL, and (e) HI storm tracks.
Domain-averaged specific humidity values (Table 3) further supported the composite map analyses. The CO (1.83 g kg−1; z = 0.42) and EC (1.75 g kg−1; z = 0.29) storm tracks exhibited the greatest mean low-level moisture availability, followed by the AC composite (1.53 g kg−1; z = −0.08). In contrast, the GLL (1.35 g kg−1; z = −0.39) and HI (1.36 g kg−1; z = −0.37) tracks displayed the lowest domain-averaged specific humidity values. These results are consistent with the composite fields and reinforce that the CO and EC environments were associated with greater ambient moisture availability, whereas the GLL and HI composites were characterized by drier Arctic air masses and an enhanced vertical vapor pressure gradient over Lake Michigan.
Composite LI fields showed that regardless of storm track, values consistently met the minimum threshold of 13 °C needed for lake-induced convection. However, the composites also display notable differences in LI between the storm-track classifications. The GLL (Figure 10d) and HI (Figure 10e) composites exhibited the greatest instability over Lake Michigan, with LI values generally ranging from 18 to 22 °C. The AC (Figure 10a) storm track displayed moderately unstable conditions, with values of approximately 16–20 °C, while the CO (Figure 10c) and EC (Figure 10b) composites exhibited comparatively weaker instability, with LI values typically ranging from 14 to 18 °C. Interestingly, the GLL and HI composites also featured the lowest lake surface temperatures (3.39 °C and 4.00 °C, respectively) of the five storm tracks. Thus, enhanced LI observed during these events was not a result of higher lake temperatures, but rather colder air masses at 850 mb. This finding is consistent with the synoptic environments described previously, particularly the expansive Arctic anticyclone associated with the HI composite and the amplified post-cyclonic cold-air outbreaks characterizing GLL events.
Domain-averaged LI values (Table 3) were consistent with the composite analyses, with the HI (19.18 °C; z = 0.34) and GLL (19.01 °C; z = 0.29) storm tracks exhibiting the greatest thermodynamic instability, followed by AC (17.93 °C; z = 0.00). The CO (16.99 °C; z = −0.26) and EC (16.97 °C; z = −0.27) composites displayed the lowest mean LI, reflecting the comparatively weaker instability observed in the composite fields. These findings complement the specific humidity analysis, suggesting that the GLL and HI storm tracks combined the greatest lake-air temperature differences with exceptionally cold, dry air masses. Together, these conditions are favorable for enhanced lake-to-atmosphere sensible and latent heat exchange and therefore provide an environment conducive to rapid boundary-layer destabilization and moistening. Because turbulent surface fluxes were not calculated directly, however, differences in actual flux magnitude among the storm-track classifications cannot be determined from the present analysis.
3.3. Pairwise Cohen’s d Analysis
The preceding composite analyses identified several qualitative differences in the synoptic environments associated with each storm-track classification. To better objectively quantify these patterns, Cohen’s d effect sizes were calculated to evaluate the magnitude of differences between storm-track categories.
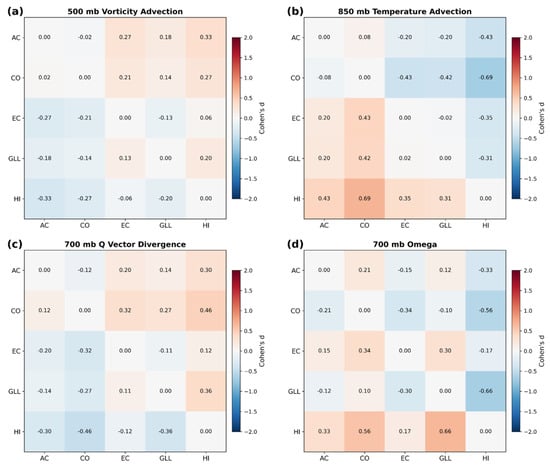
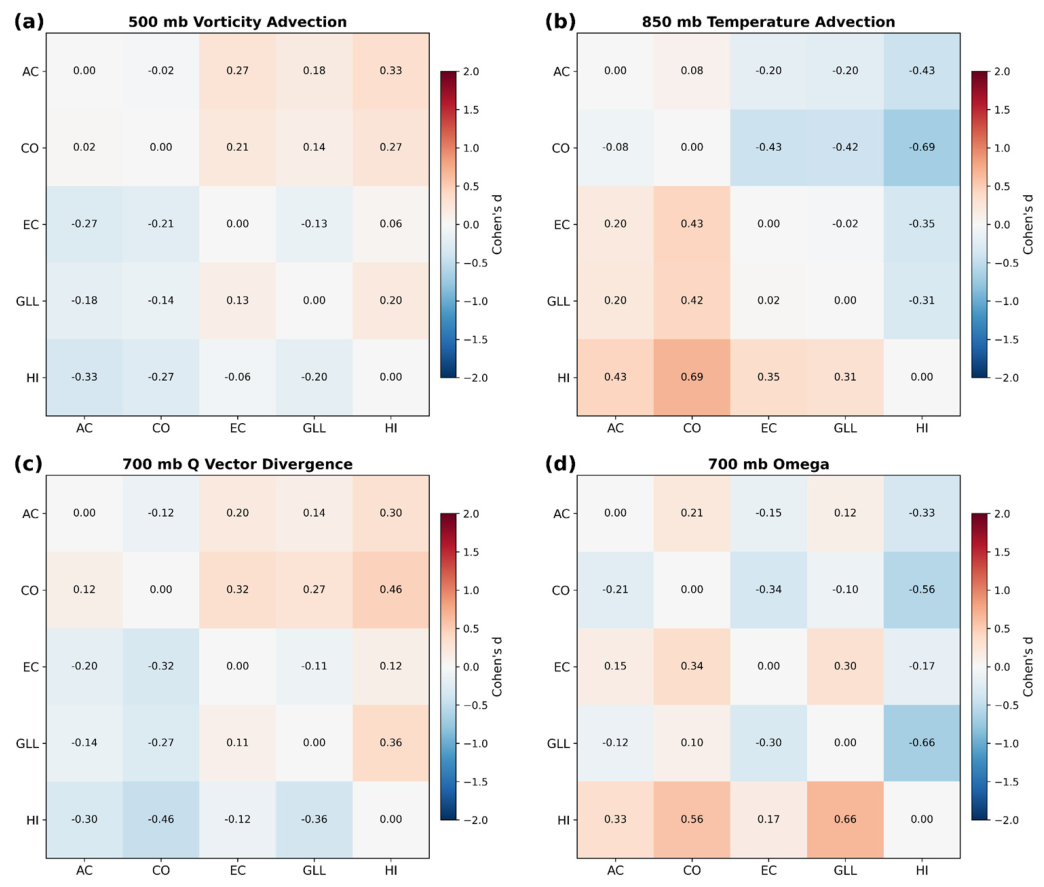
For the synoptic-scale dynamic forcing variables (Figure 11), Cohen’s d analyses showed small differences between the storm track groups. Consistent with the composite analyses, the AC, CO, and GLL storm tracks exhibited the greatest CVA over and upstream of Lake Michigan, producing positive effect sizes when compared with the EC and HI tracks (Figure 11a). Among these storm tracks, CO displayed the strongest CVA, although the differences relative to AC (|d| = 0.02) and GLL (|d| = 0.14) were small, indicating broadly similar forcing environments among the three cyclone-dominated storm tracks. In contrast, the HI track consistently exhibited the weakest CVA of all storm-track classifications, producing negative effect sizes relative to every other storm track. The EC track also displayed comparatively weak CVA, with slightly negative effect sizes relative to all storm tracks except HI (d = 0.06), placing it between the more dynamically active cyclone tracks and the predominantly anticyclonic environment. Despite these differences, the overall range of Cohen’s d values was relatively modest, as all pairwise comparisons yielded values indicative of either negligible (|d| < 0.2) or small (0.2 ≤ |d| < 0.5) effect sizes suggesting that the magnitude of the differences in 500 mb CVA among the storm tracks was generally small. With 850 mb temperature advection (Figure 11b), the pairwise comparison between CO and HI was notable as it exhibited the largest effect size (|d| = 0.69) among all synoptic-scale dynamic variable comparisons, meeting the threshold for a medium effect size (0.5 ≤ |d| < 0.8). This result indicates that CO tracks featured prominent CAA compared to HI tracks. Moreover, all comparisons between HI and another storm track led to at least a small effect size, resulting from HI classifications having the weakest CAA signal as previously discussed. Additionally, AC and CO featured higher Cohen’s d values when paired with the three other tracks, suggesting CAA was more prevalent for those two tracks.
Figure 11.
Cohen’s d effect size maps for (a) mean 500 mb vorticity advection, (b) mean 850 mb temperature advection, (c) mean 700 mb Q-vector divergence term, and (d) mean 700 mb omega. Positive and negative values indicate the direction of the pairwise differences, while larger absolute values denote stronger effects.
Similar to the 500 mb vorticity advection results, all pairwise comparisons for the Q-vector divergence term (Figure 11c) yielded either negligible or small effect sizes. However, the CO–HI comparison produced the largest effect size (|d| = 0.46) among the storm-track pairs for this variable, approaching the threshold for a medium effect size. Additionally, all Cohen’s d values point to AC, CO, and GLL tracks having stronger Q-vector convergence compared to EC and HI tracks, consistent with the synoptic composite findings. For 700 mb omega (Figure 11d), two pairwise comparisons were notable. Both CO–HI (|d| = 0.56) and GLL–HI (|d| = 0.66) exhibited medium effect sizes, aligning with the domain averages previously discussed. Additionally, as was the case with 850 mb temperature advection, all 700 mb omega comparisons involving HI and another storm track yielded either a small or medium effect size, highlighting its apparent differences when it comes to vertical motion.
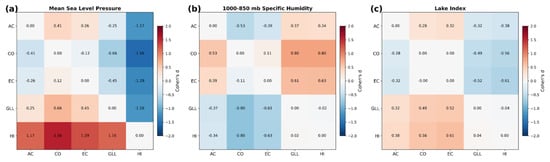
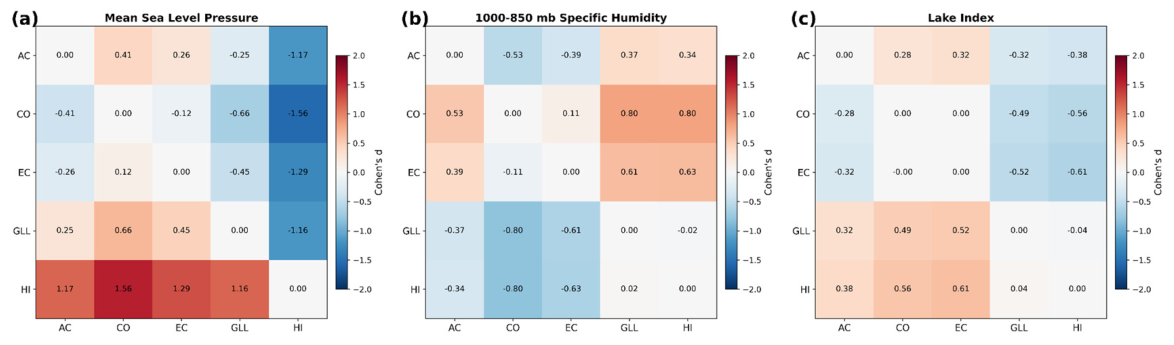
Cohen’s d analyses of the mesoscale thermodynamic forcing variables (Figure 12) generally resulted in larger effect sizes among the storm track comparisons. The largest effect sizes in this study were associated with SLP (Figure 12a). In particular, large positive effect sizes (d ≥ 0.8) were observed for all pairwise comparisons involving HI and the remaining storm tracks. The largest effect size (|d| = 1.56) was observed for the HI–CO comparison. CO also stood out as being associated with lower SLPs and it exhibited a medium effect size when compared with GLL (|d| = 0.66), and a small effect size when compared to AC (|d| = 0.41). For specific humidity (Figure 12b), numerous small and medium effect sizes are evident across the various storm track pairwise comparisons. CO exhibited the largest effect sizes for this variable when compared with both GLL and HI (|d| ≥ 0.8 in both cases), indicating higher amounts of low-level moisture. In general, both GLL and HI storm tracks were found to be associated with lower amounts of low-level moisture based on the Cohen’s d analysis, consistent with the composite analysis. Cohen’s d analysis of LI (Figure 12c) closely mirrored the composite fields as both HI and GLL presented large positive Cohen’s d values when compared to AC, CO, and EC ranging from 0.32 (GLL–AC) all the way to 0.61 (HI–EC). In contrast, effect sizes among the AC, CO, and EC composites were comparatively small (0.00 to 0.32), indicating relatively similar instability conditions.
Figure 12.
Same as Figure 11 for (a) MSLP, (b), mean 1000–850 mb specific humidity, and (c) mean LI.
3.4. Bootstrapping Analysis
Bootstrapping was employed to evaluate whether the observed variations among storm-track classifications were distinguishable from sampling variability, thereby providing another objective assessment of the robustness of the composite differences. The exploratory bootstrap resampling results (Figure 13 and Figure 14) indicated only a few notable patterns, largely matching those identified in the composite/Cohen’s d analyses.
Figure 13.
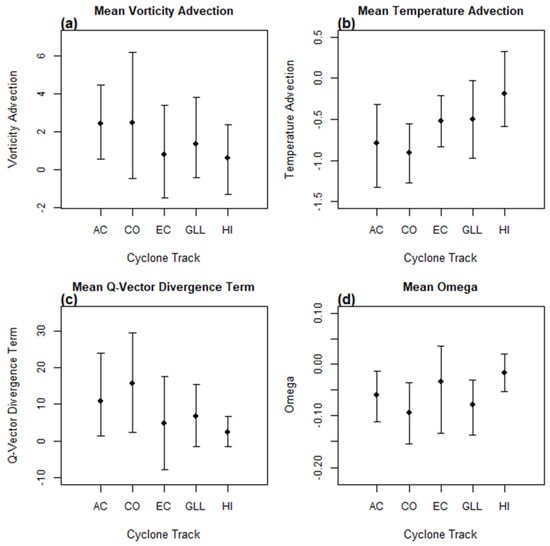
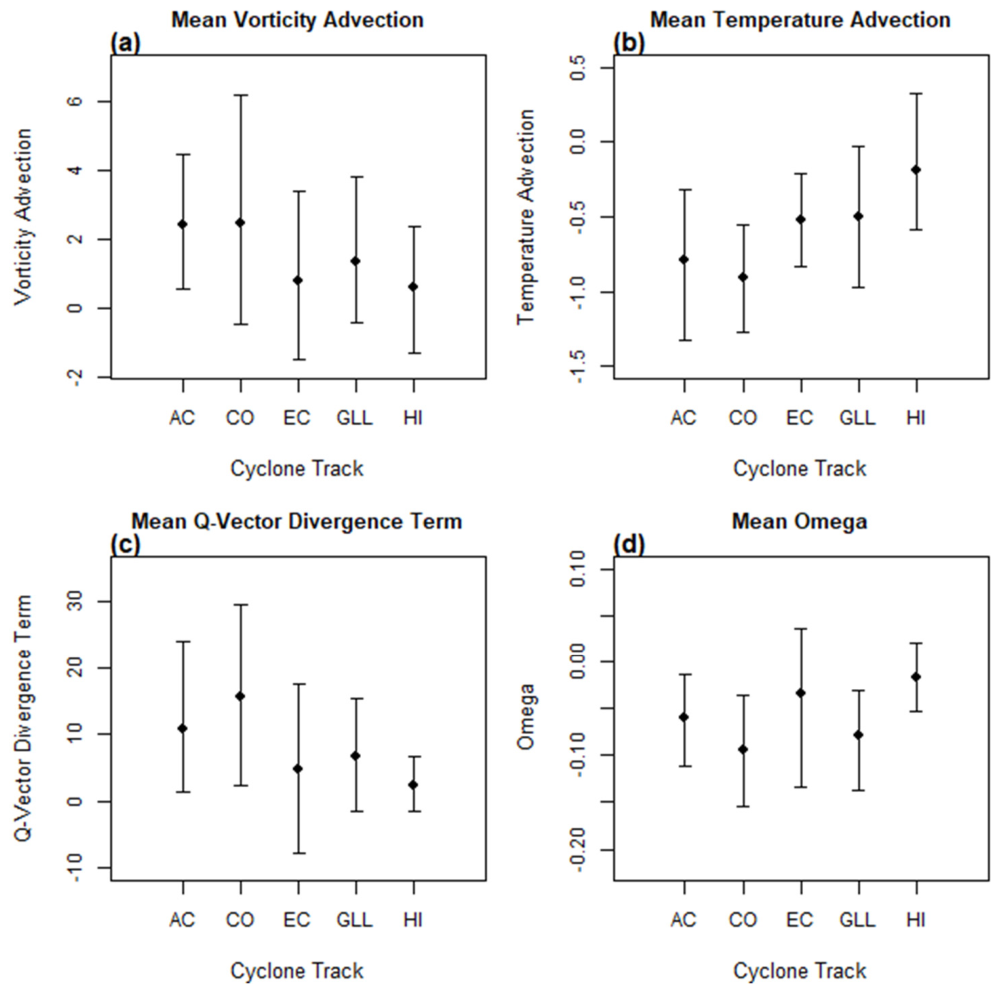
Ninety-five percent bootstrapped confidence intervals for different storm tracks to compare (a) mean 500 mb vorticity advection (10−10 s−2), (b) mean 850 mb temperature advection (10−5 °C s−1), (c) mean 700 mb Q-vector divergence term (10−18 Pa m−2 s−1), and (d) mean 700 mb omega (μbar s−1).
Figure 14.
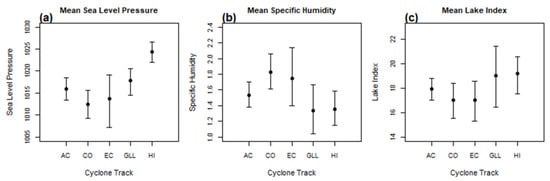
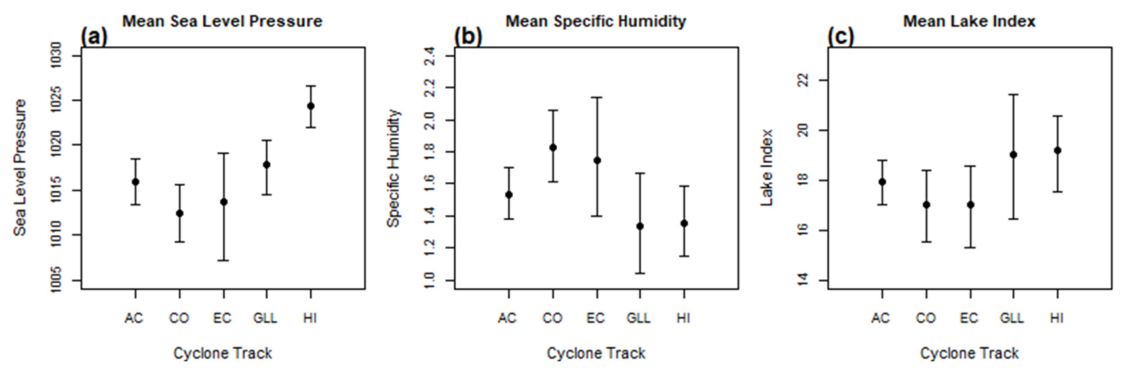
Same as Figure 13 for (a) mean SLP (mb), (b) mean 1000–850 mb specific humidity (g kg−1), and (c) mean LI (°C).
The dynamic-related variables of interest (Figure 13) exhibited minimal differences. When the variables associated with upward motion under QG theory (i.e., vorticity advection and temperature advection) were examined independently, only a few trends emerged. For 500 mb vorticity advection (Figure 13a), all tracks resulted in CVA, a source of lift under QG theory, matching the findings from the previous analyses. However, no apparent differences in the magnitude of CVA were found with the exploratory bootstraps aligning with the relatively small Cohen’s d values. Unlike with vorticity advection, some noteworthy relationships between storm tracks were found for temperature advection (Figure 13b). CAA at the 850 mb level was present with all tracks, consistent with the climatological conditions favorable for LES. This result aligns with the composite analysis (Figure 7), which similarly found CAA resulting from the north/northwesterly 10 m winds. The HI track exhibited the least amount of CAA and is particularly different when compared to two of the four other tracks (AC and EC). This was also seen in the composite fields as a broad Arctic anticyclone dominated the GLB rather than an active cyclone transporting progressively colder air into the region. This reinforces the idea that for HI tracks, the cold air mass was already well established over the Great Lakes, reducing the need for continued strong CAA. Overall, CO was associated with the greatest amount of CAA, a difference that was noteworthy compared to EC, in addition to the previously mentioned HI track. EC tracks having less CAA than CO is consistent with the composite synoptic fields, which showed the upper-level trough and associated surface EC cyclone displaced downstream. This resulted in the strongest post-cyclonic CAA for EC being east of the GLB, leaving Lake Michigan within a comparatively weaker CAA regime compared to the CO composite.
For the Q-vector divergence term (Figure 13c), exploratory bootstraps revealed converging Q-vectors with all tracks, indicating QG forcing for ascent at the synoptic scale over the domain of interest. As previously observed, the HI track resulted in the least amount of Q-vector convergence, which was expected given the characteristics of anticyclonic systems. This difference was only particularly notable when compared to CO, which suggests that considerable case-to-case variability exists within each storm-track category, limiting the ability to differentiate the forcing environments between them. When vertical motion was examined directly using 700 mb omega values (Figure 13d), HI was once again associated with the weakest upward motion. This difference was apparent relative to both the CO and GLL tracks, directly paralleling the Cohen’s d analysis and closely matching the expected patterns based on the Q-vector bootstrapping analysis.
Mesoscale thermodynamic forcing variables (Figure 14) exhibited more pronounced inter-track differences compared to the synoptic dynamic forcing variables (Figure 13), matching the trends observed with the Cohen’s d analyses. As expected for SLP (Figure 14a) the HI track was associated with markedly higher average values for the domain compared to all other storm tracks. This higher SLP was also notable in Table 3 as its mean z-score (0.85) is the largest in this study. The CO track was associated with the lowest average SLP values, a difference that was clearly discernable compared to the HI, AC, and GLL tracks. Specific humidity (Figure 14b) bootstraps showed that both the CO and EC tracks had notably higher average low-level moisture values during LES events compared to GLL and HI tracks, consistent with the numerous medium and large effect sizes previously observed in these pairwise comparisons. LI bootstraps also showed some differences between storm tracks (Figure 14c). In particular, both the GLL and HI tracks had elevated LIs compared to the other tracks, matching the findings from the Cohen’s d analysis. That said, while the HI track was notably different when compared to two of the other tracks (CO and EC), the large confidence interval for GLL prevented any clear differences between the other tracks. Additionally, no discernable differences were identified among the AC, CO, and EC storm tracks, despite the AC composite exhibiting a modestly higher median LI. Collectively, these results demonstrate that the greatest thermodynamic instability was consistently associated with HI, and to a lesser extent GLL, reinforcing the importance of lake-induced buoyancy in supporting heavy LES regardless of the degree of accompanying synoptic-scale forcing.
4. Discussion
The results of this study are consistent with those from [4], which focused on Lake Erie LES events associated with different storm tracks. As was the case for Lake Erie, composite fields indicated that Lake Michigan events exhibited a conventional synoptic setup for LES snow. They had an upper-level low geopotential height anomaly (i.e., trough) upstream of the GLB (Figure 5) coupled with a surface low-pressure system downstream, resulting in CAA and a favorable LES boundary layer wind profile. Building upon previous work, the present study expands the analysis by providing a more detailed examination of the synoptic-scale dynamic forcing and mesoscale thermodynamic forcing support conditions associated with different storm-track categories.
Regardless of storm track, synoptic-scale dynamic forcing was found to play an important role in heavy LES events over Lake Michigan. In particular, QG forcing associated with CVA at the 500 mb level consistently contributed to large-scale ascent across all storm tracks. However, no noteworthy differences were identified in the magnitude of vorticity advection among the tracks, which was unexpected given the patterns observed in the composite fields. This upper-level synoptic support has been previously identified as a distinguishing factor between average and intense LES episodes [6,7,9]. The 850 mb CAA was present in varying magnitudes across the region regardless of storm track. Although CAA is typically associated with subsidence under the QG framework, it simultaneously enhances lake-induced thermodynamic instability by increasing the air-lake temperature contrast. As a result, CAA remains a critical ingredient for LES development by promoting mesoscale ascent despite its contribution to synoptic-scale subsidence. Q-vector convergence was identified across all storm-track classifications, corroborating the preliminary findings of [9] for AC events. The persistence of Q-vector convergence over the Lake Michigan domain indicates that synoptic-scale forcing for ascent was a common characteristic of heavy LES events regardless of storm track. This result is noteworthy because Q-vector convergence represents the combined effects of QG differential vorticity advection and horizontal temperature advection, thereby serving as a diagnostic of synoptic-scale vertical motion. Examination of the individual forcing terms further revealed that vorticity advection was generally the primary contributor to the diagnosed Q-vector convergence, suggesting that large-scale dynamical forcing associated with possible upper-level short-wave troughs played a more prominent role than large-scale thermal advection in supporting widespread ascent over the Lake Michigan region. The 700 mb omega fields further supported the presence of synoptic-scale ascent across the Lake Michigan region during heavy LES events. Despite persistent upward motion among all storm-track classifications, relatively few notable differences in ascent magnitude were identified. The HI track was the sole exception, exhibiting significantly weaker upward motion than the remaining storm tracks. This behavior is consistent with the anticyclonic environment’s characteristic of HI events, which are associated with reduced synoptic-scale forcing and a greater tendency toward subsidence. Consequently, the weaker ascent observed for HI events likely reflects the diminished influence of large-scale dynamical forcing compared to the cyclone-associated storm tracks.
Mesoscale thermodynamic forcing variables exhibited greater variability amongst the different storm tracks. GLL and HI storm tracks exhibited particularly favorable thermodynamic environments, characterized by large lake–air temperature differences and relatively dry lower-tropospheric air. These conditions are consistent with an environment favorable for enhanced sensible and latent heat exchange from the lake, although the turbulent fluxes themselves were not explicitly calculated. Additionally, these results suggest that when synoptic-scale forcing is absent or relatively weak, thermodynamic processes related to these variables could play a compensatory role in supporting the observed development. For example, GLL ranked third in Q-vector convergence, but second in overall vertical motion, Thus, this track likely benefited from its stronger identified LI values and low specific humidities (i.e., thermodynamics).
In addition to examining synoptic-scale dynamical forcing and mesoscale thermodynamic forcing variables between the tracks of interest, this study also evaluated LES event duration and peak snowfall. Once again, the results of this study were consistent with the earlier findings for Lake Erie [4] as noteworthy differences among storm-track categories were generally absent for these variables. The only exception was the HI storm track, which was associated with shorter event durations over Lake Michigan. However, this storm-track category was not examined in the previous study and therefore could not be directly compared.
Similar methodological limitations to [4] were present in this work. Utilization of the NSED limited the number of LES cases that could be included in this study. While the database’s official record of LES events begins in 1996, only three counties reported events occurring prior to 2000: Ottawa County (four cases), Mason County (eight cases), and Oceana County (one case). Furthermore, there was a gap in the record with no cases between 1999 and 2005. Another limitation in this study stems from the manual process employed by the authors to identify the storm tracks associated with each LES event. Although objective criteria were established for this process, the potential for human error and interpretive variability remains. Additionally, ERA5 is a reanalysis product and therefore remains subject to biases associated with its underlying forecast model, parameterizations, observational constraints, and data-assimilation system. These biases may influence the absolute magnitude of individual dynamical and thermodynamic quantities, particularly lower-tropospheric temperature and moisture variables. Another limitation was that the QG framework applied in this study that was used to diagnose large-scale ascent is inherently approximate and relies upon assumptions including hydrostatic and near-geostrophic balance, relatively small Rossby number, scale separation, and moderate horizontal temperature gradients. Furthermore, thermodynamic forcing is used here in a process-based sense to describe lake–atmosphere sensible and latent heat exchange that modifies boundary-layer temperature, moisture, static stability, and buoyancy. Variables such as lake index and specific humidity are therefore interpreted as diagnostics of the environmental conditions governing these processes rather than as forcing terms themselves. Collectively, these limitations warrant caution when interpreting absolute magnitudes, but they are not expected to materially alter the principal comparative relationships identified among the storm-track environments. Lastly, given the number of pairwise comparisons explored within this study, multiplicity-related issues may have had an impact on the identified findings.
This study, to the authors’ knowledge, represents the first effort to compare cumulative Q-vector divergence term values and independent QG omega forcing terms among distinct storm-track categories. Therefore, a similar framework should be applied to other lakes within the GLB to identify potential similarities and differences to these findings for Lake Michigan. Furthermore, comparing synoptic-scale dynamic forcing to the mesoscale thermodynamic forcing variables, the latter of which yielded stronger inter-track differences in this study, should similarly be explored for the other lakes as well. Additionally, although peak snowfall was not found to vary significantly among storm-track categories in this study, other lakes in the GLB may exhibit differences due to variations in regional geography, lake characteristics, and atmospheric conditions including the presence and intensity of synoptic forcing. Lastly, other differences in LES events across storm track types should be investigated. For example, the societal impacts associated with these storm tracks, including differences in morbidity, mortality, and property or agricultural damages, warrant further investigation to better understand the broader implications of LES events.
5. Conclusions
This study examined the relative contributions of synoptic-scale dynamic forcing, mesoscale thermodynamic forcing, and associated LES characteristics across five North American storm-track classifications (AC, CO, GLL, EC, and HI) during heavy Lake Michigan LES events. Collectively, these results demonstrate that synoptic-scale dynamic forcing was found to play a major role in ascent during LES events, a finding supported by analyses of the individual QG omega variables and a combined Q-vector approach. CVA emerged as the primary contributor to Q-vector convergence and large-scale ascent. Overall, few notable differences were identified between the dynamic forcing variables among the explored storm tracks. In contrast, mesoscale thermodynamic forcing exhibited substantially greater variability among storm tracks. Differences in CAA, static stability, and moisture availability were considerably more pronounced than those observed in the synoptic-scale dynamical fields, suggesting that thermodynamic processes provide an important mechanism for modulating LES environments once large-scale ascent has been established. Additionally, we suggest that these differences could allow thermodynamic processes to play a compensatory role in supporting the LES environment when synoptic-scale forcing is absent or relatively weak. Despite these environmental differences between the tracks, LES impacts (i.e., duration and maximum snowfall) were identical for all cyclonic tracks.
By quantifying the relative contributions of synoptic-scale and mesoscale forcing mechanisms across multiple storm-track classifications, this study addresses an important gap in the LES literature concerning the role of QG forcing in heavy Lake Michigan snowfall events. These results provide a climatological framework for understanding how distinct synoptic environments can produce similar LES impacts and establish a foundation for future investigations examining the relative importance of individual forcing mechanisms through numerical modeling and machine-learning approaches.
Author Contributions
Conceptualization, J.W. and C.E.; methodology, J.W. and C.E.; software, J.W. and C.E.; validation, J.W. and C.E.; formal analysis, J.W. and C.E.; investigation, J.W. and C.E.; resources, J.W. and C.E.; data curation, J.W. and C.E.; writing—original draft preparation, J.W. and C.E.; writing—review and editing, J.W. and C.E.; visualization, J.W. and C.E.; supervision, J.W. and C.E.; project administration, J.W. All authors have read and agreed to the published version of the manuscript.
Funding
This research received no external funding.
Data Availability Statement
The source datasets used in this study are publicly available from the NOAA Storm Events Database, ERA5 reanalysis, and Great Lakes Surface Environmental Analysis, as described and cited in the manuscript. The compiled lake-effect snow event dataset, including event dates and associated storm-track classifications, is available from the corresponding author upon reasonable request.
Acknowledgments
The authors wish to thank three anonymous reviewers for their valuable contributions that helped improve this manuscript. The authors also wish to thank Haley Floden who assisted in development of the lake-effect snow repository and with assigning storm track classifications to the lake-effect snow cases.
Conflicts of Interest
The authors declare no conflicts of interest.
Abbreviations
The following abbreviations are used in this manuscript:
| LES | Lake-effect snow |
| CVA | Cyclonic vorticity advection |
| GLB | Great Lakes Basin |
| QG | Quasi-geostrophic |
| AC | Alberta Clipper |
| CO | Colorado Low |
| EC | East Coast cyclone |
| GLL | Great Lakes Low |
| HI | High-pressure system/anticyclone |
| NSED | NOAA Storm Events Database |
| GLSEA | Great Lakes Surface Environmental Analysis |
| ECMWF | European Centre for Medium-Range Weather Forecasts |
| ERA5 | ECMWF Atmospheric Reanalysis version 5.0 |
| LI | Lake index |
| SLP | Sea level pressure |
| WAA | Warm air advection |
References
- Orlanski, I. A rational subdivision of scales for atmospheric processes. Bull. Am. Meteorol. Soc. 1975, 56, 527–530. [Google Scholar]
- Lovejoy, S. Review article: Scaling, dynamical regimes, and stratification. How long does weather last? How big is a cloud? Nonlinear Process. Geophys. Discuss. 2023, 30, 311–374. [Google Scholar] [CrossRef] [Scilit]
- Kristovich, D.A.R.; Laird, N.F. Observations of widespread lake-effect cloudiness: Influences of upwind conditions and lake surface temperatures. Weather Forecast. 1998, 13, 811–821. [Google Scholar] [CrossRef] [Scilit]
- Wiley, J.; Elcik, C. Evolution of Synoptic Systems Associated with Lake-Effect Snow Events over Northwestern Pennsylvania. Meteorology 2024, 3, 391–411. [Google Scholar] [CrossRef] [Scilit]
- Jiusto, J.E.; Paine, D.A.; Kaplan, M.L. Great Lakes Snowstorms. Part 2: Synoptic and Climatological Aspects; ESSA Grant E22-13-69(G); Atmospheric Sciences Research Center, State University of New York at Albany: Albany, NY, USA, 1970; 58p. [Google Scholar]
- Niziol, T.A.; Snyder, W.R.; Waldstreicher, J.S. Winter Weather Forecasting throughout the Eastern United States. Part IV: Lake Effect Snow. Weather Forecast. 1995, 10, 61–77. [Google Scholar] [CrossRef] [Scilit]
- Lackmann, G.M. Analysis of a Surprise Western New York Snowstorm. Weather Forecast. 2001, 16, 99–116. [Google Scholar] [CrossRef] [Scilit]
- Holton, J.R.; Hakim, G.J. An Introduction to Dynamic Meteorology, 5th ed.; Academic Press: Oxford, UK, 2013. [Google Scholar]
- Metz, N.D.; Bruick, Z.S.; Capute, P.K.; Neureuter, M.M.; Ott, E.W.; Sessa, M.F. An Investigation of Cold-Season Short-Wave Troughs in the Great Lakes Region and Their Concurrence with Lake-Effect Clouds. J. Appl. Meteorol. Climatol. 2019, 58, 605–614. [Google Scholar] [CrossRef] [Scilit]
- Laird, N.F.; Metz, N.D.; Gaudet, L.; Grasmick, C.; Higgins, L.; Loeser, C.; Zelinsky, D.A. Climatology of Cold Season Lake-Effect Cloud Bands for the North American Great Lakes. Int. J. Climatol. 2017, 37, 2111–2121. [Google Scholar] [CrossRef] [Scilit]
- Wiley, J.; Mercer, A. Structure and Evolution of Non-Lake-Effect Snow Producing Alberta Clippers. Atmosphere 2021, 12, 1288. [Google Scholar] [CrossRef] [Scilit]
- National Weather Service Instruction 10-1605. Available online: https://www.ncdc.noaa.gov/stormevents/pd01016005curr.pdf (accessed on 14 March 2026).
- NOAA Great Lakes Environmental Research Laboratory. Available online: https://www.grerl.noaa.gov/education/ourlakes/lakes.html (accessed on 5 May 2026).
- Hersbach, H.; Bell, B.; Berrisford, P.; Hirahara, S.; Horányi, A.; Muñoz-Sabater, J.; Nicolas, J.; Peubey, C.; Radu, R.; Schepers, D.; et al. The ERA5 global reanalysis. Q. J. R. Meteorol. Soc. 2020, 146, 1999–2049. [Google Scholar] [CrossRef] [Scilit]
- Schertzer, D.; Tchiguirinskaia, I.; Lovejoy, S.; Tuck, A.F. Quasi-geostrophic turbulence and generalized scale invariance, a theoretical reply. Atmos. Chem. Phys. 2012, 12, 327–336. [Google Scholar] [CrossRef] [Scilit]
- Hoskins, B.J.; Draghici, I.; Davies, H.C. A New Look at the ω-Equation. Q. J. R. Meteorol. Soc. 1978, 104, 31–38. [Google Scholar] [CrossRef] [Scilit]
- Hjelmfelt, M.R. Numerical Study of the Influence of Environmental Conditions on Lake-Effect Snowstorms over Lake Michigan. Mon. Weather Rev. 1990, 118, 138–150. [Google Scholar] [CrossRef] [Scilit]
- Holroyd, E.W., III. Lake-Effect Cloud Bands as Seen from Weather Satellites. J. Atmos. Sci. 1971, 28, 1165–1170. [Google Scholar] [CrossRef] [Scilit]
- Cohen, J. Statistical Power Analysis for the Behavioral Sciences, 2nd ed.; Lawrence Erlbaum Associates: Hillsdale, NJ, USA, 1988. [Google Scholar]
- Wiley, J.; Mercer, A. Synoptic Climatology of Lake-Effect Snow Events off the Western Great Lakes. Climate 2021, 9, 43. [Google Scholar] [CrossRef] [Scilit]

Disclaimer/Publisher’s Note: The statements, opinions and data contained in all publications are solely those of the individual author(s) and contributor(s) and not of MDPI and/or the editor(s). MDPI and/or the editor(s) disclaim responsibility for any injury to people or property resulting from any ideas, methods, instructions or products referred to in the content. |
© 2026 by the authors. Licensee MDPI, Basel, Switzerland. This article is an open access article distributed under the terms and conditions of the Creative Commons Attribution (CC BY) license.