


Abstract
The response of temperature extremes to recent warming at the local scale remains uncertain because changes in mean temperature may be accompanied by changes in the shape of the temperature distribution. While higher mean temperatures generally lead to more frequent heat waves and fewer cold events, variations in higher-order statistical moments can either amplify or moderate these effects. This study examines how the probability distribution of 2 m temperature has evolved during the last 80 years in Greece using the ERA-5 reanalysis dataset. The evolution of the first four statistical moments (mean, standard deviation, skewness and kurtosis) and of the 5th and 95th percentiles of daily mean temperature is calculated by splitting the time series into eight decades, with each decade representing a separate climatology. A clear increase in mean temperature is observed across Greece. However, trends in the higher-order moments are more complex: the standard deviation and skewness exhibit positive and negative trends that depend on the region and the season, while kurtosis trends are weaker with a few regional exceptions. These changes alter the response of temperature extremes to warming, resulting in non-uniform shifts of the 5th and 95th percentiles. In mountainous regions, extreme cold events during winter and autumn have decreased more strongly than expected from mean warming alone, while in marine regions extreme warm events during summer and autumn have increased beyond what would be expected by a shift in the mean. In other areas, changes in the distribution shape lead to weaker extremes than those predicted by mean warming alone. These results highlight the role that changes in temperature variability have in modulating the evolution of temperature extremes under climate warming.
1. Introduction
Surface global mean temperature has risen during the past century [1,2], with global average temperature in 2024 exceeding the pre-industrial 1850–1900 baseline by 1.5 °C. It is also expected to rise even more in the future due to anthropogenic forcing [3,4]. The impact of this warming on temperature variability and especially on extreme events such as the frequency and magnitude of temperature extremes on a local scale is uncertain [5,6,7,8,9]. It is generally expected that higher global mean temperatures will lead to more frequent and more severe heat waves while the opposite holds for extreme cold events [10,11,12]. However, the mean temperature can non-linearly influence the higher-order moments of the temperature distribution such as variance, which measures the mean magnitude of the variability; skewness, which measures the asymmetry between positive and negative anomalies; and kurtosis, which measures the length of the tails of the distribution. As a result, even small shifts in the mean can lead to large changes in the variability and in extreme values [13,14]. For example, it was suggested that the extreme European and Russian heat waves in 2003 and 2010, respectively, occurred partially due to an increase in temperature variability [15,16]. Therefore, a thorough investigation of past or future changes in the temperature distribution is of great interest.
Regarding the higher-order moments of the temperature distribution, there is a significant number of studies focusing on temperature variance. Using an observational dataset of daily maximum and minimum temperatures, Donat and Alexander [17] found moderate changes in variance over the latter part of the 21st century that are spatially heterogeneous over the globe and even on the continental scale. Hansen et al. [18] examined changes in the variance of winter and summer time temperatures and found an increase over most of the globe, although the increase was found to be significantly suppressed after accounting for trends in the mean [19]. In addition, multiple studies using climate model simulations found a decrease in temperature variance under standard anthropogenic forcing scenarios during boreal winter [20,21].
Skewness and kurtosis have received less attention as it is still debated whether the surface temperature distribution is normal or not. Schneider et al. [22] analyzed winter and summer temperature variability on sub-monthly time scales using the ERA-Interim reanalysis and found near-Gaussian statistics, a result that was also found in idealized GCMs [23]. However, analysis of weather station observations from specific regions [14,24,25,26], as well as analysis of temperature variability on a global scale using the ERA-40 reanalysis dataset [27] and the NCAR Reanalysis-I [28], found asymmetric distributions with both positive and negative values of skewness. Climate model simulations also predict changes in skewness over large regions during both the cold [29] and the warm [30] seasons of the year. In addition, excess kurtosis in the temperature distributions was found in both observations [24] and reanalysis data [27].
Given the conflicting evidence for the values of the higher-order moments, as well as the influence of their changes to temperature extremes, it is important to study the probability distribution of temperature as well as its long-term evolution, especially in regions that are found to warm more rapidly than the global mean. One such region identified as a climate change hotspot is the Eastern Mediterranean [31], which is at its warmest period over the last 500 years [32] and is projected to warm even more in the future [33].
A particularly vulnerable region within the Eastern Mediterranean regarding recent and future climate change is Greece. Analysis of the longest meteorological records from a station in Athens that date back to 1864 have shown a long-term temperature variability with early and mid-century cooling but with a significant warming trend in the latter part of the last century, which is more evident during summer [34]. An investigation of homogenized time series from a large number of synoptic stations in Greece from 1960 till 2004 showed that the recent summer trend is characteristic of the whole region with the northern part of Greece also exhibiting a more prominent annual warming [35]. These results were verified with high-resolution ERA-Interim [36] and ERA-5 Land data [37,38], which revealed a warming trend of about 0.8 degrees/year in the recent 30 years that is positively correlated with the distance of the areas from the coasts [38]. Late-century surface warming was found to be prevalent, especially during spring and summer, with weaker trends in winter and autumn, and it is also accompanied by a similar upper troposphere warming as well [36]. It was also found to lead to the loss of 0.3 frost days/year [38] and to an increase in heatwaves by 80% since 1990 [37].
While temperature trends have been extensively studied for the region of Greece, long-term changes in the higher-order moments of temperature remain unexplored, and their potential link to temperature extremes has not been systematically investigated. This gap is particularly important given the growing evidence that changes in variance, skewness and kurtosis can substantially modulate the frequency and intensity of extreme events, even under modest shifts in the mean climate state. In this study, this limitation is addressed by providing a comprehensive analysis of the full temperature distribution over Greece, focusing not only on mean trends but also on its higher-order statistical moments and their temporal evolution. Using the ERA-5 reanalysis dataset, which offers an unprecedented combination of temporal coverage and spatial resolution, the decadal-scale changes in variance, skewness and kurtosis are quantified across all seasons. Furthermore, the extent to which these changes translate into modifications of temperature extremes is explicitly evaluated, thereby bridging the gap between statistical characterization and physically relevant impacts.
This paper is organized as follows. In Section 2, the dataset and the methodology for the calculation of the temperature distribution and its long-term evolution are analyzed. Section 3 presents the results on the evolving climatology of temperature, and Section 4 examines the relation of the observed changes to temperature extremes. Section 5 contains a discussion of the main findings, their relation to results of previous studies and the possible drivers of the observed changes, and finally, in Section 6, the main conclusions of this study are presented.
2. Data and Methodology
2.1. Data
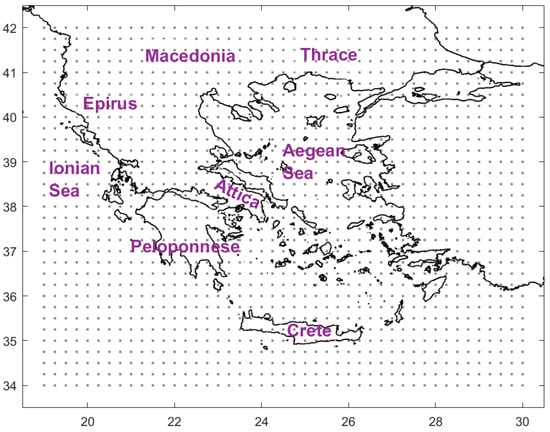
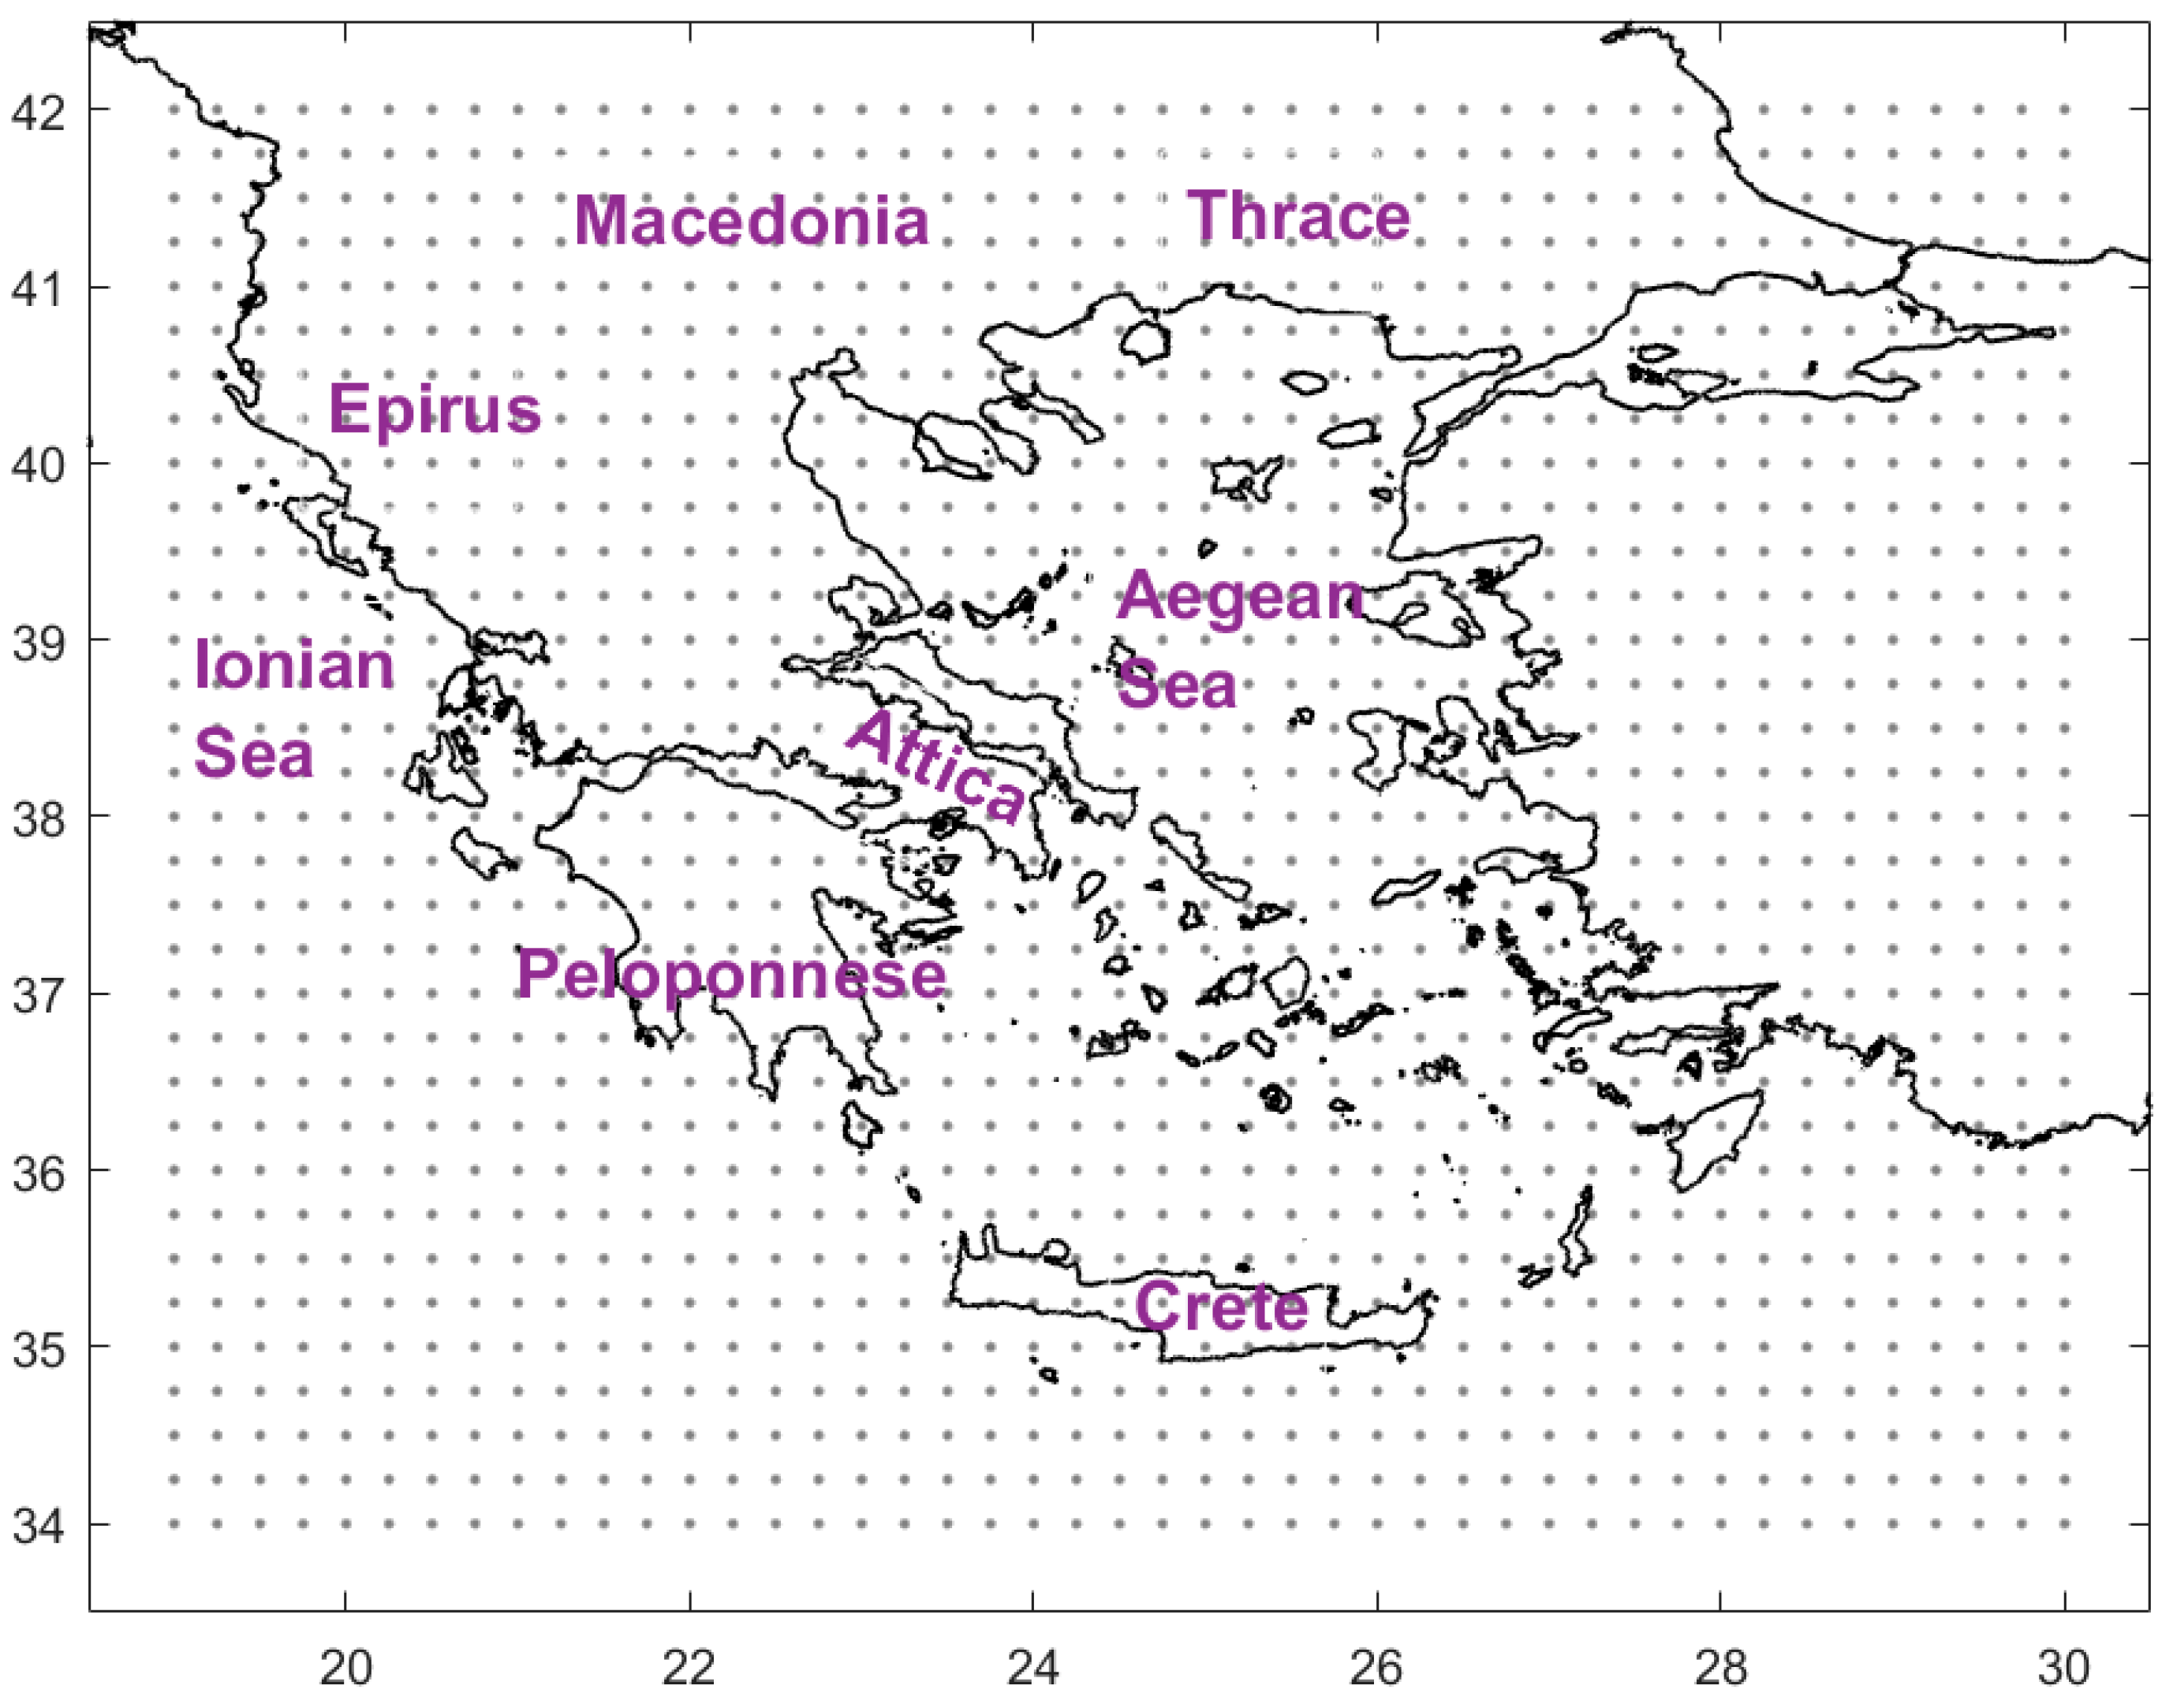
This study aims to address the long-term evolution of temperature distribution over Greece. Such an investigation requires a long time series covering the whole region with adequate resolution. ERA-5 reanalysis data [39] is therefore used rather than weather stations that lack the spatial coverage or ERA-5 Land reanalysis data that lack sea coverage and are available for a shorter period. The data is provided by the European Center for Medium-Range Weather Forecasts (ECMWF) using the Copernicus Service of the European Commission and is available for download at https://cds.climate.copernicus.eu/ (accessed on 1 November 2024). ERA-5 has global coverage with 0.25 × 0.25 degrees horizonal resolution and temporal coverage at an hourly resolution starting from 1940 until the present day. The domain under study covers the region 19 E–30 E and 34 N–42 N and is shown in Figure 1 along with the relevant grid points.
Figure 1.
The domain along with the grid points of the ERA-5 dataset.
The ERA-5 dataset is based on the Integrated Forecasting System of ECMWF and is the result of the assimilation of observations through a four-dimensional variational analysis [40]. The observations assimilated include surface data from SYNOP and METAR reports, data from buoys and ships and upper air data from radiosondes and aircrafts that cover the whole period, as well as observations from satellite products covering from the early satellite era (1979–1999) until the modern era (2000-today) [41]. ERA-5 data have been widely used in climatological studies of surface temperature and in studies related to climate change as the dataset captures the temperature variability when compared with raw observations while also covering the whole globe with adequate spatial and temporal resolution [37,38,42,43,44,45]. The reliability of the ERA-5 data regarding surface temperature in the European region was assessed by Velikou et al. [46] by comparison with two homogenized observational datasets of the European Climate Assessment and Dataset for the period of 1981–2010. It was found that the ERA-5 data captures the temperature variability, producing very high correlations of 0.998 for the Eastern Mediterranean, but underestimates the temperature, especially in the mountainous regions due to altitude differences between the stations and the surface level of the ERA-5 grid points. The form of the temperature distribution, as described by the statistical moments and the percentiles of the distribution, was also found to be similar. As a result, this dataset is suitable for the purposes of the current study.
2.2. Methodology
For each grid point, the daily average from the hourly time series of 2 m temperature is calculated for the 80-year period of December 1943–November 2023. To calculate the evolution of the temperature distribution, the study period is divided into eight decades, and the temperature statistics are calculated separately for each decade. The result is eight separate temperature distributions characterizing the long-term evolution of the temperature statistics. The decadal time scale was selected as a compromise between temporal resolution and statistical robustness: it is short enough to resolve multi-decadal changes while long enough to retain a sufficient number of days for a reliable climatology. To test the sensitivity to this choice, the analysis was repeated using four 20-year periods. The resulting spatial patterns and temporal tendencies were qualitatively similar, indicating that the main conclusions are not strongly dependent on the specific segmentation. Nevertheless, given the limited length of the record, some apparent decadal variability may reflect sampling variability, and the results should be interpreted with this limitation in mind.
The statistical moments of temperature are biased by the seasonal cycle, which dominates the variability, and by long-term intra-annual warming/cooling. Therefore, the seasonal cycle is removed by calculating the Fourier transform of each decadal time series and eliminating the annual cycle from the series. The linear trend within each of the decades is also removed with the mean temperature set to the value corresponding to the midpoint of the decadal period. As a result, sub-decadal warming is suppressed but multi-decadal warming/cooling is retained in the evolution of the temperature mean. Although the seasonal variation of temperature has been removed from the statistics, temperature variability continues to exhibit seasonal fluctuations. For example, during the cold period of the year, a significant number of cyclones forming over the Central and Northern Mediterranean Sea affect Greece, causing a stronger variability in temperature compared with the warm period [47,48]. For this reason, the statistics were calculated separately for the four seasons: the winter (DJF), spring (MAM), summer (JJA) and autumn (SON) months in each decade. Accordingly, December 1943 is included in the time series as the winter of 1944 comprises December of the preceding year, and similarly, December of 2023 is excluded.
For each season, the first four statistical moments of the temperature distribution are calculated. The first is the mean , denoted with the overbar. The second is the standard deviation
where the prime denotes deviations from the mean, which is a measure of the temperature variability [49]. The third is skewness
quantifying the asymmetry of the distribution relative to the mean [49]. Positive values indicate a temperature distribution with a longer or fatter tail towards warmer temperatures and a mean that is larger than the median. Such positive values can result in the cold period of the year from cyclogenesis events, as warm air is lifted during the growing phase of the cyclone [27]; or during the warm period of the year from heat waves related to anti-cyclonic conditions in the region [30]. In contrast, negative values indicate a temperature distribution with a longer or fatter tail towards colder temperatures, with the mean being smaller than the median. Such negative values can result from extreme cold air outbreaks related to blocking [29] or from cyclolysis events where cold air is lifted during the decaying phase of the cyclone [27]. In addition, non-zero values of skewness were shown to occur in regions neighboring the storm tracks due to non-linear meridional advection of anomalous temperature by anomalous cyclones and anti-cyclones [50,51], as well as in regions with large climatological temperature gradients due to linear advection of the background gradient by the anomalous wind [52]. Finally, the fourth is excess kurtosis
relative to the value, 3, of the normal distribution [49]. This is a measure of the tails of the distribution relative to the corresponding tails of the normal distribution. Positive values indicate heavier tails compared with the normal distribution and can occur in cases where the extreme events (either warm or cold) are intense. In contrast, negative values indicate lighter tails compared with the normal distribution and can occur in cases of relatively mild temperature variability with only a few extreme events. Non-zero values of kurtosis have the same dynamical drivers with non-zero values of skewness discussed above, as kurtosis is found to be directly related to skewness in temperature records [53].
The statistics of the first decade (1944–1953) are used as reference climatology. The evolution of the four moments for each season was then computed, and the linear trends of these moments were calculated using the Theil–Sen non-parametric method. The statistical significance of the trends at the 95% confidence level was assessed using the Mann–Kendall non-parametric test. To address the influence of long-term changes in the extreme events, the 5th () and 95th () percentiles of the temperature distribution within each decade, presenting threshold values for extreme cold and warm events, respectively, were calculated. Their linear decadal trends were also calculated using the Theil–Sen method. To assess whether the changes in the percentiles are caused by simple shifts in the mean or if changes in the other statistical moments are involved as well, the percentiles relative to the mean and are calculated as well as their trends. These represent the distance of the extreme cold () and warm () thresholds from the mean. If the trends in the percentiles are merely caused by shifts in the mean, then the relative percentiles would exhibit zero trends as both the percentiles and the mean would shift by the same amount and the distance of the extreme thresholds from the mean would remain the same. If the temperature extremes are influenced by changes in the other statistical moments, then the trends of relative percentiles would be non-zero and would quantify such influence.
3. Statistical Moments of Temperature and Their Trends
3.1. Climatology of the Statistical Moments of Temperature
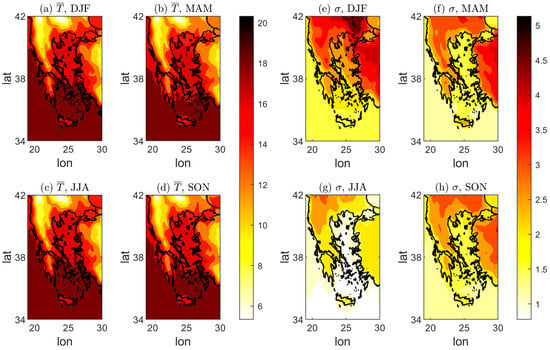
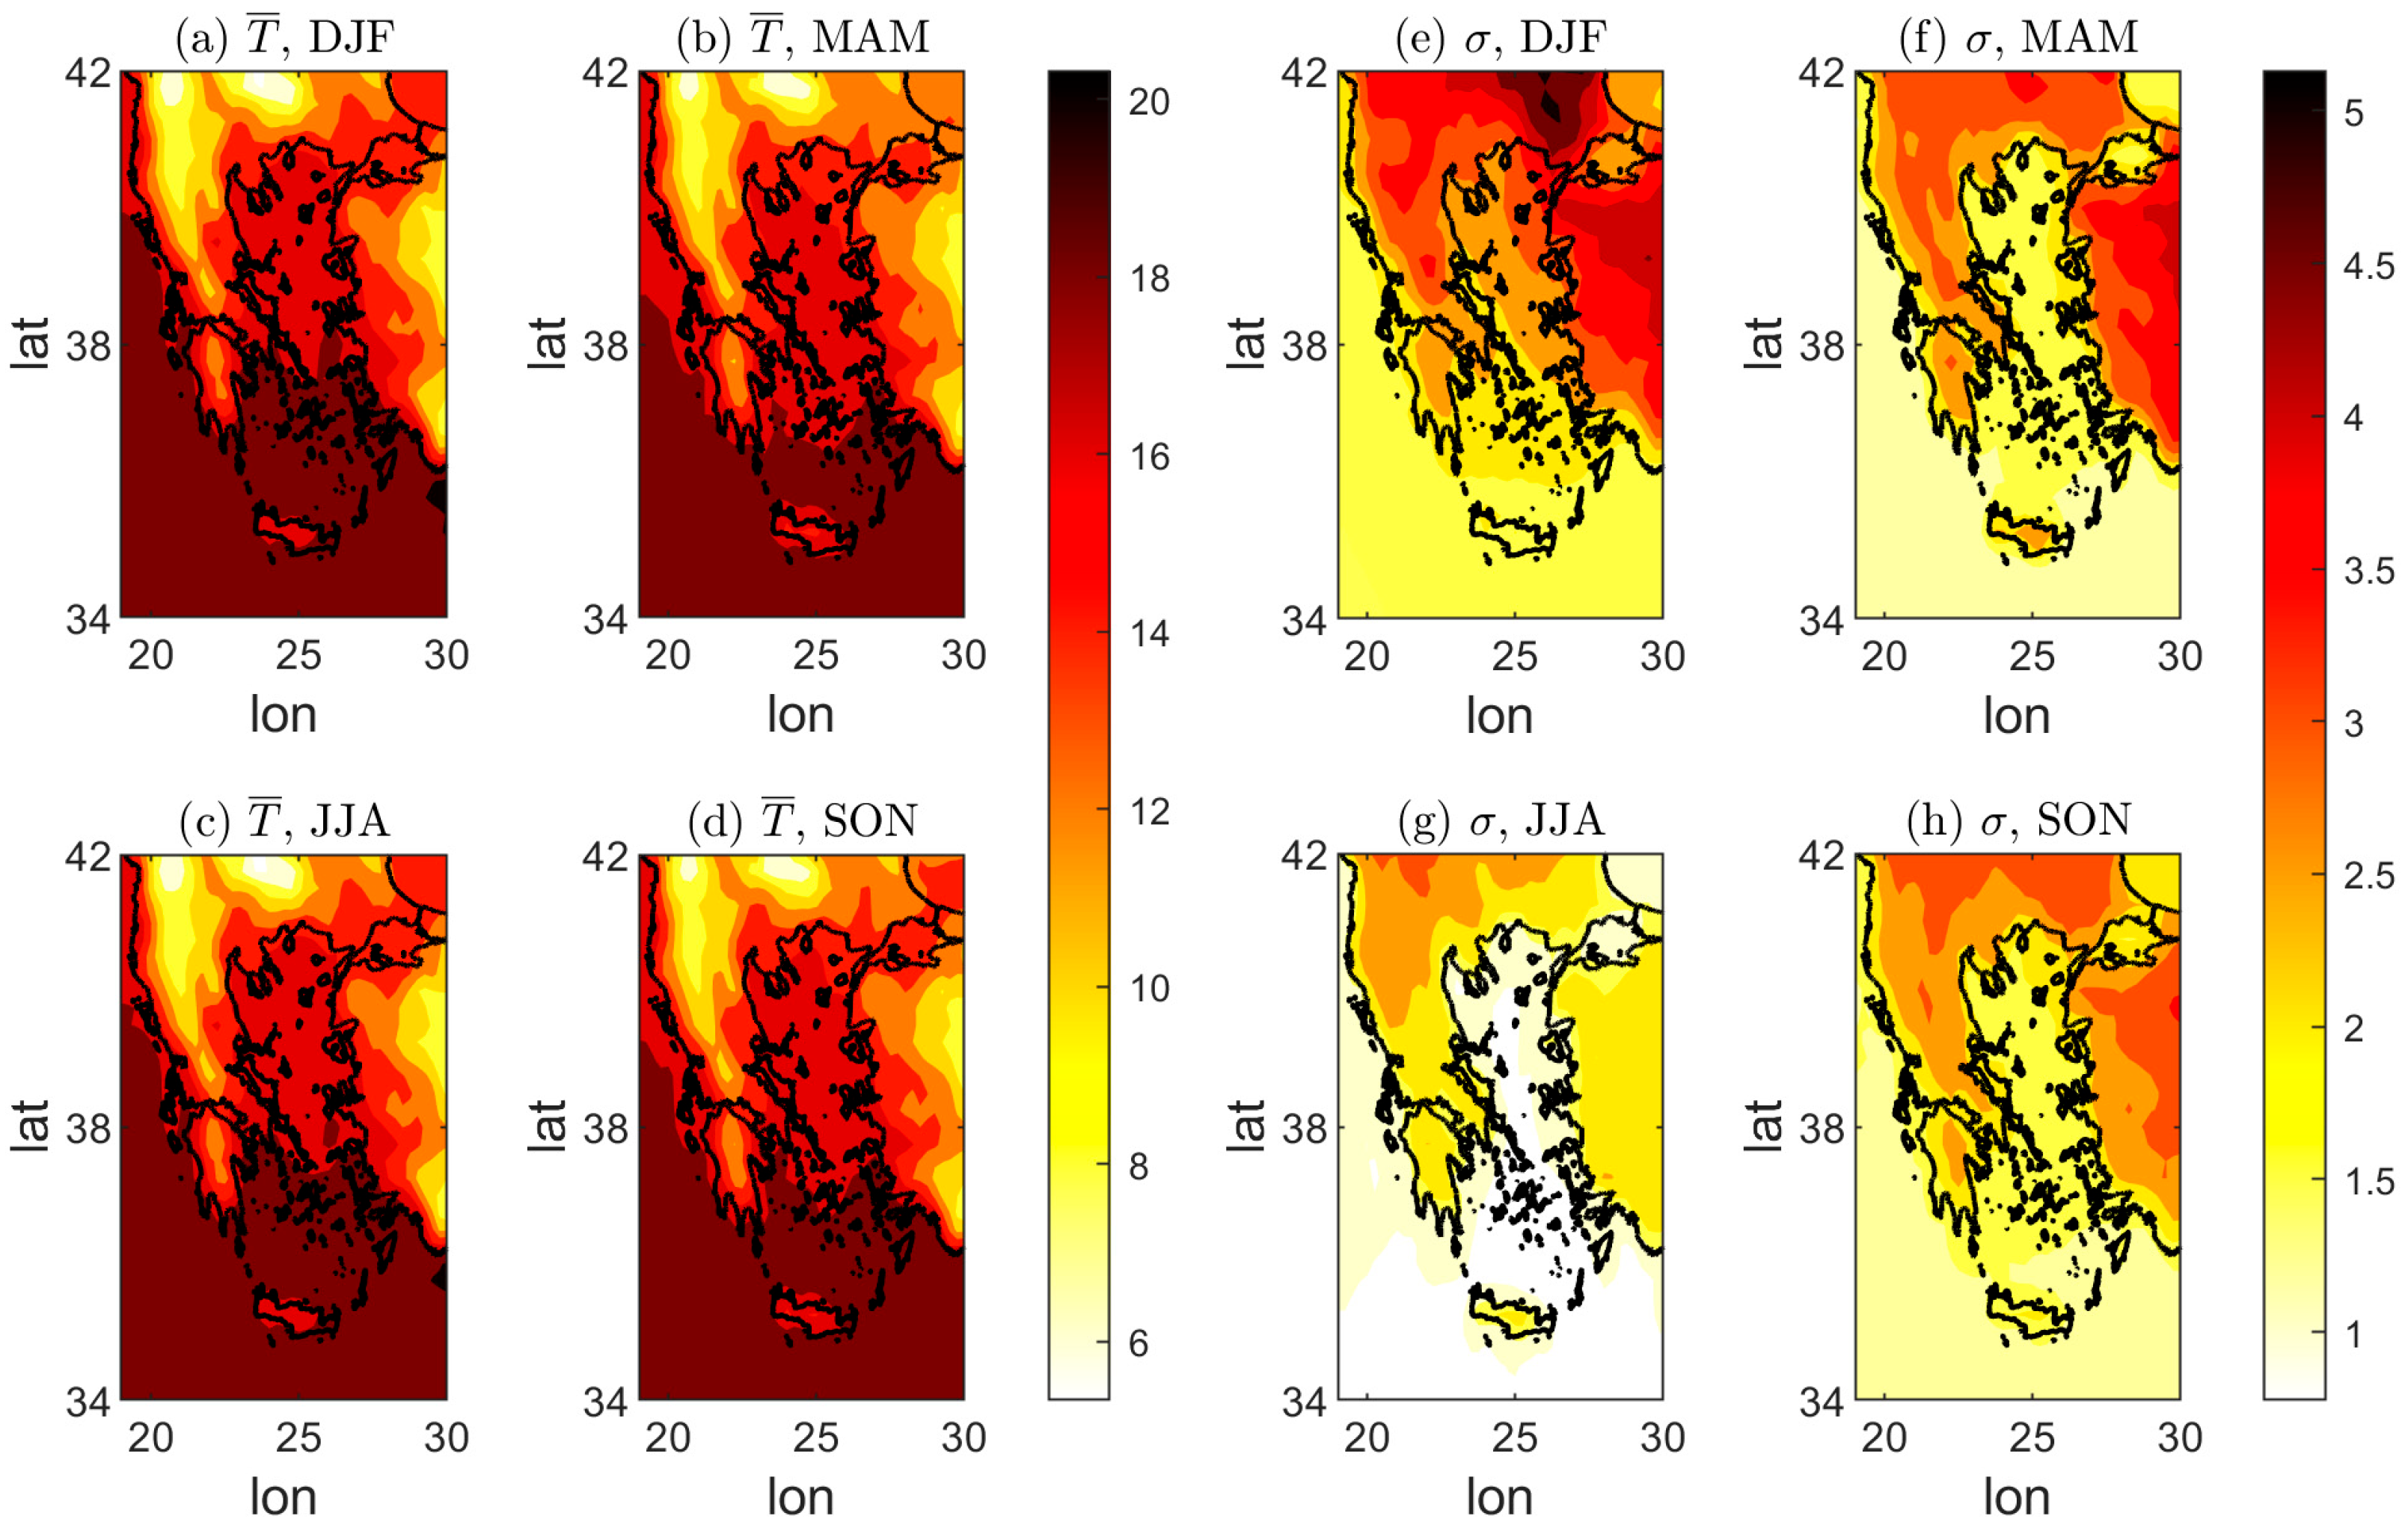
Figure 2 shows the values of the mean and the standard deviation of the temperature distribution in each season for the reference decade of 1944–1953. The mean temperature (Figure 2a–d) shows no seasonal differences as the time series are deseasonalized. It exhibits a strong meridional gradient as well as a gradient with the distance from the coast, with minimum values over the mountainous and northern regions of mainland Greece and maximum values over the southern coastal areas and the islands. This reflects the expected climatological land–sea contrast.
Figure 2.
The mean temperature (a–d) and standard deviation (e–h) in °C for the four seasons of the reference decade (1944–1953).
The standard deviation (Figure 2e–h) presents the same spatial pattern over all four seasons but with differing values reaching maximum values of up to 5 °C during the cold season and lower values of up to 3 °C during the warm season. This reflects the larger variability caused by weather systems during the cold period of the year [48]. The spatial pattern is opposite to that of the mean temperature: larger values are observed over mainland Greece, with maxima over Macedonia and Thrace, while island and coastal regions exhibit lower variability partly due to marine thermal inertia.
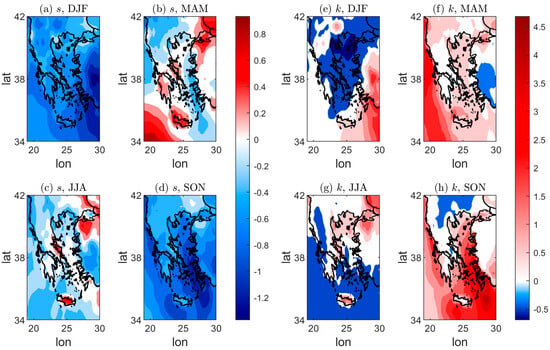
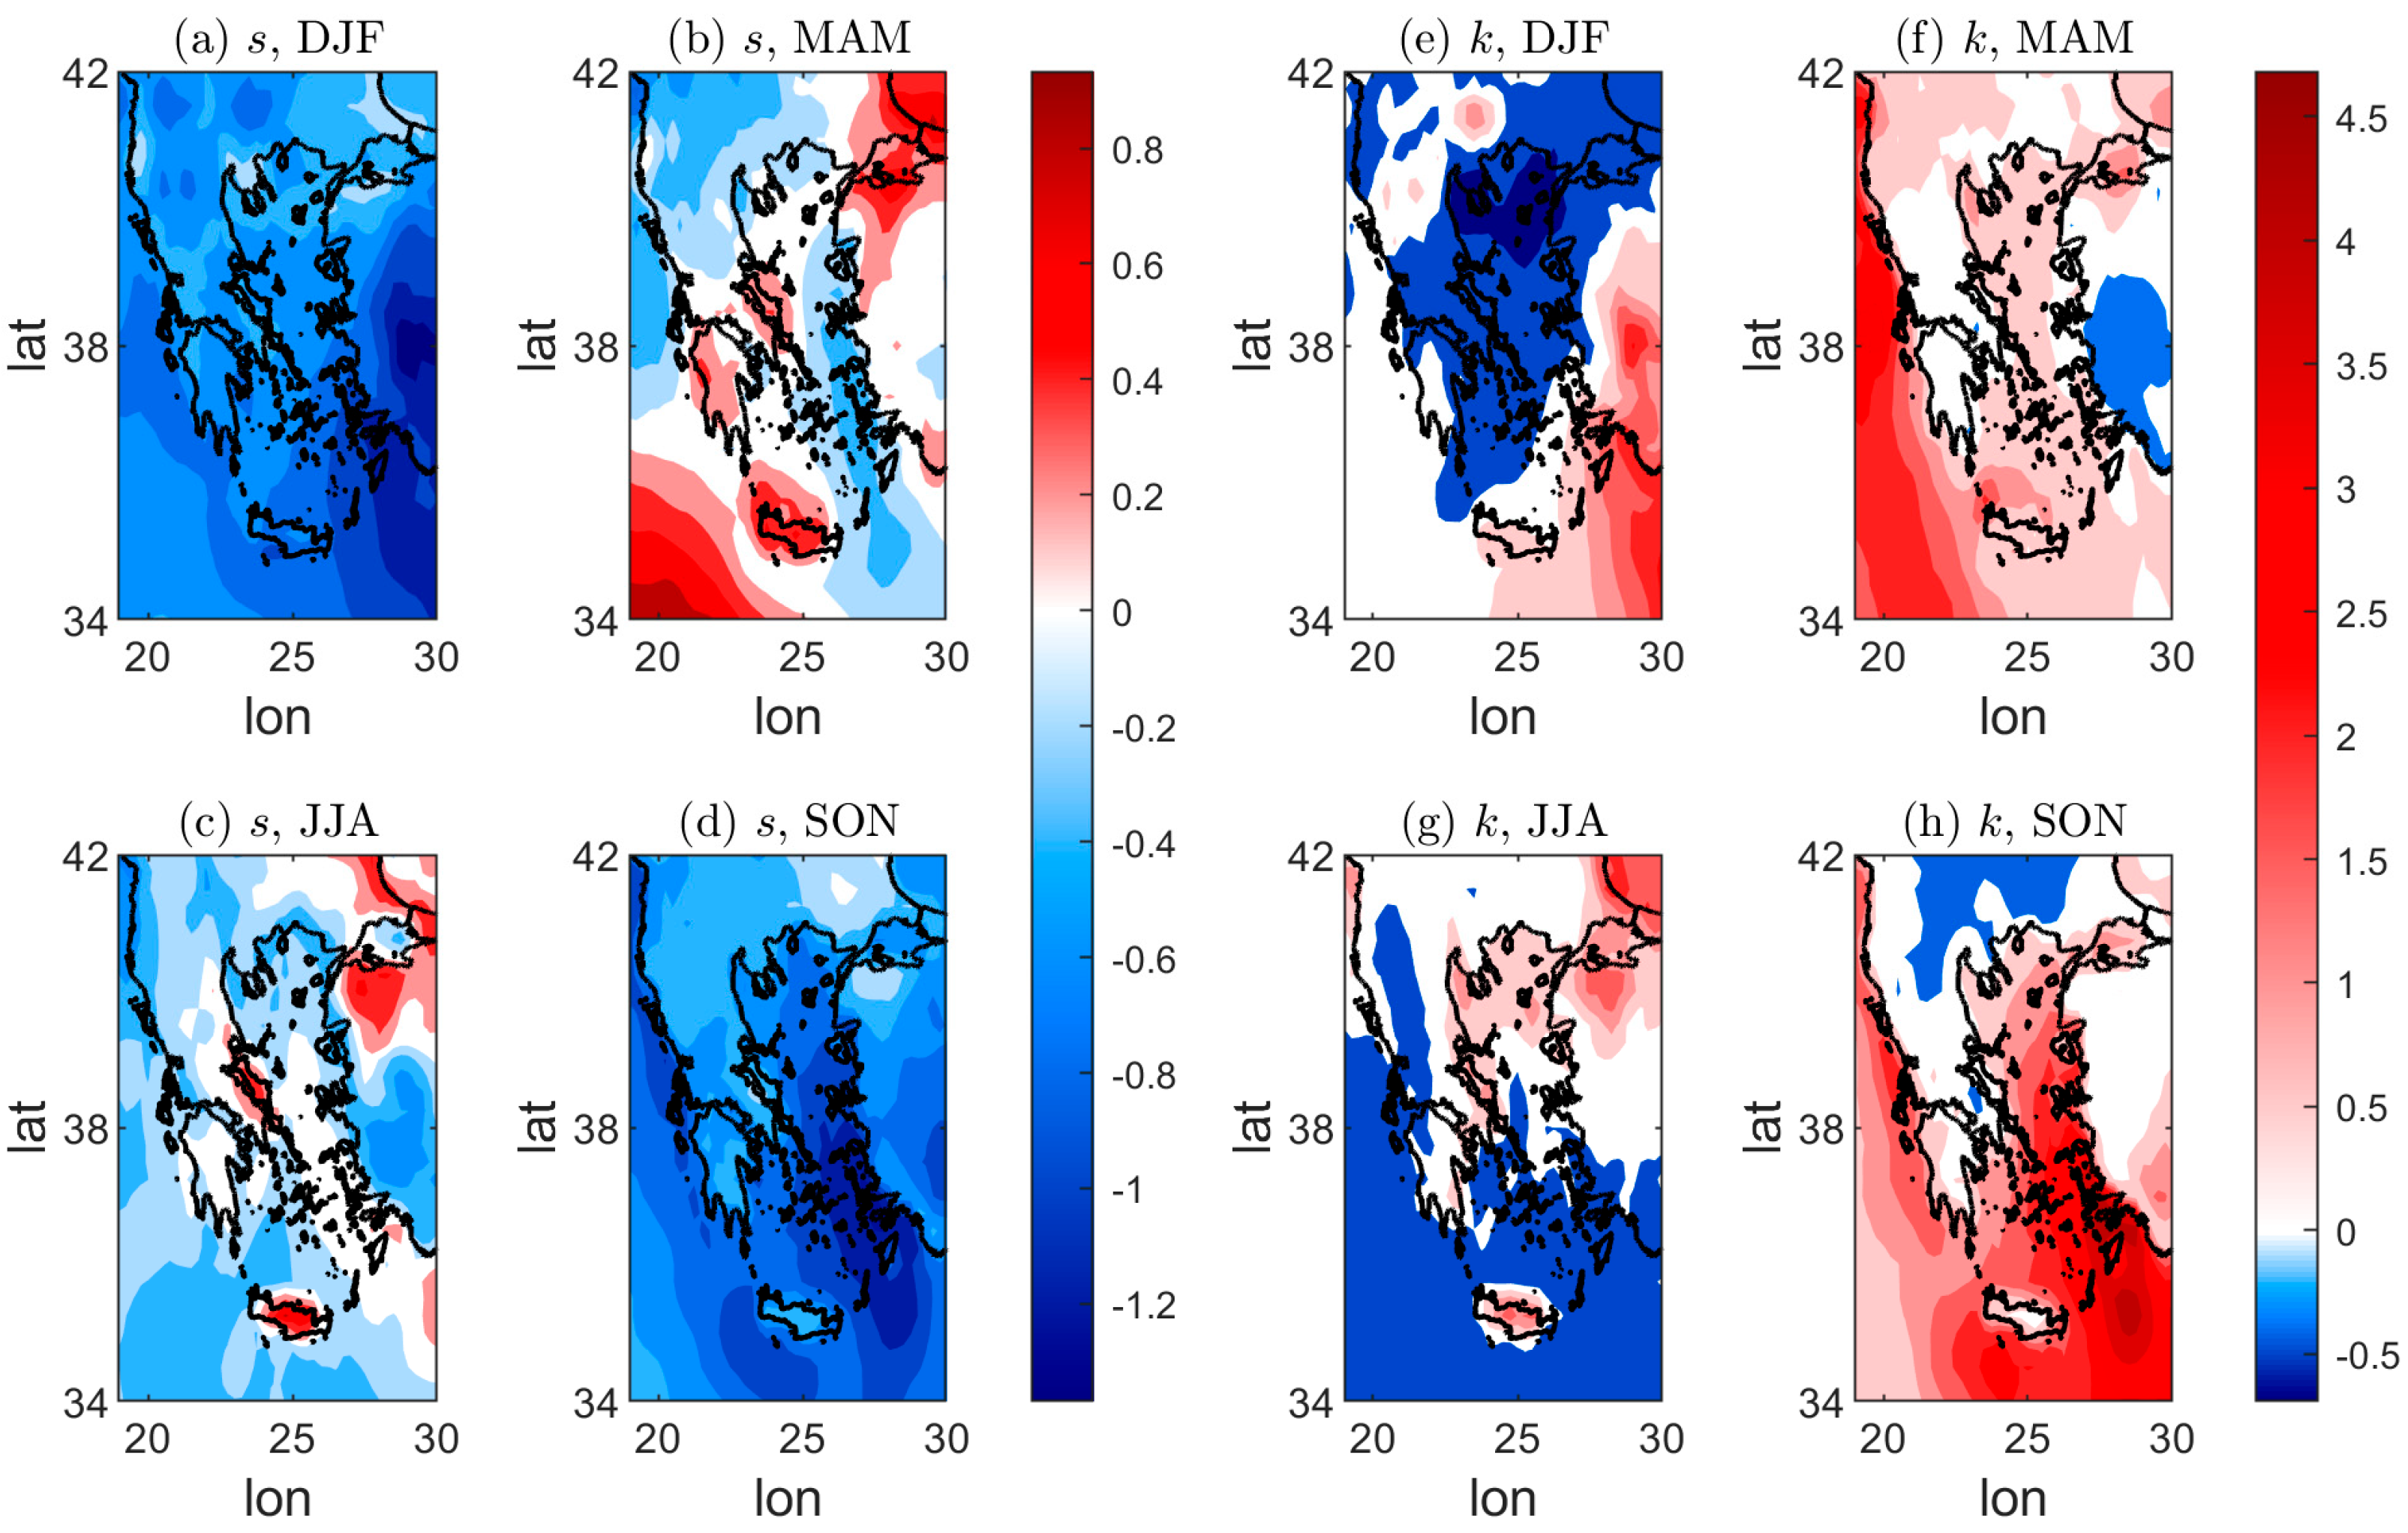
Skewness and kurtosis for the reference decade are plotted in Figure 3. Regarding skewness, negative values are observed across the entire domain during winter and fall, with minimum values of up to −1.2 towards the South Aegean Sea (Figure 3a–d). This indicates a non-normal distribution with a tail towards lower values, which is with more cold than warm events. In spring, skewness remains predominantly negative, except over the Peloponnese, the Southern Ionian Sea and Crete, where positive values occur. These positive values are probably related to warm intrusions brought by Saharan depressions that reach a peak during this season [48,54]. In summer, slightly negative skewness characterizes Central and Northern Greece, while positive values occur in Crete and in the Euboea island.
Figure 3.
Skewness (a–d) and kurtosis (e–h) for the four seasons of the reference decade (1944–1953).
Excess kurtosis is close to zero as in a normal distribution for most continental regions across all seasons, while non-zero values characterize mainly marine areas (Figure 3e–h). Specifically, during winter and autumn, localized positive values of the order of 1 (in DJF) and up to 3 (in SON) are observed in the Southeastern Aegean, while slightly negative values (−0.5) occur in the Northern Aegean and in the eastern and northeastern parts of mainland Greece during winter. In spring, relatively large values of the order of 3 are observed in the Ionian Sea, while during summer, low positive values occur over Crete and northern Aegean and slightly negative values are found in the Southern Aegean and the Ionian Sea.
In summary, for the reference climatology of the first decade, the mean temperature exhibits a meridional gradient with a land–sea contrast, while the temperature variability exhibits the opposite contrast with stronger variability over land and during the cold period of the year. The temperature distribution is negatively skewed across all seasons with a few exceptions over areas in the Aegean Sea and Crete. The kurtosis of the distribution is close to normal over land areas with positive and negative exceedance over areas in the Aegean and Ionian Sea that differ with season.
3.2. Long-Term Trends for the Statistical Moments
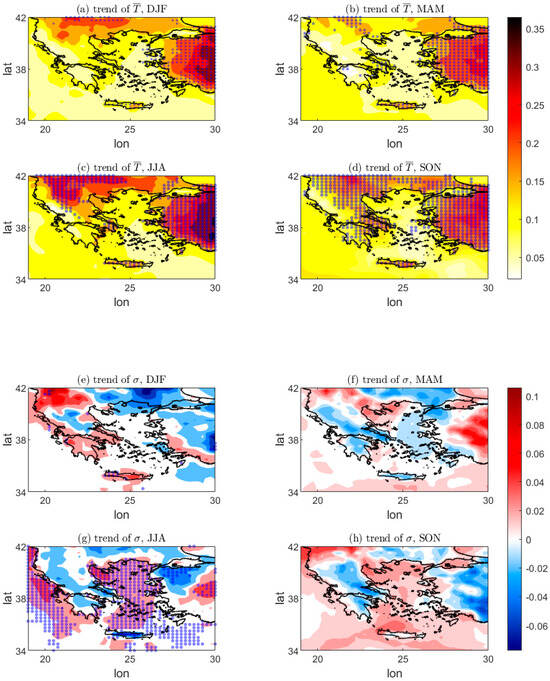
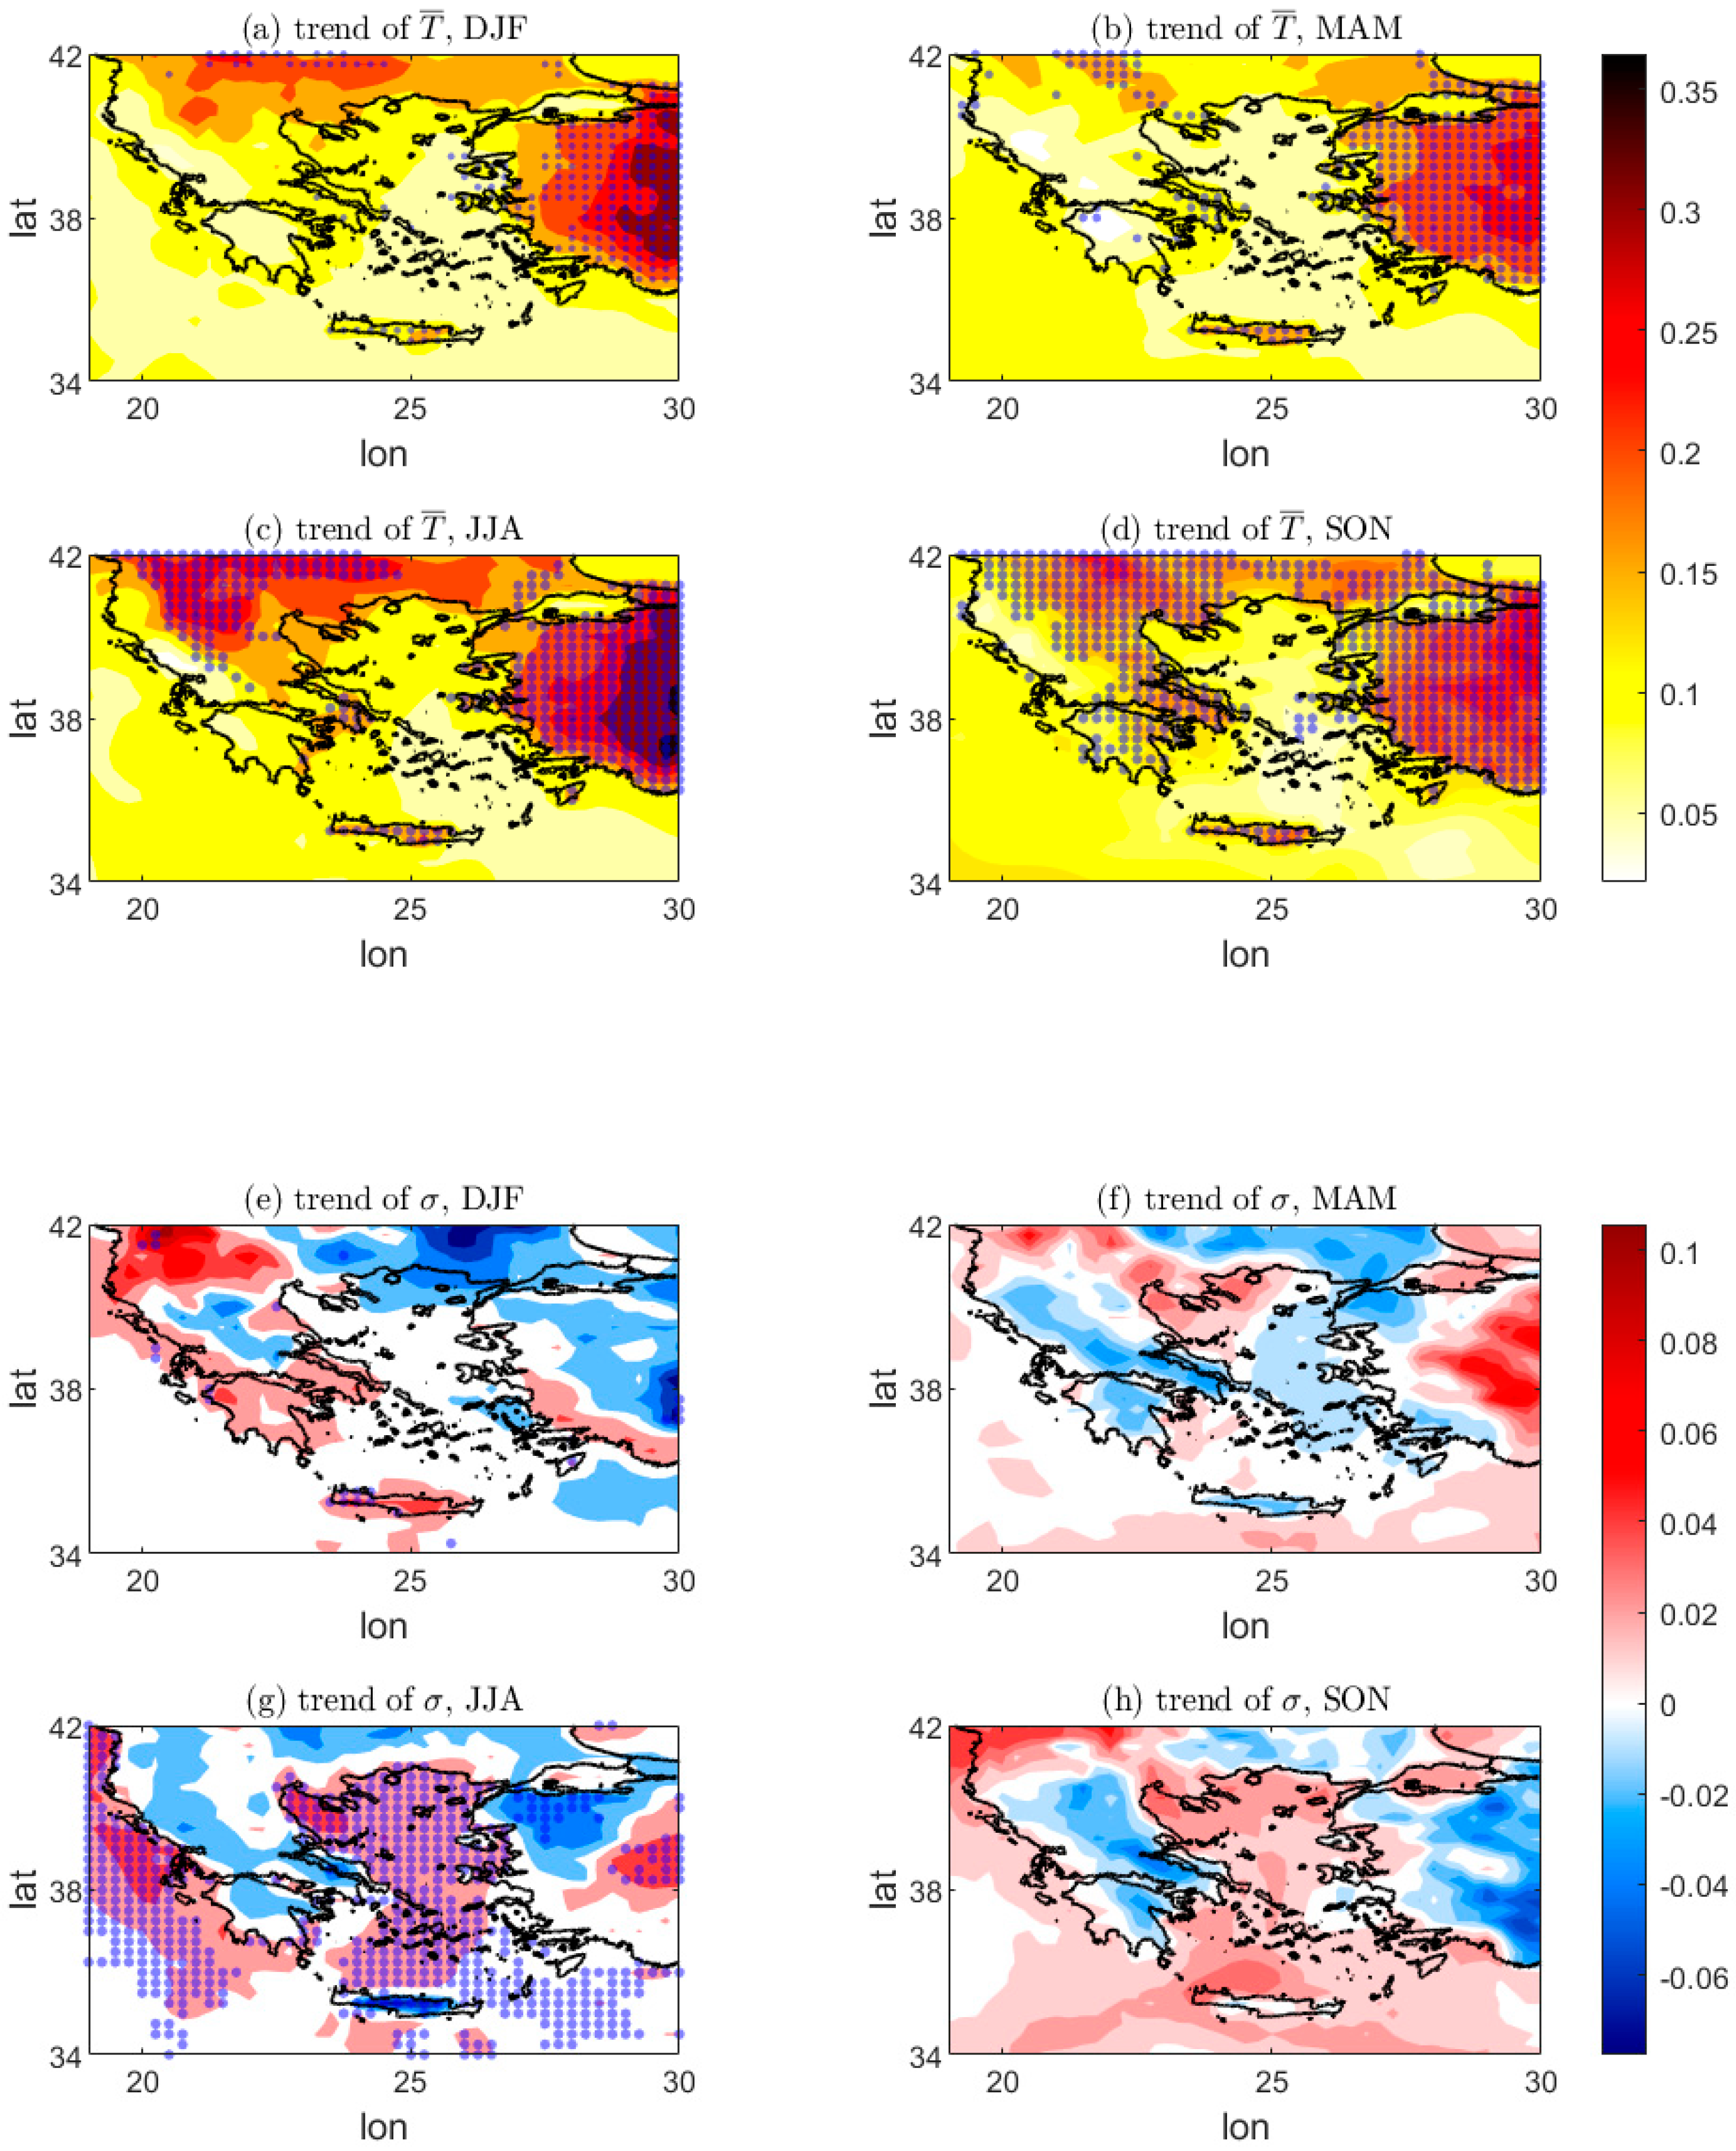
The linear trends of the mean and the variance in each season are shown in Figure 4. The mean temperature increases across the region relative to the reference period and with the same spatial pattern for all seasons (Figure 4a–d). Northern Greece and Western Turkey warm more rapidly by up to 0.35 °C per decade, with the larger trends being statistically significant. In contrast, the west coast of Greece and the Aegean Sea apart from Crete warm at the much slower pace of 0.05 °C per decade. In addition, warming is more prominent during summer.
Figure 4.
The trend of the mean temperature (a–d) and of the standard deviation (e–h) for the four seasons in °C per decade. The grid points with statistically significant trends are shown by dots.
Variance exhibits mixed positive and negative trends that depend on the region and the season (Figure 4e–h). In the Aegean and the Ionian Sea, temperature variability increases by as much as 0.04 °C per decade during summer and fall with nearly zero trend in winter and a negative trend in the Central Aegean of 0.01 °C per decade during spring.
Given the relatively low values of variance in the reference period between 0.5 and 1.5 degrees over the sea, such trends cause significant changes in the temperature variability within these areas. In most parts of central and northern mainland Greece, variance decreases for all seasons with rates in the range of −0.04 to −0.02 °C per decade. Exceptions are Crete and Northern Epirus, exhibiting moderate to strong positive trends during winter as well as the Halkidiki Peninsula, which exhibits a slight positive trend during spring and fall. Among these trends, only those during summer are statistically significant.
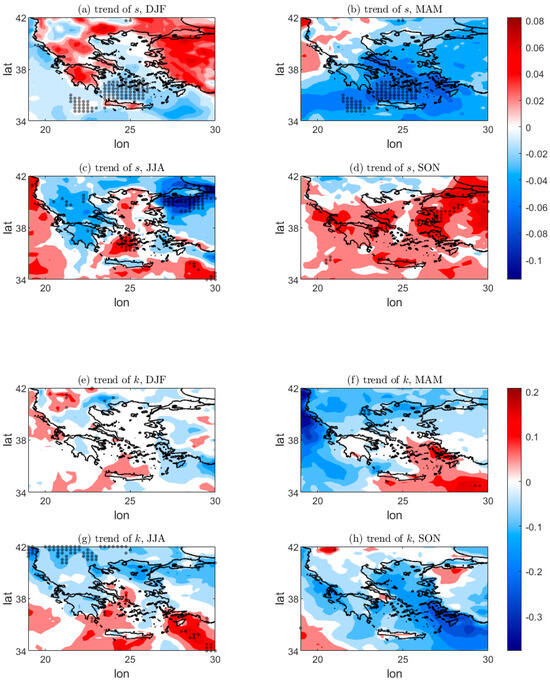
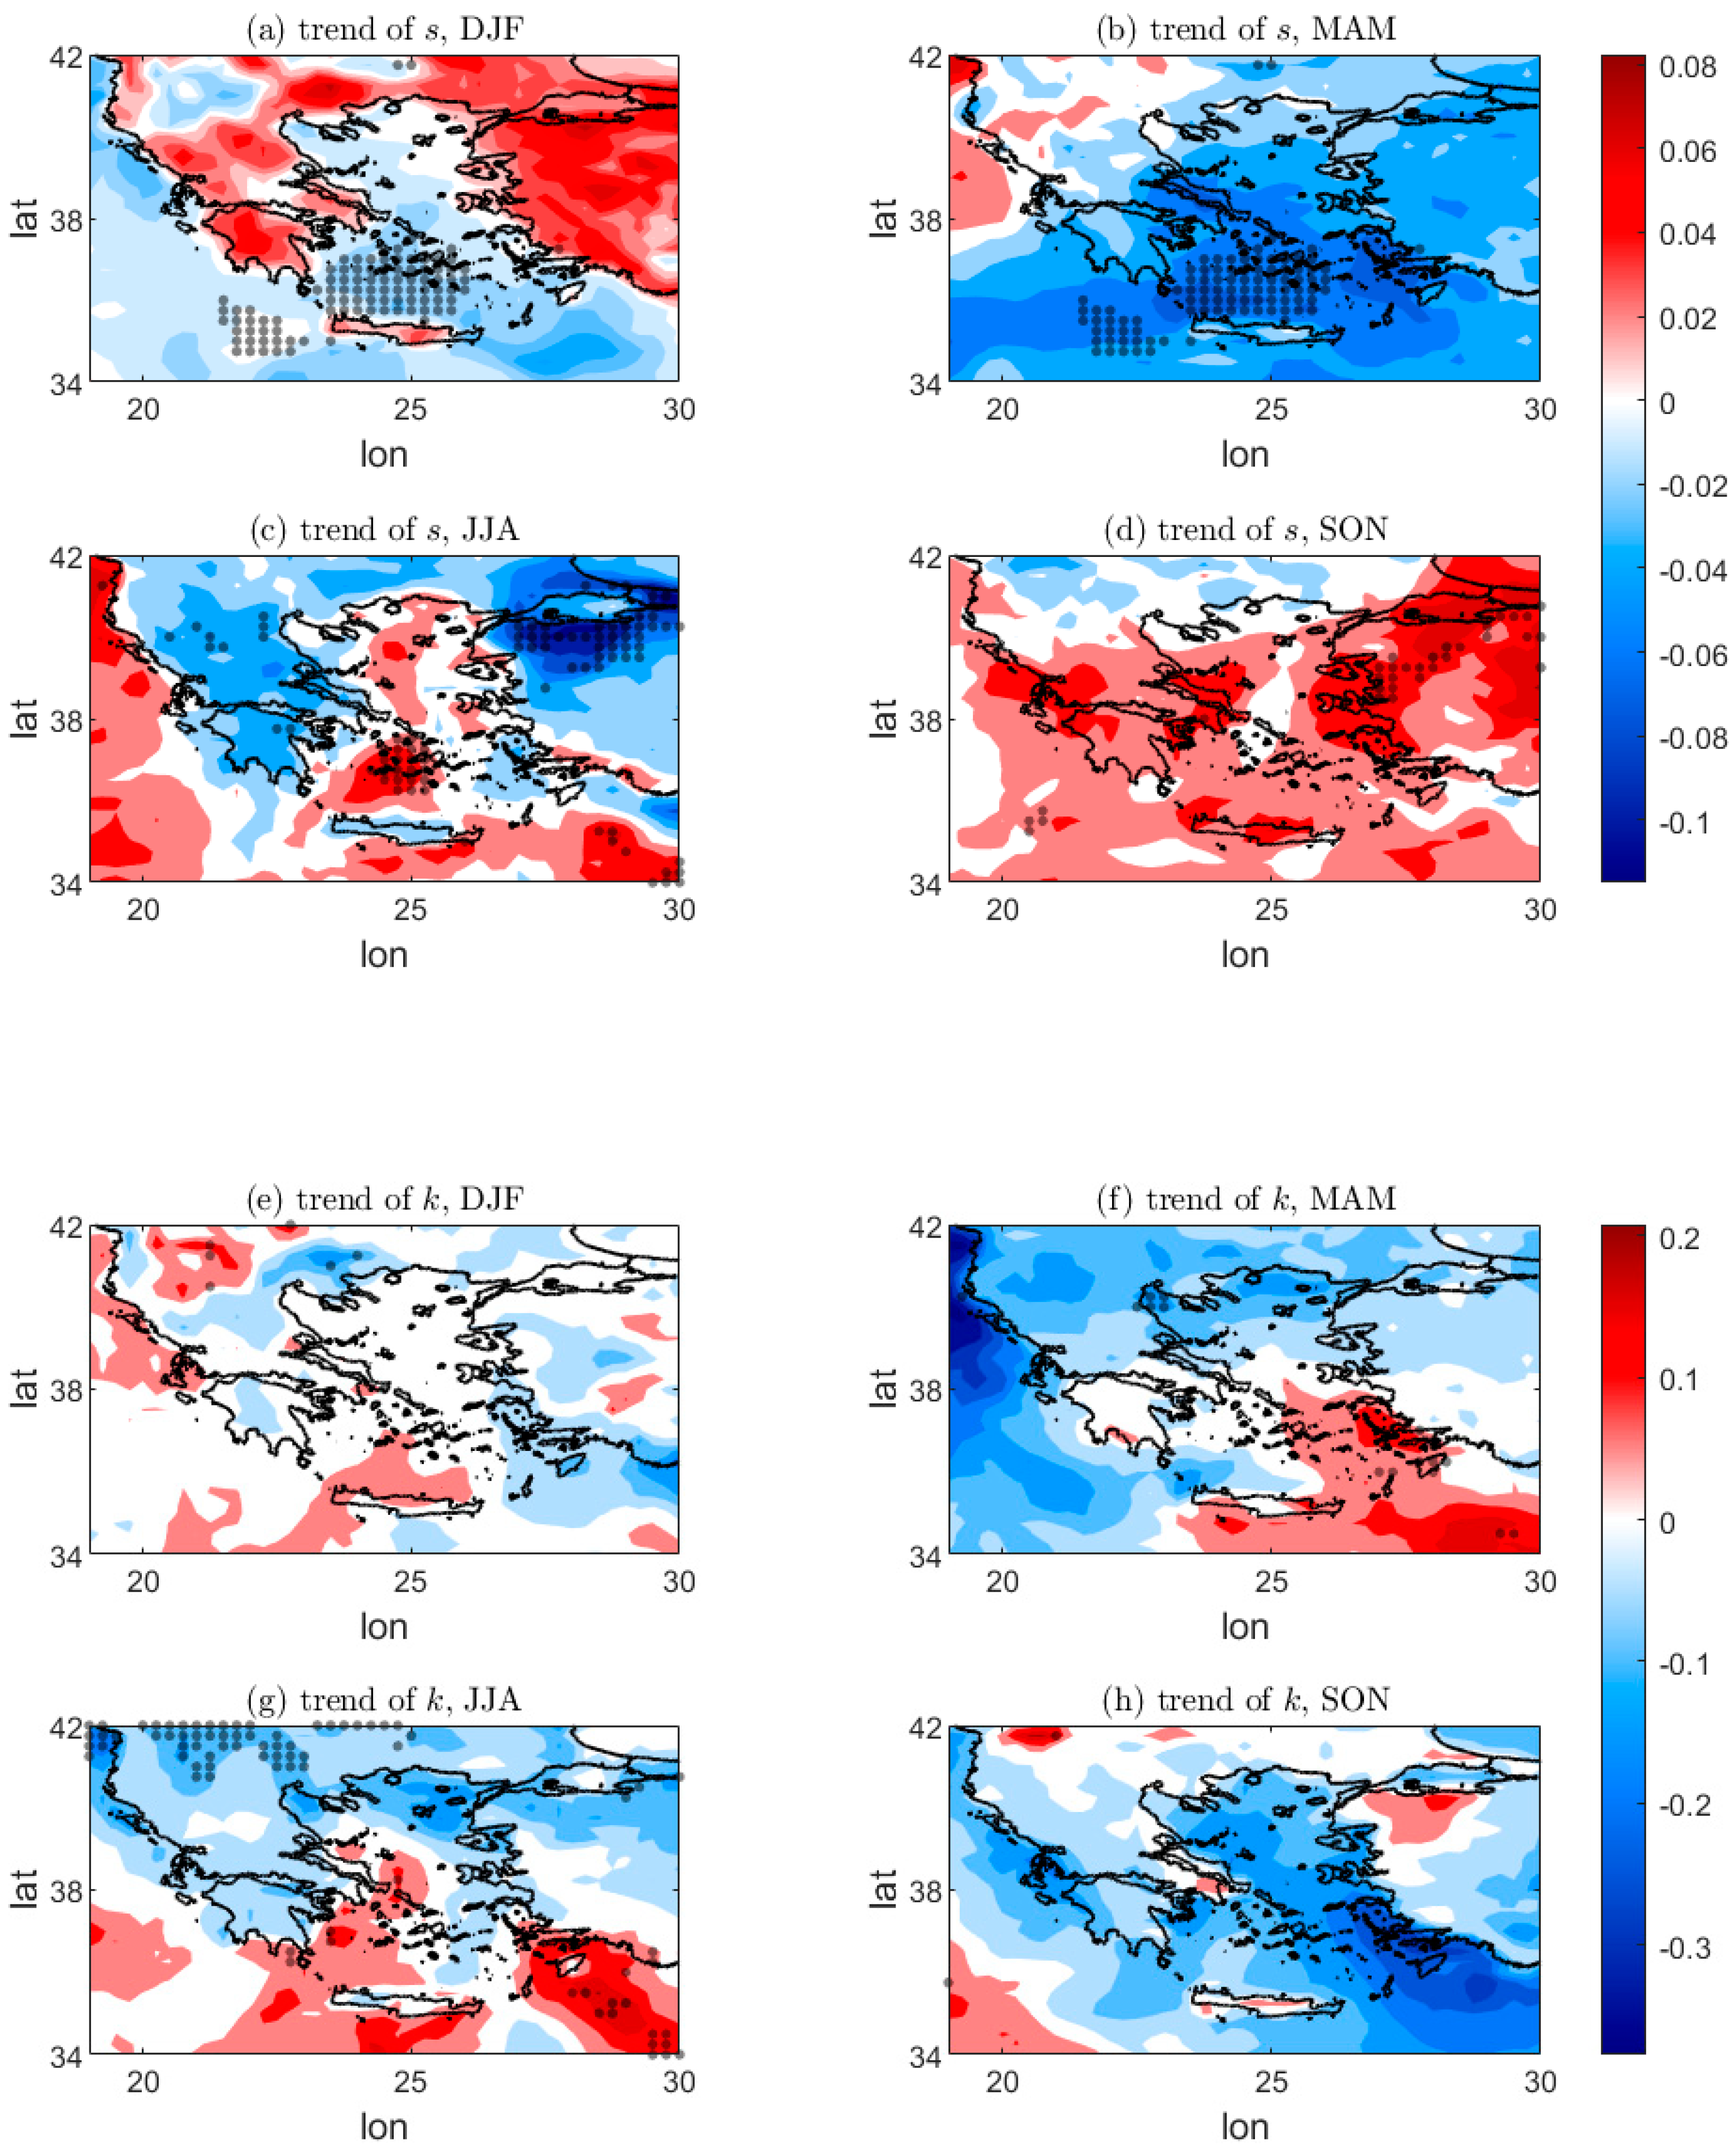
The corresponding trends of skewness and kurtosis are shown in Figure 5. The trends of skewness are both positive and negative (Figure 5a–d). Positive trends in the range of 0.05 to 0.1 per decade occur in the Aegean and the Ionian Sea during summer and fall. In the same regions, there is a low negative trend in winter and a high, statistically significant negative trend in spring, reaching minimum values of −0.08 per decade. The northern parts of mainland Greece exhibit nearly zero trend in spring and fall, while during winter and summer, the trend is positive and negative, respectively. In Central Greece and the Peloponnese, the trend is negative in spring and summer and positive in winter and fall.
Figure 5.
The trend of skewness (a–d) and kurtosis (e–h) for the four seasons. The grid points with statistically significant trends are shown by dots.
Finally, there is a general negative trend for excess kurtosis across the region and for all seasons, which is not statistically significant. In most areas, kurtosis decreases by 0.05 per decade (Figure 5e–h). Exceptions are a much more rapid decrease of the order of 0.4 per decade in the Ionian Sea during spring and in the Southern Aegean Sea during fall as well as a strong increase of the order of 0.2 per decade in Southern Aegean Sea observed during spring and summer.
4. The Influence of Changes in the Higher Statistical Moments on Extreme Events
4.1. Climatology of the 5th and 95th Percentiles
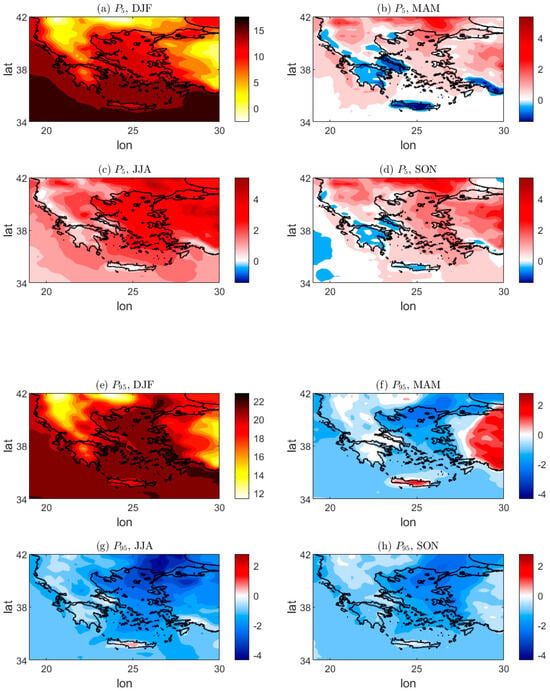
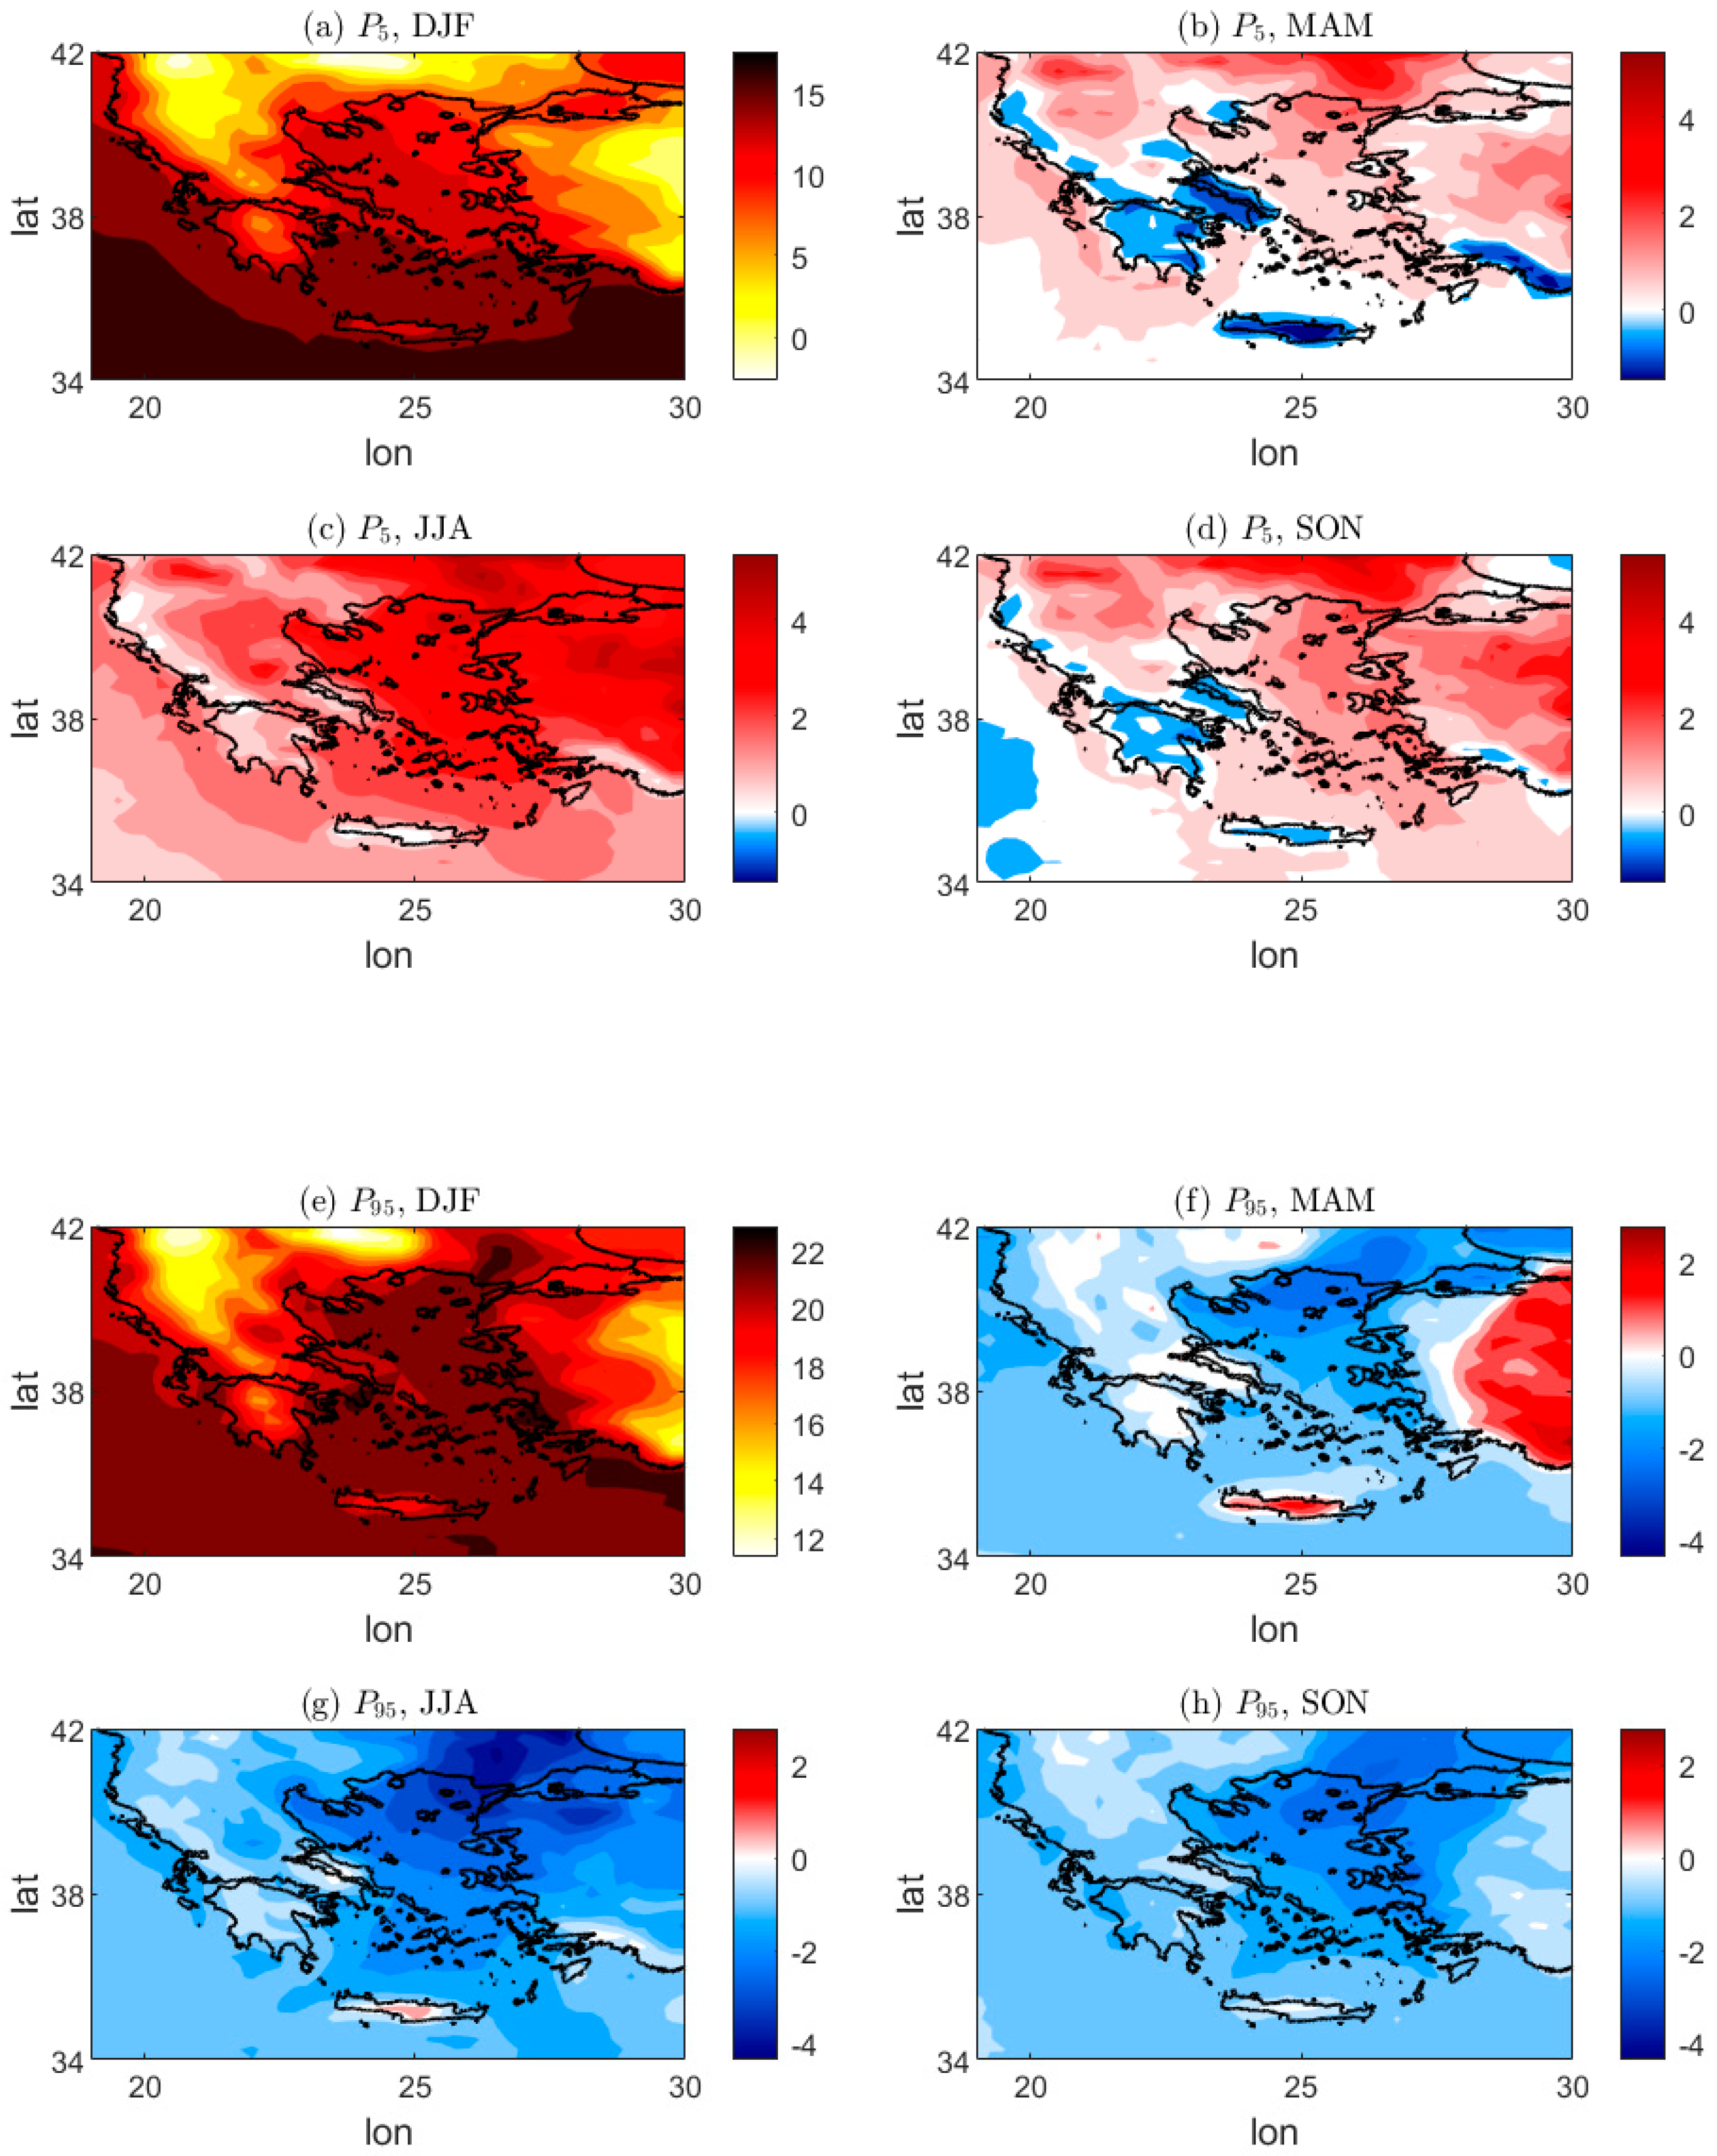
The 5th and 95th percentiles for each season and for the reference period are shown in Figure 6. The percentiles differ seasonally even though the mean presents no seasonal differences. The reason is that the shape of the distribution differs seasonally as reflected in the relevant differences of the higher-order statistical moments (cf. Figure 2 and Figure 3).
Figure 6.
The 5th (a–d) and the 95th percentiles (e–h) of the temperature distribution for the four seasons of the reference (1944–1953) decade in °C. Note that because of the small seasonal differences in the percentiles, panels (b–d) and (f–h) show the difference of the percentiles for the three seasons relative to the winter months.
However, the spatial differences in the percentiles across seasons are small relative to their magnitude. Therefore, the percentiles for winter months were plotted as a reference, and for the other three seasons, the differences in the percentiles relative to winter months are shown. Both the 5th and the 95th percentiles follow the spatial pattern of the temperature within these areas. The 5th percentile during the winter months (Figure 6a) reaches the maximum value of 16 °C over the South Aegean and the minimum value of −0.5 °C over Northern Macedonia. For the other seasons (Figure 6b–d), differences of the order of one to two degrees are observed over most of the region. Larger values occur over the Aegean Sea and Western Turkey with maximum values of up to 5 °C higher than the winter months observed during summer. There are also negative differences of the order of one degree in Crete, Attica and the Peloponnese during spring and fall.
The 95th percentile during the winter months (Figure 6e) reaches the maximum value of 22 °C over the South Aegean and the minimum value of 12 °C along the Pindus Mountains in Epirus. For the other seasons, lower values of the order of one to two degrees occur over most of the region. Smaller values occur over the Aegean Sea and Thrace with minimum values of up to 4 °C lower than the winter months observed during summer. There are also positive differences of the order of two degrees in Crete and Turkey during spring.
4.2. Trends of the Percentiles and the Influence of Changes in Higher Statistical Moments
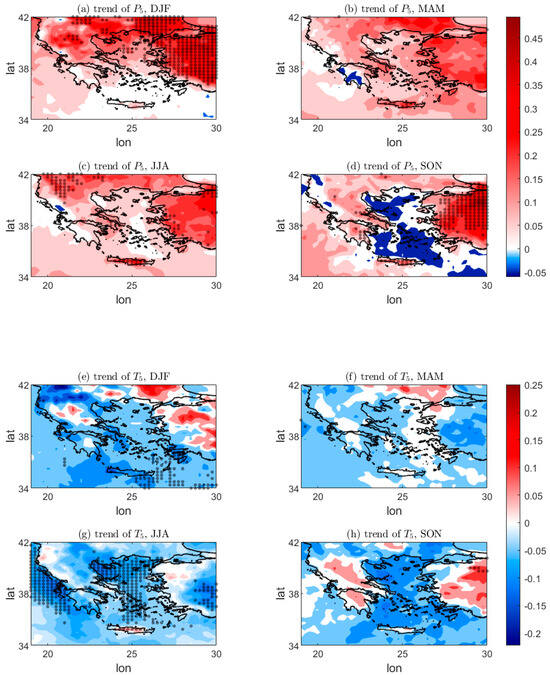
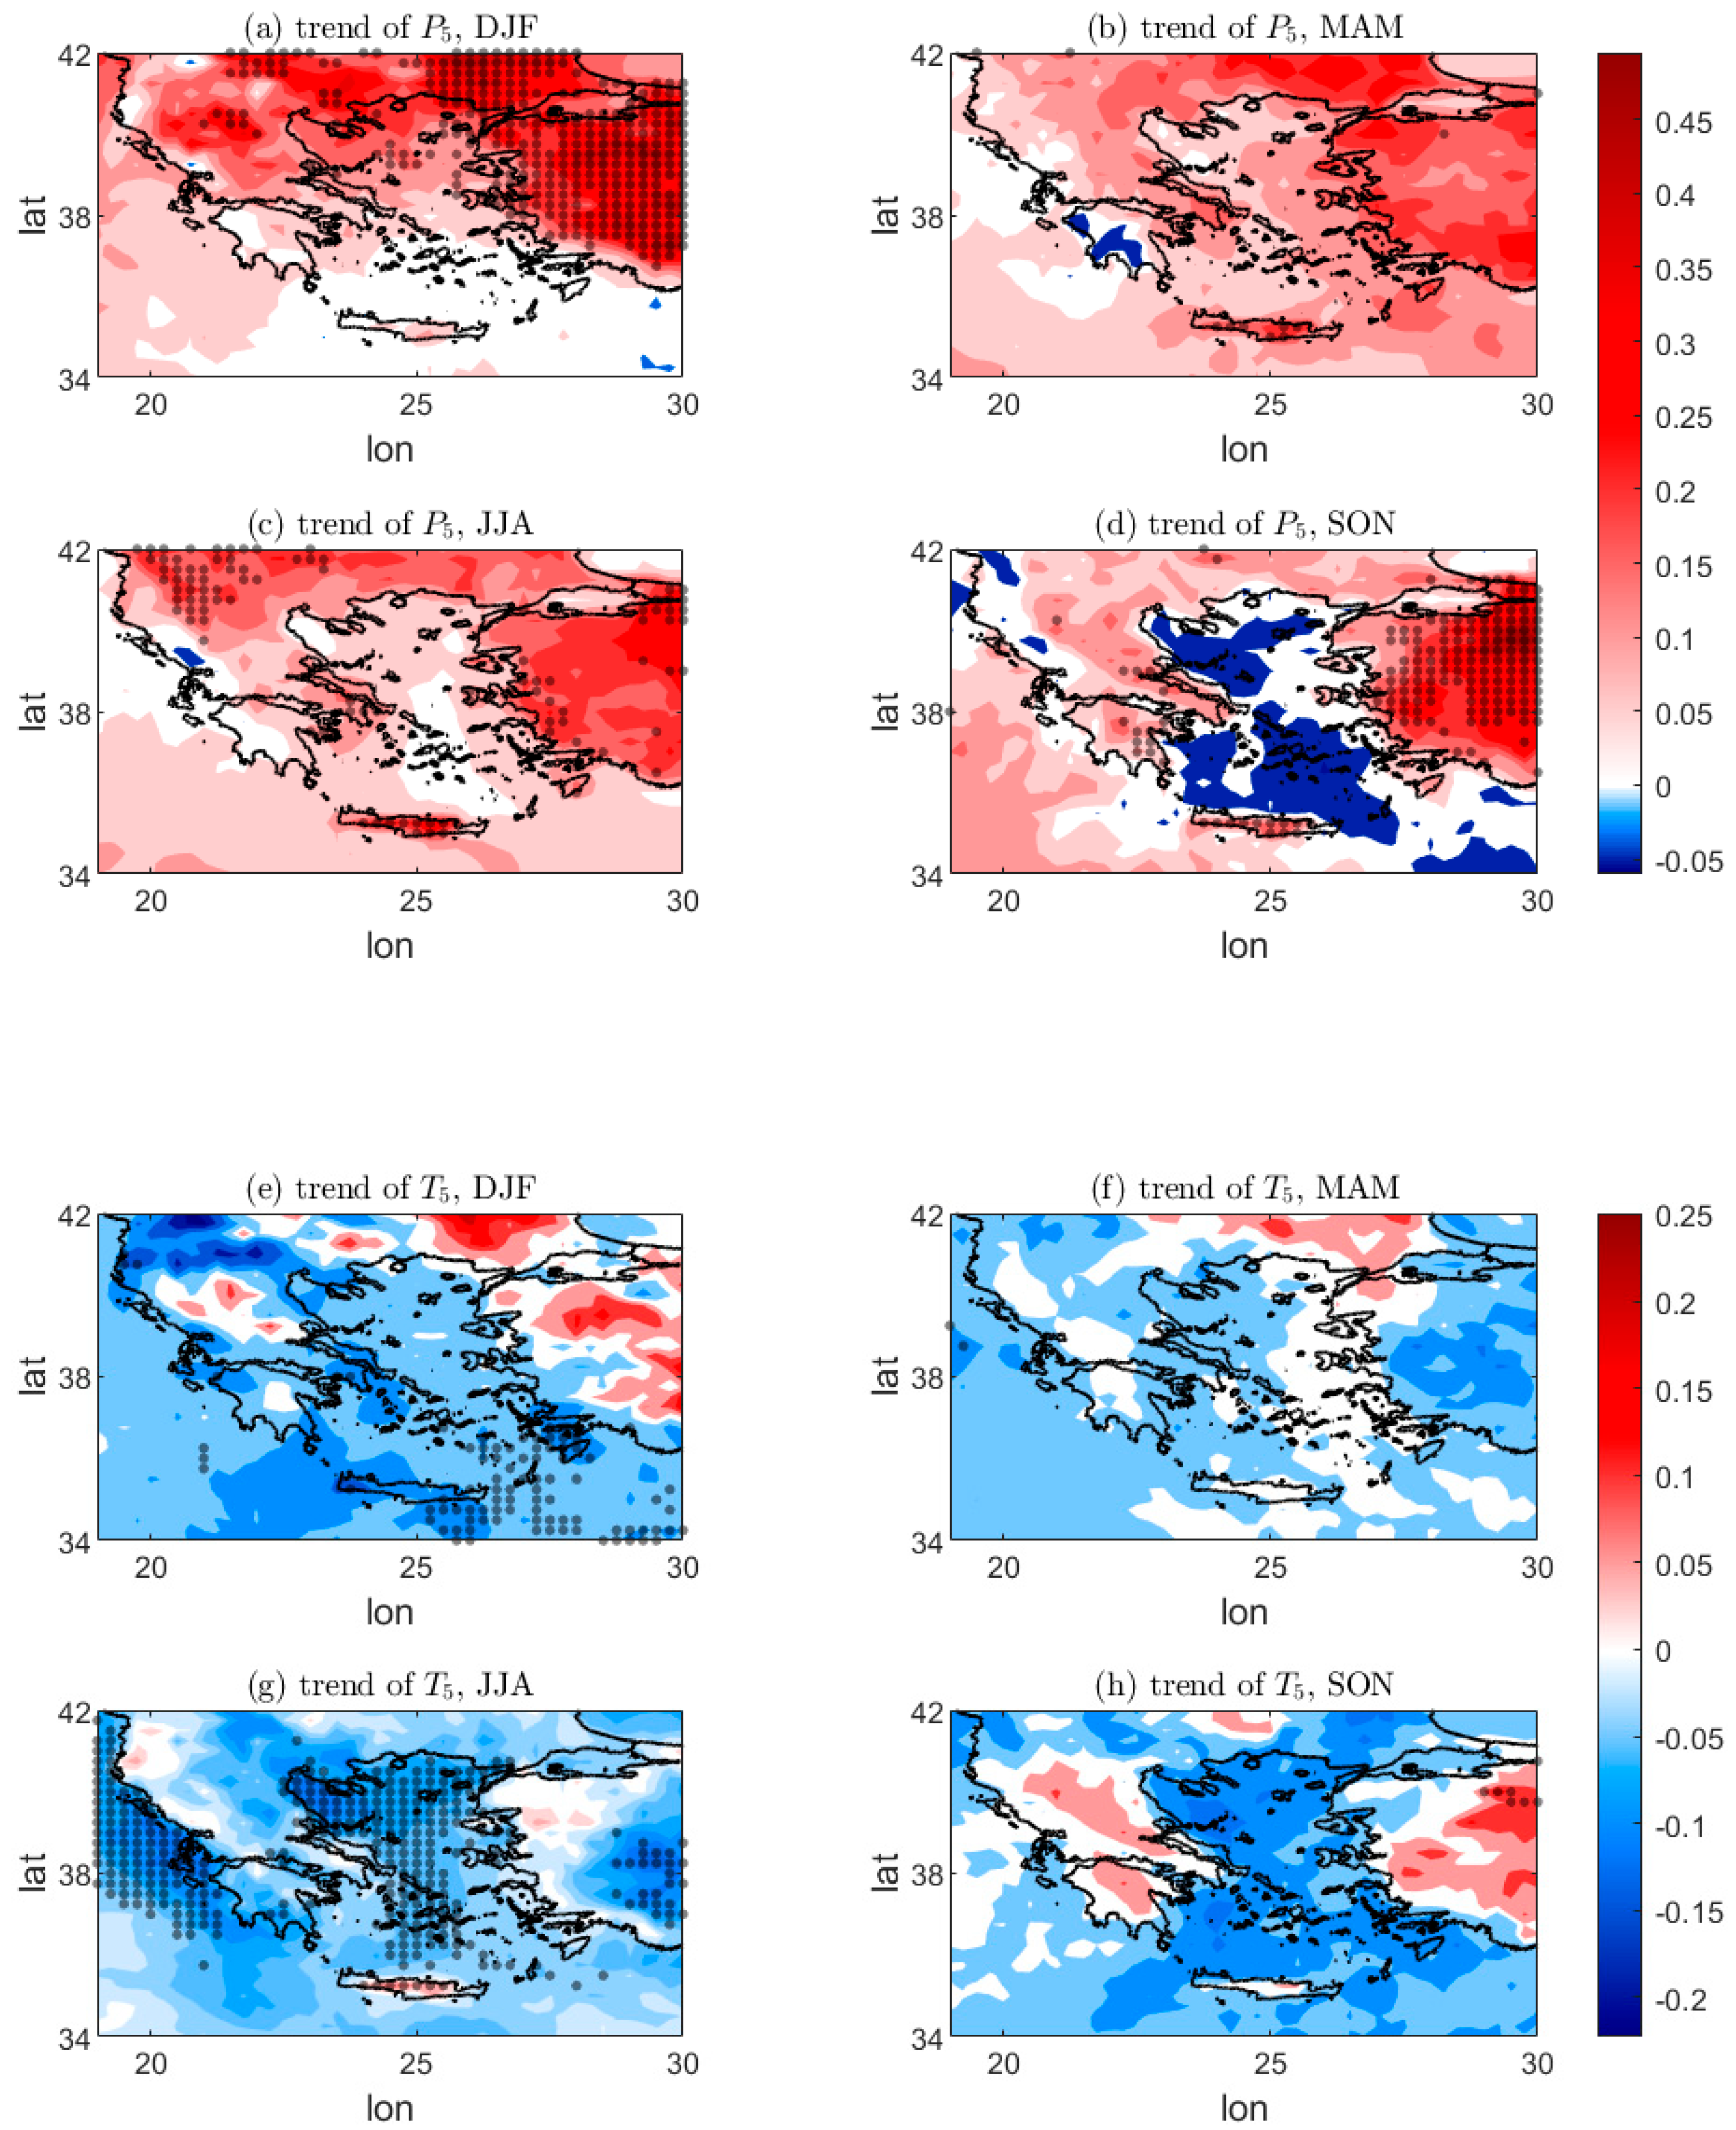
The linear trends of the 5th percentile () as well as the trends relevant to the mean () in each season are shown in Figure 7. During winter, there is a nearly zero trend for the 5th percentile in Southern Aegean and in the west coasts of Greece and a weak positive trend of 0.1 °C in parts of Central Greece (Figure 7a). This means that the threshold for extreme cold events relative to the winter climatology has not changed significantly. The contribution of the changes in the higher-order statistical moments that are quantified by the trend relevant to the mean is negative in the same areas (Figure 7e) and originates from the increased variance over Western Greece and the decreased skewness over the sea (Figure 4e and Figure 5a). As a result, the effect of this negative trend counteracts the effect of the weak warming of these areas (Figure 4a), yielding a small change in the 5th percentile. The mountainous regions in Central and Northern Greece, Northeastern Greece as well as Turkey exhibit a strong positive trend of 0.3–0.5 °C per decade that is statistically significant. This means that the temperature threshold for extreme cold events has increased by up to 4 °C over the last 80 years. The trend of the relative percentile (Figure 7e) reveals that about half of this trend is attributed to changes in higher statistical moments and more specifically to the effect of the decrease in variance and kurtosis (Figure 4e and Figure 5e) as well as the increase in skewness (Figure 5a), which combine additively to increase the percentile. The same pattern is also observed during autumn with the exceptions that first, the Aegean Sea exhibits a negative overall trend due to the contribution of the higher-order statistical moments; and second, that the positive trend in Northern Greece is reduced.
Figure 7.
The trend of the 5th percentile (a–d) and the trend of the percentile relative to the mean (e–h) for the four seasons in degrees per decade. The grid points with statistically significant trends are shown by dots.
During spring and summer, there is a positive trend for the 5th percentile across the region with lower values of the order of 0.1 °C per decade in South and Central Greece and larger values in the range 0.3–0.5 °C per decade in Northern Greece and Turkey, with the larger trends being statistically significant (Figure 7b,c). The contribution of the changes in the higher-order statistical moments is negative. In spring, the negative trend produced by the decreasing skewness overcomes the positive trend induced by the decrease in variance and kurtosis (Figure 4f and Figure 5b,f), leading to an overall negative trend (Figure 7f). The same trends hold for mainland Greece during summer, whereas in the Aegean and Ionian Sea, the opposite balance holds: the decrease in variance and kurtosis produce a negative trend that overcomes the positive trend induced by the increasing skewness, leading again to a net negative trend.
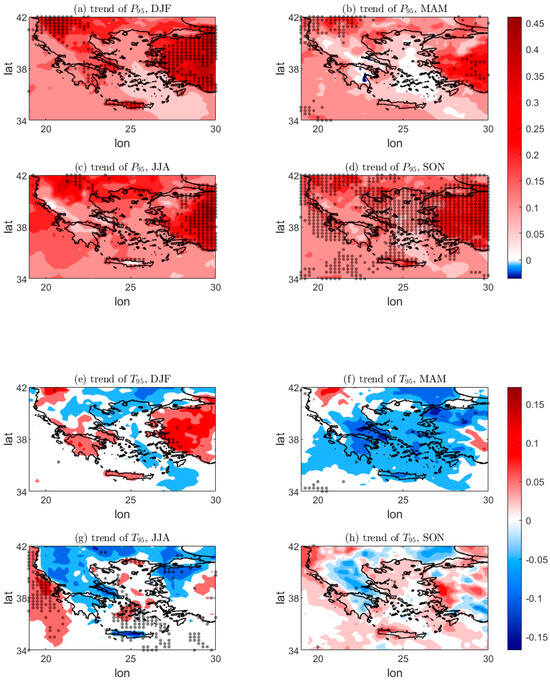
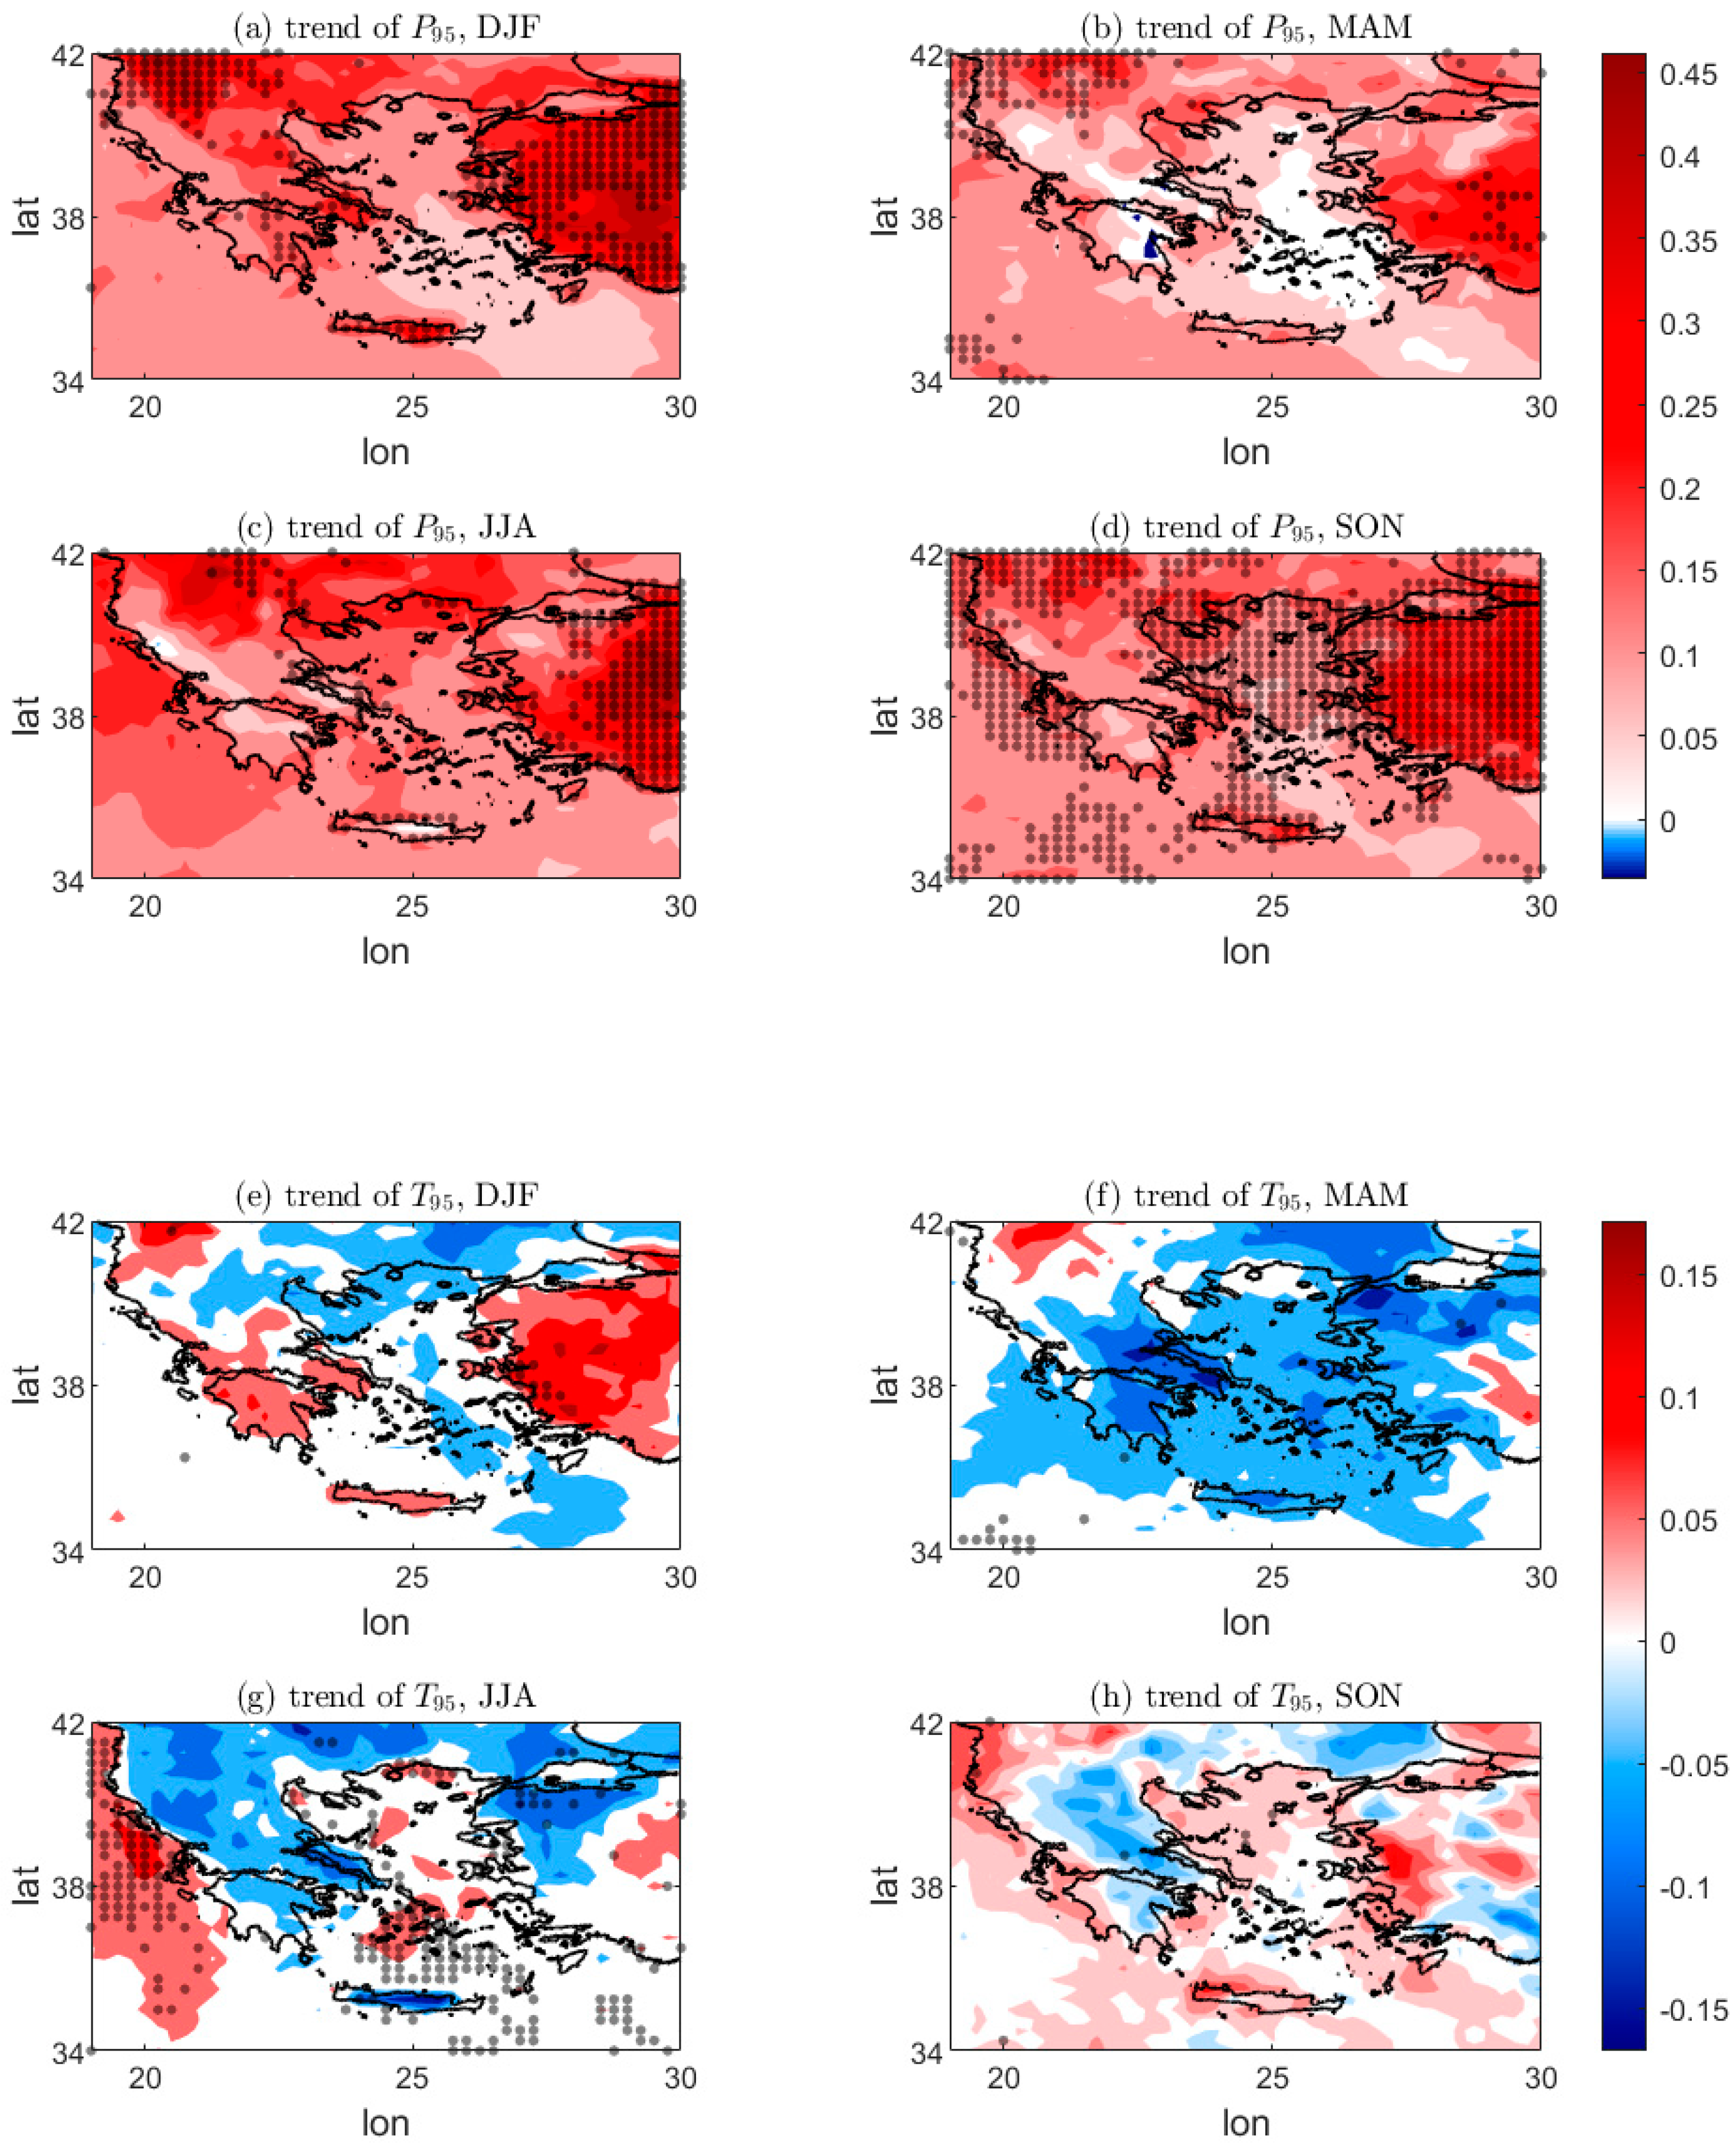
The linear trends of the 95th percentile () and the corresponding trends relevant to the mean () in each season are shown in Figure 8. The trends of the 95th percentile are positive across the region and for all seasons. In the Aegean Sea as well as in the western and southern parts of mainland Greece, the trend is of the order of 0.15 °C per decade with slightly lower values in spring. In the rest of the region, the trend of the 95th percentile is larger in the range of 0.25–0.45 °C per decade and is also statistically significant. As a result, the threshold for extreme hot events has increased by 1 °C to 4 °C over the last 80 years.
Figure 8.
The trend of the 95th percentile (a–d) and the trend of the percentile relative to the mean (e–h) for the four seasons in degrees per decade. The grid points with statistically significant trends are shown by dots.
The contribution of the changes in the higher-order statistical moments depends on the season. In winter, there is a nearly zero trend in the relative percentile due to the weak trends of the statistical moments except from five areas (Figure 8e). The first is Northeastern Greece, in which there is a negative trend of the order of −0.1 °C per decade that is due to the decrease in variance in this region (Figure 4e). The second, third and fourth are the areas of Attica, Peloponnese and Crete, in which the 95th percentile increases by 0.1 °C per decade due to the increase in both variance and skewness (Figure 4e and Figure 5a). The fourth is Western Turkey, exhibiting a trend of 0.1 °C per decade as the increase in skewness overcomes the decrease in variance in the area. As a result, in these areas a sizeable part of the trend of the 95th percentile can be attributed to changes in the higher-order statistical moments. In the rest of the region, the increase in the 95th percentile is solely due to the observed shift in the mean.
In spring, the trend of the relative percentile is negative across the region, reaching the minimum value of −0.1 °C per decade in Central Greece and the Peloponnese (Figure 8f). This is caused mainly by the decrease in both variance and skewness across the region (Figure 4f and Figure 5b) that cancel the effect of the increasing mean and lead to the lower overall values of the trend of the 95th percentile.
During summer, the Aegean and Ionian seas exhibit a statistically significant positive trend of the relative percentile (Figure 8g). This is caused by the increases in variance and skewness over the marine areas as well as the statistically significant increase in kurtosis in Southeastern Aegean Sea (Figure 4g and Figure 5c,g). In most parts of mainland Greece, there is a negative trend caused by the decreasing variance, skewness and kurtosis (Figure 4g and Figure 5c,g). As a result, almost half of the observed overall trend of the 95th percentile in the Aegean and Ionian seas is attributed to changes in higher-order statistical moments, while the stronger trend over Northern Greece and Turkey is due to the increase in the mean temperature.
Finally, during fall there is a weak positive trend over most of the Aegean and the Ionian seas and slightly negative values in most areas of mainland Greece (Figure 8h). This is caused by the increase in both skewness and variance over the seas that offset any tendency caused by the decreasing kurtosis and the decrease in variance that overcomes the effect of the increasing skewness in mainland Greece (Figure 4h and Figure 5d,h). The result is an enhancement of the effect of the shift of the distribution on the positive trend of the 95th percentile in the Aegean and the Ionian seas and a reduction in the effect over mainland Greece.
5. Discussion
The main findings in this study are now discussed in relevance to results in the literature and in relevance to possible physical drivers of the observed changes. Regarding the climatological values of the statistical moments of the temperature distribution for the reference period, the mean temperature exhibits a climatological meridional gradient as well as a land–sea gradient in agreement with previous studies [38]. Temperature variability was found to have the same spatial pattern for all seasons with maximum values of variance during winter and minimum during summer. This reflects the seasonal variability of weather systems. During the cold period of the year, a significant number of cyclones forming over the Central and Northern Mediterranean Sea affect Greece, causing stronger variability in temperature compared with the warm period [47,48]. In addition, an asymmetry towards more cold events (negative skewness) was observed across all seasons, with a few exceptions over areas in the south of the marine areas during spring. These exceptions are probably related to warm intrusions brought by Saharan depressions that reach a peak during this season [48,54]. The kurtosis of the distribution describing the length of the tails of the temperature distribution was estimated to be close to the kurtosis of a normal distribution over land areas, with positive and negative exceedance over areas in the Aegean and Ionian seas that differ with season. While outside the scope of this work, the values of skewness and kurtosis appear to be qualitatively compatible with the quadratic relationship proposed by Tamarin et al. [53], as the small (large) values of skewness during the warm (cold) period of the year are associated with small (large) values of excess kurtosis.
Regarding the trends in the moments, the mean temperature was shown to increase across the region with Northern Greece and Western Turkey, warming more rapidly and with warming being more prominent during summer. This result agrees with previous studies using data from weather stations in Greece for a similar period [35] and the ERA-5 Land dataset covering the last 30 years [38]. Variance and skewness were seen to exhibit mixed positive and negative trends that depend on the region and the season.
These long-term changes affect the temperature extremes. The trend of the 5th percentile, representing the threshold for extreme cold events, was found to be positive over Northern Greece and Western Turkey, with lower values being observed over the rest of mainland Greece as well as the Aegean and Ionian seas. The positive trend during the cold season is consistent with the decrease in frost days in the mountainous regions of Northern Greece [38] and the statistically significant declining trends in snow depth and duration of snow cover across much of the country [55]. It also has the largest value among seasons as the effect of the increasing mean temperature is amplified by the long-term changes in the higher-order statistical moments. This amplification is related to changes in the synoptic conditions governing the temperature variability. It has been shown that extreme cold winters in Greece are caused by northerly flow over the South Balkans bringing cold air masses in the region. This flow is associated with synoptic conditions characterized by a cut-off low over the Eastern Balkans in the upper atmosphere accompanied by a low over the Cyprus region at the surface [56,57]. The frequency of occurrence of this weather type has decreased in recent years [43], leading to the increase in skewness and variance observed in this study and to the large trend of the 5th percentile. Similar contributions of the changes in temperature variability to the trend of the 5th percentile also occur in the fall. This is probably related to changes in synoptic conditions over the area, as extreme cold events were shown to occur due to a similar weather type discussed for winter, and the frequency of occurrence for this weather type has also decreased [43].
Similarly, the trend of the 95th percentile, representing the threshold for extreme warm events, was found to be positive for all seasons with small regional exceptions. During summer, this has led to a larger number and more severe heat waves in parts of Greece [34,37], causing thermal discomfort [58] and enhancing pollution in urban environments [59]. During summer and winter, the positive trend was found to be the result of both the rising mean and the changes in the temperature variability. As with the 5th percentile, these changes have a synoptic origin. Previous studies have shown that extreme warm events during winter are driven by the northeastward displacement of the Atlantic subtropical high [60], with this circulation pattern becoming more frequent in recent years [43]. During summer, there are two relevant circulation patterns involved. The first pattern is the northern Etesian winds that typically cool the Aegean, with their frequency and intensity having been reduced in the last decades [61]. The second pattern is a southern flow towards the Ionian Sea caused by the high geopotential height values over Europe and the SW Asia thermal law. This circulation advecting warm air masses towards the Ionian Sea has become more frequent in the last 40 years [43].
6. Conclusions
In this study, long-term changes in the mean, variance, skewness and kurtosis of the distribution of 2 m temperature in Greece relative to the reference period (1944–1953) was investigated using the ERA-5 dataset. The influence of the long-term changes of the moments in extreme events was also addressed. Beyond the well-documented increase in mean temperature that is larger in the northern parts of the region, spatiotemporal variations in the higher-order statistical moments of the distribution were also identified, including changes in variance, skewness and, to a lesser extent, kurtosis. These changes were shown to depend strongly on both season and geographic location, highlighting the complex nature of regional climate variability. In most parts of central and northern mainland Greece, variance was found to decrease for all seasons, while skewness is characterized by a weak positive trend in winter and autumn and a weak negative trend in spring and summer. In the Aegean and Ionian seas, both variance and skewness were shown to increase during summer.
Temperature extremes were also found to change with a weakening of extreme cold events and an enhancement of extreme warm events across all seasons, as exemplified by the increase in both the 5th and the 95th percentile of the temperature distribution. It was demonstrated that these changes in the temperature extremes cannot be interpreted solely as a direct consequence of mean warming. Instead, changes in the shape of the temperature distribution were found to play a key role in modulating the response of both cold and warm extremes. In particular, extreme cold events were shown to weaken more rapidly than expected from mean warming alone in mountainous and northern regions, especially during winter and autumn. Conversely, in marine areas, extreme warm events during summer and autumn were found to intensify beyond what would be predicted by a simple shift of the mean. For the other seasons, and in all other areas in Greece, changes in higher-order moments acted to partially offset the effect of warming, leading to weaker-than-expected trends in extremes.
These findings highlight that the response of temperature extremes to climate change is inherently non-linear and regionally heterogeneous, arising from the combined influence of shifts in the mean state and modifications in temperature variability. The results further suggest that changes in atmospheric circulation and synoptic-scale processes, which influence the statistical structure of temperature, may play a crucial role in shaping future extremes.
Author Contributions
Conceptualization, N.A.B.; methodology, N.A.B.; software, A.L.; validation, A.L.; formal analysis, A.L. and N.A.B.; investigation, A.L. and N.A.B.; writing—original draft preparation, A.L. and N.A.B.; writing—review and editing, A.L. and N.A.B.; visualization, A.L.; supervision, N.A.B. All authors have read and agreed to the published version of the manuscript.
Funding
This research received no external funding.
Institutional Review Board Statement
Not applicable.
Informed Consent Statement
Not applicable.
Data Availability Statement
The ERA5 dataset used in this study is publicly available at: https://cds.climate.copernicus.eu/datasets/reanalysis-era5-single-levels?tab=overview (accessed on 1 November 2024).
Acknowledgments
The results contain modified Copernicus Climate Change Service information (2024). Neither the European Commission nor ECMWF is responsible for any use that may be made of the Copernicus information or of the data it contains.
Conflicts of Interest
The authors declare no conflicts of interest.
Abbreviations
The following abbreviations are used in this manuscript:
| GCM | General Circulation Model |
| ECMWF | European Center for Medium-Range Weather Forecasts |
| ERA-5 | ECMWF reanalysis dataset version 5 |
| DJF | December, January, February |
| MAM | March, April, May |
| JJA | June, July, August |
| SON | September, October, November |
References
- Lawrimore, J.H.; Menne, M.J.; Gleason, B.E.; Williams, C.N.; Wuertz, D.B.; Vose, R.S.; Rennie, J. An overview of the Global Historical Climatology Network monthly mean temperature data set, version 3. J. Geophys. Res. 2011, 116, D19121. [Google Scholar] [CrossRef] [Scilit]
- Chan, D.; Gebbie, G.; Huybers, P. An improved ensemble of land surface air temperatures since 1880 using revised pair-wise homogenization algorithms accounting for autocorrelation. J. Clim. 2024, 37, 2325–2345. [Google Scholar] [CrossRef] [Scilit]
- Evin, G.; Ribes, A.; Corre, L. Assessing CMIP6 uncertainties at global warming levels. Clim. Dyn. 2024, 62, 8057–8072. [Google Scholar] [CrossRef] [Scilit]
- Scafetta, N. Impacts and risks of “realistic” global warming projections for the 21st century. Geosci. Front. 2024, 15, 101774. [Google Scholar] [CrossRef] [Scilit]
- Alexander, L.V.; Zhang, X.; Peterson, T.C.; Caesar, J.; Gleason, B.; Klein Tank, A.M.G.; Haylock, M.; Collins, D.; Trewin, B.; Rahimzadeh, F.; et al. Global observed changes in daily climate extremes of temperature and precipitation. J. Geophys. Res. 2006, 111, D05109. [Google Scholar] [CrossRef] [Scilit]
- Fischer, E.M.; Schär, C. Future changes in daily summer temperature variability: Driving processes and role for temperature extremes. Clim. Dyn. 2009, 33, 917–935. [Google Scholar] [CrossRef] [Scilit]
- Coumou, D.; Robinson, A. Historic and future increase in the global land area affected by monthly heat extremes. Environ. Res. Lett. 2013, 8, 034018. [Google Scholar] [CrossRef] [Scilit]
- Huntingford, C.; Jones, P.; Livina, V.; Lenton, T.M.; Cox, P.M. No increase in global temperature variability despite changing regional patterns. Nature 2013, 500, 327–330. [Google Scholar] [CrossRef] [Scilit] [PubMed]
- Holmes, C.R.; Woollings, T.; Hawkins, E.; de Vries, H. Robust future changes in temperature variability under greenhouse gas forcing and the relationship with thermal advection. J. Clim. 2016, 29, 2221–2236. [Google Scholar] [CrossRef] [Scilit]
- Meehl, G.A.; Tebaldi, C. More intense, more frequent, and longer lasting heat waves in the 21st century. Science 2004, 305, 994–997. [Google Scholar] [CrossRef] [Scilit]
- Tebaldi, C.; Hayhoe, K.; Arblaster, J.M.; Meehl, G.A. Going to the extremes: An intercomparison of model-simulated historical and future changes in extreme events. Clim. Change 2006, 79, 185–211. [Google Scholar] [CrossRef] [Scilit]
- Simolo, C.; Brunetti, M.; Maugeri, M.; Nanni, T. Evolution of extreme temperatures in a warming climate. Geophys. Res. Lett. 2011, 38, L16701. [Google Scholar] [CrossRef] [Scilit]
- Griffiths, G.M.; Chambers, L.E.; Haylock, M.R.; Manton, M.J.; Nicholls, N.; Baek, H.-J.; Choi, Y.; Della-Marta, P.M.; Gosai, A.; Iga, N.; et al. Change in mean temperature as a predictor of extreme temperature change in the Asia–Pacific region. Int. J. Climatol. 2005, 25, 1301–1330. [Google Scholar] [CrossRef] [Scilit]
- Huybers, P.; McKinnon, K.A.; Rhines, A.; Tingley, M. U.S. daily temperatures: The meaning of extremes in the context of nonnormality. J. Clim. 2014, 27, 7368–7384. [Google Scholar] [CrossRef] [Scilit]
- Schär, C.; Vidale, P.L.; Lüthi, D.; Frei, C.; Häberli, C.; Liniger, M.A.; Appenzeller, C. The role of increasing temperature variability in European summer heatwaves. Nature 2004, 427, 332–336. [Google Scholar] [CrossRef] [Scilit]
- Barriopedro, D.; Fischer, E.; Luterbacher, J.; Trigo, R.; García-Herrera, R. The hot summer of 2010: Redrawing the temperature record map of Europe. Science 2011, 332, 220–224. [Google Scholar] [CrossRef] [Scilit] [PubMed]
- Donat, M.G.; Alexander, L.V. The shifting probability distribution of global daytime and night-time temperatures. Geophys. Res. Lett. 2012, 39, L14707. [Google Scholar] [CrossRef] [Scilit]
- Hansen, J.; Sato, M.; Ruedy, R. Perception of climate change. Proc. Natl. Acad. Sci. USA 2012, 109, E2415–E2423. [Google Scholar] [CrossRef] [Scilit]
- Rhines, A.; Huybers, P. Frequent summer temperature extremes reflect changes in the mean, not the variance. Proc. Natl. Acad. Sci. USA 2013, 110, E546. [Google Scholar] [CrossRef] [Scilit]
- de Vries, H.; Haarsma, R.J.; Hazeleger, W. Western European cold spells in current and future climate. Geophys. Res. Lett. 2012, 39, L04706. [Google Scholar] [CrossRef] [Scilit]
- Screen, J.A.; Deser, C.; Sun, L. Reduced risk of North American cold extremes due to continued Arctic sea ice loss. Bull. Am. Meteorol. Soc. 2015, 96, 1489–1503. [Google Scholar] [CrossRef] [Scilit]
- Schneider, T.; Bischoff, T.; Płotka, H. Physics of changes in synoptic midlatitude temperature variability. J. Clim. 2015, 28, 2312–2331. [Google Scholar] [CrossRef] [Scilit]
- Hassanzadeh, P.; Kuang, Z.; Farrell, B.F. Responses of midlatitude blocks and wave amplitude to changes in the meridional temperature gradient in an idealized dry GCM. Geophys. Res. Lett. 2014, 41, 5223–5232. [Google Scholar] [CrossRef] [Scilit]
- Shen, S.S.P.; Gurung, A.B.; Oh, H.-S.; Shu, T.; Easterling, D.R. The Twentieth Century Contiguous US Temperature Changes Indicated by Daily Data and Higher Statistical Moments. Clim. Change 2011, 109, 287–317. [Google Scholar] [CrossRef] [Scilit]
- Ruff, T.W.; Neelin, J.D. Long tails in regional surface temperature probability distributions with implications for extremes under global warming. Geophys. Res. Lett. 2012, 39, L04704. [Google Scholar] [CrossRef] [Scilit]
- Loikith, P.C.; Broccoli, A.J. Characteristics of observed atmospheric circulation patterns associated with temperature extremes over North America. J. Clim. 2012, 25, 7266–7281. [Google Scholar] [CrossRef] [Scilit]
- Petoukhov, V.; Eliseev, A.V.; Klein, R.; Oesterle, H. On statistics of the free-troposphere synoptic component: An evaluation of skewnesses and mixed third-order moments contribution to the synoptic-scale dynamics and fluxes of heat and humidity. Tellus A 2008, 60, 11–31. [Google Scholar] [CrossRef] [Scilit]
- Perron, M.; Sura, P. Climatology of Non-Gaussian Atmospheric Statistics. J. Clim. 2013, 26, 1063–1083. [Google Scholar] [CrossRef] [Scilit]
- Gao, Y.; Leung, L.R.; Lu, J.; Masato, G. Persistent cold air outbreaks over North America in a warming climate. Environ. Res. Lett. 2015, 10, 044001. [Google Scholar] [CrossRef] [Scilit]
- Gao, Y.; Wu, Y.; Guo, X.; Kou, W.; Zhang, S.; Leung, L.R.; Chen, X.; Lu, J.; Diffenbaugh, N.S.; Horton, D.E.; et al. More frequent and persistent heatwaves due to increased temperature skewness projected by a high-resolution Earth System Model. Geophys. Res. Lett. 2023, 50, e2023GL105840. [Google Scholar] [CrossRef] [Scilit]
- Giorgi, F. Climate change hot-spots. Geophys. Res. Lett. 2006, 33, L08707. [Google Scholar] [CrossRef] [Scilit]
- Cook, B.I.; Anchukaitis, K.J.; Touchan, R.; Meko, D.M.; Cook, E.R. Spatiotemporal drought variability in the Mediterranean over the last 900 years. J. Geophys. Res. Atmos. 2016, 121, 2060–2074. [Google Scholar] [CrossRef] [Scilit] [PubMed]
- Lelieveld, J.; Hadjinicolaou, P.; Kostopoulou, E.; Chenoweth, J.; El Maayar, M.; Giannakopoulos, C.; Hannides, C.; Lange, M.A.; Tanarhte, M.; Tyrlis, E.; et al. Climate change and impacts in the Eastern Mediterranean and the Middle East. Clim. Change 2012, 114, 667–687. [Google Scholar] [CrossRef] [Scilit]
- Founda, D.; Katavoutas, G.; Pierros, F.; Mihalopoulos, N. Centennial changes in heat waves characteristics in Athens (Greece) from multiple definitions based on climatic and bioclimatic indices. Glob. Planet. Change 2022, 212, 103807. [Google Scholar] [CrossRef] [Scilit]
- Mamara, A.; Argiriou, A.A.; Anadranistakis, M. Recent trend analysis of mean air temperature in Greece based on homogenized data. Theor. Appl. Climatol. 2016, 126, 543–573. [Google Scholar] [CrossRef] [Scilit]
- Tzanis, C.J.; Koutsogiannis, I.; Philipopoulos, K.; Deligiorgi, D. Recent climate trends over Greece. Atmos. Res. 2019, 223, 104623. [Google Scholar] [CrossRef] [Scilit]
- Galanaki, E.; Giannaros, C.; Kotroni, V.; Lagouvardos, K.; Papavasileiou, G. Spatio-temporal analysis of heatwave characteristics in Greece from 1950 to 2020. Climate 2023, 11, 5. [Google Scholar] [CrossRef] [Scilit]
- Lagouvardos, K.; Dafis, S.; Kotroni, V.; Kyros, G.; Giannaros, C. Exploring recent (1991–2020) trends of essential climate variables in Greece. Atmosphere 2024, 15, 1105. [Google Scholar] [CrossRef] [Scilit]
- Hersbach, H.; Bell, B.; Berrisford, P.; Hirahara, S.; Horányi, A.; Muñoz-Sabater, J.; Nicolas, J.; Peubey, C.; Radu, R.; Schepers, D.; et al. The ERA5 global reanalysis. Q. J. R. Meteorol. Soc. 2020, 146, 1999–2049. [Google Scholar] [CrossRef] [Scilit]
- Bonavita, M.; Hólm, E.; Isaksen, L.; Fisher, M. The Evolution of the ECMWF Hybrid Data Assimilation System. Q. J. R. Meteorol. Soc. 2016, 142, 287–303. [Google Scholar] [CrossRef] [Scilit]
- Soci, C.; Hersbach, H.; Simmons, A.; Poli, P.; Bell, B.; Berrisford, P.; Horányi, A.; Muñoz-Sabater, J.; Nicolas, J.; Radu, R.; et al. The ERA5 global reanalysis from 1940 to 2022. Q. J. R. Meteorol. Soc. 2024, 150, 4014–4048. [Google Scholar] [CrossRef] [Scilit]
- de Araújo, G.R.; Frassoni, A.G.; Sapucci, L.F.; Bitencourt, D.; de Brito Neto, F.A. Climatology of heatwaves in South America identified through ERA5 reanalysis data. Int. J. Climatol. 2022, 42, 9430–9448. [Google Scholar] [CrossRef] [Scilit]
- Lolis, C.J.; Kotsias, G.; Farmakidis, D. A 40-year climatology of air temperature extremes in the southern Balkans based on the ERA5 database. Theor. Appl. Climatol. 2022, 149, 355–377. [Google Scholar] [CrossRef] [Scilit]
- Andrade-Velázquez, M.; Montero-Martínez, M.J. Historical and projected trends of the mean surface temperature in South-Southeast Mexico using ERA5 and CMIP6. Climate 2023, 11, 111. [Google Scholar] [CrossRef] [Scilit]
- Molina, M.; Soares, P.; Lima, M.; Gaspar, T.H.; Lima, D.; Ramos, A.M.; Russo, A.; Trigo, R.M. Updated insights on climate change-driven temperature variability across historical and future periods. Clim. Change 2025, 178, 97. [Google Scholar] [CrossRef] [Scilit]
- Velikou, K.; Lazoglou, G.; Tolika, K.; Anagnostopoulou, C. Reliability of the ERA5 in Replicating Mean and Extreme Temperatures across Europe. Water 2022, 14, 543. [Google Scholar] [CrossRef] [Scilit]
- Trigo, I.F.; Davies, T.D.; Bigg, G.R. Objective climatology of cyclones in the Mediterranean region. J. Clim. 1999, 12, 1685–1696. [Google Scholar] [CrossRef] [Scilit]
- Kotsias, G.; Lolis, C.J.; Hatzianastassiou, N.; Bakas, N.; Lionello, P.; Bartzokas, A. Objective climatology and classification of the Mediterranean cyclones based on the ERA5 data set and the use of the results for the definition of seasons. Theor. Appl. Climatol. 2023, 152, 581–597. [Google Scholar] [CrossRef] [Scilit]
- Abramowitz, M.; Stegun, I. Handbook of Mathematical Functions and Formulas, Graphs and Mathematical Tables; Dover: New York, NY, USA, 1972; pp. 932–934. [Google Scholar]
- Linz, M.; Chen, G.; Hu, Z. Large-scale atmospheric control on non-Gaussian tails of midlatitude temperature distributions. Geophys. Res. Lett. 2018, 45, 9141–9149. [Google Scholar] [CrossRef] [Scilit]
- Garfinkel, C.I.; Harnik, N. The non-Gaussianity and spatial asymmetry of temperature extremes relative to the storm track: The role of horizontal advection. J. Clim. 2017, 30, 445–464. [Google Scholar] [CrossRef] [Scilit]
- Tamarin-Brodsky, T.; Hodges, K.; Hoskins, B.J.; Shepherd, T.G. Changes in Northern Hemisphere temperature variability shaped by regional warming patterns. Nat. Geosci. 2020, 13, 414–421. [Google Scholar] [CrossRef] [Scilit]
- Tamarin-Brodsky, T.; Hodges, K.; Hoskins, B.J.; Shepherd, T.G. A Simple Model for Interpreting Temperature Variability and Its Higher-Order Changes. J. Clim. 2022, 35, 387–403. [Google Scholar] [CrossRef] [Scilit]
- Prezerakos, N.G.; Michaelides, S.C.; Vlassi, A.S. Atmospheric synoptic conditions associated with the initiation of north-west African depressions. Int. J. Climatol. 1990, 10, 711–729. [Google Scholar] [CrossRef] [Scilit]
- Masloumidis, I.; Dafis, S.; Kyros, G.; Lagouvardos, K.; Kotroni, V. Snow Cover and Depth Climatology and Trends in Greece. Climate 2025, 13, 34. [Google Scholar] [CrossRef] [Scilit]
- Scaife, A.A.; Knight, J.R. Ensemble simulations of the cold European winter of 2005–2006. Q. J. R. Meteorol. Soc. 2008, 134, 1647–1659. [Google Scholar] [CrossRef] [Scilit]
- Peterson, T.C.; Stott, P.A.; Herring, S. Explaining extreme events of 2011 from a climate perspective. Bull. Am. Meteorol. Soc. 2012, 93, 1041–1067. [Google Scholar] [CrossRef] [Scilit]
- Psiloglou, B.E.; Gkinis, N.; Giannakopoulos, C. High-Resolution Temporal Variation of Thermal Discomfort Indices in the Eastern Mediterranean City of Athens, Greece, Since the Beginning of the 20th Century (1901–2024). Climate 2025, 13, 210. [Google Scholar] [CrossRef] [Scilit]
- Begou, P.; Saraga, D.; Maggos, T. The relationship between heat waves and summertime pollution in the Attica Region, Greece. Meteorol. Atmos. Phys. 2026, 138, 4. [Google Scholar] [CrossRef] [Scilit]
- Founda, D.; Van Loon, H. Circulation anomalies associated with winter temperature extremes in Athens during the period 1900–2004. Meteorol. Z. 2008, 17, 55–59. [Google Scholar] [CrossRef] [Scilit]
- Poupkou, A.; Zanis, P.; Nastos, P.; Papanastasiou, D.; Melas, D.; Tourpali, K.; Zerefos, C. Present climate trend analysis of the Etesian winds in the Aegean Sea. Theor. Appl. Climatol. 2011, 106, 459–472. [Google Scholar] [CrossRef] [Scilit]
Disclaimer/Publisher’s Note: The statements, opinions and data contained in all publications are solely those of the individual author(s) and contributor(s) and not of MDPI and/or the editor(s). MDPI and/or the editor(s) disclaim responsibility for any injury to people or property resulting from any ideas, methods, instructions or products referred to in the content. |
© 2026 by the authors. Licensee MDPI, Basel, Switzerland. This article is an open access article distributed under the terms and conditions of the Creative Commons Attribution (CC BY) license.