


Abstract
Puerto Rico has experienced increasingly frequent and intense extreme heat conditions in recent years, with the 2023–2024 warm seasons standing out for prolonged periods of dangerously high heat index values and widespread spatial exposure. These conditions are particularly concerning in tropical island environments, where high humidity limits physiological cooling and amplifies heat-related health risks. The main objective of this study is to identify and characterize extreme heat zones and events across Puerto Rico using NOAA-modeled heat index (apparent temperature) data, as well as to examine their spatial and temporal variability during the 2021–2024 period. Hourly modeled apparent temperature data between 2 and 4 pm, representing the warmest time of day, were analyzed for each day from June through October. Mean maximum and maximum heat index surfaces were generated for each month and warm season, and extreme heat zones were identified using the 103 °F (39.4 °C) danger threshold. Results show a persistent concentration of extreme heat in low-elevation coastal regions, particularly across the northern coastal plains from San Juan to Hatillo, with floodplain areas in Arecibo and Manatí exhibiting the highest and most consistent exposure. August was identified as the month with the highest mean maximum heat index across all study years, followed by September. The warm seasons of 2023 and 2024 exhibited the highest magnitudes and spatial extents of extreme heat, with some regions experiencing apparent temperatures exceeding 110 °F and up to 141 extreme heat days during peak afternoon hours. The findings indicate a transition from localized heat hotspots to widespread and sustained extreme heat exposure across Puerto Rico’s coastal regions. This study provides an island-scale assessment of extreme heat patterns with direct implications for public health, infrastructure planning, and heat-risk management in a warming tropical climate.
1. Introduction
Extreme heat is widely recognized as the deadliest weather hazard in many countries on Earth [1], and growing evidence indicates that tropical island environments face unique exposure and vulnerability profiles as the climate warms [2]. Globally, 2024 was confirmed as the warmest year on record [3], capping a decade (2015–2024) that comprises the ten warmest years observed, with exceptional land and ocean heat that raises baseline temperatures and amplifies heat stress risk worldwide [4]. Within this context, the Caribbean and Puerto Rico in particular [5], has experienced unusually frequent and intense heat episodes in recent warm seasons, with 2023–2024 notable for prolonged periods of high heat index values and nighttime warmth that reduce physiological recovery and elevate health risk [6]. Societal impacts have been broad: for example, heat has disrupted school operations in Puerto Rico and spurred calls for improved cooling and adaptation in public facilities, underscoring the relevance of heat as a public health and planning challenge [7,8].
Puerto Rico’s exposure to extreme heat is shaped by its tropical rainforest climate, rapid urbanization along the coastal plain, and heterogeneous land cover. Longstanding research has documented a pronounced and spatially complex urban heat island (UHI) in the San Juan Metropolitan Area (SJMA) [9,10]. Recent work on annual and seasonal trends on the island shows significant increases in minimum and average temperature across the island between 1970 and 2024 [11] in both urban and rural areas. Executive assessments by the Puerto Rico Climate Change Council (PRCCC) and the Committee of Experts and Advisors on Climate Change (CEACC) further note that temperatures across Puerto Rico have increased since the early 20th century and that urbanized areas exhibit higher temperatures relative to surrounding vegetated regions, reinforcing concerns about localized heat burdens in built environments [12,13]. More recently, the 2023 heat season brought anomalously high apparent temperatures across Puerto Rico [8], highlighting compounding stressors such as humidity and warm nights that raise heat-related illness risks even when dry-bulb temperatures alone might not appear extreme.
The public health literature in Puerto Rico links elevated temperatures and heat stress to adverse outcomes. In the SJMA, time-series analyses of daily mortality demonstrate significant associations between high temperatures and increased risk of non-accidental mortality [14], with cardiovascular and cerebrovascular outcomes among the most sensitive during warm periods [15]. Complementing local studies, national syndromic surveillance reported substantial increases in heat-related emergency department visits during the 2023 warm season across multiple U.S. regions [16], consistent with the exceptional heat experienced that year and relevant to U.S. territories such as Puerto Rico. Together, these findings support the premise that heat is already a consequential hazard for public health in Puerto Rico, and that its impacts are likely to intensify as mean conditions warm up and extremes become more persistent.
Despite these important advances, key knowledge gaps remain. Much of the Puerto Rico evidence base has focused on the SJMA or on station-based metrics, leaving a need for island-wide, gridded perspectives that resolve spatial patterns in apparent temperature data (heat index) to capture diurnal and seasonal evolution, as well as place recent heat seasons (2021–2024) in context. Given Puerto Rico’s steep environmental and socioeconomic gradients, from coastal urban cores to interior mountain communities, understanding where and when extreme heat concentrates are essential for equitable climate-risk management, infrastructure planning, and targeted health interventions. Accordingly, the main objective of this study is to identify extreme heat zones in Puerto Rico using NOAA-modeled heat index data to determine how they vary spatially and temporally during the 2021–2024 period.
2. Data and Methods
From an operational perspective, Puerto Rico benefits from the National Weather Service (NWS) San Juan office for decision-support products that increasingly emphasize heat-risk communication. In March 2025, as part of the NWS Hazard Simplification effort, Excessive Heat Watches/Warnings were renamed “Extreme Heat Watches/Warnings” to improve clarity and actionability for partners and the public in Puerto Rico and the U.S. Virgin Islands [17,18]. Critically, many of these warning decisions and public-facing graphics are informed by gridded, high-resolution forecast datasets such as the National Digital Forecast Database (NDFD), which provides an “Apparent Temperature” field that dynamically represents heat index (temperature–humidity) under warm conditions and wind chill under cold conditions [19]. Over island territories outside the continental U.S., these apparent temperature (heat index) forecasts are available at three-hourly temporal resolution. The NDFD apparent temperature (heat index) product used in this study corresponds to the gridded forecast dataset provided by the National Weather Service at an approximate spatial resolution of 2.5 km. NDFD data archived and accessible via the National Oceanic and Atmospheric Administration (NOAA) and the National Center for Environmental Information (NCEI). The NOAA Big Data Program offers a consistent, quality-controlled, and operationally maintained source of modeled apparent temperature (heat index) fields suited for spatiotemporal analyses at the island scale.
Hourly modeled apparent temperature (heat index) data between 2 and 4 pm were obtained from the NDFD for each day from June through October for the 2021–2024 period. Those months were selected based on the temperature climatology of Puerto Rico, since it is during that period that higher temperatures and more extreme heat events occurred [20]. For each day, the heat index value was derived by selecting the maximum value within the 2:00–4:00 pm time window, representing the peak apparent temperature during the afternoon period. Around 30–31 modeled heat index raster surfaces for each month analyzed for the 2021–2024 period were obtained. The heat index modeled surfaces were processed using Geographic Information Systems (GIS) and average maximum apparent temperature raster surfaces were calculated for each month (June–October) and for the whole season for the 2021–2024 period. Apparent temperature data for the years 2020 and 2025 were incomplete, and for that reason, they were not included in this analysis.
To identify extreme heat zones in Puerto Rico, the average maximum surfaces that were calculated for each month and season were reclassified based on the following heat index classes (Table 1). These are the three classes:
Table 1.
Heat index classifications.
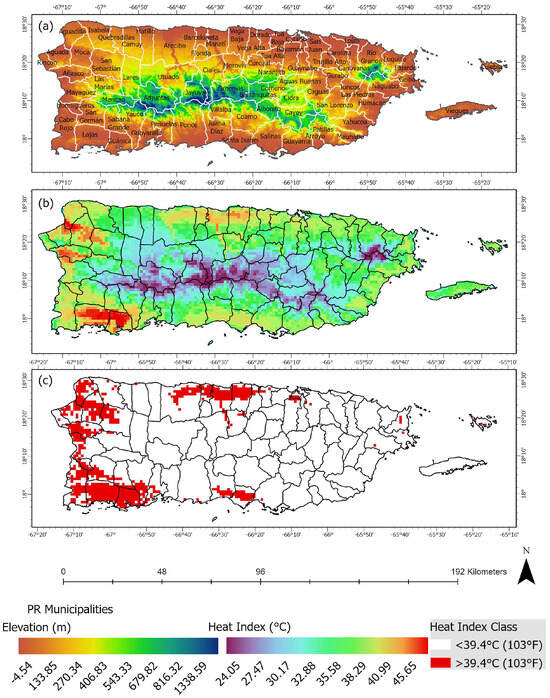
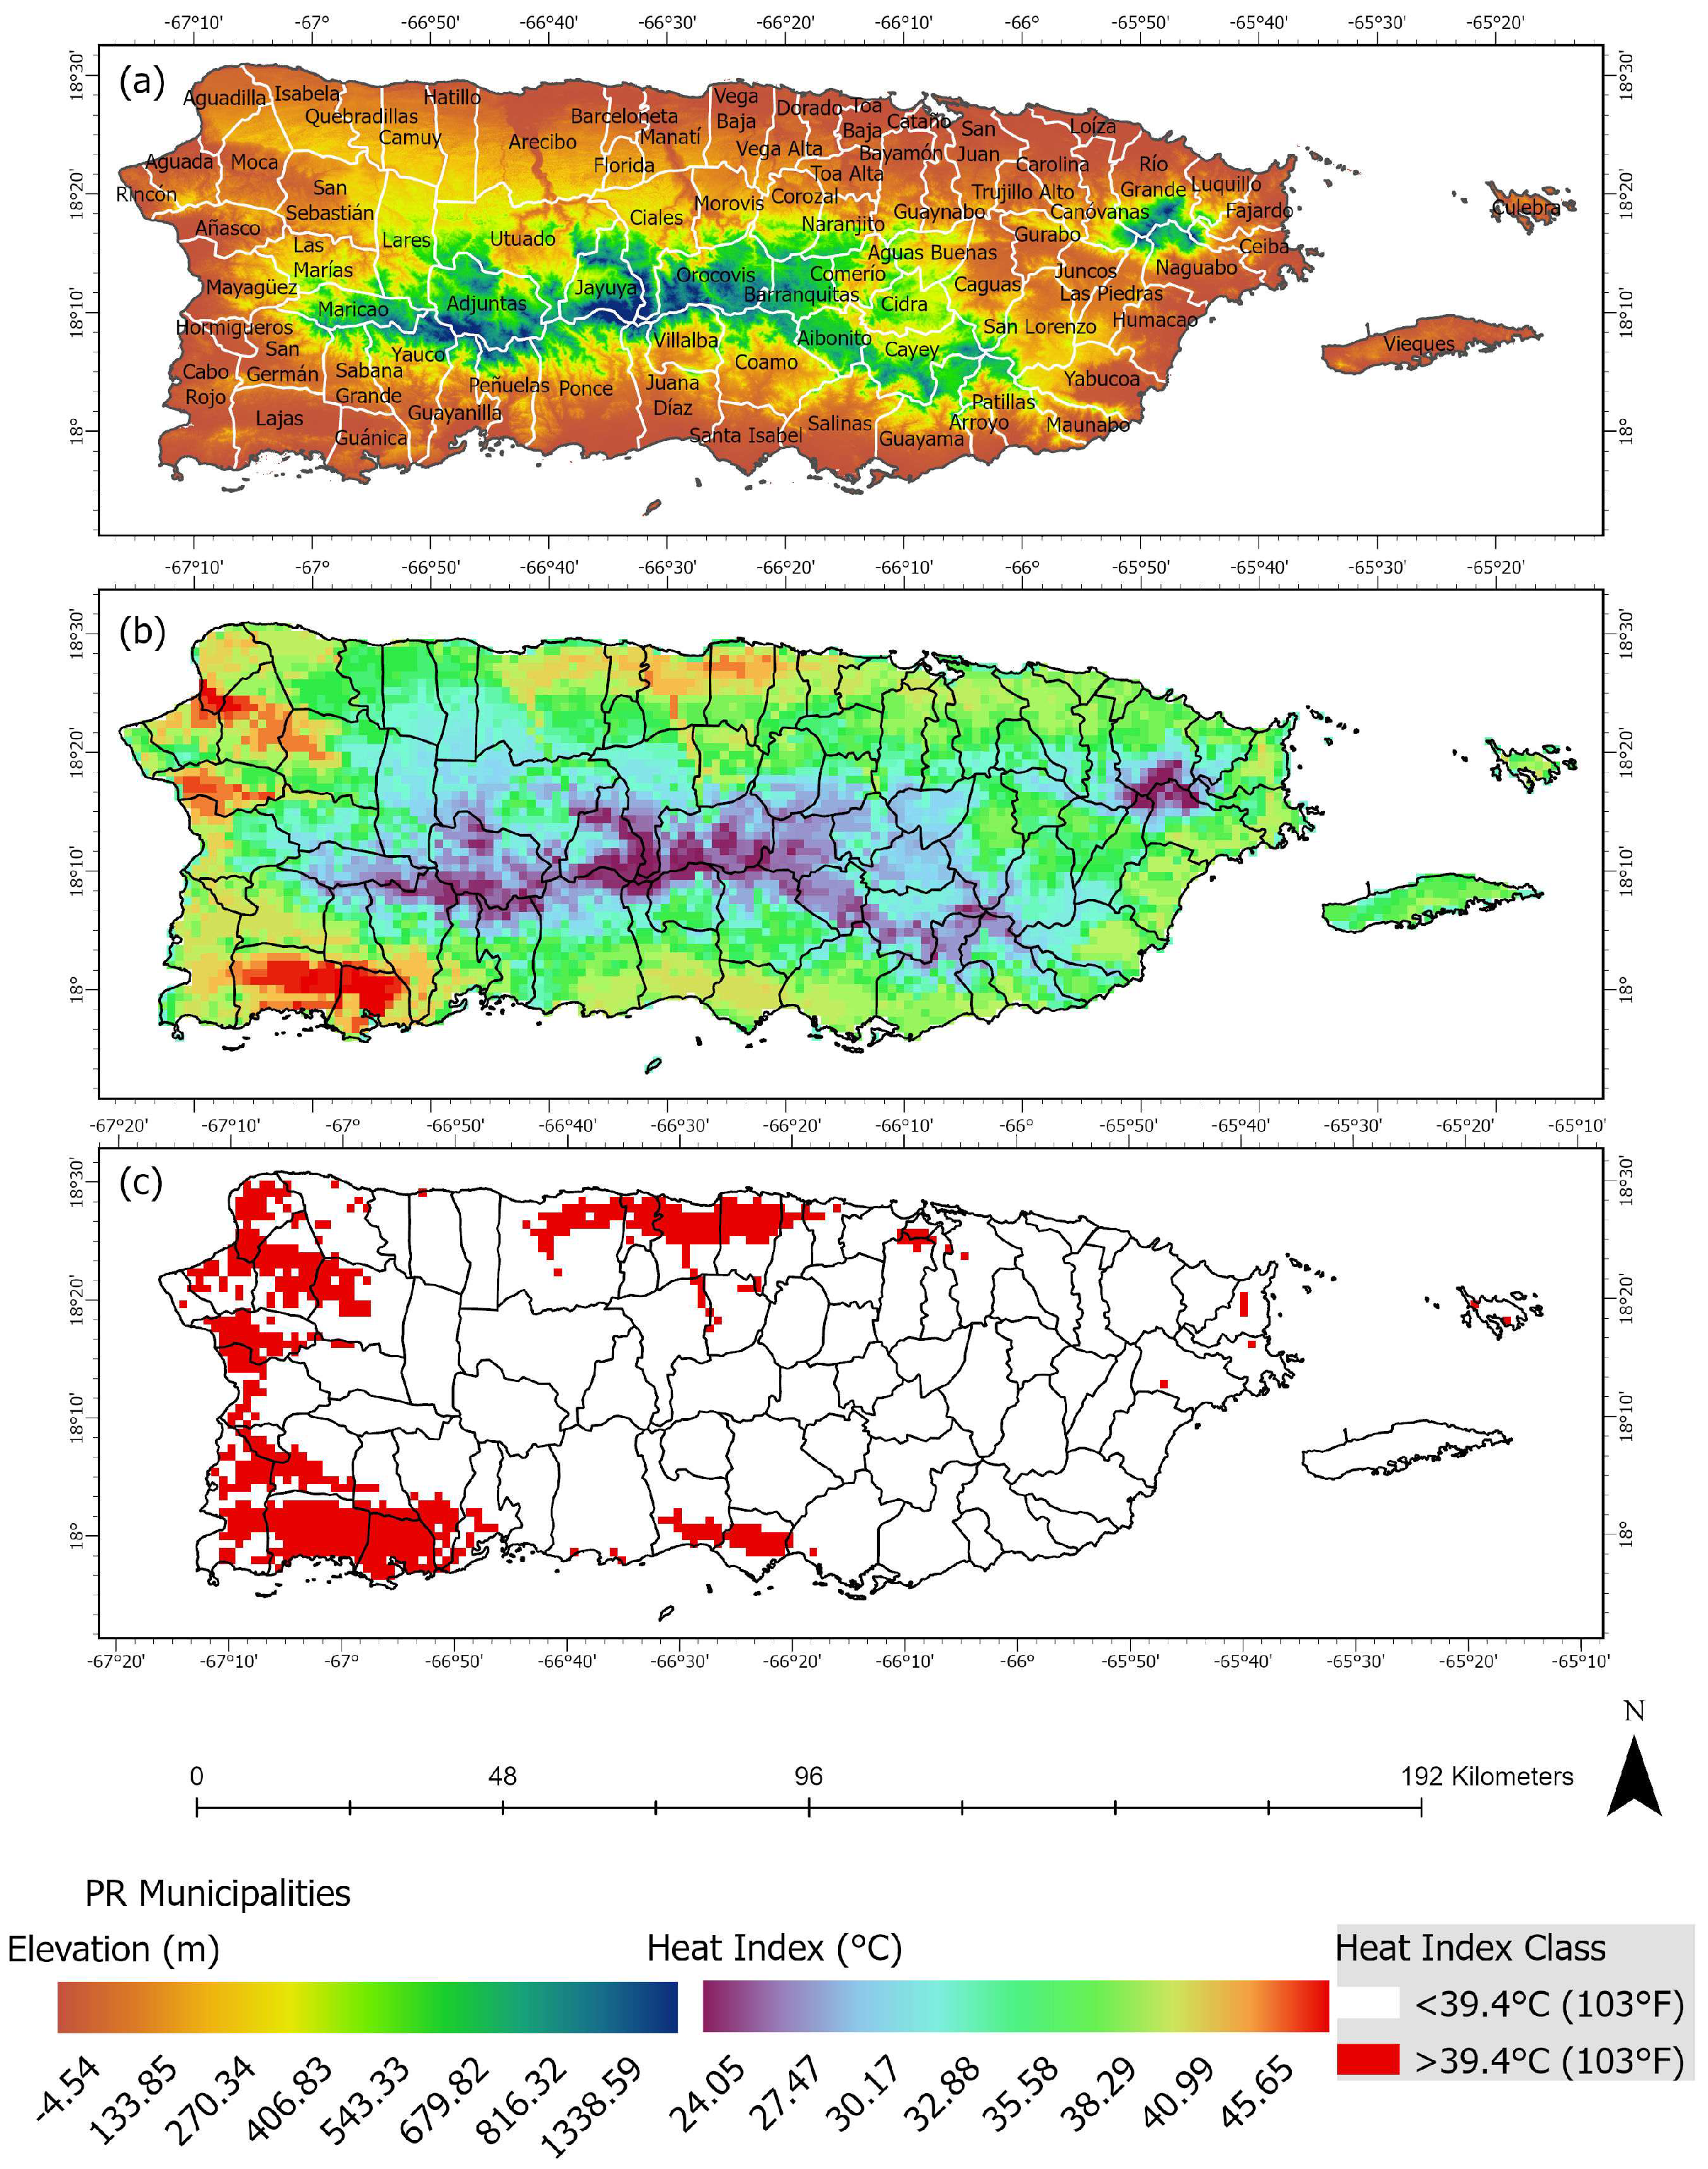
A heat index above ~103 °F (39 °C) is usually considered dangerous [21], as it marks the threshold where heat-related illnesses (heat exhaustion, heat stroke) become much more likely [22,23], particularly for vulnerable populations (elderly, children, outdoor workers, people with chronic illnesses). The average maximum modeled heat index surfaces were reclassified using the “Danger” threshold of 39.4–51 °C (103–125 °F) to spatially isolate the different extreme heat zones. The study area in this analysis includes the main island of Puerto Rico and the municipalities of Vieques and Culebra (Figure 1a). The topography of the study area ranges from high elevations (>500 m) in the central mountain’s region to low-altitude coastal plains in the northern, southern, eastern, and western regions of the archipelago (Figure 1a).
Figure 1.
The archipelago of Puerto Rico shows elevation in meters and the island’s 78 municipalities (a). An extreme heat event that occurred on August 7 of 2024 around 2–4 pm showing the heat index in °C (b), and the reclassified event highlighting the areas of the island that experienced heat indexes at or above 39.4 °C (c).
In this study, an extreme heat event is defined as a day when the heat index exceeds 103 °F (39.4 °C), consistent with thresholds used by the National Weather Service for issuing heat advisories in tropical regions. The 103 °F (39.4 °C) threshold was applied at the daily grid level, using the daily maximum heat index values derived from the 2–4 pm period. The number of days exceeding this threshold was then calculated for each grid cell and subsequently aggregated to produce spatial summaries. An extreme heat event that occurred around 2–4 pm on August 7 of 2024 is shown as an example of the modeled apparent temperature data used in this study (Figure 1b), with the reclassified mean maximum values exceeding 39.4 °C (103 °F) clustered in the coastal plains of the northern, western, and eastern regions of the island (Figure 1c). Using a GIS, spatial overlay analyses were performed with the reclassified heat index surfaces for each month to quantify the number of days that an area experiences extremely dangerous heat. Maps of monthly and seasonal heat index (apparent temperature) frequencies for each month and year were produced to examine spatial and temporal characteristics of extreme heat for the 2021–2024 period. The terms apparent temperature and heat index are used interchangeably across the following sections to describe the main findings of this study.
To assess the reliability of the modeled heat index estimates derived from the NDFD, the modeled heat index values were compared with observations from Weather Underground meteorological stations located across Puerto Rico. Station-based heat index values were calculated using observed daily maximum temperature and relative humidity values for the month of September 2024. The observed heat index values were then compared with modeled heat index values extracted from the NDFD dataset at the corresponding station locations. The comparison shows a strong positive relationship between observed and modeled values, with correlation coefficients exceeding 0.61 in areas experiencing the highest apparent temperatures. These results suggest that the NDFD dataset reasonably captures the spatial variability of the heat index across Puerto Rico.
To further examine the meteorological conditions associated with extreme heat across Puerto Rico, additional atmospheric variables were obtained from the ERA5 reanalysis dataset produced by the European Center for Medium-Range Weather Forecasts (ECMWF) in Reading, United Kingdom. ERA5 provides hourly global atmospheric fields at a spatial resolution of approximately 0.25° (~31 km) and is widely used for climate and weather analyses due to its consistent assimilation of observational data [24]. For this study, ERA5 fields of 2 m air temperature, relative humidity, 10 m wind components, mean sea level pressure, and sea surface temperature were extracted for Puerto Rico and the surrounding waters for August 2023. Mean values were calculated for the afternoon period between 1400 and 1600 local time, corresponding to the time of day when maximum apparent temperatures typically occur. The temperature and relative humidity fields were used to calculate heat index values following the National Weather Service formulation, while the 10 m wind components were used to derive wind speed and direction fields. These ERA5 datasets were used to evaluate the meteorological drivers of extreme heat and to provide a physical interpretation of the spatial heat index patterns identified in the NDFD analysis.
3. Results and Discussion
3.1. Mean Maximum Heat Index
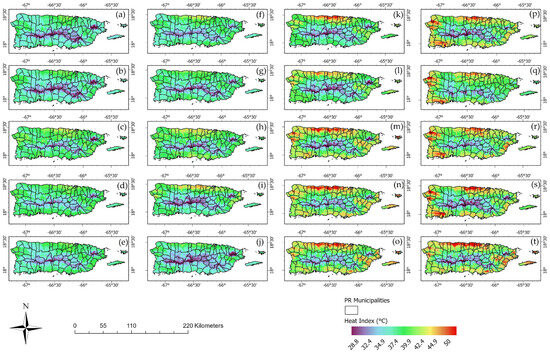
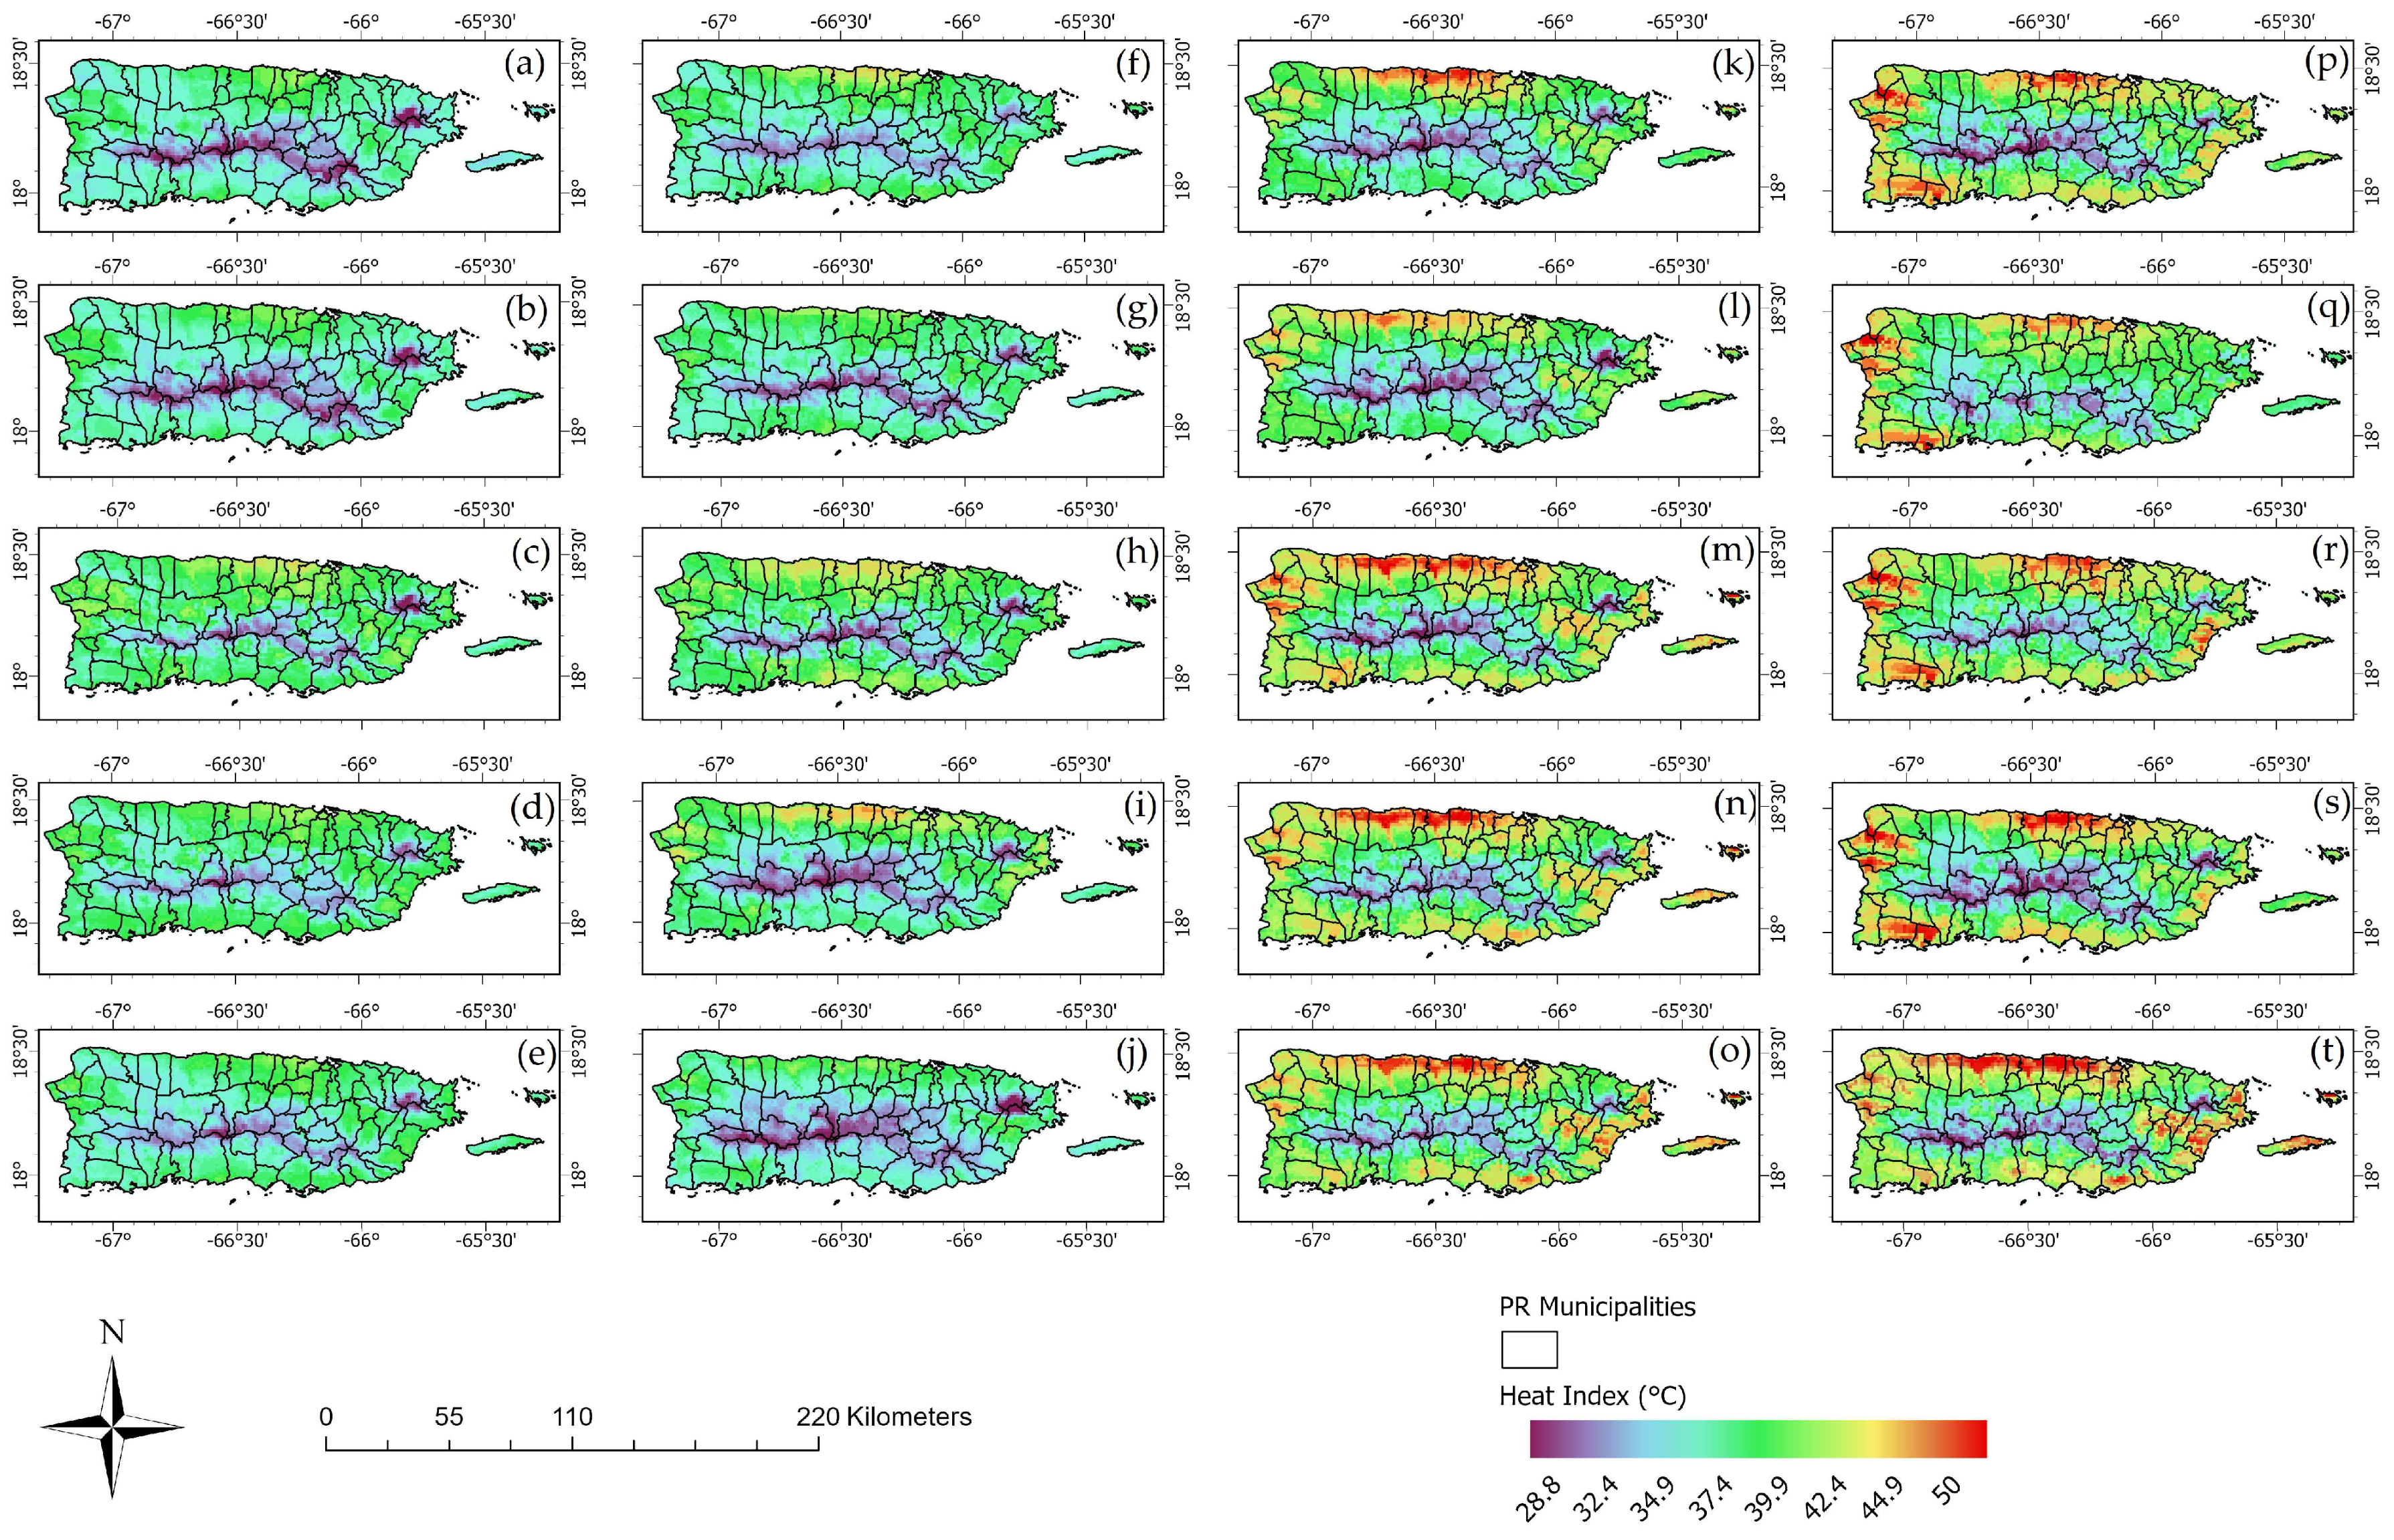
Mean maximum heat index values around between 2 and 4 pm during the warm-season months (June–October) for the 2021–2024 period reveal a persistent spatial pattern of elevated thermal stress across the study area (Figure 2). The mean maximum heat index maps for the years 2021 (Figure 2a–e) and 2022 (Figure 2f–j) show higher apparent temperatures of 39.4 °C or higher (103 °F) in the northern coastal zones of the island, especially during the months of August and September (Figure 2c,h,i). The warmer months of the years 2023 (Figure 2k–o) and 2024 (Figure 2p–t) exhibited higher heat indexes at or above 43.3 °C (110 °F) in the northern coastal plains, with some zones reaching apparent temperatures as high as 51.6 °C (124.9 °F). The months of August for the studied period exhibits the highest mean maximum heat indexes (Figure 2m,r), with the years 2023 and 2024 again showing the highest heat indexes in the northern coastal plains of the island. The month of September was second behind August with regard to zones exhibiting high mean maximum heat indexes (Figure 2n,s), with most of those higher values concentrated in the northern coastal areas. The highest mean heat index values are consistently concentrated in the northern region of the island, especially in low-elevation, coastal, and urbanized regions, where high air temperatures combine with elevated humidity to produce dangerous apparent temperature conditions.
Figure 2.
Mean maximum heat index values at or above 39.4 °C (103 °F) around 2–4 pm for the warmer months of June (a), July (b), August (c), September (d), and October (e) of 2021. The months of June (f), July (g), August (h), September (i), and October (j) of 2022. The months of June (k), July (l), August (m), September (n), and October (o) of 2023. The months of June (p), July (q), August (r), September (s), and October (t) of 2024.
The municipalities located in the northern coastal plains, from San Juan to Hatillo, are the ones that exhibit the highest mean maximum heat index values. The low-elevation floodplains of Arecibo and Manati are shown as highly exposed areas to extreme heat, especially in the months of August, September and October (Figure 2m–o,r–t). The coastal plains in the west, east, and south also exhibit exposure to extreme heat, yet the most exposed area is the northern coastal plains. These patterns are consistent with previous research showing that tropical regions experience amplified heat stress due to limited evaporative cooling and high atmospheric moisture content [25,26]. The results further suggest that afternoon thermal exposure during the warm season has become a structural characteristic of the regional climate, with implications for outdoor activity, energy demand, and heat-related health risks.
When extreme heat is analyzed annually by combining the five warmer months (Figure 3), an expansion of the zone with higher heat indexes emerges. The warmer months of the years 2021 and 2022 (Figure 2a,b) exhibit higher mean maximum heat indexes of 39.4 °C or higher (103 °F) in the northern coastal plains, with the rest of the island showing lower mean maximum heat patterns. It is evident that higher elevation areas on the island exhibit lower heat indexes than the lower altitude plains, yet not all coastal zones experienced similar apparent temperature patterns. The northern coastal plains region, and to a lower degree, the lower elevation areas in the west, were the areas that experienced the higher heat indexes at or above 43.3 °C (110 °F), especially during the years 2023 and 2024 (Figure 3c,d). The years 2023 and 2024 showed similar extreme heat patterns, yet 2023 shows a more concentrated area of elevated heat indexes (>44) in the northern coastal plains, while 2024 shows a smaller zone in the north with an expanded area of higher apparent temperatures in the west. These findings align with recent observations of record-breaking global and regional temperatures and reflects the increasing role of compound heat–humidity extremes in shaping human heat exposure [27,28,29]. The 2023 and 2024 patterns suggest that extreme apparent temperature conditions are no longer confined to localized hotspots but are becoming spatially pervasive during peak afternoon hours.
Figure 3.
Annual mean maximum heat index values between 2 and 4 pm local time during the warm-season months (June–October) for the period years 2021 (a), 2022 (b), 2023 (c) and 2024 (d).
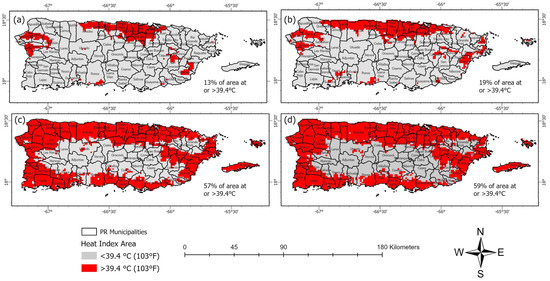
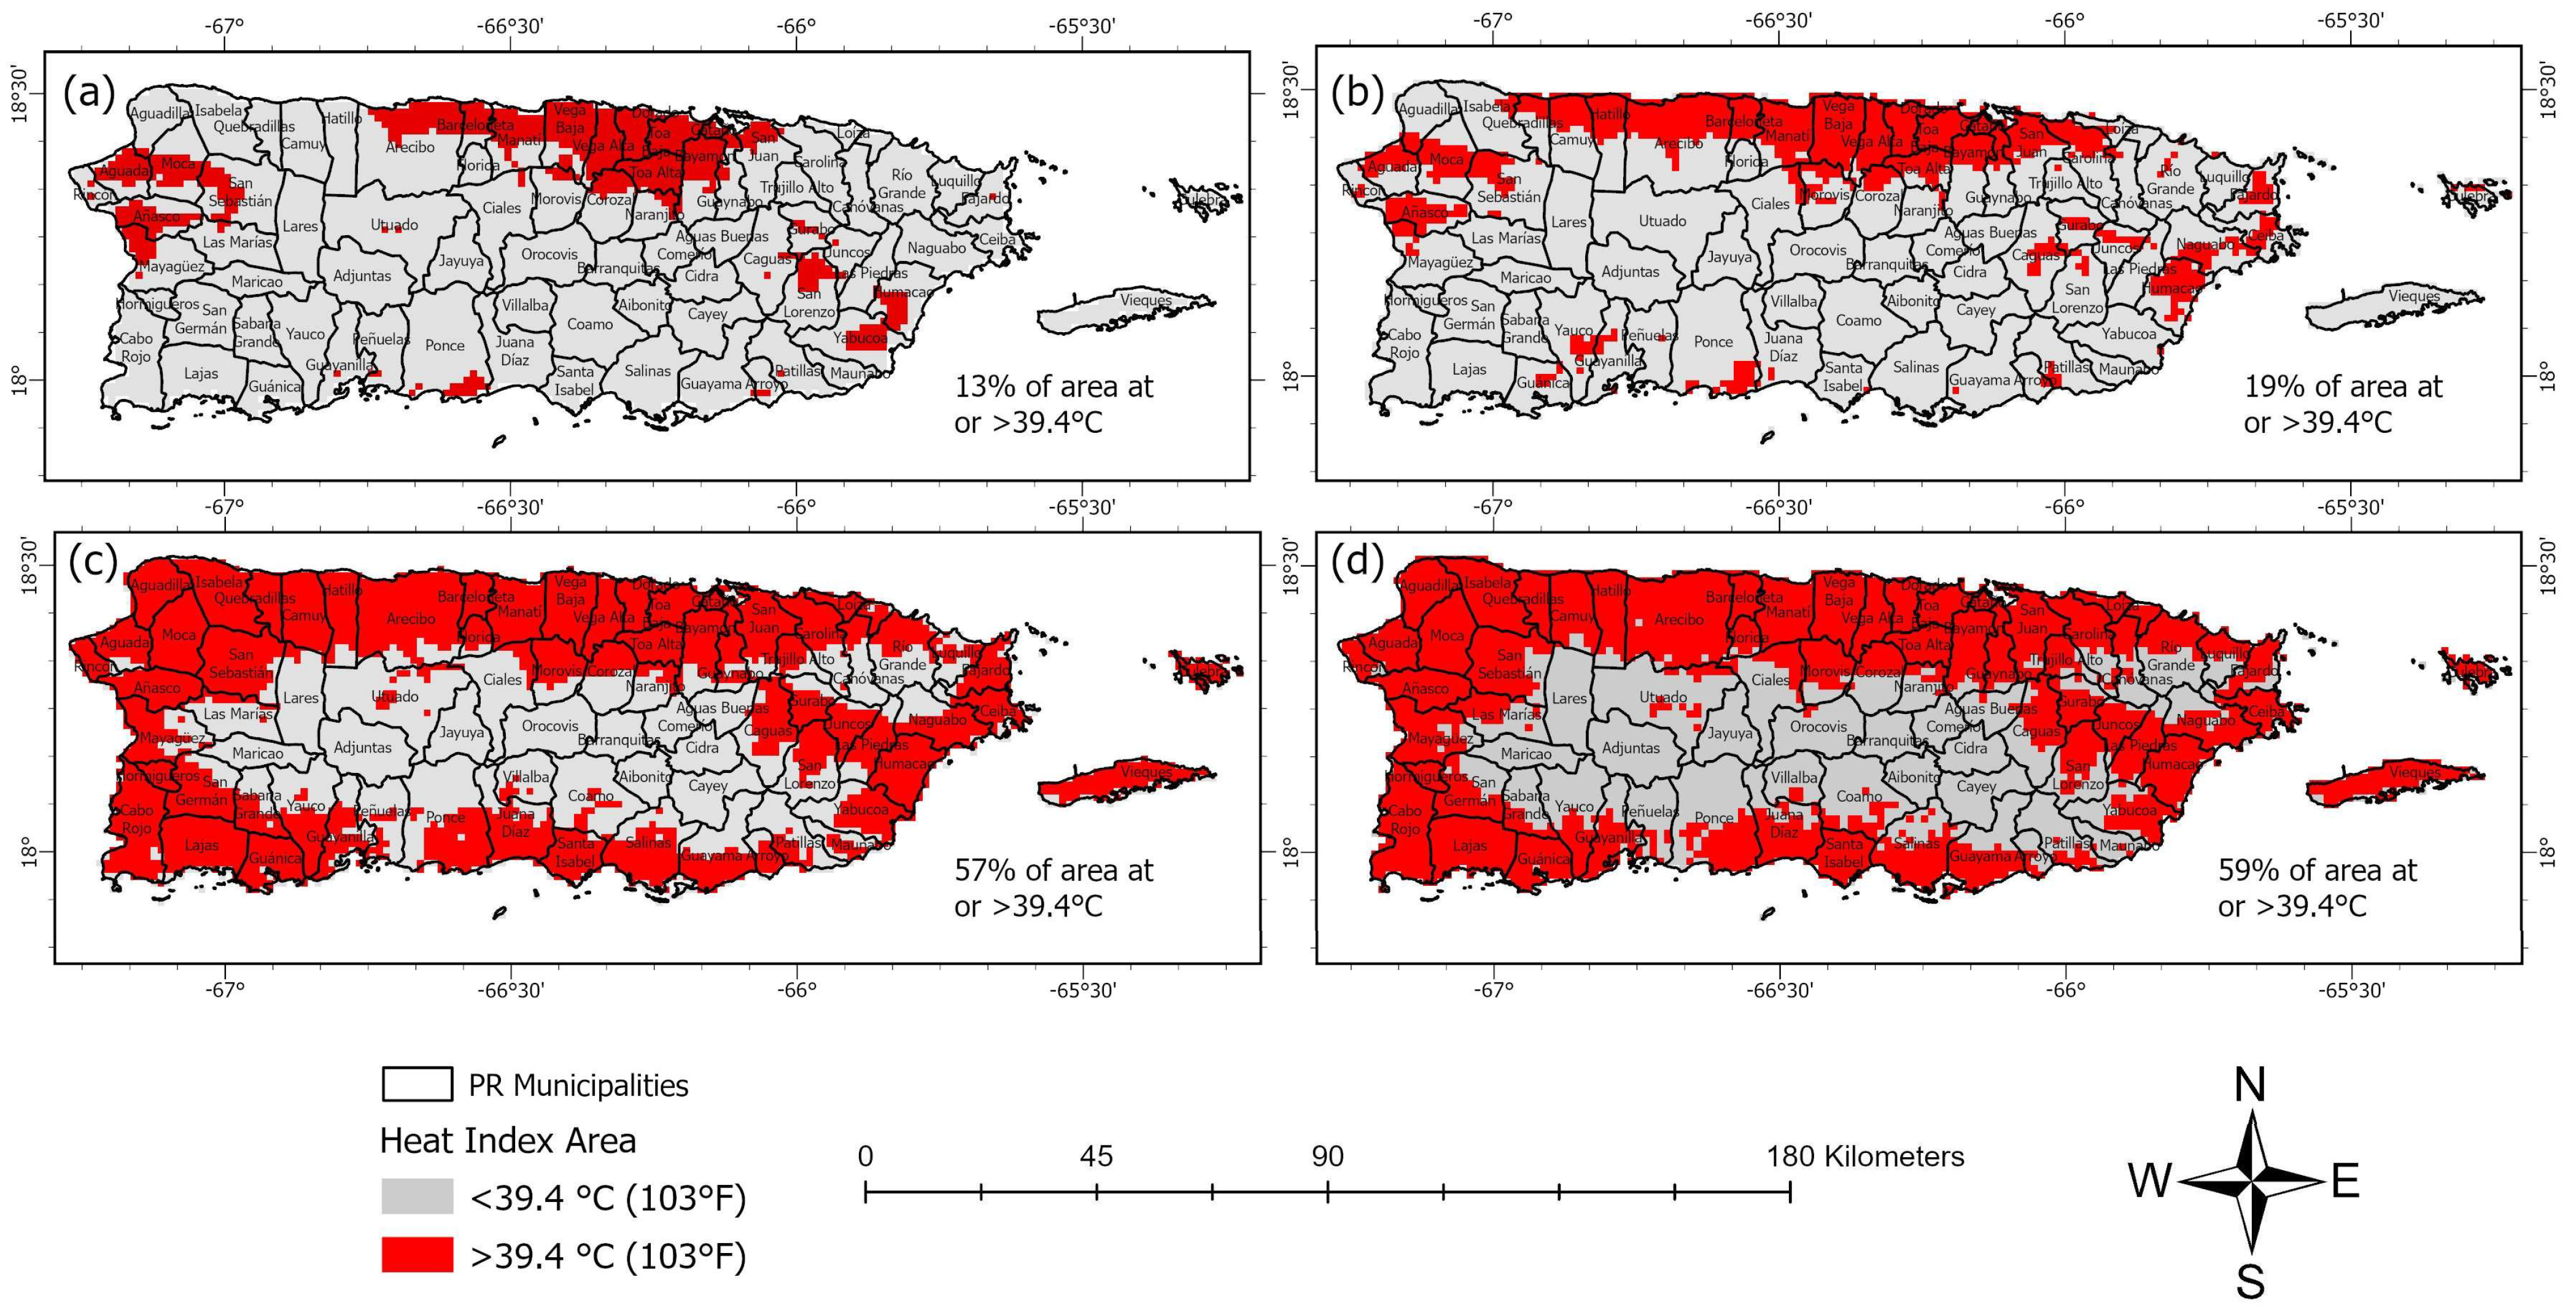
When the areas that exhibited heat indexes at 39.4 °C (103 °F) or above around 2–4 pm for the June–October period are examined, an evident expansion of the exposed area is evident (Figure 4). For the year 2021, around 13% of the island had areas experiencing extreme heat, yet they are mostly concentrated in the northern coastal plains between the municipalities of Arecibo and Bayamon (Figure 4a). The extreme-heat area expanded to 19% in 2022, with the northern region expanding east and west. Dangerous heat index estimates around 2–4 pm for the year 2023 covered 57% of the island, with most municipalities in the northern region of the island experiencing extreme heat in the entirety of their boundaries. The 2023 period also exhibited expansions of high heat index areas in the lower elevation zones of the western, eastern, and southern regions of the island. The year with the most area (59%) experiencing heat indexes at 39.4 °C (103 °F) or above around 2–4 pm was 2024, with the northern municipalities identified as the most exposed, while the higher elevation areas in the central region, as well as the eastern and southern zones, as the least exposed to extreme heat.
Figure 4.
Areas in Puerto Rico that exhibited mean maximum heat indexes at 39.4 °C or above (103 °F) around 2–4 pm for the June–October period for the years 2021 (a), 2022 (b), 2023 (c) and 2024 (d).
3.2. Extreme Heat Events
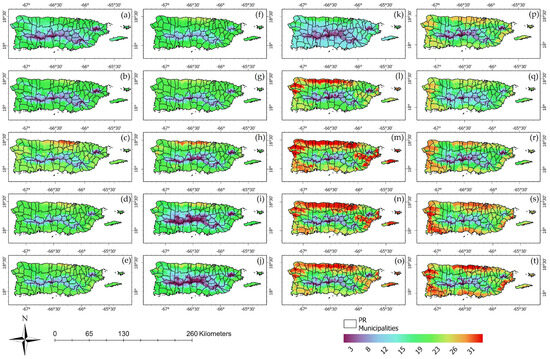
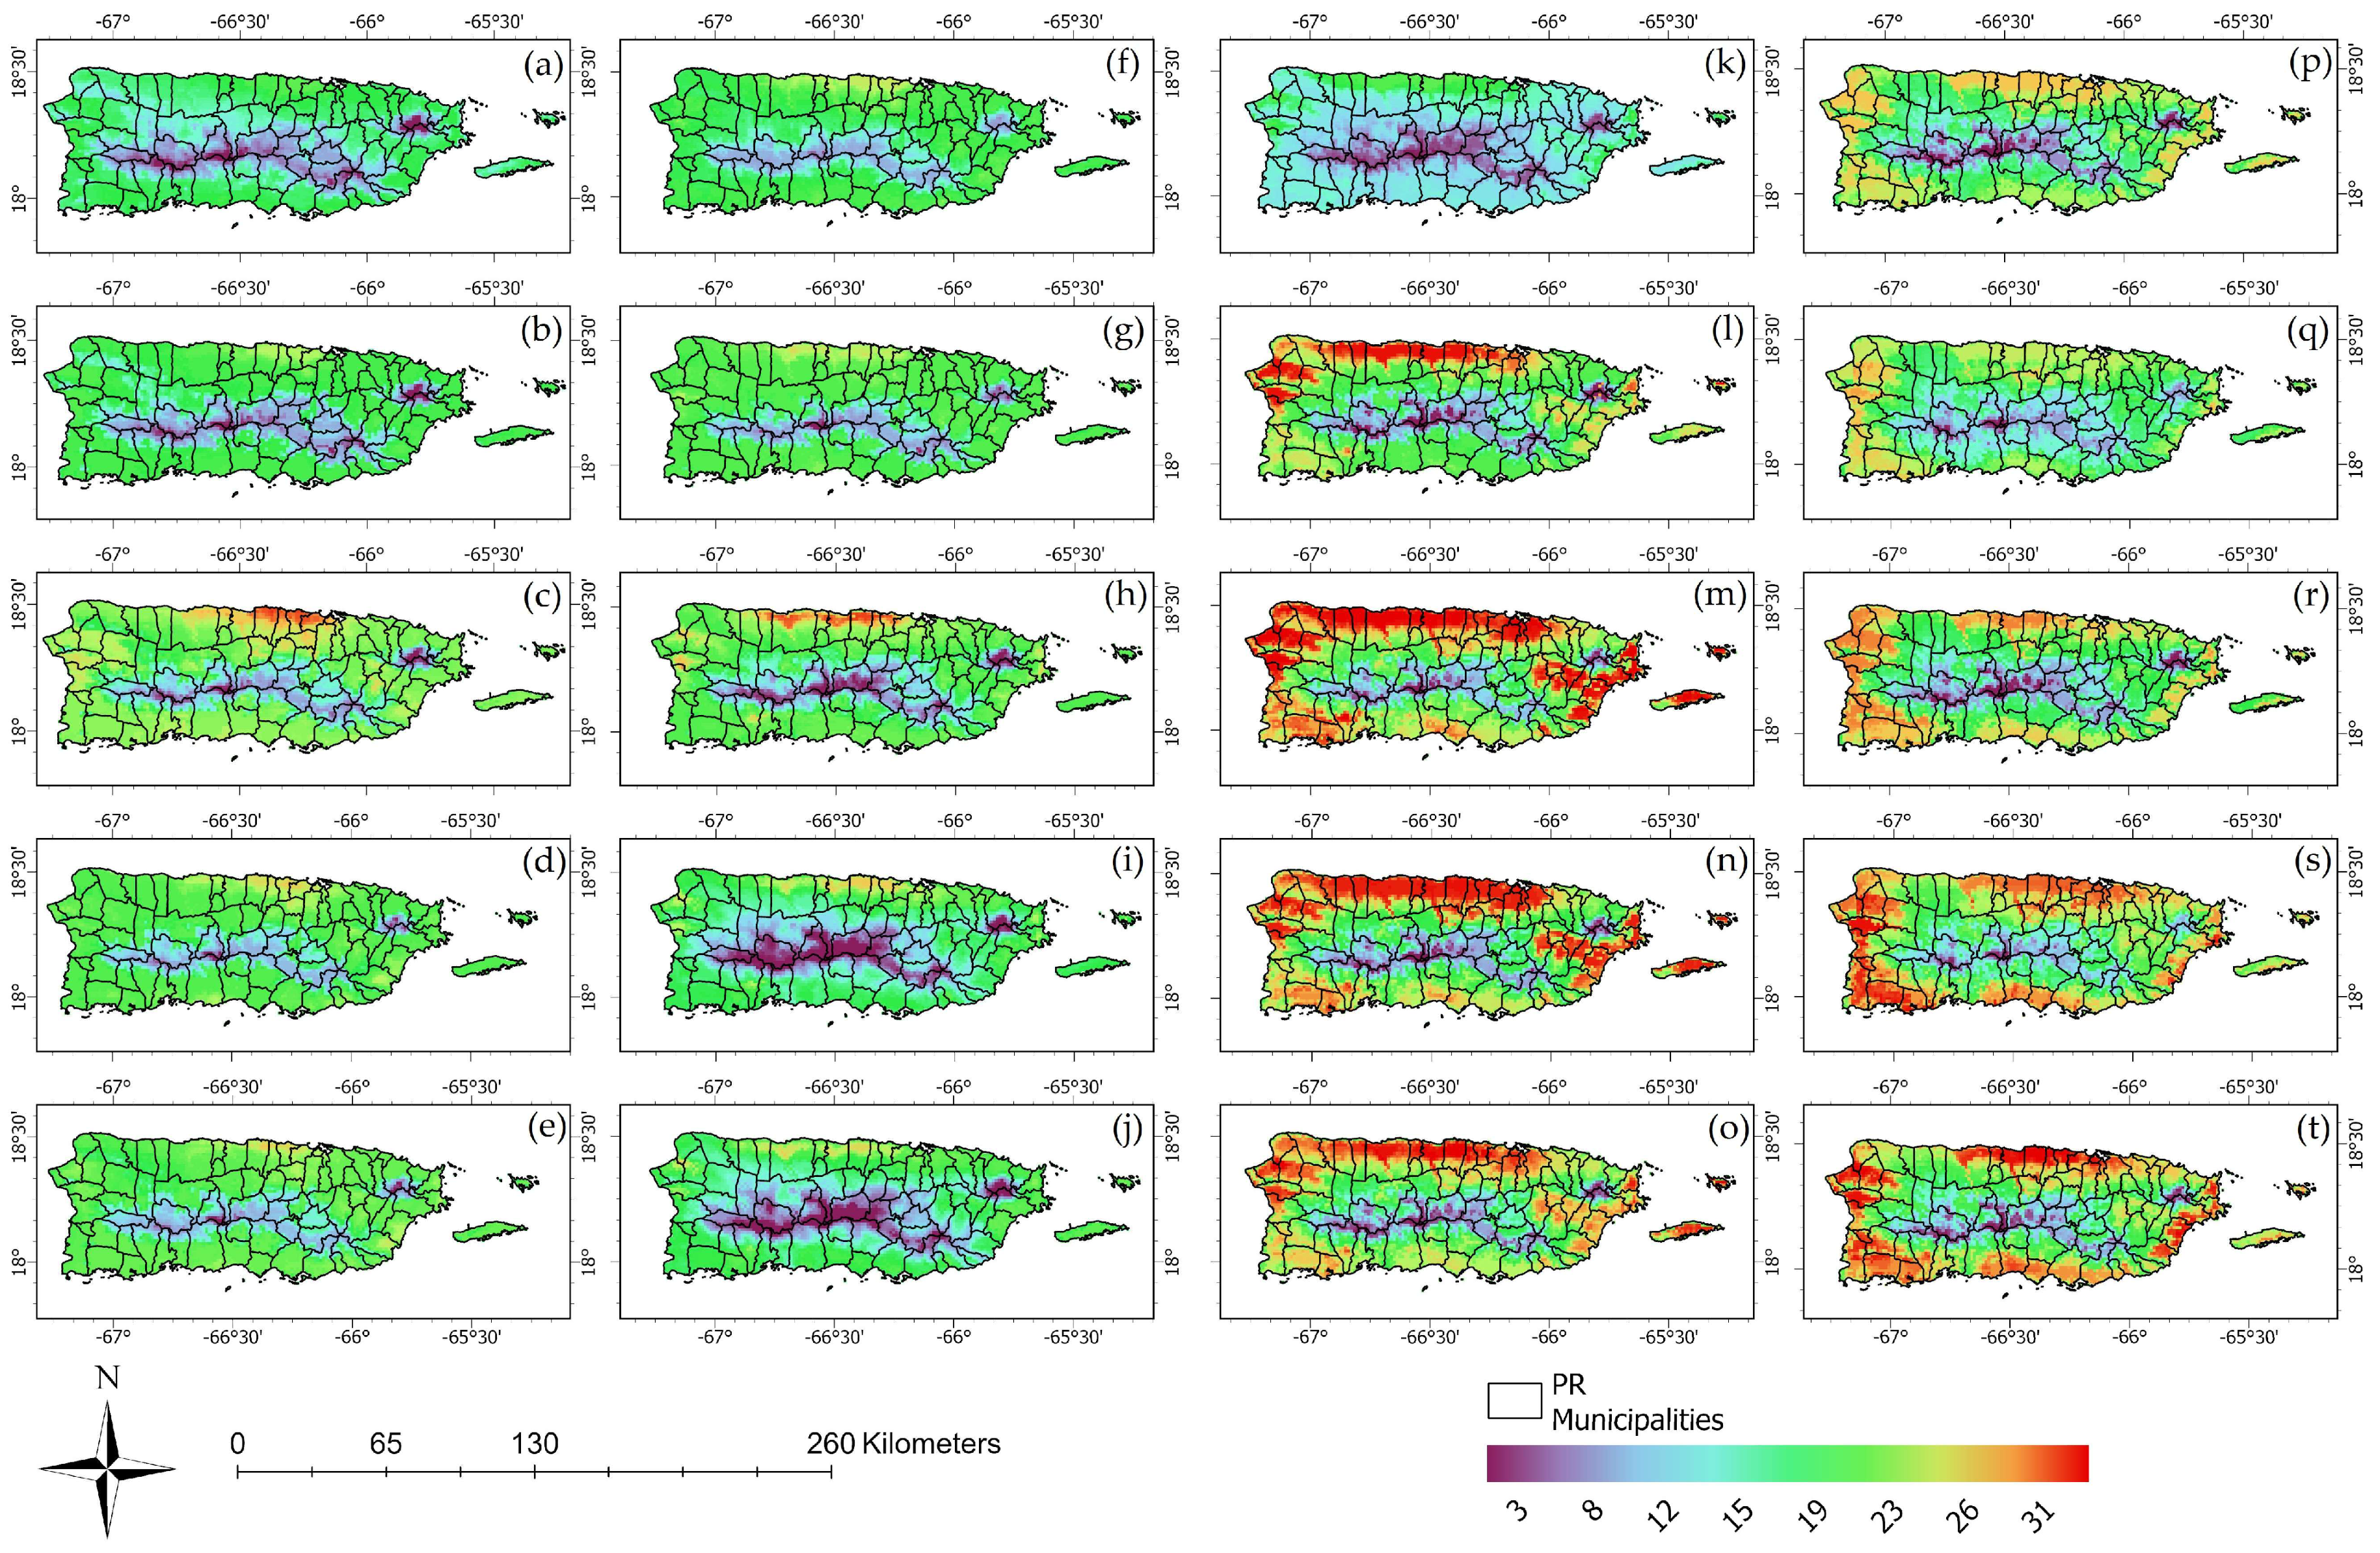
When the number of days that showed heat indexes at 39.4 °C (103 °F) or above are examined for each of the warmer months during the 2021–2024 period, it is evident that not all regions of Puerto Rico are equally exposed to extreme heat (Figure 5). The warmer months of 2021 (Figure 5a–e) and 2022 (Figure 5f–j) showed a range of extreme heat days between 8—in the higher elevation areas—and in some cases 31 consecutive days in the coastal plains of the northern region of the island. The months with the higher number of extreme heat days for 2021 and 2022 were August, September, and October, especially in the lower elevation areas of the northern coastal plains. The months of the years 2023 (Figure 5k–o) and 2024 (Figure 5p–t) exhibited larger areas of extreme heat conditions, with the months of August and September exhibiting the most areas with 30–31 consecutive days of mean maximum apparent temperatures at 39.4 °C or above (103 °F) around 2–4 pm. The year 2023 showed the most areas experiencing 26 to 31 days a month of extreme heat (Figure 5l–o), with the northern coastal zones of the island once again identified as the most exposed area of Puerto Rico. When it comes to 2024, the areas that experienced 23–31 days a month of dangerous heat were more widespread, now that western, southern, and eastern coastal zones also exhibit higher frequencies like the ones found on the north coast.
Figure 5.
Total number of days per month that experienced heat indexes at 39.4 °C (103 °F) or above around 2–4 pm for the warmer months of June (a), July (b), August (c), September (d), and October (e) of 2021. The months of June (f), July (g), August (h), September (i), and October (j) of 2022. The months of June (k), July (l), August (m), September (n), and October (o) of 2023. The months of June (p), July (q), August (r), September (s), and October (t) of 2024.
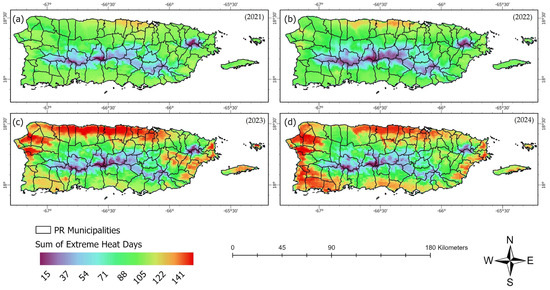
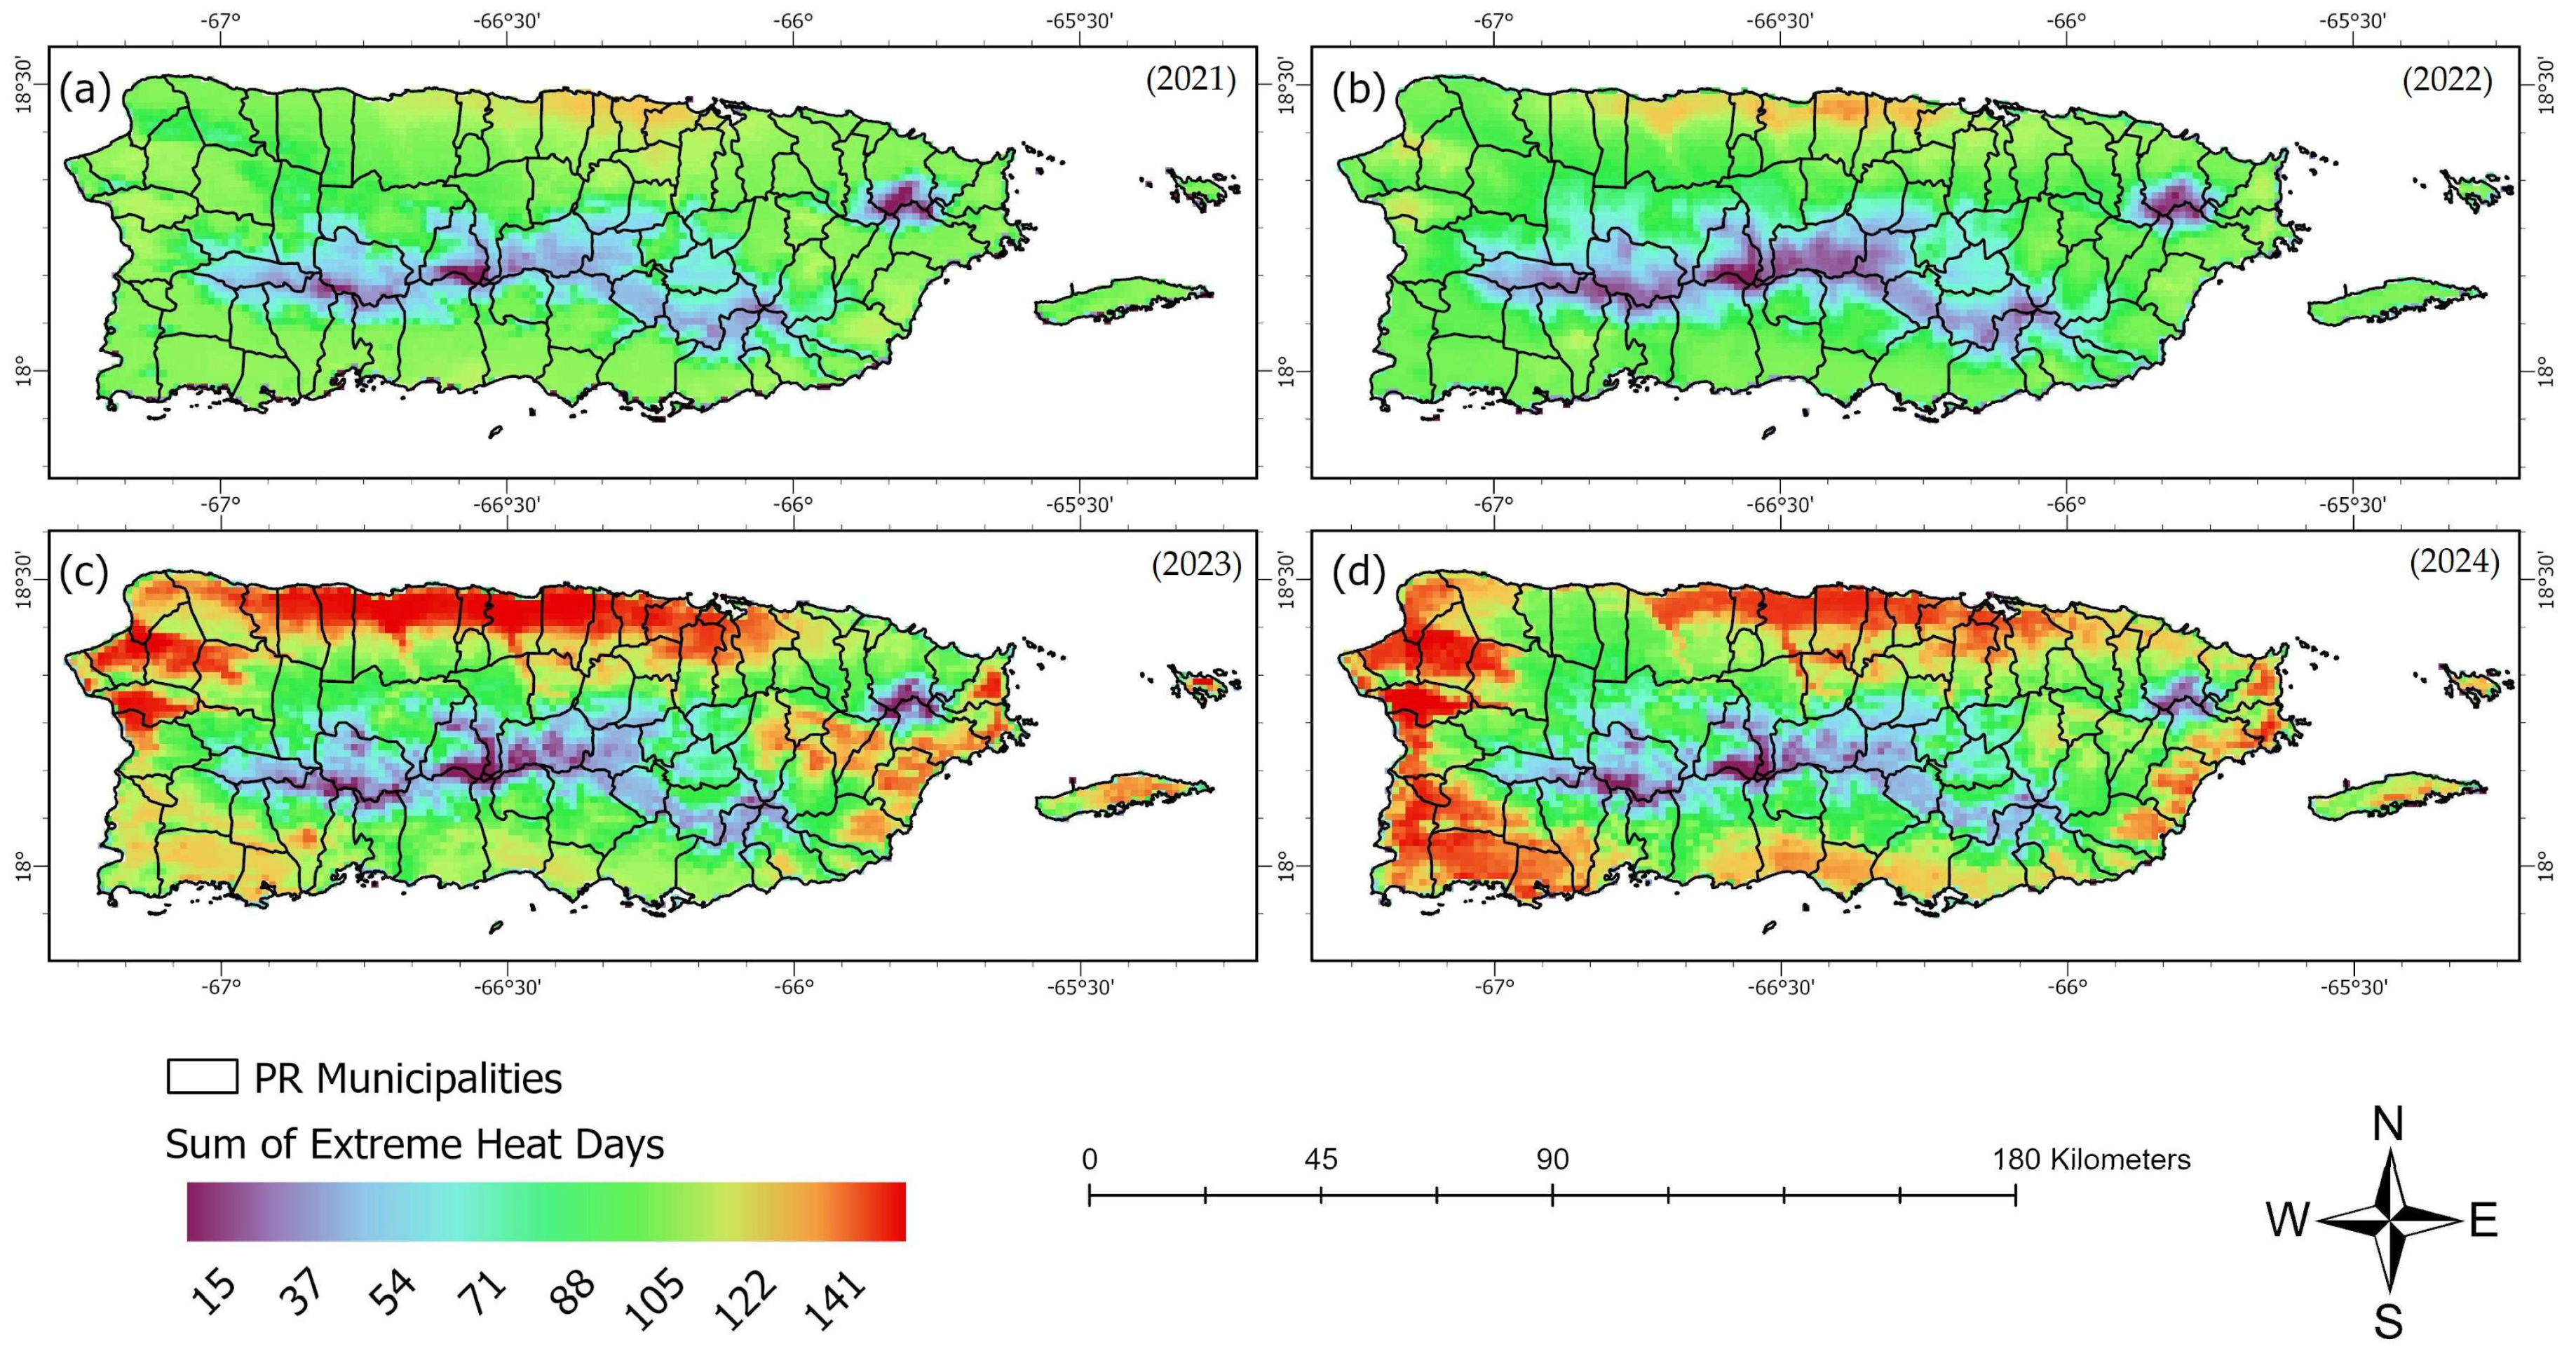
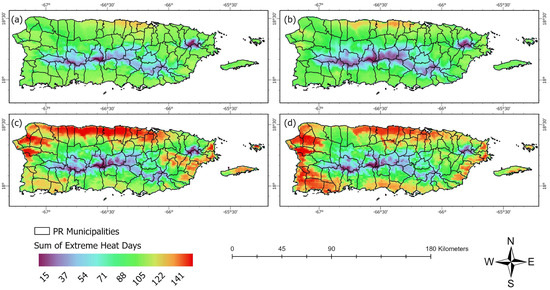
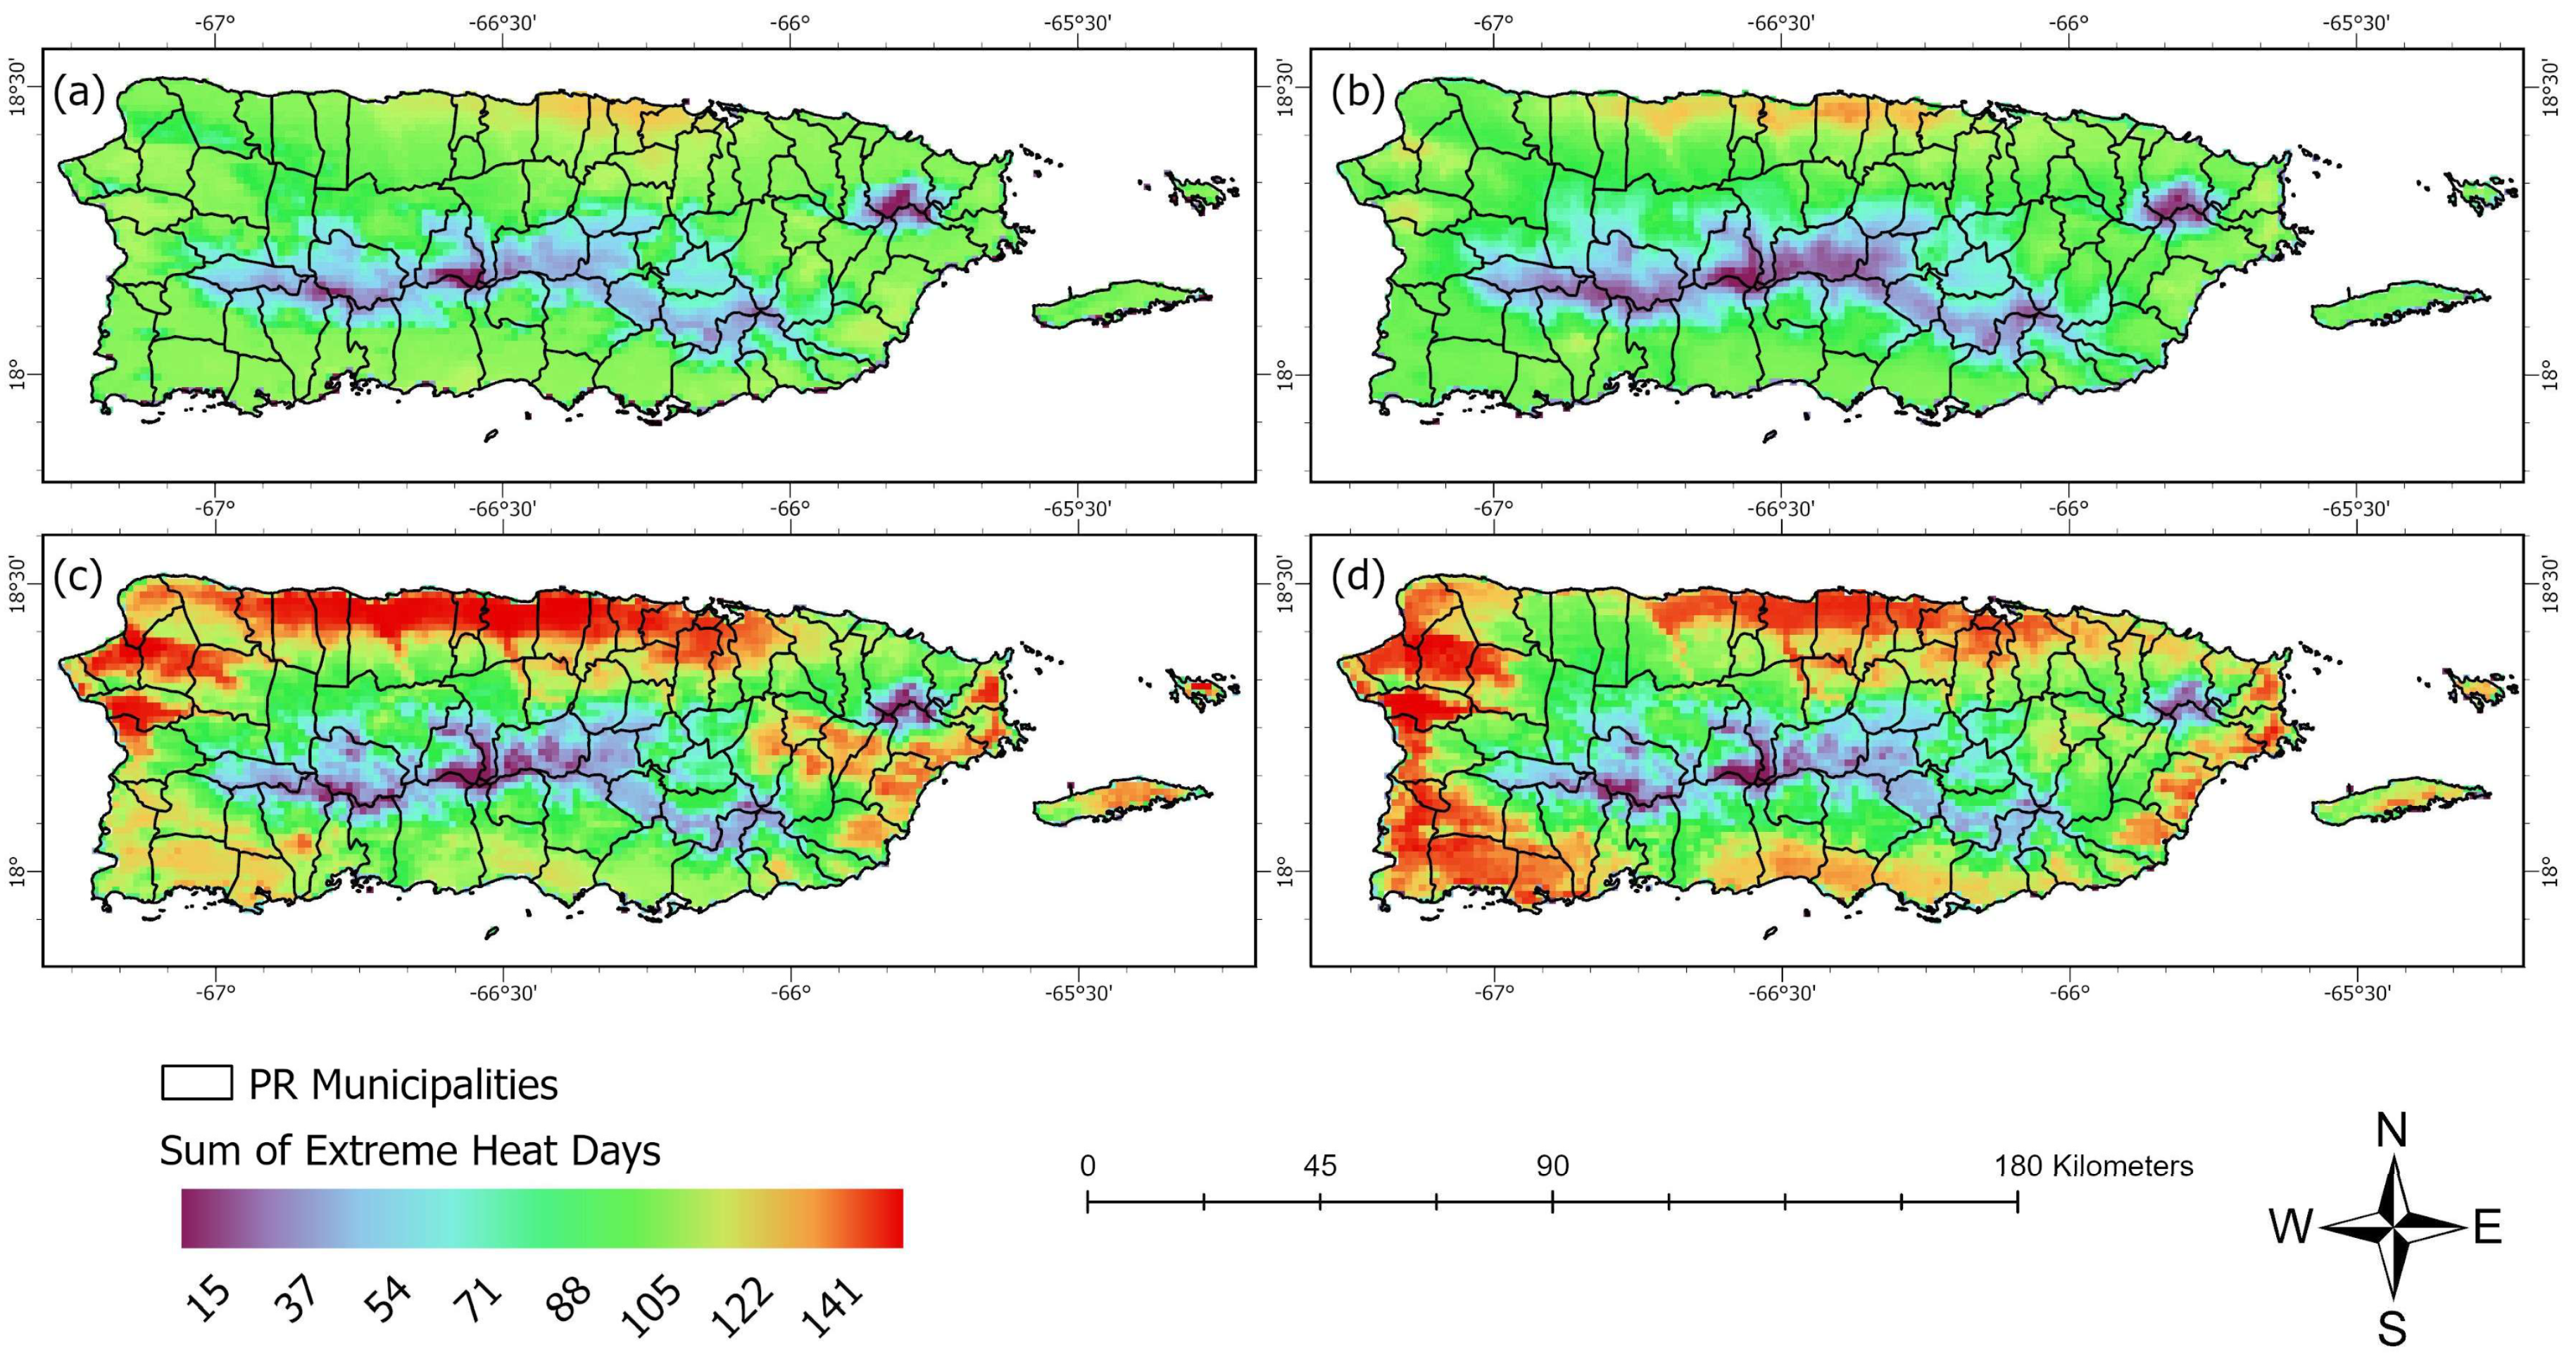
When the total number of days experiencing heat indexes at or above 39.4 °C (103 °F) around 2–4 pm are aggregated each year, we can observe that extreme heat frequency has contrasting spatial and temporal characteristics (Figure 6). The extreme heat frequency patterns for 2021 (Figure 6a) and 2022 (Figure 6b) are similar in their spatial characteristics, with a very narrow zone along the lower elevation areas of the northern coastal plains exhibiting a higher number of days (>100 or more) of extreme heat, while lower frequencies were found as we move to the interior region of the island. The sum of total extreme heat days for the year 2023 (Figure 6c) shows that some regions in the northern coastal plains and the lower elevation floodplains in the west exhibited almost five consecutive months (141 days) of heat indexes at or above 39.4 °C (103 °F) around 2–4 pm. It is important to note the extent of those extreme events in the floodplains of the rivers in Arecibo and Manati, with some high-frequency zones located deeper into the island (Figure 6c). The extreme heat events frequency map for 2024 (Figure 6d) shows a reduction in the high heat index zones in the northern region, yet lower elevation areas in the west, south, and east emerge as areas that experienced between 100 and 141 days of high apparent temperature in the afternoon hours. These results show that extreme heat frequency is becoming more pervasive across Puerto Rico, with dangerous apparent temperature zones expanding from the more exposed area in the northern coastal plains to all the lower elevation areas of the archipelago.
Figure 6.
Sum of all extreme heat days for the warm-season months of 2021 (a), 2022 (b), 2023 (c) and 2024 (d).
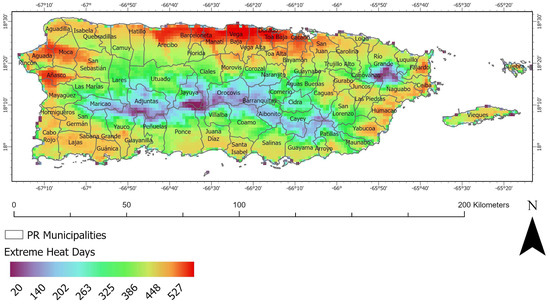
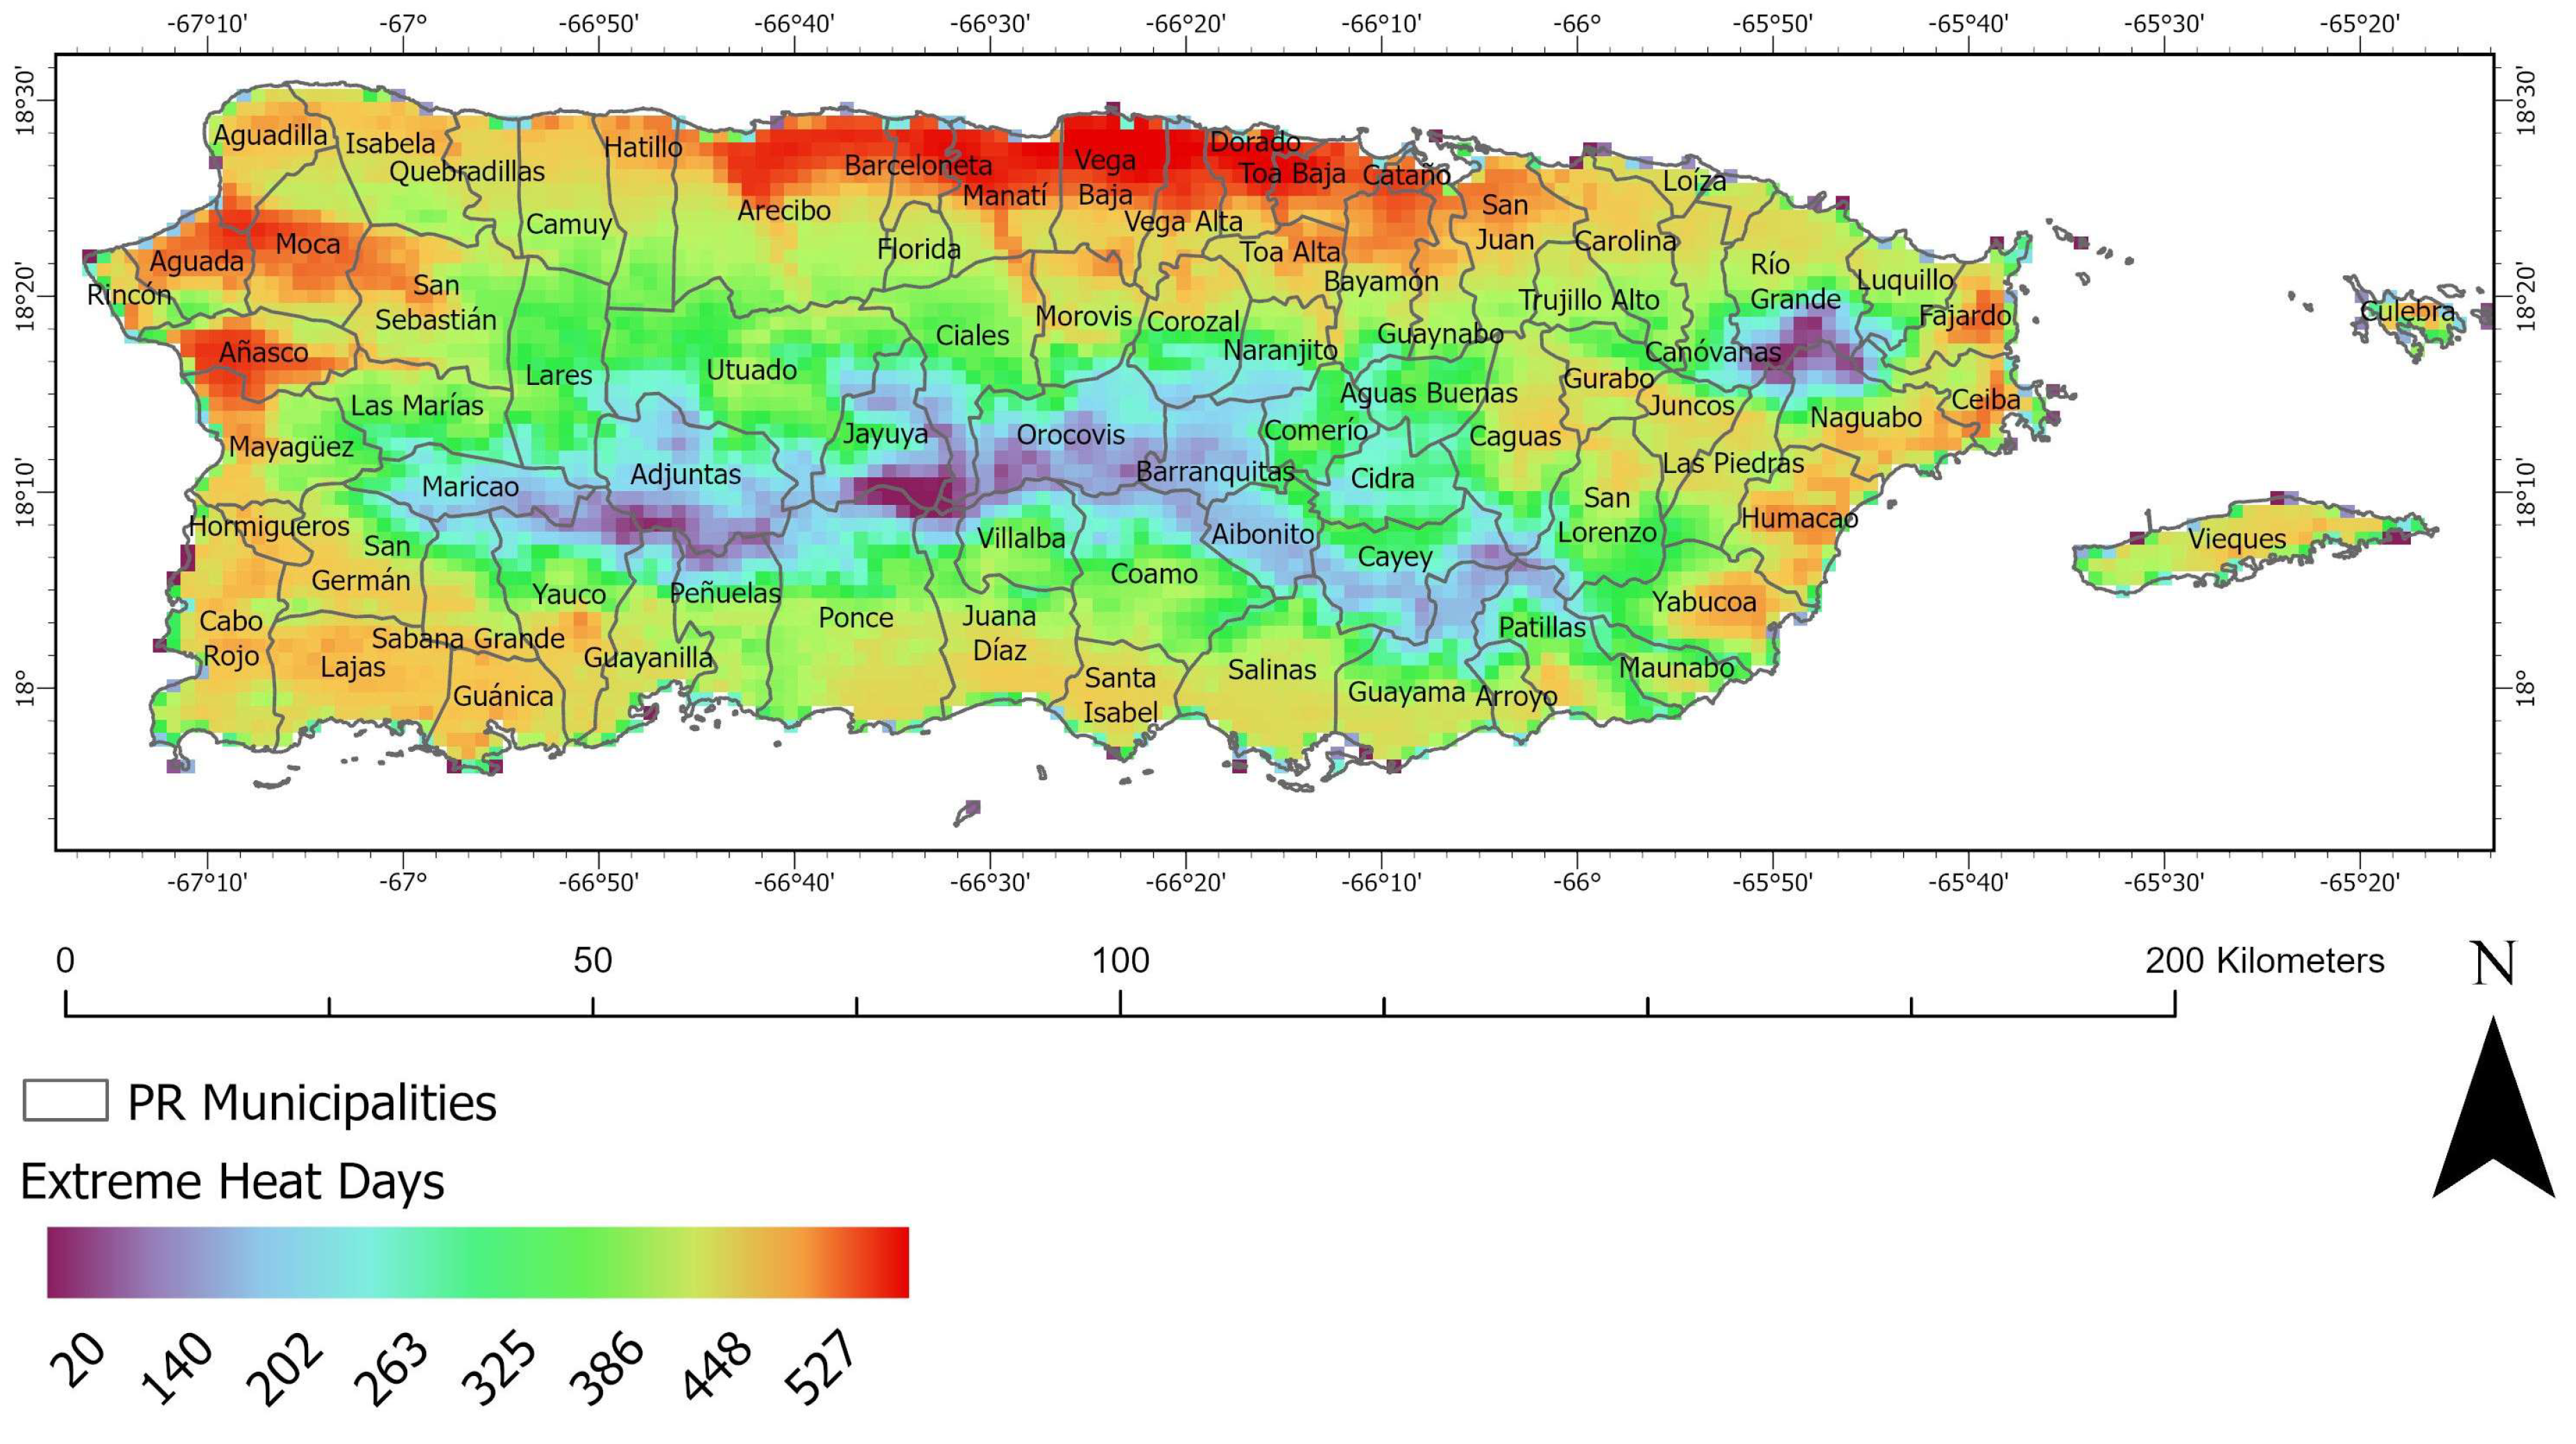
When all extreme heat events analyzed for the four years are combined, we can identify the most exposed areas across the island (Figure 7). The most important finding of this study is the identification of the northern coastal zone, from Arecibo to Bayamon, as the area with the highest exposure to dangerous heat in Puerto Rico. The northern coastal plains had the most municipalities that experienced heat indexes at 39.4 °C (103 °F) or above around 2–4 pm, with some areas experiencing more than 500 days of extreme late-afternoon heat during the four years that were analyzed (Figure 7). Using U.S. Census total population data per municipality for 2024, results show that the highly exposed northern corridor has an estimated population of 557,406 [30], which is around 17% of the population of Puerto Rico. The second most exposed area to extreme heat was the lower elevation areas of the northwest, especially the municipalities of Añasco, Moca and Aguada. The third zone in terms of dangerous afternoon heat exposure is the coastal lower elevation zones of the eastern region of Puerto Rico (Figure 7). When all of the municipalities that experienced more than 450 days of extreme heat for the warm-season months of 2021–2024 are combined, we find that 1,308,532 [30] people were exposed to dangerous heat conditions in the analyzed period, which represents 40% of the population of the island.
Figure 7.
Sum of all extreme heat days for the warm-season months (June–October) of the years 2021, 2022, 2023, and 2024.
3.3. Meteorological Drivers of Extreme Heat
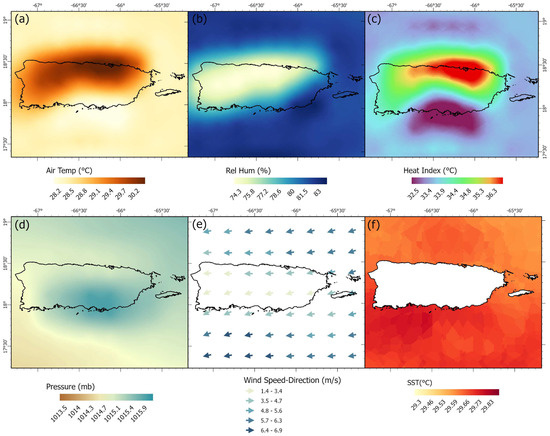
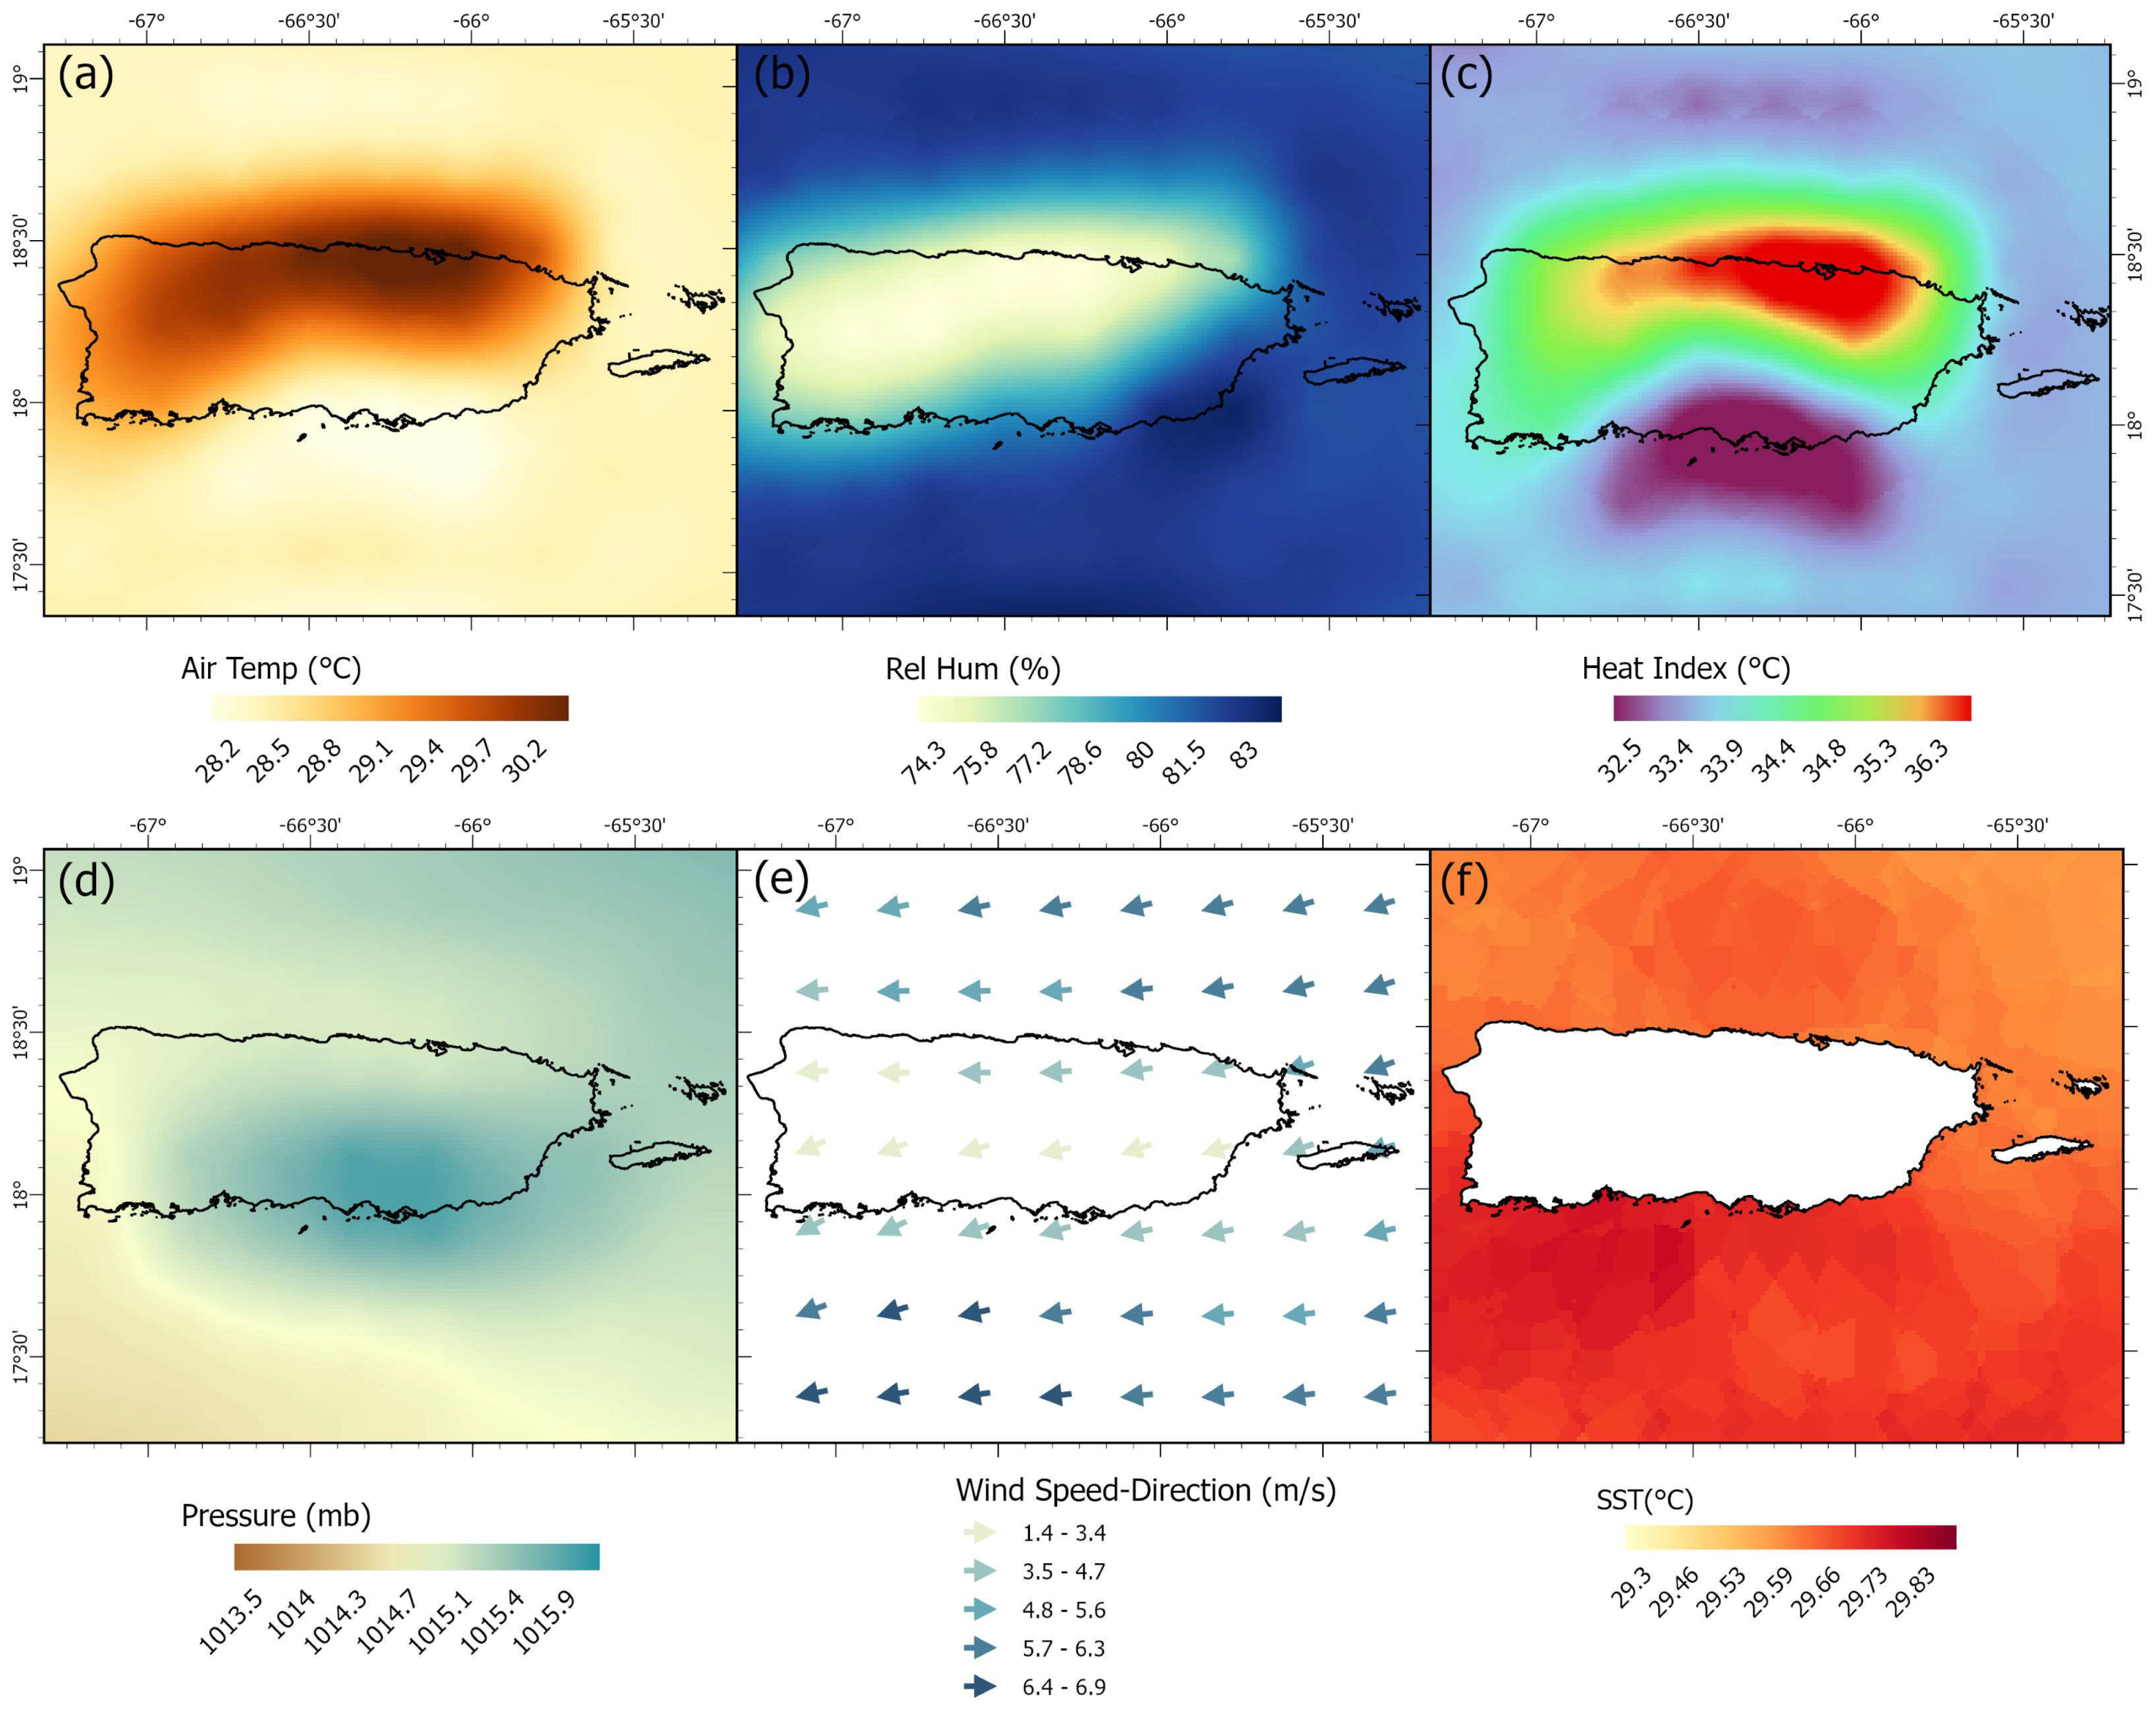
To better understand the atmospheric conditions associated with the spatial patterns of extreme heat identified in this study, ERA5 reanalysis datasets were analyzed for Puerto Rico and the surrounding waters during the afternoon period (2–4 pm) for August 2023. ERA5 fields were interpolated using ordinary kriging to a finer spatial grid, allowing for improved visualization of spatial gradients across Puerto Rico. This interpolation of the ERA5 variables was intended for visualization purposes and does not introduce new spatial information. The ERA5 surface temperature distribution shows elevated temperatures across the northern coastal plains and portions of the western region of the island (Figure 8a), while the relative humidity field indicates higher moisture levels across the northeastern, northwestern, and southeastern coastal zones (Figure 8b). When heat index values were calculated using these ERA5 temperature and humidity fields, the resulting spatial distribution (Figure 8c) closely matched the patterns derived from the NDFD heat index dataset. In particular, the ERA5-derived heat index also identified the northern coastal plains of Puerto Rico as the region most consistently exposed to extreme apparent temperatures, reinforcing the spatial patterns identified in this analysis. This result is consistent with previous studies showing that heat stress in warm tropical environments is strongly amplified when elevated air temperatures occur in combination with high atmospheric moisture rather than temperature alone [25,26,31].
Figure 8.
Meteorological drivers of extreme heat across Puerto Rico during August 2023 (2–4 pm ERA5 means): (a) air temperature, (b) relative humidity, (c) calculated heat index, (d) mean sea level pressure, (e) wind speed and direction vectors, and (f) sea surface temperature.
Additional meteorological variables were examined to evaluate the atmospheric processes contributing to these patterns. The ERA5 mean sea level pressure field indicates relatively weak pressure gradients across Puerto Rico during the analyzed period, with values ranging between approximately 1013 and 1016 mb (Figure 8d). These conditions are consistent with the influence of the Atlantic subtropical high-pressure system, which commonly affects the Caribbean during the summer months and contributes to stable atmospheric conditions. Wind vectors derived from ERA5 fields show a dominant east-to-west flow across the region (Figure 8e), with mean wind speeds generally ranging between approximately 3 and 6 m s−1, reflecting the prevailing Atlantic trade wind regime. These winds transport warm and moisture-laden maritime air toward the island and contribute to elevated humidity levels across coastal regions. This seasonal pattern is also consistent with the broader Caribbean summer circulation associated with the midsummer drought, during which stronger low-level easterlies and the North Atlantic subtropical high modulate moisture transport and convective suppression across the region [32].
Sea surface temperatures surrounding Puerto Rico during the analyzed period were also relatively high, averaging approximately 29–30 °C (Figure 8f). These warm ocean waters provide a continuous source of atmospheric moisture through evaporation, which can further enhance apparent temperature values when combined with high air temperatures and persistent onshore flow. Under these conditions, the interaction between warm sea surface temperatures, trade wind advection, and coastal topography favors the development of elevated heat index values across the coastal plains of Puerto Rico. Together, the spatial coherence among surface temperature (Figure 8a), relative humidity (Figure 8b), calculated heat index (Figure 8c), wind vectors (Figure 8e), and sea surface temperature (Figure 8f) provides a physically consistent explanation for the concentration of extreme heat in the northern coastal region identified in this study. These thermodynamic and circulation controls are consistent with prior work emphasizing the combined role of heat, humidity, and large-scale atmospheric forcing in producing dangerous heat conditions in tropical and subtropical environments [25,26,31].
The meteorological patterns identified in this analysis also provide useful insights for strategies aimed at reducing exposure to extreme heat across Puerto Rico. The results indicate that the highest apparent temperatures occur where elevated air temperatures coincide with high atmospheric humidity and warm surrounding sea surface temperatures, particularly along the northern coastal plains. These findings suggest that mitigation strategies should prioritize reducing surface heat accumulation and improving urban ventilation in densely populated coastal areas. Increasing urban vegetation and tree canopy coverage can enhance shading and evapotranspiration, thereby lowering surface and near-surface air temperatures. Similarly, the use of reflective or high-albedo materials in urban infrastructure can reduce heat storage in built environments. Because the analysis also highlights the role of prevailing trade winds in transporting warm and humid maritime air across the island, urban planning strategies that preserve natural airflow corridors and minimize obstruction of coastal breezes may further help reduce localized heat stress. Together, these measures can contribute to lowering heat exposure in vulnerable areas where the interaction of temperature, humidity, and coastal meteorological processes produces the highest heat index values. The consistency between ERA5-derived heat index patterns and the NDFD results provides independent support for the robustness of the spatial distribution of extreme heat identified in this study, particularly across the northern coastal plains of Puerto Rico.
4. Conclusions
This study was motivated by the growing recognition that extreme heat represents one of the most pressing climate-related hazards for tropical island environments, particularly in Puerto Rico, where high humidity, rapid coastal urbanization, and socioeconomic vulnerability intersect. The primary objective was to identify and characterize the spatial and temporal variability of extreme heat across the Puerto Rican archipelago using NOAA-modeled heat index data during the warm seasons of 2021–2024. By focusing on the 2–4 pm window, when apparent temperatures typically peak, this study aimed to capture conditions most relevant for human exposure, public health risk, and operational heat warnings. Through the integration of high-resolution gridded data and GIS-based analyses, the research sought to move beyond station-based assessments and provide an island-wide perspective on heat stress patterns, addressing a key knowledge gap in Caribbean heat climatology. This approach allows for the identification of persistent hotspots, seasonal intensification, and interannual variability in extreme heat conditions, offering a framework that is directly applicable to climate adaptation planning, infrastructure resilience, and heat-risk communication in Puerto Rico.
The analysis of mean maximum heat index surfaces revealed a robust and recurrent spatial structure of extreme thermal exposure across Puerto Rico. Low-elevation coastal plains, particularly along the northern region from San Juan to Hatillo, consistently exhibited the highest apparent temperatures, frequently exceeding the 103 °F (39.4 °C) danger threshold and, in recent years, surpassing 120 °F (48.8 °C). August emerged as the month with the highest mean maximum heat index across all study years, with September closely following behind, underscoring the intensification of late-summer heat stress. The years 2023 and 2024 were particularly notable, showing both higher magnitudes and a broader spatial extent of extreme heat relative to earlier years. These findings highlight the role of compounded heat–humidity conditions in shaping human thermal exposure and suggest that extreme apparent temperatures are becoming a structural feature of Puerto Rico’s warm-season climate. The implications are significant for energy demand, outdoor labor productivity, and public health, particularly in densely populated coastal municipalities where exposure coincides with urban heat island effects and limited nighttime cooling.
Beyond mean conditions, the analysis of extreme heat events revealed a marked increase in both the frequency and spatial reach of dangerous heat index values. During 2021 and 2022, extreme heat days were largely confined to narrow coastal zones, with interior and higher elevation areas experiencing fewer events. In contrast, the warm seasons of 2023 and 2024 exhibited widespread and persistent extreme heat, with some coastal and floodplain regions experiencing 20 to 31 consecutive days per month above the 103 °F threshold. When aggregated annually, parts of northern and western Puerto Rico experienced up to 141 days of extreme heat during peak afternoon hours, effectively spanning most of the warm season. These patterns indicate a transition from episodic heat events to sustained exposure regimes, which substantially increase cumulative heat stress and associated health risks. The expansion of high-frequency extreme heat zones into western, southern, and eastern coastal regions further suggests that vulnerability is no longer geographically limited, reinforcing the need for island-wide heat preparedness and targeted adaptation strategies, since around 40% of the population was found to be highly exposed.
The meteorological patterns identified in this study also provide guidance for strategies aimed at reducing exposure to extreme heat across Puerto Rico. The results indicate that the highest apparent temperatures occur in low elevation coastal regions where elevated air temperatures coincide with high atmospheric humidity and persistent maritime airflow. These conditions suggest that mitigation efforts should prioritize reducing surface heat accumulation and improving thermal comfort in densely populated coastal areas. Increasing urban vegetation and tree canopy coverage can enhance shading and evapotranspiration, helping to lower surface and near-surface air temperatures. Similarly, the use of reflective or high-albedo materials in roofs, pavements, and other built surfaces can reduce heat storage in urban environments. Because the analysis also highlights the influence of trade winds in transporting warm and humid air toward the island, urban planning strategies that preserve natural airflow corridors and minimize obstruction of coastal breezes may further help reduce localized heat stress. Implementing these strategies may contribute to lowering heat exposure in vulnerable communities where the combined effects of high temperature and humidity produce the highest heat index values.
Overall, this study makes a key contribution by providing the first comprehensive, island-scale assessment of extreme heat patterns in Puerto Rico using operationally relevant NOAA-modeled heat index data. The findings offer actionable insights for public health agencies, planners, and emergency managers, particularly in the context of evolving National Weather Service heat-risk communication and warning frameworks. Nonetheless, several limitations should be acknowledged. The reliance on modeled apparent temperature data may not fully capture microclimatic variability, especially in complex urban environments, and the focus on peak afternoon hours does not address nighttime heat stress, which is increasingly recognized as critical for health outcomes. Future research should integrate observational data, urban morphology, land cover, and socioeconomic indicators to better quantify exposure and vulnerability. Expanding the temporal scope beyond 2024, examining in depth the meteorological conditions of extreme heat events and incorporating projections under future climate scenarios would further enhance understanding of long-term heat risk in Puerto Rico. Together, these efforts will be essential for developing equitable and effective heat adaptation strategies in a warming tropical climate.
Author Contributions
Conceptualization, J.J.H.A. and R.M.-T.; methodology, J.J.H.A. and R.M.-T.; software, K.V.V.C. and J.A.H.L.; validation, J.J.H.A.; formal analysis, J.J.H.A., K.V.V.C. and J.A.H.L.; investigation, J.J.H.A. and R.M.-T.; resources, J.J.H.A. and R.M.-T.; data curation, K.V.V.C. and J.A.H.L.; writing—original draft preparation, J.J.H.A.; writing—review and editing, J.J.H.A. and R.M.-T.; visualization, J.J.H.A., K.V.V.C. and J.A.H.L.; supervision, J.J.H.A. and R.M.-T.; project administration, J.J.H.A.; funding acquisition, J.J.H.A. All authors have read and agreed to the published version of the manuscript.
Funding
This research received no external funding.
Data Availability Statement
Apparent temperature (heat index) modeled data for Puerto Rico used in this study can be obtained from the National Digital Forecast Database (NDFD) https://www.ncei.noaa.gov/thredds/catalog/model-ndfd-file_kwbn/catalog.html, accessed on 24 August 2025.
Acknowledgments
We would like to thank the team of the National Weather Service in San Juan Puerto Rico for guiding us in the process of obtaining the NOAA-NDFD modeled apparent temperature (heat index) data used in this study.
Conflicts of Interest
The authors declare no conflicts of interest.
References
- Grant, L.; Vanderkelen, I.; Gudmundsson, L.; Fischer, E.; Seneviratne, S.I.; Thiery, W. Global emergence of unprecedented lifetime exposure to climate extremes. Nature 2025, 641, 374–379. [Google Scholar] [CrossRef] [Scilit] [PubMed]
- Callahan, C.W.; Trok, J.; Wilson, A.J.; Gould, C.F.; Heft-Neal, S.; Diffenbaugh, N.S.; Burke, M. Increasing risk of mass human heat mortality if historical weather patterns recur under global warming. Nat. Clim. Change 2025, 16, 26–32. [Google Scholar] [CrossRef] [Scilit]
- Copernicus Climate Change Service. Global Climate Highlights 2024. 2025. Available online: https://climate.copernicus.eu/global-climate-highlights-2024 (accessed on 3 December 2025).
- Lüthi, S.; Fairless, C.; Fischer, E.M.; Scovronick, N.; Ben Armstrong Coelho, M.S.Z.S.; Guo, Y.L.; Guo, Y.; Honda, Y.; Huber, V.; Kyselý, J.; et al. Rapid increase in the risk of heat-related mortality. Nat. Commun. 2023, 14, 4894, Erratum in Nat. Commun. 2024, 15, 8110. [Google Scholar] [CrossRef] [Scilit]
- Di Napoli, C.; Allen, T.; Méndez-Lázaro, P.A.; Pappenberger, F. Heat stress in the Caribbean: Climatology, drivers, and trends of human biometeorology indices. Int. J. Climatol. 2023, 43, 405–425. [Google Scholar] [CrossRef] [Scilit] [PubMed]
- Boakye, O.F.; Keneshia, H.; Jorge, G.C. Extreme Heat in the Caribbean: Impacts on Wellbeing and Buildings Energy Infrastructure—The 2023 Summer Case. ASME J. Eng. Sustain. Build. Cities 2024, 5, 031007. [Google Scholar] [CrossRef] [Scilit]
- MMéndez-Lázaro, P.A.; Pérez-Cardona, C.M.; Rodríguez, E.; Martínez, O.; Taboas, M.; Bocanegra, A.; Méndez-Tejeda, R. Climate change, heat, and mortality in the tropical urban area of San Juan, Puerto Rico. Int. J. Biometeorol. 2018, 62, 699–707. [Google Scholar] [CrossRef] [Scilit]
- Méndez-Lázaro, P.A.; Cabrera-Rivera, L.T.; Rueda-Roa, D.; Muller-Karger, F.E.; Morales, M.H.; Sánchez-Sepúlveda, M.V.; Rodríguez, E.; Martínez, O.; Morales, E.; Chardón-Maldonado, P.; et al. Assessing the impacts, risks, and vulnerabilities of extreme heat in learning environments of Puerto Rico in 2023. J. Clim. Change Health 2025, 26, 100581. [Google Scholar] [CrossRef] [Scilit]
- Velazquez-Lozada, A.; Gonzalez, J.E.; Winter, A. Urban heat island effect analysis for San Juan, Puerto Rico. Atmos. Environ. 2006, 40, 1731–1741. [Google Scholar] [CrossRef] [Scilit]
- González, J.E.; Luvall, J.C.; Rickman, D.; Comarazamy, D.; Picón, A.; Harmsen, E.; Tepley, C.A. Urban heat islands developing in coastal tropical cities. Eos Trans. Am. Geophys. Union 2005, 86, 397–403. [Google Scholar] [CrossRef] [Scilit]
- Ayala, J.J.H.; Tejeda, R.M.; Santos, F.L.S.; Rolón, N.A.V.; Cruz, N.M. Trends in Annual, Seasonal, and Daily Temperature and Its Relation to Climate Change in Puerto Rico. Atmosphere 2025, 16, 737. [Google Scholar] [CrossRef] [Scilit]
- Puerto Rico Climate Change Council. Puerto Rico’s State of the Climate 2014–2021: Assessing Puerto Rico’s Social-Ecological Vulnerabilities in a Changing Climate. Puerto Rico Coastal Zone Management Program, Department of Natural and Environmental Resources. 2022. Available online: https://www.pr-ccc.org/wp-content/uploads/2023/06/PR_StateOfTheClimate_2014-2021_PRCCC-09-2022-1.pdf (accessed on 21 October 2025).
- Comité de Expertos y Asesores sobre Cambio Climático. Borrador Final del Plan de Mitigación, Adaptación y Resiliencia al Cambio Climático en Puerto Rico (Tomos 1 y 2). Departamento de Recursos Naturales y Ambientales, Gobierno de Puerto Rico. 2024. Available online: https://www.scribd.com/document/756634455/Borrador-Final-Del-Plan-de-Mitigacion-Adaptacion-y-Resiliencia-Al-Cambio-Climatico-en-Puerto-Rico (accessed on 20 April 2026).
- Méndez-Lázaro, P.; Muller-Karger, F.E.; Otis, D.; McCarthy, M.J.; Rodríguez, E. A heat vulnerability index to improve urban public health management in San Juan, Puerto Rico. Int. J. Biometeorol. 2018, 62, 709–722. [Google Scholar] [CrossRef] [Scilit] [PubMed]
- Méndez-Lázaro, P.A.; Di Napoli, C.; Rivas-Tumanyan, S.; Pérez-Ríos, N.; Sepúlveda, L.G.; Rodríguez, E.; Milán, L. Too hot and too humid in the Caribbean: Impacts of extreme heat events and non-accidental mortality in the tropical island of Puerto Rico (2015–2020). J. Clim. Change Health 2025, 25, 100484. [Google Scholar] [CrossRef] [Scilit] [PubMed]
- Vaidyanathan, A. Heat-related emergency department visits—United States, may–september 2023. MMWR. Morb. Mortal. Wkly. Rep. 2024, 73, 324–329. [Google Scholar] [CrossRef] [Scilit] [PubMed]
- Olson, M.; Sutton, J. Bridging the Gap between National Weather Service Heat Terminology and Public Understanding. Bull. Am. Meteorol. Soc. 2025, 106, E836–E848. [Google Scholar] [CrossRef] [Scilit]
- Weinberger, K.R.; Zanobetti, A.; Schwartz, J.; Wellenius, G.A. Effectiveness of National Weather Service heat alerts in preventing mortality in 20 US cities. Environ. Int. 2018, 116, 30–38. [Google Scholar] [CrossRef] [Scilit]
- National Weather Service. National Digital Forecast Database (NDFD): Apparent temperature grids for June–August 2021–2024 [Data set]. National Oceanic and Atmospheric Administration. 2024. Available online: https://www.ncei.noaa.gov/oa/prod-model/index.html#national-digital-forecast-database/ (accessed on 10 September 2025).
- Colón, J.A. Climatología de Puerto Rico; University of Puerto Rico Press: San Juan, Puerto Rico, 2009. [Google Scholar]
- National Weather Service. What Is the Heat Index; National Oceanic and Atmospheric Administration: Silver Spring, MD, USA, 2025. Available online: https://www.weather.gov/ama/heatindex (accessed on 24 September 2025).
- Jacklitsch, B.; Williams, W.; Musolin, K.; Coca, A.; Kim, J.-H.; Turner, N. Criteria for a Recommended Standard: Occupational Exposure to Heat and Hot Environments (NIOSH Publication No. 2016-106); National Institute for Occupational Safety and Health: Washington, DC, USA, 2016. Available online: https://www.cdc.gov/niosh/docs/2016-106/ (accessed on 24 September 2025).
- Arbury, S.; Jacklitsch, B.; Farquah, O.; Hodgson, M.; Lamson, G.; Martin, H.; Profitt, A. Heat illness and death among workers—United States, 2012–2013. Morb. Mortal. Wkly. Rep. 2014, 63, 661–665. [Google Scholar]
- Hersbach, H.; Bell, B.; Berrisford, P.; Hirahara, S.; Horányi, A.; Muñoz-Sabater, J.; Nicolas, J.; Peubey, C.; Radu, R.; Schepers, D.; et al. The ERA5 global reanalysis. Q. J. R. Meteorol. Soc. 2020, 146, 1999–2049. [Google Scholar] [CrossRef] [Scilit]
- Mora, C.; Dousset, B.; Caldwell, I.R.; Powell, F.E.; Geronimo, R.C.; Bielecki, C.R.; Counsell, C.W.W.; Dietrich, B.S.; Johnston, E.T.; Louis, L.V.; et al. Global risk of deadly heat. Nat. Clim Change 2017, 7, 501–506. [Google Scholar] [CrossRef] [Scilit]
- Raymond, C.; Matthews, T.; Horton, R.M. The emergence of heat and humidity too severe for human tolerance. Sci. Adv. 2020, 6, eaaw1838. [Google Scholar] [CrossRef] [Scilit]
- IPCC. AR6 Synthesis Report: Climate Change 2023. Intergovernmental Panel on Climate Change. 2023. Available online: https://www.ipcc.ch/report/ar6/syr/ (accessed on 2 October 2025).
- Matthews, T.K.R.; Wilby, R.L.; Murphy, C. Communicating the deadly consequences of global warming for human heat stress. Proc. Natl. Acad. Sci. USA 2017, 114, 3861–3866. [Google Scholar] [CrossRef] [Scilit]
- Vicedo-Cabrera, A.M.; Scovronick, N.; Sera, F.; Royé, D.; Schneider, R.; Tobias, A.; Astrom, C.; Guo, Y.; Honda, Y.; Hondula, D.M.; et al. The burden of heat-related mortality attributable to recent human-induced climate change. Nat. Clim. Change 2021, 11, 492–500. [Google Scholar] [CrossRef] [Scilit]
- US Census Bureau. Annual Estimates of the Resident Population for Puerto Rico Municipios: 1 April 2020 to 1 July 2024 (Vintage 2024). U.S. Department of Commerce. 2024. Available online: https://www.census.gov/data/datasets/time-series/demo/popest/2020s-total-puerto-rico-municipios.html (accessed on 4 December 2025).
- Sherwood, S.C.; Huber, M. An adaptability limit to climate change due to heat stress. Proc. Natl. Acad. Sci. USA 2010, 107, 9552–9555. [Google Scholar] [CrossRef] [Scilit]
- Curtis, S.; Gamble, D.W. Regional variations of the Caribbean mid-summer drought. Theor. Appl. Climatol. 2008, 94, 25–34. [Google Scholar] [CrossRef] [Scilit]

Disclaimer/Publisher’s Note: The statements, opinions and data contained in all publications are solely those of the individual author(s) and contributor(s) and not of MDPI and/or the editor(s). MDPI and/or the editor(s) disclaim responsibility for any injury to people or property resulting from any ideas, methods, instructions or products referred to in the content. |
© 2026 by the authors. Licensee MDPI, Basel, Switzerland. This article is an open access article distributed under the terms and conditions of the Creative Commons Attribution (CC BY) license.