


Abstract
This paper investigates the different relaxation channels of a single symmetric top NH3 and a spherical top CH4 molecule trapped at low temperature in a clathrate hydrate nano-cage in the infrared absorption domain of their vibrational degrees of freedom. The approach utilizes the Born–Oppenheimer approximation and the extended site inclusion model applied to CO2 in a previous work, which was based on pairwise atom–atom effective interaction potentials. The calculations show that trapping the methane or ammonia molecule is energetically more favorable in a type sI clathrate structure than in an sII one, and entropic considerations show that methane can be released much more easily than ammonia from clathrate hydrate nano-cages. In the small (s) and large (l) nano-cages with the sI structure, the CH4 molecule exhibits a more or less perturbed rotational motion, while the NH3 molecule shows a strongly hindered orientational motion that tends to a three-dimension librational motion (oscillation motion) around its orientational equilibrium configuration. The calculated orientational energy level schemes are quite different from those of the molecular free rotation. In the static field inside the cage, degenerate and vibrational modes of methane and ammonia molecules are shifted and split. Moreover, for ammonia molecules, the and modes are shifted, and the inversion motion is no longer allowed. The non-radiative and radiative relaxation channels of CH4, NH3 and CO2 in clathrate nano-cages are discussed with reference to the matrix isolation spectroscopic results. Upon laser excitation, then, from the energy levels calculated for the different degrees of freedom, NH3 and CO2 are expected to fluoresce, while for CH4, non-radiative relaxation should lead to evaporation at the surface of clathrates. Experimental setups are suggested to localize and study these species underneath ice surfaces on distant planets or planetesimals from mobile detectors such as drones or CubeSats equipped with appropriate laser sources and telescopes with 2D imaging detectors.
1. Introduction
Clathrate hydrates are suspected to be extensively present on several planets (Earth, Uranus, …), satellites (Titan, satellite of Saturne [1], …) and comets (67P/Churyumov-Gerasimenko [2,3], for example) of the solar system as well as in ice mantles of dust in the interstellar medium (ISM).
Clathrate hydrates are characterized by a compact assembly consisting of water nano-cages that naturally contain some small guest molecules, such as CO2, CH4, NH3, N2, C2H6, etc., or atoms, such as noble gas atoms that stabilize their formation under suitable conditions of low temperature and high pressure.
Planetologists are thus concerned with the possible impact of clathrate on the distribution of the planet’s volatiles and on the modification of their atmosphere’s compositions. For example, several gas species observed in the martian atmosphere (CO2, CH4, noble gases) could have been stored in subsurface clathrate reservoirs in the past [4,5].
The major challenge of today’s planetary sciences is then to observe clathrate hydrates on other bodies of the solar system like comets, giants planets and the satellite Titan of Saturne.
Among several known clathrate hydrates, those of CH4 and CO2 have drawn close attention from the scientific community due to their use as potential sources of energy [6,7] and in CO2 sequestration [8], respectively.
Thus, it is of great interest to correctly determine the amount of species potentially trapped in the cages of clathrates, i.e., the fractional occupancy of guest species under the thermodynamic conditions, pressure and temperature, prevailing in the regions where clathrates might form [9,10,11], for example, planet Mars, which is being targeted in a near future to be colonized.
High-resolution Raman and infrared spectroscopy are powerful tools to observe molecules trapped in condensed environments, such as clathrate hydrates [12,13,14,15,16,17,18,19]. In particular, the detection of CH4 and NH3 clathrate hydrates on some of bodies of the solar system is theoretically possible. This allows then a prediction of the quantity expected to be measured when a given surface area is sensed with an appropriate device.
In low-temperature clathrate hydrates, the vibrational spectrum of a guest molecule trapped in nano-cages has different infrared frequencies from those observed in the gas phase. The spectra are generally simpler as the rotational and translational degrees of freedom of the trapped molecule are hindered inside the cavities. The vibrational shifts are relatively small: typically less than 1% of the observed gas phase frequencies. They can be determined by assuming that the intramolecular electronic potential that drives the nuclear motions of the trapped molecule is slightly perturbed.
The purpose is to compare the entropy of the two studied molecular systems, methane and ammonia, in a clathrate nano-cage in an attempt to predict the evolution of the clathrate when methane and ammonia are subjected to infrared absorption from sunlight or any other radiation source, natural or artificial, through the increase in entropy of the system from its clathrate form. From the results of the calculations, an experimental method to observe and measure these systems can then be in principle formulated. It is necessary then to also calculate the expected line intensities and frequency centers where the band centers can be localized. This can be performed by applying the Born–Oppenheimer approximation to the different degrees of freedom of methane or ammonia molecules trapped in clathrate nano-cages. It allows one to calculate the energy levels; then, from the partition function, the entropy of the trapped system can be numerically evaluated.
To simulate the infrared spectra of CH4 or NH3 trapped in clathrate nano-cages, we applied the same site inclusion model that was successfully used to analyze spectra of CO2 isotopologues trapped in clathrate hydrates [20], O3 and CO2 and N2O trapped in rare gas matrices [21,22,23,24,25], and NH3 trapped in a rare gas matrix [26].
In this model, the approach considered to calculate the long-range interactions between the guest molecule and the host H2O molecules consists of the determination of the static electric field present in the nano-cage using effective charges on the water molecules of the cage.
The perturbation of the electronic potential driving the nuclear motions of the trapped CH4 or NH3 molecule is then computed from the interaction between these effective charges and those on the trapped molecule.
When the molecule is trapped in the clathrate cage, the interaction with water molecules in the short-range scale modifies the translational and rotational degrees of freedom because the molecule is no longer free to move. The rotational degrees of freedom are then perturbed, and the rotational level scheme is very complex relative to the gas phase scheme.
To calculate the bar spectra of CH4 or NH3 trapped in a nano-cage, a renormalization procedure is applied to the total Hamiltonian of the system. The dynamical coupling between the molecular degrees of freedom and those of the cage is then small enough, at least to a first approximation, to justify the use of an initial chaos hypothesis. As a result, the density matrix operator of the system can be factorized into a product consisting of two terms: one related to the CH4 or NH3 renormalized optical states and the other to cage both states spanned by its vibrational modes. The dynamical line shifts and line widths of the bar spectra can be disregarded and clathrate cage considered as rigid.
The interaction potential model used in our calculations is presented in Section 2, and the renormalization method applied to separate the different motions from each other is described. The Hamiltonian of the encaged CH4 or NH3 molecule is presented in Section 3, and the results of the calculations of the frequency shifts of the vibrational modes and the orientational levels schemes of the molecule are then given. In Section 4, we present the calculation method of the entropy of the molecule-clathrate systems. Section 5 is devoted to a presentation of the formalism used for the construction of the infrared bar spectra. The calculated spectra are then presented and compared when possible to experimental ones.
2. Structure and Potential Model
2.1. CH4 and NH3 Clathrate Hydrates Systems
Clathrate hydrates are ice-like lattices of water molecules, which form periodic structure matrices containing guest atoms and/or molecules (Fleyfel and Devlin [27]; Sloan and Koh [28]; Buch et al. [29]; Devlin [30]; Ripmeester and Ratcliffe [31]; Dartois et al. [15,16,17,18]). Their stability is ensured by the hydrogen bonds between water molecules as well as the van der Waals bonds (no hydrogen bonds) between the trapped species and the surrounding water molecules.
Different clathrate structures are known; the more abundant structure types are (i) the cubic structures I and II, which form in the presence of single guest species, on one hand, and (ii) the hexagonal structure H, which needs the presence of two small guest species or one large guest species, on the other hand [6]. The two most common types “structure I” and “structure II” are presented in Figure 1.
Figure 1.
Small and large cavities which form the sI and sII structures of the clathrate hydrate matrices.
In structure I (sI), the unit cell is composed of 46 water molecules constituting 2 small cavities 512 formed with 12 pentagons and 6 large cavities 51262 formed with 12 pentagons and 2 hexagons facing each other and each of which is surrounded by 6 pentagons. The unit cell can incorporate up to 8 guest molecules. In structure II (sII), the unit cell consists of 136 water molecules which form 16 small cavities 512 and 8 large cavities 51264 formed with 12 pentagons and 4 hexagons, each surrounded by 6 pentagons. The unit cell can incorporate up to 24 guest molecules.
Thus, in the following, only the cubic sI and sII structures, comprising 4 × 4 × 4 unit cells (containing up to 2944 water molecules) for the structure sI and 3 × 3 × 3 unit cells (containing up to 3672 water molecules) for the structure sII, respectively, are considered to simulate the infrared spectra of CH4 or NH3 molecules as simple guests trapped in a cage of a clathrate matrix. These matrices are quite large to provide a good convergence of the interaction potential energies.
Figure 2a,b show the trapping model of a guest molecule in the small and large cavities of the structure type sI as well as the absolute frames (O,X,Y,Z) defined along symmetry axes. The oxygen and hydrogen atom positions in each matrix are defined with respect to the corresponding absolute frame.
Figure 2.
Inclusion of a CH4 (or NH3) molecule into the clathrate small (a) and large (b) cages of the sI structure type. Clathrate hydrogen atoms are not represented.
Figure 3 gives the geometrical characteristics of the guest CH4–H2O interacting pairwise molecules, and it shows the internal positions of the atoms in the guest molecule with respect to its frame (G,x,y,z) and its external orientational = () (precession, nutation and proper rotation) and translational (center of mass position vector) degrees of freedom with respect to the absolute frame (O,X,Y,Z) tied to the clathrate matrix. The unitary rotational matrix used to transfer from this absolute frame to the molecular frame is given in Appendix A.
Figure 3.
Geometrical characteristics of a CH4 molecule interacting with a water molecule of the clathrate matrix. (O,X,Y,Z) and (G,x,y,z) are the absolute frame tied to the matrix and the molecular frame, respectively.
2.2. Total Hamiltonian of the Molecule Clathrate System
The total Hamiltonian of the system composed of a single guest molecule, assumed to be in its ground electronic state, trapped in a clathrate nano-cage, is shown below:
In this equation, and are, respectively, the kinetic rotational and translational operators expressed as
where , and are the rotational constants and the mass of the molecule, and is the conjugate momentum operator of translation along direction (X,Y,Z) of the absolute frame.
In Equation (1), is the Hamiltonian of the internal vibrational motions of the molecule in the gas phase state given by
where and are the reduced mass and the conjugate momentum operator, which are connected to the th vibrational mode with dimensionless normal coordinate and frequency . The second term represents the internal potential energy surface, which is generally given in a Taylor series expansion with respect to the normal coordinates. It can be separated into harmonic (second order) parts with force constants and anharmonic (higher order) parts, which represents a small perturbation as
Finally, in Equation (1), is the interaction potential energy between the guest molecule and the clathrate water molecules, and is the Hamiltonian associated with all the degrees of freedom of the clathrate water molecules, in the absence (which is hypothetical, since the clathrate hydrates form only in the presence of the gas species) of the trapped molecule, including their internal vibration, orientational and translational (vibration of their respective center of mass) motions.
However, since clathrate hydrates are structures that form under significant high pressures and at low temperatures, due to the strong hydrogen bonds between the hydrogen and oxygen atoms of different water molecules, it is reasonable to study the spectroscopic phenomena of the molecule trapped in a crystal assumed to be rigid, and consequently, the Hamiltonian will be ignored in the following calculations.
2.3. Interaction Potential Energy
The interaction potential energy between the trapped CH4 (or NH3) molecule and the rigid clathrate nano-cage is modeled as the sum of 12-6 Lennard–Jones (LJ) pairwise atom–atom potentials characterizing the repulsion–dispersion contributions and the electrostatic part due to the charge–charge interaction between the atomic charges in the CH4 (or NH3) molecule and the atomic charges in the clathrate water molecules. It can be expressed as
where is the distance vector between the ith atom, with charge , of the guest molecule and the jth atom, with charge , of the kth water molecule of the clathrate matrix, respectively; meanwhile, and are the mixed LJ potential parameters, which are obtained from the usual Lorentz–Berthelot combination rules and .
The values of the Lennard–Jones potential parameters and and of the various methane, ammonia and water characteristic parameters are given, respectively, in Table 1 and Table 2. In Equation (6), is the number of water molecules in the clathrate matrix.
Table 1.
Lennard–Jones potential parameters values used in our calculations.
Table 2.
CH4, NH3 and H2O characteristic parameters used in our calculations.
In this table, the values are obtained from ref. [10,11] and references therein, and the energy conversion factor is 1 mev = 8.06554 cm−1.
The values of the effective electric charges used in our calculations are obtained from references [32,33].
2.4. Separation Model of and Renormalized Hamiltonian
The distance vector in Equation (6) and Figure 3 can be expressed in terms of the position vector r of the molecular center of mass (c.m.), the position vector of the jth atom of the kth water molecule with respect to the absolute frame (O,X,Y,Z), and the position vector of the ith atom of the guest molecule with respect to its associated frame (G,x,y,z), as
Thus, to determine the influence of the surroundings on the molecular internal motions, the position vectors of the atoms in the molecule and the molecular dipole moment operator can be expressed in a series expansion with respect to the molecular frame in terms of the dimensionless vibrational normal coordinates {}.
Taking only the first order terms leads to
In these expressions, is the position vector of the ith atom in the CH4 (or NH3) rigid molecule, and is its permanent dipole moment vector; meanwhile, and are the first derivatives of and with respect to the dimensionless normal coordinate , which describes the th molecular vibrational mode with frequency . Note that the expression of will be used in the near and far-infrared spectra calculations.
Using the Born–Oppenheimer approximation (adiabatic approximation) allows us to separate the high-frequency vibrational modes {} of the molecule from its low-frequency external modes—that is, the orientation and c.m. translation r() motions around its equilibrium orientation () and c.m. position (). Then, the interaction potential energy can be written as
where represents the low-frequency motions-dependent part of the potential energy for the non-vibrating molecule. However, since this work is devoted to the construction of the infrared bar spectra of the guest molecule trapped in the clathrate hydrates, can be written as
where the first term is the minimum interaction energy value associated with the equilibrium configuration (position and orientation) of the rigid molecule in its cage. The second and third terms characterize, respectively, the orientational motion for the molecule at its equilibrium position and the translational motion of the molecule (that is, its c.m. motion) at its equilibrium orientation . The last term in Equation (11) represents the dynamic orientation–translation coupling, which is responsible for energy transfers between the orientational motion and the translational motion (also called, phase relaxation), and it can induce a shifting and broadening of the spectral lines of the bar spectrum. Therefore, this coupling will be ignored in the preliminary calculations.
In Equation (10), characterizes the vibrational-dependent part for the molecule at its equilibrium position and orientation. It is generally a small perturbation which involves only vibrational-level shifts and/or splittings. It can be expanded in a power series up to a second order with respect to the dimensionless vibrational normal coordinates {} as
The last term of Equation (10) characterizes the dynamic coupling between the internal and the external modes (vibration–orientation–translation), which can lead to energy transfers between the vibrational modes and the orientational and translational modes (also called, vibrational relaxation). It is not considered in this paper.
Finally, according to the previous potential energy separation model, the renormalized Hamiltonian of the guest molecule trapped in the rigid clathrate nano-cage can be written as
2.5. Potential Energy Surfaces
Equilibrium Configurations
The first step in our numerical calculations involves the search of the equilibrium configuration of the rigid guest molecule into the clathrate cages. The potential energy (see Equation (10)) is minimized with respect to both the external molecular degrees of freedom, that is, the c.m. translational coordinates and the orientational angles.
The obtained equilibrium configurations ((), ()) and the corresponding minimum energy values for CH4 and NH3 trapped in the small and large cavities of the sI and sII structures are given in Table 3 and Table 4.
Table 3.
Equilibrium configurations and minimum energies of the CH4 molecule trapped in the small and large cages of the sI and sII structures.
Table 4.
Equilibrium configurations and minimum energies of the NH3 molecule trapped in the small and large cages of the sI and sII structures.
A rapid comparison of the minimum energy values associated with each system “guest molecule–structure–cage”, clearly shows the following:
- (i)
- The formation of the CH4-clathrate sI structure with energies −266.6 and −263.4 meV, respectively, for the small and large cages, is more favorable than that of the CH4-clathrate sII one with energies −238.1 and −229.3 meV, respectively, for the small and large cages, which is consistent with the results of Sloan and Koh [28];
- (ii)
- The formation of the NH3-clathrate sI structure with energies −468.7 and −450.4 meV, respectively, for the small and large cages, is much more favorable than that of the NH3-clathrate sII one with energies −307.1 and −237.0 meV, respectively, for the small and large cages. Then, in the following, we will focus our calculations on the guest species–clathrate hydrates of the sI structure type only, which is compatible with the experimental observations of Sloan and Koh.
Moreover, a look at the cages of the sI structure reveals that the c.m. of the CH4 molecule is in an equilibrium position slightly off-center with respect to the origin of the reference frame, where the cages are not fully symmetric. For the NH3 molecule, in addition to the cage asymmetry, the significantly more off-center equilibrium position is due to the strong electrical polarity of this molecule. Indeed, the electrical contribution to the total energy is about 8% and 4% for the CH4–small cage and CH4–large cage, respectively, while it is about 53% and 57% for the NH3–small cage and NH3–large cage, respectively. Therefore, the large energy difference between the NH3–clathrate hydrates and the CH4–clathrate hydrates indicates that the first one is much more stable than the second one.
2.6. Translational Motions
The analysis of the calculated translational potential energy surface shows that the molecule (c.m.) can exhibit only translational oscillations around its equilibrium position in the nano-cages. Then, to solve the eigenequation connected to the Hamiltonian of Equation (13), can be expanded in a series of successive powers with respect to the dynamic coordinates , , and such as
where are the expansion coefficients characterizing the forces, the harmonic force constants (quadratic order) and the anharmonic force constants (higher orders) of the translational vibration motions of the molecule; , and are natural numbers.
It is important to note that the coefficient is excluded from this expression, since it corresponds to the minimum interaction energy value (Table 3 and Table 4).
2.6.1. CH4 Molecule in sI Structure
In the small cage, the equilibrium configuration of the methane guest molecule is obtained when its center of mass (c.m.) is located about −0.10 Å from the origin of the nano-cage reference frame (O,X,Y,Z) along the Z axis; its orientation angles are ≃ 180 deg, ≃ 110 deg and ≃ 0 deg. The minimum interaction energy value is then = −266.6 meV as mentioned in Table 3.
When the molecule is fixed at this equilibrium orientation, its translational potential energy surface is that of a nearly harmonic three-dimensional oscillator that is slightly asymmetric and characterized by displacements of large amplitudes around its equilibrium position. The frequencies of such motions were calculated using a Discrete Variable Representation (DVR) method [34]. The obtained values are 133 cm−1, 108 cm−1 and 120 cm−1.
In the large cage, the guest molecule is located about −0.27 Å along the Z axis of the reference frame; its orientation angles are ≃ 85 deg, ≃ 40 deg and ≃ 100 deg. The corresponding minimum energy value is −263.4 meV (Table 3).
When the molecule is maintained at its equilibrium orientation, the translational potential energy surface characterizes a three-dimensional oscillator that is rather anharmonic, featuring large amplitudes around its equilibrium position. The associated frequency values were calculated as 63 cm−1, 52 cm−1 and 47 cm−1.
2.6.2. NH3 Molecule in sI Structure
In the small cage, the equilibrium configuration of the ammonia guest molecule is obtained for its c.m. position ( = 0.16 Å, = −0.48 Å, = −0.28 Å); its orientation is ≃ 108 deg, ≃ 92 deg and ≃ 0 deg. The minimum energy value is = −468.7 meV as mentioned in Table 4. The molecule is re ≃ 0.58 Å from the origin of the reference frame (O,X,Y,Z) of the nano-cage.
When the molecule is fixed at this equilibrium orientation, its translational potential energy surface is that of a nearly harmonic three-dimensional oscillator that is slightly asymmetric and characterized by displacements of small amplitudes around its equilibrium position. The frequency values of this motion were calculated as 125 cm−1, 95 cm−1, and 113 cm−1.
In the large cage, the guest molecule is located at ( = −0.32 Å, = 0.50 Å, = −0.98 Å), which was at re ≃ 1.15 Å from the origin of the reference frame; its orientation angles are ≃ 325 deg, ≃ 40 deg and ≃ 95 deg. The corresponding minimum interaction energy value is then −450.4 meV (Table 4).
When the molecule is maintained in its equilibrium orientation, the translational potential energy surface characterizes a nearly harmonic three-dimensional oscillator. The associated frequency values were calculated to be 120 cm−1, 84 cm−1 and 88 cm−1.
3. Quantum Mechanical Treatment of the Optical Hamiltonian
Considering the trapped molecule in the rigid clathrate nano-cages, at its equilibrium position () determined previously, the Hamiltonian of the optically active system can be written as the sum of a vibrational Hamiltonian and of an orientational Hamiltonian:
that can be dealt with separately.
The eigenvectors of the Hamiltonian can be written as the tensor product of the respective eigenvectors of and .
It is important to mention that the rotational and centrifugal distortion constants of the molecule in the gas phase depend on its vibrational level v of the th mode. Schrödinger’s equation associated with the orientational Hamiltonian must then be solved for each vibrational state involved in a transition.
3.1. Vibrational Motions
In the gas phase, the eigenelements associated with the molecular vibrational Hamiltonian can be determined as linear combinations of the tensor products of the harmonic eigenvectors by applying a first-order perturbation treatment on the anharmonic part such as
where v and are the vibrational quantum numbers, and the values are the resulting coefficients.
When the molecule is trapped in the clathrate matrix, it is immersed in an asymmetric environment, and the intermolecular forces generate frequency shifts and/or splittings of the vibrational modes with respect to its frequencies in the gas phase state. The relative modifications do not generally exceed . The vibrational dependent part given by Equation (12) is then introduced using a first-order perturbation treatment.
Let and be the anharmonic eigenelements associated with and connected to the vth level of the th vibrational mode, all other modes remaining in their fundamental state. These eigenelements are presumed to have been calculated previously.
The frequency shift of the vibrational transition for the trapped molecule, and due to , can be calculated as shown below:
where ℏ is Planck’s constant.
Thus, the frequency shift of the th fundamental vibrational transition is given by
If the vibrational mode is degenerate, a degeneracy lifting can occur, and distinct shifts are obtained for the same “molecule-structure-cage” system.
As already noted, in small and large cages of the sI structure, the CH4 molecule adopts a position that is slightly off-center with respect to the center of the cages and can have translational motions of large amplitudes. In this case, vibrational frequency shifts toward low frequencies (red), with respect to those of the gas phase state of the molecule, are to be expected.
On the contrary, the NH3 molecule adopts a significantly more off-center position with respect to the center of the cages, and it is submitted to a strong crystal field. Its translational motions have small amplitudes. In this case, vibrational frequency shifts toward high frequencies (blue), with respect to those of the gas phase state of the molecule, are to be expected.
3.1.1. CH4 Molecule in sI Structure
The methane molecule is characterized by four vibrational modes: , a non-degenerate symmetric stretch, and , a doubly degenerate symmetric bending, which are both inactive in the infrared and therefore not considered in this work; , an antisymmetric stretch, and , an antisymmetric bending, which are both triply degenerate and active in the infrared.
The frequency shift and the degeneracy lifting of the and vibrational modes were calculated for the molecule trapped in the small and large cages of the clathrate sI structure. The obtained values are presented in Table 5 and, as expected, the vibrational frequencies are red shifted. Moreover, these results show that the vibrational frequencies are lower in the large cages than in the small cages, which is in agreement with previous ab initio molecular dynamics simulation calculations [35,36] and experimental Raman spectroscopic measurements [37,38].
Table 5.
Frequencies and frequency shifts (cm−1) of the vibrational modes (antisymmetric stretch) and (antisymmetric bending) of the CH4 molecule trapped in the small and large cages of the clathrate sI structure. (exp.) represents the gas phase experimental frequencies of CH4.
Note that due to the nearly identical dependent coefficients (in absolute value) of the vibrational interaction potential energy with respect to the vibrational dimensionless normal coordinates, the calculated values of are nearly the same as those of (see Table 5).
3.1.2. NH3 Molecule in sI Structure
In Table 6, we give the frequency shift of the non-degenerate and modes as well as the frequency shift and the degeneracy lifting of the double degenerate and modes for the ammonia molecule trapped in the small and large cages of the clathrate sI structure. The results show the blue shift character of the ammonia modes due to its quite strong confinement in an off-center position in the nano-cages.
Table 6.
Frequencies and frequency shifts (cm−1) of the vibrational modes of the NH3 molecule trapped in the small and large cages of the clathrate sI structure. (exp.) represents the gas phase experimental frequencies of NH3.
Moreover, in the vibration mode of the free NH3 molecule (gas phase state), the hydrogen atoms can pass from one side of the nitrogen atom to the other (vibration-inversion mode). This motion is generally described as a one-dimensional tunneling motion of one particle in a symmetrical double-well potential function (left (L) and right (R) wells) with a high, but finite, hindering barrier (254 meV) [39].
The resolution of the eigenequation associated with this mode leads to energy levels that are split into doublets (+) and (−). The eigenfunctions of the fundamental and first excited states are then described by , , and [40,41].
In the small and large cages of the sI structure of the clathrate matrix, the ammonia molecule is immersed in a non-symmetric crystal field due to its quite off-center position. Then, the potential energy surface of its translational motion only has one minimum in each cage (Table 4), and one of the two wells associated with the vibration-inversion mode disappears; therefore, the inversion motion is not allowed.
3.2. Orientational Motions and Level’s Schemes
The orientational level’s schemes for the non-vibrating molecule trapped in a clathrate nano-cage can be determined by solving the Schrödinger’s eigenequation associated with the orientational Hamiltonian of Equation (15), which yields the orientational eigenenergies and eigenfunctions. This requires an analysis of the orientational potential energy surface experienced by the molecule at its equilibrium position ().
The resolution model to be used depends on the nature of this orientational motion: (i) free rotation, (ii) more or less free rotation or (iii) libration motion around an equilibrium orientation ().
3.2.1. CH4 Molecule in sI Structure
A detailed analysis of the orientational potential energy surface of a CH4 molecule trapped in the small and large cages of the sI structure shows that the motion has a more or less perturbed rotational character along the potential energy valley, whose respective barrier heights are 17 and 5 meV (137.114 and 40.328 cm−1). Figure 4a,b give the potential energy surfaces minimized with respect to the spinning angle for CH4, respectively, in the small and large cages as functions of ().
Figure 4.
Contour plots of the orientational potential energy surfaces (in meV) versus () angular motions for a CH4 molecule located at its c.m. equilibrium positions ( given in Table 3) and minimized with respect to its spinning angle into the clathrate small cage (a), a pentagonal dodecahedron composed of 20 molecules, and large cage (b), which is a tetra-dodecahedron consisting of 24 molecules. The color code illustrates a decrease in potential energy from violet to green.
Thus, the eigenequation associated with the orientational Hamiltonian can be solved on the basis of orientational wavefunctions , which can be cast as linear combinations of the free rotational eigenvectors of the molecule in the gas phase, where J, M and K are the quantum numbers associated with the level state of energy :
where represents complex coefficients determined by solving the orientational eigenequation.
The potential energy surface is then numerically adjusted on the basis of Wigner rotation elements [42] as
where represent the expansion coefficients numerically calculated using a Gauss–Legendre integration method:
In these equations, is an integer number connected to the angle , while p and q are connected to the angles and , respectively, and can take the values .
We note, however, that because of the C3v symmetry of the molecule, the number q can only take values which are multiples of 3 (including zero). In Equation (20), the fitting coefficients are complex numbers and have been calculated up to . The higher expansion terms were negligibly small.
Schrödinger’s eigenequation associated with the orientational Hamiltonian can now be solved on the basis of the eigen elements and connected to the free rotational motion of the molecule. The eigenenergies , eigenvectors and coefficients are calculated by solving the secular equations system:
where and C are the Kronecker symbols and the Clebsch–Gordan coefficients which appear after applying the addition theorem for the elements [42].
Equations (22) is then solved by diagonalizing the characteristic matrix of minimum dimension , which allows terms in Equation (20) up to to perturb levels up to , with high levels being negligibly populated at low temperatures ( 10–30 K).
The resulting orientational energy levels schemes (up to ∼110 cm−1) are presented in Figure 5 for CH4 molecules trapped in the small (a) and large (b) cages, and for comparison, the CH4 gas phase free rotational levels scheme is also presented (c).
Figure 5.
Calculated orientational levels schemes for CH4 trapped in the small (a) and large (b) cages of the clathrate sI structure up to 110 cm−1, and for comparison, the free rotational CH4 gas phase levels scheme (c).
It can be clearly seen that the orientational states of the molecule are completely modified with respect to those of the free rotation motion. The calculations show that each state is a mixture of several free rotational states. In the small cage, there are only a few well-separated levels, while in the large cage, several intermixed levels are present.
Figure 5 also shows that the thin lines (red lines) represent the non-degenerate states that can be characterized by , whose linear combination contains the free rotational states of quantum numbers The thick lines (green lines) represent the doubly degenerate states that can be characterized by , whose linear combination contains the free rotational states of quantum numbers
3.2.2. NH3 Molecule in sI Structure
Figure 6a,b give the orientational potential energy surfaces minimized with respect to the spinning angle for NH3 molecule trapped, respectively, in the small and large cages as functions of ().
Figure 6.
Contour plots of the orientational potential energy surfaces (in meV) versus the () angular motions for a NH3 molecule located at its c.m. equilibrium positions ( given in Table 4) and minimized with respect to its spinning angle into the clathrate small cage (a), a pentagonal dodecahedron composed of 20 molecules, and a large cage (b), which is a tetra-dodecahedron consisting of 24 molecules. The color code illustrates a decrease in potential energy from violet to green.
A detailed analysis of these potential energy surfaces shows that the molecule behaves as three rather harmonic angular oscillators (librators) of small amplitudes around the equilibrium orientation angles , as seen in Table 4. Then, we need to introduce a set of new coordinates, varying around 0, instead of the orientational angles , and that allow the labeling of the energy states with appropriate librational quantum numbers.
The orientational potential energy can be expanded into a series of successive powers such as
where represents the expansion coefficients characterizing the forces, the harmonic force constants (quadratic order), and the anharmonic force constants (higher orders) of the librational motion of the molecule, and the superscript (∗) means that the zero-order terms () are not to be considered, since they correspond to the minimum energy values (Table 4). The obtained values for NH3 trapped in the small and large cages are given in Table 7.
Table 7.
Expansion coefficients of the orientational potential energy for NH3 trapped in the small and large cages of the clathrate sI structure.
Then, Schrödinger’s eigenequation for each case can be solved on the basis of three independent harmonic librators, such as the orientational eigenvectors, which can be expressed as , where j, m and k are independent integer quantum numbers connected to the , and coordinates, respectively.
Finally, the Hamiltonian can be written as
where , and are the Hamiltonians associated with the harmonic librators, and is the perturbation Hamiltonian part that will be introduced using the stationary perturbations theory.
Then, the eigensolutions of the harmonic part of the orientational Hamiltonian are expressed as
where , N and H are the harmonic librational frequencies, the normalization factors and Hermite’s polynomials, which are connected to the three librational motions.
- NH3 in the small cage
In the small cage, since deg. (Table 4), we can introduce the new coordinates = cos , and (where and are expressed in radians).
The kinetic rotational operator (Equation (2)) needs to be expanded in terms of the new coordinates . So, up to fourth-order series expansion, the following expression is obtained as
Hence, after some rearrangements of the orientational Hamiltonian, the following expressions are obtained for the separated harmonic Hamiltonians:
the expression of the perturbation Hamiltonian part is given in Equation (A4) of Appendix B.
Solving Schrödinger’s eigenequation associated with , and yields, respectively, the frequency values = 304.1 cm−1, = 215.4 cm−1 and = 155.2 cm−1.
The calculations of the corrective values to the eigenenergies which are due to the perturbation Hamiltonian are made using a first-order perturbation treatment: . The resulting values are included in the levels scheme presented in Figure 7a.
Figure 7.
Calculated orientational (librational) levels schemes for NH3 trapped in the small (a) and large (b) cages of the clathrate sI structure up to 450 cm−1. The arrows indicate the possible librational transitions.
- NH3 in the large cage
In the large cage, since deg. (Table 4), we introduce the new coordinates = sin (), and (where and are expressed in radians).
Then, the kinetic rotational operator can be dealt with, similarly to that of the NH3–small cage case, as
and the rearrangements of the orientational Hamiltonian give the separated harmonic Hamiltonians:
with the effective rotational constants and . The expression of the perturbation Hamiltonian part is given in Equation (A5) of Appendix B.
Solving Schrödinger’s eigenequation associated with , and yields, respectively, the frequency values = 285.0 cm−1, = 291.7 cm−1 and = 118.5 cm−1.
As in the case of the NH3–small cage, the corrective values to the eigenenergies due to the perturbation Hamiltonian are included in the levels scheme presented in Figure 7b.
It is important to mention that at the first-order perturbation treatment, the corrections due to odd power terms of (that is, = odd or = odd or = odd) are zero. Their corresponding expansion coefficients do not appear in Table 7.
Finally, a comparaison of the obtained orientational levels schemes associated with CH4 and NH3 molecules trapped in the clathrate sI nano-cages shows that in the near-infrared frequency region, we expect (i) for CH4, ro-vibrational spectra composed of several Q∗ lines corresponding to pure vibration transitions surrounded by vibration–orientation R∗ and P∗ lines, and (ii) for NH3, pure vibrational spectra composed of only a few Q∗ lines.
4. Entropy Change of the Guest of a Clathrate System with Temperature
4.1. Molecular Partition Function
As far as the entropy change of the molecular system trapped in a clathrate nano-cage is concerned, the calculations may be performed from an initial state in which the molecular system is free to move as well as the liquid water molecules with loose hydrogen bonds at a temperature just above the transition temperature to the final solid clathrate state. In the initial state, both the trapped molecule and the H2O molecules are relatively free, and the system is thus in a higher state of energy from its activated translational, rotational and vibrational degrees of freedom, contributing to a higher entropy. In the liquid state, water molecules are constantly moving and forming/breaking hydrogen bonds. This dynamic state provides water with a higher configurational and translational entropy compared to ice, where water molecules are clamped into fixed positions in a lattice. On the other hand, once the molecule is trapped in a clathrate nano-cage, the entropy of both the molecule and the water molecules will decrease due to the new, more ordered structure.
Because the molecule is being confined within the clathrate cage, this configuration lowers its ability to move freely, such that the translational entropy decreases significantly because it is now localized within a specific nano-cage with less space to move in. The same is true for the rotational entropy as the molecule’s rotational degrees of freedom are also limited inside the cage, although it may still undergo some constrained rotations or librations within the cage. As far as its vibrational entropy of the molecule is concerned, since the latter preserves its structure, only the electronic potential will suffer slight changes due to interactions with the surrounding water molecules, leading to a shift in the vibrational band centers. The overall entropy for the molecule clathrate system decreases when the temperature decreases. Following the second law of thermodynamics, this means that the entropy of the surroundings increases.
In order to compare the results obtained in this work with experimental results from previous studies on molecules trapped in rare gas matrices [20], O3 and CO2 and N2O in rare gas matrices [21,22,23,24,25], and NH3 trapped in a rare gas matrix [26], we start from the low-temperature condensed clathrate hydrate system, calculate the entropy of the molecule embedded in the small and large nano-cages, and evaluate how the clathrate system will evolve with temperature rise.
Moreover, because the vibrational energy levels are slightly perturbed from those of the gas phase, one expects that these levels will not be affected for very low temperatures below 100 K and that only the translational and orientational degrees of freedom will contribute to entropy variation with temperature rise. Indeed, in the gas phase at a room temperature of 298 K, only translational and rotational degrees of freedom contribute to entropy and internal energy.
The purpose is to try to predict the variation of the entropy of the molecule inside the clathrate system for NH3 and CH4 in the event it is warmed or acquires energy through an absorption of radiation. It is then a system which will exchange energy with its environment in the form of heat, which is a disordered form of energy that will heat the clathrate. Depending on the temperature rise, this may lead to two effects: a surface effect in the form of water molecules sublimation, which is a transition from the condensed state to the vapor state, and a volume effect that will increase the vibrational states of the solid water molecules as well as that of the encaged molecule through the orientation (libration or damped rotation) and translation (vibration of the center of mass) of the molecule.
Assuming that the change of the entropy of the clathrate system is the same as far as the water molecules are concerned both at the surface and in the bulk, then one can focus on the degrees of freedom of the trapped molecule, i.e., NH3 and CH4 inside the small and large cages. In the gas phase, the partition function of the molecule is expressed, in terms of vibrational and rotational degrees of freedom, as a product of the vibrational and rotational partition functions. Then, for the trapped molecule, the partition function is a product of three partition functions connected to the orientation (libration or damped rotation), the vibration and the translation (vibration of the center of mass) motions of the molecule. The vibrational partition function of the molecule is only slightly changed from the gas phase one due to vibrational shifts. It is expressed as
where and are, respectively, the energy and degeneracy of the vth vibration level associated with the th vibrational mode, and , where is the Boltzmann’s constant.
The orientational (librational or damped rotational) partition function of the molecule is expressed as
where is the energy of the lth librational or damped rotational level and is its degeneracy.
The translational motion of the molecular center of mass is 3-fold, and its related partition function is expressed as
where is the energy of the translational level of the center of mass given in terms of three independent motions in the three directions labeled X, Y and Z. Notice that the degeneracy of each level is equal to 1, and in that case is set to 1.
The total partition function of the molecule encaged inside the clathrate small or large cage is then given by the product of these three partition functions.
As already shown in our previous works [10,20], we can calculate numerically the partition function from the energy levels and their degeneracies, if present, and evaluate the corresponding entropy change due to activation of the accessible degrees of freedom through temperature change.
4.2. Entropy Calculations
Applying the model described in the previous section, we calculate numerically the partition functions for NH3 and CH4 molecules as well as for CO2 from previous studies [10,20].
For each degree of freedom, at temperature T, the entropy S is defined as
In terms of the probability for the molecule to have the energy . It becomes
where Z is the partition function of the corresponding degree of freedom with mean energy at temperature T.
From the numerical values of the energy levels, the corresponding entropy at different temperatures can be evaluated for each degree of freedom as given in Table 8 for carbon dioxide, Table 9 for methane and Table 10 for ammonia molecules trapped in the small and large cages of the clathrate hydrates. These results are discussed below in Section 6.
Table 8.
Entropy (cm−1/K) values associated with the translation, orientation and vibration motions of CO2 molecules trapped in the small and large cages of the clathrate matrix at different temperatures.
Table 9.
Entropy (cm−1/K) values associated with the translation, orientation and vibration motions of CH4 molecules trapped in the small and large cages of the clathrate matrix at different temperatures.
Table 10.
Entropy (cm−1/K) values associated with the translation, orientation and vibration motions of NH3 molecules trapped in the small and large cages of the clathrate matrix at different temperatures.
5. Infrared Absorption Spectra
5.1. General
The infrared absorption coefficient associated with a number of optically active molecules trapped, per volume unit, in a sI clathrate hydrate structure at temperature T, is defined as the real part of the spectral density, i.e., the Fourier transform of the time-dependent autocorrelation function [43]:
where is a running frequency variable, c is the speed of light, characterizes the initial canonical density matrix operator of the system, and is the molecular dipole moment operator defined in the absolute frame (see Equation (A2) of Appendix A).
Recall that isolated quantum systems can be described by a density matrix operator that contains only diagonal terms because this operator is built from pure quantum states. When the systems interact with an environment such as a thermal bath, which in our case is the clathrate system, the quantum states of the overall system spanned by the tensorial product of the Hilbert space of each system—the trapped molecule and the clathrate—are mixed, and the corresponding density matrix operator is no longer diagonal. The time evolution of the density matrix is given by the time-dependent von Neumann equation. The time evolution of the autocorrelation function of the dipole moment operator of the trapped molecule connected to the electromagnetic wave of the incident radiation for absorption or the radiated fluorescence initiated by spontaneous emission is then driven by that of the density matrix as given in the expression of . The Lindblad quantum master equation can be applied to the density matrix, which is expressed as a column vector that allows the calculation of the different effects of the radiative and non-radiative relaxation paths that result from the interaction between the different degrees of freedom (internal or external) for the molecule, between the molecule and the clathrate environment as well as the incident or emitted radiation.
Finally, the trace (Tr) operation means an average over the time evolution of the system in which the time-dependent dipole moment operator can be expressed in the following form:
As mentioned above, this paper is devoted to constructing the infrared bar spectra of the trapped methane or ammonia molecules to anticipate IR regions to localize these molecules. Some assumptions and approximations are then applied in order to perform the calculations.
(i) The clathrate hydrate matrices are highly diluted such that the trapped active molecules are isolated from each other. Their mutual interactions are then negligible. Dartois et al. [14] have observed a temperature-reversible behavior of the infrared spectrum of the methane clathrate hydrate between 7 K and 80 K, which indicates an absence of interaction between the trapped CH4 molecules.
(ii) The water molecules are rigid (non-vibrating) and fixed at their equilibrium positions and orientations.
(iii) The initial chaos hypothesis for the density matrix operator is assumed to be valid. This allows the optical wave functions to be written as tensorial products of the renormalized vibrational and orientational ones . Although the orientational states parametrically depend on the vibrational states through the rotational and centrifugal distortion constants, this dependence remains negligible and thus will be ignored below.
(iv) As already seen, the CH4 and NH3 molecules can stabilize the sI structure of clathrate in the small and large cages. The number of optically active molecules defined in Equation (39) can be written as the sum + of the numbers of active molecules trapped, per volume unit, in small s and large l cages, respectively.
Spin Degrees of Freedom
As shown in references [44] (section 3.8.4 of chapter 3, IR spectroscopy of symmetric tops and for space observation) and [45], spin statistics can be included in the calculation of the observed transitions of the trapped molecule in clathrate. Then, it is necessary to establish the correlation table between the symmetries of the rotational degrees of freedom of the free molecule and the orientational degrees of freedom of the encaged molecule given that transitions occur from the ground electronic and vibrational states that are symmetric.
5.2. Far-Infrared Bar Spectrum
5.2.1. CH4 Molecule in sI Structure
Because of its spherical symmetry, the CH4 molecule does not have a permanent dipole moment ( = 0). Consequently, this molecule does not absorb in the far-infrared range (no orientational spectrum).
5.2.2. NH3 Molecule in sI Structure
Within the framework above, in the far-infrared range, the absorption coefficient of a number of optically active NH3 molecules trapped, per volume unit, in cages c (c = s or l), at temperature T, is given by
In this expression, is the frequency associated with the molecular transition between the orientational states and of respective energy and , defines the orientation canonical partition function associated with the fundamental vibrational state at temperature T, and is the Dirac’s function.
Moreover, the brackets refer to the orientational transition elements of the molecular permanent dipole moment vector expressed in the absolute frame (G,X,Y,Z) tied to the molecular center of mass G (see Figure 3 and Appendix A).
Figure 7 presents the librational levels schemes obtained for NH3 trapped in the small (a) and large (b) cages of the sI structure, as well as the possible transitions induced by the permanent dipole moment in the approximation of its expansion, up to the first order, in terms of coordinates , and .
Assuming a theoretical filling rate of the molecules trapped in the sI structure type (see Figure 1), that is, and , the far (librational) infrared spectrum (integrated intensity lines) at temperature T = 10 K consists of four lines well isolated from each other, as presented in Table 11.
Table 11.
Integrated intensities of the far-infrared spectrum of NH3 molecules trapped in the sI structure of clathrate at T = 10 K.
It is worth noting that at this temperature, only the ground librational levels are populated. The libration–vibational level being symmetric, then, following the calculations presented in references [44] (section 3.8.4 of chapter 3, IR spectroscopy of symmetric tops and for space observation) and [45], the spin statistics leads to a spin degeneracy of 12 for this level. In effect, in Figure 7a, the first excited state at energy 135.9 cm−1 starts to have a population from temperature T = 50 K.
5.3. Near-Infrared Bar-Spectrum
In the near-infrared range, the absorption coefficient connected to the fundamental transition of the th vibrational mode: (all other modes being in their ground states) of a number of optically active molecules trapped, per volume unit, in cages c (c = s or l), at temperature T, is given by
In this expression, is the frequency associated with the transition between the vibration–orientation states and . Note, however, that the orientational quantum numbers () in Equation (42) must be replaced by the () ones for the case of the CH4 molecule.
Moreover, the brackets refer to the vibrational transition elements of the dimensionless normal coordinate and to the orientational transition elements of the first derivative of the molecular dipole moment vector with respect to this coordinate, expressed in the absolute frame (G,X,Y,Z), as presented in Appendix A.
Once again, we assume the same theoretical filling rate of the molecules trapped in the clathrate sI structure, that is, and . Spin statistics leads to a spin degeneracy of 5 [44] (section 3.8.4 of chapter 3) and [45].
5.3.1. CH4 Molecule in sI Structure
First, recall that for CH4 trapped in the sI structure, the quantum numbers () characterizing the orientational states in Equation (42) must be replaced by () characterizing the rotational states (see Section 3.2.1).
In Figure 8, we present the calculated bar spectrum, as well as the experimental spectrum obtained by Dartois et al. [14,16] at temperature T = 7 K, in the frequency range of the triply degenerate vibrational mode .
Figure 8.
Experimental spectrum (transmittance) from Dartois et al. [14,16] at temperature T = 7 K and calculated bar spectrum in the frequency range of the vibrational mode of CH4 trapped in small cages (green lines), pentagonal dodecahedrons each consisting of 20 molecules with a mean radius of 3.95 Å, and large cages (red lines), tetra-dodecahedrons each consisting of 24 molecules with a mean radius of 4.33 Å of the clathrate sI structure.
The calculated bar spectrum is composed of two groups of lines between 2995 and 3015 cm−1, on the one hand, and between 3015 and 3040 cm−1, on the other hand. Moreover, each group consists of three blocks of lines due to the degeneracy lifting of the vibrational mode of CH4 molecules.
The first group consists of several spectral lines due to the absorption of CH4 molecules trapped in the large cages. The three strongest lines Q∗ correspond to pure vibration transitions; each one is surrounded by high frequency vibration–orientation lines (R∗ branches) and low frequency vibration–orientation lines (P∗ branches).
The second group consists of less numerous and less intense spectral lines due to the absorption of CH4 molecules trapped in the small cages. There are still three pure vibration lines (Q∗ branches) surrounded by high-frequency vibration–orientation lines. This group also includes some vibration–orientation lines (R∗ branches) due to the absorption of molecules trapped in the large cages.
It can be noticed from Table A1 in the Appendix A that the first-derivative components of the molecular dipole moment with respect to the vibrational dimensionless normal coordinates are nearly equal (in absolute value) to those of the ones. The bar spectrum in the mode frequency range should then be identical to that of Figure 8.
5.3.2. NH3 Molecule in sI Structure
The integrated intensities of the near-infrared spectrum of NH3 trapped in the sI structure of clathrate hydrate, at temperature T = 10 K, are calculated using Equation (42). However, at this temperature range, only the ground vibration–libration state = is populated. The spin degeneracy is thus equal to 12 for this level.
Then, in each frequency range associated with each vibrational mode of the molecule, the spectrum is only composed of pure vibrational lines (Q∗ branches). The calculations show that the intensities associated with vibration–libration transitions are negligible (less than 4% of those of the pure vibrational transitions). Thus, the obtained spectra are presented in Table 12.
Table 12.
Integrated intensities of the near-infrared spectra (bar-spectra) of NH3 trapped in the sI structure of clathrate hydrate at T = 10 K.
6. Discussion
The results obtained for the different guests, NH3 and CH4 molecules, as well as for the CO2 molecule, in a clathrate hydrate system, will be discussed on a semi-quantitative basis in the light of results obtained on molecules trapped in inert gas matrices. This approach follows the pioneering research of Pimentel and co-workers [46,47] on short-lived species stabilized in an inert rigid matrix. The latter could be studied at will by standard spectroscopic observation, generally in the near-infrared region. This technique was subsequently applied on a broader field of research: matrix isolation spectroscopy, in terms of the species and host matrix, the experimental techniques beyond conventional infrared absorption spectroscopy to laser spectroscopy such as laser-induced fluorescence spectroscopy and double IR-IR resonance techniques (chapter 6 in [48]), and theoretical models that were elaborated to interpret the experimental results (chapter 7 in [48]).
As shown in previous matrix isolated spectroscopic works, for O3 molecule [21,22,23,49], and for N2O and CO2 molecules [24,25], both experimental research and modeling show that the molecule is clamped inside the nano-cage and that the shifts are not affected by temperature rise. Moreover, a recent work [50] confirmed that the symmetry of the CO2 molecule is preserved in low temperature rare gas matrices and clathrates from a study of the lowest fermi dyads of the energy levels. As far as the line-width variations for O3 molecule with temperature rise are concerned, an analysis of experimental data shows that different pathways, modeled by a multiphonon relaxation process or by isolated binary collisions [51], could contribute to the line widths, depending on the matrix and whether the trapping site of the matrix was single or double substitutional site. In contrast to these non-radiative relaxation channels contributions to the line-width broadening with temperature rise for fundamental vibrational lines absorption, as observed for the double-trapping site of the O3 molecule in rare gas xenon and krypton matrices, a different situation is observed for emission processes. The competition of these channels with radiative relaxation processes, when vibrational levels are excited by a tunable laser in the near-infrared region, results in an amplified stimulated emission of radiation, as observed with experiments performed on O3 [52,53], CO2 [54,55] and N2O [56] molecules in low-temperature rare gas matrices. These experimental observations have been explained in terms of a theoretical phenomenological model proposed by Apkarian [57]. Thus, time-resolved laser spectroscopy, such as laser-induced fluorescence and IR-IR double resonance, allows the determination of the intrinsic times of the processes involved in energy transfers between the different degrees of freedom of a defect or trapped system such as an atom or a molecule in a matrix and its environment at the nanoscale level.
Based on the methods of statistical and quantum physics using the density matrix formalism through a master equation, the time characteristics of the physical processes have been obtained by means of more elaborate theoretical models for di-acids [58,59,60,61,62,63], for example. The models are generally built for a two-level system, but they can be extended to multi-level ones interacting with a thermal bath to obtain the relaxation constants that correspond to thermal phenomena in a given medium [58,59,60,61,62,63,64,65,66,67,68] and to calculate the shape of the spectral lines [69,70,71,72,73,74,75].
In matrix isolation spectroscopy, one may cite the pioneering works of S.H. Lin for diatomics and C. Girardet and A. Lakhlifi for polyatomics when numerical algorithms are applied to solve the differential analytical equations and mimic, through these models, these relaxation processes once the main paths are identified [58,61,62,63,66,67,68].
In particular, when a clathrate hydrate with methane, ammonia or carbon dioxide is subjected to an excitation by a source of radiation, the mechanisms underlying the intrinsic exchange of energy between the different modes—vibration, libration, rotation and translation—of the trapped system or between the trapped system and its environment can be analyzed. The encaged molecule clathrate system is thus considered as an open quantum system, the system of interest being the molecule and the water molecules being the environmental bath. Note that the bath itself is in contact with the external environment which imposes the external bath temperature.
In this work, the model applied allows one to calculate the energies of the different degrees of freedom of the molecule trapped inside the clathrate cages, CH4 and NH3 molecules, as given in Section 2, and from the calculated values, the relaxation pathways can be reasonably inferred. Those obtained in reference [20,76] for the CO2 molecule will also be used for comparison. The matrix isolation spectroscopic technique leads to the study of artificial chemical species trapped in a nano-cage, but the results obtained with these artificial systems can be used to infer those expected with clathrate hydrates, which are a natural form of such species at the nanoscale.
CH4, NH3 and CO2 Molecules in Clathrate
In a previous study, calculations of the spectra of CO2 clathrate hydrates [20,76] show that the coupling between the CO2 molecule and the clathrate nano-cage through electromagnetic interactions is quite different for the low-frequency translational, rotational/librational modes and for the high-frequency vibrational modes. While both repulsive short-range and attractive long-range interactions are important coupling parameters that have an impact on these degrees of freedom, in contrast, the electrostatic effects from effective charges are only affecting the low-frequency modes. For high-vibrational frequency modes, coupling occurs through polarization effects only. One immediate consequence is that if one can determine the shifts of vibrational transitions for one isotope, the corresponding shifts for other isotopes can be deduced as well. The calculations performed on CH4 and NH3 molecules follow the same pattern as far as the coupling of the low-frequency modes (constrained translation and rotation) and the high-frequency modes (vibration) with the clathrate matrix is concerned. Note that without any further calculations, the spectral range to locate the near-infrared absorption domains of the isotopologues can also be anticipated from gas phase values, as confirmed in a recent work on fermi dyads of CO2 [50].
The calculations show that in the small cage, the translation of the center of mass of CO2 is constrained to that allowed by three independent harmonic oscillators with frequencies at the harmonic level ranging from 95 cm−1, 125 cm−1 and 115 cm−1 along the X, Y and Z axes, respectively. In comparison, CH4 oscillates with frequencies at 133 cm−1, 108 cm−1 and 120 cm−1, while for NH3, the values are depicted at 125 cm−1, 95 cm−1 and 113 cm−1, as given in Section 2. Then, these translational degrees of freedom are more likely to couple to high-energy optical Einstein phonons rather than the low-energy Debye phonons from acoustic branches (two transverse (TA) and one longitudinal (LA)) [77]. Then, both multiphonon and isolated binary collisions may contribute as non-radiative relaxation channels in the process.
In the large cage, the situation is different for CO2, which moves as a 1D oscillator at a frequency of 55 cm−1 and, in a plane perpendicular to this motion, as a 2D harmonic oscillator at a frequency of 30 cm−1. For CH4 and NH3, the motions of the center of mass are those of three harmonic oscillators at frequencies of 63 cm−1, 52 cm−1 and 47 cm−1 and 120 cm−1, 84 cm−1 and 88 cm−1, respectively. In the large cage, the calculated frequencies are lower by a factor of 2 approximately for CO2 and CH4. The non-radiative channels may likewise be mixed—characterized by multiphononic and isolated binary collisional processes through coupling with high-energy Einstein phonons.
As far as rotations are concerned, only CH4 can rotate, while both CO2 and NH3 are subjected to librational motions only. The spacings between the levels are such that in the large cage, the levels are denser for CH4 in an almost continuous distribution than for CO2, which itself presents a denser distribution of levels than for NH3.
In the small cage, the levels are well isolated for CO2 and NH3, the spacings being around 50 cm−1 for the former and 100 cm−1 for the latter. In the CH4 case, the distribution is in the form of polyads with the energy gaps being between 15 cm−1 and 20 cm−1. Then, the non-radiative relaxation channels ought to be different for the three molecules as far as orientational or rotational motions are concerned. The acoustic phonons are below 20 cm−1 for CH4 clathrate hydrate, but because of the denser energy levels, both acoustic and optical phonons should contribute as pathways for energy transfers. For CO2 and NH3, one expects the energy levels to be populated by optical phonons rather in case of energy transfer. As CH4 can rotate, another relaxation channel through a transfer to rotational degrees of freedom is possible.
If one considers only the first two baths, i.e., the medium in which the clathrate hydrate is found and the external source of radiation, through imposing the temperature of the clathrate with its embedded molecule, the values of entropy of the embedded molecule when the temperature rises can be calculated as in Section 4.2. These values incllude the different degrees of freedom, the translation of the center of mass of the molecule, of the rotational or orientational and vibrational motions, as depicted in Section 2.
The results of this work show that with temperature rise, the vibrational part will hardly contribute to any significant increase of entropy for the three molecules. This means that when the coupling between the guest molecule and the host is activated, the vibrational degrees of freedom will not provide any relaxation channel for a degradation of energy. The values calculated for the entropy of the molecular systems show that when their vibrational degrees of freedom are excited, then the most probable quenching path is by the emission of photons for CO2 and NH3, for which the non-radiative pathways are reduced, while for CH4, a competition between non-radiative and radiative relaxation may prevent emission. Moreover, it is expected to be in the form of amplified stimulated emission because of the population inversion at the temperatures at which clathrates form and also because excitation occurs in the near-infrared region of the electromagnetic spectrum. In other words, on a square surface of 2 µm × 2 µm, which is an acceptable mean value for the wavelength of the NIR radiation, coherent excitation of the molecules is achieved, resulting in some sort of superradiant emission. The different models and physical considerations of these outcomes can be found in the book by C. Cohen-Tannoudji, J. Dupont-Roc and G. Grynberg: Processus d’interaction entre photons et atomes [78].
So, a way to look for these molecules in a medium where clathrate hydrates can be found— on planets such as Mars, planetsimals, or even comets—could be by laser-induced amplified stimulated emission through a LIDAR system to collect the emitted photons. Whether on Mars, which is being targeted to be eventually colonized, from drones, or CubeSats [79,80,81,82,83] that may operate above the iced surface of Mars to track these molecules, ASE induced by a laser source implemented on the drones or the CubeSats may be observed on mounted telescopes.
For imagers that collect radiation emitted by a black or a gray body [81,82,83,84,85]—for example, the sun as a far distant emitter of radiation or the planet on which the clathrate is present (the Earth, Mars, …) itself as a closer radiation emitter—then the energy flow is from another bath with the characteristic black body radiation modeled by Planck’s formula and the radiation emitted depending on the temperature of the emitting system following the well-known Stefan–Boltzmann formula. One is expected to observe superimposed on the black body radiation of the surface some spectral lines corresponding to the emitted ASE fluorescence by molecules of NH3 and CO2 and others corresponding to absorption by molecules of CH4. The latter takes place when non-radiative relaxation supplies enough heat to evaporate the clathrate hydrate. This has been observed, for example, in an experiment on the characterization of NiO surfaces by ellipsometry [86] when the absorption lines of NiO molecules were superimposed on ellipsometric data. Moreover, a measure of the quantity observed can be estimated from the calculations performed in this paper with most probably direct in situ analysis from implemented AI algorithms.
7. Conclusions
The results obtained for the different guests, CH4 and NH3 molecules, as well as for the CO2 molecule in a clathrate, lead to low-frequency motions to rotations for CH4 and librations for NH3 and CO2, which means that the transfer to rotation for CH4 gives rise to an extra relaxation path compared to those of NH3 and CO2. Temperature rise for CH4 is expected to be higher through isolated binary collisions, a multiphonon process or transfer to rotation. As a result, non-radiative pathways will be in competition with radiative ones concerning CH4 but not for NH3 and CO2. As far as emission is concerned, in the case of librations, energy separations are large in the small cage, and then CO2 and NH3 can be considered to be isolated such that fluorescence is expected to be the main radiative relaxation channel at least for the small cages. Then, the latter condensed systems can be searched for by drones or CubeSats on Mars, producing planets from emission characteristics superimposed on the black body radiation of the icy surfaces at the polar caps. The amount of these molecules underneath the icy caps can be quantified using the results given in Section 5. In the large cage, the energy level spacings are smaller by a factor of 2, approximately amounting to 50 cm−1. Then, this corresponds to a local temperature rise of 30 K. Note that the absorption of IR radiation then results in a process whereby the clathrate is mildly warmed. In this context, if it is in an environment with other different molecules, especially organic, then chemical reactions may occur that modify this organic matter.
Author Contributions
Theoretical calculations, A.L. and P.R.D.; experimental and technological setups and discussion, A.L., P.R.D. and M.M. All authors have read and agreed to the published version of the manuscript.
Funding
This research received no external funding.
Data Availability Statement
This manuscript has no associated data or the data will not be deposited. The results of the calculations do not need to be kept as data on a database because they are included in the article.
Acknowledgments
In this work, calculations have been executed on computers from the Utinam Institute of the Université Marie & Louis Pasteur, which is supported by the Regional Council of Bourgogne-Franche-Comté.
Conflicts of Interest
The authors declare no conflicts of interest.
Appendix A. Rotational Matrix Transformation and Molecular Dipole Moment
Figure A1 describes the transformation of the absolute frame (O,X,Y,Z) into a new (O,x,y,z) one.
Figure A1.
Transformation from the absolute frame (O,X,Y,Z) tied to the matrix to the molecular frame (O,x,y,z).
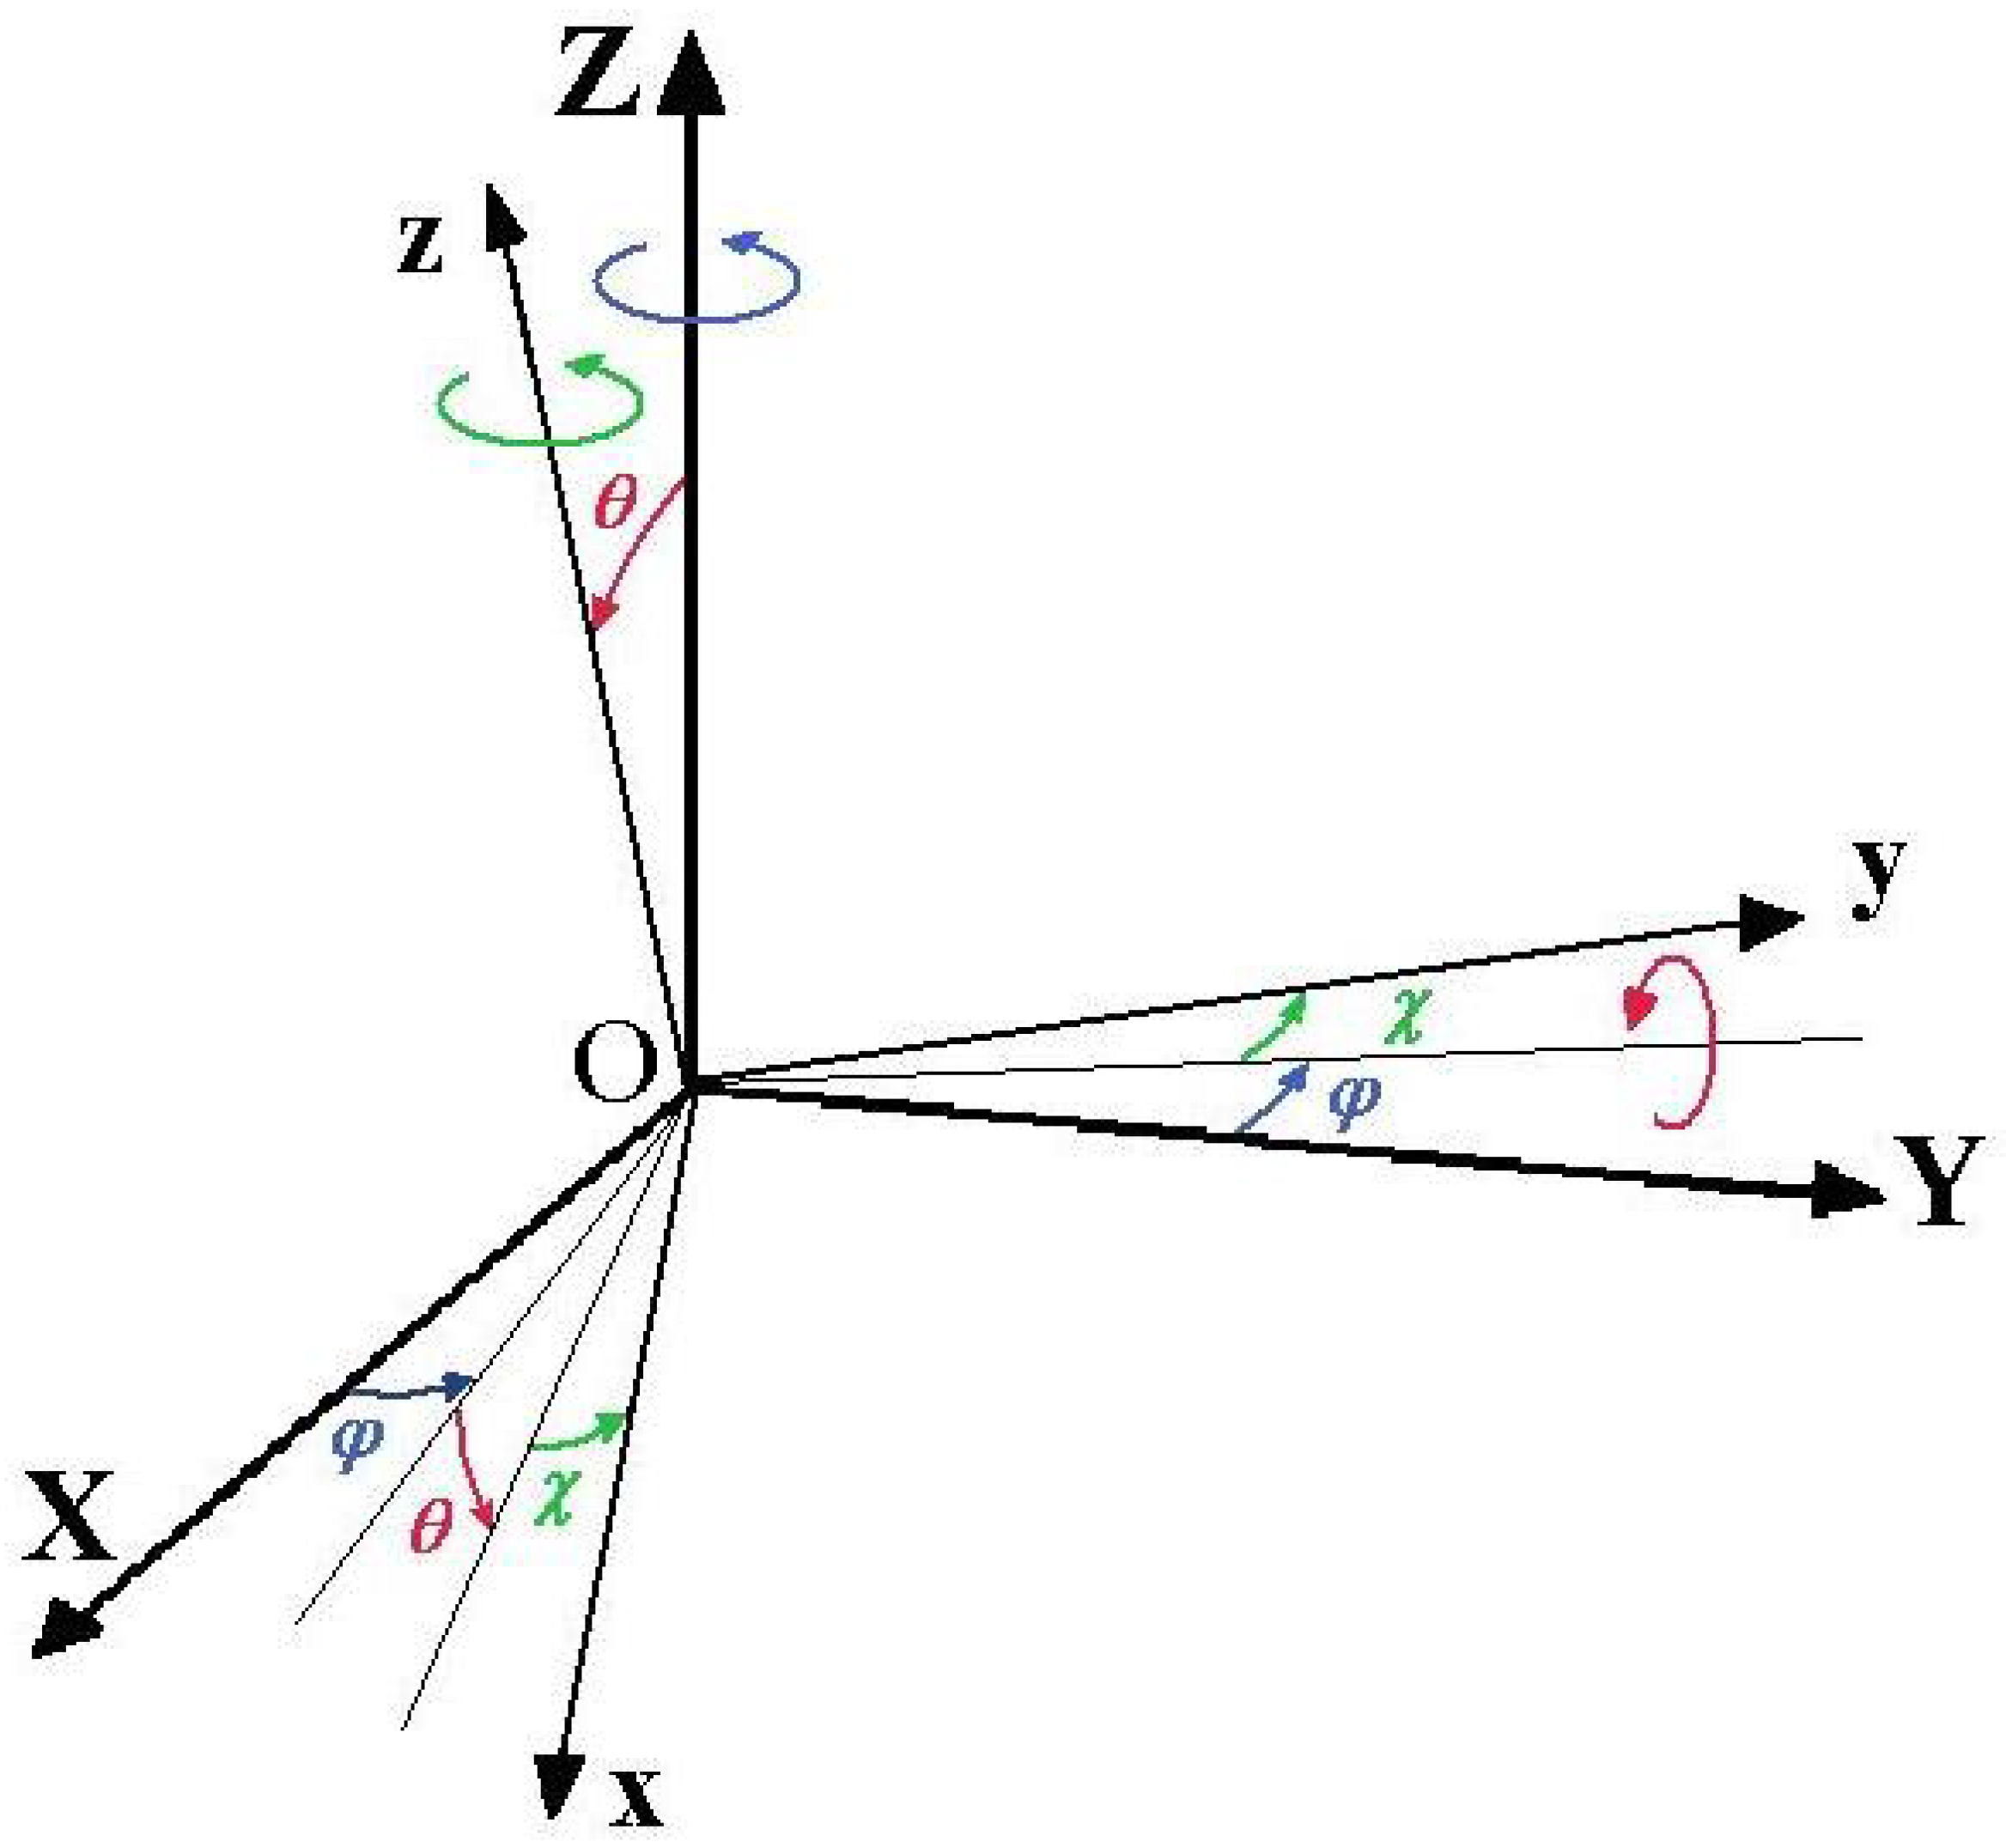
The corresponding unitary matrix in terms of the Euler angle coordinates , and is given as [42]
Thus, the molecular permanent dipole moment vector and the first-derivative vectors with respect to the dimensionless normal coordinate connected to the th vibrational mode can be written in the absolute frame as
where is the inverse matrix of . The component values of the first-derivative vectors of the molecular dipole moment in the molecular frame are given in Table A1 for CH4 molecule and in Table A2 for NH3 molecule.
Table A1.
First-derivative components (in D unit) of the molecular dipole moment with respect to the dimensionless normal coordinates for CH4.
Table A2.
First-derivative components (in D unit) of the molecular dipole moment with respect to the dimensionless normal coordinates for NH3.
Appendix B. Orientational Perturbation Hamiltonian
The expressions of the orientational perturbation Hamiltonians for the ammonia molecule trapped in the clathrate sI structure are
- NH3-small cage
- NH3-large cage
The superscript (∗∗) in the above expressions indicates that the harmonic force constants , and are excluded in the sum operation.
References
- Tobie, G.; Lunine, J.I.; Sotin, C. Episodic Outgassing as the Origin of Atmospheric Methane on Titan. Nature 2006, 440, 61–64. [Google Scholar] [CrossRef] [Scilit] [PubMed]
- Marboeuf, U.; Mousis, O.; Petit, J.M.; Schmitt, B. Clathrate Hydrates Formation in Short-Period Comets. Astrophys. J. 2010, 708, 812–816. [Google Scholar] [CrossRef] [Scilit]
- Marboeuf, U.; Schmitt, B.; Petit, J.M.; Mousis, O.; Fray, N. A Cometary Nucleus Model Taking into account all Phase Changes of Water Ice: Amorphous, Crystalline, and Clathrate. Astron. Astrophys. 2012, 542, A82. [Google Scholar] [CrossRef] [Scilit]
- Chastain, B.K.; Chevrier, V. Methane Clathrate Hydrates as a Potential Source for Martian Atmospheric Methane. Planet. Space Sci. 2007, 55, 1246–1256. [Google Scholar] [CrossRef] [Scilit]
- Mousis, O.; Lunine, J.I.; Chassefière, E.; Montmessin, F.; Lakhlifi, A.; Picaud, S.; Petit, J.M.; Cordier, D. Mars Cryosphere: A Potential Reservoir for Heavy Noble Gases? Icarus 2012, 218, 80–87. [Google Scholar] [CrossRef] [Scilit]
- Sloan, E.D. Fundamental Principles and Applications of Natural Gas Hydrates. Nature 2003, 426, 353–359. [Google Scholar] [CrossRef] [Scilit]
- Walsh, M.R.; Sloan, E.D.; Sum, A.K.; Wu, D.T. Microsecond Simulations of Spontaneous Methane Hydrate Nucleation and Growth. Science 2009, 326, 1095–1098. [Google Scholar] [CrossRef] [Scilit]
- Park, Y.; Kim, D.Y.; Lee, J.W.; Huh, D.G.; Park, K.P.; Lee, J.; Lee, H. Sequestering Carbon Dioxide into Complex Structures of Naturally Occurring Gas Hydrates. Proc. Natl. Acad. Sci. USA 2006, 103, 12690–12694. [Google Scholar] [CrossRef] [Scilit]
- Gloesener, E.; Karatekin, Ö.; Dehant, V. Stability and Composition of CH4-Rich Clathrate Hydrates in the Present Martian Subsurface. Icarus 2021, 353, 114099. [Google Scholar] [CrossRef] [Scilit]
- Lakhlifi, A.; Dahoo, P.R.; Picaud, S.; Mousis, O. A Simple Van’t Hoff Law for Calculating Langmuir Constants in Clathrate Hydrates. Chem. Phys. 2015, 448, 53–60. [Google Scholar] [CrossRef] [Scilit]
- Lakhlifi, A.; Dahoo, P.R. Van’t Hoff Law for Temperature Dependent Langmuir Constants in Clathrate Hydrate Nanocavities. arXiv 2015, arXiv:1503.04633v1. [Google Scholar]
- Trainer, M.G.; Tolbert, M.A.; McKay, C.P.; Toon, O.B. Enhanced CO2 Trapping in Water Ice via Atmospheric Deposition with Relevance to Mars. Icarus 2010, 206, 707–715. [Google Scholar] [CrossRef] [Scilit]
- Trainer, M.G.; Tolbert, M.A.; McKay, C.P.; Toon, O.B. Limits on the Trapping of Atmospheric CH4 in Martian Polar Ice Analogs. Icarus 2010, 208, 192–197. [Google Scholar] [CrossRef] [Scilit]
- Dartois, E.; Deboffle, D. Methane Clathrate Hydrate FTIR Spectrum Implications for its Cometary and Planetary Detection. Astron. Astrophys. 2008, 490, L19–L22. [Google Scholar] [CrossRef] [Scilit]
- Dartois, E.; Schmitt, B. Carbon Dioxide Clathrate Hydrate FTIR Spectrum Near Infrared Combination Modes for Astrophysical Remote Detection. Astron. Astrophys. 2009, 504, 869–873. [Google Scholar] [CrossRef] [Scilit]
- Dartois, E.; Deboffle, D.; Bouzit, M. Methane Clathrate Hydrate Infrared Spectrum II. Near-Infrared Overtones, Combination Modes and Cages Assignments. Astron. Astrophys. 2010, 514, A49–A54. [Google Scholar] [CrossRef] [Scilit]
- Dartois, E. CO Clathrate Hydrate: Near to Mid-IR Spectroscopic Signatures. Icarus 2011, 212, 950–956. [Google Scholar] [CrossRef] [Scilit]
- Dartois, E.; Bouzit, M.; Schmitt, B. Clathrate Hydrates: FTIR Spectroscopy for Astrophysical Remote Detection. In European Conference on Laboratory Astrophysics; EAS Publications Series: Les Ulis, France, 2012; Volume 58, pp. 219–224. [Google Scholar]
- Maslakci, Z.; Devlin, J.P.; Uras-Aytemiz, N. NH3 as Unique Non-Classical Content-Former within Clathrate Hydrates. J. Chem. Phys. 2017, 146, 234508. [Google Scholar] [CrossRef] [Scilit]
- Lakhlifi, A.; Dahoo, P.R.; Chassefière, E. Potential Infrared Relaxation Channels Calculated for CO2 Clathrate Hydrates. J. Quant. Spect. Radiat. Transf. 2017, 187, 124–134. [Google Scholar] [CrossRef] [Scilit]
- Lakhlifi, A.; Girardet, C.; Dahoo, P.R.; Brosset, P.; Gauthier-Roy, B.; Abouaf-Marguin, L. Interpretation of the Infrared Spectrum of Ozone Trappe in Inert Matrices. Chem. Phys. 1993, 177, 31–44. [Google Scholar] [CrossRef] [Scilit]
- Dahoo, P.R.; Lakhlif, A.; Chabbi, H. Spectroscopy of O3 Trapped in Rare Gas Matrices. I. Theoretical Model fot Low-Lying Vibrational Levels. J. Chem. Phys. 1999, 111, 10192–10201. [Google Scholar] [CrossRef] [Scilit]
- Chabbi, H.; Dahoo, P.R.; Lakhlifi, A. Spectroscopy of O3 Trapped in Rare Gas Matrices. II. Vibrational Energies and Transition Moments of Low-Lying Levels. J. Chem. Phys. 1999, 111, 10202–10209. [Google Scholar] [CrossRef] [Scilit]
- Dahoo, P.R.; Berrodier, I.; Raducu, V.; Teffo, J.L.; Chabbi, H.; Lakhlifi, A.; Abouaf-Marguin, L. Splitting of ν2Vibrational Mode of CO2 Isotopic Species in the Unstable Trapping Site in Argon Matrix. Eur. Phys. J. D 1999, 5, 71–81. [Google Scholar] [CrossRef] [Scilit]
- Lakhlifi, A.; Chabbi, H.; Dahoo, P.R.; Teffo, J.L. A Theoretical Study of CO2 and N2O Molecules Trapped in an Argon Matrix: Vibrational Energies, and Transition Moments for Low-Lying Levels and IR Bar Spectra. Eur. Phys. J. D 2000, 12, 435–448. [Google Scholar] [CrossRef] [Scilit]
- Girardet, C.; Lakhlifi, A. Infrared Profile of NH3 Trapped in Argon Matrix. J. Chem. Phys. 1985, 83, 5506–5519. [Google Scholar] [CrossRef] [Scilit]
- Fleyfel, F.; Devlin, J.P. Carbon Dioxide Clathrate Hydrate Epitaxial Growth: Spectroscopic Evidence for Formation of the Simple Type-II CO2 Hydrate. J. Phys. Chem. 1991, 95, 3811–3815. [Google Scholar] [CrossRef] [Scilit]
- Sloan, E.D.; Koh, C.A. Clathrate Hydrates of Natural Gases, Chemical Industries, 3rd ed.; CRC Press: London, UK, 2008; p. 86. [Google Scholar]
- Buch, V.; Devlin, J.P.; Monreal, I.A.; Jagoda-Cwiklik, B.; Uras-Aytemiz, N.; Cwiklik, L. Clathrate Hydrates with Hydrogen-Bonding Guests. Phys. Chem. Chem. Phys. 2009, 11, 10245–10265. [Google Scholar] [CrossRef] [Scilit]
- Devlin, J.P. Catalytic Activity of Methanol in All-Vapor Subsecond Clathrate-Hydrate Formation. J. Chem. Phys. 2014, 140, 164505. [Google Scholar] [CrossRef] [Scilit]
- Ripmeester, J.A.; Ratcliffe, C.I. The Diverse Nature of Dodecahedral Cages in Clathrate Hydrates As Revealed by 129Xe and 13C NMR Spectroscopy: CO2 as a Small-Cage Guest. Energy Fuels 1998, 12, 197–200. [Google Scholar] [CrossRef] [Scilit]
- Partay, L.B.; Jedlovszky, P.; Hoang, P.N.M.; Picaud, S.; Mezei, M. Free-Energy Profile of Small Solute Molecules at the Free Surfaces of Water and Ice, as Determined by Cavity Insertion Widom Calculations. J. Phys. Chem. C 2007, 111, 9407–9416. [Google Scholar] [CrossRef] [Scilit]
- Alavi, S.; Susilo, R.; Ripmeester, J.A. Linking Microscopic Guest Properties to Macroscopic Observables in Clathrate Hydrates: Guest-Host Hydrogen Bonding. J. Chem. Phys. 2009, 130, 174501. [Google Scholar] [CrossRef] [Scilit]
- Light, J.C.; Hamilton, I.P.; Lill, J.V. Generalized Discrete Variable Approximation in Quantum Mechanics. J. Chem. Phys. 1985, 82, 1400–1409. [Google Scholar] [CrossRef] [Scilit]
- Tse, J.S. Vibrations of Methane in Structure I Clathrate Hydrate—An ab initio Density Functional Molecular Dynamics Study. J. Supramol. Chem. 2002, 2, 429–433. [Google Scholar] [CrossRef] [Scilit]
- Hiratsuka, M.; Ohmura, R.; Sum, A.K.; Yasuoka, K. Molecular Vibrations of Methane Molecules in the Structure I Clathrate Hydrate from ab initio Molecular Dynamics Simulation. J. Chem. Phys. 2012, 136, 044508. [Google Scholar] [CrossRef] [Scilit] [PubMed]
- Sum, A.K.; Burruss, R.C.; Sloan, E.D. Measurement of Clathrate Hydrates via Raman Spectroscopy. J. Phys. Chem. B 1997, 101, 7371–7377. [Google Scholar] [CrossRef] [Scilit]
- Ohno, H.; Kida, M.; Sakurai, T.; Iizuka, Y.; Hondoh, T.; Narita, H.; Nagao, J. Symmetric Stretching Vibration of CH4 in Clathrate Hydrate Structures. Chem. Phys. Chem. 2010, 11, 3070–3073. [Google Scholar] [CrossRef] [Scilit]
- Swalen, J.D.; Ibers, J.A. Potential Function for the Inversion of Ammonia. J. Chem. Phys. 1962, 36, 1914–1918. [Google Scholar] [CrossRef] [Scilit]
- Lakhlifi, A. Dynamic and Spectroscopic Studies of Single Molecules Physisorbed on Graphite Substrates. 1. Theoretical Approach. J. Phys. Chem. B 2005, 109, 11314–11321. [Google Scholar] [CrossRef] [Scilit]
- Lakhlifi, A.; Killingbeck, J.P. Dynamic and Spectroscopic Studies of Single Molecules Physisorbed on Graphite Substrates. 2. Application to the Ammonia Molecule. J. Phys. Chem. B 2005, 109, 11322–11331. [Google Scholar] [CrossRef] [Scilit]
- Rose, M.E. Elementary Theory of Angular Momentum; Wiley: New York, NY, USA, 1967. [Google Scholar]
- Robert, D. Contribution à la Théorie du Spectre Infrarouge des Solutions Liquides. Ph.D. Thesis, University of Franche-Comté, Besançon, France, 1967. [Google Scholar]
- Dahoo, P.R.; Lakhlif, A. Infrared Spectroscopy of Symmetric and Spherical Top Molecules for Space Observation 1; Wiley: Hoboken, NJ, USA, 2021; Volume 3. [Google Scholar]
- Landau, L.; Lifchitz, E.; Pitaevski, L. Physique Théorique: Mécanique Quantique; Mir: Moscow, Russia, 1975; Volume 3. [Google Scholar]
- Whittle, E.; Dows, D.A.; Pimentel, G.C. Matrix Isolation Method for the Experimental Study of Unstable Species. J. Chem. Phys. 1954, 22, 1943. [Google Scholar] [CrossRef] [Scilit]
- Pimentel, G.C. Formation and Trapping of Free Radicals; Academic Press: New York, NY, USA, 1960. [Google Scholar]
- Dahoo, P.R.; Pougnet, P.; El Hami, A. Nanometer-Scale Defect Detection Using Polarized Light; Wiley: Hoboken, NJ, USA, 2016; Volume 2. [Google Scholar]
- Brosset, P.; Dahoo, P.R.; Gauthier-Roy, B.; Abouaf-Marguin, L.; Lakhlifi, A. Analysis of IR Absorption Spectrum of O3 in Inert Matrices: Spectroscopic Evidence for Two Trapping Sites. Chem. Phys. 1993, 172, 315–324. [Google Scholar] [CrossRef] [Scilit]
- Chakchouk, M.A.; Dahoo, P.R.; El Hami, A.; Lakhlifi, A.; Fadil, D.; Gafsi, W.; Haddar, M. IR Spectroscopic Observation Windows and Analysis for Environmental Issues: Application to CO2. Eur. Phys. J. D 2023, 77, 183. [Google Scholar] [CrossRef] [Scilit]
- Dahoo, P.R.; Jasmin, D.; Brosset, P.; Gauthier-Roy, B.; Abouaf-Marguin, L. Vibrational Relaxation Study of O3 in Rare Gas and Nitrogen Matrices by Time Resolved Infrared–Infrared Double Resonance Spectroscopy. J. Chem. Phys. 1998, 108, 8541–8549. [Google Scholar] [CrossRef] [Scilit]
- Jasmin, D.; Dahoo, P.R.; Brosset, P.; Raducu, V.; Gauthier-Roy, B.; Abouaf-Marguin, L. Laser-Induced Infrared Fluorescence of O3 Trapped in Xenon Matrices. J. Chem. Phys. 1994, 101, 7337–7341. [Google Scholar] [CrossRef] [Scilit]
- Jasmin, D.; Brosset, P.; Dahoo, P.R.; Gauthier-Roy, B.; Abouaf-Marguin, L. Stimulated Emission at 10 µm of O3 Trapped in Low Temperature Matrices: Threshold Measurements and Quantum Yield Evaluation. J. Chem. Phys. 1998, 108, 2302–2308. [Google Scholar] [CrossRef] [Scilit]
- Chabbi, H.; Dahoo, P.R.; Gauthier-Roy, B.; Vasserot, A.M.; Abouaf-Marguin, L.; Broquier, M.; Dubost, H.; Kolos, R.; Tramer, A.; Berset, J.M.; et al. Vibrational Stimulated Emission of 13CO2 in Solid Argon. Chem. Phys. Lett. 1998, 285, 252–258. [Google Scholar] [CrossRef] [Scilit]
- Chabbi, H.; Dahoo, P.R.; Dubost, H.; Gauthier-Roy, B.; Vasserot, A.M.; Abouaf-Marguin, L. Experimental analysis of 13CO2 Infrared Stimulated Emissions in Solid Argon. Low. Temp. Phys. 2000, 26, 719–726. [Google Scholar] [CrossRef] [Scilit]
- Chabbi, H.; Dahoo, P.R.; Gauthier-Roy, B.; Vasserot, A.M.; Abouaf-Marguin, L. Infared Stimulated Emission of N2O Trapped in Argon Matrices: Comparison with O3 and CO2. J. Phys. Chem. A 2000, 104, 1670–1673. [Google Scholar] [CrossRef] [Scilit]
- Apkarian, V.A. Stimulated Emission as a Major Channel for the Depopulation of Laser-Excited States in Condensed Media. Chem. Phys. Lett. 1984, 110, 168–172. [Google Scholar] [CrossRef] [Scilit]
- Lin, S.H. On the Master Equation Approach of Vibrational Relaxation in Condensed Media. J. Chem. Phys. 1974, 61, 3810–3820. [Google Scholar] [CrossRef] [Scilit]
- Blumen, A.; Lin, S.H.; Manz, J. Theory of Vibrational Energy Transfer Among Diatomic Molecules in Inert Matrices. J. Chem. Phys. 1978, 69, 881–896. [Google Scholar] [CrossRef] [Scilit]
- Zumofen, G. A priori Rates of Phonon-Assisted v–v Transfers Among CO and N2 Molecules in N2 Matrices. J. Chem. Phys. 1978, 69, 4264–4272. [Google Scholar] [CrossRef] [Scilit]
- Lin, S.H. Radiationless Transitions; Academic Press: New York, NY, USA, 1980. [Google Scholar]
- Lin, S.H.; Eyring, H. On the density matrix approach of intramolecular relaxation processes. Proc. Natl. Acad. Sci. USA 1981, 78, 2013–2016. [Google Scholar] [CrossRef] [Scilit] [PubMed]
- Kono, H.; Lin, S.H. Spectroscopic Properties and Relaxation Processes of Impurity Molecules in Solids. I. Rotational Spectra. Chem. Phys. 1983, 78, 2607–2620. [Google Scholar] [CrossRef] [Scilit]
- Nitzan, A.; Mukamel, S.; Jortner, J. Some Features of Vibrational Relaxation of a Diatomic Molecule in a Dense Medium. J. Chem. Phys. 1974, 60, 3929–3934. [Google Scholar] [CrossRef] [Scilit]
- Nitzan, A.; Silbey, R.J. Relaxation in Simple Quantum Systems. J. Chem. Phys. 1974, 60, 4070–4075. [Google Scholar] [CrossRef] [Scilit]
- Lakhlifi, A. Etude Théorique de la Molécule d’Ammoniac Piégée en Matrice: Interactions, Mouvements et Phénomènes Relaxationnels. Ph.D. Thesis, University of Franche-Comté, Besançon, France, 1987. [Google Scholar]
- Lakhlifi, A.; Girardet, C. Vibrational Relaxation of Ammonia Trapped in Rare Gas Matrices. J. Chem. Phys. 1987, 87, 4559–4575. [Google Scholar] [CrossRef] [Scilit]
- Lakhlifi, A.; Dahoo, P.R. Enhanced Localization of Tunneling of the NH3 Umbrella Mode in Nano-cage Fullerene. Chem. Phys. 2011, 386, 73–80. [Google Scholar] [CrossRef] [Scilit]
- Anderson, P.W. Pressure Broadening in the Microwave and Infra-Red Regions. Phys. Rev. 1949, 76, 647. [Google Scholar] [CrossRef] [Scilit]
- Tsao, P.J.; Curnutte, B. Line-Widths of Pressure-Broadened Spectral Lines. J. Quant. Spect. Radiat. Transf. 1962, 2, 41–49. [Google Scholar] [CrossRef] [Scilit]
- Fiutak, J.; Van Kranendonk, J. Impact Theory of Raman Line Broadening. Can. J. Phys. 1962, 40, 1085–1100. [Google Scholar] [CrossRef] [Scilit]
- Fano, U. Pressure Broadening as a Prototype of Relaxation. Phys. Rev. 1963, 131, 259. [Google Scholar] [CrossRef] [Scilit]
- Ben Reuven, A. Symmetry Considerations in Pressure-Broadening Theory. Phys. Rev. 1966, 141, 34. [Google Scholar] [CrossRef] [Scilit]
- Ben Reuven, A. Impact Broadening of Microwave Spectra. Phys. Rev. 1966, 145, 7. [Google Scholar] [CrossRef] [Scilit]
- Robert, D.; Bonamy, J. Short Range Force Effects in Semiclassical Molecular Line Broadening Calculations. J. De Phys. 1979, 40, 923–943. [Google Scholar] [CrossRef] [Scilit]
- Dahoo, P.R.; Puig, R.; Lakhlifi, A.; Meis, C.; Gale, J. Simulating Relaxation Channels of CO2 in Clathrate Nano-cages. J. Phys. Conf. Ser. 2016, 738, 012072. [Google Scholar] [CrossRef] [Scilit]
- Tse, J.S.; Shpakov, V.P.; Murashov, V.V.; Belosludov, V.R. The Low Frequency Vibrations in Clathrate Hydrates. J. Chem. Phys. 1997, 107, 9271–9274. [Google Scholar] [CrossRef] [Scilit]
- Cohen-Tannoudji, C.; Dupont-Roc, J.; Grynberg, G. Processus D’interaction Entre Photons et Atomes; Savoirs Actuels, InterEditions, Editions du CNRS: Paris, France, 1988; p. 628. [Google Scholar]
- Chakchouk, M.A.; El Hami, A.; Dahoo, P.R.; Lakhlifi, A.; Gafsi, W.; Haddar, M. Optimisation de Plan de Vol d’un Drone Faisant un Cycle Hamiltonien Entre N Points de Mesures; Problème du Voyageur de Commerce et Durée de Vie de Batterie. Uncertain. Reliab. Multiphys. Syst 2022, 6, 1–7. [Google Scholar] [CrossRef] [Scilit]
- Chakchouk, M.A. Conception D’un Détecteur de Systéme Mécatronique Mobile Intelligent pour Observer les Molécules en Phase Gazeuse en IR. Ph.D. Thesis, ENI, Sfax, Tunisia, 2024. [Google Scholar]
- Meftah, M.; Damé, L.; Keckhut, P.; Bekki, S.; Sarkissian, A.; Hauchecorne, A.; Bertran, E.; Rogers, J.P.; Abbaki, S.; Dufour, C.; et al. UVSQ-Sat, a Pathfinder CubeSat Mission for Observing Essential Climate Variables. Remote Sens. 2020, 12, 92. [Google Scholar] [CrossRef] [Scilit]
- Meftah, M.; Clavier, C.; Sarkissian, A.; Hauchecorne, A.; Bekki, S.; Lefevre, F.; Galopeau, P.; Dahoo, P.R.; Pazimeau, A.; Vieau, A.J.; et al. UVSQ-Sat NG, a New CubeSat Pathfinder for Monitoring Earth Outgoing Energy and Greenhouse Gases. Remote Sens. 2023, 15, 4876. [Google Scholar] [CrossRef] [Scilit]
- Meftah, M.; Dufour, C.; Bolsé, D.; Van Laeken, L.; Clavier, C.; Chandran, A.; Chang, L.; Sarkissian, A.; Galopeau, P.; Hauchecorne, A.; et al. Advancing CubeSats Capabilities: Ground-Based Calibration of Uvsq-Sat NG Satellite’s NIR Spectrometer and Determination of the Extraterrestrial Solar Spectrum. Remote Sens. 2024, 16, 3655. [Google Scholar] [CrossRef] [Scilit]
- Dahoo, P.R.; Meftah, M.; El Hami, A. NanoSatellites Cubesats de l’ére NewSpace pour l’Observation du Spatial-1; Série: Spectroscopie Infrarouge; ISTE Ltd.: London, UK, 2025; p. 270. [Google Scholar]
- Dahoo, P.R.; Meftah, M.; El Hami, A. NanoSatellites Cubesats de l’ére NewSpace pour l’Observation du Spatial-2; Série: Spectroscopie Infrarouge; ISTE Ltd.: London, UK, 2025; p. 290. [Google Scholar]
- Dahoo, P.R.; Hamon, T.; Negulescu, B.; Rocher, P.; Tessier, M.; Wack, A.; Thomas, L. Evidence by Spectroscopic Ellipsometry of Optical Property Change in Pulsed Laser Deposited NiO Films when Heated in Air at Neel Temperature. Appl. Phys. A 2004, 79, 1439–1443. [Google Scholar] [CrossRef] [Scilit]
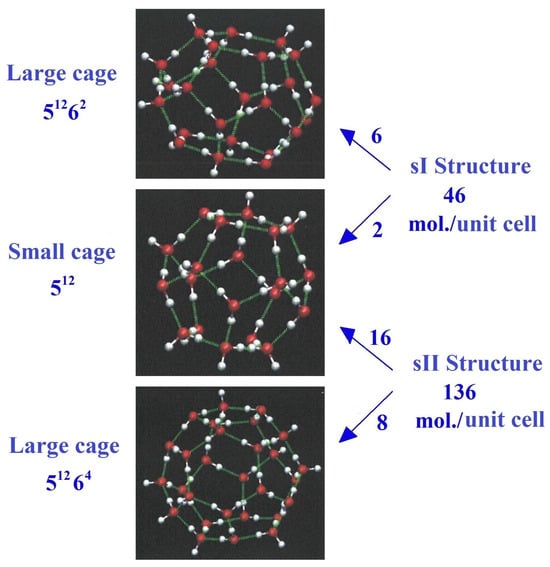
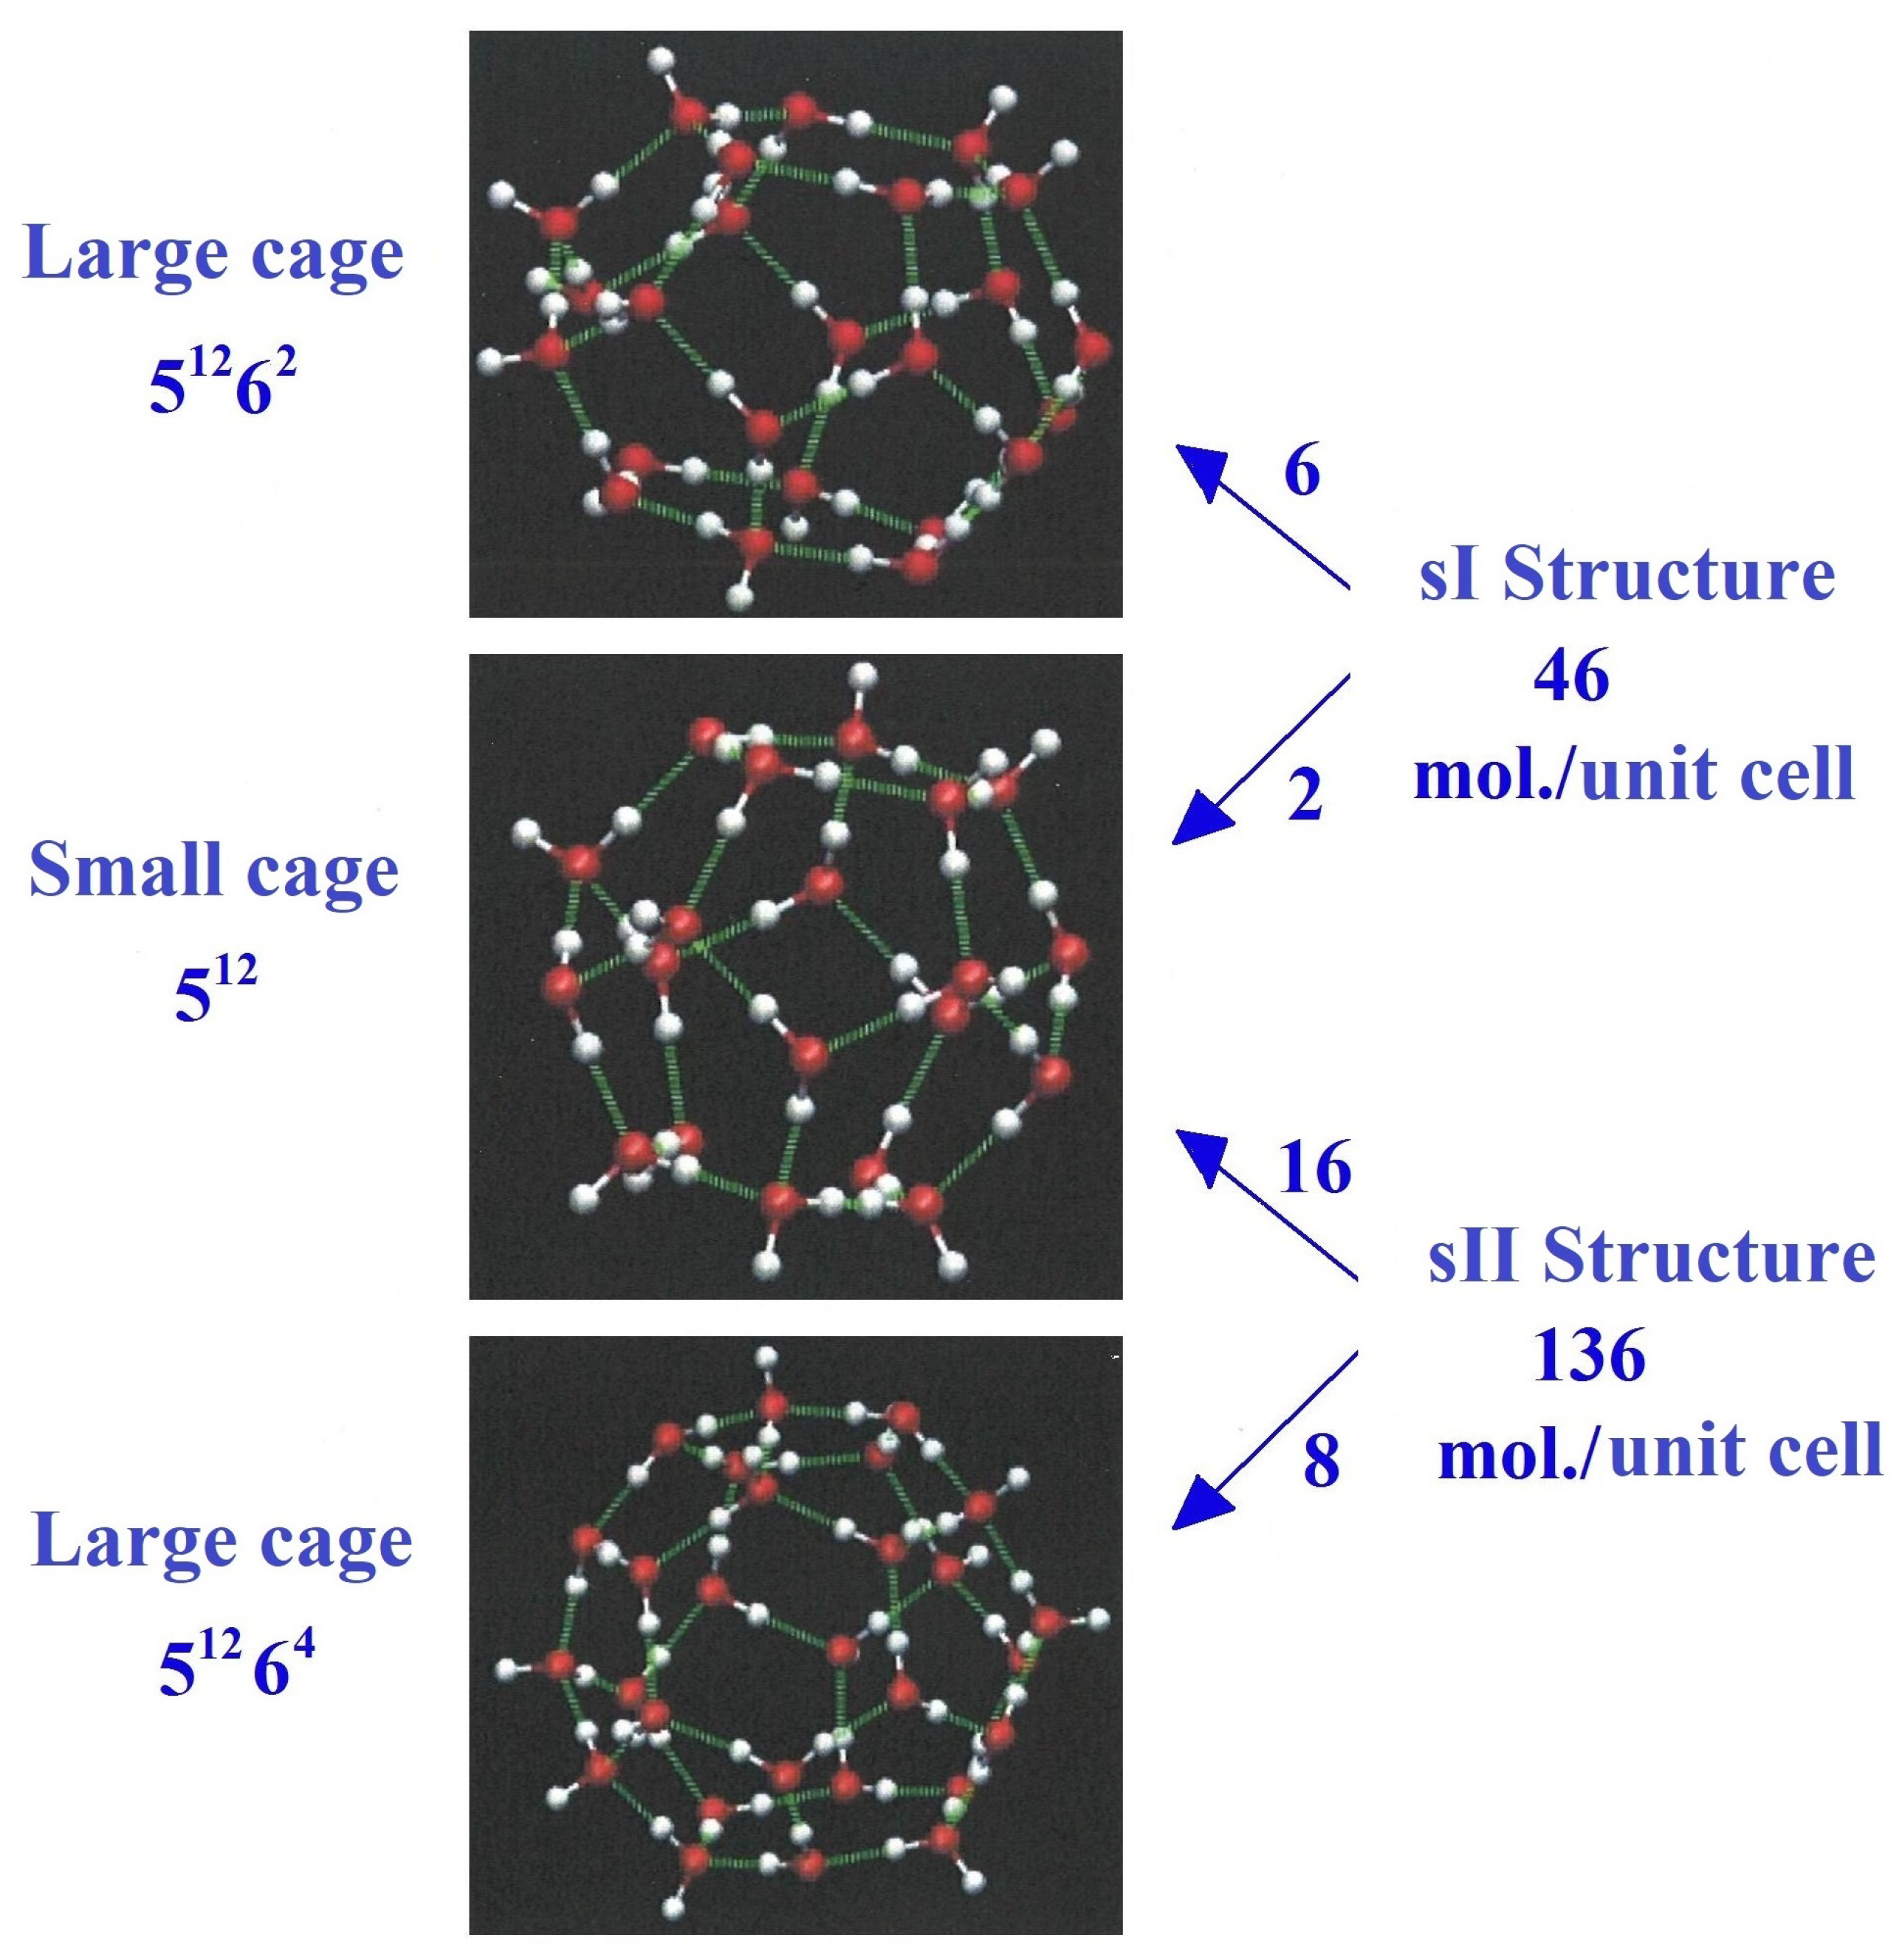
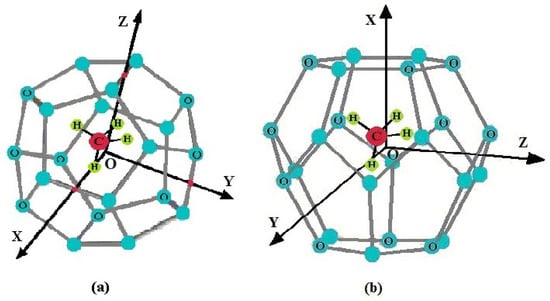
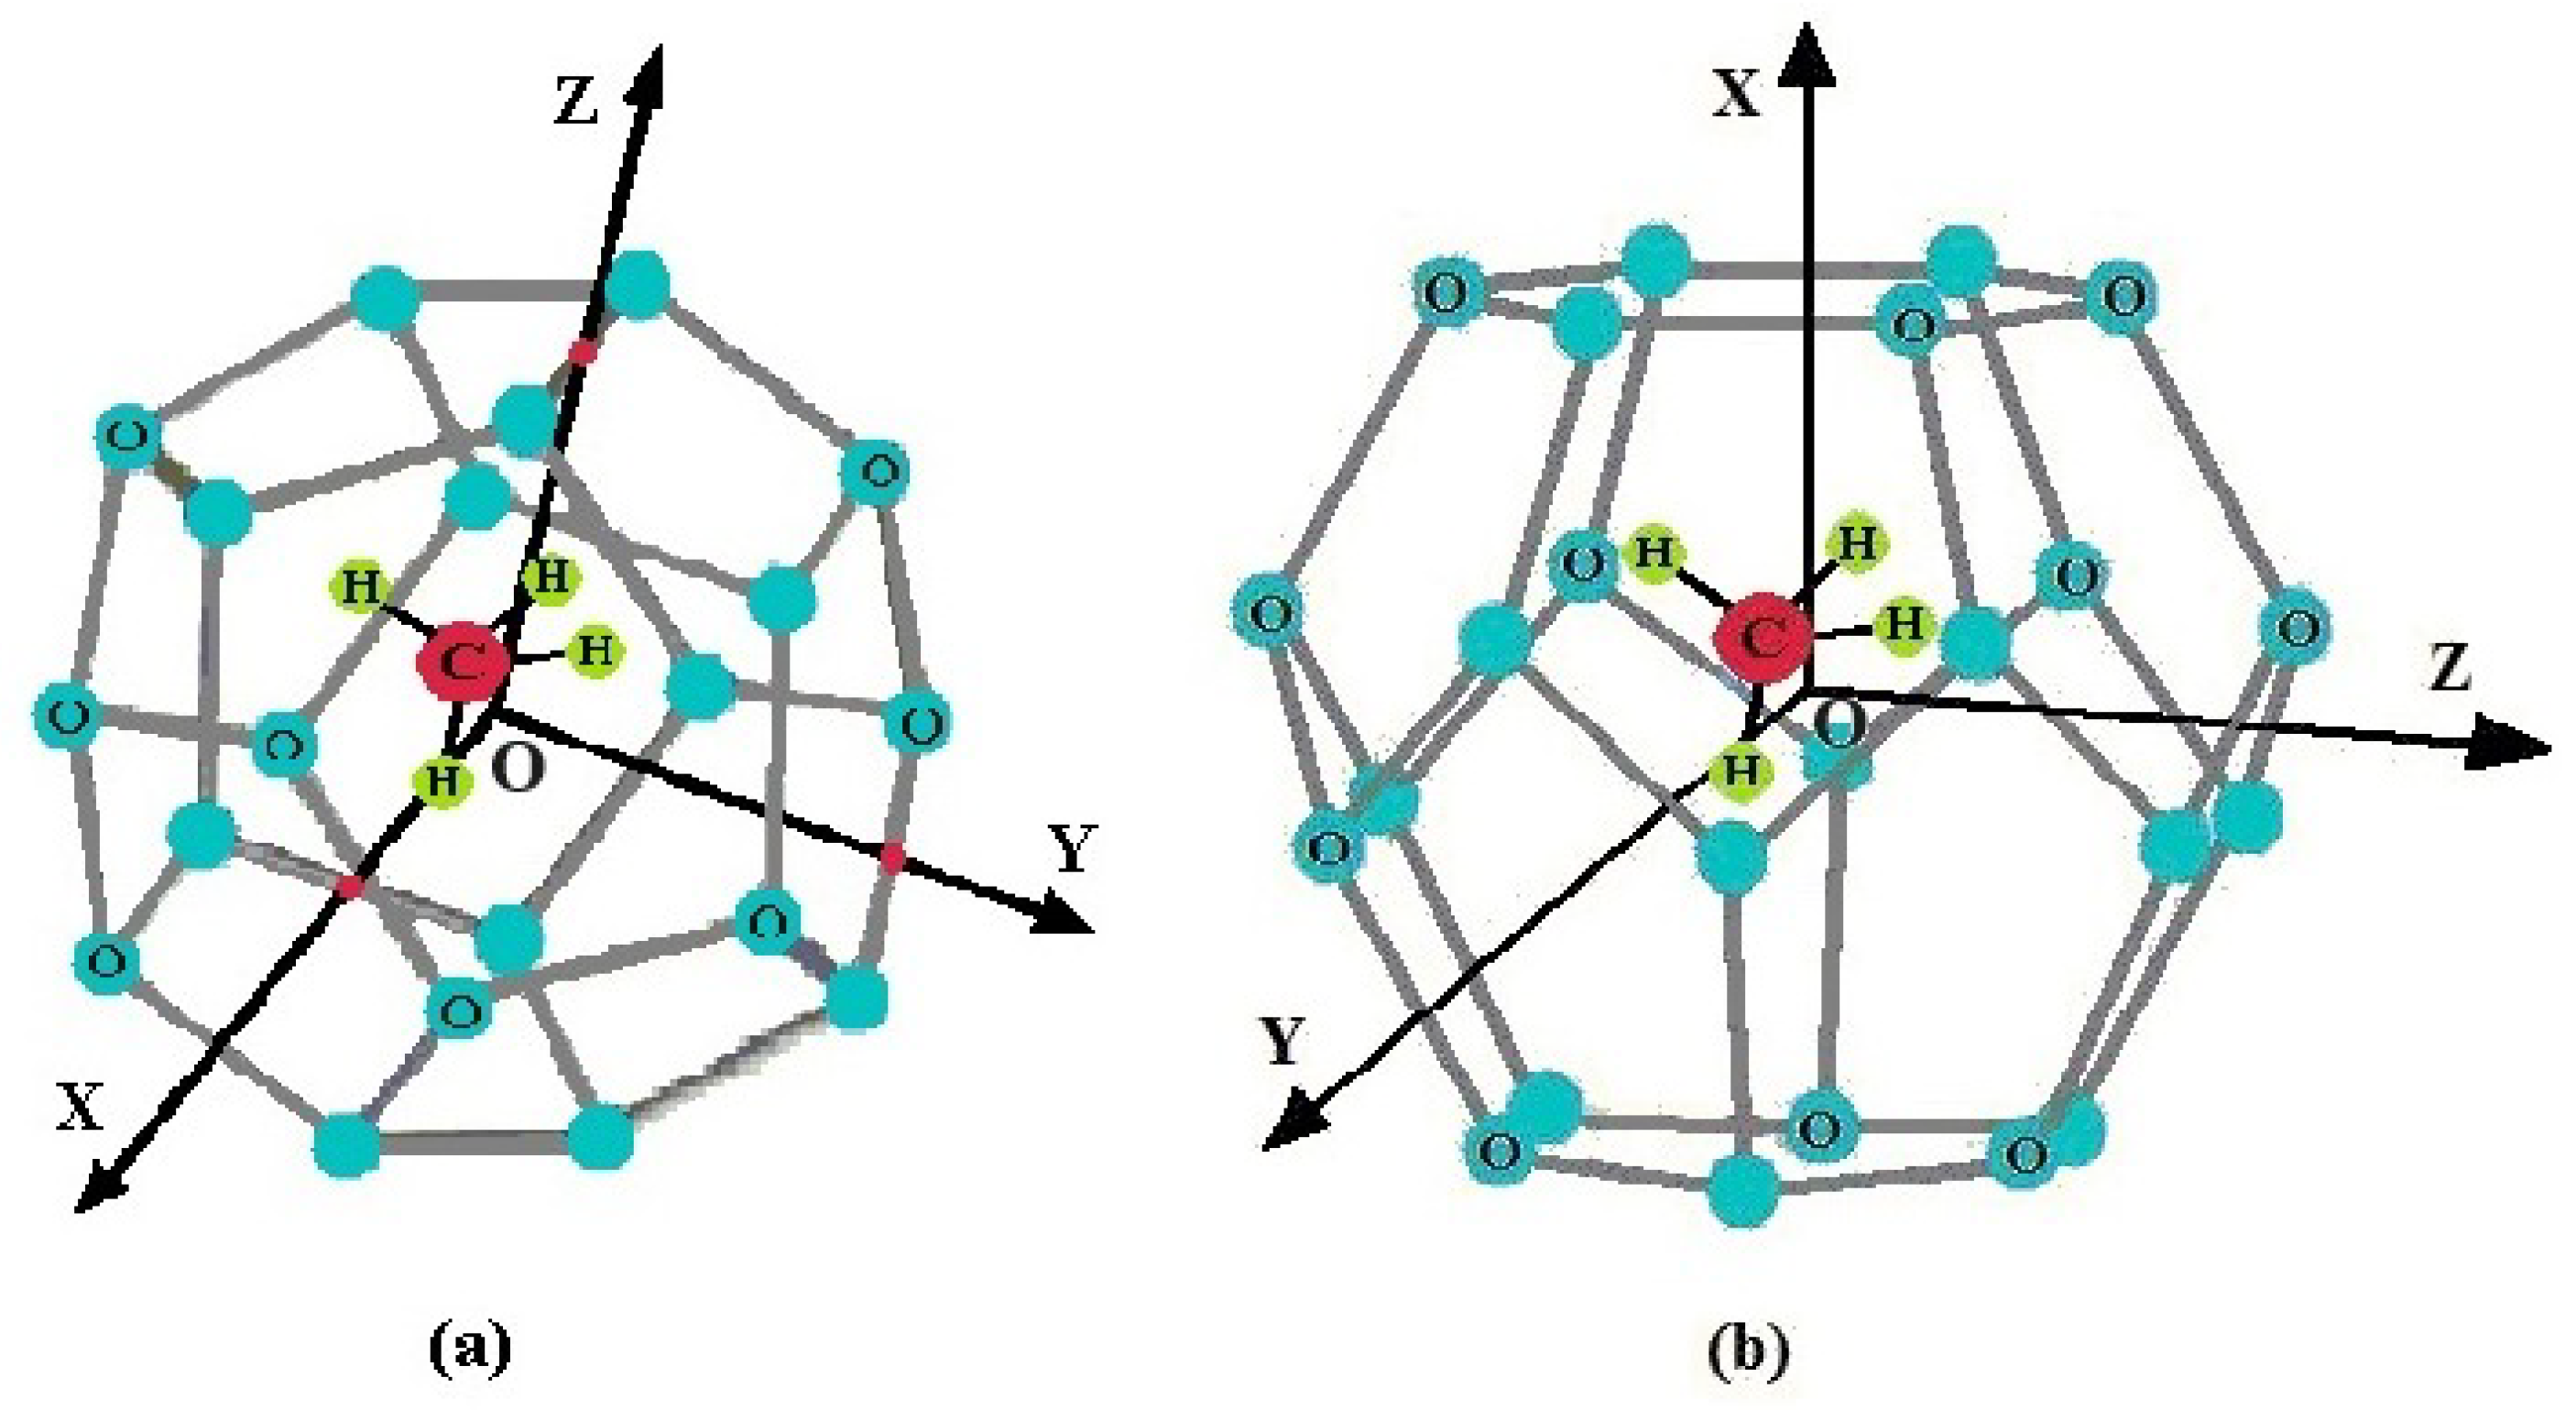
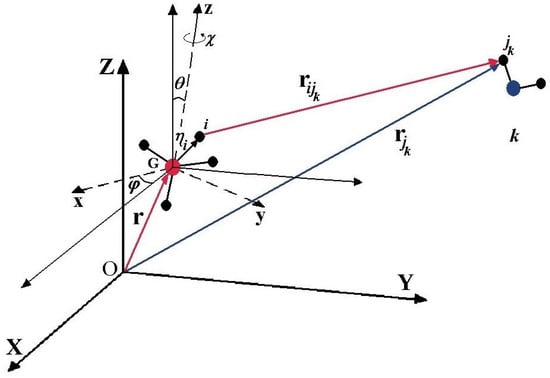
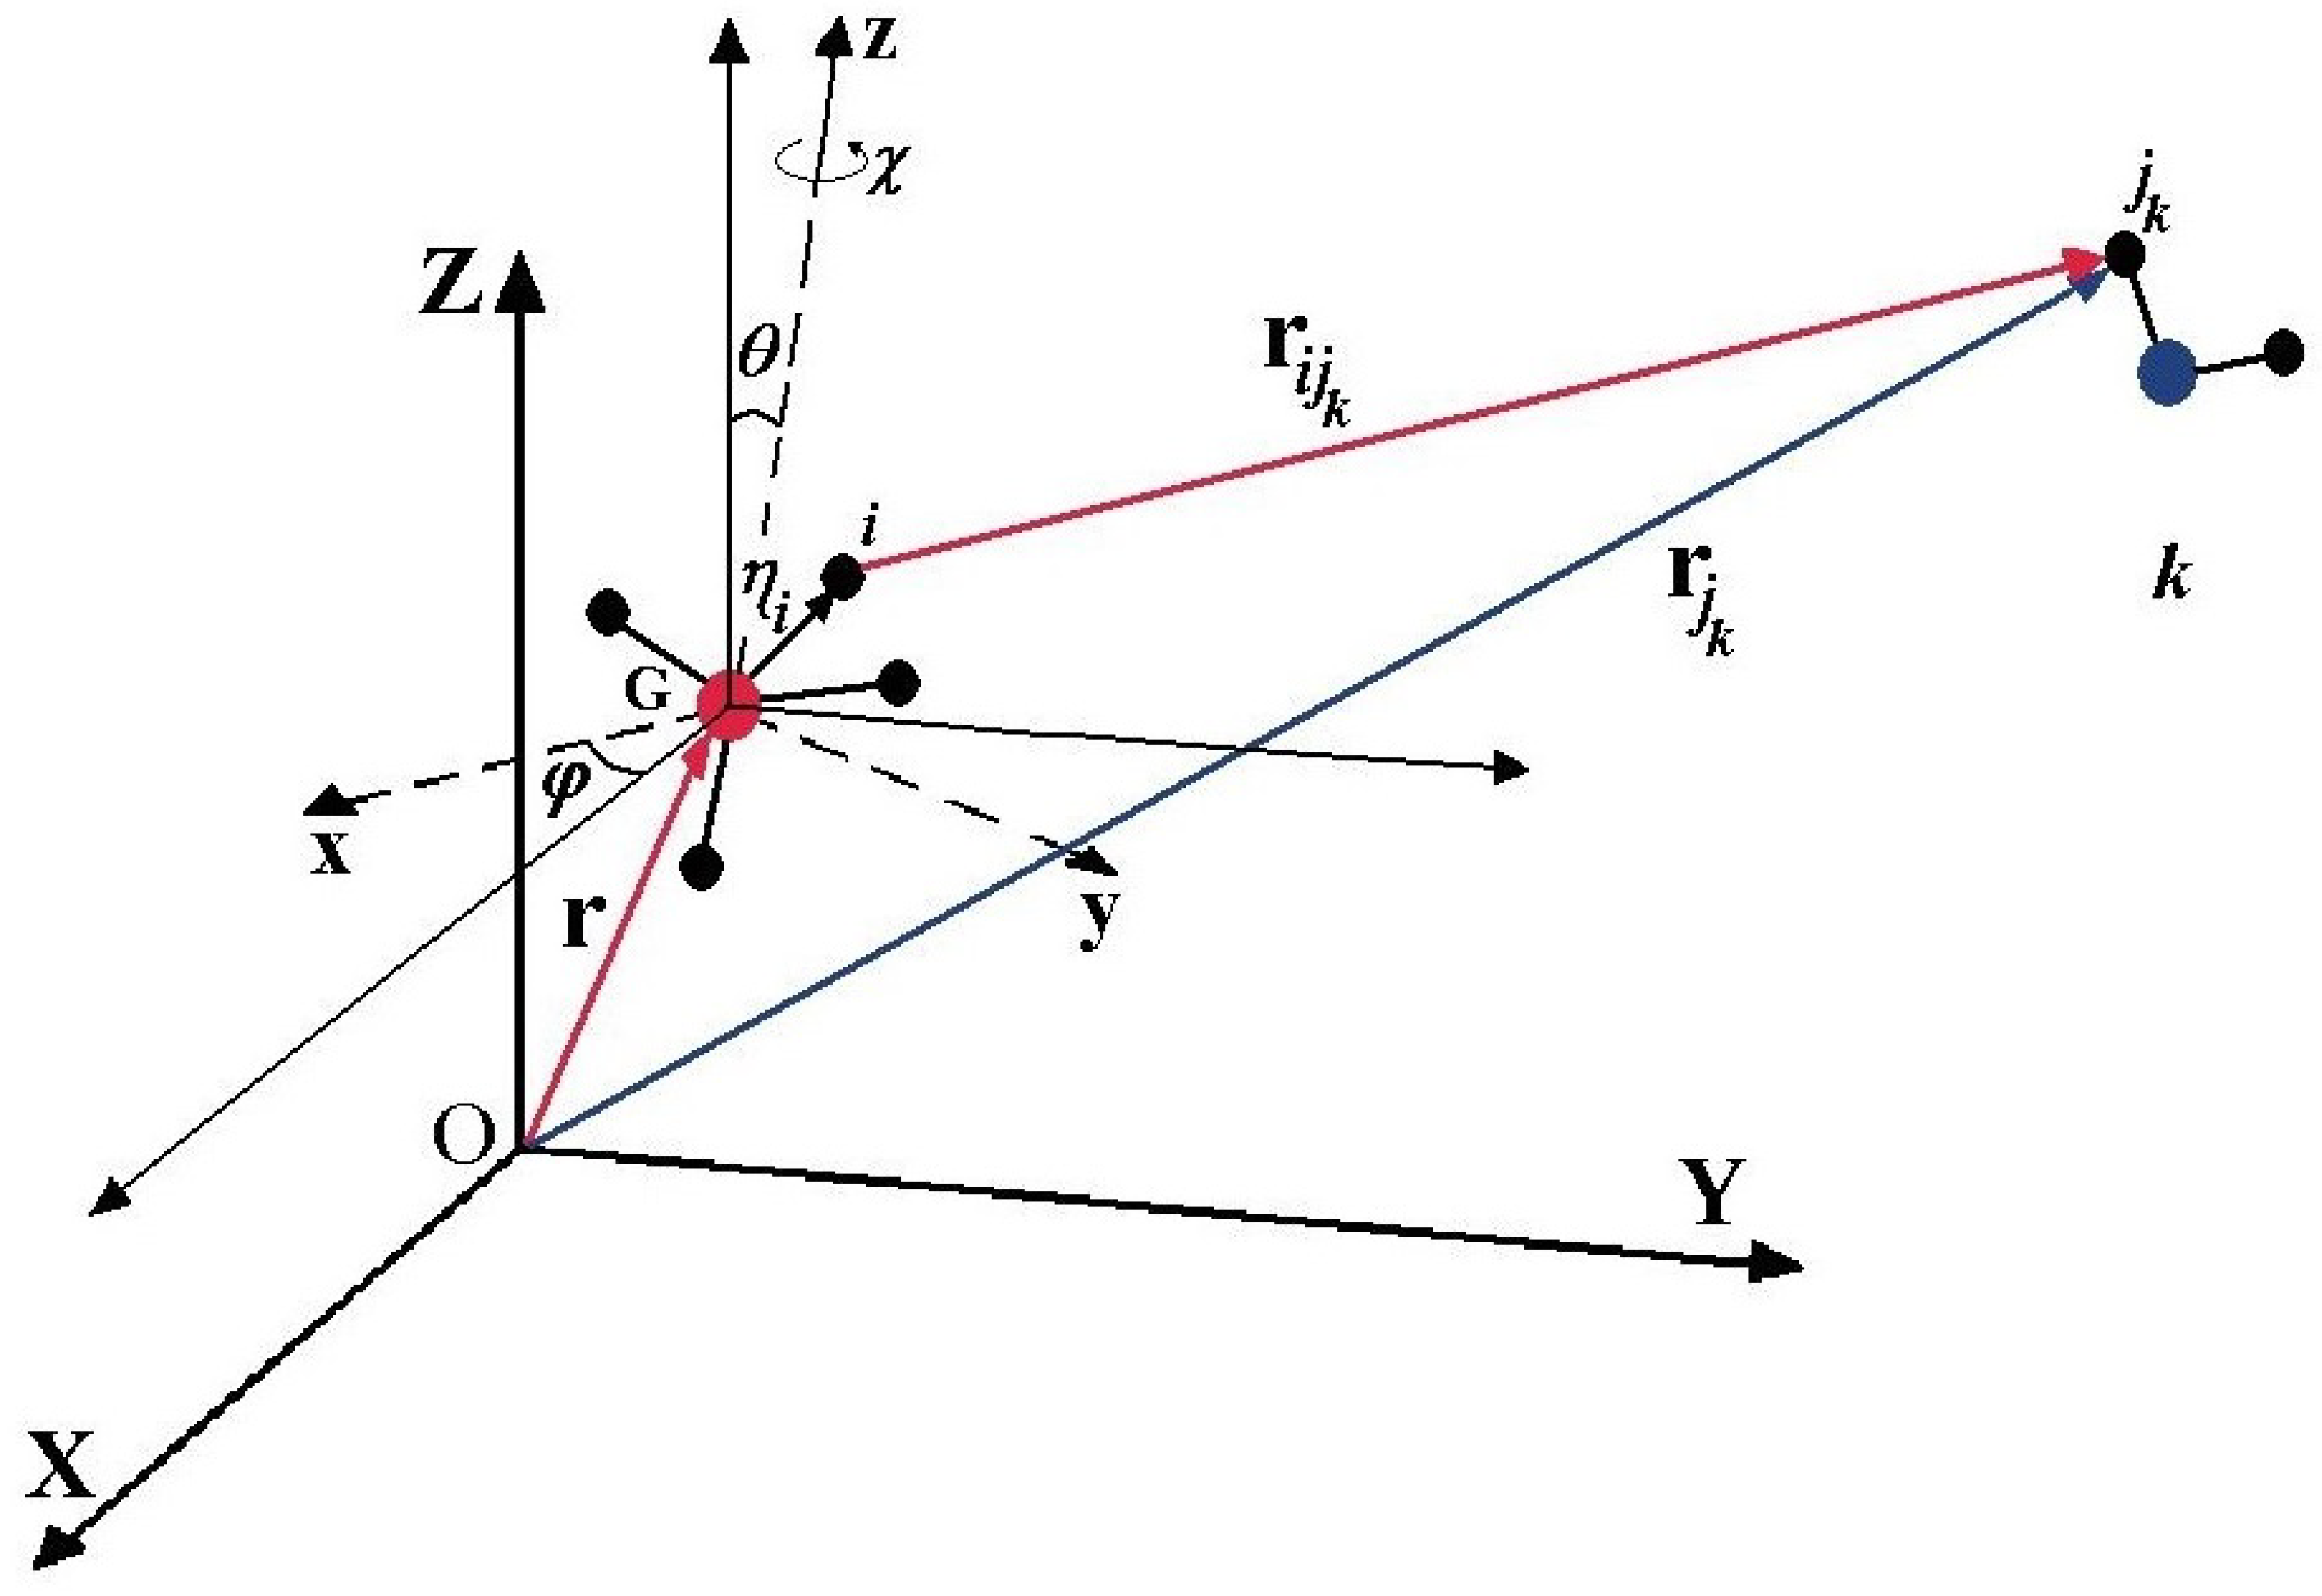
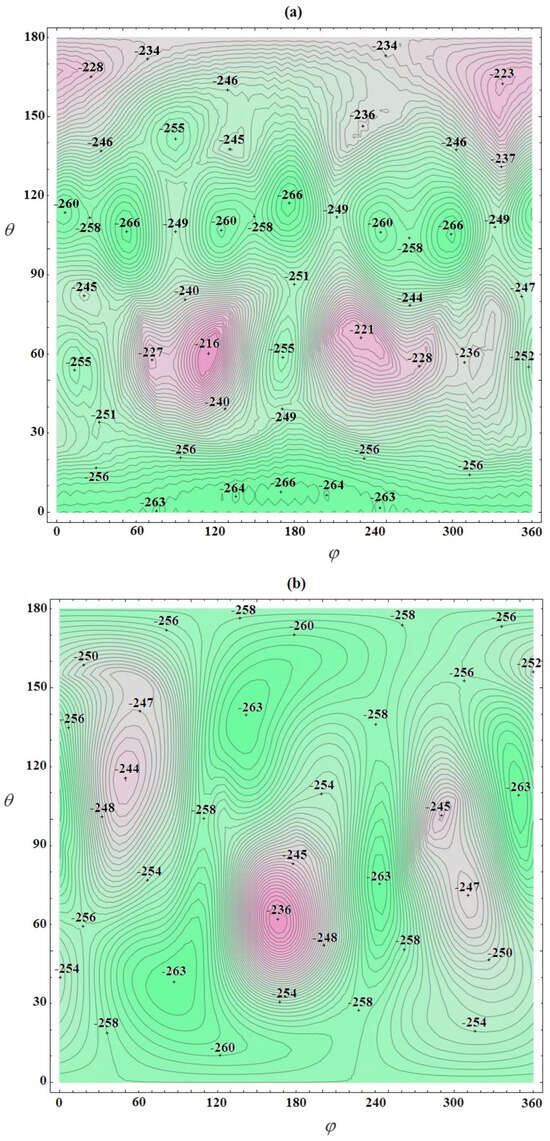
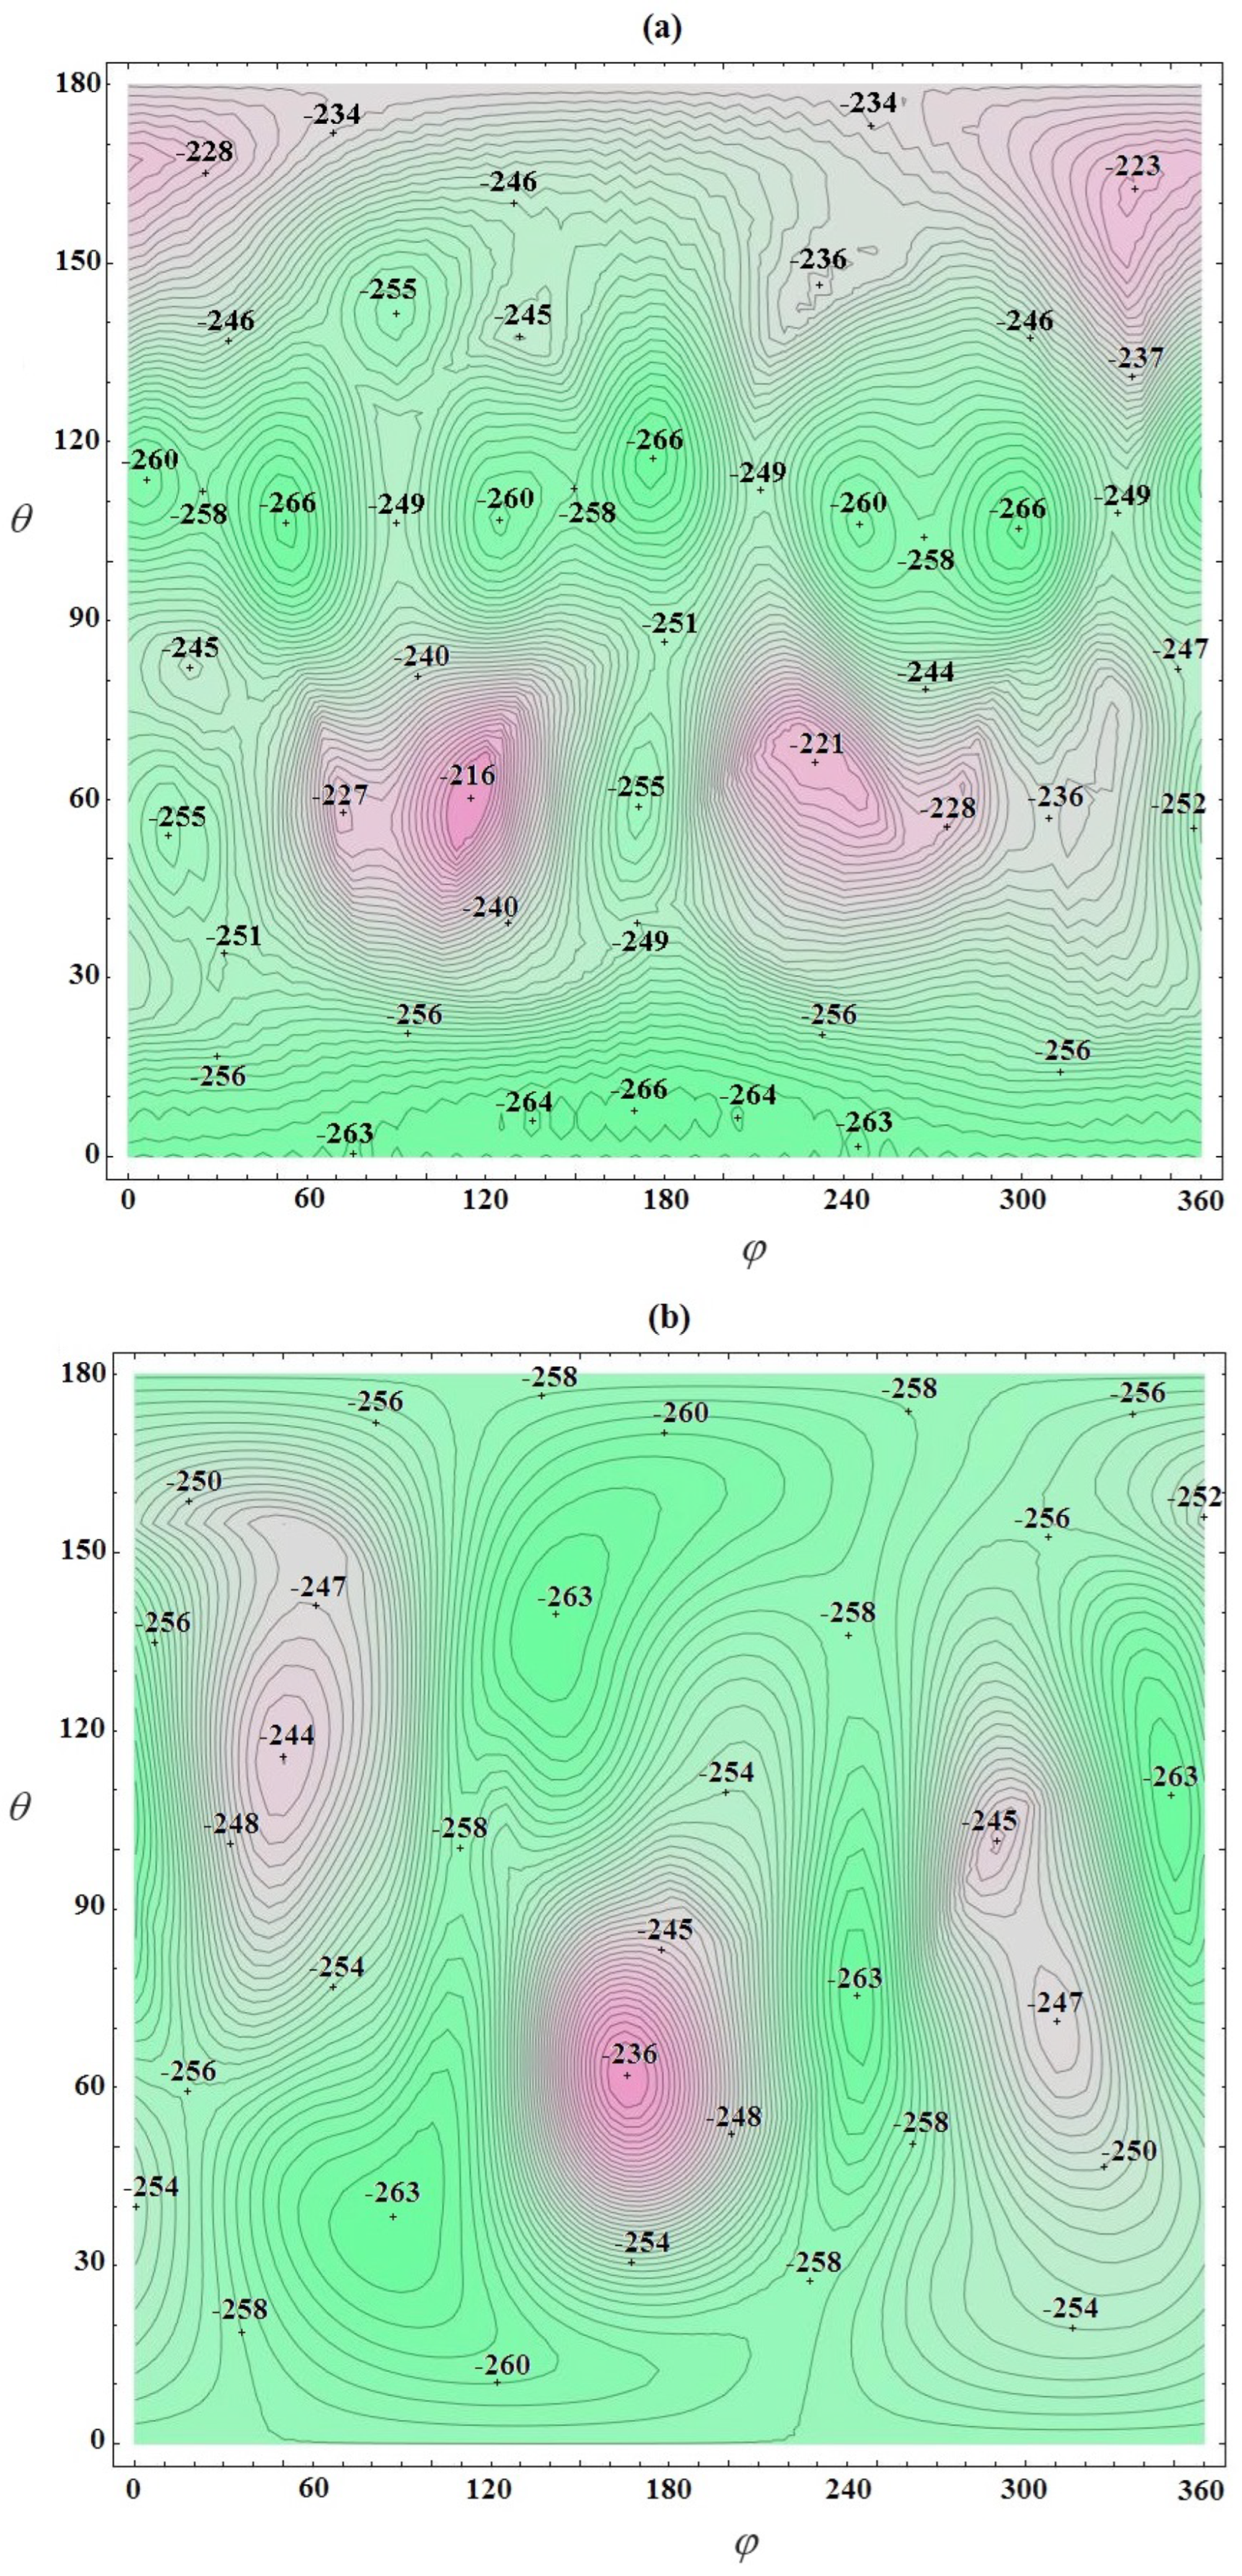
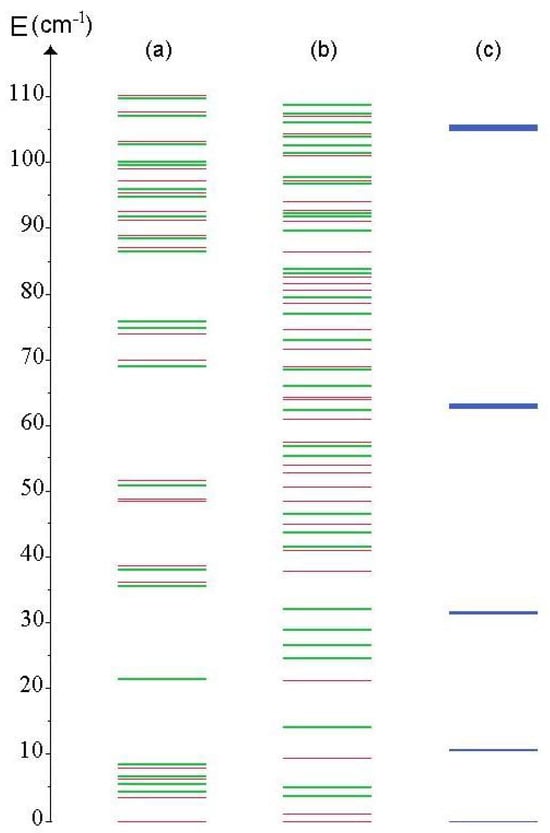
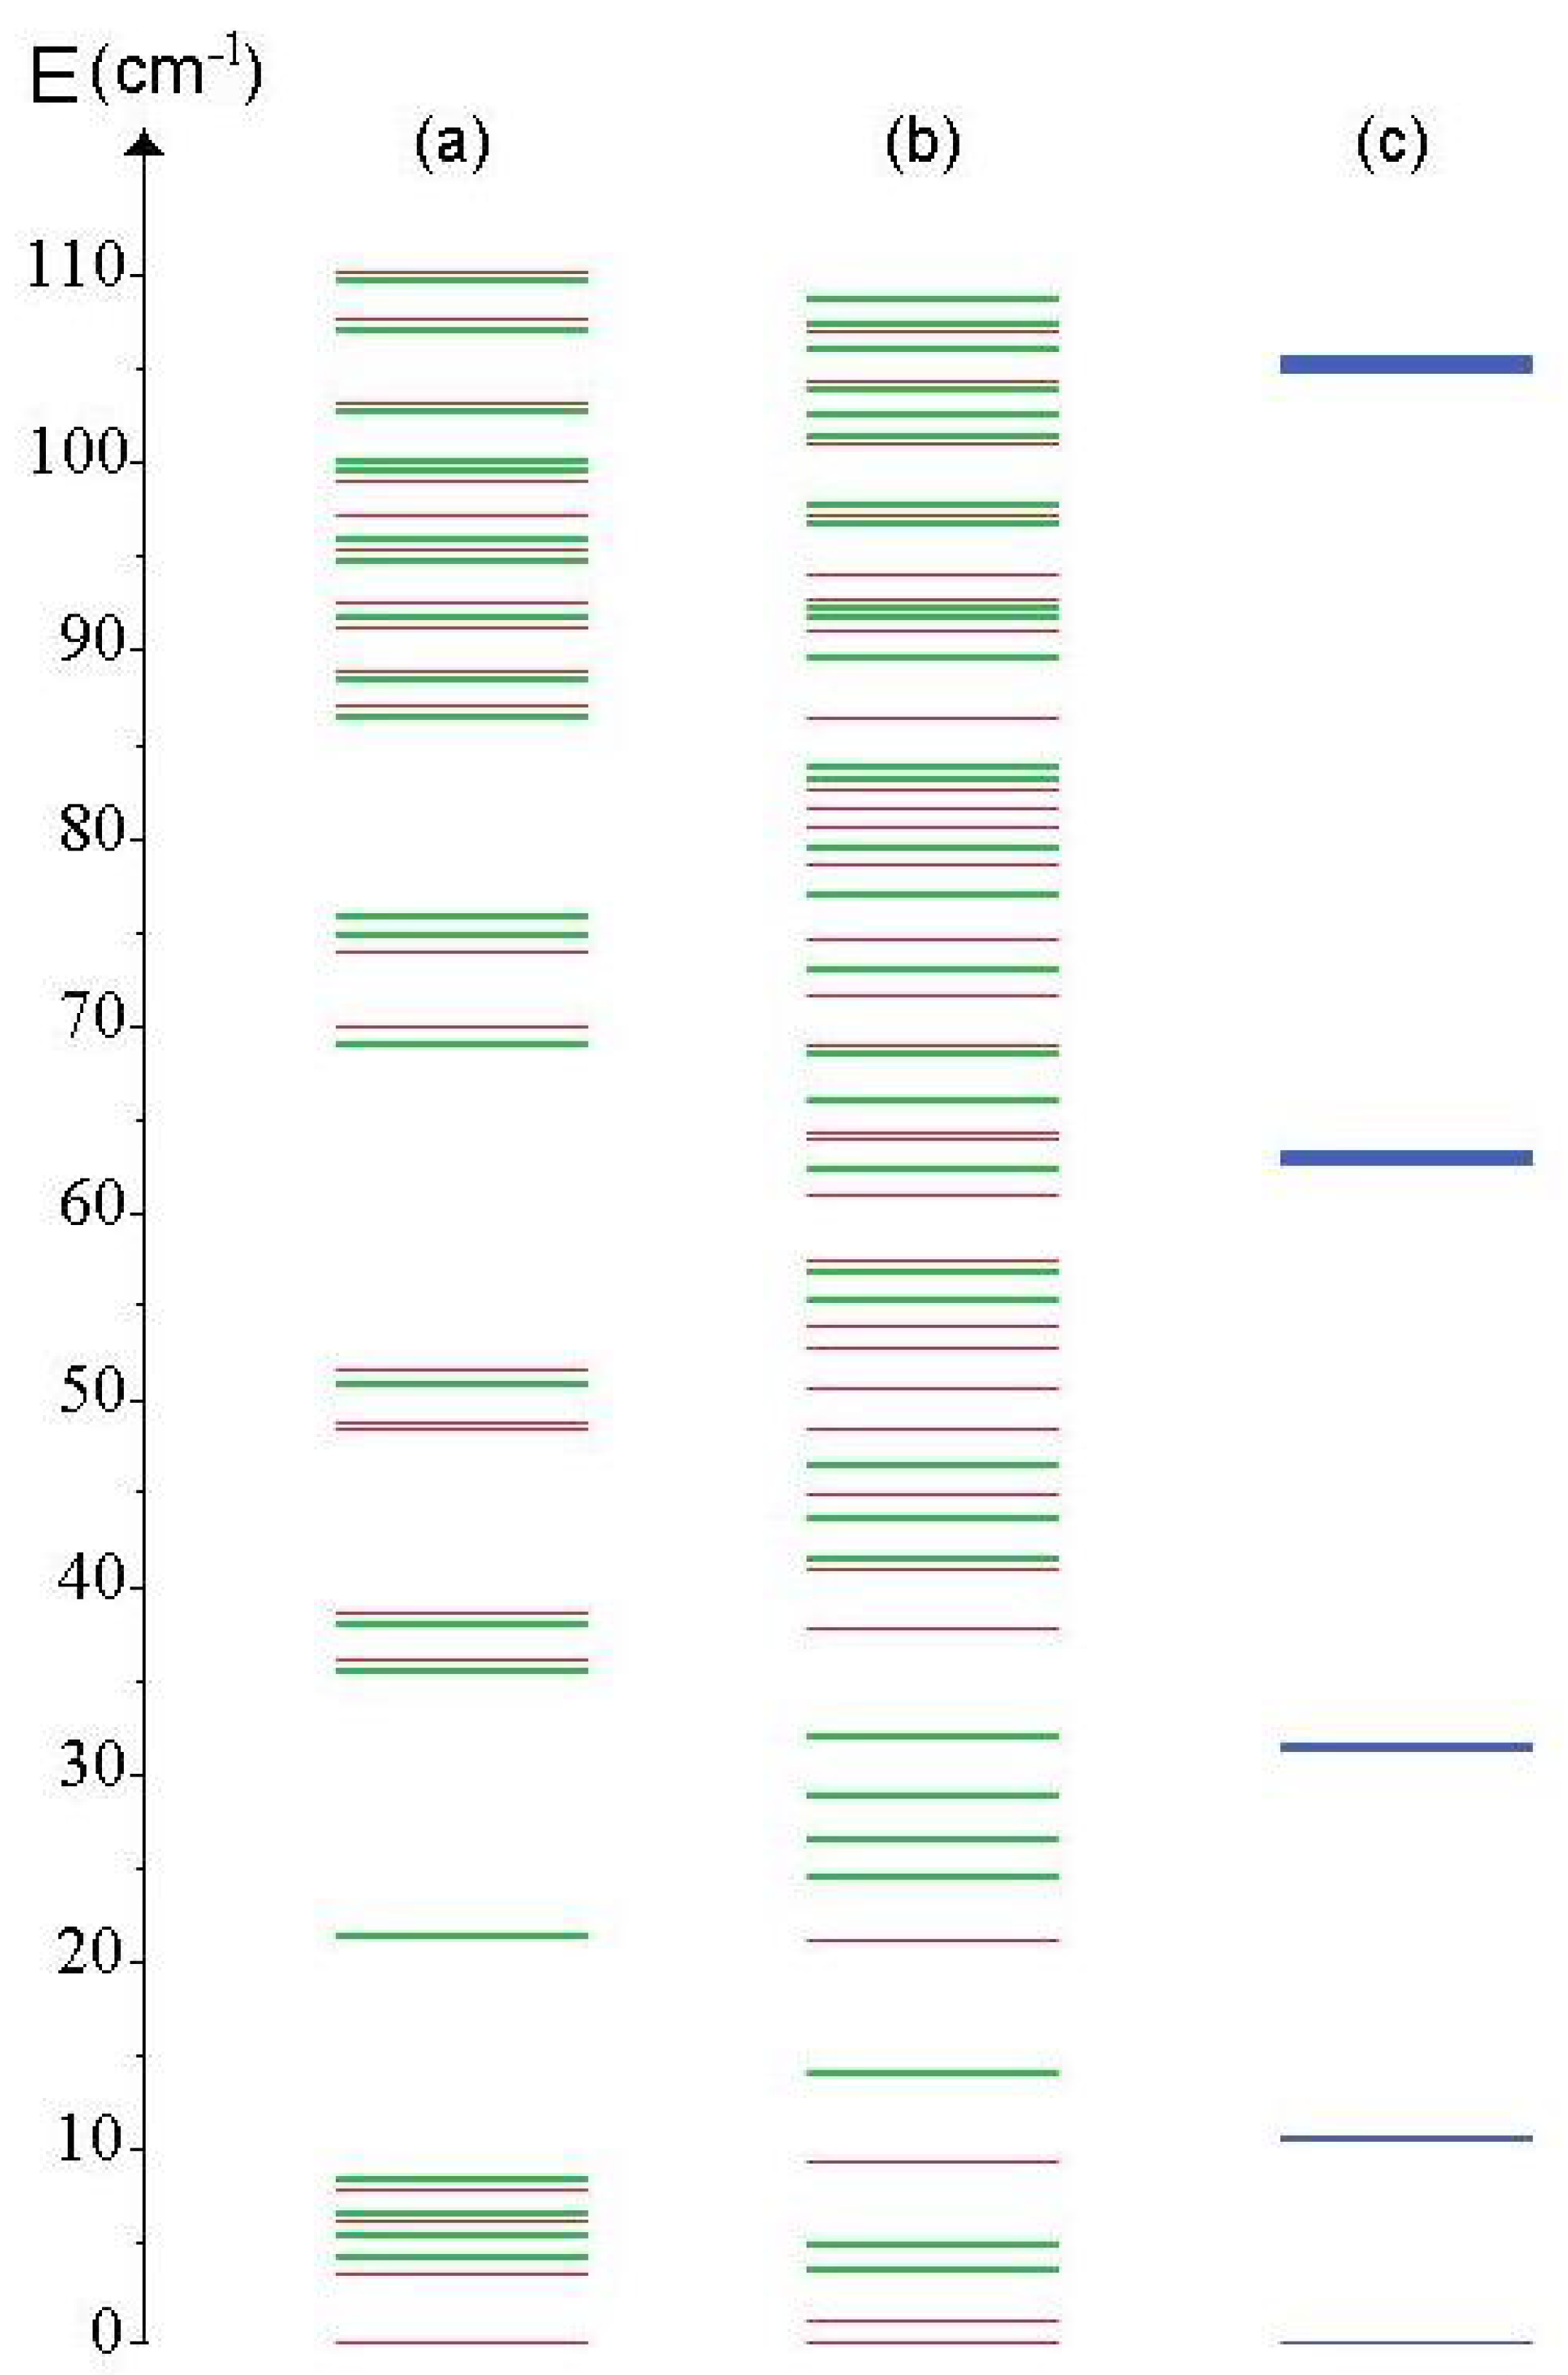
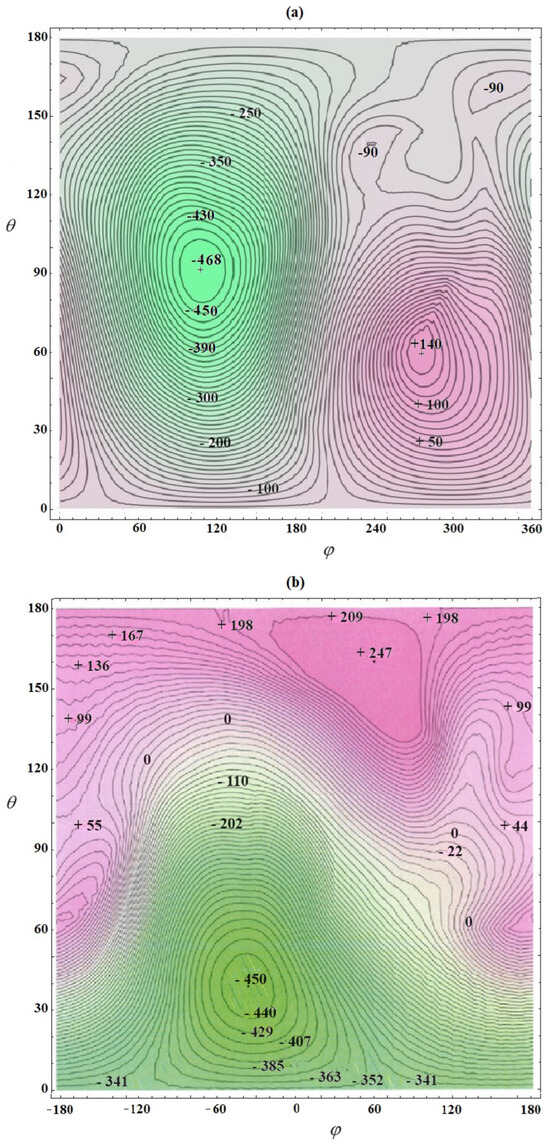
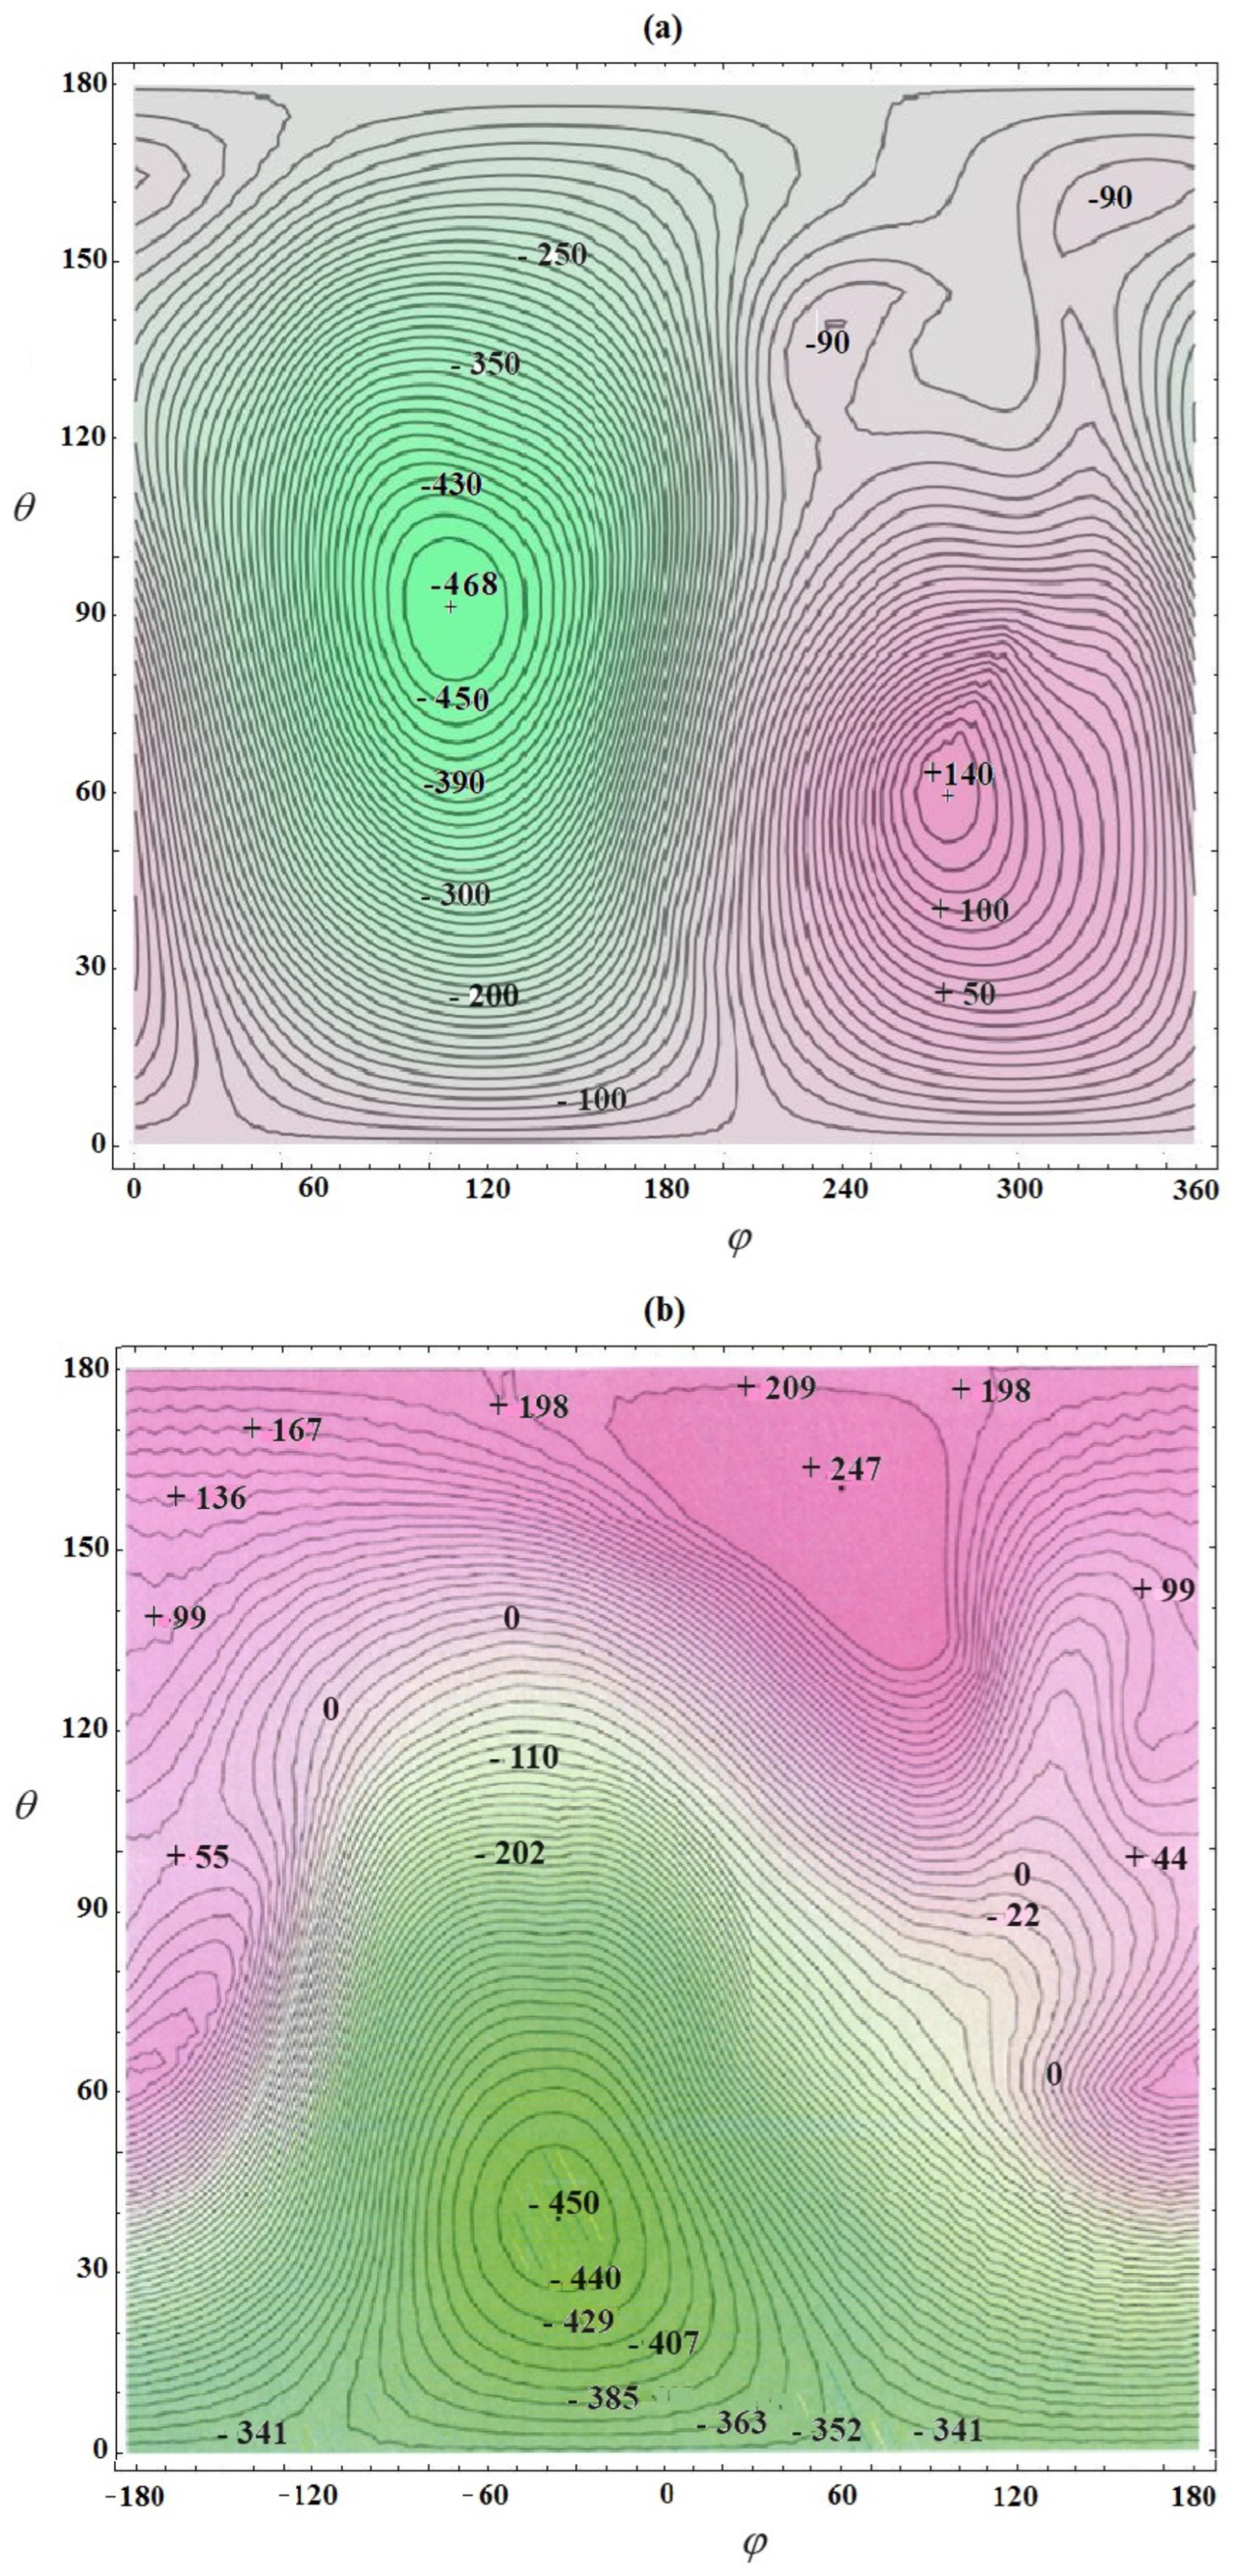
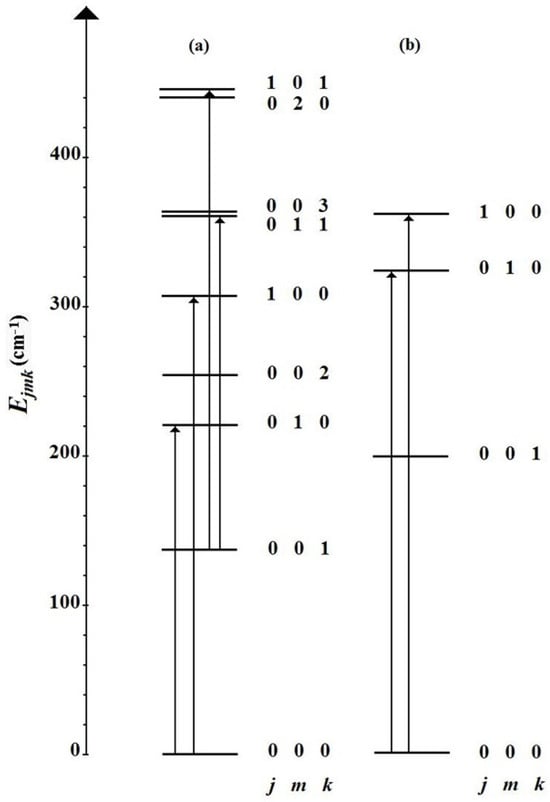
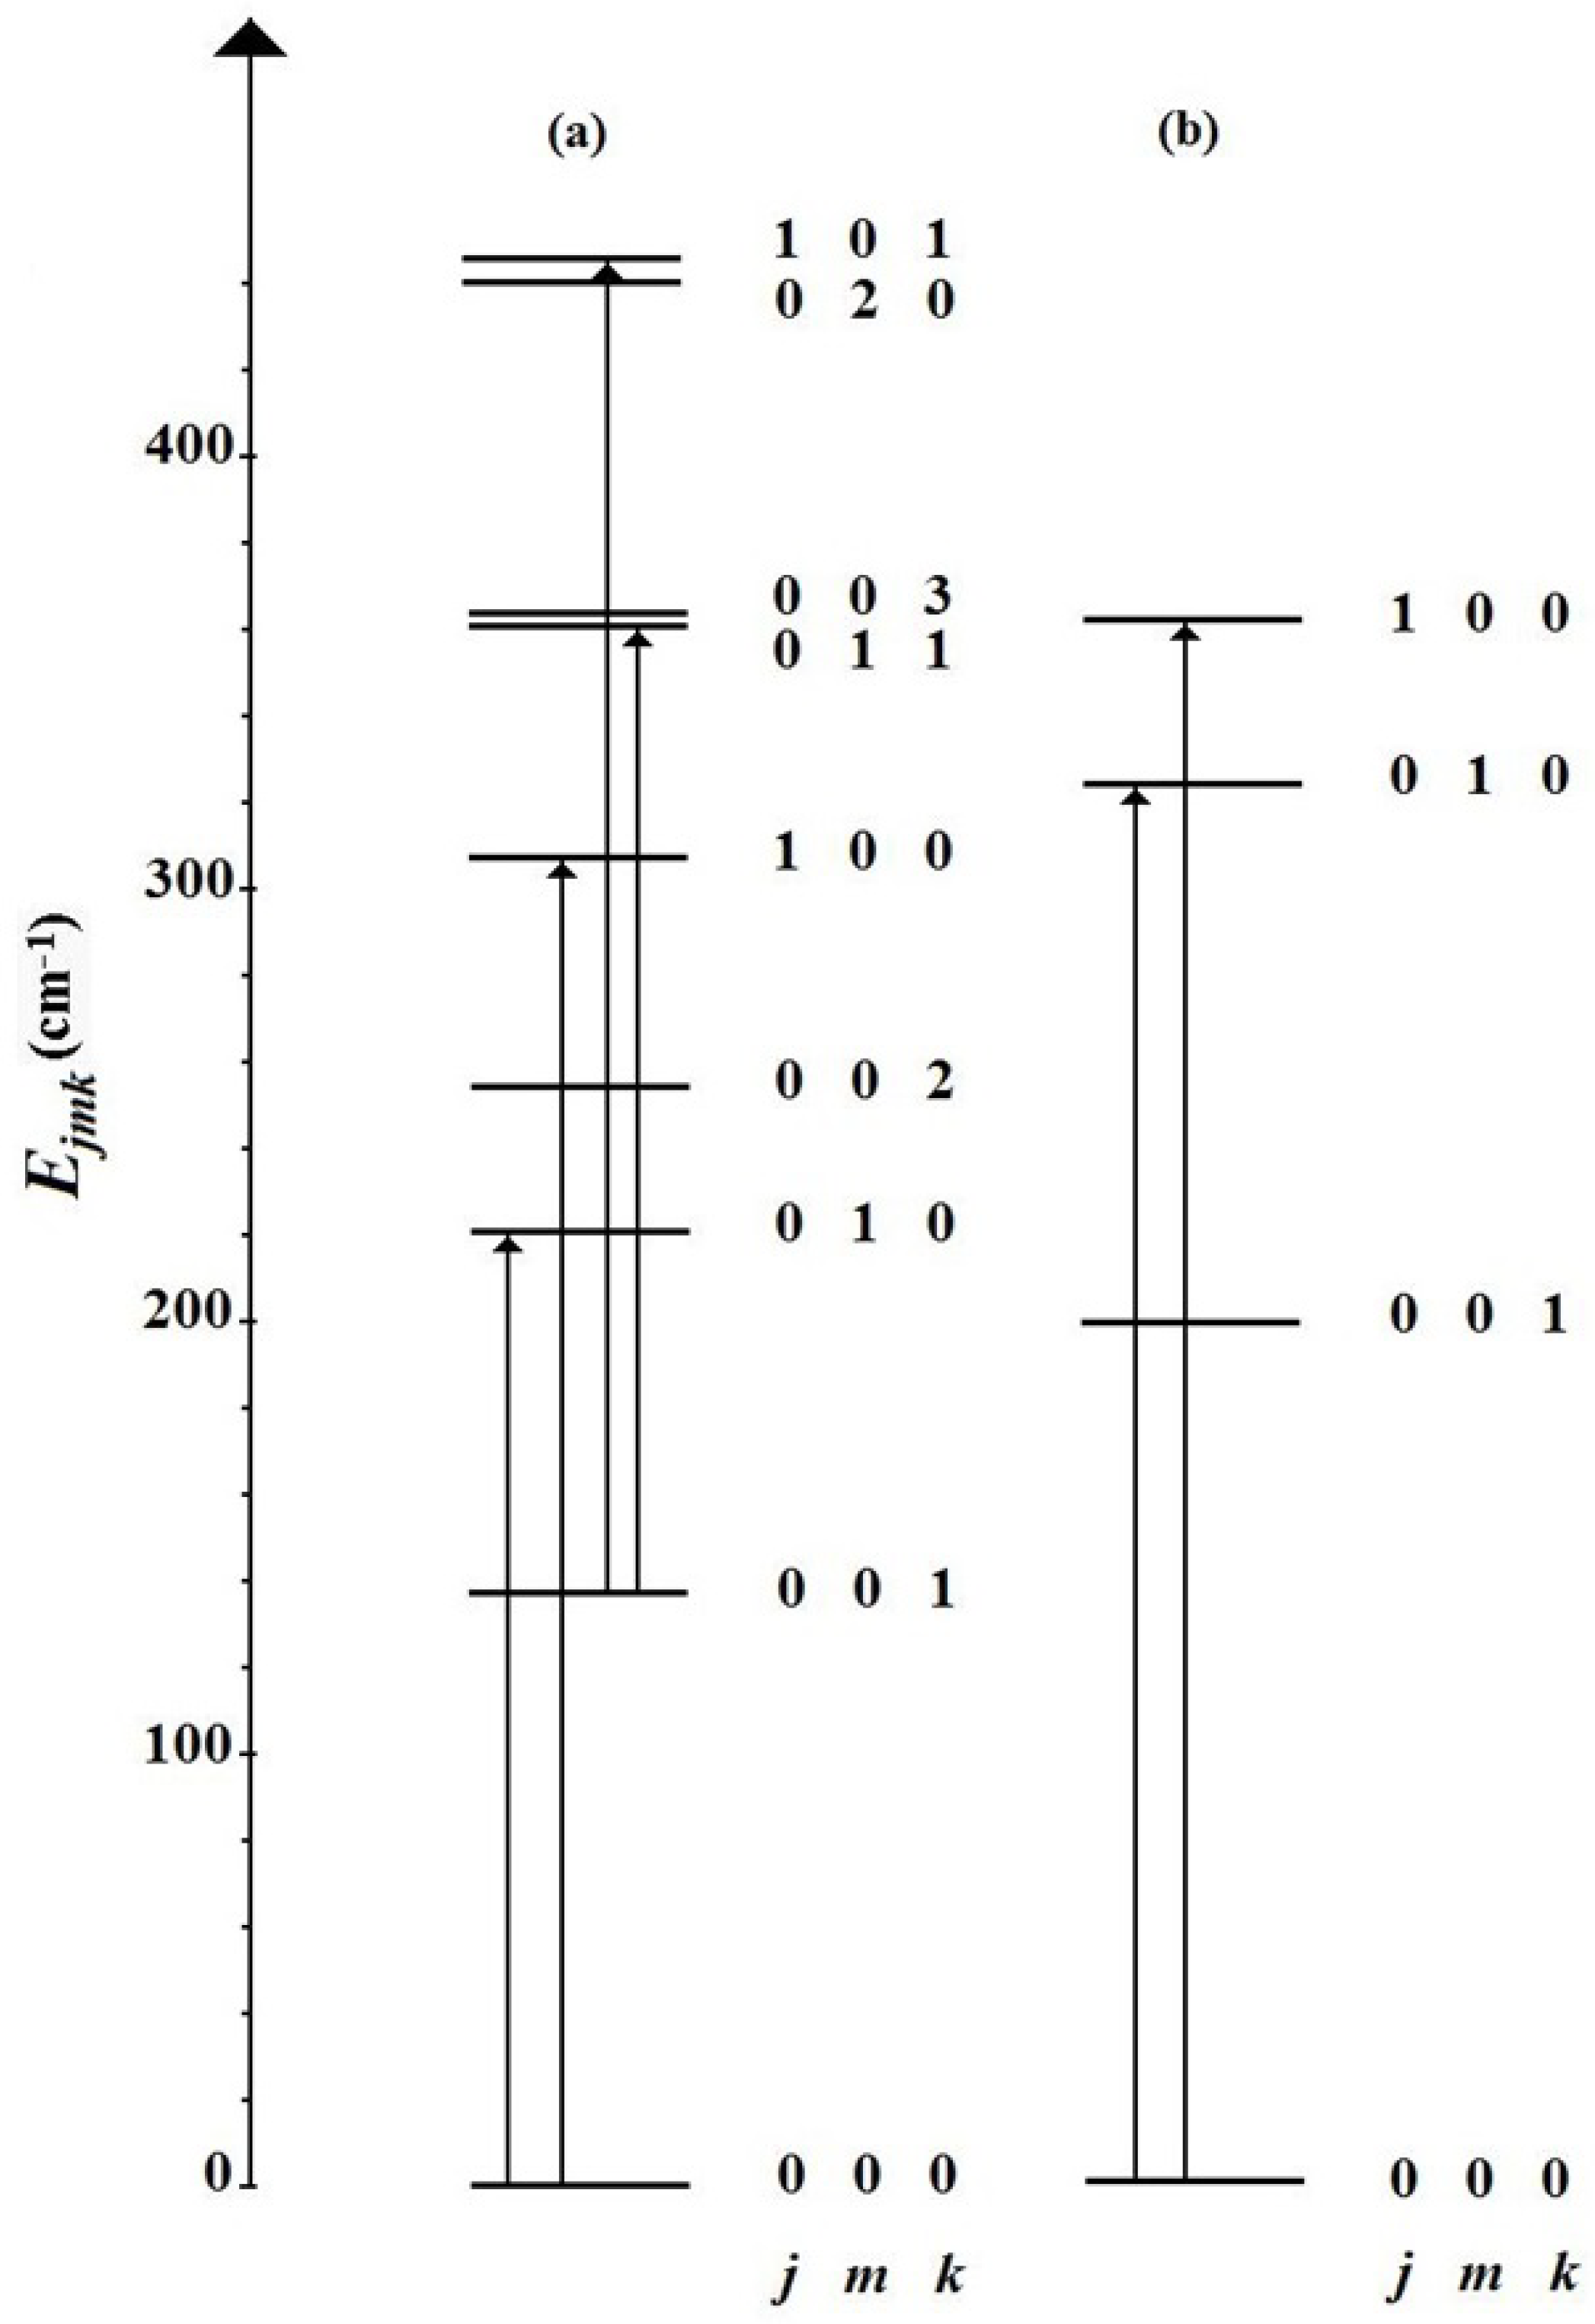
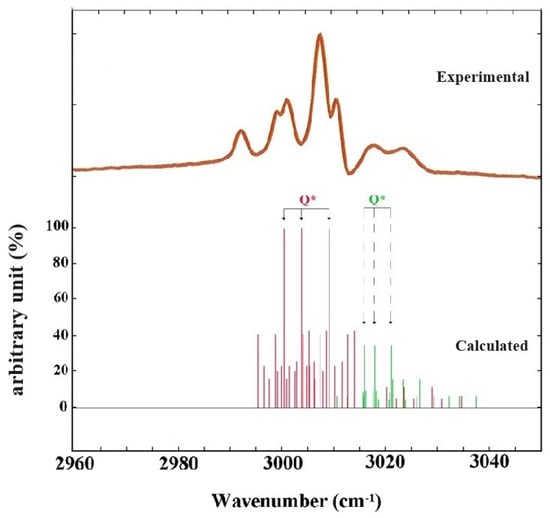
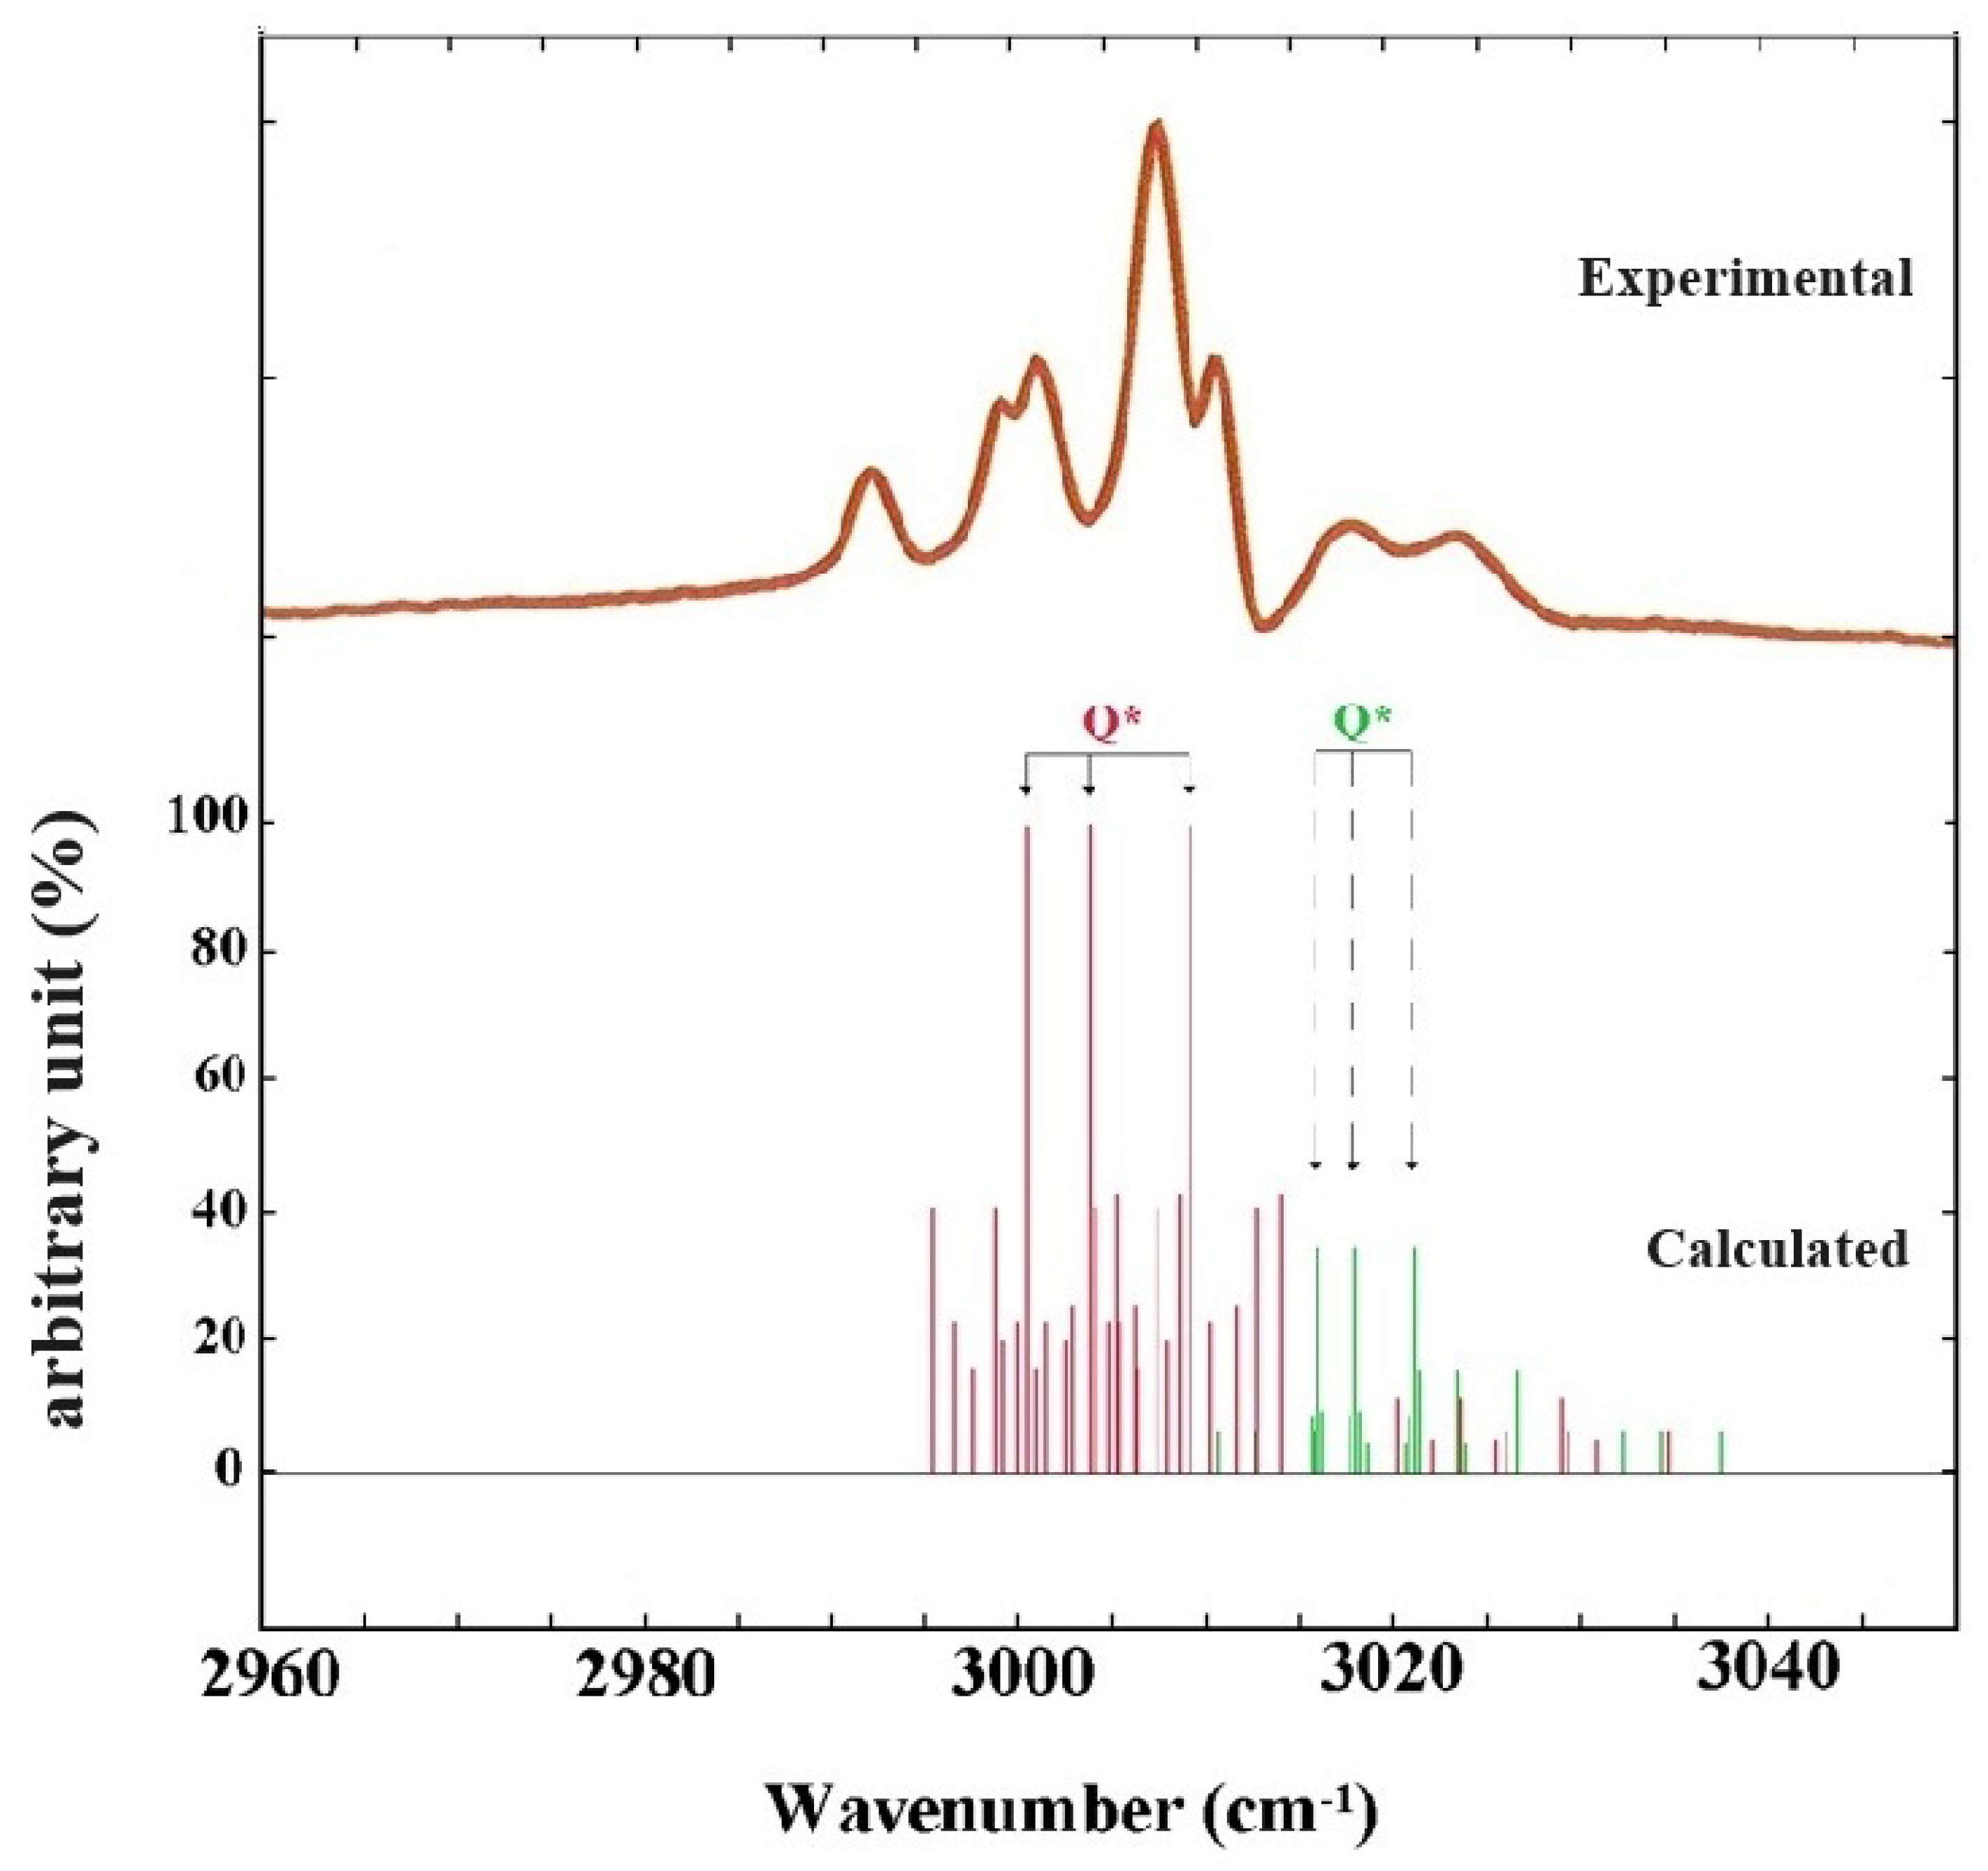

Disclaimer/Publisher’s Note: The statements, opinions and data contained in all publications are solely those of the individual author(s) and contributor(s) and not of MDPI and/or the editor(s). MDPI and/or the editor(s) disclaim responsibility for any injury to people or property resulting from any ideas, methods, instructions or products referred to in the content. |
© 2026 by the authors. Licensee MDPI, Basel, Switzerland. This article is an open access article distributed under the terms and conditions of the Creative Commons Attribution (CC BY) license.