


Abstract
The purpose of this study is to determine the optimal location for siting an onshore wind farm on the island of Skyros, thereby maximizing performance and minimizing the project’s environmental impacts. Seven evaluation criteria are defined across various sectors, including environmental and economic sectors, and six criteria weighting methods are applied in combination with four multicriteria decision-making (MCDM) ranking methods for suitable areas, resulting in twenty-four ranking models. The alternatives considered in the analysis were defined through the application of constraints imposed by the Specific Framework for Spatial Planning and Sustainable Development for Renewable Energy Sources (SFSPSD RES), complemented by exclusion criteria documented in the international literature, as well as a minimum area requirement ensuring the feasibility of installing at least four wind turbines within the study area. The correlations between their results are then assessed using the Spearman coefficient. Geographic information systems (GISs) are utilized as a mapping tool. Through the application of the methodology, it emerges that area A9, located in the central to northern part of Skyros, is consistently assessed as the most suitable site for the installation of a wind farm based on nine models combining criteria weighting and MCDM methods, which should be prioritized as an option for early-stage wind farm siting planning. The results demonstrate an absolute correlation among the subjective weighting methods, whereas the objective methods do not appear to be significantly correlated with each other or with the subjective methods. The ranking methods with the highest correlation are PROMETHEE II and ELECTRE III, while those with the lowest are TOPSIS and VIKOR. Additionally, the hierarchy shows consistency across results using weights from AHP, BWM, ROC, and SIMOS. After applying multiple methods to investigate correlations and mitigate their disadvantages, it is concluded that when experts in the field are involved, it is preferable to incorporate subjective multicriteria analysis methods into decision-making problems. Finally, it is recommended to use more than one MCDM method in order to reach sound decisions.
1. Introduction
Identifying sites that harmonize clean energy generation with environmental protection [1,2], economic viability, and social approval [3] is essential as the need for renewable energy, such as wind power, escalates. Finding the optimal location for onshore wind farms (OWFs) is a crucial process, with the aim of maximizing performance while minimizing or even mitigating environmental impacts. Selecting the right location for a wind farm is vital to its success, as it significantly impacts the amount of energy it can produce [4,5]. Various methodologies that contribute to appropriate decision-making can be found in the international literature, including multicriteria decision-making (MCDM) approaches and geographic information systems (GISs).
MCDM is a useful tool that can address complicated issues that include various different—and often controversial—criteria. The process of multicriteria decision-making comprises four main steps: defining the assessment criteria, collecting data for each criterion, computing the weights of the assessment criteria, and final ranking of the alternatives [6].
Integrated energy planning, considering environmental, social, and economic considerations, has spurred the routine adoption of multicriteria decision-making (MCDM) methods [7,8]. In this setting, GISs prove indispensable for scouting sites and pinpointing optimal wind farm locations due to their ability to generate comprehensive databases and translate them into clear visual maps [9,10,11]. GISs are employed to collect and analyze spatial data, integrating the information with MCDM techniques to aid in site selection [12,13,14]. In their 2021 review, Sotiropoulou and Vavatsikos [15] listed 35 journal papers that examined multicriteria GIS-assisted relative suitability analyses for wind farms, all drawn from the Scopus database and published since 2001. Seven of these works (20%) were published between 2001 and 2010, while the remaining 28 (80%) were published between 2011 and 2021. Recent case studies from the five last years that combine MCDM methods with GIS are detailed below.
Moradi et al. [16] combined AHP and GIS to assess the suitability of Alborz province in Iran for wind farm installations. Six evaluation criteria were considered in the analysis, and three different scenarios were considered (equal weight, zero weight to two economic criteria, zero weight to two electric criteria). Their findings demonstrated that the variance in appropriate land for the highly favored classes varied across each scenario.
Xu et al. [17] proposed a methodology that combines the interval analytic hierarchy process (IAHP) with the stochastic VIekriterijumsko KOmpromisno Rangiranje (VIKOR) and a GIS tool to determine the degree of suitability of wind farm siting in the Wafangdian region, China. Three exclusion criteria were defined, followed by six evaluation criteria. The weights of the evaluation criteria were determined through the IAHP, while the final ranking was obtained with the help of the stochastic VIKOR method. Both the evaluation criteria and the final hierarchy of the Wafangdian areas after the application of MCDM were spatially visualized through GIS maps. Although 30.2% of the study area was suitable for wind farm deployment, only 3.36% was characterized as highly suitable for this purpose. A sensitivity analysis was performed to investigate the influence of the weights on the final result through three different scenarios (equal weight, economic scenario promoting electricity generation, environmental- and social-oriented scenario).
Feloni and Karandinaki [18] reported a typical example of the application of MCDM combined with GIS for the siting of wind farms in the regional unit of Chania in Crete, Greece. Their aim was to develop and apply a GIS and MCDM methodology to identify the most suitable locations for the deployment of wind farms, considering multiple technical, environmental, and socio-economic criteria. The criteria were selected in accordance with legislative frameworks and available data. The weighting of the criteria was carried out using the AHP method, and the individual criteria were normalized on a standard scale (0–1) with the aid of GIS tools. The final synthetic evaluation was conducted using the weighted linear combination (WLC) method, which combines the normalized fields with corresponding weights. Three different scenarios (technical, techno-economic, and techno-economic-environmental) were applied, resulting in distinct suitability maps. The area east of the prefecture of Chania was characterized in all scenarios as more suitable for the installation of wind farms, mainly in mountainous and semi-mountainous zones with interesting wind potential.
Sotiropoulou and Vavatsikos [15] investigated the siting of an onshore wind farm in Thrace, Greece, using the preference ranking organization method for enrichment of evaluations II (PROMETHEE II) and GIS. The study began with the definition of 18 siting criteria. In the model used, the PROMETHEE II multicriteria analysis method was applied to a sample of 2095 initial locations, comparing the alternative options in pairs with respect to the siting criteria. Finally, GIS maps were produced which illustrate the degree of preference for the areas in which a wind farm can be sited. This method can serve as a strategic planning tool, contributing to the decision-making process for the development of wind facilities and functioning as a guide for siting large-scale wind farms (regional or national).
Moltames et al. [19] applied GIS and AHP to Khuzestan province in Iran. The model uses 14 thematic data layers (technical, environmental, economic) to assess the suitability of the areas, and the approach is based on the use of GIS for the generation of layers, normalization and filtering of the data, and spatial combination processing. The analysis involves multiple criteria, which are combined to obtain a suitability score for each candidate site. The findings indicate that Shadegan city possesses the greatest economic potential, while Khorramshahr city exhibits the maximum technical capacity for electricity generation via wind energy. For different sizes of wind systems (e.g., 550, 2500, 8000 kW), the model shows that the 550 kW unit has the greatest spatial suitability in the area.
Ayalke and Şişman [20] examined the spatial placement of terrestrial wind farms in the Amhara Region of Ethiopia, integrating the best worst method (BWM) with GIS to identify suitable installation areas to serve as valuable resources for future decision-making processes in spatial planning. Initially, eight criteria were defined that determine suitability according to the values they receive. The classification of the areas according to each criterion was depicted on eight GIS maps, respectively. Then, the weights of the criteria were assigned and, based on the BWM, the final map was obtained, determining the degree of suitability for the installation of wind farms in each region of Amhara. The area’s appropriateness for wind farms is assessed on a scale from 0 to 5, categorized as inappropriate, very low, low, moderate, high, and very high potential. The areas with great potential for wind energy production are located in the eastern and western parts of the region.
Vagiona and Alexiou [21] investigated the optimal location of a wind farm on uninhabited islets in the South Aegean Region. First, the exclusion and evaluation criteria (environmental, technical, and economic) were identified. Then, the AHP was used to assign weights to the criteria, and TOPSIS was employed to rank the optimal options for the examined uninhabited islets, using four different scenarios that were developed (baseline, uniform criteria weights, technical/economic oriented scenario, and environmental oriented scenario). In parallel with the analysis of the criteria and the application of the methods, a GIS tool was used to visualize the data.
Seyed Alavi et al. [22] studied the optimal siting options for wind farms among 50 proposed locations in eastern Iran. The 13 evaluation criteria used were divided into 4 categories: environmental, social, technical, and climatic. The weights of each criterion were assigned using the entropy weight method (EWM). The 50 suitable areas for wind farm siting were ranked using 3 different methods: simple additive weighting (SAW), TOPSIS, and elimination and choice translating reality (ELECTRE). The ranking of areas differed based on the method used. According to the TOPSIS and ELECTRE techniques, the Gezi Bojnourd choice is the optimal site, whereas the Neishabour Hesar Yazdan alternative is the least favorable site. Moreover, the Bashirabad Torbatjam choice is the most advantageous location for the SAW approach.
Amsharuk and Łaska [23] presented a methodological framework for the deployment of wind farms in Podlaskie Voivodeship, Poland, using GIS and three MCDM methods; namely, the AHP, Borda, and TOPSIS methods. Eleven criteria and six variants were considered in the analysis. The AHP method was employed to evaluate the criteria weights, and three MCDM techniques were utilized to rank the variants. Variant 6 was the top choice in both the AHP and Borda methods; therefore, it was selected for further spatial analysis. The spatial analysis was performed through QGIS. A total of 704 plots were selected, covering a total area of 32.50 km2. These plots represent approximately 0.16% of the total area in the western, southwestern, and southern regions of Podlaskie Voivodeship.
Badi et al. [24] carried out an integrated assessment to rank five sites within Libya: Derna, Masalata, Misurata, Tripoli, and Tarhuna. Six criteria guided the evaluation, with their importance calibrated through a hybrid of the analytic hierarchy process (AHP) and best worst method (BWM). The final ordering of the five candidate locations was then derived using the measurement alternatives and ranking according to compromise solution (MARCOS) method. Derna emerged as the site for wind farm deployment, with Tarhuna slotted in as the runner-up. To probe the stability of this ordering, a sensitivity analysis was run, drawing on nine distinct MCDM approaches to compare the outcomes.
Yildiz [25] presented a GIS-driven spatial multicriteria decision-making (SMCDM) approach, for scouting viable wind farm locations, in Balıkesir, Turkey. He extracted the importance of nine chosen criteria via an AHP questionnaire and then layered the scored criterion maps to generate a wind farm suitability map. The analysis revealed that 2.34% of the surveyed area fell into the highest suitability bracket, while a further 9.34% was assigned to the next tier. When a sensitivity analysis was conducted with every criterion assigned its weight, it was found that the findings were partly trustworthy.
In his 2024 assessment, Yaman [26] mapped the locations for wind farm deployment around Adana, Turkey, by coupling the analytic hierarchy process (AHP) with GIS. He weighed eleven exclusion constraints against fifteen siting criteria. After calculating the weights, the final map was generated using GIS’s weighted linear combination (WLC) method, which divides the area into five suitability categories. The numbers reveal that in Adana province, approximately 10% of the land is genuinely suitable for wind farm placement, while roughly 51.66% falls into the moderately suitable bracket.
Demir et al. [27] applied fuzzy stepwise weight evaluation ratio analysis (F-SWARA) to assess seventeen wind farm siting criteria, while fuzzy measurement alternatives and ranking by compromise solution (F-MARCOS) was used to select the most appropriate site for wind farm deployment in the province of Sivas, Turkey. GIS was used to form a database of criteria and alternatives, which was transformed into a fuzzy decision matrix. A total of 36.5% of the study area turned out to be highly suitable, and the districts that present the most sites characterized as “highly suitable” were Ulaş, Gürün, and Kangal districts.
The purpose of the present research is to determine the optimal area for an onshore wind farm in Skyros, with the aim of maximizing performance and minimizing the project’s impacts. To achieve this specific objective, the international literature and Greek legislation are considered, the current situation of the study area is analyzed, exclusion criteria are determined, and the available areas are identified. Subsequently, seven assessment criteria are defined; these are related to various sectors, including environmental and economic aspects. Six weighting methods (four subjective and two objective) are applied in combination along with four siting ranking methods, resulting in the creation of 24 ranking models. Their results are correlated through the Spearman coefficient. The multicriteria analysis methods of the weighting stage are the AHP, BWM, rank order centroid (ROC), SIMOS, entropy, and importance of criteria through criterion correlation (CRITIC), whereas the methods of the ranking stage are TOPSIS, VIKOR, elimination and selection translating reality III (ELECTRE III), and the preference ranking organization method for enriching evaluations II (PROMETHEE II). Geographic information systems (GISs) are used as a visualization tool.
Considering the existing literature, the present study aims to address the research questions presented below:
Q1. Does the application of different criteria weighting methods affect the weights of the criteria?
Q2. Does the application of different subjective criteria weighting methods result in different criteria weighting findings?
Q3. Does the application of different objective criteria weighting methods result in different criteria weighting outcomes?
Q4. Does the application of different MCDM methods affect the final ranking of siting areas?
Q5. Which siting area is more suitable than the others?
The main contributions of the present study are summarized as follows: (i) this is the first research to utilize six criteria weighting methods and four alternative ranking methods; (ii) several method combinations, such as ROC-VIKOR, SIMOS-VIKOR, BWM-VIKOR, ROC-ELECTRE III, SIMOS-ELECTRE III, BWM-ELECTRE III, ROC-PROMETHEE II, SIMOS-PROMETHEE II, and BWM-PROMETHEE II, are used for the first time to determine the most suitable onshore wind farm siting areas; (iii) to reduce the subjectivity of subjective methods, objective methods are also employed to assign weights to the criteria, and the results are compared both in terms of the weights of the assessment criteria and the rankings of the suitable siting areas. Therefore, beyond a simple GIS–MCDM wind farm siting application, this study contributes to the systematic comparison of criteria weighting methods (objective and subjective) with four MCDM ranking methods, thus comparing 24 distinct ranking models applied to a specific renewable energy spatial decision-making problem. The use of Spearman’s rank correlation coefficient contributes to quantitative insight into the consistency, divergence, and influence of subjective versus objective weighting approaches in onshore wind farm siting. The comparative framework used in the analysis enhances transparent and robust early-stage spatial planning decisions.
2. Materials and Methods
The proposed methodological framework is applied to identify the most suitable areas for wind farm deployment considering several criteria. The first step of the methodology (Figure 1) involves identifying the exclusion and assessment criteria based on the legislative framework and the international literature. Using GIS and applying the exclusion criteria, suitable locations for siting a wind farm in the study area are identified. Additionally, GIS contributes to the creation of the assessment matrix, as it is used as a tool to measure the values of the assessment criteria in each suitable siting area.
Figure 1.
Proposed methodological framework.
Figure 1 presents the six criteria weighting methods and the four MCDM methods used in the analysis. Criteria weighting is a necessary process in decision-making, as the assessment criteria in most cases differ in importance and often conflict. To investigate how assessment criteria weighting methods influence results, six methods are applied: four subjective (AHP, BWM, ROC, SIMOS) and two objective (entropy, CRITIC).
After this step, MCDM ranking methods are employed to incorporate the weighted assessment criteria and generate suitable area rankings. The four MCDM ranking methods used are TOPSIS, VIKOR, ELECTRE III, and PROMETHEE II.
The criteria weighting methods were selected to ensure widespread acceptance in the wind energy siting literature (e.g., AHP, BWM, CRITIC), as well as methodological diversity, including both subjective approaches, which depend on expert judgment, and objective approaches, which rely solely on raw data. The four selected ranking MCDM methods represent the most common MCDM methods that use different computation processes: compromise (TOPSIS), compromise programming (VIKOR), outranking with veto thresholds (ELECTRE III), and preference flows (PROMETHEE II). They are comparatively use with the aim of explaining how different decision processes might influence spatial suitability rankings.
The integration of different criteria weighting methods with MCDM ranking methods resulted in 24 final ranking models (Figure 2), with which the most suitable areas were selected. The results of Step 2 and Step 3 are compared using Spearman’s rank correlation coefficient.
Figure 2.
Final site ranking models.
2.1. Study Area
Skyros is located at the center of the Aegean Sea (Figure 3) and is the southernmost and largest island of the Northern Sporades, with a total area of 210 km2 [28]. It is a part of Central Greece and, more specifically, of the regional unit of Euboea. The administrative area of the municipality of Skyros coincides with the geographical unit of the island of Skyros. It has a high relief, mostly in the southern part of the island, due to its mountainous character, and it consists of nineteen settlements [29].
Figure 3.
Definition of (a) the study area and (b) altitude.
2.2. Exclusion Criteria
In this step, the exclusion criteria (ECs) and their incompatibility zones derived from either the Specific Framework for Spatial Planning and Sustainable Development for Renewable Energy Sources (SFSPSD RES) [30] or the scientific international literature are identified (Table 1). The purpose of these exclusion criteria is to exclude areas that are unsuitable for wind farm deployment due to various factors. The 16 exclusion criteria, covering a wide range of factors, are divided into 6 broad categories: natural and environmental areas of interest; cultural and historical heritage areas; residential networks; technical infrastructure and networks; land uses; and geomorphology and wind potential.
Table 1.
Exclusion criteria and incompatibility zones.
2.3. Assessment Criteria
The selection of assessment criteria is based on each researcher’s subjective perception. The goal of this study is to determine the most suitable sites for a wind farm while minimizing social, environmental, and economic impacts and maximizing the project’s efficiency. Therefore, seven assessment criteria are used (Table 2). The assessment criteria are carefully balanced between cost criteria (where lower values are preferred) and benefit criteria (where higher values are selected). It should be noted that the limited number of assessment criteria is a deliberate methodological choice. A significant portion of the environmental, spatial, economic, and institutional criteria is applied during the exclusion stage in accordance with the national legal framework of SFSPSD RES. The assessment criteria focus on key criteria systematically found in the international literature to ensure that the modeling conducted in the present study includes the most important siting factors (e.g., wind velocity, distance from road network, distance from electricity network) in the decision-making process and concentrate on technical, economic, environmental, and social parameters, as well as essential criteria based on the characteristics of the study area (e.g., distance from cultural heritage areas).
Table 2.
Assessment criteria.
2.3.1. Technical/Financial Criteria
C1—slope: the slope is closely related to the region’s geomorphology and significantly impacts the project’s construction and maintenance costs. A high slope percentage makes access to the project challenging, leading to higher construction and maintenance costs [37,38].
C2—wind velocity: the financial impacts decrease when choosing an area with high wind velocity because the produced energy is higher [39].
2.3.2. Financial Criteria
C3—distance from road network: roads provide access to the project for construction and maintenance. The closer the wind farm is to the road network, the smaller the distance to reach it. This means there is not a strong need to construct a new road, and human interventions in the environment are less pronounced [40,41].
C4—distance from electricity network: the proximity of the wind farm to the island’s electricity grid significantly reduces the project’s costs, as it ensures a connection to the existing lines without the need to construct new roads or power lines [39]. Additionally, the shorter the distance between the wind turbine and the power supply network, the lower the electrical energy loss [38].
2.3.3. Environmental Criteria
C5—distance from protected areas: the distance of the wind farm from protected areas helps retain natural environmental elements and ecosystems and preserve biodiversity [38].
2.3.4. Social Criteria
C6—distance from settlements: the distance of available areas for the wind farm from urban settlements is one of the social criteria that was determined to consider the effects of such a project on the island’s inhabitants. Wind turbines cause visual and acoustic disturbances in the surrounding area, leading to adverse social reactions [38].
C7—distance from cultural heritage areas: the selection of this criterion aims to protect areas with distinct historical and archeological characteristics [42], which fosters greater connection between people and culture and, potentially, the development of tourism.
2.4. Criteria Weighting Methods
The selected criteria often contradict each other and combine various factors, making it challenging to prioritize them in terms of importance. Therefore, using the methods defined in Step 2 in combination yields a ranking of the criteria that considers both objective data and subjective factors. This aids in studying their correlation and determining the ideal criteria weights. The criteria weighting methods applied in this step are AHP, BWM, ROC, and SIMOS (subjective methods) and EWM and CRITIC (objective methods).
2.4.1. Subjective Methods
- AHP (analytic hierarchy process)
For the pairwise comparison of the criteria in AHP, the following decision matrix is created: (A) , where is equal to the number of assessment criteria [43]. For each element of the decision matrix Α, the following should be true: > 0, = 1 [8].
Each researcher is called upon to assign the respective values using Saaty’s fundamental scale (1–9) to prioritize the criteria by importance. In Table 3, the scores of the numerical values of the Saaty scale are presented [44].
Table 3.
Importance of values based on the Saaty scale.
Then, every element of matrix A is divided by the sum of its respective column to obtain a new matrix, which is the normalization of the matrix. Therefore, the average of each row of the new matrix is calculated to assign weights to each criterion. The sum of the weights must be equal to 1.
One advantage of AHP is its ability to perform consistency checks, confirming the accuracy of the results. For this reason, the consistency ratio CI is calculated for the resulting weights using the equation:
where is the number of criteria.
The consistency ratio is calculated using the following equation:
where is the random index.
- BWM (best worst method)
According to Kumar and Ratandhara [45] and to Rezaei [46], assigning weights to criteria through the BWM is a five-step process.
- The assessment criteria are defined.
- The decision-maker (DM) determines the best and the worst criteria, and , respectively.
- At this point, a comparison is made, and the degree of preference for the best criterion over the other criteria is determined. The preferred values or pairwise comparison values are assigned using Saaty’s scale (1–9). This results in an order of the matrix as follows:where is the degree of preference of over , and .
- A comparison is made, and the degree of preference of the criteria is determined in relation to the worst criterion , using Saaty’s scale (1–9) as in the previous step. Thus, the column of the matrix is obtained:where is the degree of preference of over , and .
- The optimal weights are calculated for each criterion. To achieve this, a solution in which deviations between the weights and the DM’s preferences are as minor as possible must be found. The goal is to minimize the maximum absolute differences and for each criterion . Therefore, the optimal weight for each pair and , is defined as the one where the following apply for each :
To do this, we need to solve for , such that:
Finally, to check the accuracy of the resulting weights, Rezaei [46] developed the consistency index and the consistency ratio . Consistency decreases when is lower or higher than ; otherwise, , and the highest inequality occurs when and have the maximum value, which will result in . In addition, , and given the highest inequality as a result of assigning the maximum value by and , is a value that should be subtracted from and and added to as follows: . For the minimum consistency = = , we have . Solving for different values of [47], the maximum possible and these values are used as the consistency index (CI).
The consistency ratio (CR) is calculated using the formula:
- ROC (rank-order centroid)
The ROC is used to calculate criteria weights by determining the centroids of all possible weights and maintaining the ranking based on objective importance. In this way, the maximum error of each weight is reduced to a minimum [47]. The calculation of the weights is carried out after the criteria have been ranked by the DM based on importance, according to the following equation:
where the weight of criterion , and is the set of criteria.
- SIMOS
The steps followed for the ranking of the criteria are the following [6,48]:
- The decision-maker ranks the criteria (cards) in ascending order, starting from what they consider less essential and ending with the most important. In the case that two or more criteria are equally important, a subset that contains the equal criteria is created.
- The decision-maker defines the weights of the criteria (cards). To carry this out, white cards are used. The following are assumed:
- When there is no white card between two consecutive criteria (or subsets of criteria), the difference between their weights is equal to .
- When one white card is placed, the difference is equal to .
- When two white cards are placed, the difference is equal to , and so on.
Then, the ranking created according to the steps detailed above is used to determine the criterion weights using the SIMOS method. Specifically, the procedure is as follows:
Let us say a family of 12 criteria is provided. Table 4 presents how the DM has ranked the criteria or groups of criteria by importance. The criteria are converted according to the following steps [48].
Table 4.
Criteria cards ranking based on the DM.
- The criteria or their groups are ranked from least to most important based on the white cards.
- Each criterion must be assigned a position or, according to Simos, a weight. Therefore, criterion assumes position 1, assumes position 2, assumes position 3, and so on.
- The non-normalized weight (or average weight according to Simos) of each ranking is calculated. To achieve this, the sum of the positions of all criteria in a specific ranking is divided by the sum of the criteria in that ranking. For example, the non-normalized weight for ranking 1 is (1 + 2 + 3)/3 = 2, while the non-normalized weight for ranking 2 is 4/1 = 4.
- The normalized weight (or relative weight according to Simos) of each criterion is calculated by dividing the non-normalized weight of its ranking by the sum of positions of all criteria excluding white cards. As the result should be an integer, weight criterion γ and δ, respectively, are equal to 2 × 100/(1 + 2 + 3 + 4 + 6 + 7 + 8 + 9 + 10 + 11 + 12 + 13) = 200/86 ≈ 2 and 4 × 100/(1 + 2 + 3 + 4 + 6 + 7 + 8 + 9 + 10 + 11 + 12 + 13) = 400/86 = 4.65 ≈ 5.
2.4.2. Objective Methods
- EWM (entropy weight method)
The following steps are used to weight the criteria [22,49]:
To begin the process, an assessment matrix must be formed, where is the set of alternatives (which, in this research, is the suitable sites for wind farm siting in the study area) and is the set of assessment criteria.
- The values of alternative are normalized with criterion (), following the equation:where is the value of the specific element in matrix .
- The entropy is calculated based on the formula:where and criteria.
- The criteria weights are assigned according to the equation:where is the degree of uncertainty.
- CRITIC (criteria importance through intercriteria correlation)
CRITIC is an objective MCDM, in which the weights of each criterion are calculated according to the contrast and differing intensity that they exhibit between them [50]. According to Žižović et al. [51] and Hassan et al. [52], the steps followed to determine the weights are as follows:
- An decision matrix is created, where is the set of alternatives, is the set of assessment criteria, and is the value of alternative with respect to criterion .
- The matrix is normalized by applying the corresponding equations. For the benefit criteria, where the higher value is more preferable, the following equation is used:
For the cost criteria, where the lowest values are preferred, the equation used is as follows:
where are the alternative positions, are the criteria, , and . This results in the normalized matrix .
- 3.
- The standard deviation of each criterion is calculated. is the average score of criterion , and is the set of alternatives [6].
- 4.
- An matrix is created, the elements of which constitute the linear correlation coefficients between and .
- 5.
- The information measures for each criterion are calculated.
- 6.
- The weights of the criteria are determined. This method assigns greater weights to criteria with high standard deviation and low correlation with other criteria.
2.5. Ranking Methods
Step 3 of the methodology includes the assessment of alternative sites. Therefore, the four MCDM ranking methods (TOPSIS, VIKOR, ELECTRE III, and PROMETHEE II; as described below) are used, and their results are compared.
- TOPSIS (technique for order of preference by similarity to ideal solution)
The steps of TOPSIS method are provided as follows [43,53,54]:
- An decision matrix is created, where is the set of alternatives, is the set of assessment criteria, and is the value of alternative with respect to the criterion .
- The elements of the matrix are normalized in order to obtain a new normalized matrix and compare the different criteria types.where denote the alternatives, and denote the criteria.
- The weighted normalized decision matrix is calculated based on the equation:where is an element of , and is the weight of criterion .
- The positive ideal solution (PIS; ) and negative ideal solution (NIS; ) are determined as follows, where is related to benefit criteria, and is related to cost criteria.
- The separation distance between alternative and the PIS or NIS is measured by the Euclidean distance as follows:
- The alternative’s relative closeness to the PIS is calculated using the following equation. The greater the value, the more preferable the alternative site:where .
- VIKOR (VIekriterijumsko KOmpromisno Rangiranje)
VIKOR uses the following steps to rank the alternatives [55,56,57]:
- Positive and negative ideal solutions are measured (και , respectively) for each assessment criterion.
- The and values are calculated. is defined as the distance from alternative to the PIS, and is defined as the distance from alternative to the NIS.where is the weight of criteria .
- The value is measured. In the next equation, the following hold: , , , , is the weight of the strategy of “the majority of criteria”, and The weight of the strategy is assigned values from 0 to 1, and is usually set as 0.5.
- The alternatives are ranked based on the values. Thus, three ranking lists are constructed. The optimal alternative solution is the one where is true.
- ELECTRE III (elimination and choice translating reality III)
Ranking of the alternative areas is achieved using the following methodology [58,59]. The first three steps are identical to the TOPSIS method (Equations (22) and (23)). Then, four more steps are applied:
- The concordance and discordance sets are defined for each pair of alternatives. In this step, the examined alternatives are compared to each other based on the criteria, and the best or worst is determined to obtain the final and .
- The corresponding concordance and discordance matrices are constructed.
The matrix is and non-symmetric, and the concordance sets are taken into consideration in its construction. The concordance index equals the sum of the criteria weights related to each set, which expresses the relative importance of the alternative in relation to the alternative . The element where is true has no value. The remaining elements are calculated based on the following equation:
where denote the criteria, and .
The matrix is and non-symmetric. Element where is true have no value. Additionally, the higher the value, the less preferable the alternative is in relation to . This step focuses on the assumption that one alternative is worse than another, and each element is measured based on the equation:
where denote the criteria, and .
- 3.
- The concordance dominance and discordance dominance matrices are determined. The matrix is obtained through comparison of the concordance threshold with the elements of , wherewhere is the number of decision points.
The elements of matrix are assigned the following values. A value of 1 means that outweighs .
The matrix is obtained from the comparison of the concordance threshold with the elements of , where
where is the number of decision points.
The elements of are assigned the following values.
- 4.
- The aggregate dominance matrix is then constructed. It is , based on the matrices and , and its elements are assigned values of 0 or 1, following the formula:
The last step involves determination of the importance of the alternatives, where the matrix appears in the following form. Analyzing the matrix, it is indicated that . This means that alternative 1 is preferred to alternatives 2 and 3, and alternative 3 is preferred to alternative 2. Thus, the order of importance will be
- PROMETHEE II (preference ranking organization method for enrichment of evaluations ΙΙ)
The process of ranking the alternatives using the PROMETHEE II method is provided as follows [60,61]:
The preference function is determined to express the outcome of the comparison between alternatives , where is a finite set of possible alternatives. is a monotonically increasing function of the observed deviation between and .
where .
Six preference functions are proposed to facilitate its selection. The decision-maker is called to choose the function that will be used, and no more than two parameters (, or thresholds) have to be determined. The preference function of the standard criterion is frequently used, as it does not include extra parameters such as the preference and indifference thresholds that are necessary for other kinds of preference functions.
In the next step, a preference index , which shows the preference of alternative over , is calculated following the formula:
where is the criteria weight.
The leaving and entering flows—denoted as and —respectively, are calculated using the following equations. indicates the degree to which alternative outranks the rest, while shows the degree that the remaining alternatives outweigh .
Finally, the net flow of alternative is set as the difference between the leaving and entering flows. The higher the value of , the more preferable the alternative is considered to be.
2.6. Spearman’s Rank Correlation Coefficients
After the weighting of criteria is completed, Spearman’s correlation coefficient () is used to compare the results from each MCDM. The same procedure is followed to rank the alternative areas for wind farm installation. In this way, an integrated analysis is conducted that contributes to the decision-making process.
Spearman’s rank correlation coefficient () takes values between [−1, +1], where values close to +1 indicate a strong positive relationship, values close to −1 indicate a strong negative relationship, and values close to 0 indicate weak or no correlation in the compared rankings. The equation used to calculate this coefficient in Steps 2 and 3, respectively, is as follows [62]:
where is the number of criteria or alternative sites, and is the difference between the ranking of the methods examined.
3. Results
This section analyzes the results of the methodological framework employed and applied. ArcGIS Pro 3.0.2 was used to visualize the exclusion areas for wind farm siting, as well as the available areas and their ranking resulting from the application of different criteria weighting and MCDM ranking methods.
3.1. Exclusion Areas
For the creation of the thematic maps depicting the exclusion criteria, data from the following sources were used: GEODATA, Global Wind Atlas, RAE, USGS Earth Explorer, Ministry of Environment and Energy/Estia, National Archive of Monuments, European Environment Agency, Copernicus Land, ArcGIS Online [63,64,65,66,67,68,69,70,71]. An essential prerequisite for wind farm siting is the exclusion of areas that have any status and have made any decision regarding the installation of RES. Therefore, the corresponding areas in the municipality of Skyros with either production licenses or rejection decisions were further excluded from the analysis. Figure 4 presents six thematic maps, regarding: (a) areas of natural and environmental interest, (b) technical infrastructure and networks, (c) land uses, (d) settlements, (e) slopes, and (f) production licenses or rejection decision areas.
Figure 4.
Exclusion zones around (a) areas of natural and environmental interest, (b) technical infrastructure and networks, (c) land uses, (d) settlements, (e) slopes, and (f) production licenses or rejection decision areas.
After applying the exclusion criteria and their corresponding incompatible zones, 20 suitable areas for wind farm siting emerged, occupying a total area of 4 km2 and ranging in surface area from 0.007 km2 to 0.847 km2.
The selection of the final suitable areas for assessment in this study was based on the number of wind turbines that can be installed within each area, ensuring the project is considered viable. Specifically, the areas deemed suitable are those where at least four Vestas V90 (2 MW) wind turbines with a rotor diameter of 90 m can be installed. Following the guidelines of Appendix II of the SFSPSD RES [30], the minimum distance between turbines is 2.5 times the rotor diameter (i.e., 2.5 d). Therefore, in this case, the minimum distance was 225 m. Applying these data to each available area within the municipality of Skyros resulted in eleven suitable sites (Figure 5); their surface area and the number of turbines that can be installed at each site are recorded in Table 5.
Figure 5.
Suitable sites for wind farm siting in the study area.
Table 5.
Surface area and number of turbines of suitable sites for wind farm siting in the study area.
3.2. Assessment of Suitable Areas
The assessment of the selected areas in terms of their suitability for the siting of wind farms was divided into two stages. Initially, a weighting was assigned to the assessment criteria by applying the six criteria weighting methods (AHP, BWM, ROC, SIMOS, CRITIC, entropy). Then, the ranking of the areas for assessment followed, which was carried out using each of the four MCDM methods (TOPSIS, VIKOR, ELECTRE III, PROMETHEE II) in combination with the weights calculated from the six criteria weighting methods. As a result, 24 different models for ranking the available areas were generated.
3.2.1. Criteria Weighting Method
The criteria weighting methods used at this stage were AHP, BWM, ROC, and SIMOS (subjective) and EWM and entropy (objective). Each method assigns its own weight to the assessment criteria and subsequently examines the correlation of its results using the Spearman coefficient. The results of the assessment criteria weighting methods used are summarized in Table 6.
Table 6.
Assessment criteria weights using four subjective (AHP, BWM, ROC, SIMOS) and two objective (entropy, CRITIC) weighting methods.
The subjective methods yielded the same ranking of the criteria, with no significant deviation in the values assigned to each. This is due to the incorporation of the researcher’s subjective perception and judgment into all methods. The most important criterion is the wind velocity. The AHP, BWM, and SIMOS assigned weights of 0.351, 0.344, and 0.250, respectively, while ROC produced the highest value, at 0.370. Conversely, the least important criterion is the distance from cultural heritage sites, for which AHP, ROC, and SIMOS assigned weights of 0.020, while BWM assigned a weight of 0.037. The entropy and the CRITIC method determine the objective weights of the assessment criteria without the decision-maker’s direct involvement. In the entropy method, the assessment criteria weights depend on the degree of dispersion and, therefore, the variability in values within each criterion, whereas in the CRITIC method, the assessment criteria weights are determined considering both the standard deviation of each criterion and the correlation between criteria. In the current research, for the entropy method, wind velocity (C2) presents low variability in values among suitable areas (A1–A11) and receives low assessment criterion weight, whereas distance to road network (C3) and distance from cultural heritage sites (C7) present high variability, resulting in a high assessment criterion weight. Regarding the CRITIC method, the combined effect of variability and intercriteria correlation leads to similar weights for C2, C3, and C7.
The calculation of the Spearman coefficient contributes to the investigation of the correlation between the weighting performance methods and the way that they rank the criteria. Specifically, the closer the coefficient value is to 1, the greater the relevance of the multicriteria methods being compared. Additionally, the p-value indicates the level of significance of the methods being compared, with the correlation considered statistically significant when the values are <0.05 and statistically not significant when they are ≥0.05.
The conclusion drawn from Table 7 is that the criteria weighting methods AHP, BWM, ROC, and SIMOS exhibit an absolute correlation among themselves, meaning that they assign weights to the assessment criteria in a consistent manner. This is explained by the Spearman correlation coefficient being equal to 1 and the p-value being less than 0.01 in the binary comparisons conducted.
Table 7.
Spearman correlation coefficient and significance level (in terms of p-value) comparing the ranking of assessment criteria weights.
On the other hand, the CRITIC method exhibited a moderate correlation with all subjective methods. In contrast, entropy showed either high (compared to AHP, BWM, ROC, SIMOS) or low (compared to CRITIC) negative correlations with the other methods, indicating an inverse ranking tendency and, therefore, proving that there are fundamental differences between data-driven and expert-based weighting methodologies.
The absolute correlation between the AHP, BWM, ROC, and SIMOS methods stems from the fact that they are all subjective multicriteria methods, with the ranking of criteria based on the researcher’s opinion and judgment, which remains constant across all cases. At the same time, the objective method that most closely resembles the subjective ones in terms of how weights are assigned was CRITIC; however, it did not show a statistically significant correlation with any of them, as the p-values were all greater than 0.05.
3.2.2. Prioritization of Suitable Areas
After assessment of the importance of the criteria by each criteria weighting method separately, the 11 suitable areas were compared with each other across the 7 assessment criteria to determine their final ranking based on suitability for wind farm siting. The assessment matrix is presented in Table 8. The data for the assessment criteria were drawn from the following sources: GEODATA, Global Wind Atlas, RAE, USGS Earth Explorer, Ministry of Environment and Energy/Estia, National Archive of Monuments, European Environment Agency, Copernicus Land, ArcGIS Online [63,64,65,66,67,68,69,70,71].
Table 8.
Assessment matrix.
At this stage, the four MCDM methods were applied six times, using the different weights derived from the six criteria weighting methods. Therefore, a total of 24 final rankings of the suitable areas were produced.
The application of different MCDM methods to rank suitable areas using weights derived from various criteria weighting methods led to different hierarchies. In Figure 6, the rankings from the 24 models are compiled to facilitate the selection of the optimal wind farm location, including all the results.
Figure 6.
Ranking of the alternatives based on the 24 models derived from the combination of the 6 assessment criteria weighting methods and the 4 MCDM ranking methods.
As observed, in all four MCDM methods, the rankings showed consistency between AHP, BWM, ROC, and SIMOS. Conversely, entropy and CRITIC differed in their rankings, both among themselves and compared to the others. This is due to the fact that AHP, BWM, ROC, and SIMOS exhibit an absolute correlation as they are subjective weighting methods and, therefore, the evaluation criteria received similar weights.
In general, fluctuations were observed regarding the rankings. VIKOR and PROMETHEE II appeared to produce similar results in certain cases, such as in the prioritization with the weights of ROC. Considering the weights of entropy and CRITIC, the greatest divergence between the ranking methods was observed, as these are objective methods.
The area that was considered the most suitable was A9 (based on nine models), while the areas that were least suitable were A5 and A11 (each based on nine models).
According to VIKOR, PROMETHEE II, and ELECTRE III, in combination with the majority of the criteria weighting methods, areas A9 and A11—located in the central and southern parts of the island, respectively—were the top two choices. Conversely, A5 and A10—which are situated in the center of the island and in close proximity to each other—were ranked last. TOPSIS designated A9 as the optimal location for wind farm deployment, and A5 and A11 as the worst.
It should be noted that no parametric sensitivity analysis was performed in the present research. However, the reliability of the results was examined through the systematic comparison of 24 different weighting and MCDM ranking method combinations, allowing for investigation of stability or fluctuations in suitable area rankings under different assessment criteria weights.
For a more extensive investigation of the relationships between the ranking methods, the Spearman coefficients were calculated. As shown in Table 9, very high correlations were observed between pairs of methods with values greater than 0.7, such as VIKOR and PROMETHEE III, using the weights of ROC. On the other hand, very low correlations, indicating a clear differentiation in ranking, were observed for the combinations of methods where the Spearman coefficient values are less than 0.3; namely, TOPSIS-VIKOR and TOPSIS-ELECTRE III with the weights of SIMOS.
Table 9.
Spearman’s rank correlation coefficient matrix of ranking methods using AHP, BWM, ROC, SIMOS, entropy, and CRITIC weights.
Additionally, it was observed that all ranking methods using entropy weights exhibited very high correlations with each other.
4. Conclusions
The study conducted within the proposed framework facilitated the selection of an optimal area for onshore wind farm deployment on the island of Skyros through the combined use of multicriteria analysis methods and geographic information systems (GISs), which serve as a mapping tool.
Climate change has been worsening rapidly and its impacts are becoming increasingly noticeable, both globally and nationally. Harnessing wind energy potential for electricity generation is considered one of the most effective ways to contribute to mitigating the phenomenon and to shift towards the use of green energy, promoting the adoption of environmentally friendly practices.
For this reason, there is a steady upward trend in the exploitation of wind energy, with the capacity derived from the operation of wind turbines reaching 1.017 GW worldwide in 2023. Like most human interventions, however, wind farms also have certain impacts on the natural environment, as well as on the socio-economic sector. Therefore, to reduce the negative effects associated with these projects and maximize their efficiency, it is considered essential to use multicriteria analysis methods to select the most suitable available area.
By integrating criteria identified in the international literature and documented in the SFSPSD-RES [30] with the current state of the study area, the most significant criteria for deploying wind farms were selected along with those that exclude their siting. Thus, 20 available areas emerged, of which 11 were ultimately considered as areas for evaluation, due to the requirement that at least four Vestas V90-2 MW wind turbines (the minimum number set for the project to be considered efficient) can be installed within their extent, based on the technical specifications for the minimum distance of the environmental impact assessment for RES and the type of wind turbines chosen. As illustrated with the help of the GIS, the final positions for evaluation were mostly located in the central to northern part of the island of Skyros and are in close proximity to each other, except for one, which was situated in the southern part.
The seven assessment criteria selected were as follows: slope, wind velocity, distance from the road network, electricity network, protected areas, settlements, and cultural heritage sites. The multifaceted nature of the issue, as well as the differing nature of the criteria, makes wind farm siting a complex problem and led to the combined use of different multicriteria analysis methods in the weighting stage, as well as in the final ranking of the locations, resulting in 24 ranking models. The objectives were to minimize the disadvantages and exploit the advantages of each method, as well as to explore the different outcomes.
In the assessment criteria weighting stage, six multicriteria analysis methods were applied, of which AHP, BWM, ROC, and SIMOS are subjective methods, while entropy and CRITIC are objective. The analysis of the results using Spearman correlation coefficients indicated that the subjective methods exhibited perfect correlations with each other, indicating that they assign weights to the assessment criteria in the same way; this is due to the incorporation of the researcher’s personal opinion, and remained consistent across all cases. On the other hand, the CRITIC method showed moderate correlations with all subjective methods, while entropy showed strong negative correlations with all subjective methods and a low negative correlation with the other objective method. Subsequently, for the final ranking of the suitability of the areas, four multicriteria methods were used—TOPSIS, VIKOR, PROMETHEE II, and ELECTRE III—each applied six times with the different weights derived from the different criteria weighting methods. According to the Spearman coefficients, the ranking methods with the highest correlations were PROMETHEE II and ELECTRE III, while those with the lowest were TOPSIS and VIKOR. The TOPSIS and VIKOR methods are quite similar regarding their methodology, as they are based on an aggregating function that represents closeness to the ideal solution (distance measurements). Although they rank the alternatives based on their proximity to ideal and non-ideal solutions, they yield different results: TOPSIS selects the alternative closest to the ideal solution and furthest from the non-ideal solution, whereas VIKOR determines a “compromise solution.” Additionally, the differences in the results are due to the different methods used to normalize the assessment matrix: TOPSIS uses vector normalization, while VIKOR uses linear normalization. On the other hand, the strong correlation between PROMETHEE II and ELECTRE III is due to the fact that they are both compensatory methods that belong to the group of outranking methods, in which the computations are based on pairwise dominance and not on absolute distances (as in TOPSIS and VIKOR). Suitable sites are compared in a pairwise manner based on each assessment criterion, providing rankings that show a strong correlation.
Furthermore, the rankings showed consistency across results using the weights from AHP, BWM, ROC, and SIMOS. Conversely, with the weights from entropy and CRITIC, the areas differed in their rankings both among themselves and compared to the others. The majority of the combinations identified area A9—located in the central to northern part of the island—as the most consistently high-ranking potential area, providing a prioritized alternative for early-stage spatial planning and further detailed investigation (e.g., production license, micro-siting, environmental impact assessment approval, installation license, grid connection). The results of the present study could support strategic early-stage decision-making, which should be followed by detailed wind resource analysis, analysis of grid capacity constraints, environmental impact assessment studies, and stakeholder engagement processes. Finally, based on the preceding analysis, this work recommends incorporating subjective multicriteria analysis methods when researchers are experts in the field, as the results align with the decision-maker’s opinion. Conversely, when the researchers are not specialized in multicriteria decision-making, the use of objective multicriteria analysis methods is advised, as their results are derived from the values of the assessment matrix. It should be noted that the proposed methodology is applied under the constraints of the Greek Spatial Planning and Sustainable Development for Renewable Energy Sources (SFSPSD RES), ensuring that all assessed areas are legally compliant and meet a minimum project viability threshold. Therefore, the proposed GIS–MCDM framework should be considered as a strategic, early-stage spatial planning and screening tool that can support planners and decision-makers, aiming to identify and comparatively assess suitable areas for wind farm siting, and not as a substitute for developer-led project feasibility assessment.
Author Contributions
Conceptualization, D.T. and D.G.V.; methodology, D.T. and D.G.V.; software, D.T.; formal analysis, D.T.; investigation, D.T.; data curation, D.T.; writing—original draft preparation, D.T. and D.G.V.; writing—review and editing, D.T. and D.G.V.; visualization, D.T.; supervision, D.G.V. All authors have read and agreed to the published version of the manuscript.
Funding
This research received no external funding.
Institutional Review Board Statement
Not applicable.
Informed Consent Statement
Not applicable.
Data Availability Statement
Τhe data presented in this study are available on request from the authors due to privacy considerations.
Conflicts of Interest
The authors declare no conflicts of interest.
Abbreviations
The following abbreviations are used in this manuscript:
| AHP | Analytic hierarchy process |
| BWM | Best worst method |
| CI | Consistency index |
| CR | Consistency ratio |
| CRITIC | Criteria importance through intercriteria correlation |
| DM | Decision-maker |
| ECs | Exclusion criteria |
| ELECTRE | Elimination and choice translating reality |
| EWM | Entropy weight method |
| F-MARCOS | Fuzzy measurement alternatives and ranking by compromise solution |
| F-SWARA | Fuzzy stepwise weight evaluation ratio analysis |
| GIS | Geographic information system |
| IAHP | Interval analytic hierarchy process |
| MARCOS | Measurement alternatives and ranking according to compromise solution |
| MCDM | Multicriteria decision-making |
| NIS | Negative ideal solution |
| OWFs | Onshore wind farms |
| PIS | Positive ideal solution |
| PROMETHEE II | Preference ranking organization method for enrichment of evaluations ΙΙ |
| RI | Random index |
| ROC | Rank order centroid |
| SAW | Simple additive weighting |
| SFSPSD RES | Spatial Planning and Sustainable Development for Renewable Energy Sources |
| SMCDM | Spatial multicriteria decision-making |
| TOPSIS | Technique for order of preference by similarity to ideal solution |
| VIKOR | VIekriterijumsko KOmpromisno Rangiranje |
| WLC | Weighted linear combination |
| Symbol | Description |
| Pairwise comparison matrix in AHP | |
| Number of assessment criteria in subjective criteria weighting methods | |
| Element of pairwise comparison matrix representing importance of criterion over | |
| Maximal eigenvalue | |
| Best criterion in BWM | |
| Worst criterion in BWM | |
| Best-to-others vector in BWM | |
| The preference of the best criterion over criterion in BWM | |
| Others-to-worst vector in BWM | |
| The preference of the criterion over the worst criterion | |
| Weight of best criterion in BWM | |
| Weight of criterion | |
| Weight of worst criterion in BWM | |
| Consistency (deviation) parameter in BWM | |
| Difference between criteria weights in SIMOS | |
| Family of criteria in SIMOS | |
| Matrix of alternatives and assessment criteria | |
| Normalized values of alternative with criterion in EWM | |
| The value of alternative with respect to criterion in the matrix | |
| Entropy value | |
| A normalization constant for scaling entropy values within the interval 0–1 | |
| Decision matrix () | |
| The normalized value of alternative with respect to criterion in the CRITIC method | |
| Maximum value of criterion across all alternatives | |
| Minimum value of criterion across all alternatives | |
| Standard deviation of normalized values of criterion | |
| Average of the normalized values of criterion across all alternatives in the CRITIC method | |
| Intercriteria correlation symmetric matrix () in the CRITIC method | |
| Correlation coefficient between criterion and criterion in the CRITIC method | |
| Information content of criterion in the CRITIC method | |
| Information content of criterion in the CRITIC method | |
| Normalized value of alternative with respect to criterion in the TOPSIS method | |
| Weighted normalized value of alternative with respect to criterion in the TOPSIS method | |
| Positive ideal solution | |
| Negative ideal solution | |
| Euclidean distance of alternative from the positive ideal solution | |
| Euclidean distance of alternative from the negative ideal solution | |
| Relative closeness coefficient of alternative to the ideal solution | |
| Ideal value of criterion among all alternatives in the VIKOR method | |
| Non-ideal value of criterion among all alternatives in the VIKOR method | |
| Performance value of alternative for criterion in the VIKOR method | |
| VIKOR compromise ranking index of alternative | |
| Group utility measure of alternative | |
| Individual regret measure of alternative | |
| Maximum (worst) value of the group utility measure among all alternatives in the VIKOR method | |
| Minimum (best) value of the group utility measure among all alternatives in the VIKOR method | |
| Maximum (worst) value of the individual regret measure among all alternatives in the VIKOR method | |
| Minimum (best) value of the individual regret measure among all alternatives in the VIKOR method | |
| Weight of the strategy of the majority of the criteria (usually 0.5) | |
| Concordance set containing the criteria for which alternative is at least as good as | |
| Discordance set containing the criteria for which alternative is worse than | |
| Veto threshold on criterion relative to alternative | |
| Veto threshold directly indexed by the pair of alternatives | |
| Concordance matrix | |
| Disconcordance matrix | |
| Partial concordance index for criterion when comparing two alternatives | |
| Partial discordance index for criterion when comparing two alternatives | |
| Alternatives under comparison | |
| Alternatives under comparison | |
| Concordance dominance matrix, derived from comparing with | |
| Discordance dominance matrix, derived from comparing with | |
| Concordance threshold, defined as the average of all values | |
| Discordance threshold, defined as the average of all values | |
| Element of matrix | |
| Element of matrix | |
| Element of matrix | |
| Aggregate dominance matrix | |
| Monotonically increasing function of the observed deviation | |
| Observed deviation between | |
| Preference degree of alternative over | |
| Indifference threshold | |
| Preference threshold | |
| Scale parameter | |
| Global (aggregated) preference index of over | |
| Preference of over with respect to criterion | |
| Positive (leaving) flow of | |
| Negative (entering) flow of | |
| Net flow of | |
| Spearman’s rank correlation coefficient | |
| The difference between the ranking of the methods examined |
References
- Gao, C.; Na, H.; Song, K.; Dyer, N.; Tian, F.; Xu, Q.; Xing, Y. Environmental Impact Analysis of Power Generation from Biomass and Wind Farms in Different Locations. Renew. Sustain. Energy Rev. 2019, 102, 307–317. [Google Scholar] [CrossRef] [Scilit]
- Dai, K.; Bergot, A.; Liang, C.; Xiang, W.-N.; Huang, Z. Environmental Issues Associated with Wind Energy—A Review. Renew. Energy 2015, 75, 911–921. [Google Scholar] [CrossRef] [Scilit]
- Enevoldsen, P.; Sovacool, B.K. Examining the Social Acceptance of Wind Energy: Practical Guidelines for Onshore Wind Project Development in France. Renew. Sustain. Energy Rev. 2016, 53, 178–184. [Google Scholar] [CrossRef] [Scilit]
- Kaya, İ.; Çolak, M.; Terzi, F. A Comprehensive Review of Fuzzy Multi Criteria Decision Making Methodologies for Energy Policy Making. Energy Strategy Rev. 2019, 24, 207–228. [Google Scholar] [CrossRef] [Scilit]
- Zhang, W.; Maleki, A.; Pourfayaz, F.; Shadloo, M.S. An Artificial Intelligence Approach to Optimization of an Off-Grid Hybrid Wind/Hydrogen System. Int. J. Hydrogen Energy 2021, 46, 12725–12738. [Google Scholar] [CrossRef] [Scilit]
- Vagiona, D.G. The Use of Comparative Multi-Criteria Analysis Methods to Evaluate Criteria Weighting in Assessments of Onshore Wind Farm Projects. Energies 2025, 18, 771. [Google Scholar] [CrossRef] [Scilit]
- Pohekar, S.D.; Ramachandran, M. Application of Multi-Criteria Decision Making to Sustainable Energy Planning—A Review. Renew. Sustain. Energy Rev. 2004, 8, 365–381. [Google Scholar] [CrossRef] [Scilit]
- Siksnelyte, I.; Zavadskas, E.K.; Streimikiene, D.; Sharma, D. An Overview of Multi-Criteria Decision-Making Methods in Dealing with Sustainable Energy Development Issues. Energies 2018, 11, 2754. [Google Scholar] [CrossRef] [Scilit]
- Ali, S.; Taweekun, J.; Techato, K.; Waewsak, J.; Gyawali, S. GIS Based Site Suitability Assessment for Wind and Solar Farms in Songkhla, Thailand. Renew. Energy 2019, 132, 1360–1372. [Google Scholar] [CrossRef] [Scilit]
- Mohammadzadeh Bina, S.; Jalilinasrabady, S.; Fujii, H.; Farabi-Asl, H. A Comprehensive Approach for Wind Power Plant Potential Assessment, Application to Northwestern Iran. Energy 2018, 164, 344–358. [Google Scholar] [CrossRef] [Scilit]
- Castro-Santos, L.; Garcia, G.P.; Simões, T.; Estanqueiro, A. Planning of the Installation of Offshore Renewable Energies: A GIS Approach of the Portuguese Roadmap. Renew. Energy 2019, 132, 1251–1262. [Google Scholar] [CrossRef] [Scilit]
- Sánchez-Lozano, J.M.; García-Cascales, M.S.; Lamata, M.T. GIS-Based Onshore Wind Farm Site Selection Using Fuzzy Multi-Criteria Decision Making Methods. Evaluating the Case of Southeastern Spain. Appl. Energy 2016, 171, 86–102. [Google Scholar] [CrossRef] [Scilit]
- Huo, Z.; Zhang, J.; Cheng, C.; Cao, H.; Yang, Y. A Synergistic Model Framework for Identifying Variable Renewable Energy Integration Capacity and Deployment Sites for Hydro-Wind-PV Integrated Energy Bases. Energy 2025, 314, 134326. [Google Scholar] [CrossRef] [Scilit]
- Salih, A.; Hassaballa, A.A.; Eltawil, M.A. Integrating Spatial Data and Multi-Criteria Analysis for Wind Farm Suitability Mapping in Eastern Saudi Arabia. Energy 2024, 301, 131623. [Google Scholar] [CrossRef] [Scilit]
- Sotiropoulou, K.F.; Vavatsikos, A.P. Onshore Wind Farms GIS-Assisted Suitability Analysis Using PROMETHEE II. Energy Policy 2021, 158, 112531. [Google Scholar] [CrossRef] [Scilit]
- Moradi, S.; Yousefi, H.; Noorollahi, Y.; Rosso, D. Multi-Criteria Decision Support System for Wind Farm Site Selection and Sensitivity Analysis: Case Study of Alborz Province, Iran. Energy Strategy Rev. 2020, 29, 100478. [Google Scholar]
- Xu, Y.; Li, Y.; Zheng, L.; Cui, L.; Li, S.; Li, W.; Cai, Y. Site Selection of Wind Farms Using GIS and Multi-Criteria Decision Making Method in Wafangdian, China. Energy 2020, 207, 118222. [Google Scholar] [CrossRef] [Scilit]
- Feloni, E.; Karandinaki, E. GIS-Based MCDM Approach for Wind Farm Site Selection—A Case Study. J. Energy Power Technol. 2021, 3, 1–15. [Google Scholar]
- Moltames, R.; Naghavi, M.S.; Silakhori, M.; Noorollahi, Y.; Yousefi, H.; Hajiaghaei-Keshteli, M.; Azizimehr, B. Multi-Criteria Decision Methods for Selecting a Wind Farm Site Using a Geographic Information System (GIS). Sustainability 2022, 14, 14742. [Google Scholar] [CrossRef] [Scilit]
- Ayalke, Z.G.; Şişman, A. Site Selection for Wind Farms Using Geographic Information System with Best-Worst Method: A Case Study Amhara Region of Ethiopia. Adv. Land Manag. 2022, 2, 69–78. [Google Scholar]
- Vagiona, D.G.; Alexiou, V. Wind Farm Deployment in Uninhabited Islets: A Case Study the Region of the South Aegean (Greece). Wind 2022, 2, 451–465. [Google Scholar] [CrossRef] [Scilit]
- Seyed Alavi, S.M.; Maleki, A.; Khaleghi, A. Optimal Site Selection for Wind Power Plant Using Multi-Criteria Decision-Making Methods: A Case Study in Eastern Iran. Int. J. Low-Carbon Technol. 2022, 17, 1319–1337. [Google Scholar]
- Amsharuk, A.; Łaska, G. The Approach to Finding Locations for Wind Farms Using GIS and MCDA: Case Study Based on Podlaskie Voivodeship, Poland. Energies 2023, 16, 7107. [Google Scholar] [CrossRef] [Scilit]
- Badi, I.; Pamučar, D.; Stević, Ž.; Muhammad, L.J. Wind Farm Site Selection Using BWM-AHP-MARCOS Method: A Case Study of Libya. Sci. Afr. 2023, 19, e01511. [Google Scholar] [CrossRef] [Scilit]
- Yildiz, S.S. Spatial Multi-Criteria Decision Making Approach for Wind Farm Site Selection: A Case Study in Balıkesir, Turkey. Renew. Sustain. Energy Rev. 2024, 192, 114158. [Google Scholar] [CrossRef] [Scilit]
- Yaman, A. A GIS-Based Multi-Criteria Decision-Making Approach (GIS-MCDM) for Determination of the Most Appropriate Site Selection of Onshore Wind Farm in Adana, Turkey. Clean Technol. Environ. Policy 2024, 26, 4231–4254. [Google Scholar] [CrossRef] [Scilit]
- Demir, G.; Riaz, M.; Deveci, M. Wind Farm Site Selection Using Geographic Information System and Fuzzy Decision Making Model. Expert Syst. Appl. 2024, 255, 124772. [Google Scholar] [CrossRef] [Scilit]
- Region of Central Greece—Municipality of Skyros. Available online: https://pste.gov.gr/dimos-skirou/ (accessed on 1 November 2025).
- Hellenic Statistical Authority—ELSTAT. Available online: https://www.statistics.gr/el/statistics/-/publication/SKA01/- (accessed on 1 November 2025).
- Ministry of Environment and Energy. Specific Framework for Spatial Planning and Sustainable Development (SFSPSD) for Renewable Energy Sources. Available online: https://ypen.gov.gr/wp-content/uploads/2020/11/FEK2464B_2008_RES.pdf (accessed on 1 November 2025).
- Garbellini, L.; Ke, S.; Gummidi, S.R.B.; Dong, D.; Birkved, M.; Liu, G. Geographic Information System Based Multi-Criteria Decision-Making for Onshore Wind Farm Site Selection in Brazil. Res. Sq. 2024. [Google Scholar] [CrossRef] [Scilit]
- Villacreses, G.; Gaona, G.; Martínez-Gómez, J.; Jijón, D.J. Wind Farms Suitability Location Using Geographical Information System (GIS), Based on Multi-Criteria Decision Making (MCDM) Methods: The Case of Continental Ecuador. Renew. Energy 2017, 109, 275–286. [Google Scholar] [CrossRef] [Scilit]
- Bili, A.; Vagiona, D.G. Use of Multicriteria Analysis and GIS for Selecting Sites for Onshore Wind Farms: The Case of Andros Island (Greece). Eur. J. Environ. Sci. 2018, 8, 5–13. [Google Scholar] [CrossRef] [Scilit]
- Atici, K.B.; Simsek, A.B.; Ulucan, A.; Tosun, M.U. A GIS-Based Multiple Criteria Decision Analysis Approach for Wind Power Plant Site Selection. Util. Policy 2015, 37, 86–96. [Google Scholar] [CrossRef] [Scilit]
- Nasery, S.; Matci, D.K.; Avdan, U. GIS-Based Wind Farm Suitability Assessment Using Fuzzy AHP Multi-Criteria Approach: The Case of Herat, Afghanistan. Arab. J. Geosci. 2021, 14, 1091. [Google Scholar]
- Derdouri, A.; Murayama, Y. Onshore Wind Farm Suitability Analysis Using GIS-Based Analytic Hierarchy Process: A Case Study of Fukushima Prefecture, Japan. Geoinform. Geostat. Overv. 2018, 16, 2. [Google Scholar]
- Höfer, T.; Sunak, Y.; Siddique, H.; Madlener, R. Wind Farm Siting Using a Spatial Analytic Hierarchy Process Approach: A Case Study of the Städteregion Aachen. Appl. Energy 2016, 163, 222–243. [Google Scholar] [CrossRef] [Scilit]
- Bilgili, A.; Arda, T.; Kilic, B. Explainability in Wind Farm Planning: A Machine Learning Framework for Automatic Site Selection of Wind Farms. Energy Convers. Manag. 2024, 309, 118441. [Google Scholar] [CrossRef] [Scilit]
- Gorsevski, P.V.; Cathcart, S.C.; Mirzaei, G.; Jamali, M.M.; Ye, X.; Gomezdelcampo, E. A Group-Based Spatial Decision Support System for Wind Farm Site Selection in Northwest Ohio. Energy Policy 2013, 55, 374–385. [Google Scholar] [CrossRef] [Scilit]
- Ayodele, T.R.; Ogunjuyigbe, A.S.O.; Odigie, O.; Munda, J.L. A Multi-Criteria GIS Based Model for Wind Farm Site Selection Using Interval Type-2 Fuzzy Analytic Hierarchy Process: The Case Study of Nigeria. Appl. Energy 2018, 228, 1853–1869. [Google Scholar] [CrossRef] [Scilit]
- Rehman, S.; Baseer, M.A.; Alhems, L.M. GIS-Based Multi-Criteria Wind Farm Site Selection Methodology. FME Trans. 2020, 48, 855–867. [Google Scholar]
- Latinopoulos, D.; Kechagia, K. A GIS-Based Multi-Criteria Evaluation for Wind Farm Site Selection. A Regional Scale Application in Greece. Renew. Energy 2015, 78, 550–560. [Google Scholar]
- Papathanasiou, J.; Ploskas, N. Multiple Criteria Decision Aid: Methods, Examples and Python Implementations; Springer Optimization and Its Applications; Springer International Publishing: Cham, Switzerland, 2018; Volume 136, ISBN 978-3-319-91646-0. [Google Scholar]
- Saaty, R.W. The Analytic Hierarchy Process—What It Is and How It Is Used. Math. Model. 1987, 9, 161–176. [Google Scholar] [CrossRef] [Scilit]
- Kumar, M.; Ratandhara, H. A Simplified and Improved Best-Worst Method for Multi-Criteria Decision-Making: A Novel Approach. SSRN 2023. [Google Scholar] [CrossRef] [Scilit]
- Rezaei, J. Best-Worst Multi-Criteria Decision-Making Method. Omega 2015, 53, 49–57. [Google Scholar] [CrossRef] [Scilit]
- Roszkowska, E. Rank Ordering Criteria Weighting Methods—A Comparative Overview. Optimum. Stud. Ekon. 2013, 5, 14–33. [Google Scholar] [CrossRef] [Scilit]
- Figueira, J.; Roy, B. Determining the Weights of Criteria in the ELECTRE Type Methods with a Revised Simos’ Procedure. Eur. J. Oper. Res. 2002, 139, 317–326. [Google Scholar] [CrossRef] [Scilit]
- Zhu, Y.; Tian, D.; Yan, F. Effectiveness of Entropy Weight Method in Decision-Making. Math. Probl. Eng. 2020, 2020, 3564835. [Google Scholar] [CrossRef] [Scilit]
- Diakoulaki, D.; Mavrotas, G.; Papayannakis, L. Determining Objective Weights in Multiple Criteria Problems: The Critic Method. Comput. Oper. Res. 1995, 22, 763–770. [Google Scholar] [CrossRef] [Scilit]
- Žižović, M.; Miljković, B.; Marinković, D. Objective Methods for Determining Criteria Weight Coefficients: A Modification of the CRITIC Method. Decis. Mak. Appl. Manag. Eng. 2020, 3, 149–161. [Google Scholar] [CrossRef] [Scilit]
- Hassan, I.; Alhamrouni, I.; Azhan, N.H. A CRITIC–TOPSIS Multi-Criteria Decision-Making Approach for Optimum Site Selection for Solar PV Farm. Energies 2023, 16, 4245. [Google Scholar] [CrossRef] [Scilit]
- Shih, H.-S.; Olson, D.L. TOPSIS and Its Extensions: A Distance-Based MCDM Approach; Studies in Systems, Decision and Control; Springer International Publishing: Cham, Switzerland, 2022; Volume 447, ISBN 978-3-031-09576-4. [Google Scholar]
- Zulqarnain, R.M.; Saeed, M.; Ahmad, N.; Dayan, F.; Ahmad, B. Application of TOPSIS Method for Decision Making. Int. J. Sci. Res. Math. Stat. Sci. 2020, 7, 76–81. [Google Scholar]
- Chatterjee, P.; Chakraborty, S. A Comparative Analysis of VIKOR Method and Its Variants. Decis. Sci. Lett. 2016, 5, 469–486. [Google Scholar] [CrossRef] [Scilit]
- San Cristóbal, J.R. Multi-Criteria Decision-Making in the Selection of a Renewable Energy Project in Spain: The Vikor Method. Renew. Energy 2011, 36, 498–502. [Google Scholar] [CrossRef] [Scilit]
- Wei, J.; Lin, X. The Multiple Attribute Decision-Making VIKOR Method and Its Application. In Proceedings of the 2008 4th International Conference on Wireless Communications, Networking and Mobile Computing, Dalian, China, 12–17 October 2008; IEEE: Dalian, China, 2008; pp. 1–4. [Google Scholar]
- Afsordegan, A.; Del Vasto-Terrientes, L.; Valls, A.; Núria Agell, N.; Sánchez, M. Finding the most sustainable wind farm sites with a hierarchical outranking decision aiding method. Ann. Oper. Res. 2022, 312, 1307–1335. [Google Scholar] [CrossRef] [Scilit]
- Taherdoost, H.; Madanchian, M. A Comprehensive Overview of the ELECTRE Method in Multi Criteria Decision-Making. J. Manag. Sci. Eng. Res. 2023, 6, 5–16. [Google Scholar] [CrossRef] [Scilit]
- Goswami, S.S. Outranking Methods: Promethee I and Promethee II. Found. Manag. 2020, 12, 93–110. [Google Scholar] [CrossRef] [Scilit]
- Wang, J.-J.; Yang, D.-L. Using a Hybrid Multi-Criteria Decision Aid Method for Information Systems Outsourcing. Comput. Oper. Res. 2007, 34, 3691–3700. [Google Scholar] [CrossRef] [Scilit]
- Şahin, M. Location Selection by Multi-Criteria Decision-Making Methods Based on Objective and Subjective Weightings. Knowl. Inf. Syst. 2021, 63, 1991–2021. [Google Scholar] [CrossRef] [Scilit]
- Hellenic Data Service. Available online: https://data.hellenicdataservice.gr/dataset?q=&organization=geodata-gov-gr&sort=score+desc%2C+metadata_modified+desc (accessed on 3 November 2025).
- Global Wind Atlas. Available online: https://globalwindatlas.info (accessed on 3 November 2025).
- RAE GeoPortal. Available online: https://geo.rae.gr/ (accessed on 3 November 2025).
- EarthExplorer. Available online: https://earthexplorer.usgs.gov/ (accessed on 3 November 2025).
- Ministry of Environment and Energy—Estia. Available online: https://estia.minenv.gr/ (accessed on 4 November 2025).
- National Archive of Monuments. Available online: https://www.arxaiologikoktimatologio.gov.gr/portal/ (accessed on 4 November 2025).
- European Environment Agency. Available online: https://www.eea.europa.eu/en (accessed on 4 November 2025).
- CORINE Land Cover 2018. Available online: https://land.copernicus.eu/en/products/corine-land-cover/clc2018 (accessed on 4 November 2025).
- ArcGIS Online. Available online: https://www.arcgis.com/index.html (accessed on 4 November 2025).
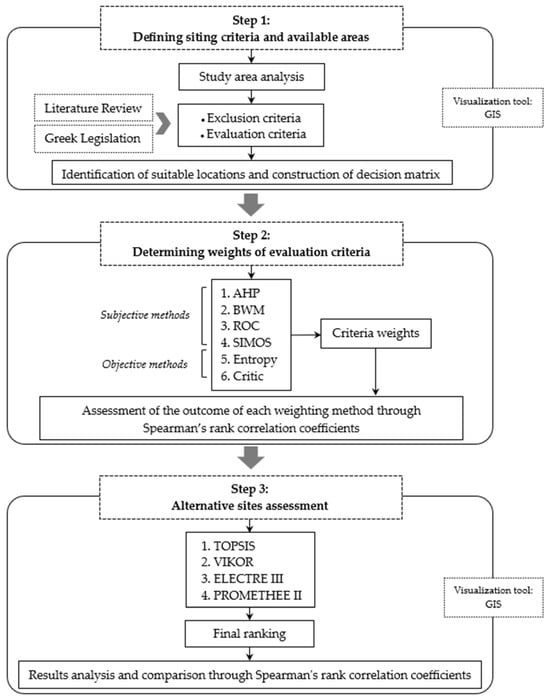
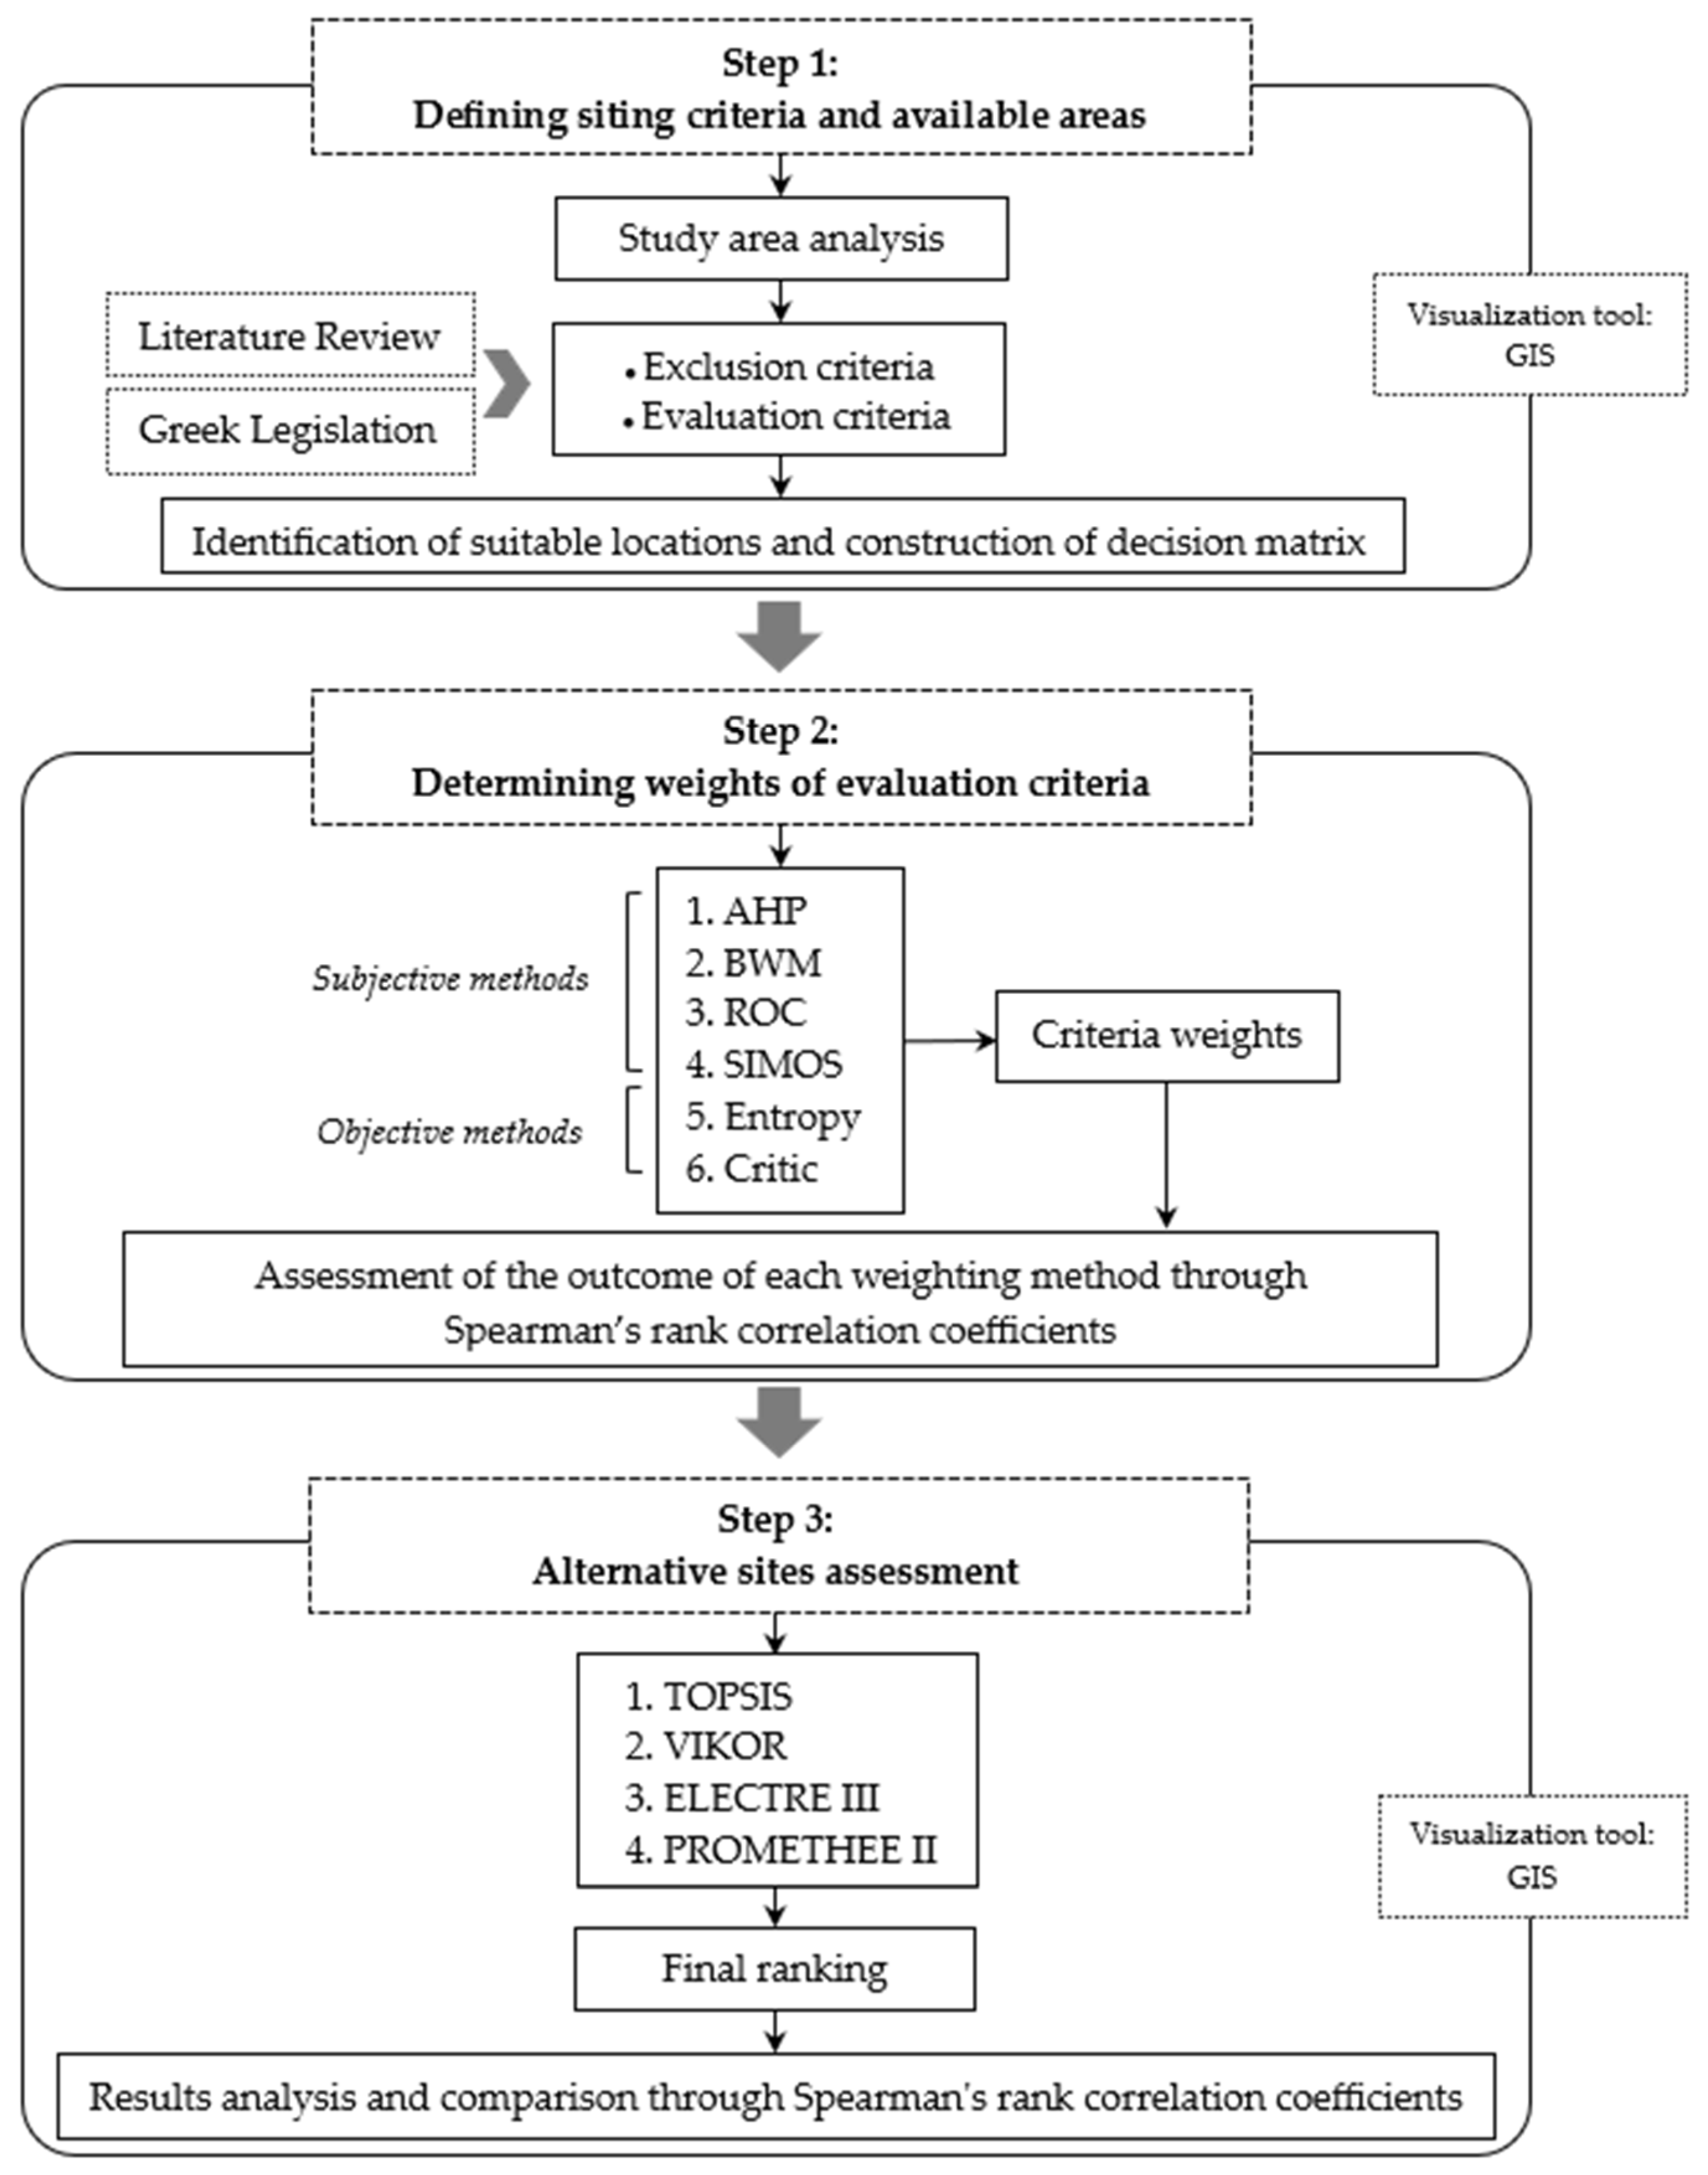


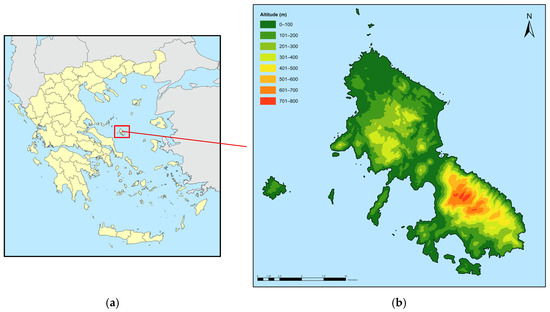
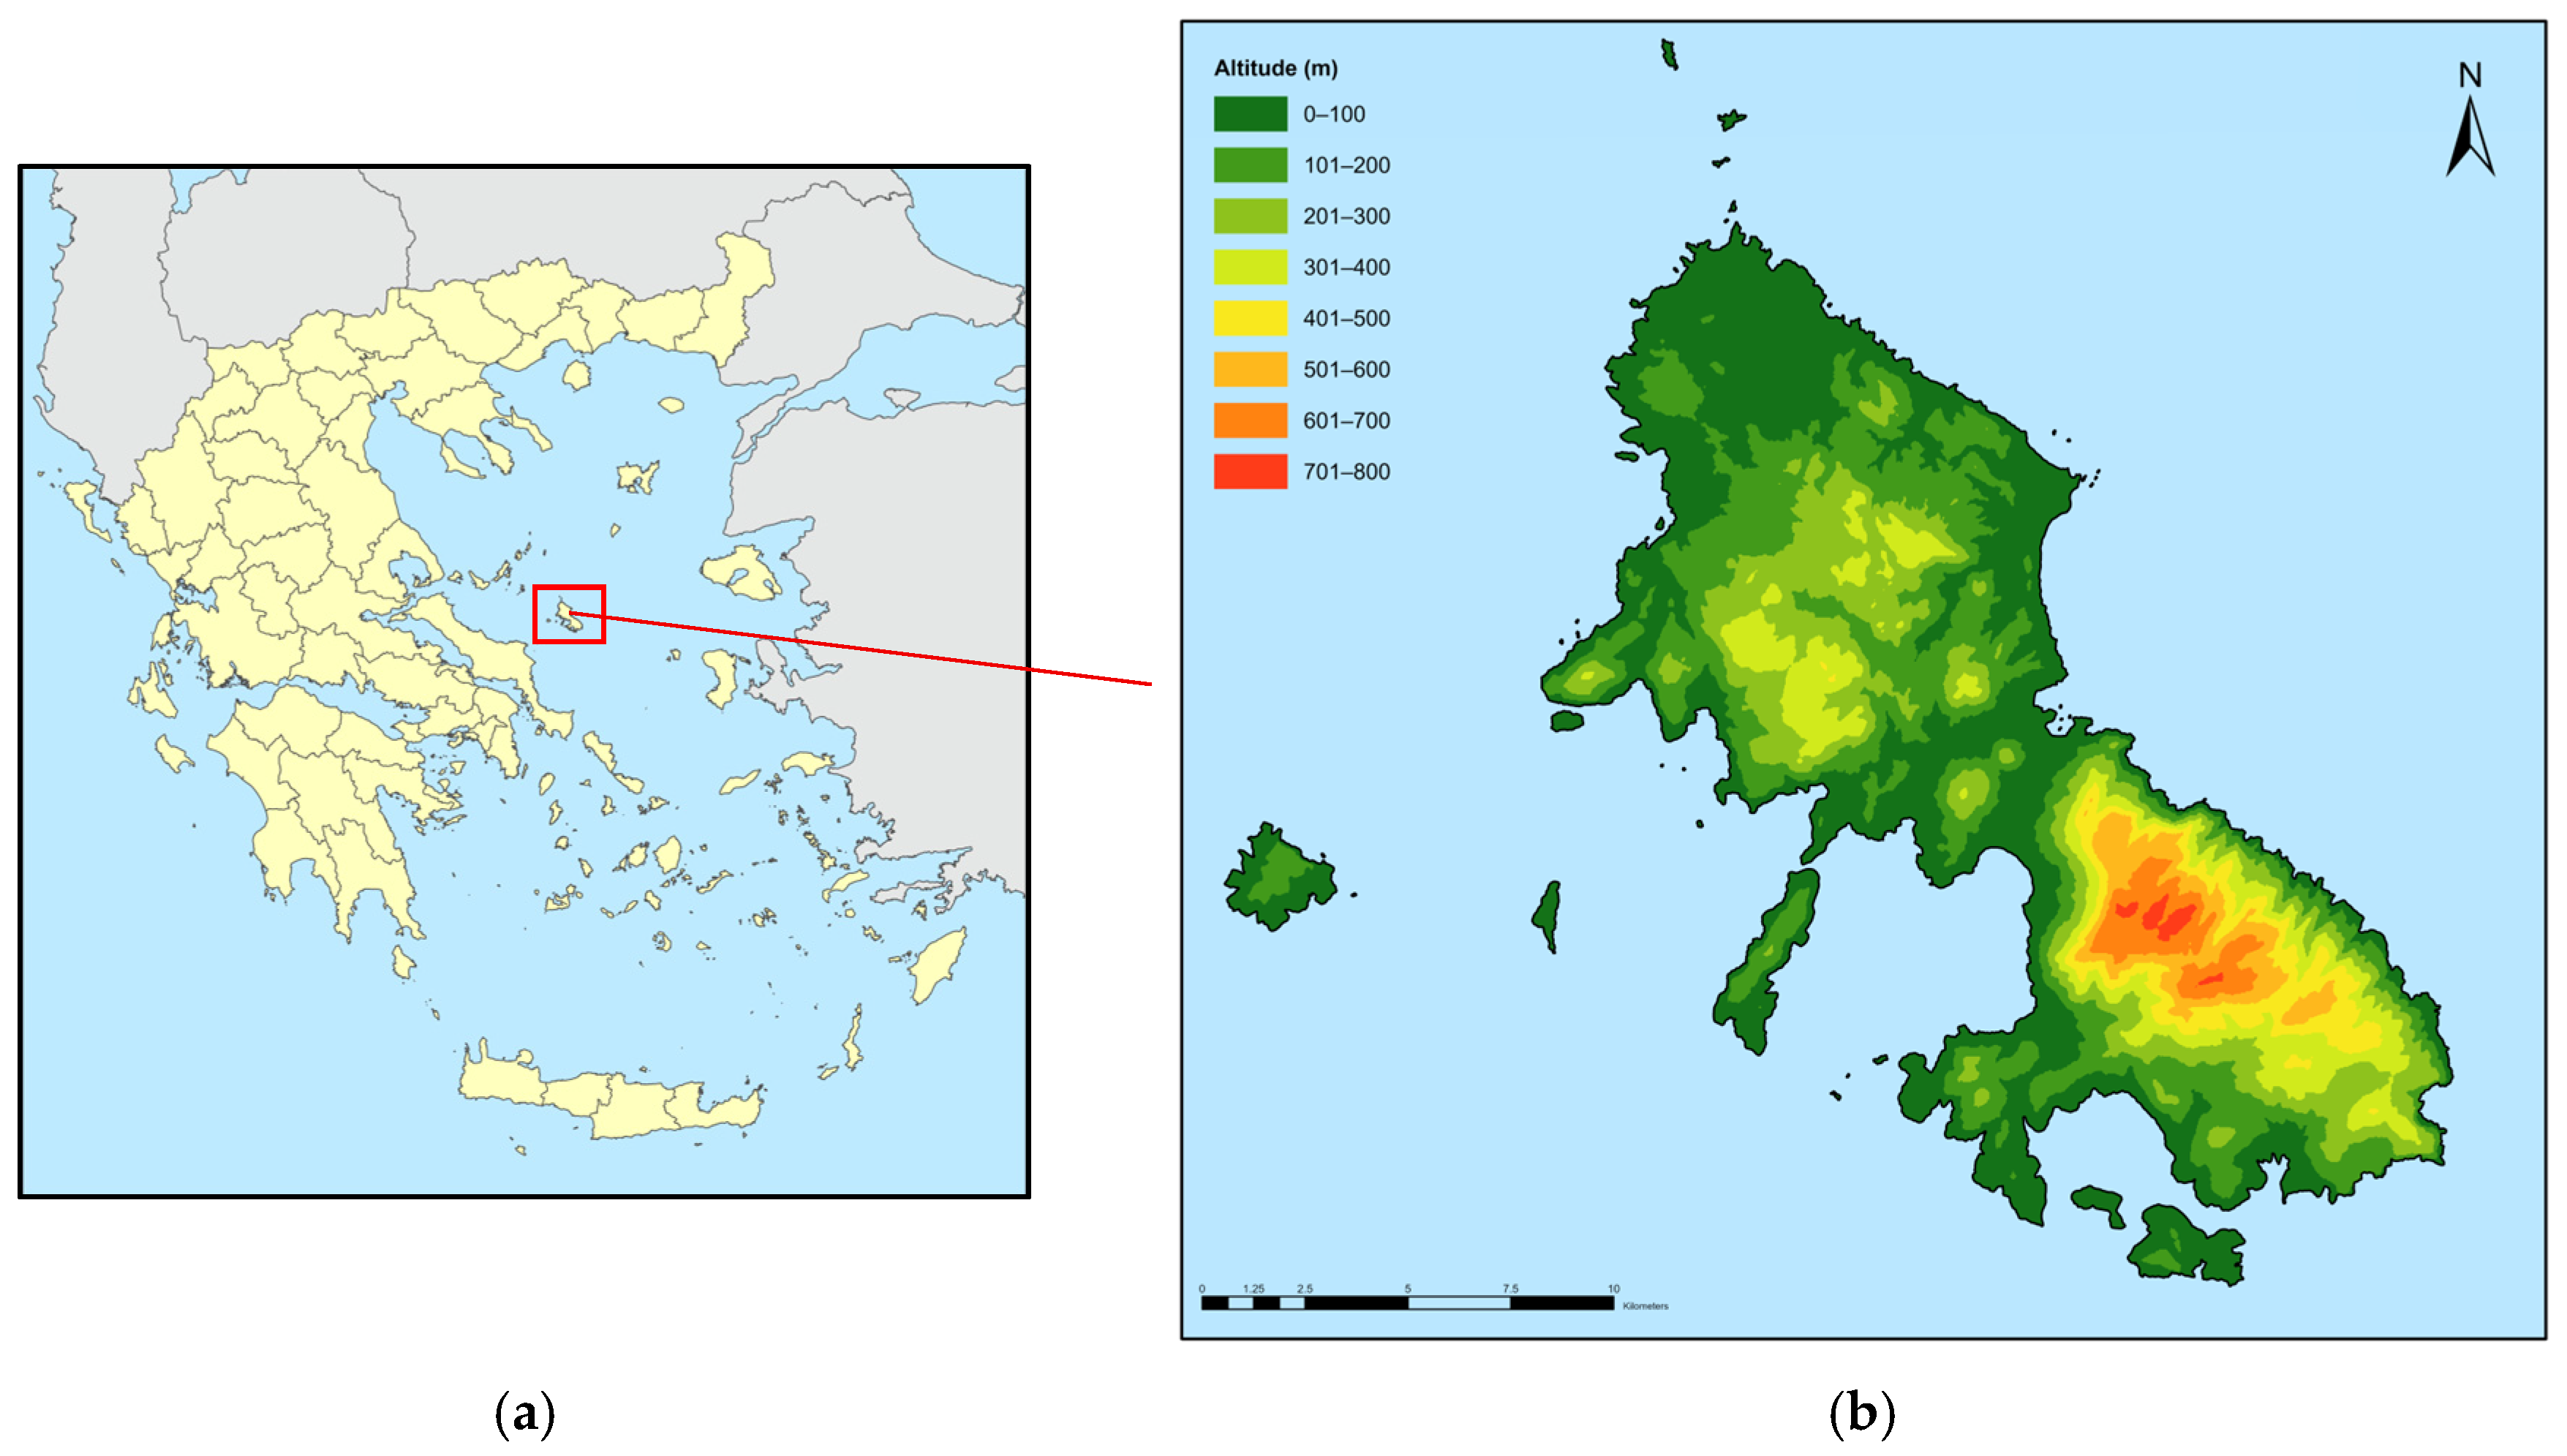
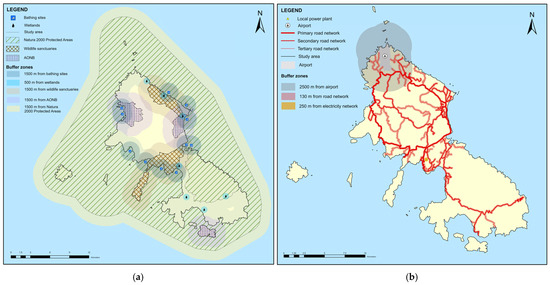
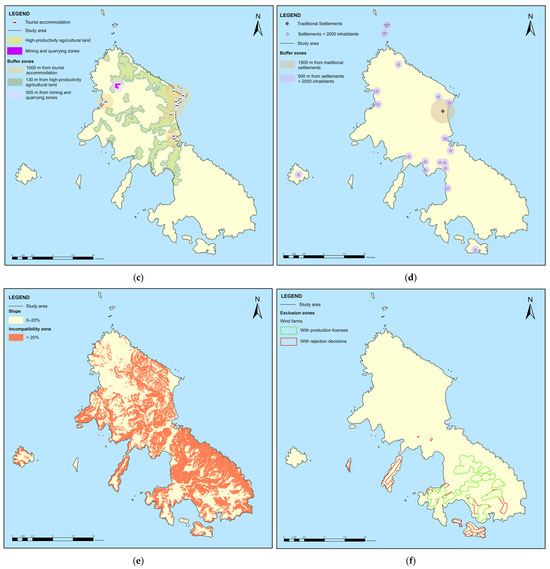
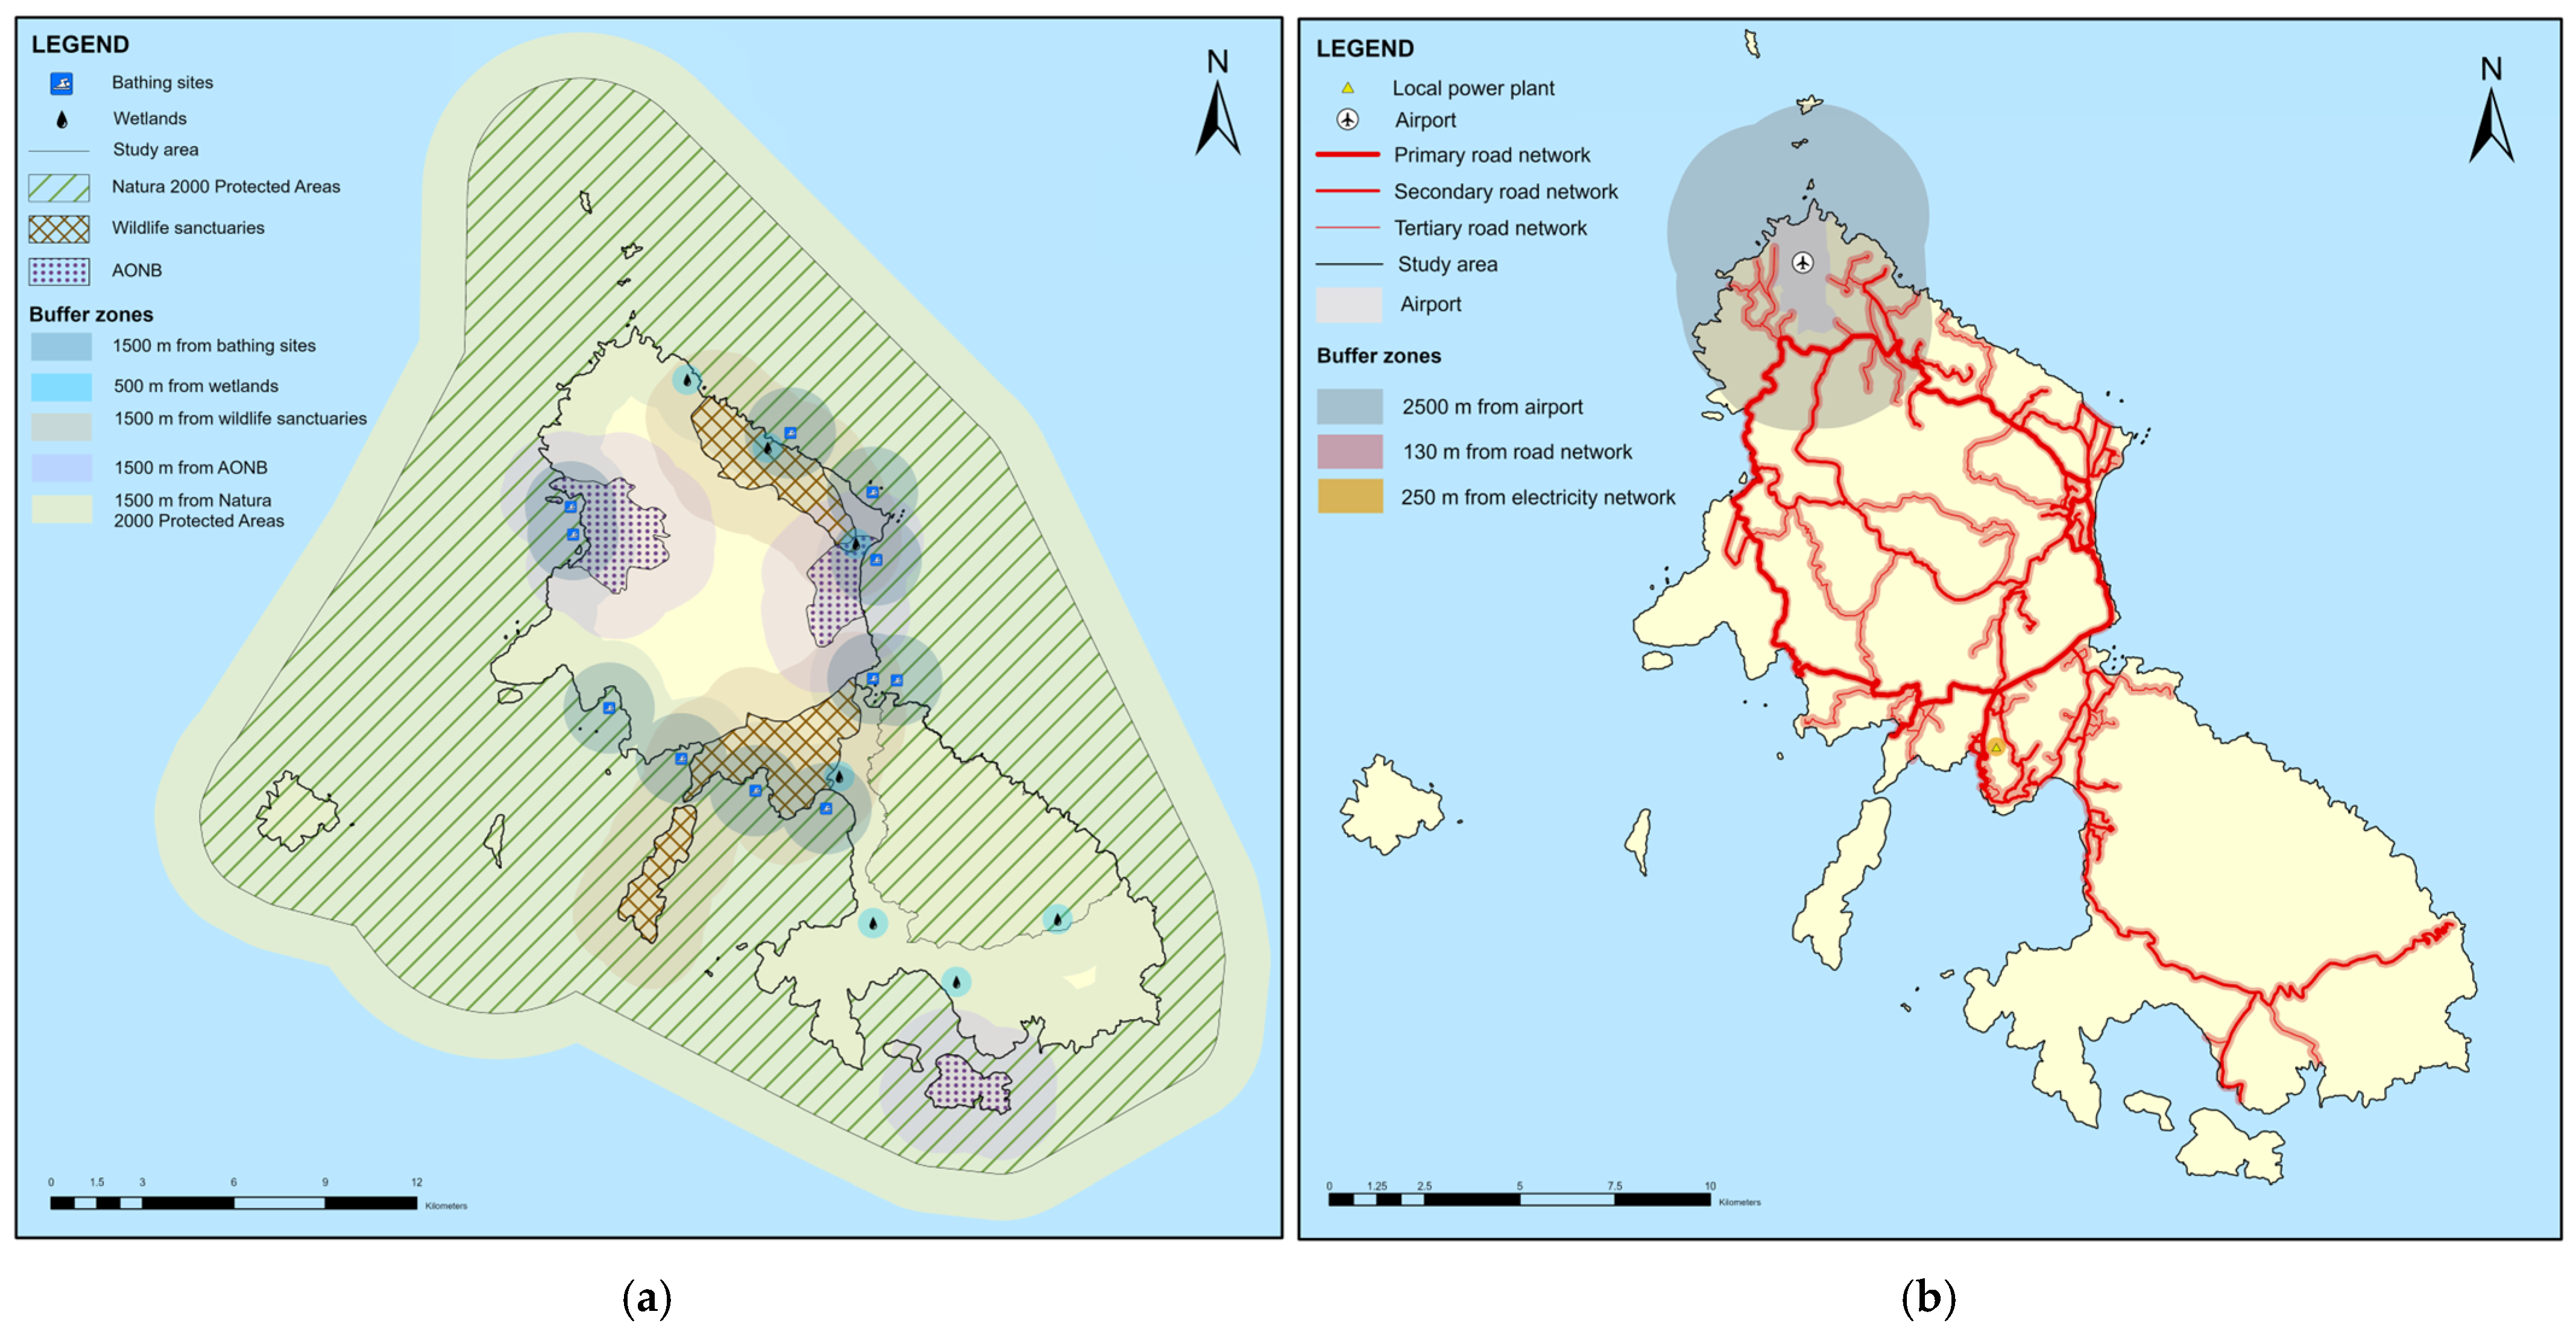
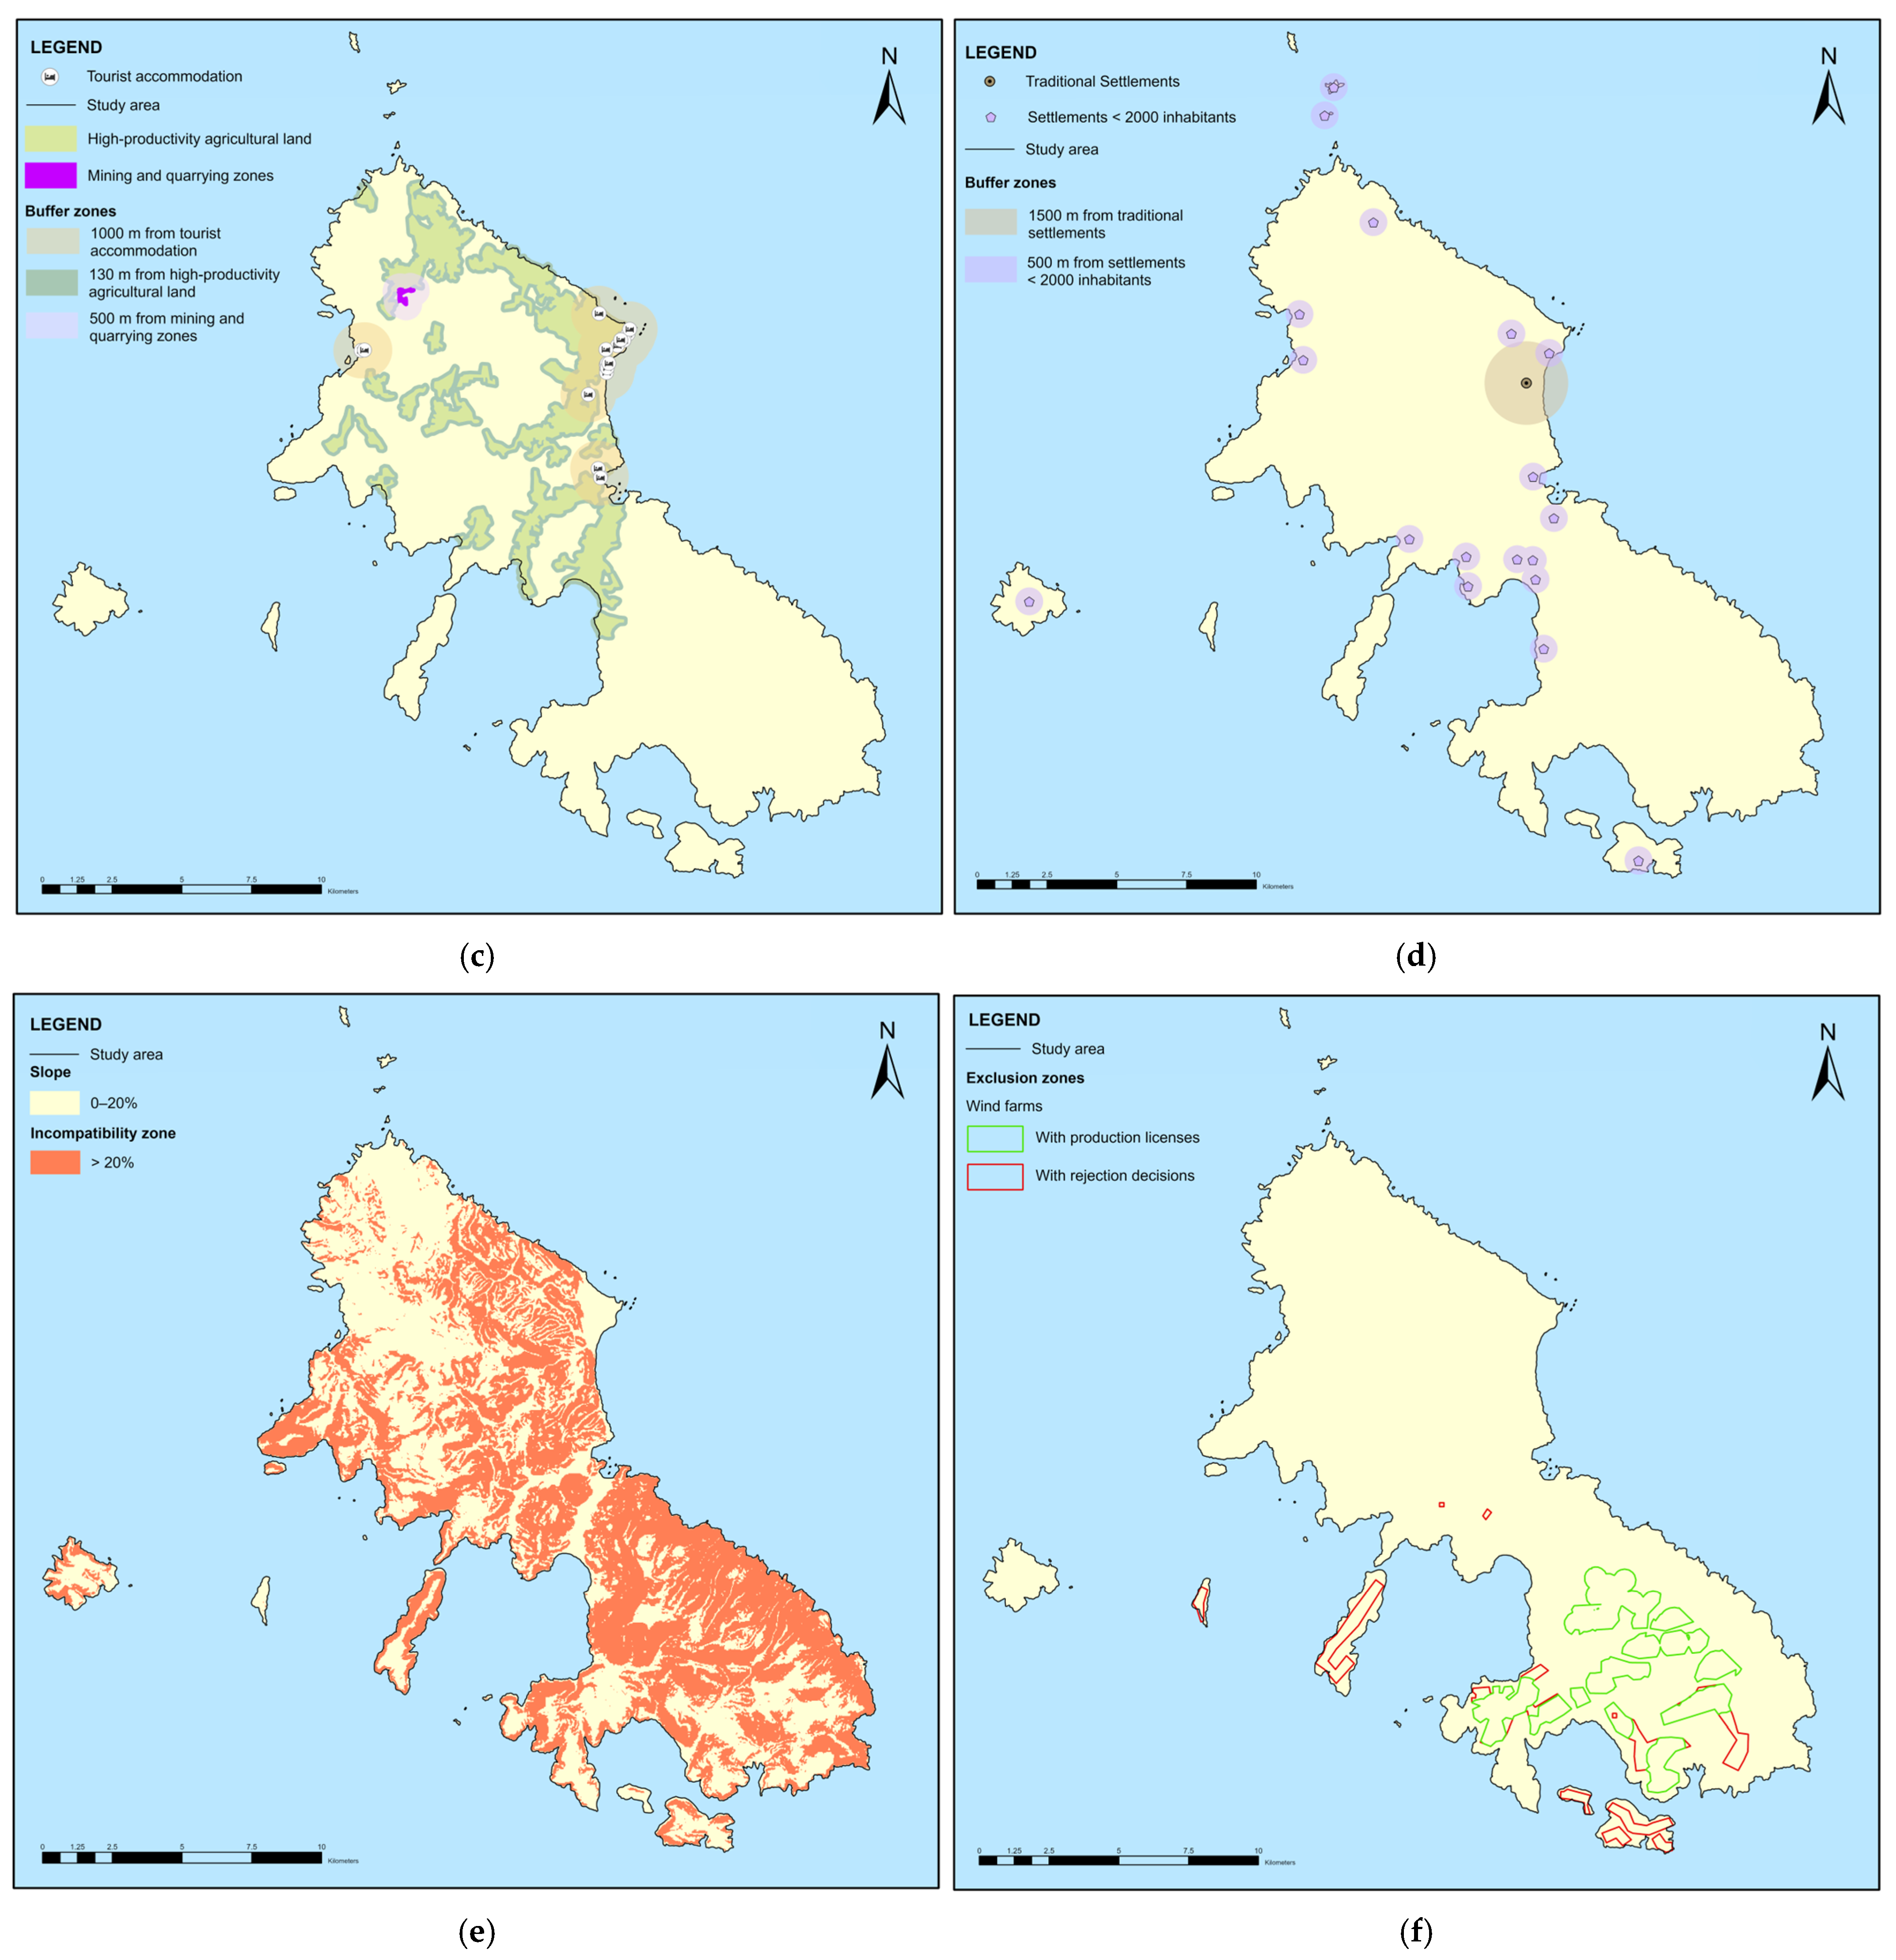
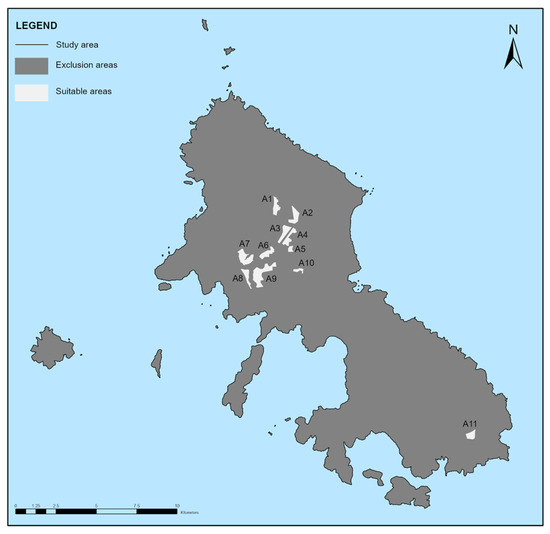
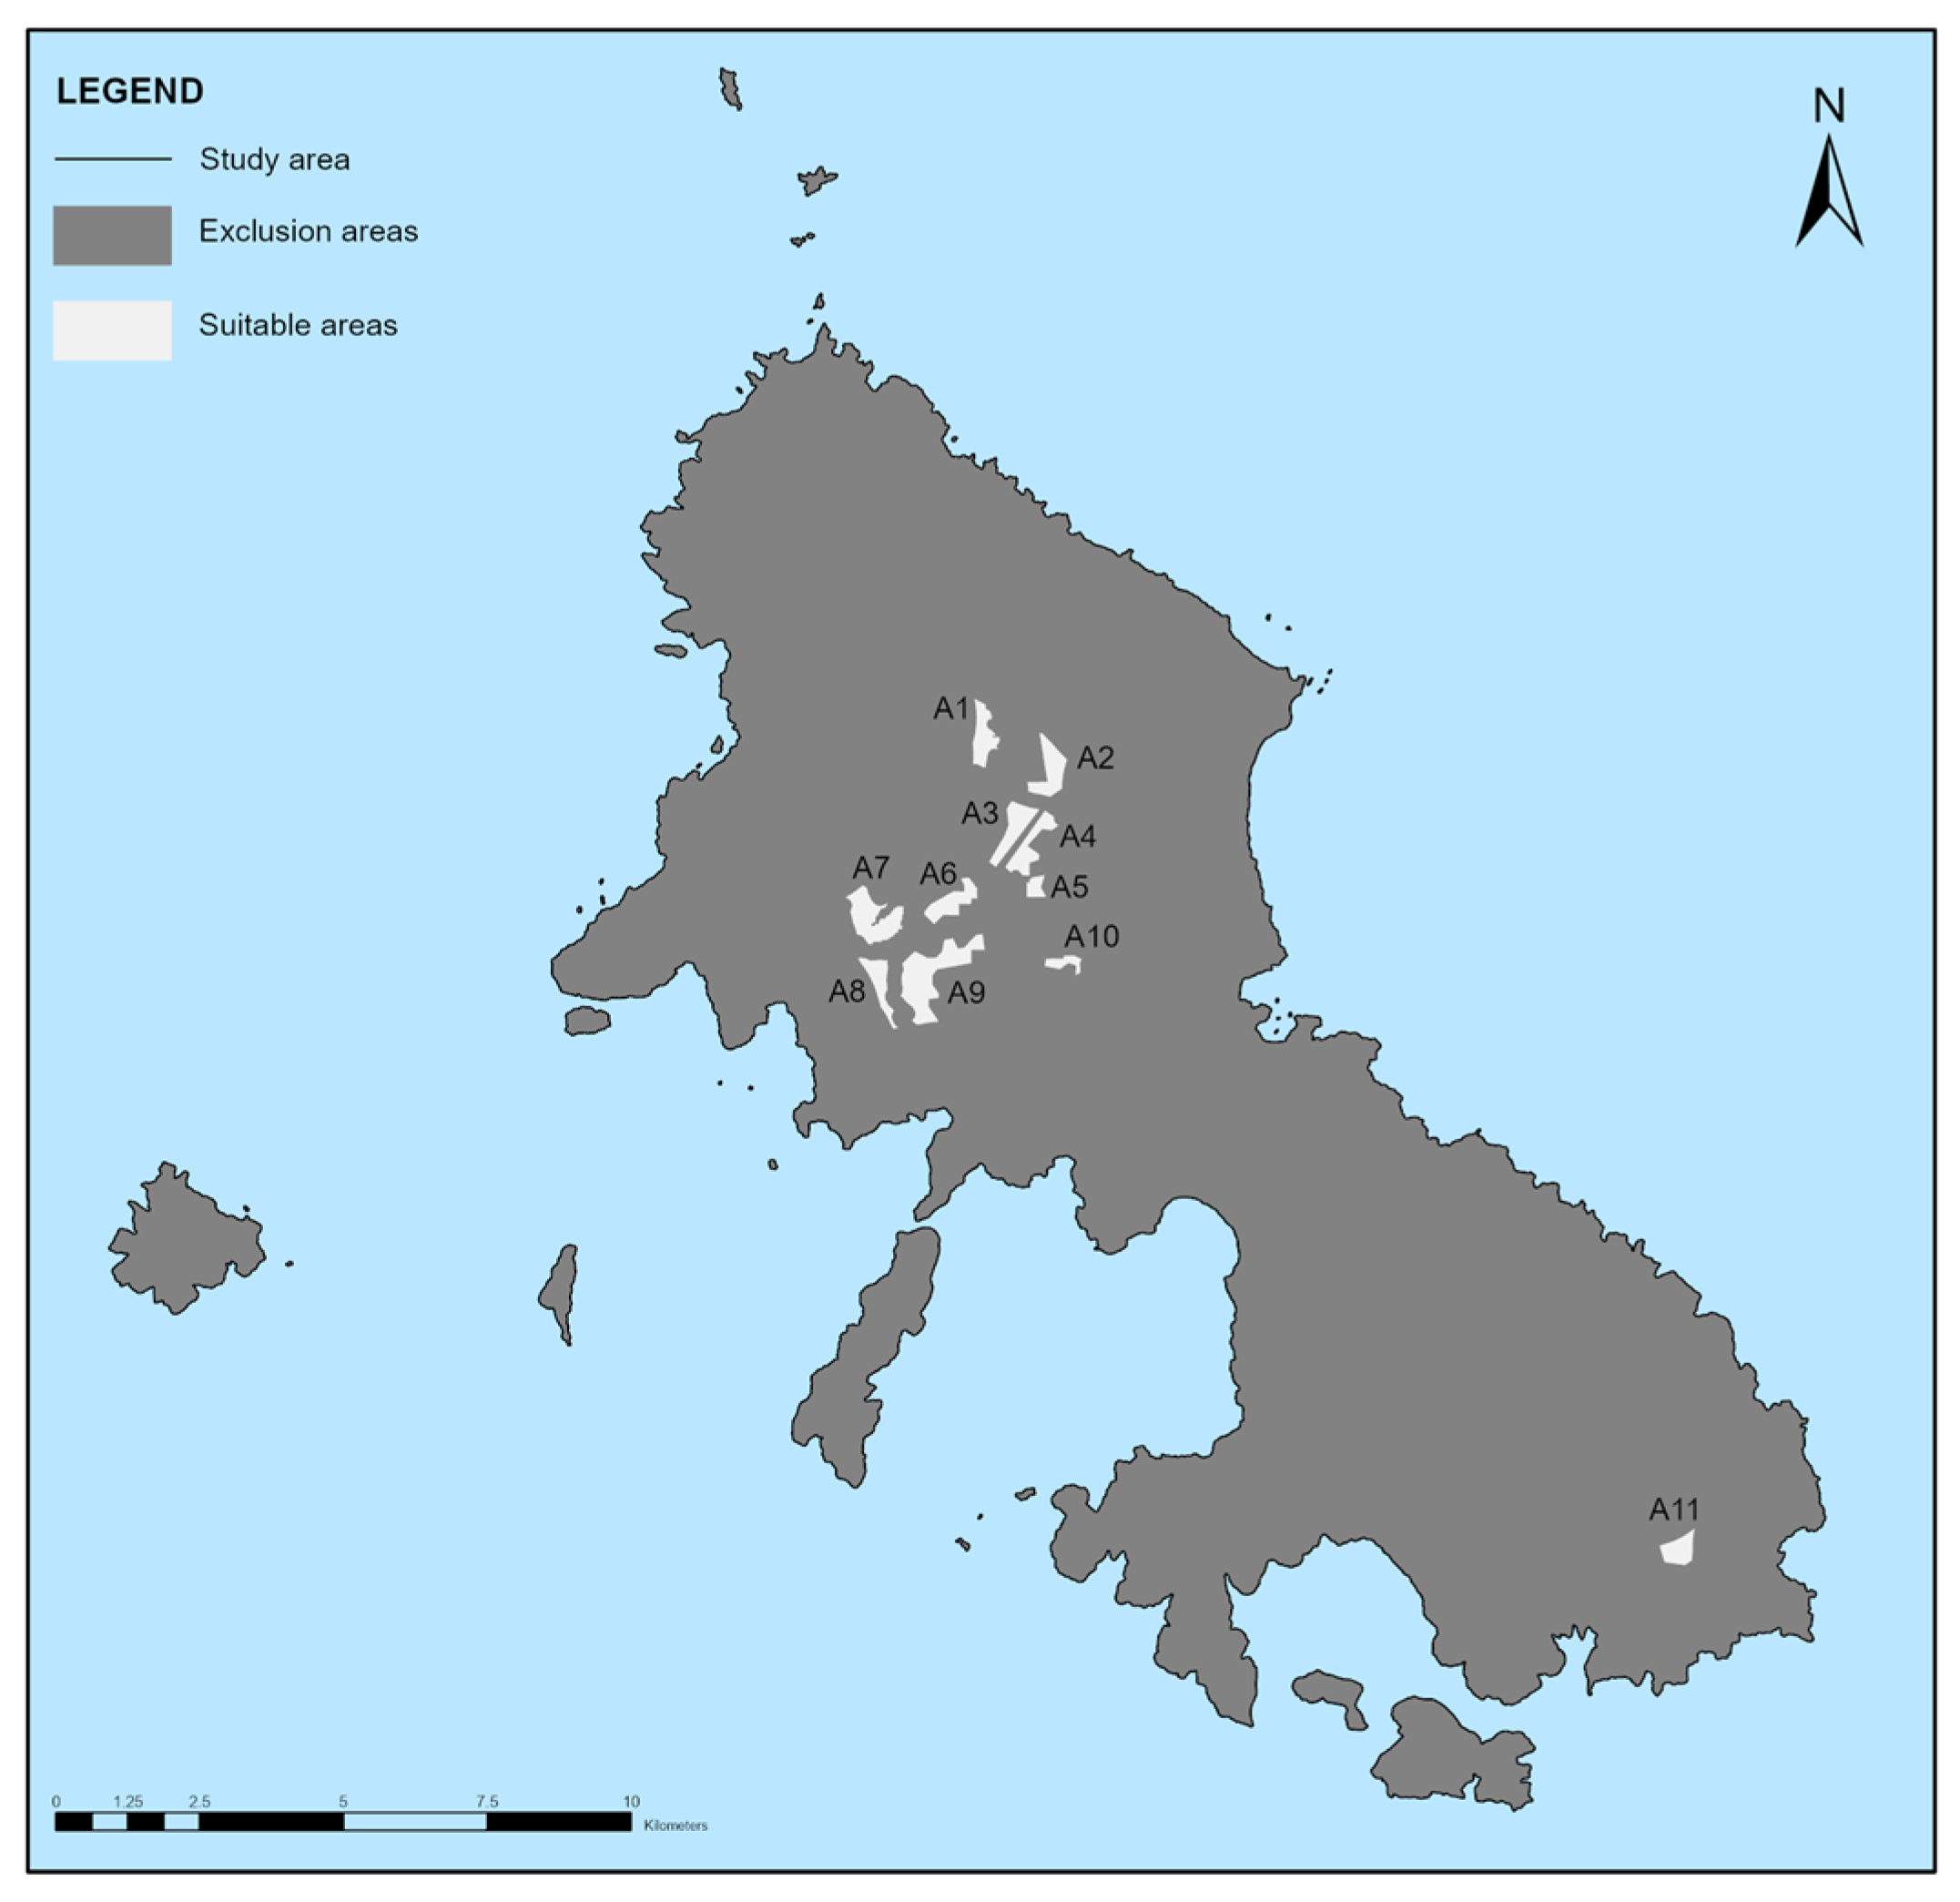
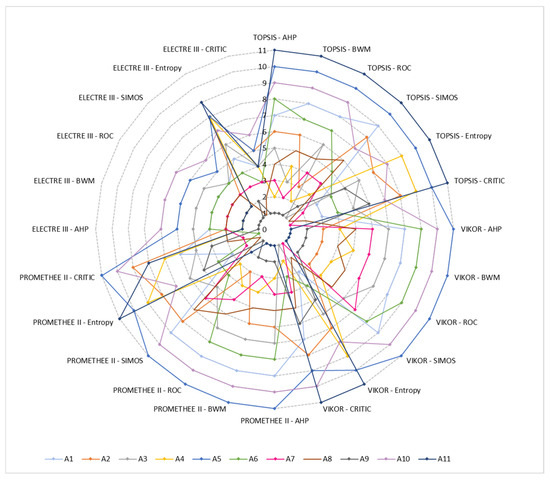
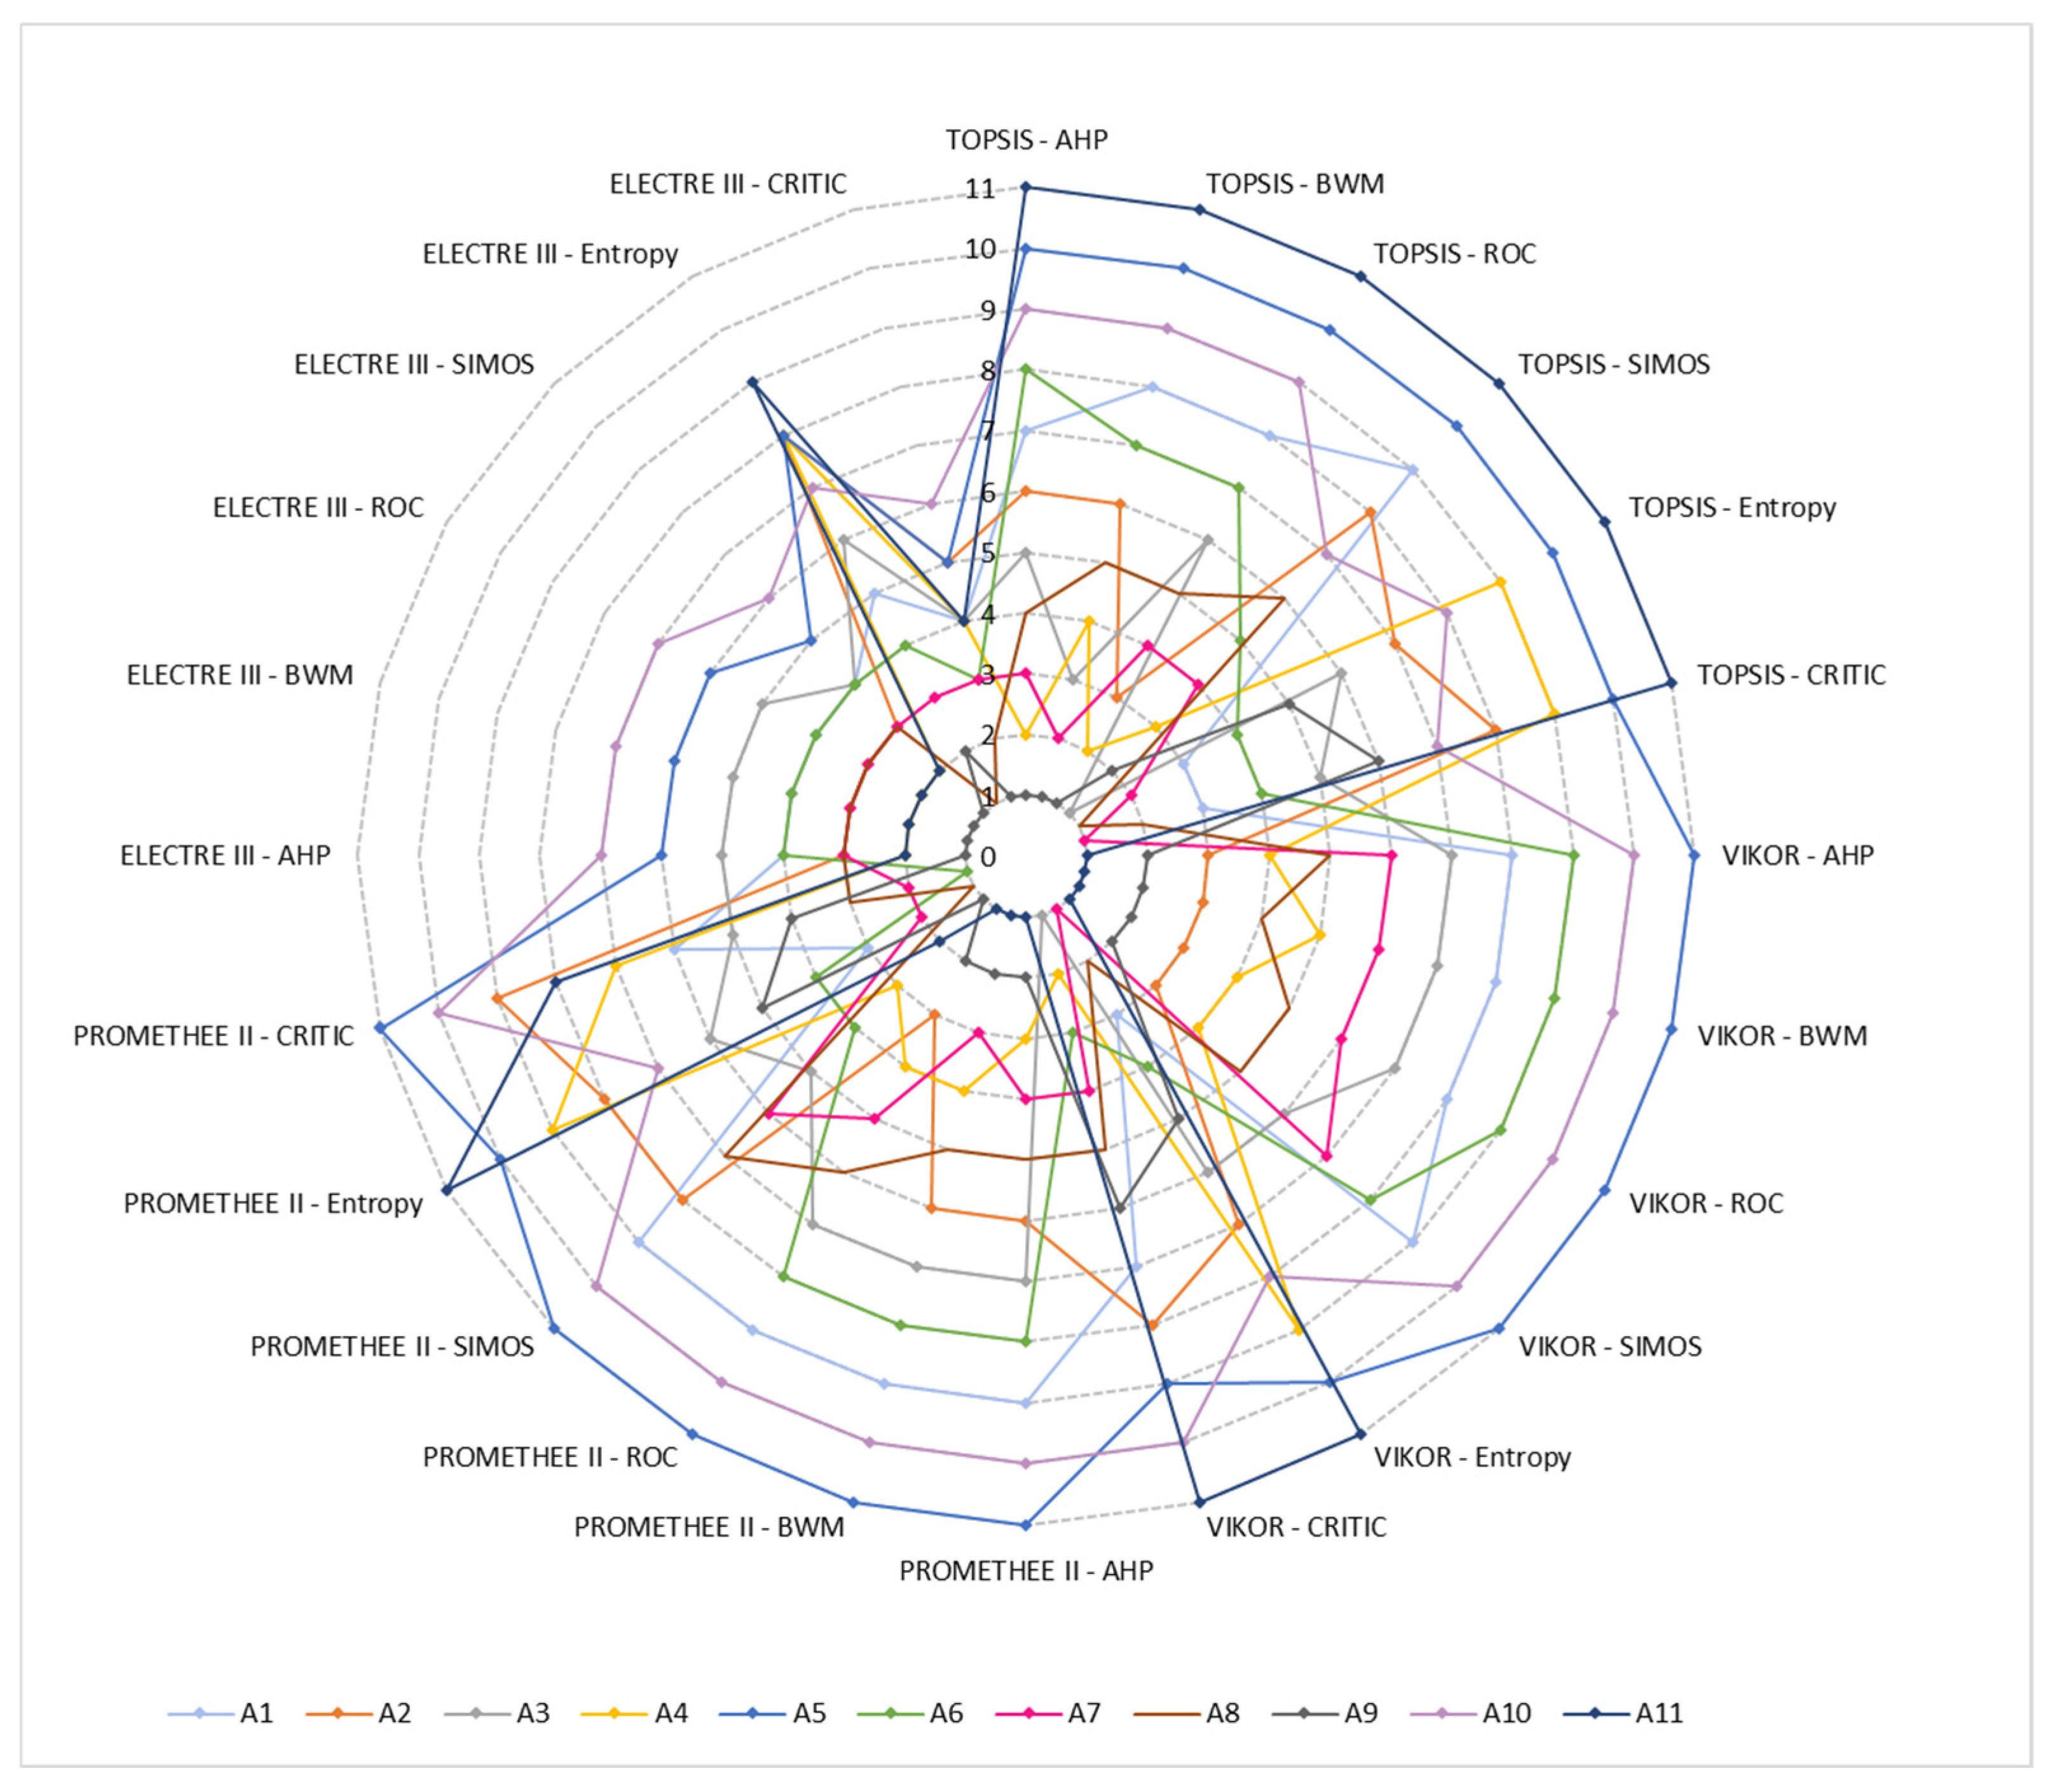

Disclaimer/Publisher’s Note: The statements, opinions and data contained in all publications are solely those of the individual author(s) and contributor(s) and not of MDPI and/or the editor(s). MDPI and/or the editor(s) disclaim responsibility for any injury to people or property resulting from any ideas, methods, instructions or products referred to in the content. |
© 2026 by the authors. Licensee MDPI, Basel, Switzerland. This article is an open access article distributed under the terms and conditions of the Creative Commons Attribution (CC BY) license.