Proceeding Paper

Influence of LED-Spectra on Yield and Phytochemical Content of Chinese Kale (Brassica oleracea var. alboglabra) in a Hydroponic Vertical Farming System †

School of Biological and Environmental Sciences, Faculty of Science and Engineering, University of Nottingham Malaysia, Semenyih 43500, Malaysia
*
Author to whom correspondence should be addressed.
Presented at the 3rd International Online Conference on Agriculture (IOCAG 2025), 22–24 October 2025; Available online: https://sciforum.net/event/IOCAG2025.
Biol. Life Sci. Forum 2025, 54(1), 24; https://doi.org/10.3390/blsf2025054024
Published: 14 February 2026
(This article belongs to the Proceedings of The 3rd International Online Conference on Agriculture)

Abstract

Rapid urbanization and population growth demand sustainable food systems. This study investigated hydroponic vertical farming with LED lighting for Chinese kale (Brassica oleracea var. alboglabra), comparing white LEDs (WL), 20% red + 80% blue (20% RL: 80% BL), and 80% red + 20% blue (80% RL:20% BL). Plants grown under control conditions were assessed at weeks 2, 4, and 6. The 80% RL:20% BL treatment enhanced fresh weight, leaf area, root length, and biomass, while 20% RL:80% BL maximized chlorophyll, anthocyanin, and phenolics. Leaf number and quantum yield remained similar, though stress was evident. The findings of this research highlight red-dominant light for growth and blue-dominant light for phytochemical enrichment.

1. Introduction

Global population growth is projected to intensify substantially over the next five decades, reaching an estimated 9 billion by 2050 and escalating further to 11.2 billion by 2100 [1,2]. This demographic expansion is expected to place unprecedented pressure on global food systems, exacerbating challenges related to food security and environmental sustainability. Concurrently, more than 70% of arable land is already under agricultural use, a trend compounded by rapid rural-to-urban migration, urban infrastructure development, and progressive soil degradation [3]. These constraints underscore the urgent need for innovative agricultural strategies, among which hydroponic vertical farming systems (HVFS) have emerged as a promising solution for sustainable food production in densely populated urban environments [4].
Vertical farming represents a contemporary form of urban agriculture in which crop production is extended along the vertical axis, enabling cultivation in spatially constrained settings [5]. Hydroponic systems, which rely on nutrient-enriched aqueous media rather than soil, further enhance crop productivity by optimizing nutrient delivery and reducing environmental variability. The integration of hydroponics within vertical farming offers multiple advantages, including reduced water consumption, year-round production, minimal land requirements, lower occupational risks, reduced transportation demands, and diminished exposure to soil-borne pathogens [6]. Notably, HVFS can achieve substantially higher yields per unit area compared to conventional agriculture, thereby improving land-use efficiency [7].
Advancements in controlled environment agriculture (CEA) have further strengthened the potential of HVFS through the incorporation of artificial light-emitting diode (LED) technologies. LEDs provide precise spectral control, high photosynthetically active radiation (PAR) output, low radiant heat emission, and superior energy efficiency, making them an advantageous alternative to traditional fluorescent (FL) and high-intensity discharge (HID) lamps [8]. Within the visible spectrum, wavelengths between 400 and 700 nm constitute the PAR range essential for photosynthesis. Red (600–700 nm) and blue (400–500 nm) wavelengths, in particular, exhibit high quantum efficiency, and disruptions in these spectral regions can significantly reduce photosynthetic performance [4]. These wavelengths drive the excitation of key photosynthetic pigments, including chlorophylls, carotenoids, and xanthophylls, thereby sustaining plant metabolic activity [9].
According to the McCree action spectrum, chlorophyll exhibits maximal absorption peaks near 660 nm (red) and 450 nm (blue), reflecting the critical role of these wavelengths in photosynthetic efficiency [4]. Red LED light has been associated with enhanced biomass accumulation, stem elongation, and fruit development, whereas blue light promotes photosynthetic activity, phytochemical synthesis, and improved disease resistance [9]. The photosynthetic photon flux density (PPFD) of red and blue LEDs aligns closely with the absorption spectra of major plant photoreceptors, enabling modulation of photomorphogenic responses and other light-regulated developmental processes [10]. Six major classes of photoreceptors- phytochromes, rhodopsins, cryptochromes, phototropins, xanthopsins, and BLUF proteins mediate these responses.
Crop selection is a critical determinant of vertical farming success, particularly for high-value microgreens and herbs that align with contemporary consumer preferences [11]. Chinese kale (Brassica oleracea var. alboglabra), a widely cultivated Brassicaceae vegetable in South Asia and Southern China, represents a suitable candidate for HVFS [12]. Brassicaceous crops are valued for their rich phytochemical profiles, including glucosinolates, phenolics, carotenoids, vitamins, and dietary fiber, which contribute to their documented health benefits, such as reduced risk of cardiovascular disease, diabetes, and cancer [13]. Chinese kale, recognized by the American Cancer Society for its anticancer potential, accounted for 71 million metric tons of global production in 2019, with an anticipated annual growth rate of 2.1% from 2020 to 2025 [14]. Its adaptability to LED lighting and hydroponic cultivation further reinforces its suitability for vertical farming.
Previous studies have demonstrated that LED-based cultivation enhances physiological performance, photosynthetic efficiency, secondary metabolite accumulation, and overall crop quality in kale and related species [15]. Combinations of red and blue light often outperform monochromatic treatments, yielding greater biomass and improved phytochemical profiles [8]. For instance, reference [16] reported increased leaf fresh weight, plant height, and phytochemical accumulation in Chinese kale and Ocimum basilicum L. under mixed red–blue LED regimes. Similar trends have been observed in Chinese kale, with red light promoting shoot biomass and blue light enhancing phenolic content [17]. However, optimal spectral ratios appear to be species- and cultivar-specific, as demonstrated by differential phenolic responses in basil under red versus blue light [8]. These findings highlight the need for further research to determine species-appropriate LED spectral compositions.
The present study aims to investigate the effects of LED light treatments and hydroponic vertical farming systems on the growth performance and phytochemical accumulation of Chinese kale. The outcomes are expected to contribute to a deeper understanding of crop responses within controlled environment agriculture and to inform the optimization of HVFS for sustainable urban food production.

2. Materials and Methods

2.1. Experimental Site and Materials

The experiment was conducted from February to March 2022 in an indoor hydroponic vertical farming system located at Block C, Faculty of Science and Engineering, University of Nottingham Malaysia. Chinese kale seedlings, hydroponic fertilizers, and instruments (pH meter and EC meter; Vivosun, Ontario, CA, USA) were obtained from Tropicana Farm Damansara, Farm Factory, and the bioscience laboratory.

2.2. Lighting System and Experimental Design

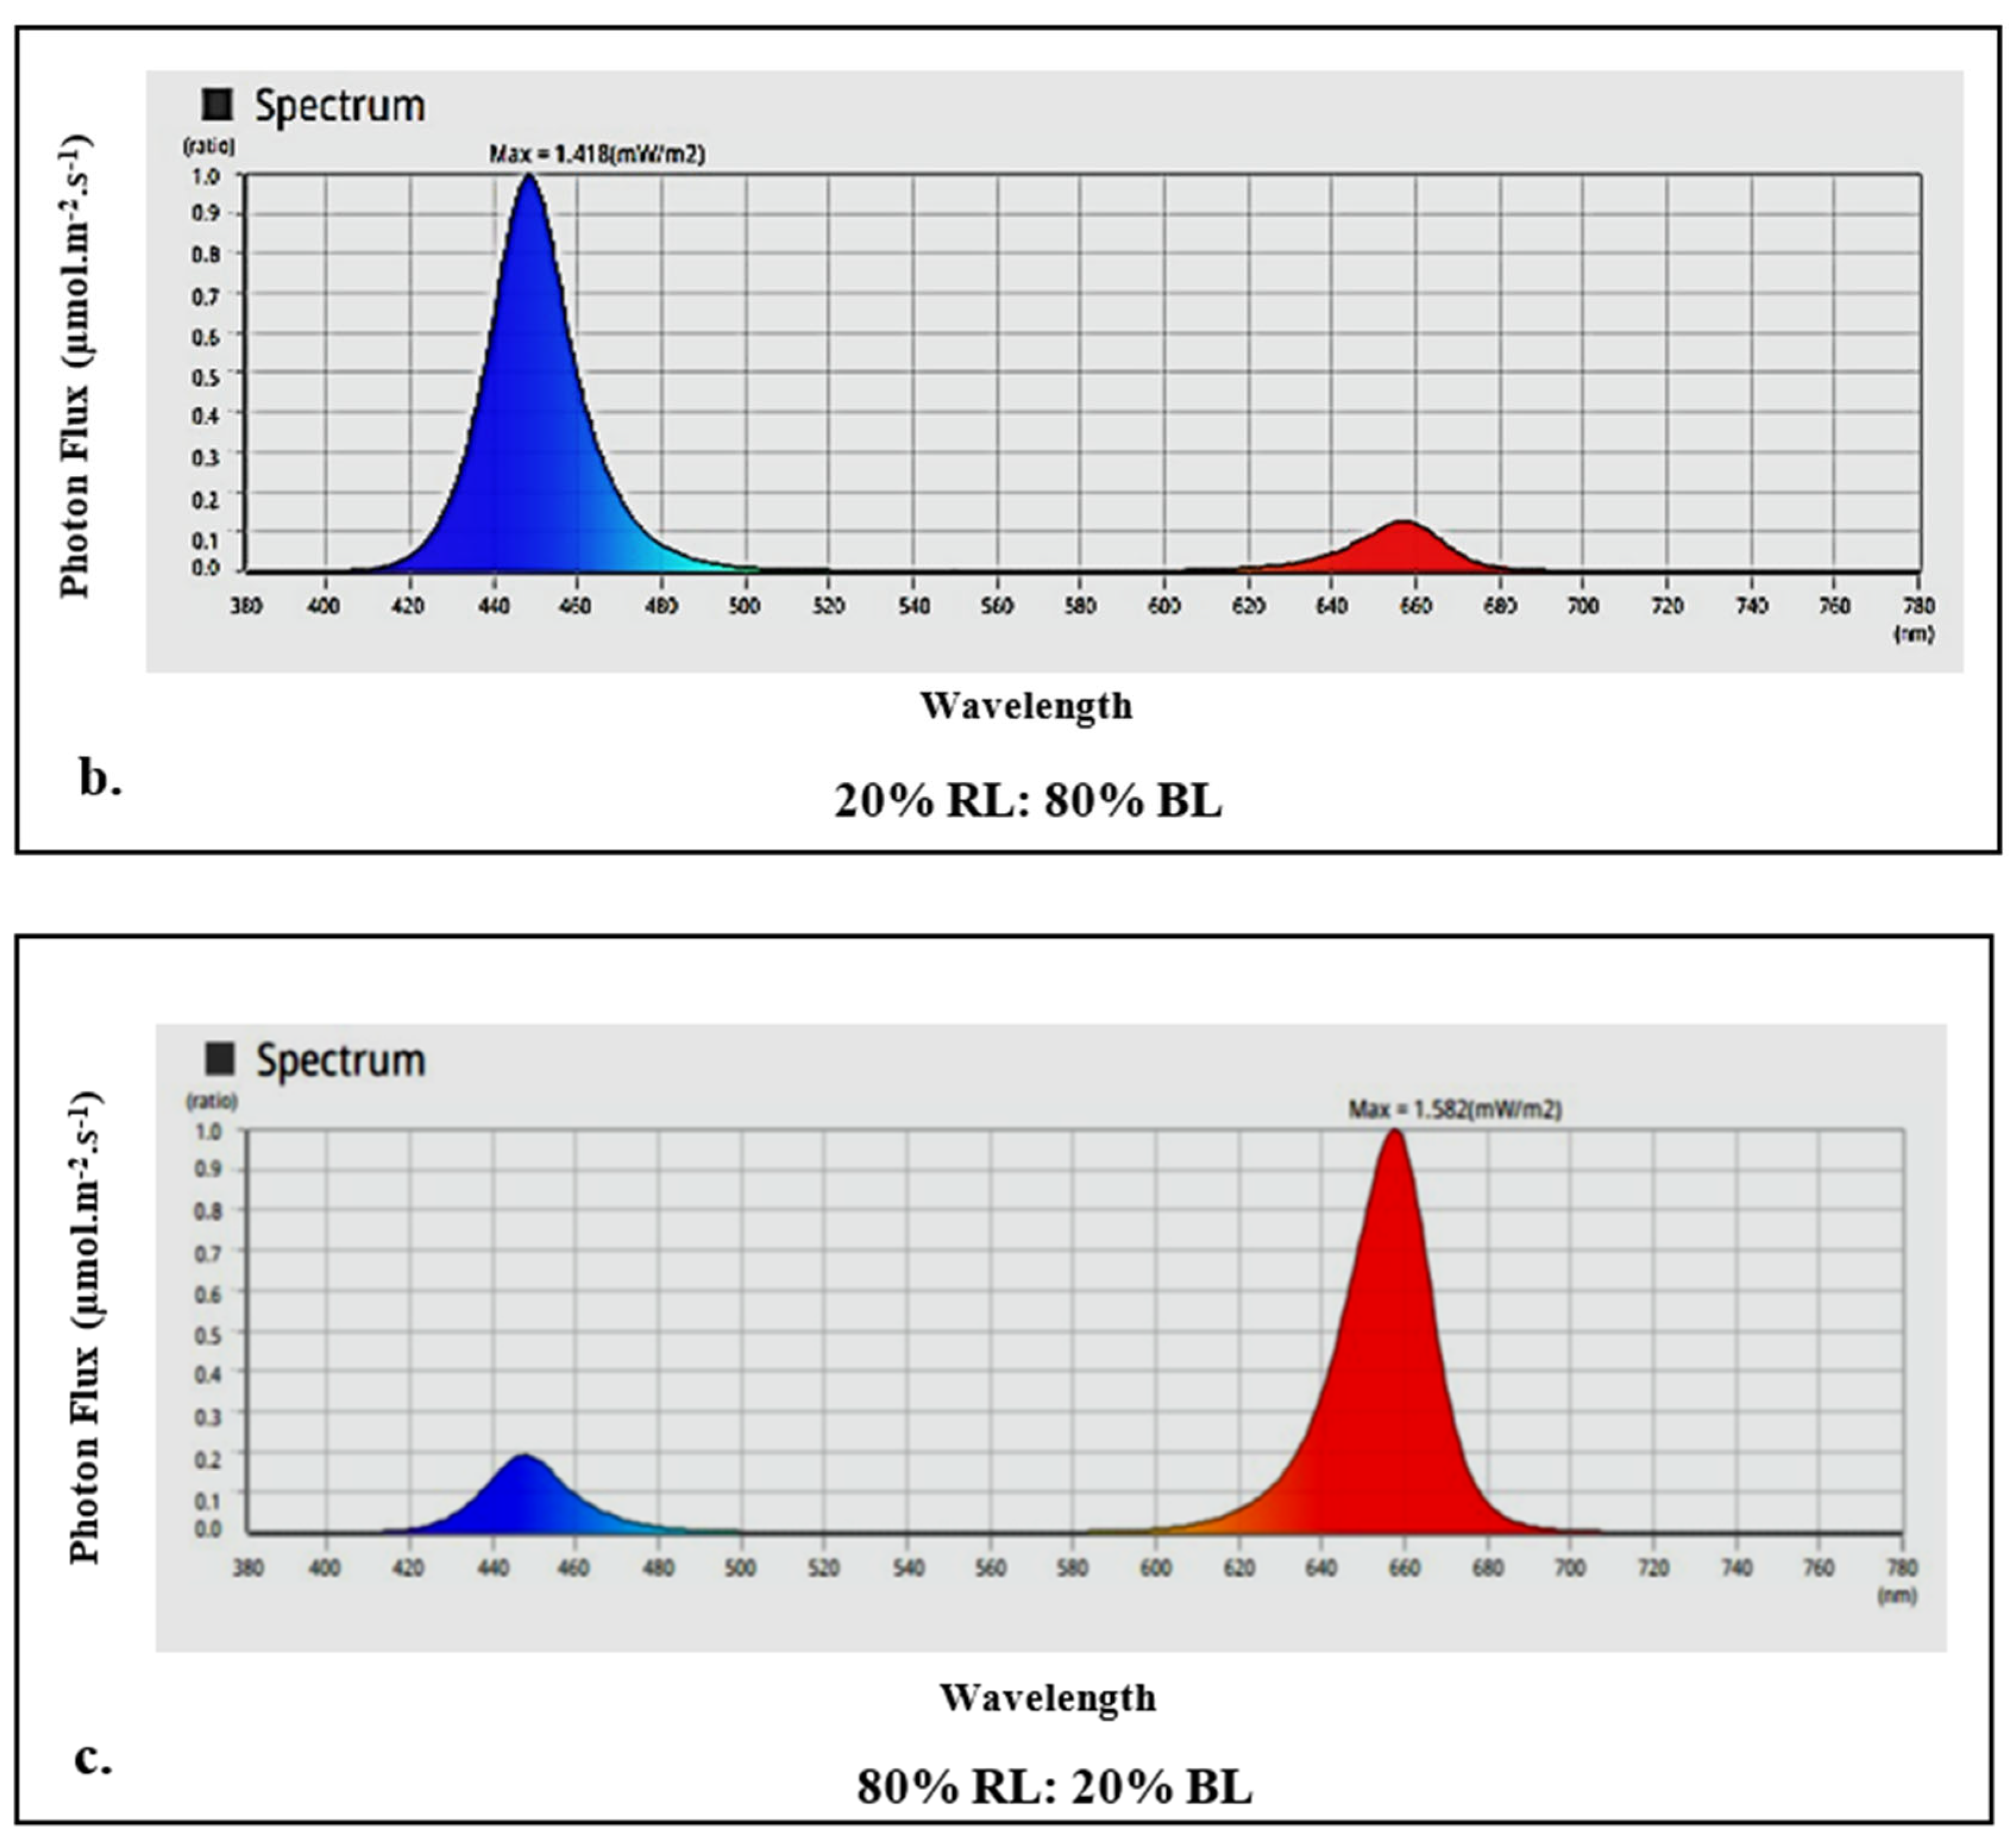
To evaluate LED light effects, three treatments were applied: (i) white light (WL; 400–700 nm) as the control, (ii) 20% red + 80% blue (20% RL:80% BL), and (iii) 80% red + 20% blue (80% RL:20% BL). Irradiance was quantified as photosynthetic photon flux density (PPFD) (Table 1), and emission spectra of all treatments are shown in Figure 1. The three LED treatments were assigned across the layers of the vertical grow stack, with light treatment considered a fixed factor. Within each layer, plant positions were randomized. Eighteen uniform plants were arranged per growing layer. At weeks 2, 4, and 6, three plants per light treatment were randomly selected for parameter measurements.

2.3. Nursery and Hydroponic Vertical Farming System Management

2.3.1. Nursery Management

Seeds of Chinese kale were sown into 65 pieces of urethane foam, with 2–3 seeds per piece, and germinated in plastic trays (15 cm × 20 cm × 8 cm) containing tap water under ambient conditions. Trays were watered daily to prevent desiccation. Seedlings were thinned at 7 days after sowing (DAS) to retain one healthy seedling per foam piece. On 12 DAS, 54 seedlings bearing one to two pairs of true leaves were transplanted into the vertical grow stack.

2.3.2. Hydroponic System Setup and Operation

A semi-closed nutrient film technique (NFT) hydroponic system integrated with the vertical farming structure was installed by the supplier at the University of Nottingham Malaysia. The hydroponic vertical farming system comprised stacked polyvinyl chloride (PVC) pipes/columns, pumps, and a reservoir tank at the lowest layer. Each layer was controlled by an automated timer connected to both the respective pump and the LED light (WL, 80% RL:20% BL, 20% RL:80% BL). A 12 h photoperiod (06:00–18:00) was maintained for all layers.
Hydroponic stock solutions were prepared by adding hydroponic fertilizer with an N–P–K formulation (fertilizer A) and calcium nitrate (fertilizer B) into separate high-density polyethylene (HDPE) jerrycans (25 L each). Twenty liters of tap water (electrical conductivity, EC = 0.26 dS·m−1) were added to each jerrycan, and the solutions were thoroughly mixed. The final EC values of the stock solutions were 5.45 dS·m−1 (fertilizer A) and 5.23 dS·m−1 (fertilizer B).
Prior to transplantation, 50 mL of fertilizer A (EC = 5.45 dS·m−1) and 50 mL of fertilizer B (EC = 5.23 dS·m−1) were added to the reservoir tank together with 70 L of tap water (EC = 0.26 dS·m−1). Seedlings (n = 54) embedded in their foam supports were placed into net pots (56 mm × 39 mm × 58 mm) and maintained at room temperature. Nutrient solution EC in the reservoir was monitored and adjusted weekly to target values of 2.0 ± 0.1 dS·m−1 (week 2), 2.5 ± 0.1 dS·m−1 (week 4), and 3.0 ± 0.1 dS·m−1 (week 6); measured EC values were 2.12, 2.63, and 2.89 dS·m−1, respectively. The solution pH was maintained between 5.5 and 6.5 by the addition of sodium hydroxide (NaOH) as required. At weeks 2, 4, and 6, three plant samples were randomly selected from each light treatment for subsequent measurements.

2.4. Parameter Measurements

2.4.1. Plant Fresh Weight, Dry Weight, and Leaf Area

At weeks 2, 4, and 6 (corresponding to 26, 40, and 54 DAS), shoots from randomly selected plants were weighed for fresh mass using an electronic scale (GF-61000, A&D Ltd., Tokyo, Japan). Samples were then oven-dried at 40 °C for one week to determine dry mass. Total leaf area was measured by excising leaves at the petiole and quantifying area using a leaf area meter (LI-3100, LI-COR Inc., Lincoln, NE, USA) in the CEPB room.

2.4.2. Quantum Yield

Healthy leaves from each treatment were dark-adapted for 30 min using aluminum foil at weeks 2, 4, and 6 (26, 40, and 54 DAS). The maximum quantum yield of PSII ( F v / F m ) was recorded using a modulated fluorometer (FluorPen FP 100, Photon Systems Instruments, Drásov, Czech Republic).

2.4.3. Anthocyanin and Chlorophyll Content

Anthocyanin content was measured non-destructively on intact leaves using a portable anthocyanin meter (ACM-200, Opti-Sciences Inc., Hudson, NH, USA). Three positions per leaf were measured, and the mean value was calculated for each sample. Chlorophyll content was determined using a handheld chlorophyll meter (SPAD-502, Konica Minolta, Tokyo, Japan). The sensor was clamped on leaves at comparable canopy height, and SPAD values were recorded.

2.4.4. Total Phenolic Content

For extraction, 0.2 g of dried Chinese kale leaves were ground (with liquid nitrogen to aid pulverization) and homogenized with 2 mL of 30% ethanol (v/v). The homogenate was diluted with water to a total volume of 6 mL and incubated in the dark at 80 °C for 1 h. Samples were centrifuged (Eppendorf 5810-R, Hamburg, Germany) at 10,000 rpm (≈9400× g) and 20 °C for 10 min. Supernatants were stored at 5 °C in a microbial cold room until analysis.
Total phenolic content (TPC) was quantified by the Folin–Ciocalteu colorimetric assay following modifications of Qian et al. [18]. Briefly, 50 µL of extract was mixed with 50 µL of 0.2 M Folin–Ciocalteu reagent in an Eppendorf tube. After 3 min at room temperature, 100 µL of 7.5% (w/v) aqueous sodium bicarbonate (NaHCO3) was added, and the mixture was incubated for 1 h at room temperature. Aliquots (200 µL per sample) were transferred to a flat-bottom 96-well microplate and read at 760 nm using a microplate reader (VersaMax™, Molecular Devices, San Jose, CA, USA) with distilled water as the blank. Results were expressed as milligrams of gallic acid equivalents per gram of extract (mg GAE·g−1) based on a gallic acid standard curve.

2.5. Statistical Analysis

All measurements were performed in triplicate. Data were analyzed using one-way analysis of variance (ANOVA) in IBM SPSS Statistics 28.0 (Chicago, IL, USA). Mean separation was conducted using Tukey’s HSD test at p < 0.05 . Pearson correlation (two-tailed) was used to assess relationships between measured parameters

3. Results and Discussion

3.1. Fresh Weight and Dry Weight

According to our results, in weeks 4 and 6, the growth characteristics of Chinese kale in terms of fresh weight (FW) and dry weight (DW) were significantly (p < 0.05) affected by the supplementation of different LED light treatments (Table 2). Throughout this study, the shoot FW and DW of Chinese kale increased with an increasing percentage of red light. The FW and DW under 80%RL: 20%BL Chinese kale was higher than that of 20% RL: 80% BL and WL. Where the FW and DW of 80% RL: 20% BL at week 6 was ≈ 1.5-time higher than the control WL. Notably, the FW of Chinese kale under 20% RL: 80% BL at weeks 2 and 4 were similar to WL, but it was heavier than WL at week 6.
It is generally acknowledged that FW can be a useful parameter in evaluating crop yield results and DW can provide an accurate measurement of biomass that eliminates water content fluctuation [19]. LED light with different color ratio possesses a positive relationship with Chinese kale [20]. Such that in our study, 80%RL: 20%BL has shown to be the most prominent light treatment for FW and DW accumulation in Chinese kale. These results were aligned with various crops such as pak choi (Brassica rapa subsp. Chinensis) under 77% RL: 23% BL with the highest FW and DW, followed by 73% RL: 27% BL [21] and herb plant such as coriander under mix ratio of red–blue light (RB) (19:1) were shown to have 1.3- and 1.4-times higher FW and DW respectively compared to those using 100% red LED [22].
This indicates that red light can be better absorbed by chlorophylls and promote photosynthesis than the other light wavelengths in the visible spectrum. In this respect, red light matches the absorbance area of chlorophyll present in chloroplasts and can be perceived by phytochrome photoreceptors for growth development and biomass accumulation in plants. Activated phytochrome is shown to induce plastid development, stem elongation, and gene expression in the nucleus [23]. Enhancing red light can also stimulate photophosphorylation in guard cells to produce the energy required to open up the stomata and induce carbon dioxide (CO2) absorption into the intercellular space, eventually improving the photosynthetic ability that directly led to the promotion of biomass [23]. Blue light (BL) enhances ribulose-1,5-bisphosphate carboxylase/oxygenase (RuBisCO) activity and modifies spongy parenchyma and palisade mesophyll organization, thereby improving photosynthetic efficiency [24]. Hence, this suggests that Chinese kale grown under both 20% RL: 80% BL and 80% RL: 20% BL with higher FW and DW can be due to the enhancement in photosynthesis capacity or efficiency. On the other hand, the low FW and DW of Chinese kale grown under WL might be due to dilution, as white light consists of low-efficiency wavelengths and reduced red–blue light intensities that can affect the net photosynthesis [25].
However, it is also of interest that lettuce has a higher shoot–root DW and FW under red–blue–white (RBW) LED light treatment compared to RB light [26] and a slight increase in plant biomass under 90%RL: 10%GL [27]. These results probably imply that specific light apart from blue and red can be quite effective in enhancing plant biomass and growth, where further analysis is required to explore these findings.

3.2. Leaf Area

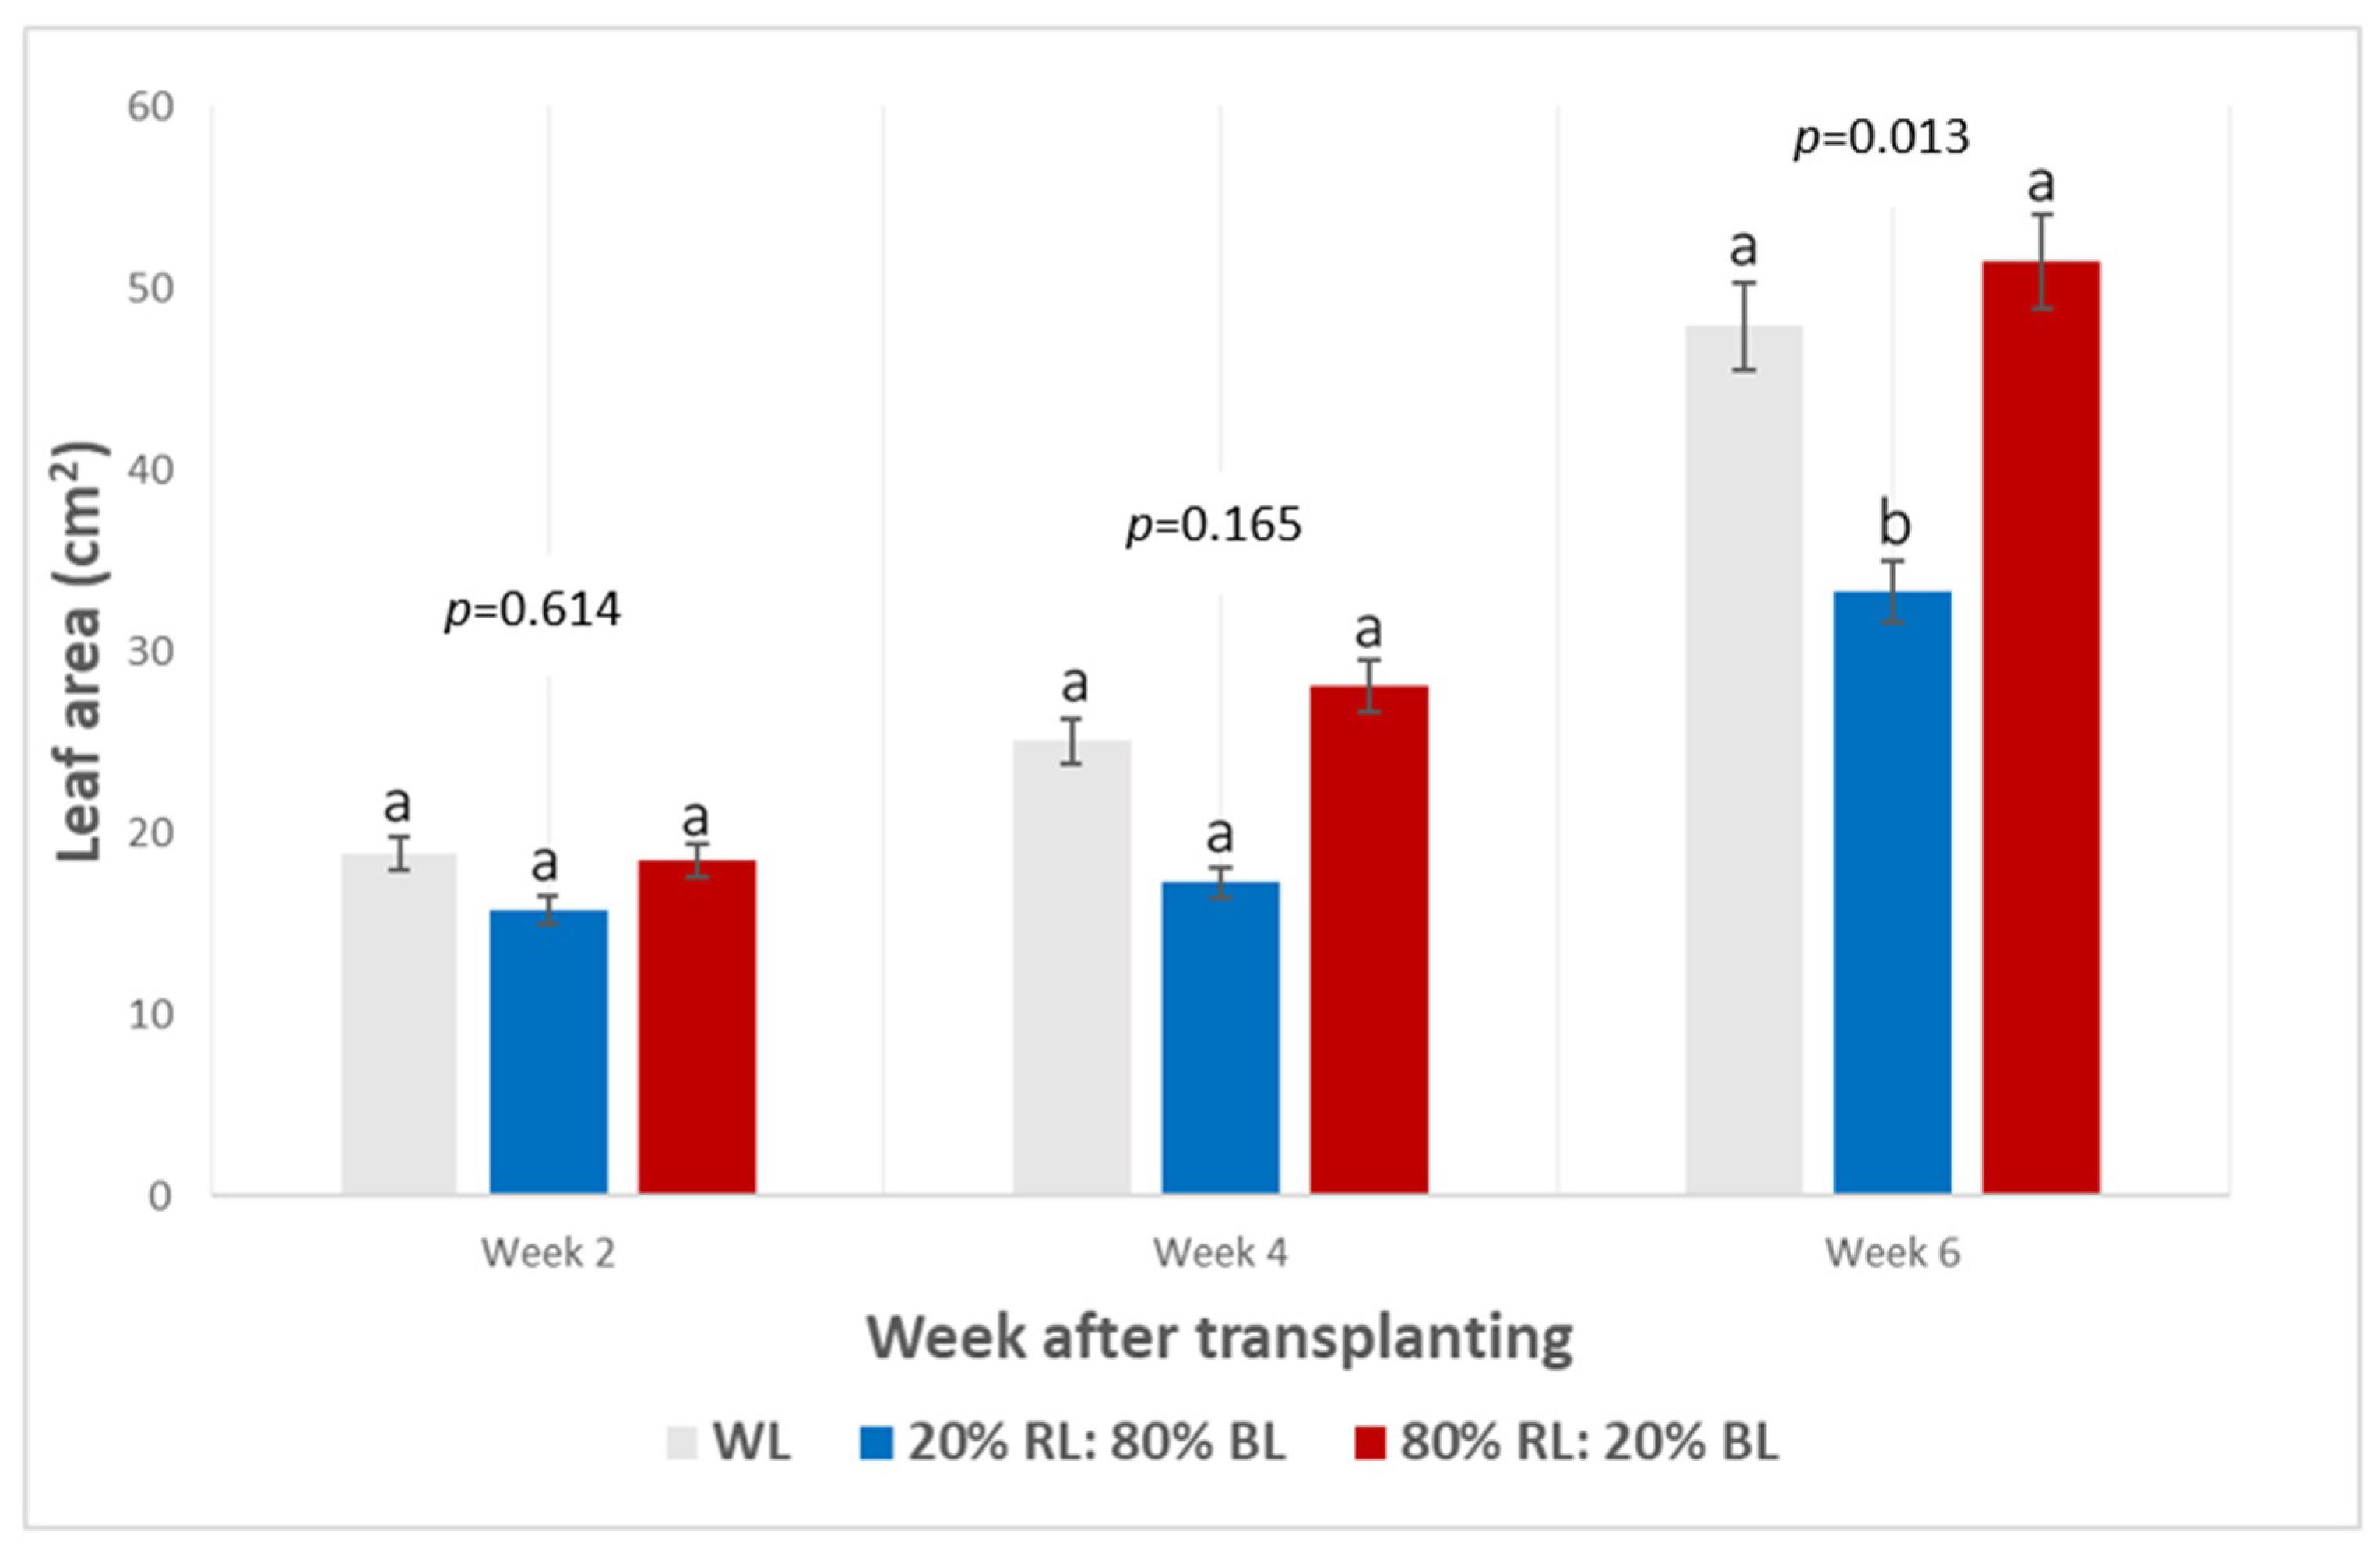
Figure 2 shows the impact of LED light on the leaf area per plant. Leaf area is an important indicator for plant productivity; it determines the total amount of light that can be perceived by the plant [28]. Current findings showed that red-rich light spectra have a positive impact on regulating plants’ LA by maximizing the photosynthetic rate and leaf expansion stimulation [29,30]. RL matches the assimilation peak of phytochrome photoreceptor and chlorophylls, causing a greater improvement in efficiency [30]. Whereas BL wavelength can cause the overstimulation of cryptochrome photoreceptor and contribute to reducing LA, which would decrease the light capture ability and growth quality [29,31]. Similar results can be seen in wheat, lettuce, and soybean with decreased LA over a 75% fraction of BL [32,33]. Moreover, rapid increased LA under WL can be deduced as shade avoidance syndrome, it can be explained by either a low R: FR ratio or green light that elucidates phytochrome for shade avoidance response and allows the expansion of leaves at the uppermost layer (Figure 2) [31]. However, several findings also mentioned that cucumber seedlings and lettuce plants under monochromatic RB light and WL had 56–87% more LA than plants in 80%RL: 20%BL and 20% RL: 80% BL, thus indicating that different light conditions might affect plants differently, which would require further study to determine it [31,34].

3.3. Quantum Yield

There was no significant chlorophyll fluorescence (Fv/Fm) difference between the three LED light treatments (p > 0.05) (Table 3). The highest and lowest quantum yield (QY) efficiency of photosystem II (ΦPSII) were observed under WL and 80% RL: 20% BL, respectively, during week 6.
Chlorophyll fluorescence (Fv/Fm) measures the maximal photochemical and operating efficiency of photosystem II [1,23]. Which is a stress indicator that determines whether a plant is in a distress condition [23]. According to Maxwell and Johnson [35], most of the healthy plant species will have an optimal value around 0.83, and values lower than this can be seen when exposed to stress. This suggested that all three LED treatments used in this study disturb the photochemical process and photosynthetic capability of chlorophyll in PSII, and a common postulation of low QY is the malfunction of photosynthetic machinery [23,36]. It was known that under excess light treatment, PSII center can be subjected to photoinhibition when there is too much reduced electron present leading to a transient backlog in excitation energy with the stimulation of singlet oxygen that can cause substantial damage to the cellular components [36]. Another possibility of low QY is the decrease in efficiency of excitation capture in PSII, where photo-protective mechanisms in terms of non-photochemical quenching (NPQ) dissipate the excess excitation energy into heat [36,37]. Such dissipation can cause the over-reduction of excitation energy present in PSII, thus reducing the photosynthesis efficiency [36].
Through our study, it was discerned that the proportion of RL might have exerted pressure on the Chinese kale. This was supported by previous investigations [1,17,23,38,39], which showed that lettuce, sweet basil, and kale plants grown under RL and 80%RL: 20%BL had a lower QY compared to WL and 20%RL: 80%BL treatment, indicating that was stress was exerted on the photosynthetic machinery. However, some studies indicated that cucumber leaves under 70%RL: 30%BL can result in increased chlorophyll fluorescence efficiency and QY [40,41]. This suggested that stress adaptation and acclimation for each plant might be different and vary between species. As suggested by Hogewoning et al. [38], the distance between LEDs light and the plants’ pot column can increase slightly to prevent any stress exertion on the Chinese kale.

3.4. Chlorophyll Content

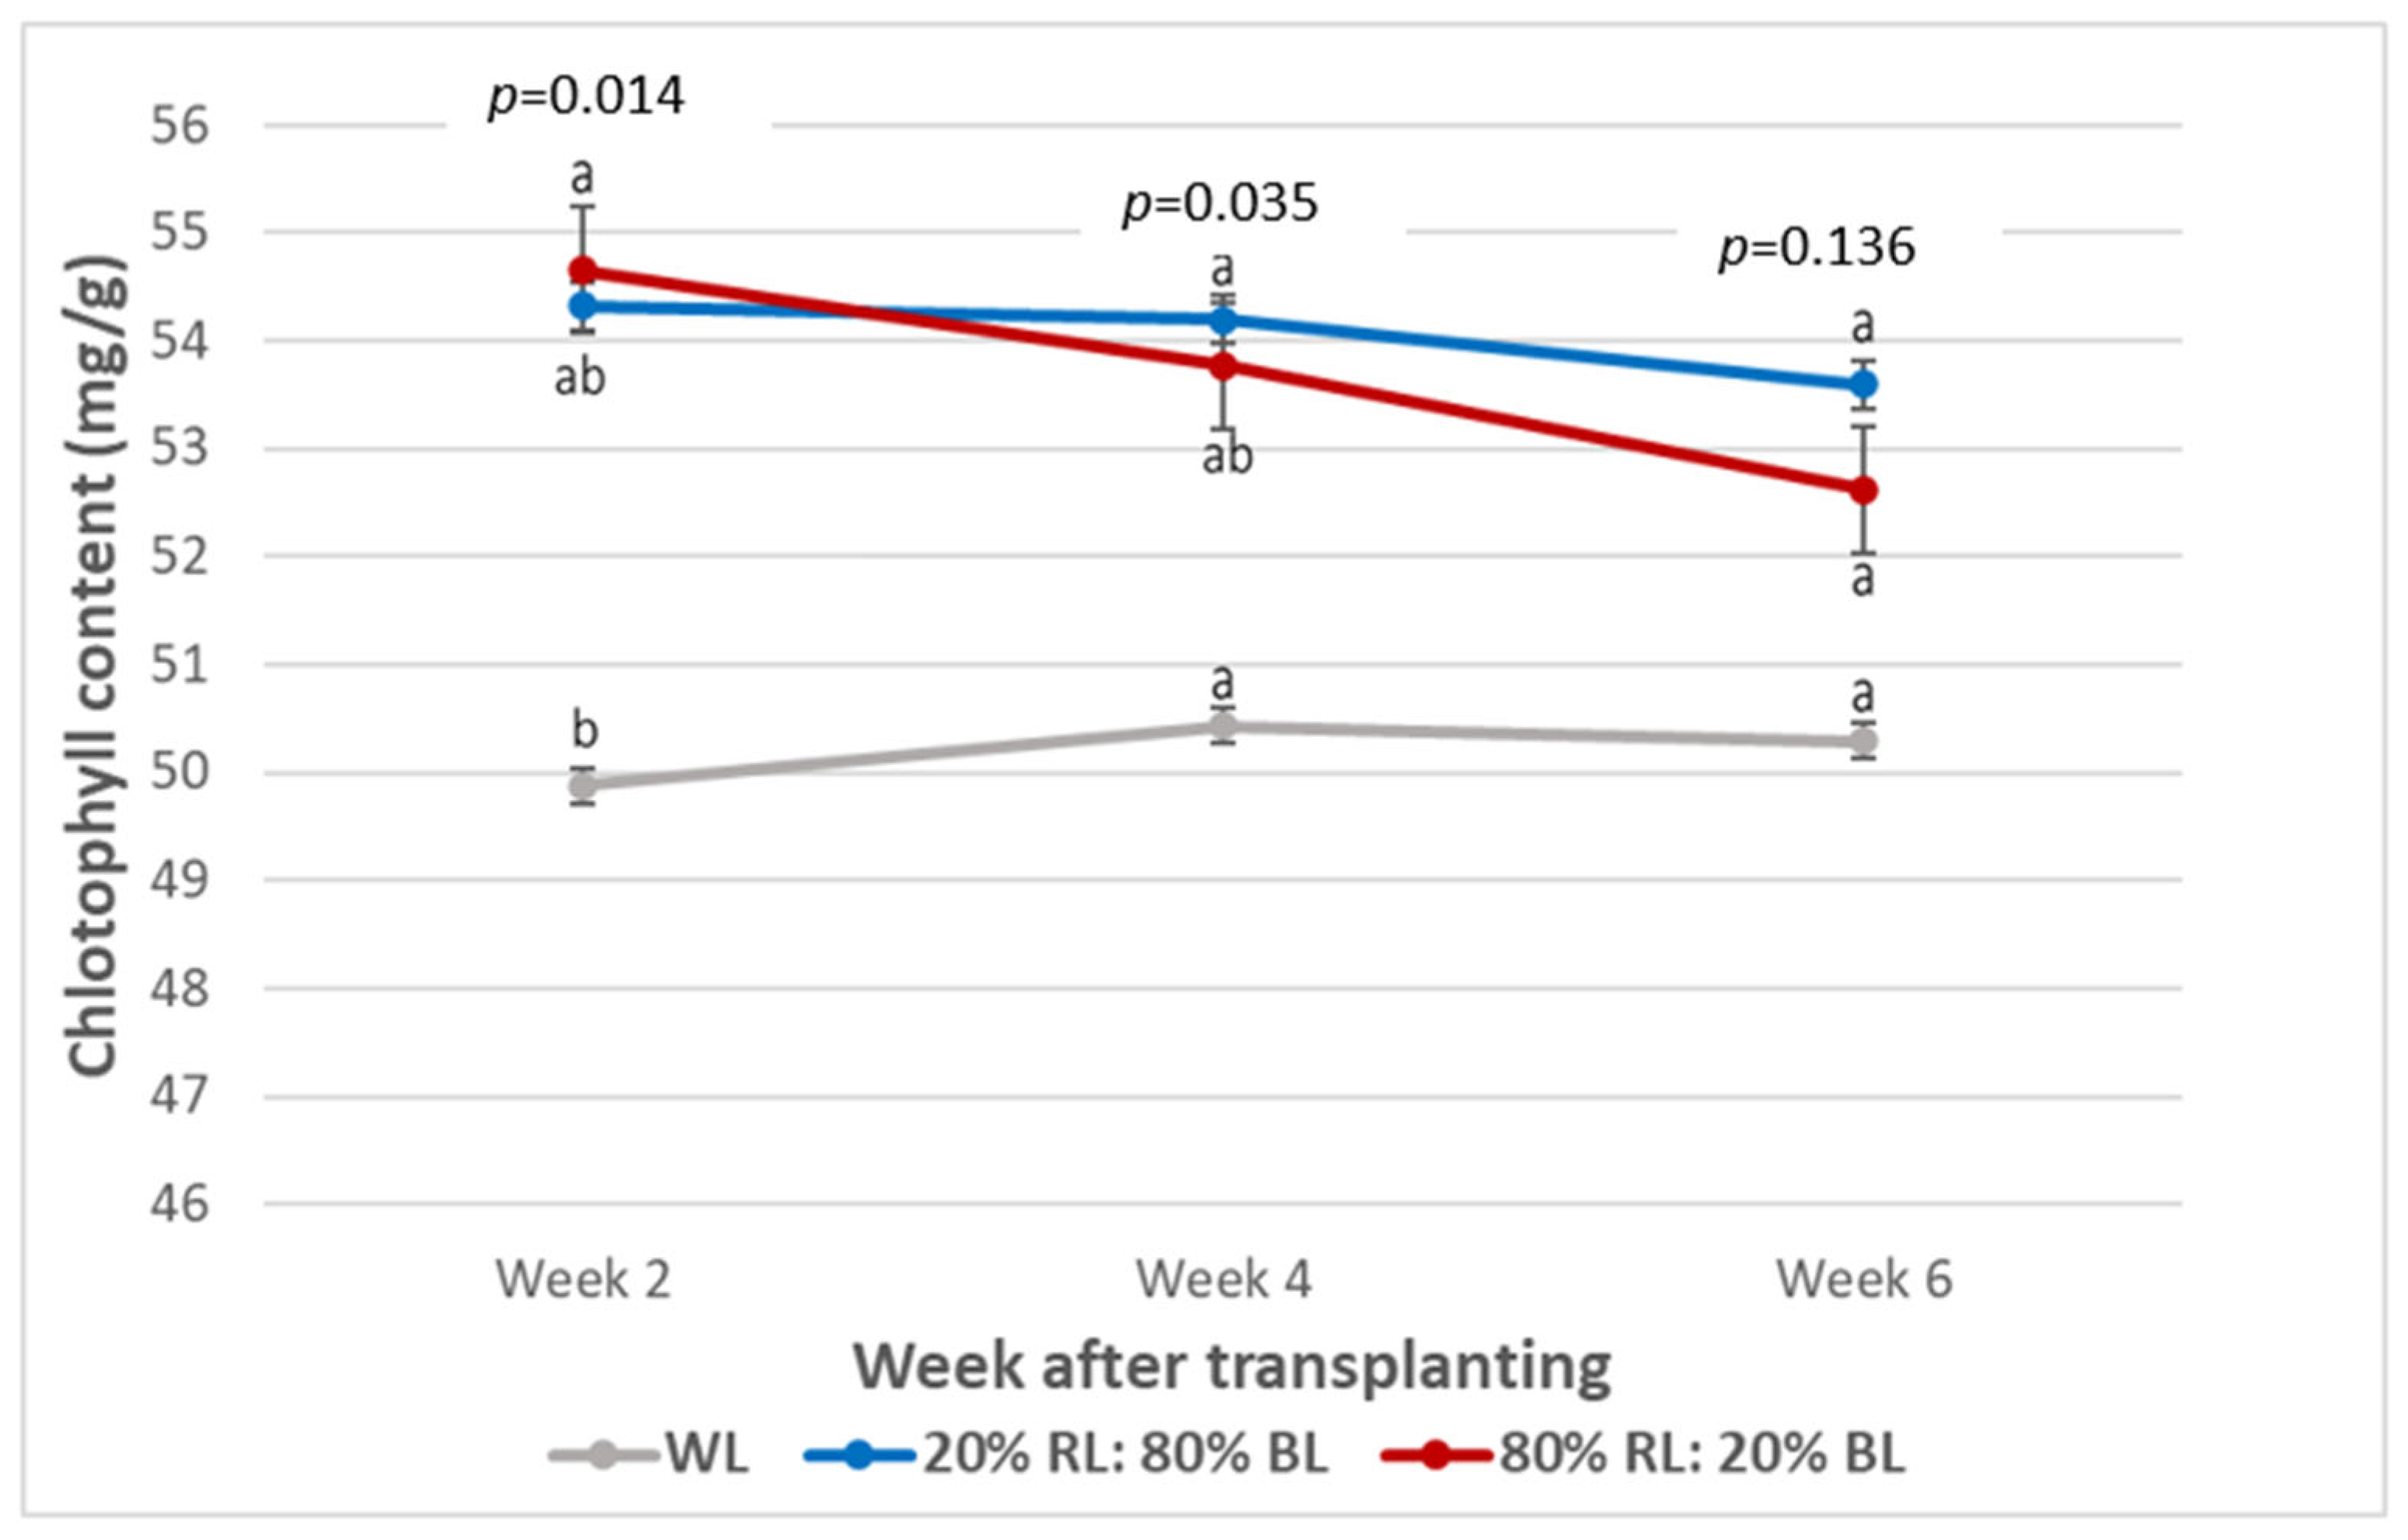
The light treatments affected Chlorophyll content (Chl) significantly at the early stage (p < 0.05) (Figure 3), and in this respect, a constant decline trend in Chl was evident from week 2 onward, with the highest value found in the 20%RL: 80%BL treatment. Interestingly, the Chl content of Chinese kale under WL treatment showed an upward surge from week 2 to 4, but reduced since week 4.
Thus, inferring that BL is more effective in the induction of Chl biosynthesis [13,42]. Similar results were obtained from cucumber and lettuce, with the highest Chl content maintained under 25%RL; 75%BL and 41%RL; 59%BL, respectively [23,43,44]. In our study, the Chl of Chinese kale under the three light treatments showed a consistent drop; this might indicate that either the plants are using Chl more efficiently or already achieving their maximum growth stage at week 4 [26]. As reported, plants with reduced Chl content seem to use Chl more efficiently in controlling growth rate [26]. Furthermore, Chinese kale can reach its harvesting period around week 6 at 60 DAS, where accelerated senescence of mature leaves indicates the loss in protein and chlorophyll content as the ageing process [45]. Notably, Chl content under 20% RL: 80% BL has a slower degradation rate than the other light treatments. It can be deduced that a higher BL proportion can prolong the irradiation time and retard the degradation of Chl [46]. Some studies also indicated that tobacco (Nicotiana tabacum. L.) and lettuce seedlings treated with monochromatic RL and 80% RL: 20% BL can have a higher Chl content, thus revealing that cultivar species can have different responses to RB light treatments [23,27,42].

3.5. Anthocyanin Content

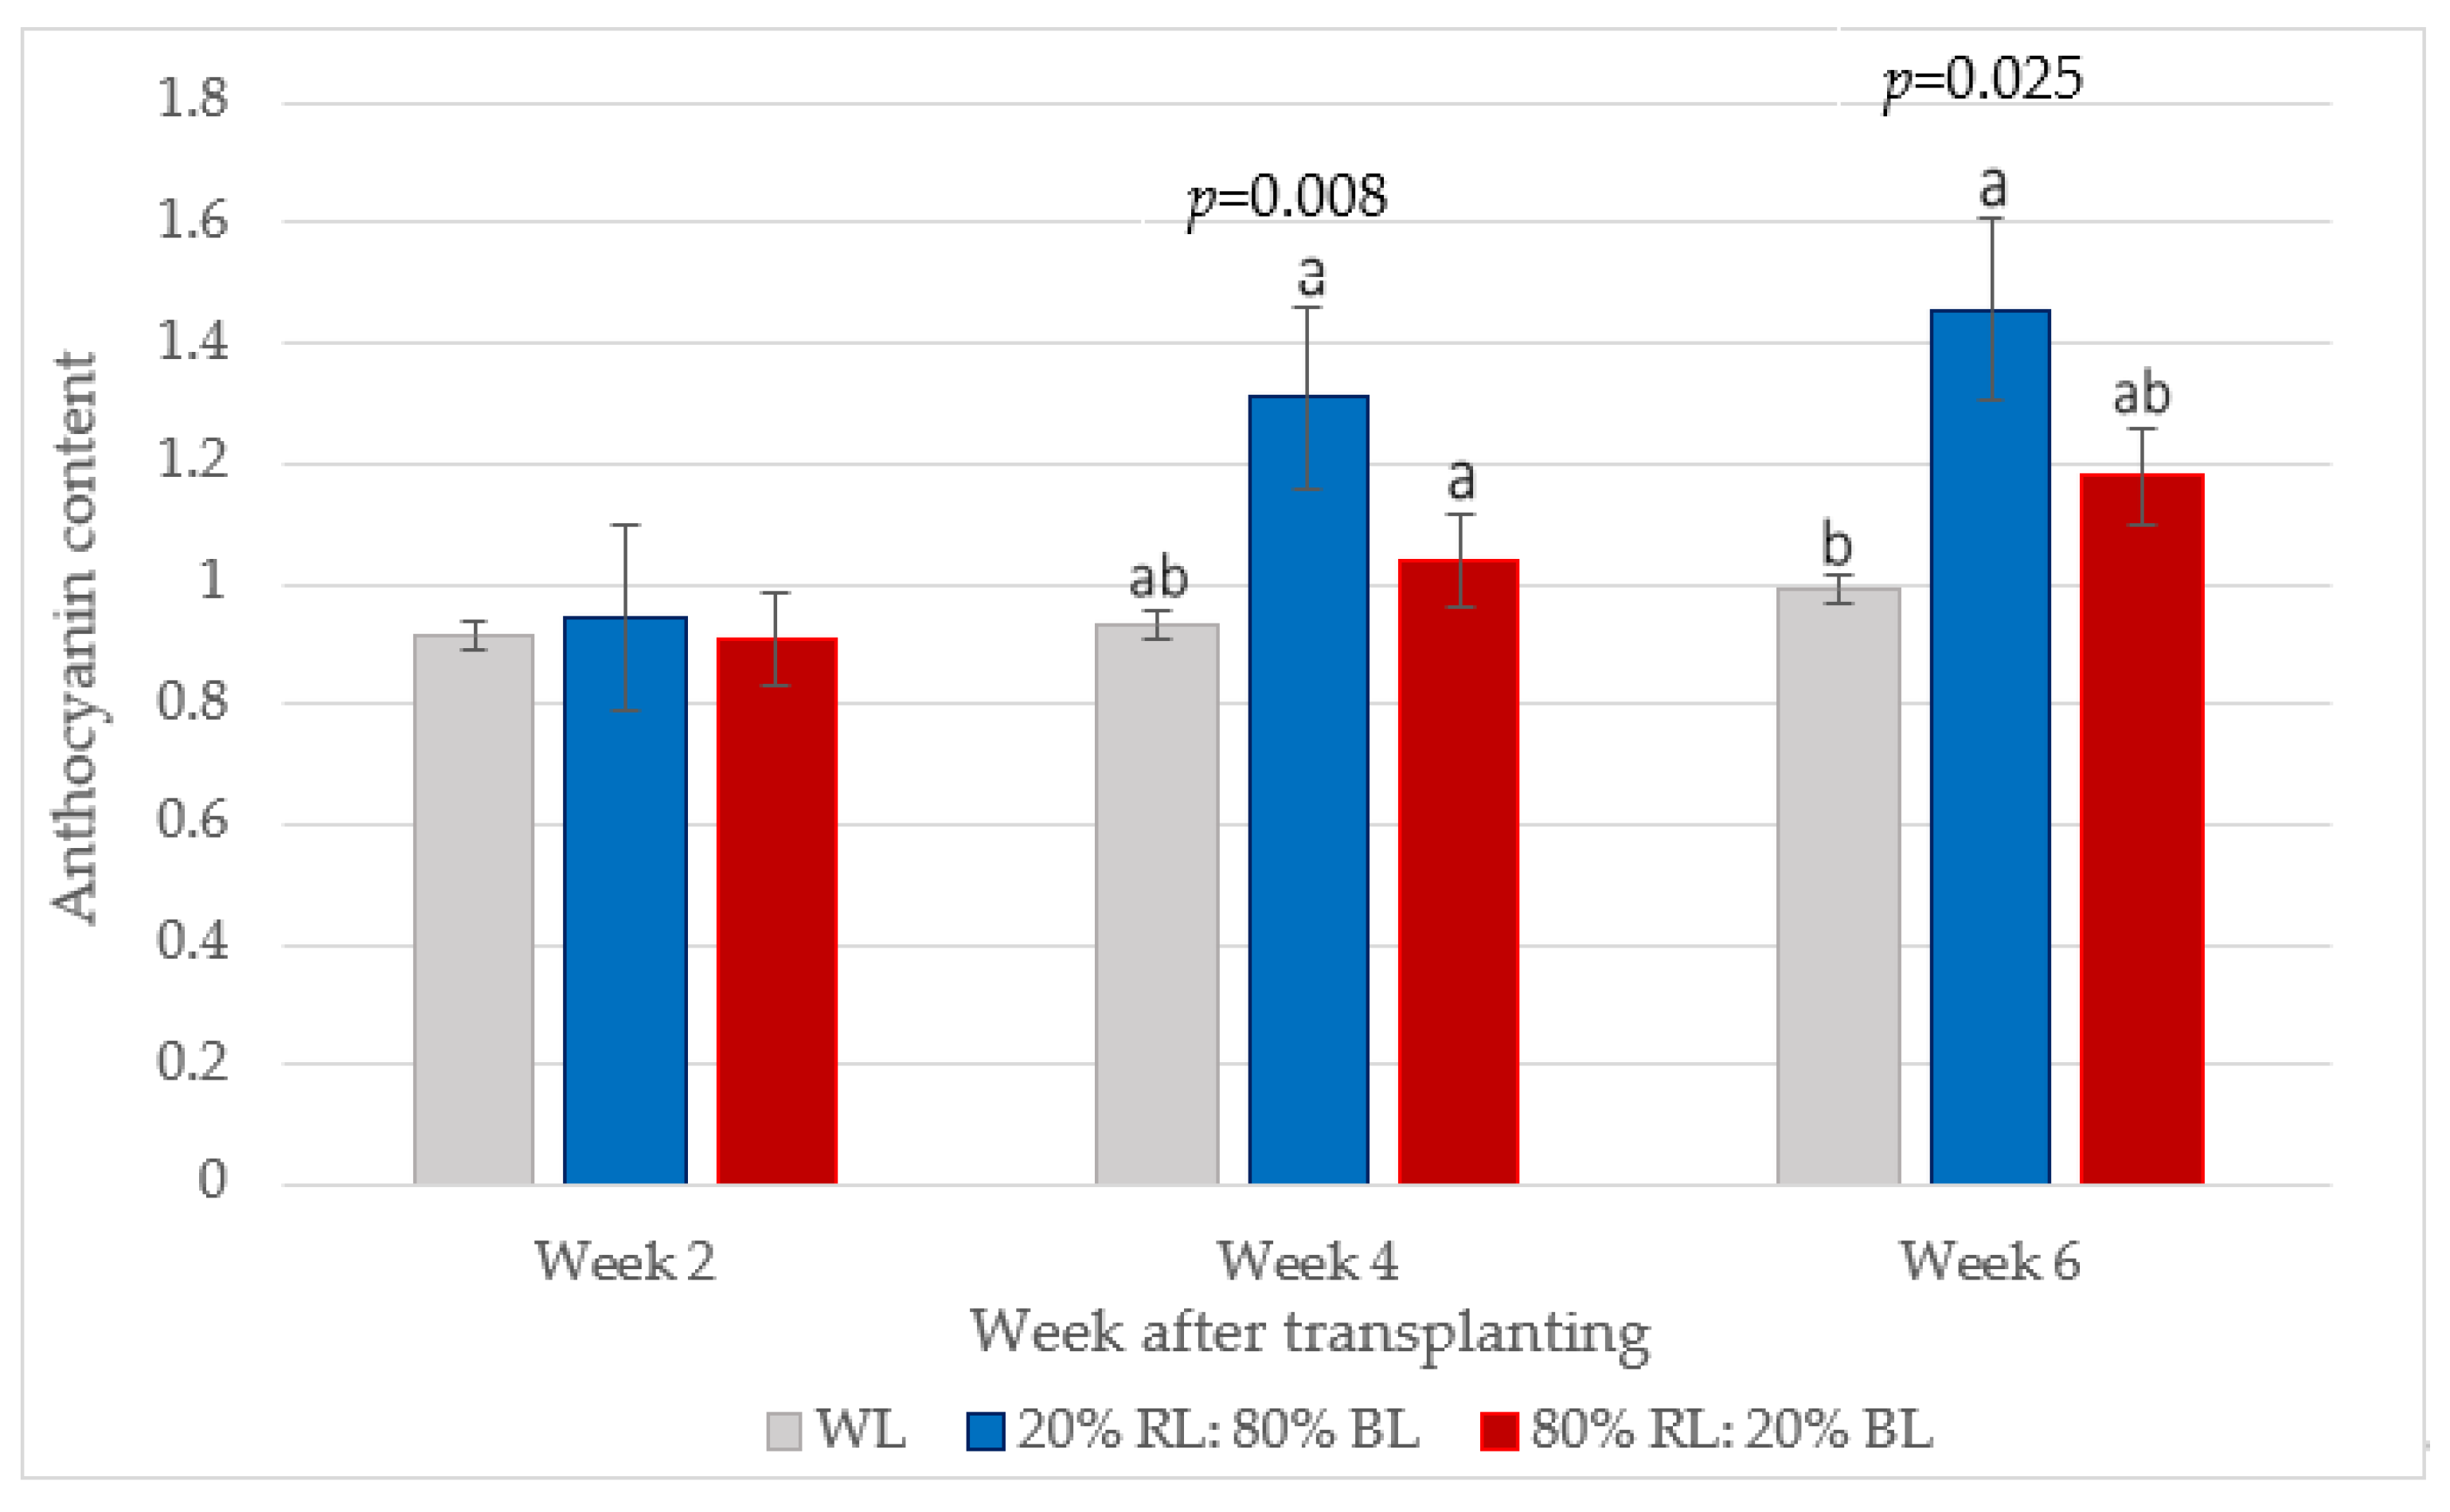
In our study, the anthocyanin content of Chinese kale was significantly affected by the light treatments at weeks 4 and 6 (p < 0.05) (Figure 4). RB light showed a prominent accumulation of anthocyanin content, and particularly, 20%RL: 80%BL elicited the highest anthocyanin content, and WL had the lowest anthocyanin content.
Anthocyanin is a vacuolar phytochemical pigment responsible for violet or red–blue pigment in plants. It’s an excellent antioxidant with diverse physiological abilities to prevent hypertension, liver disorders, and urinary problems [47]. According to [48], exposure to BL and RL can increase the content of anthocyanin significantly. Where the highest anthocyanin accumulation can be seen in Chinese kale, lettuce, and buckwheat with 30% BL: 60% RL, 80% BL: 20% RL, and 50% BL: 50% RL treatment, respectively [13,31,49]. A previously reported study showed a similar result to our experiment, with BL as the most efficient wavelength in the regulation of anthocyanin biosynthesis [13]. BL was able to perceive by cryptochrome 1 and promote downstream gene expressions such as DFR (dihydroflavonol-4-reductase), PAL (phenylalanine ammonium lyase), and CHS (chalcone synthesis) that lead to higher anthocyanin accumulation [13,31,50]. This could then explain the higher anthocyanin content present in the 20%RL: 80%BL treatment compared to the WL treatment. Notably, the lower anthocyanin content present in WL treatment can be due to GL and FR light [31,47].
When cryptochrome-dependent GL is simultaneously delivered with BL, it can reverse the blue light-induced effect on anthocyanin accumulation [51,52]. Moreover, anthocyanin content is directly correlated to the amount of active phytochrome (Pfr), thus the lower R: FR present in WL can reduce Pfr and eventually anthocyanin accumulation [31]. Interestingly, RBW light was also reported to have the highest total anthocyanin concentration in Perilla frutescens, indicating that anthocyanin biosynthesis might be dependent on species that could incorporate more alternative light treatments in our future study [53,54].

3.6. Total Phenolic Content

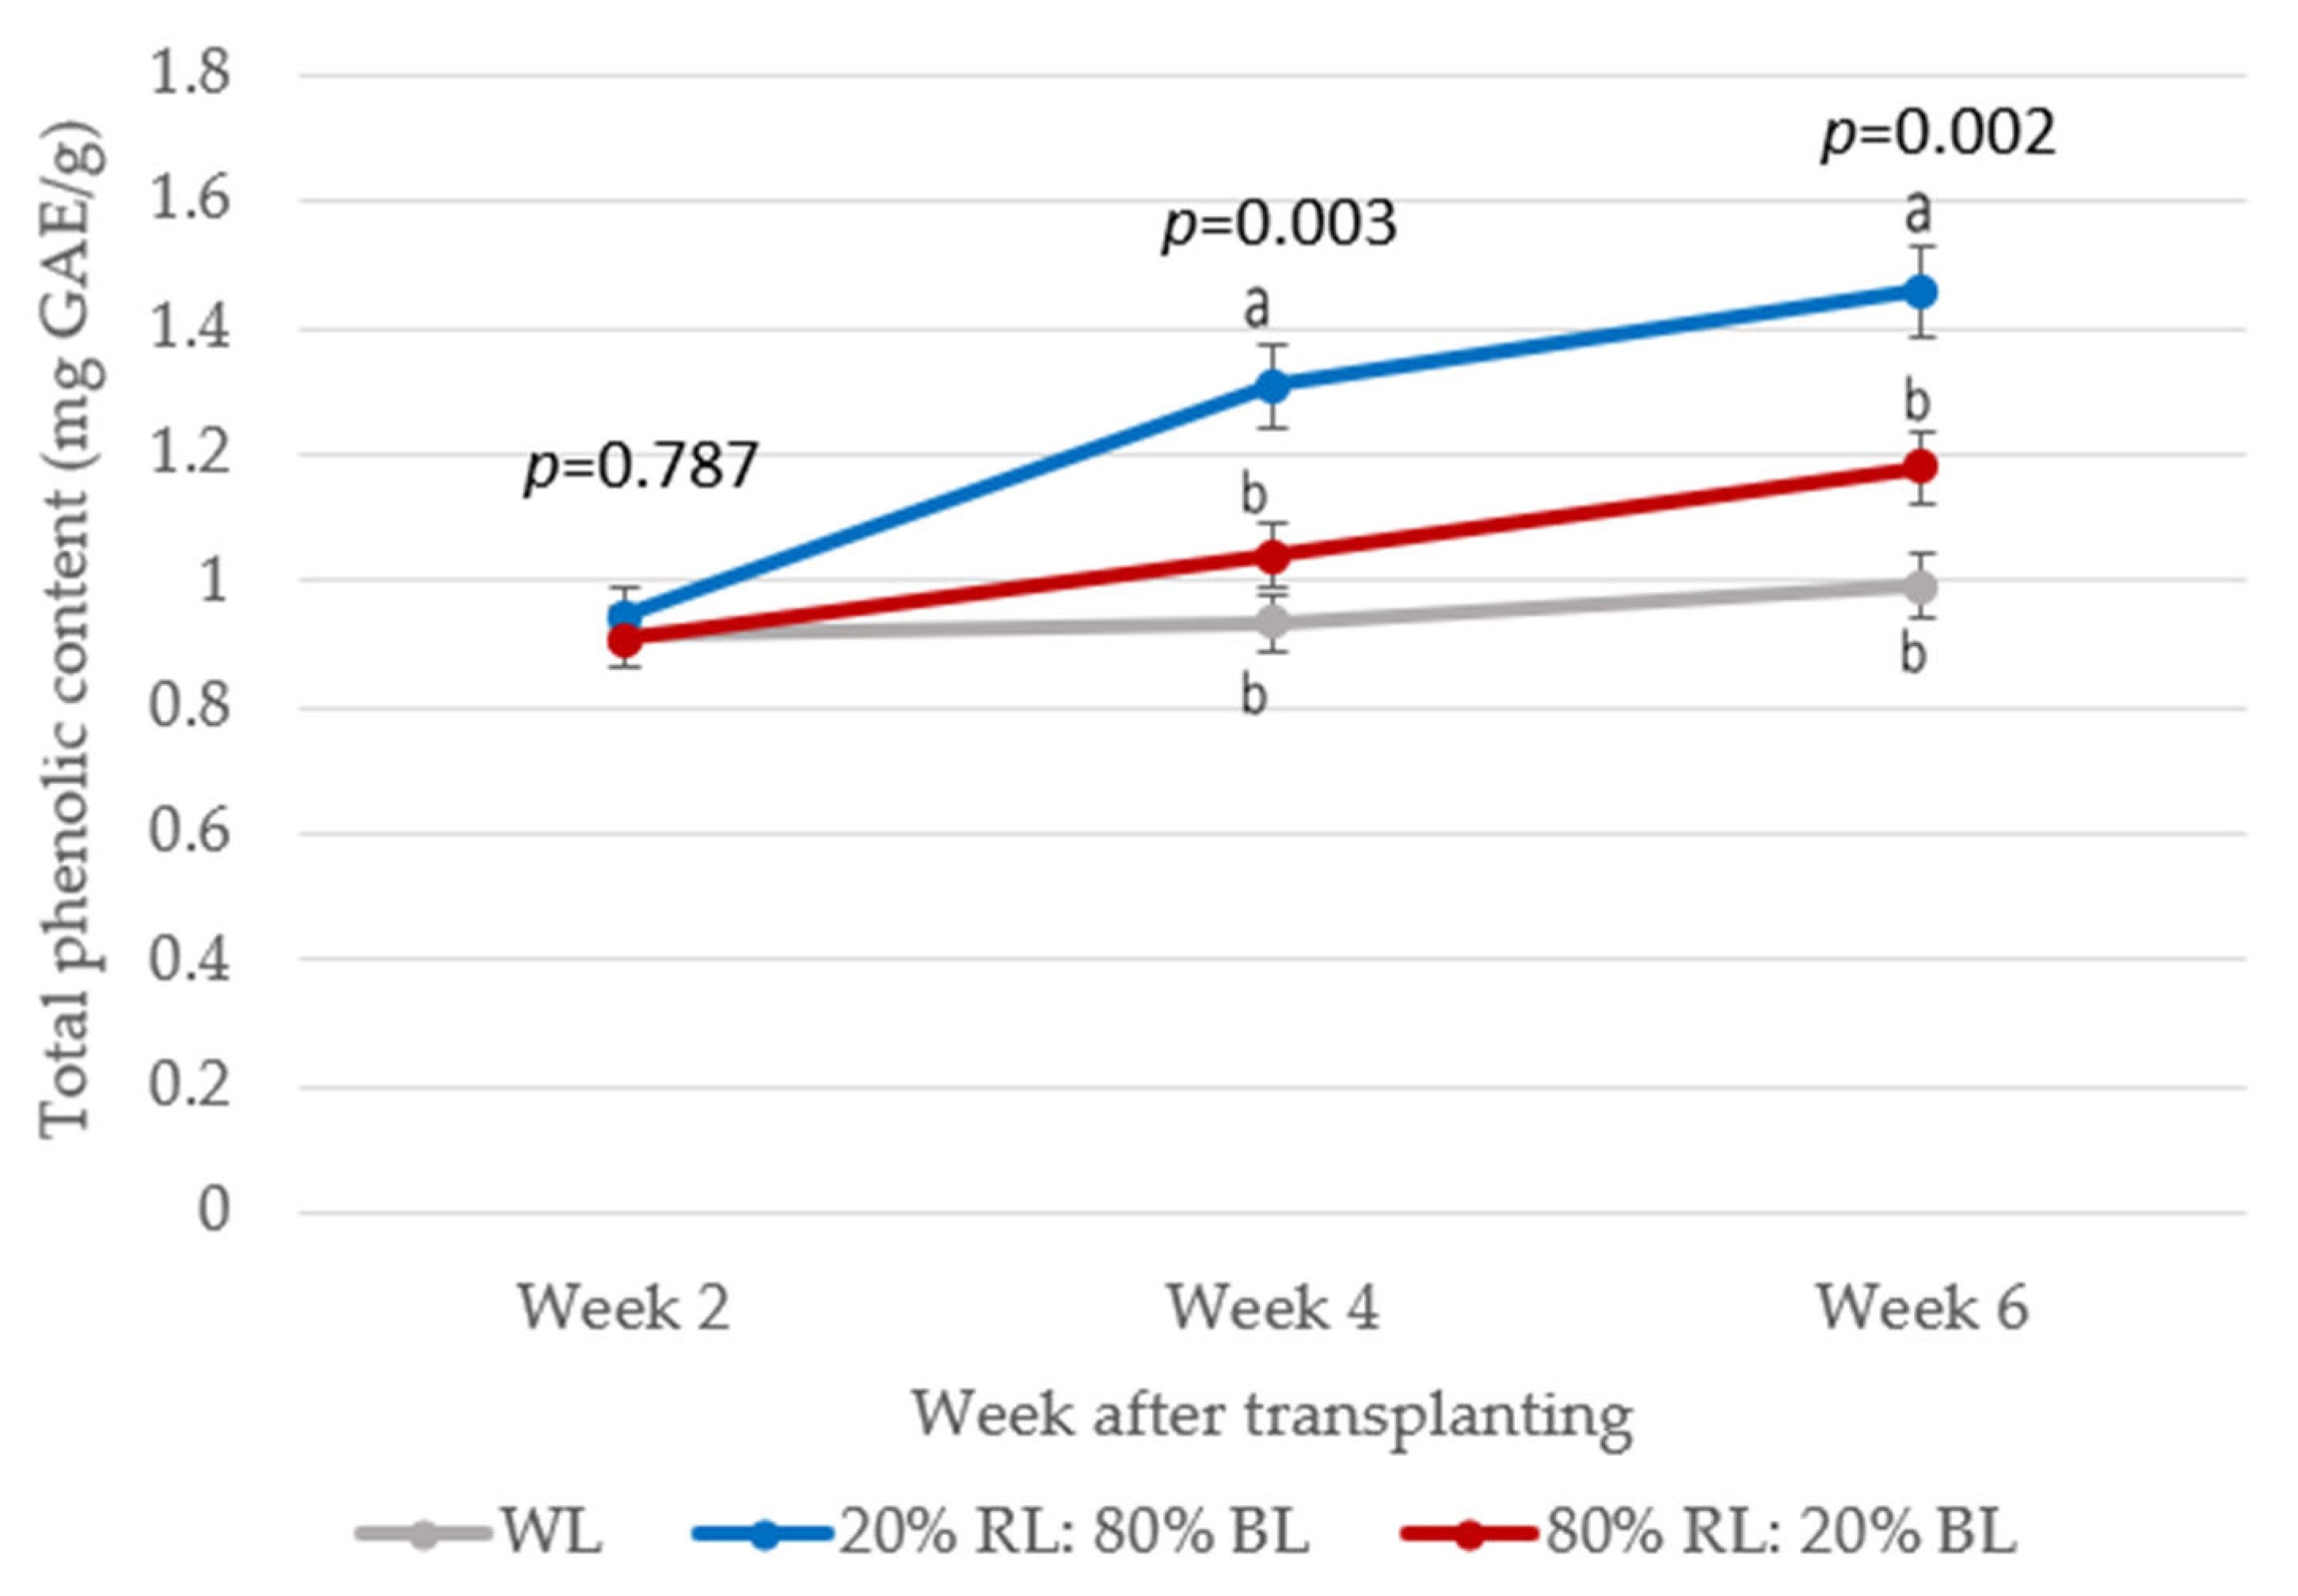
The total phenolic content (TPC) of Chinese kale was significantly affected by all three-light treatments at weeks 4 and 6 (p < 0.05) (Figure 5). Increased BL ratios in 20% RL: 80% BL showed the highest phenolic content and were ≈ 1.5 times higher than 80% RL: 20% BL and WL treatments at week 6.
Phenolic compounds (PCs) are phytochemicals with antioxidant capacity that can be found extensively in commonly consumed vegetables [55], important secondary metabolites produced by plants against abiotic/biotic stress, and may protect humans from heart disease and cancer [56]. In our study, BL ratios were shown to be the most prominent light in PC stimulation. Various studies have reported similar findings in TPC accumulation; Chinese kale sprout with 69.09% increased TPC under BL [18]; lettuce with the highest TPC under 20% RL: 80% BL and 41% RL: 59% BL [23,31]. Further analysis indicated that phenylalanine ammonia lyase (PAL) in phenylpropanoid pathway is the key enzyme in photoinduction of PCs [23]. More specifically, BL transforms hydroxycinnamic acids, which are strong inhibitors of PAL, into the less inhibitory cis form [57] and allows the upregulation of PAL enzyme for PCs synthesis. It could then explain why 20%RL: 80%BL has the highest TPC, followed by 80% RL: 20% BL and WL treatment in our study.

4. Conclusions

Based on the obtained results, the fresh and dry weight and phytochemicals accumulation of Chinese kale are affected by the LED light treatments. This comprehensive study indicated that 80%RL: 20%BL is the most promising LED regime in plant growth promotion and biomass accumulation, whereas 20%RL: 80%BL treatment was more beneficial to the accumulation of phytochemicals.

Author Contributions

Conceptualization, A.S.; methodology, A.S., L.K.C., and X.J.; software, L.K.C.; validation, A.S., L.K.C., and X.J.; formal analysis, L.K.C. and X.J.; investigation, L.K.C. and X.J.; resources, A.S.; data curation, L.K.C.; writing—original draft preparation, L.K.C. and X.J.; writing—review and editing, A.S.; visualization, L.K.C.; supervision, A.S.; project administration, A.S.; funding acquisition, A.S. All authors have read and agreed to the published version of the manuscript.

Funding

This research was funded by the School of Biological and Environmental Sciences, University of Nottingham Malaysia.

Data Availability Statement

The data presented in this study are available on request from the corresponding author.

Acknowledgments

The authors would like to thank the lab technicians, Shankari and Siti Nurazlin, for their help and assistance in providing the resources for this research.

Conflicts of Interest

The authors declare no conflicts of interest. The funders had no role in the design of the study; in the collection, analyses, or interpretation of data; in the writing of the manuscript; or in the decision to publish the results.

References

  1. Pennisi, G.; Blasioli, S.; Cellini, A.; Maia, L.; Crepaldi, A.; Braschi, I.; Spinelli, F.; Nicola, S.; Fernandez, J.A.; Stanghellini, C.; et al. Unraveling the Role of Red:Blue LED Lights on Resource Use Efficiency and Nutritional Properties of Indoor Grown Sweet Basil. Front. Plant Sci. 2019, 10, 305. [Google Scholar] [CrossRef] [PubMed]
  2. Benke, B.; Tomkins, B. Future food-production systems: Vertical farming and controlled-environment agriculture. Sustain. Sci. Pract. Policy 2017, 13, 13–26. [Google Scholar] [CrossRef]
  3. Martin, M.; Molin, E. Environmental Assessment of an Urban Vertical Hydroponic Farming System in Sweden. Sustainability 2019, 11, 4124. [Google Scholar] [CrossRef]
  4. Wong, L.Z. Vertical Farming Offers Answer to Food Sustainability. 2020. Available online: https://www.thestar.com.my/lifestyle/living/2020/03/06/4-engineers-believe-vertical-farming-offers-answer-to-food-sustainability (accessed on 1 November 2025).
  5. Gentry, M. Local heat, local food: Integrating vertical hydroponic farming with district heating in Sweden. Energy 2019, 174, 191–197. [Google Scholar] [CrossRef]
  6. Rajan, P.; Lada, R.R.; Macdonald, M.T. Advancement in Indoor Vertical Farming for Microgreen Production. Sci. Res. 2019, 10, 1397–1408. [Google Scholar] [CrossRef]
  7. Touliatos, D.; Dodd, I.C.; McAinsh, M. Vertical farming increases lettuce yield per unit area compared to conventional horizontal hydroponics. Food Energy Secur. 2016, 5, 184–191. [Google Scholar] [CrossRef]
  8. Dou, H.; Niu, G.; Gu, M.; Masabni, J.G. Responses of Sweet Basil to Different Daily Light Integrals in Photosynthesis, Morphology, Yield, and Nutritional Quality. HortScience 2018, 53, 496–503. [Google Scholar] [CrossRef]
  9. Rehman, M.; Ullah, S.; Bao, Y.; Wang, B.; Peng, D.; Liu, J. Light-emitting diodes: Whether an efficient source of light for indoor plants? Environ. Sci. Pollut. Res. 2017, 24, 24743–24752. [Google Scholar] [CrossRef]
  10. Moglich, A.; Yang, X.; Ayers, R.A.; Moffat, K. Structure and Function of Plant Photoreceptors. Annu. Rev. Plant Biol. 2010, 61, 21–47. [Google Scholar] [CrossRef]
  11. Wang, Y.-Q.; Hu, L.-P.; Liu, G.-M.; Zhang, D.-S.; He, H.-J. Evaluation of the Nutritional Quality of Chinese Kale (Brassica alboglabra Bailey) Using UHPLC-Quadrupole-Orbitrap MS/MS-Based Metabolomics. Molecules 2017, 22, 1262. [Google Scholar] [CrossRef] [PubMed]
  12. Nawaz, H.; Shad, M.S.; Muzaffar, S. Phytochemical Composition and Antioxidant Potential of Brassica. In Brassica Germplasm-Characterization, Breeding and Utilization; IntechOpen: London, UK, 2018. [Google Scholar] [CrossRef]
  13. Zhang, Y.; Ji, J.; Song, S.; Su, W.; Liu, H. Growth, Nutritional Quality and Health-Promoting Compounds in Chinese Kale Grown under Different Ratios of Red:Blue LED Lights. Agronomy 2020, 10, 1248–1263. [Google Scholar] [CrossRef]
  14. Mordor Intelligence. Cabbages and Other Brassicas Market—Growth, Trends, COVID-19 Impact, And Forecasts (2022–2027). Available online: https://www.mordorintelligence.com/industry-reports/cabbages-and-other-brassicas-market (accessed on 6 November 2025).
  15. Lefsrud, M.G.; Kopsell, D.A.; Sams, C.E. Irradiance from Distinct Wavelength Light-emitting Diodes Affect Secondary Metabolites in Kale. HortScience 2008, 43, 2243–2244. [Google Scholar] [CrossRef]
  16. Manawasinghe, N.K.G.K.R.; Weerasekara, S.H.; Karunaratne, C.S.L.M.; Weerakkody, W.A.P.; Kulapala, B. Influence of substrate and supplementary LED lighting on Vertical Farming of Basil (Ocimum basilicum L.) and Pak choi (Brassica rapa var. chinensis). Asian J. Agric. Hortic. Res. 2020, 7, 42–45. [Google Scholar] [CrossRef]
  17. Metallo, R.M.; Kopsell, D.A.; Sams, C.E.; Bumgarner, N.R. Influence of blue/red vs. white LED light treatments on biomass, shoot morphology, and quality parameters of hydroponically grown kale. Sci. Hortic. 2018, 235, 189–197. [Google Scholar] [CrossRef]
  18. Qian, H.; Liu, T.; Deng, M.; Miao, H.; Cai, C.; Shen, W.; Wang, Q. Effects of light quality on main health-promoting compounds and antioxidant capacity of Chinese kale sprouts. Food Chem. 2015, 196, 1232–1238. [Google Scholar] [CrossRef] [PubMed]
  19. Huang, W.; Ratkowsky, D.A.; Hui, C.; Wang, P.; Su, J.; Shi, P. Leaf Fresh Weight Versus Dry Weight: Which is Better for Describing the Scaling Relationship between Leaf Biomass and Leaf Area for Broad-Leaved Plants? Forests 2019, 10, 256. [Google Scholar] [CrossRef]
  20. Okamoto, K.; Yanagi, T.; Takita, S.; Tanaka, M.; Higuchi, T.; Ushida, Y.; Watanabe, H. Development of Plant Growth Apparatus Using Blue and Red LED as Artificial light source. Acta Hortic. 1996, 440, 111–116. [Google Scholar] [CrossRef]
  21. Bian, Z.; Jiang, N.; Grundy, S.; Lu, C. Uncovering LED light effects on plant growth: New angles and perspectives—LED light for improving plant growth, nutrition and energy-use efficiency. Acta Hortic. 2018, 1227, 491–498. [Google Scholar] [CrossRef]
  22. Naznin, M.T.; Lefsrud, M.; Gravel, V.; Hao, X. Different ratios of red and blue LED light effects on coriander productivity and antioxidant properties. Acta Hortic. 2016, 1134, 223–230. [Google Scholar] [CrossRef]
  23. Son, K.H.; Oh, M.M. Leaf Shape, Growth, and Antioxidant Phenolic Compounds of Two Lettuce Cultivars Grown under Various Combinations of Blue and Red Light-emitting Diodes. HortScience 2013, 48, 988–995. [Google Scholar] [CrossRef]
  24. Muneer, S.; Kim, E.J.; Park, J.S.; Lee, J.H. Influence of Green, Red and Blue Light Emitting Diodes on Multiprotein Complex Proteins and Photosynthetic Activity under Different Light Intensities in Lettuce Leaves (Lactuca sativa L.). Int. J. Mol. Sci. 2014, 15, 4657–4670. [Google Scholar] [CrossRef] [PubMed]
  25. Sabzalian, M.R.; Heydarizadeh, P.; Zahedi, M.; Boroomand, A.; Agharokh, M.; Sahba, M.R.; Schoefs, B. High performance of vegetables, flowers, and medicinal plants in a red-blue LED incubator for indoor plant production. Agron. Sustain. Dev. 2014, 34, 879–886. [Google Scholar] [CrossRef]
  26. Lin, K.H.; Huan, M.Y.; Huang, W.D.; Hsu, M.H.; Yang, Z.W.; Yang, C.M. The effects of red, blue, and white light-emitting diodes on the growth, development, and edible quality of hydroponically grown lettuce (Lactuca sativa L. var. capitata). Sci. Hortic. 2013, 150, 86–91. [Google Scholar] [CrossRef]
  27. Kang, W.H.; Park, J.S.; Park, K.S.; Son, J.K. Leaf photosynthetic rate, growth, and morphology of lettuce under different fractions of red, blue, and green light from light-emitting diodes (LEDs). Hortic. Environ. Biotechnol. 2016, 57, 573–579. [Google Scholar] [CrossRef]
  28. Nguyen, C.D.; Vu, D.; Huo, H.; Pearson, B. LED Light Increases Leaf Area and Root Length of Humulus lupulus (var. Tettnanger) In Vitro: ENH1319 EP583, 8/2020; EDIS: Gainesville, FL, USA, 2020. [Google Scholar] [CrossRef]
  29. Snowden, M.C.; Cope, K.R.; Bugbee, B. Sensitivity of Seven Diverse Species to Blue and Green Light: Interactions with Photon Flux. PLoS ONE 2016, 11, e0163121. [Google Scholar] [CrossRef]
  30. Rihan, H.Z.; Aljafer, N.; Jbara, M.; Macallum, L.; Lengger, S.; Fuller, M.P. The Impact of LED Lighting Spectra in a Plant Factory on the Growth, Physiological Traits and Essential Oil Content of Lemon Balm (Melissa officinalis). Plants 2022, 11, 342. [Google Scholar] [CrossRef]
  31. Spalholz, H.; Veazie, P.P.; Hernandez, R. Impact of sun-simulated white light and varied blue:red spectrums on the growth, morphology, development, and phytochemical content of green- and red-leaf lettuce at different growth stages. Sci. Hortic. 2020, 264, 109195. [Google Scholar] [CrossRef]
  32. Dougher, T.A.; Bugbee, B. Differences in the response of wheat, soybean and lettuce to reduced blue radiation. Photochem. Photobiol. 2001, 73, 199–207. [Google Scholar] [CrossRef] [PubMed]
  33. Hernandez, R.; Kubota, C. Physiological responses of cucumber seedlings under different blue and red photon flux ratios using LEDs. Environ. Exp. Bot. 2016, 121, 66–74. [Google Scholar] [CrossRef]
  34. Wang, X.Y.; Xu, X.M.; Cui, J. The importance of blue light for leaf area expansion, development of photosynthetic apparatus, and chloroplast ultrastructure of Cucumis sativus grown under weak light. Photosynthetica 2015, 53, 213–222. [Google Scholar] [CrossRef]
  35. Maxwell, K.; Johnson, G.N. Chlorophyll fluorescence—A practical guide. J. Exp. Bot. 2000, 51, 659–668. [Google Scholar] [CrossRef]
  36. Adams, B.D.; Adams, W.W.; Barker, D.H.; Logan, B.A.; Bowling, D.R.; Verhoeven, A.S. Using chlorophyll fluorescence to assess the fraction of absorbed light allocated to thermal dissipation of excess excitation. Physiol. Plant. 1996, 98, 253–264. [Google Scholar] [CrossRef]
  37. Lambrev, P.H.; Miloslavina, Y.; Jahns, P.; Holzwarth, A.R. On the relationship between non-photochemical quenching and photoprotection of Photosystem II. Biochim. Et Biophys. Acta BBA Bioenerg. 2012, 1817, 760–769. [Google Scholar] [CrossRef]
  38. Hogewoning, S.W.; Trouwborst, G.; Maljaars, H.; Poorter, H.; Ieperen, W.V.; Harbinson, J. Blue light dose–responses of leaf photosynthesis, morphology, and chemical composition of Cucumis sativus grown under different combinations of red and blue light. J. Exp. Bot. 2010, 61, 3107–3117. [Google Scholar] [CrossRef] [PubMed]
  39. Li, Z.; Chen, Q.; Xin, Y.; Mei, Z.; Gao, A.; Liu, W.; Yu, L.; Chen, X.; Chen, Z.; Wang, N. Analyses of the photosynthetic characteristics, chloroplast ultrastructure, and transcriptome of apple (Malus domestica) grown under red and blue lights. BMC Plant Biol. 2021, 21, 483. [Google Scholar] [CrossRef] [PubMed]
  40. Savvides, A.; Fanourakis, D.; Leperen, W.W. Co-ordination of hydraulic and stomatal conductances across light qualities in cucumber leaves. J. Exp. Bot. 2012, 63, 1135–1143. [Google Scholar] [CrossRef] [PubMed]
  41. Wolska, J.G.; Kowalczyk, K.; Przybysz, A.; Mirgos, M.; Orlinski, P. Photosynthetic Efficiency and Yield of Cucumber (Cucumis sativus L.) Grown under HPS and LED Lighting in Autumn–Winter Cultivation. Plants 2021, 10, 2042. [Google Scholar] [CrossRef] [PubMed]
  42. Johkan, M.; Shoki, K.; Goto, F.; Hasida, S.N.; Yoshihara, T. Blue Light-emitting Diode Light Irradiation of Seedlings Improves Seedling Quality and Growth after Transplanting in Red Leaf Lettuce. HortScience 2010, 45, 1809–1814. [Google Scholar] [CrossRef]
  43. Cope, K.R.; Bugbee, B. Spectral Effects of Three Types of White Light-emitting Diodes on Plant Growth and Development: Absolute versus Relative Amounts of Blue Light. HortScience 2013, 48, 504–509. [Google Scholar] [CrossRef]
  44. Snowden, M.C. Effects of Blue and Green Light on Plant Growth and Development at Low and High Photosynthetic Photon Flux 2015. All Graduate Theses and Dissertations, Spring 1920 to Summer 2023. Available online: https://digitalcommons.usu.edu/etd/4613 (accessed on 15 November 2025).
  45. Perera, L.; Daundasekera, M.; Wijesundara, D.S.A. Maturity at harvest affects postharvest longevity of cut Calathea foliage. Ceylon J. Sci. 2010, 38, 35–38. [Google Scholar] [CrossRef][Green Version]
  46. Wang, S.; Wang, X.; Shi, X.; Wang, B.; Zheng, X.; Wang, H.; Liu, F. Red and Blue Lights Significantly Affect Photosynthetic Properties and Ultrastructure of Mesophyll Cells in Senescing Grape Leaves. Hortic. Plant J. 2016, 2, 82–90. [Google Scholar] [CrossRef]
  47. Ryu, J.; Seo, K.S.; Choi, G.L.; Rha, E.S. Effects of LED Light Illumination on Germination, Growth and Anthocyanin Content of Dandelion (Taraxacum officinale). Korean J. Plant 2012, 25, 731–738. [Google Scholar] [CrossRef][Green Version]
  48. Matsiak, B.; Kowalski, A. White, blue and red LED lighting on growth, morphology and accumulation of flavonoid compounds in leafy greens. Zemdirb. Agric. 2019, 106, 281–286. [Google Scholar] [CrossRef]
  49. Azad, M.O.K.; Adnan, M.; Son, J.; Cho, D.H.; Park, C.H. Effect of Artificial LED on the Growth, Anthocyanin, Chlorophyll and Total Phenolic Content of Buckwheat Seedling. Biomed. J. Sci. Tech. Res. 2019, 13, 10274–10277. [Google Scholar] [CrossRef][Green Version]
  50. Meng, X.; Xing, T.; Wang, X. The role of light in the regulation of anthocyanin accumulation in Gerbera hybrida. Plant Growth Regul. 2004, 44, 243–250. [Google Scholar] [CrossRef]
  51. Zhang, T.; Maruhnich, S.A.; Folta, K.M. Green Light Induces Shade Avoidance Symptoms. Plant Physiol. 2011, 157, 1528–1536. [Google Scholar] [CrossRef]
  52. Wang, Y.; Folta, K.M. Contributions of green light to plant growth and development. Am. J. Bot. 2013, 100, 70–78. [Google Scholar] [CrossRef]
  53. Zhou, Y.; Singh, B.R. Red light stimulates flowering and anthocyanin biosynthesis in American cranberry. Plant Growth Regul. 2002, 38, 165–171. [Google Scholar] [CrossRef]
  54. Park, Y.G.; Oh, H.J.; Jeong, B.R. Growth and anthocyanin concentration of Perilla frutescens var. acuta Kudo as affected by light source and DIF under controlled environment. Hortic. Environ. Biotechnol. 2013, 54, 103–108. [Google Scholar] [CrossRef]
  55. Wang, S.Y.; Lin, H.S. Antioxidant Activity in Fruits and Leaves of Blackberry, Raspberry, and Strawberry Varies with Cultivar and Developmental Stage. J. Agric. Food Chem. 2000, 48, 140–146. [Google Scholar] [CrossRef]
  56. Li, Y.; Zheng, Y.; Liu, H.; Zhang, Y.; Hao, Y.; Song, S.; Lei, B. Effect of supplemental blue light intensity on the growth and quality of Chinese kale. Hortic. Environ. Biotechnol. 2018, 60, 49–57. [Google Scholar] [CrossRef]
  57. Lobiuc, A.; Vasilache, V.; Pintilie, O.; Stoleru, T.; Burducea, M.; Oroian, M.; Zamfirache, M.M. Blue and Red LED Illumination Improves Growth and Bioactive Compounds Contents in Acyanic and Cyanic Ocimum basilicum L. Microgreens Molecules 2017, 22, 2111. [Google Scholar] [CrossRef]
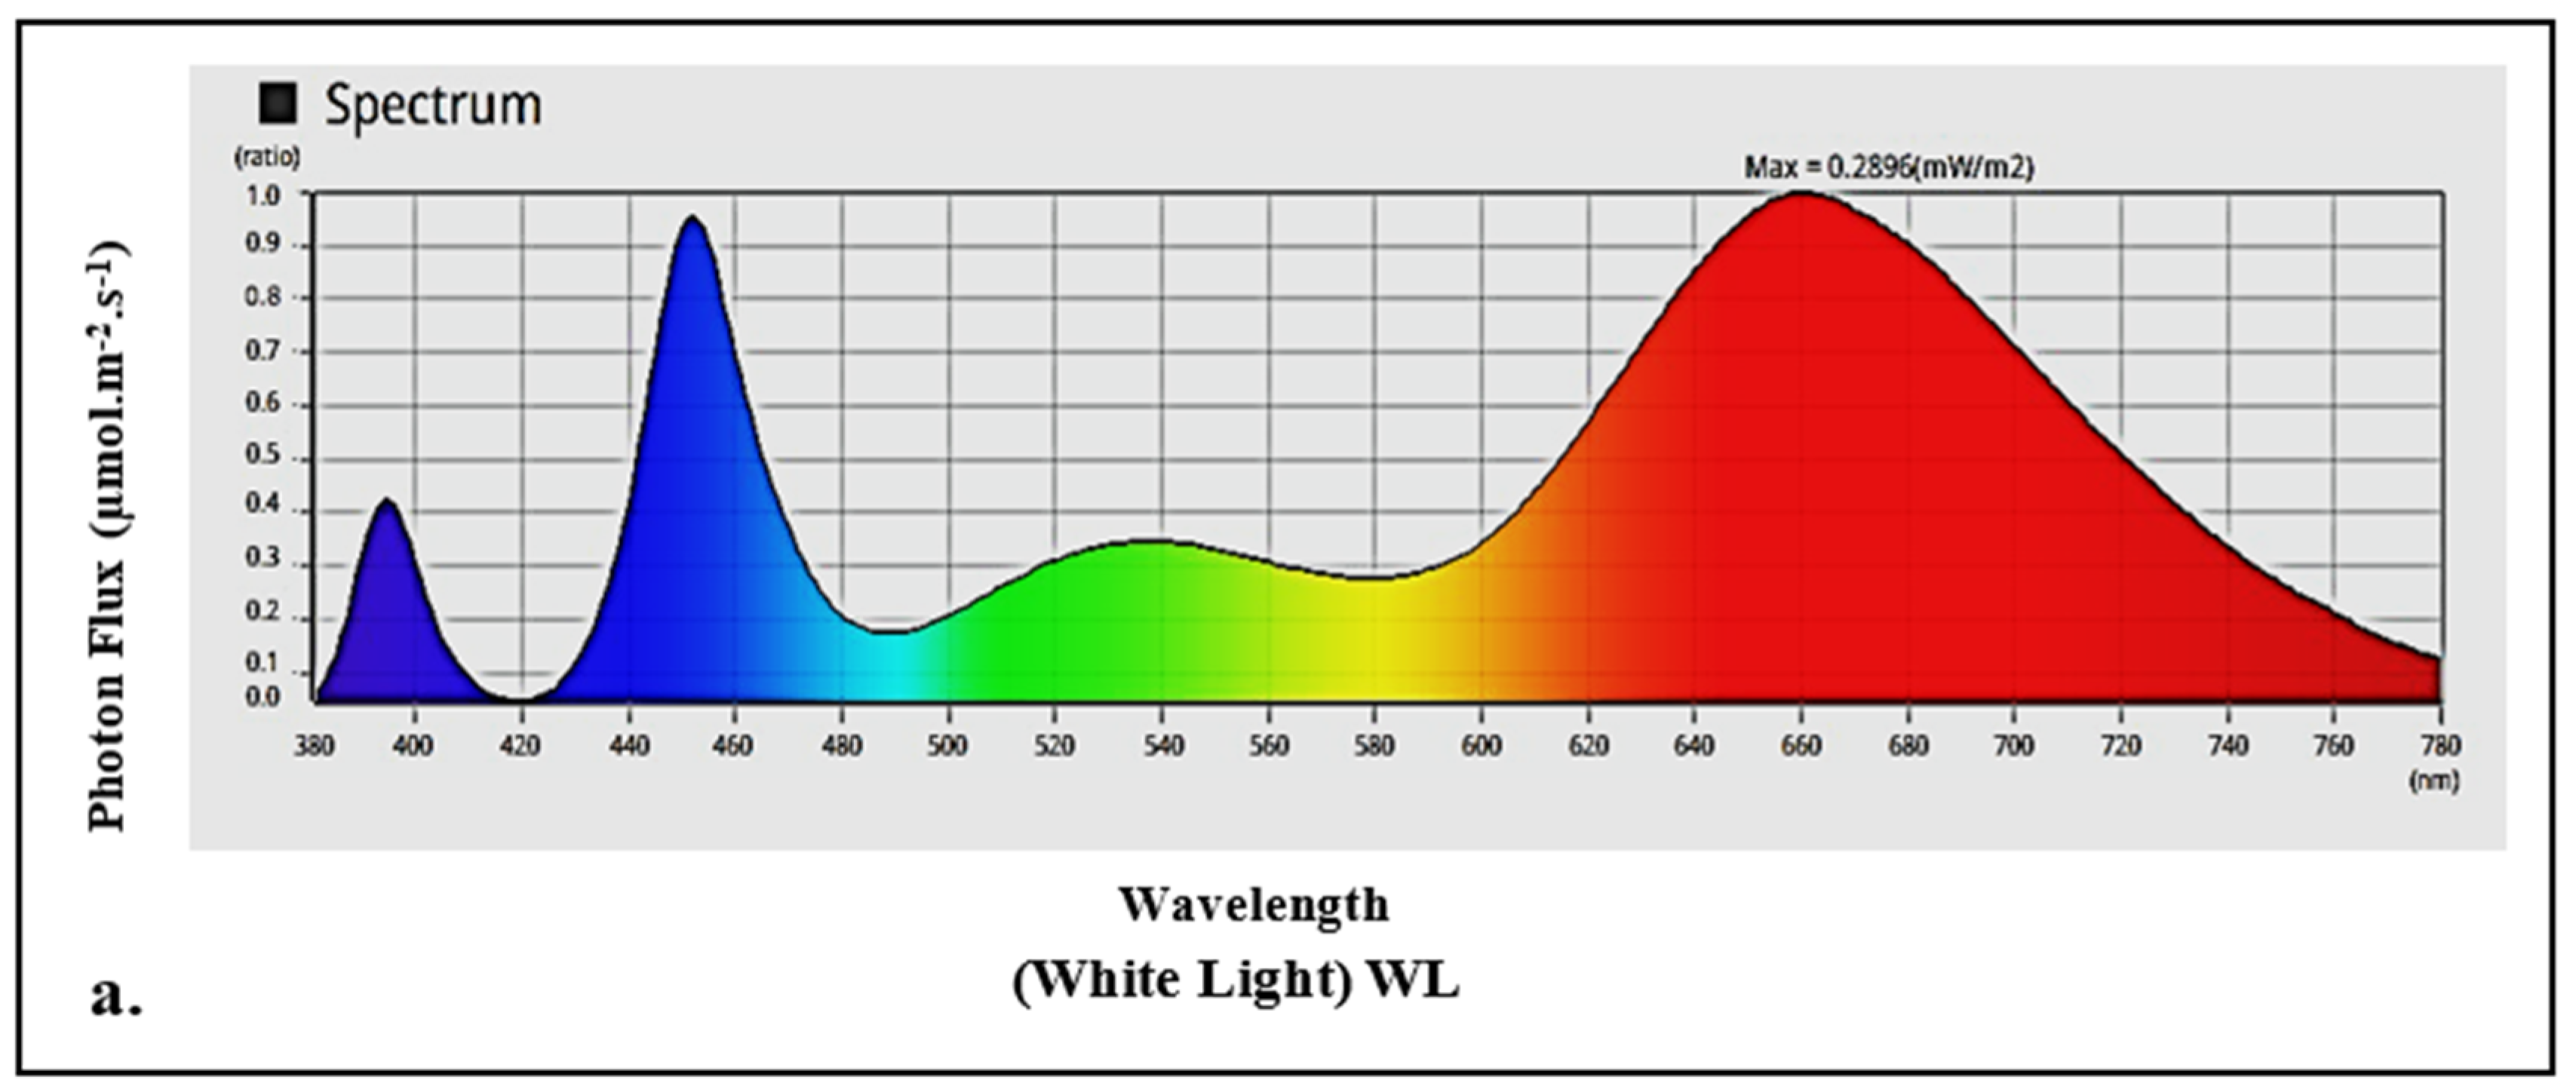
Figure 1. The spectra distribution for all three LED treatments. RL = red light, BL = blue light, WL = white light.
Blsf 54 00024 g001aBlsf 54 00024 g001b
Figure 2. The effect of supplementary LEDs on Chinese kale leaf area at weeks 2, 4, and 6. Within each sampling week, bars with the different letters are significantly different using Tukey test at p < 0.05 level. Error bars indicate SEM value. RL = red light, BL = blue light, WL = white light (n = 3).
Blsf 54 00024 g002
Figure 3. The effect of different LEDs ratios treatment on Chinese kale cChlorophyll content at weeks 2, 4, and 6. Within each sampling week, lines with the different letters are significantly different using Turkey test at p < 0.05. Error bars indicate SEM value. RL = red light, BL = blue light, WL = white light (n = 3).
Blsf 54 00024 g003
Figure 4. Anthocyanin content in Chinese kale grown under WL and different ratios of red: blue LED light treatment at weeks 2, 4, and 6. Within each sampling week, bars with the different letters are significantly different using Tukey test at p < 0.05. Error bars indicate SEM value. BL = blue light, RL = red light, WL = white light (n = 3).
Blsf 54 00024 g004
Figure 5. Influence of different LED light treatments on Chinese kale total phenolic content at weeks 2, 4, and 6. Within each sampling week, lines with the different letters are significantly different using Tukey test at 5% level. Error bars indicate SEM value. BL = blue light, RL = red light, WL = white light (n = 3).
Blsf 54 00024 g005
Table 1. The spectra specifications for all three LED treatments.
Measurement Treatment
Photon Flux (μmolm−2s−2)WL20% RL:80% BL80% RL:20% BL
Average PPFD (400–700 nm)49.8347.4457.41
Blue (400–500 nm)11.24 (22%)42.10 (85%)9.08 (12%)
Green (500–600 nm)10.99 (22%)0.00 (0%)0.00 (0%)
Red (600–700 nm)27.81 (56%)5.07 (11%)48.03 (88%)
RL = red light, BL = blue light, WL = white light. PPFD = photosynthetic photon flux density.
Table 2. Fresh weight and dry weight of Chinese kale under WL, 20% RL: 80% BL, and 80% RL: 20% BL treatment at weeks 2, 4, and 6 (n = 3).
TreatmentFresh Weight (g)Dry Weight (g)
Week 2Week 4Week 6Week 2Week 4Week 6
WL3.42 a6.78 b9.02 b0.31 a0.53 c0.95 b
20% RL: 80% BL3.71 a7.22 b11.31 b0.34 a0.72 b1.19 b
80% RL: 20% BL4.10 a10.24 a14.86 a0.36 a0.99 a1.54 a
SEM0.340.370.630.040.040.07
p -value 0.4290.0100.0020.733<0.010.003
Means within each column followed by same letters are not significantly different using Tukey’s test at p < 0.05 level.
Table 3. Effect of WL, 20% RL: 80% BL, and 80% RL: 20% BL treatment on Chinese kale quantum yield (n = 3).
TreatmentQuantum Yield (Fv/Fm)
Week 2Week 4Week 6
WL0.69 a0.71 a0.71 a
20% RL: 80% BL0.65 a0.68 a0.70 a
80% RL: 20% BL0.65 a0.65 a0.69 a
SEM0.020.020.02
p -value 0.2680.1950.754
Means within each column followed by same letters are not significantly different using Tukey’s test at p < 0.05 level.
Disclaimer/Publisher’s Note: The statements, opinions and data contained in all publications are solely those of the individual author(s) and contributor(s) and not of MDPI and/or the editor(s). MDPI and/or the editor(s) disclaim responsibility for any injury to people or property resulting from any ideas, methods, instructions or products referred to in the content.