


Abstract
Grid-connected photovoltaic (PV) systems paired with battery storage are becoming a core element of low-carbon distribution networks. This paper develops a complete closed-form formulation together with an independent, simulation-based verification of a single-phase grid-connected PV-battery microgrid sized for high-irradiance residential conditions in Saudi Arabia, using measured solar-resource and tariff data for Riyadh. A 6.25 kW monocrystalline array feeds a 400 V DC link through a perturb-and-observe boost stage; a bidirectional converter couples a 13.5 kWh LiFePO4 battery; and an IEEE 1547 smart inverter interfaces a 230 V grid through an LCL filter. Governing equations for every subsystem are derived and evaluated numerically, and a Python re-implementation of the phasor power-flow model verifies the analysis over a 24 h cycle run to periodic steady state, reproducing the reference design values with a mean absolute error of 0.5%. Using measured monthly solar-resource and temperature data for Riyadh, a full twelve-month analysis gives an annual self-sufficiency of 51.8% and a PV self-consumption of 72.9% for the optimised energy-management scheme. A dedicated time-domain switching simulation with FFT analysis shows that the LCL filter limits grid-current total harmonic distortion to 0.8%, far below the L-filter value of 6.2% and below the 5% current-distortion reference of IEEE 519 (full compliance additionally requires the PCC short-circuit ratio). Twelve-month, battery-size and load-sensitivity studies confirm robustness, and a techno-economic assessment based on the Saudi Electricity Company residential tariff quantifies levelized cost, payback and battery degradation, showing that economic viability hinges on tariff reform.
1. Introduction
The accelerating decarbonisation of electricity supply, driven by climate concerns and the finite nature of fossil reserves, has pushed renewable generation to the centre of modern power-system planning [1,2]. Photovoltaic (PV) conversion is the fastest-growing of these resources, yet its output is variable and non-dispatchable, which complicates voltage and frequency regulation when large numbers of PV units are connected to a passive distribution feeder [3]. Organising distributed generation, storage and controllable demand into a microgrid, a low- or medium-voltage cell that couples to the upstream network at a single point of common coupling (PCC) and can run either grid-connected or islanded, is a widely adopted response to this challenge [1,4,5]. Since the CERTS concept was formalised [1] and later surveyed in detail [2,5], the microgrid has been shown to raise reliability and efficiency while trimming losses and emissions.
Microgrid control is customarily arranged in three layers [3,6]. A primary layer acts locally and without communication, typically through droop laws that share active and reactive power among parallel converters [3]; a secondary layer restores voltage and frequency to nominal values [4,6]; and a tertiary layer handles dispatch and power-flow optimisation. Model-predictive and multi-agent extensions of this hierarchy have since demonstrated lower operating cost and improved tolerance to communication loss [7]. For grid-tied operation, the distinction between grid-following (current-source) and grid-forming (voltage-source) inverter behaviour is central, because the interface converter must respond correctly during disturbances and islanding [8,9,10,11].
Operating a PV array at its maximum power point (MPP) under changing irradiance and temperature requires maximum-power-point tracking (MPPT), a topic examined in a large body of work [12,13,14]. The perturb-and-observe (P&O) method [15] remains the most widely deployed technique because of its simplicity and modest computational cost, at the expense of a steady-state ripple proportional to the perturbation step [16]. Incremental-conductance [17] and adaptive, fuzzy or global-search variants reduce this ripple or improve behaviour under partial shading [18,19,20], while credible tracking studies depend on an accurate array model; the single-diode five-parameter representation [21,22,23] offers a strong balance of fidelity and cost and is adopted here.
Battery energy storage smooths PV variability and enables peak shaving and load shifting [24,25,26]. Among the available chemistries, lithium iron phosphate (LiFePO4) is particularly well matched to stationary use because of its long cycle life, thermal stability and flat discharge characteristic [27]. Safe operation depends on keeping the pack within a conservative state-of-charge (SOC) band, since deep cycling and elevated temperature are the dominant drivers of capacity fade [28]; accordingly, the present study treats SOC as a bounded energy state governed by charge and discharge power rather than attempting the detailed model-based or Kalman-filter estimation used for online battery management [29,30]. How PV and battery capacities are jointly sized then sets both the achievable self-sufficiency and the system economics [31,32,33].
The move from passive to smart inverters is among the most consequential recent advances in grid-tied PV [34,35,36]. Smart inverters actively support the network through Volt–VAR, Volt–Watt and frequency–Watt functions codified in IEEE 1547-2018 [34]; local reactive control counters the voltage rise caused by high PV penetration [37], and large-scale studies confirm that mandatory grid-support functions raise hosting capacity well above that of passive units [38]. Power quality at the PCC is shaped mainly by the output filter: the LCL topology [39] attenuates switching harmonics far more effectively than a single inductor of equal total value, but it introduces a resonance that must be damped [40,41]. Compliance is assessed against the IEEE 519 total demand distortion limits, which depend on the short-circuit ratio and harmonic order rather than a single fixed percentage [42].
Saudi Arabia offers an exceptional setting for residential PV: annual global horizontal irradiance exceeds 2200 kWh·m−2 across much of the Kingdom [43], and Vision 2030 targets a 50% renewable share with solar as the anchor technology [44,45]. Feasibility studies report attractive resource economics for utility- and building-scale PV [46,47], and recent microgrid assessments confirm the technical potential of distributed PV storage in the Kingdom [48]. The strong temporal overlap between solar generation and air-conditioning demand is especially favourable for self-consumption [45]. Working against these advantages are ambient temperatures that frequently exceed 45 °C together with heavy dust loading, both of which depress array efficiency and accelerate battery ageing and must therefore be reflected in any credible design.
Despite this extensive literature, three gaps persist. First, few studies present a fully documented, end-to-end model that couples the single-diode PV equation, P&O MPPT, bidirectional DC/DC conversion, smart-inverter functions, battery management and grid interaction within a single reproducible verification framework. Second, many simulation studies rely on idealised components and stop at daily energy metrics, without quantifying grid-current harmonic distortion, examining seasonal and disturbance robustness, or assessing economic viability. Third, work that specifically targets the high-irradiance, high-cooling-demand Saudi residential context remains comparatively sparse. This paper addresses these gaps through the following contributions:
- A closed-form derivation of every subsystem, from which all numerical design tables are generated directly rather than assumed;
- An independent Python re-implementation of the phasor power-flow model that verifies the analysis over a 24 h cycle run to periodic steady state, with quantified reproducibility error;
- A dedicated time-domain switching simulation with FFT analysis that quantifies grid-current total harmonic distortion (THD) and benchmarks the LCL filter against an equivalent L filter and the IEEE 519 [42] limits;
- A twelve-month seasonal analysis with battery-size and load-sensitivity sweeps that test the robustness and generality of the conclusions;
- A techno-economic assessment (levelised cost of energy, payback, net present value and battery degradation) that links the technical design to real-world viability under Saudi tariff structures.
Table 1 positions the study against representative prior work and highlights the combination of features that distinguishes it. The remainder of the paper is organised as follows: Section 2 describes the architecture; Section 3 develops the formulation; Section 4 sets out the modelling and verification methodology, including the explicit treatment of idealising assumptions; Section 5 presents and discusses the results; and Section 6 concludes.
Table 1.
Positioning of this work against representative prior studies. “Partial” denotes limited or design-level treatment.
2. System Architecture and Operating Principle
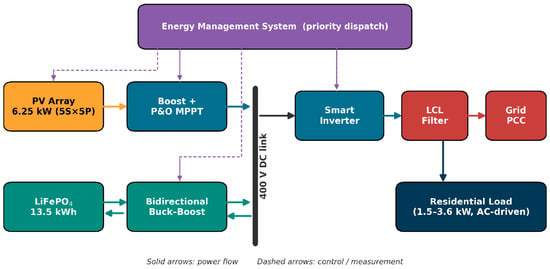
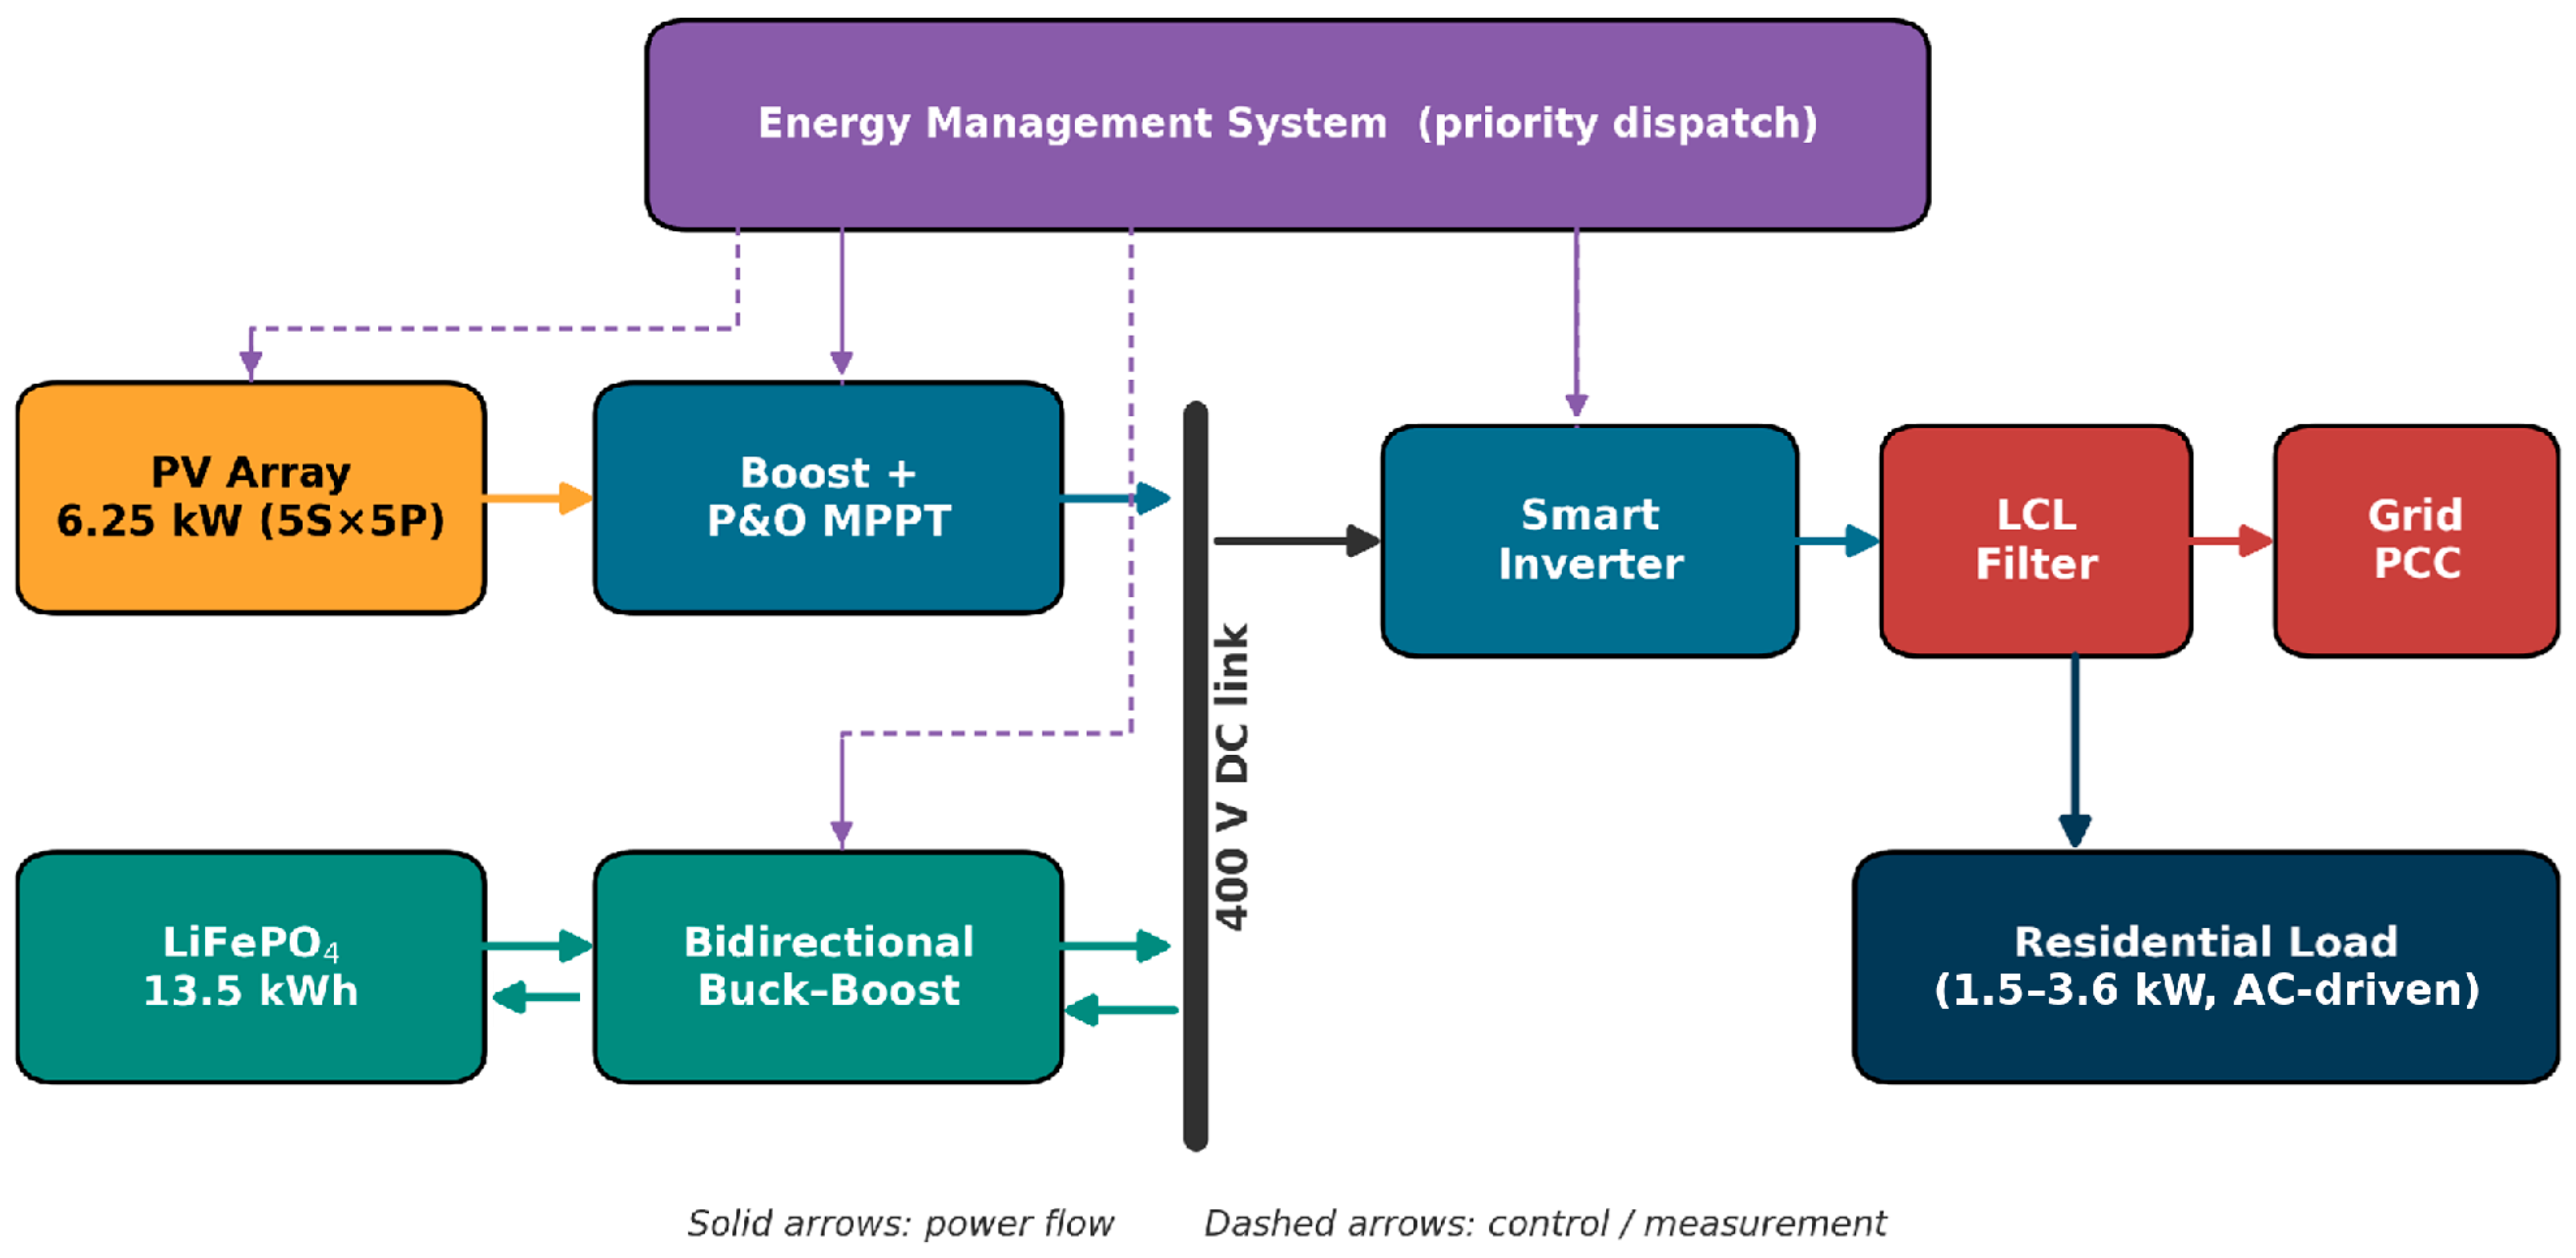
The system studied here is a single-PCC, grid-connected residential microgrid whose architecture is shown in Figure 1. Five subsystems share a common 400 V DC link: a 6.25 kW monocrystalline PV array; a unidirectional boost converter driven by a P&O MPPT controller; a bidirectional buck–boost converter that interfaces a LiFePO4 battery; a single-phase smart inverter rated at 230 V, 60 Hz with Volt–VAR, Volt–Watt and frequency–Watt functions; and an LCL filter that connects the inverter to the utility at the PCC. A single-phase interface is adopted because a 400 V DC link is sufficient to synthesise the 230 V, 325 V-peak waveform without an interposing transformer; whereas, a two-level connection to a three-phase 400 V line-to-line grid would demand roughly 650–700 V on the DC side; the 6.25 kW rating is consistent with a single-phase residential service. An energy-management system (EMS) coordinates the subsystems by reading PV power, load demand and battery SOC and enforcing a deterministic priority-dispatch policy.
Figure 1.
Architecture of the grid-connected PV-battery microgrid. Solid arrows denote power flow; dashed arrows denote control and measurement signals. The PV array, bidirectional battery converter and smart inverter share a common 400 V DC link.
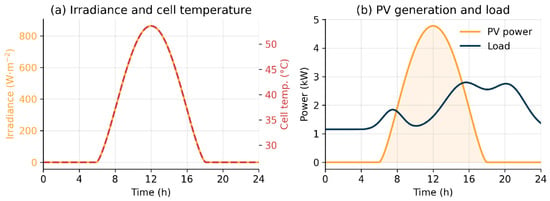
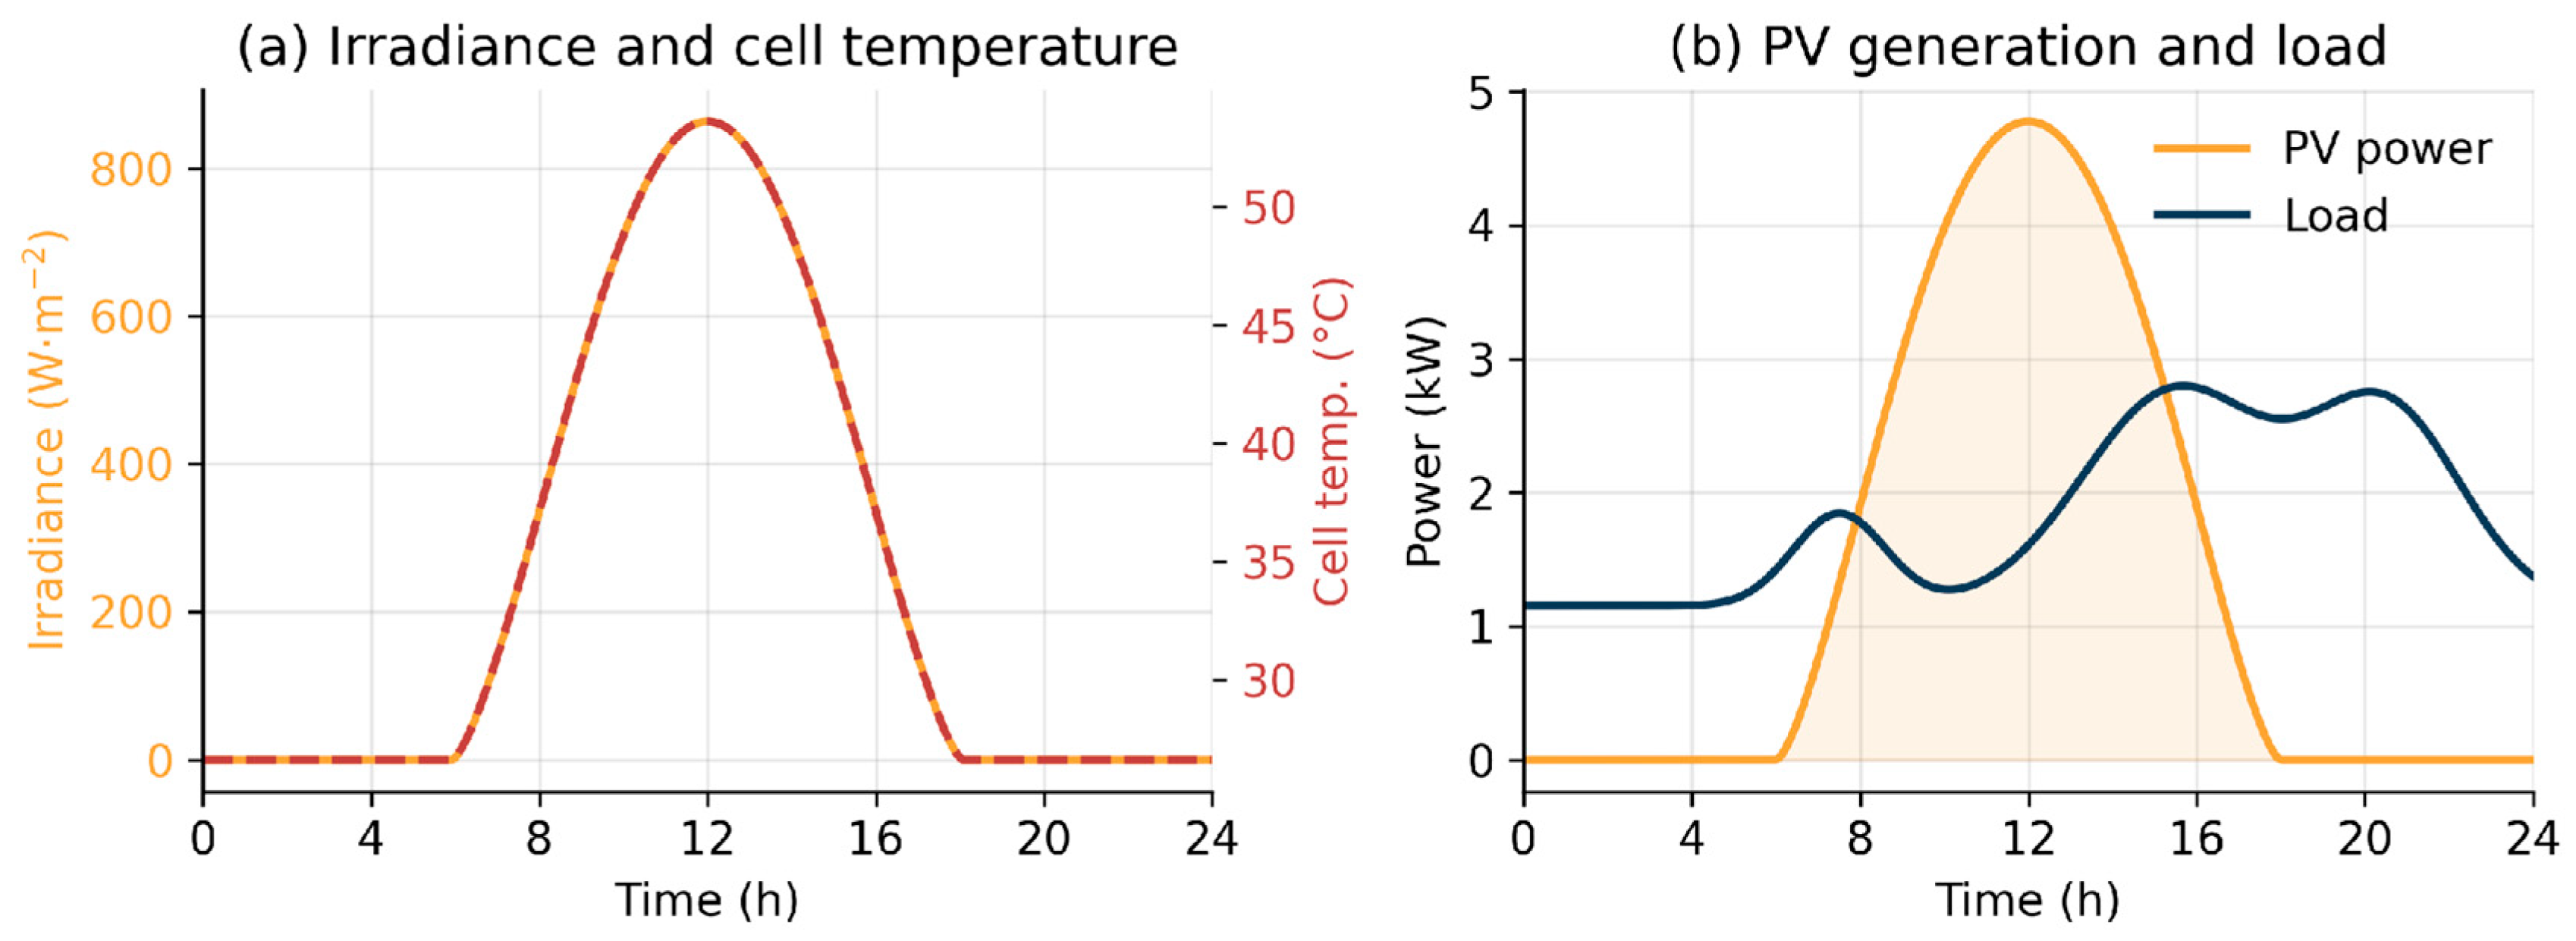
The operating principle follows a strict priority order. During high irradiance the array supplies the load first; any surplus charges the battery until the upper SOC limit is reached, after which residual power is exported. When PV generation is insufficient, the battery discharges to cover the deficit, and the grid supplies the remainder only once the lower SOC limit is reached. This hierarchy maximises renewable self-consumption while protecting the pack from over-charge and deep discharge. The smart inverter simultaneously regulates reactive power and rides through voltage and frequency disturbances in accordance with IEEE 1547-2018 [34]. Figure 2 shows the diurnal input profiles used in the verification: a clear-sky irradiance curve, the corresponding cell temperature, and the air-conditioning-dominated residential load.
Figure 2.
Diurnal profiles for the representative annual-mean Riyadh day: (a) irradiance (scaled to the measured monthly mean insolation) and the NOCT-based cell temperature; (b) the resulting PV generation and the residential load demand.
3. Theoretical Formulation
3.1. Photovoltaic Array: Single-Diode Model
The PV module is represented by the single-diode five-parameter model [21,22,23], in which the output current at terminal voltage obeys
where is the photo-generated current, the diode saturation current, and the series and shunt resistances, the ideality factor, and the thermal voltage for series cells at junction temperature . The photo-current scales with in-plane irradiance and temperature as
with the short-circuit current at standard test conditions and its temperature coefficient. The saturation current follows from the open-circuit condition,
with . The implicit Equation (1) is solved by Newton iteration, the module power is , and the MPP is the point where . Table 2 lists the extracted parameters for the 60-cell, 250 W module; Table 3 gives the 5S × 5P array configuration; and Table 4 reports the resulting characteristics across the irradiance and temperature range relevant to Saudi operation, computed directly from Equations (1)–(3).
Table 2.
Extracted single-diode five-parameter values for the 60-cell, 250 W module at standard test conditions (1000 W/m2, 25 °C).
Table 3.
Photovoltaic array configuration (5S × 5P) built from the module of Table 2.
Table 4.
Single-diode PV characteristics versus irradiance and cell temperature (per 250 W module and for the 25-module, 6.25 kW array), computed from Equations (1)–(3).
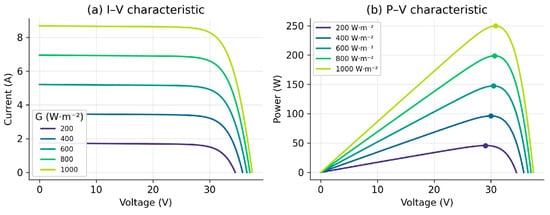
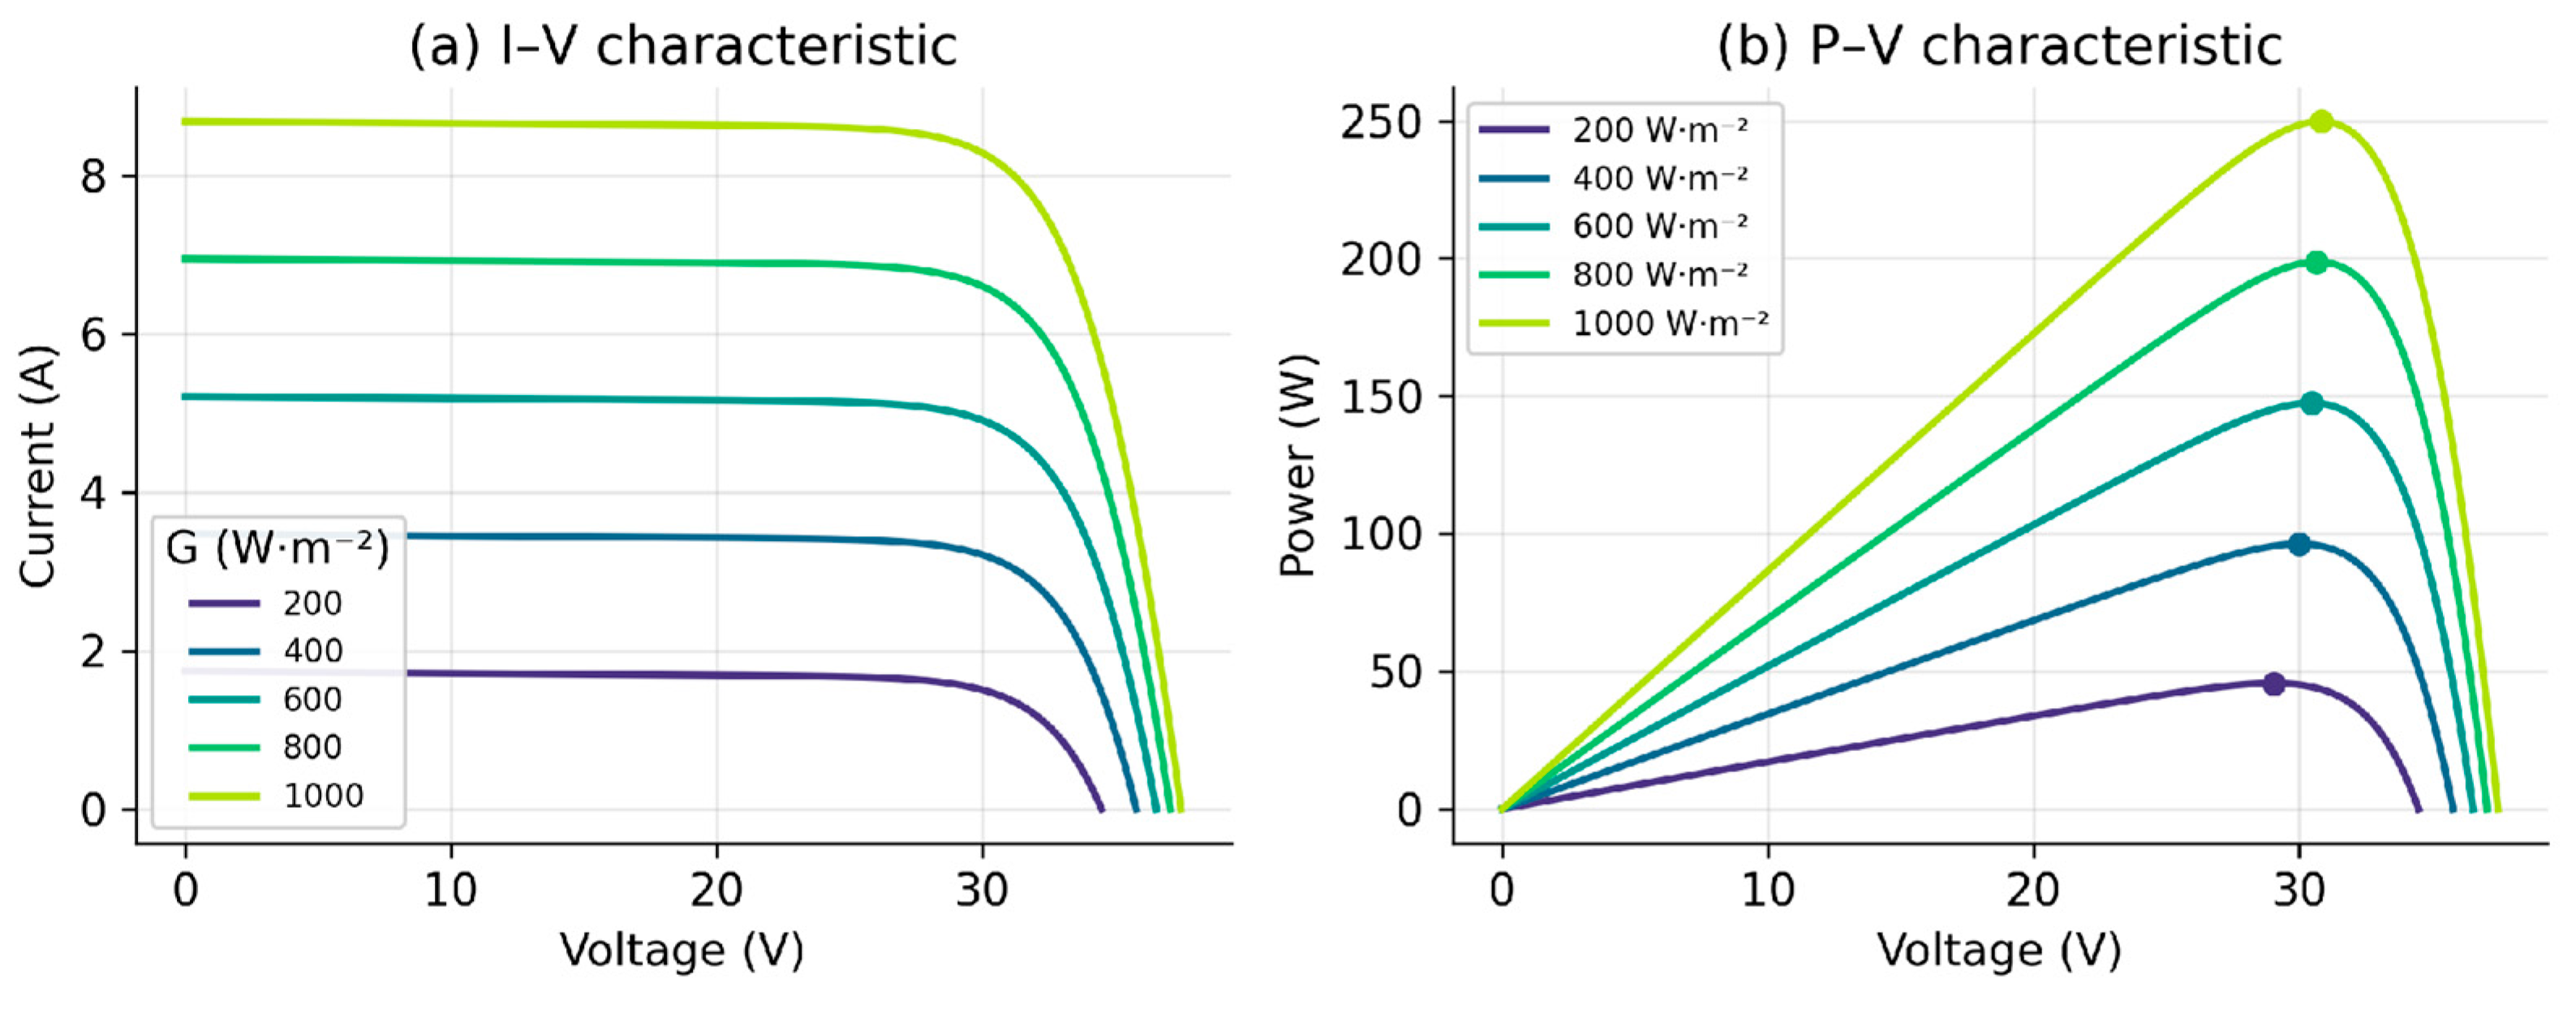
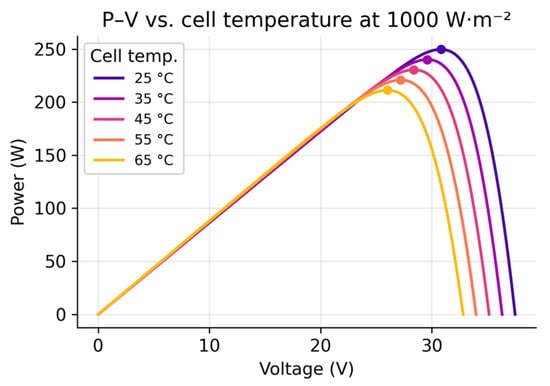
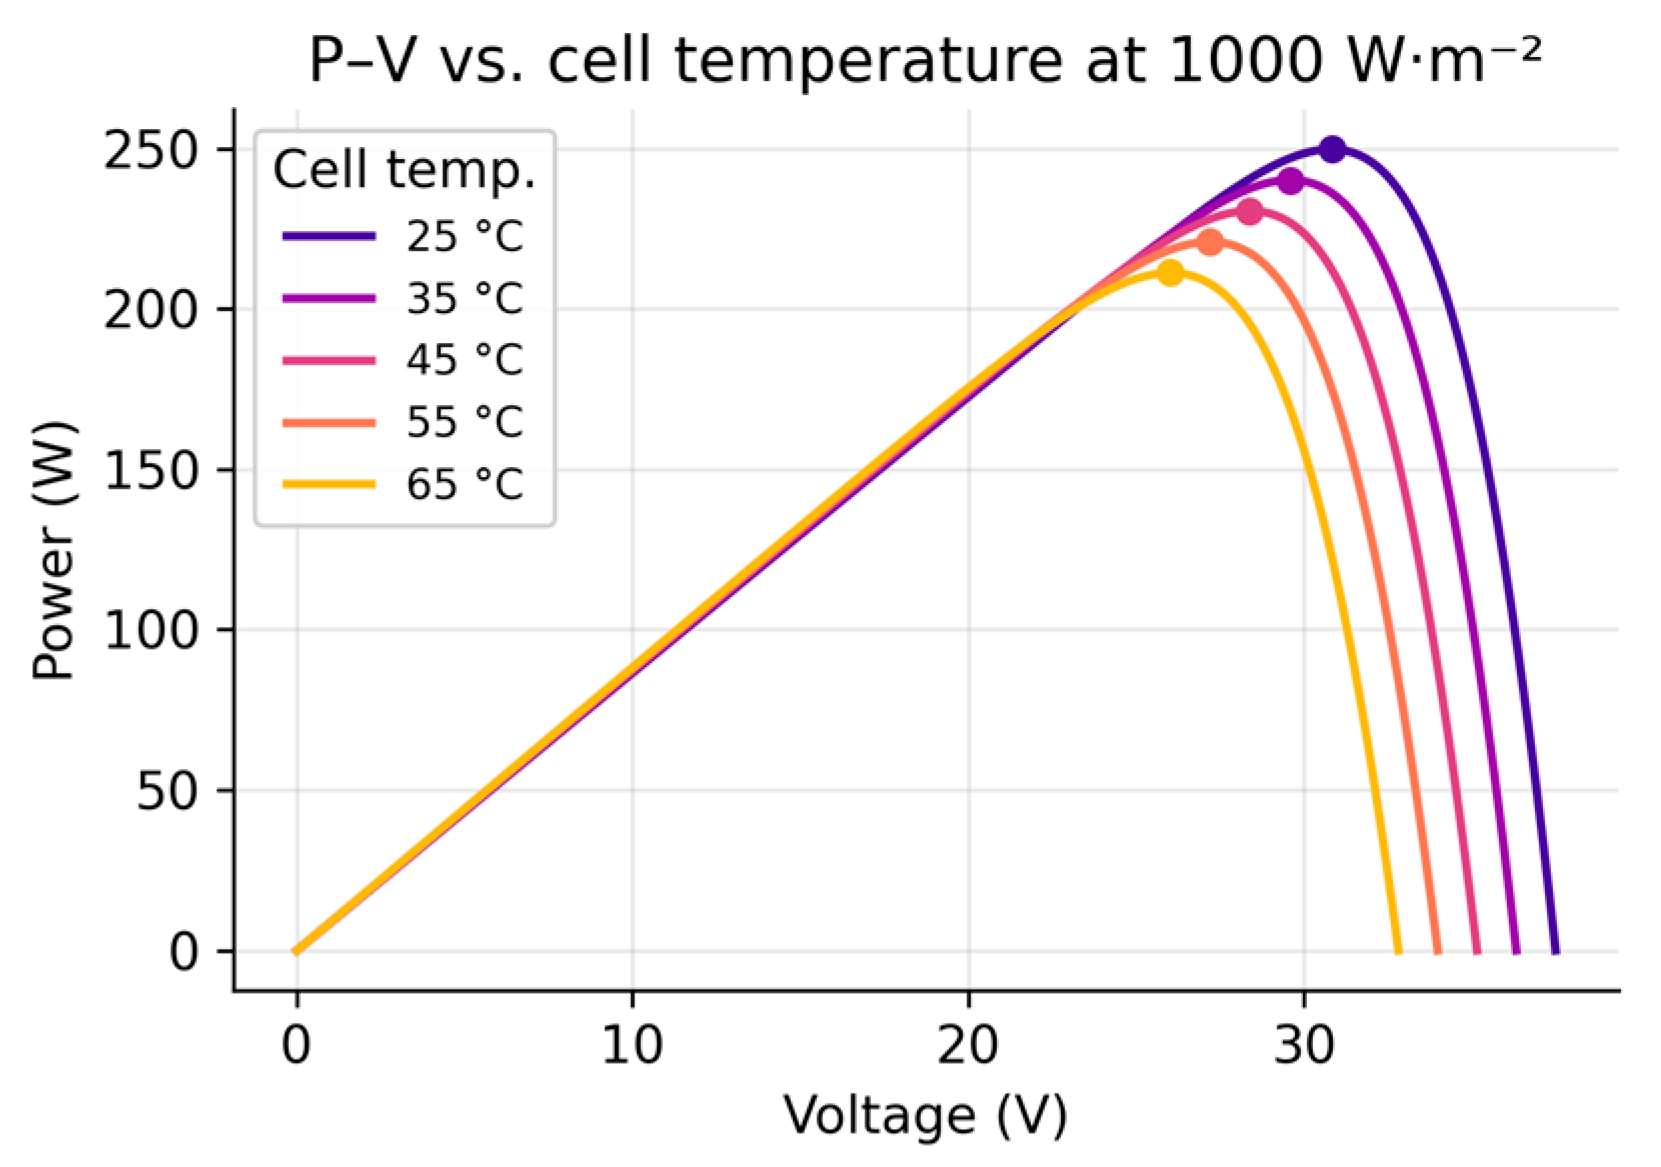
At standard test conditions the model returns a module MPP of 249.7 W at V and A, an array peak of 6.24 kW that reproduces the nameplate to within 0.12%. At a representative 30 °C cell temperature the array peak is 6.12 kW, consistent with the reference Simulink model. Within the tabulated range the thermal derating is illustrated by the 1000 W·m−2 rows: at 45 °C the array output falls from 6.24 kW to 5.76 kW, a reduction of 7.7% that is a structural feature of the regional climate rather than a design margin. Figure 3 shows the I–V and P–V curves at 25 °C, and Figure 4 the negative power–temperature dependence at 1000 W·m−2.
Figure 3.
Single-diode (a) I–V and (b) P–V characteristics of the 250 W module at 25 °C for irradiance from 200 to 1000 W·m−2; markers denote the maximum-power points.
Figure 4.
P–V characteristic of the module at 1000 W·m−2 for cell temperatures from 25 to 65 °C, illustrating the negative power–temperature coefficient.
3.2. Maximum-Power-Point Tracking (Perturb-and-Observe)
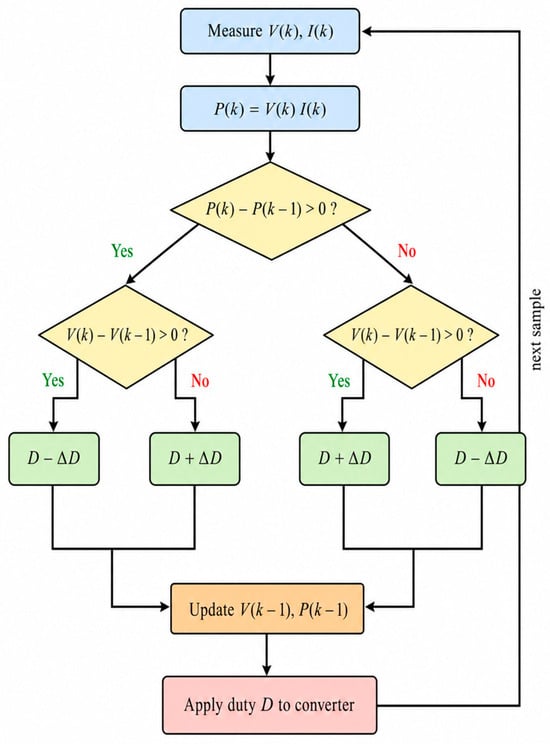
The P&O algorithm [15,16] perturbs the converter duty cycle and observes the change in PV power. With and , the duty-cycle update is
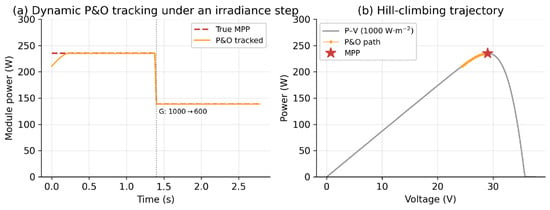
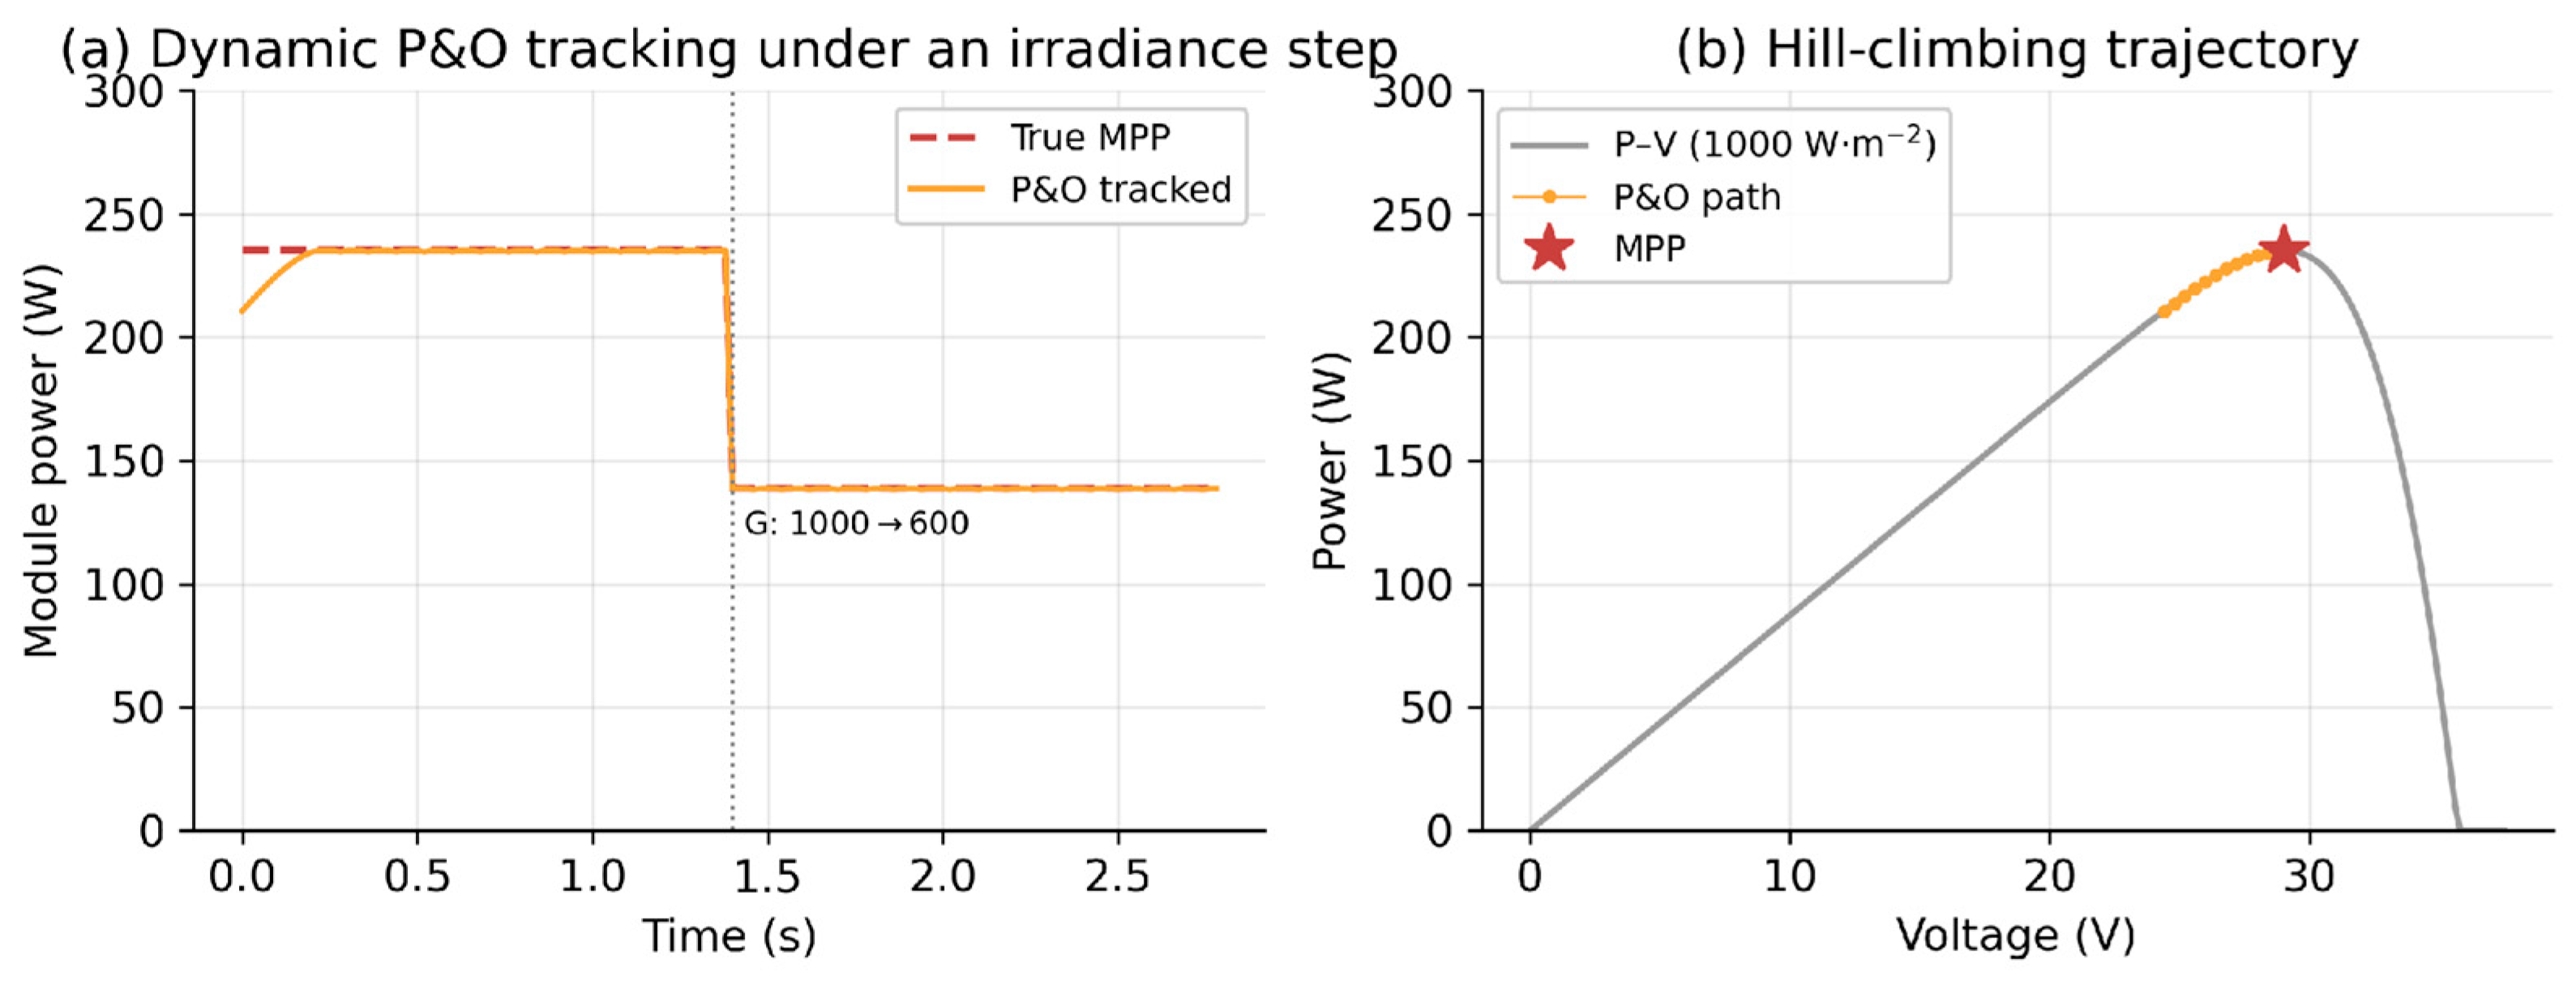
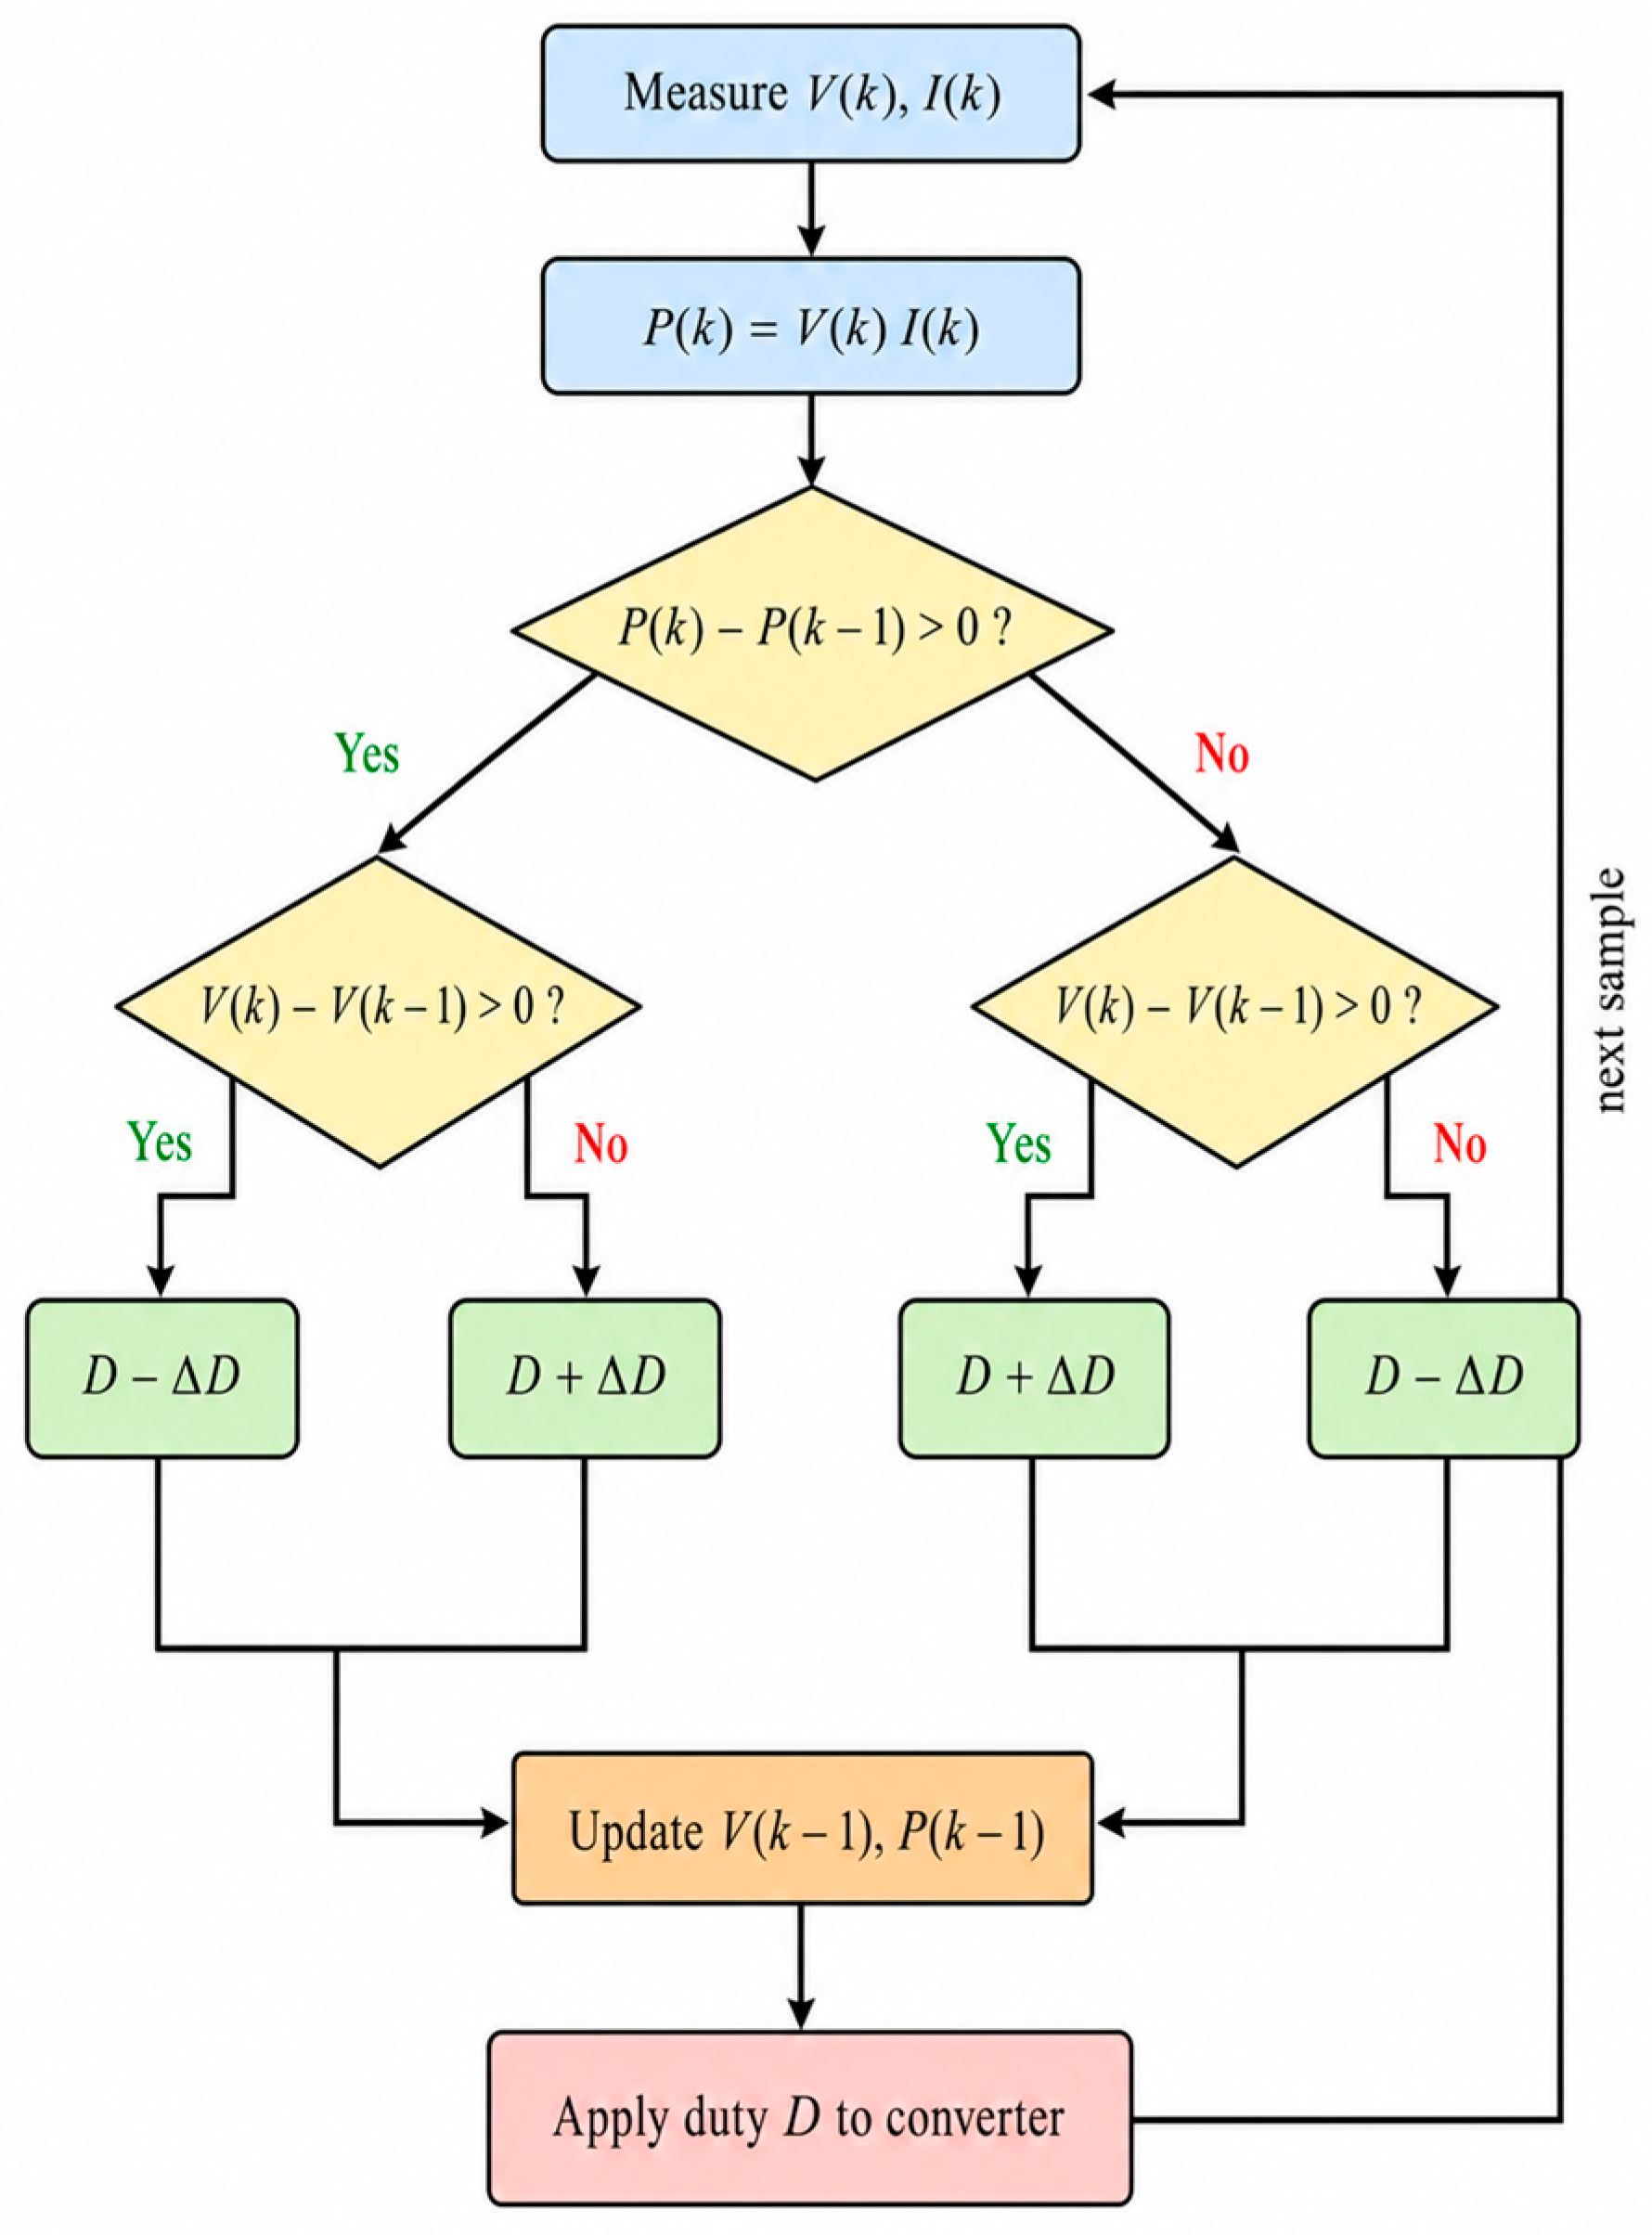
where is the fixed perturbation step. The sign rule drives the operating point uphill on the P–V curve. Because the boost stage imposes , so that raising the duty cycle lowers the array voltage, Equation (4) is written explicitly for duty-cycle control rather than for direct voltage perturbation: explicitly, and , which is the mirror image of the conventional voltage-domain rule. Steady-state ripple grows with while tracking speed falls as is reduced, giving the well-known accuracy–speed trade-off [16]. Figure 5 verifies the algorithm dynamically: panel (a) shows the tracked power following the true MPP through an irradiance step from 1000 to 600 W·m−2, and panel (b) shows the hill-climbing trajectory on the P–V curve. As discussed in Section 4, the daily energy dispatch of Section 5 does not integrate the discrete P&O loop time-step by time-step; instead it assumes ideal MPP operation, because the millisecond-to-second settling time of the tracker is negligible relative to the one-minute dispatch interval. The dynamic simulation of Figure 5 confirms that the tracker reaches the MPP well within a single dispatch step, which justifies the ideal-MPP assumption while acknowledging that a practical controller incurs a small steady-state tracking loss that would marginally reduce the reported PV yield. The complete decision logic of the algorithm is summarised in the flowchart of Figure 6.
Figure 5.
Dynamic verification of the P&O controller: (a) tracked module power following the true MPP through a step change in irradiance; (b) the hill-climbing trajectory converging to the MPP on the 1000 W·m−2 P–V curve.
Figure 6.
Flowchart of the perturb-and-observe MPPT algorithm implemented on the boost-converter duty cycle.
3.3. DC/DC Converter Design
The boost converter raises the PV string voltage to the DC-link voltage . In continuous conduction the ideal voltage ratio fixes the steady-state duty cycle :
The boost inductor bounds the peak-to-peak inductor-current ripple , and the output capacitor bounds the DC-link voltage ripple :
where is the switching frequency and the output current. The battery is interfaced by a bidirectional half-bridge (buck–boost) stage with the smoothing inductor on the battery side; it runs in buck mode when charging (DC link to battery) and in boost mode when discharging. With the 154.1 V array MPP voltage of the 5S × 5P configuration, a 400 V DC link, 10 kHz switching, 20% current ripple and 1% voltage ripple, Equations (5) and (6) give the boost-stage duty and the values in Table 5. Applying the same relations to the bidirectional stage between the 102.4 V battery and the 400 V link gives a charging (buck) duty and a discharging (boost) duty ; for a 20% ripple on the 65.9 A rated battery current ( A) the battery-side inductor is mH, a 0.5% battery-voltage ripple fixes the battery-side capacitor at µF, and the peak switch current is about 72.5 A. These bidirectional-converter values are included in Table 5. The 4.7 mF DC-link decoupling capacitor is sized from the 120 Hz second-harmonic power ripple that a single-phase interface imposes: for a ripple energy and a ±1% voltage ripple about 400 V, the energy-balance condition yields about 2.6 mF, so the selected 4.7 mF provides margin against transients.
Table 5.
PV boost-converter and bidirectional battery-converter design parameters from Equations (5) and (6).
3.4. LCL Filter Design
The inverter couples to the grid through an LCL filter, which attenuates switching harmonics far more effectively than a single inductor of equal total value [39]. The inverter-side inductor limits the current ripple, the filter capacitor is a fraction of the base capacitance, and the grid-side inductor is . The base impedance and capacitance are
and the resonance frequency and passive-damping resistor are
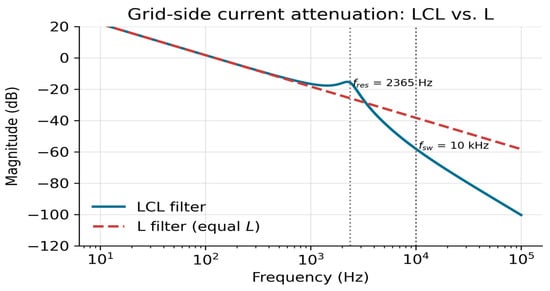
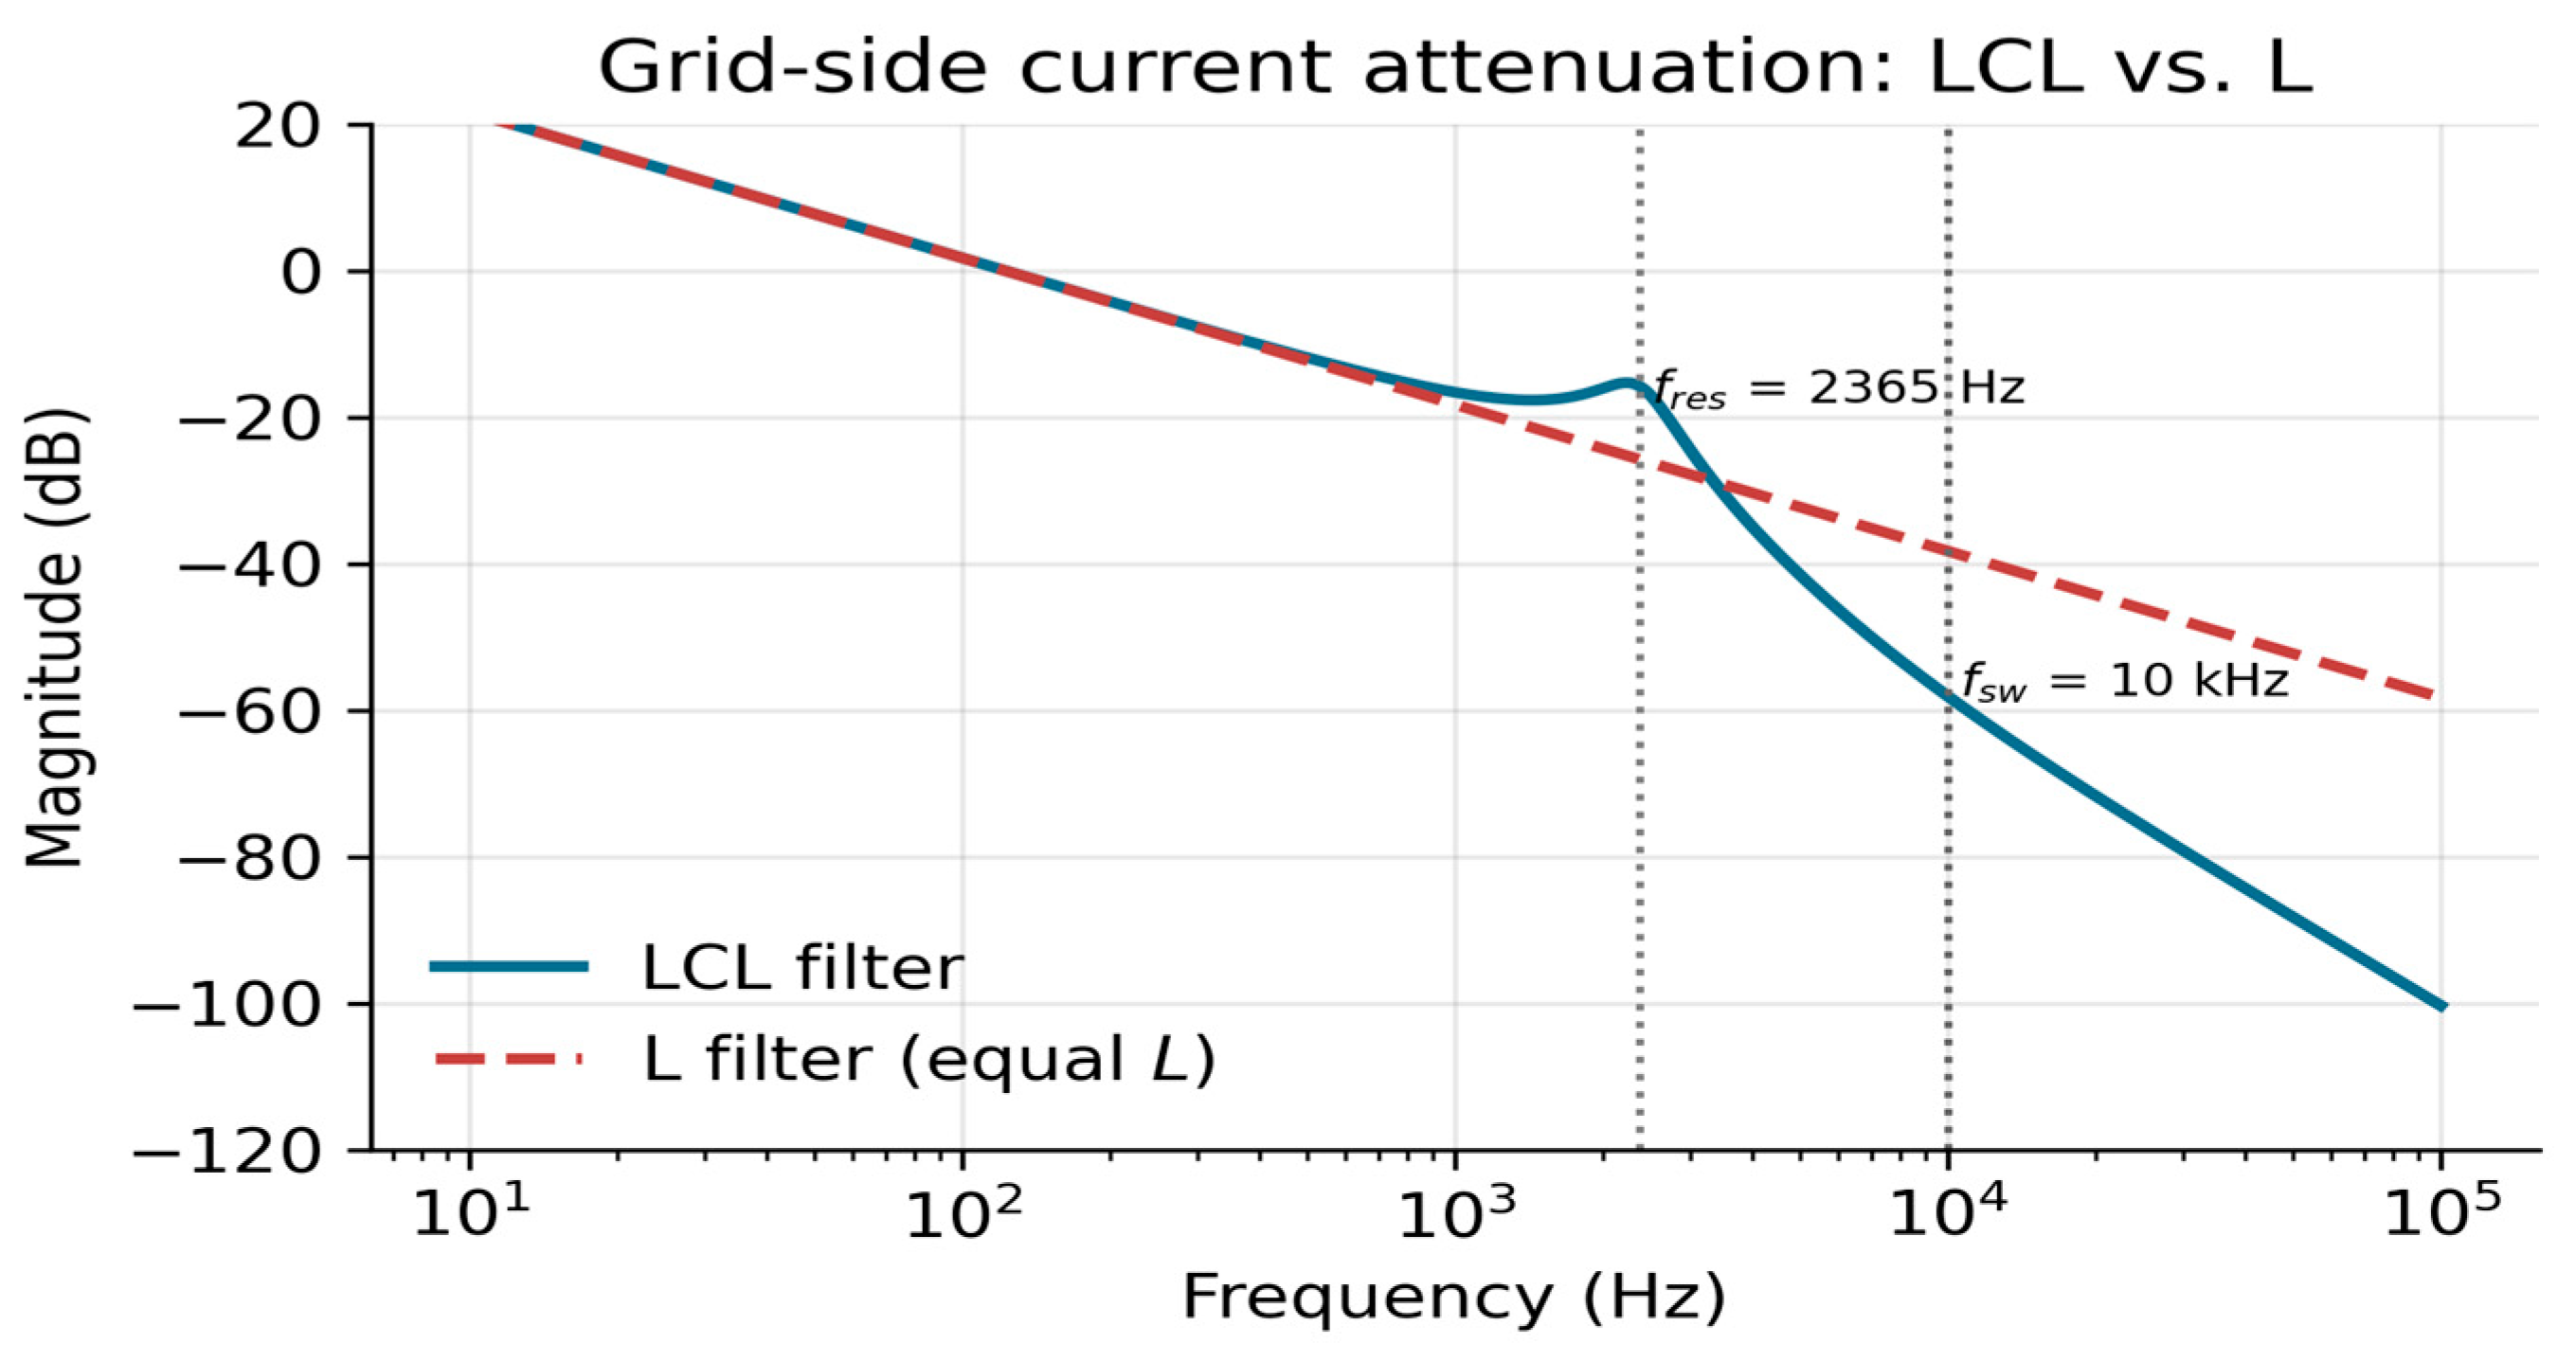
The resonance must satisfy to decouple it from the fundamental and the switching frequency [39,41]. With the inputs of Table 6, Equations (7) and (8) give the parameters of Table 7; the computed Hz lies safely inside the admissible band from 600 Hz to 5000 Hz. The total inductance is kept low at mH, so that at the rated 27.2 A the fundamental voltage drop is only about 13.3 V, or 5.8% of the phase voltage. The filter capacitor draws a fundamental reactive current A (about 312 var, near 5% of rated power and within the usual LCL design range), so the series damping resistor dissipates W at the fundamental, a negligible fraction of the rating and rising only modestly once the switching-harmonic capacitor current is included. Figure 7 compares the design-level attenuation of the LCL filter with that of an equivalent L filter of the same total inductance, and the resulting grid-current harmonic distortion is quantified in Section 5.4.
Table 6.
Design inputs for the single-phase LCL filter (Equations (7) and (8)).
Table 7.
LCL filter design parameters from Equations (7) and (8).
Figure 7.
Magnitude of the grid-side current transfer function for the designed LCL filter versus an L filter of equal total inductance; the resonance and switching frequencies are marked.
3.5. Battery Energy Storage and State-of-Charge Dynamics
The LiFePO4 battery is modelled by a Thevenin equivalent whose terminal voltage depends on the open-circuit voltage , the internal resistance and the current :
To remove any ambiguity in the current-sign convention, the state of charge is propagated in power form using strictly non-negative charge and discharge powers and :
where is the nominal pack energy and the charge and discharge efficiencies, with and never simultaneously non-zero. The operating envelope is bounded by
where the signed battery power is taken positive for discharge and negative for charge, the convention adopted consistently in Equation (12) and in the dispatch results of Section 5. In the optimised design a slew-rate limit on emulates the finite ramp capability of real cells and suppresses high-frequency current demand:
The pack specification is given in Table 8: a 13.5 kWh, 102.4 V LiFePO4 battery with a 0.5C rating, 95% round-trip efficiency and 50 mΩ internal resistance. The 0.5C rating fixes the maximum power at kW; the 500 W·s−1 slew-rate of Equation (12) is a separate EMS smoothing parameter, not derived from the C-rate. Two SOC windows are compared: a baseline 50–80% window and an optimised 40–80% window, giving usable energies of 4.05 kWh and 5.40 kWh before conversion losses. The shallow depth of discharge and conservative upper bound extend cycle life substantially and are a defensible choice given that ambient temperatures above 45 °C accelerate lithium-ion ageing [28]; the resulting degradation and its economic impact are quantified in Section 5.8.
Table 8.
Battery pack specification (Equations (9)–(12)).
3.6. Smart-Inverter Control and Grid-Support Functions
For the single-phase inverter, an orthogonal voltage–current pair is generated by a second-order generalised-integrator phase-locked loop (SOGI-PLL), allowing the controller to be expressed in a virtual frame aligned with the grid voltage [49]. In this frame the active and reactive powers at the PCC are
where are the RMS-equivalent components produced by the SOGI-PLL, that is, the orthogonal quantities scaled by , so that and are the true single-phase active and reactive powers and the one-half factor that appears with instantaneous peak-valued quantities is absorbed into the coordinate scaling. With grid-voltage orientation () the powers decouple onto and , regulated by proportional–integral controllers. Grid support uses the three droop characteristics of IEEE 1547-2018 [34]. The Volt–VAR function adjusts reactive power with terminal voltage,
the Volt–Watt function curtails active power above a threshold ,
and the frequency–Watt function reduces active power when frequency exceeds nominal,
where are the droop gains. Representative IEEE 1547-2018 Category B settings are adopted: the Volt–VAR curve uses breakpoints , , and pu with a reactive capability of on the outer segments; the Volt–Watt curve holds full power to pu and ramps linearly to at pu; and the frequency–Watt response uses a 5% droop above a Hz dead-band. The inverter is rated kVA, and whenever the combined active-power and Volt–VAR reactive-power demand would exceed this rating the controller gives active power priority subject to the apparent-power limit . The microgrid is a grid-connected-only system and is not designed for intentional islanding: the inverter monitors PCC voltage and frequency and, on detecting an unintentional island, ceases to energise and disconnects within the IEEE 1547 clearing time [50]. It therefore remains in grid-following mode at all times. Harmonic compliance is governed by IEEE 519, whose limits apply at the PCC and are expressed as total demand distortion referenced to the maximum demand current, with the applicable band set by the short-circuit ratio [42]; the design is assessed against these bands in Section 5.4 rather than against a single fixed percentage.
3.7. Energy-Management Priority Logic and Power Balance
At every instant the EMS enforces the power balance
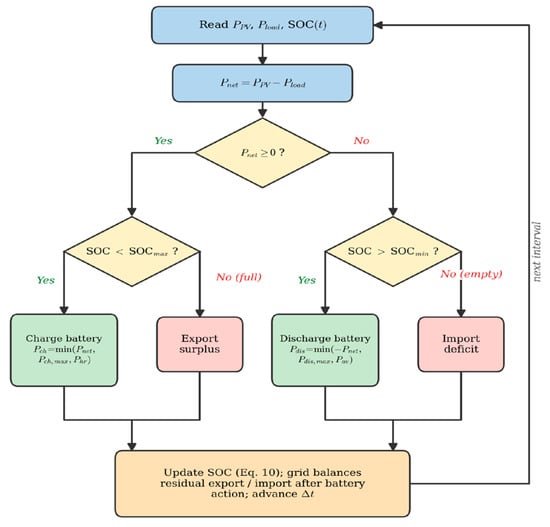
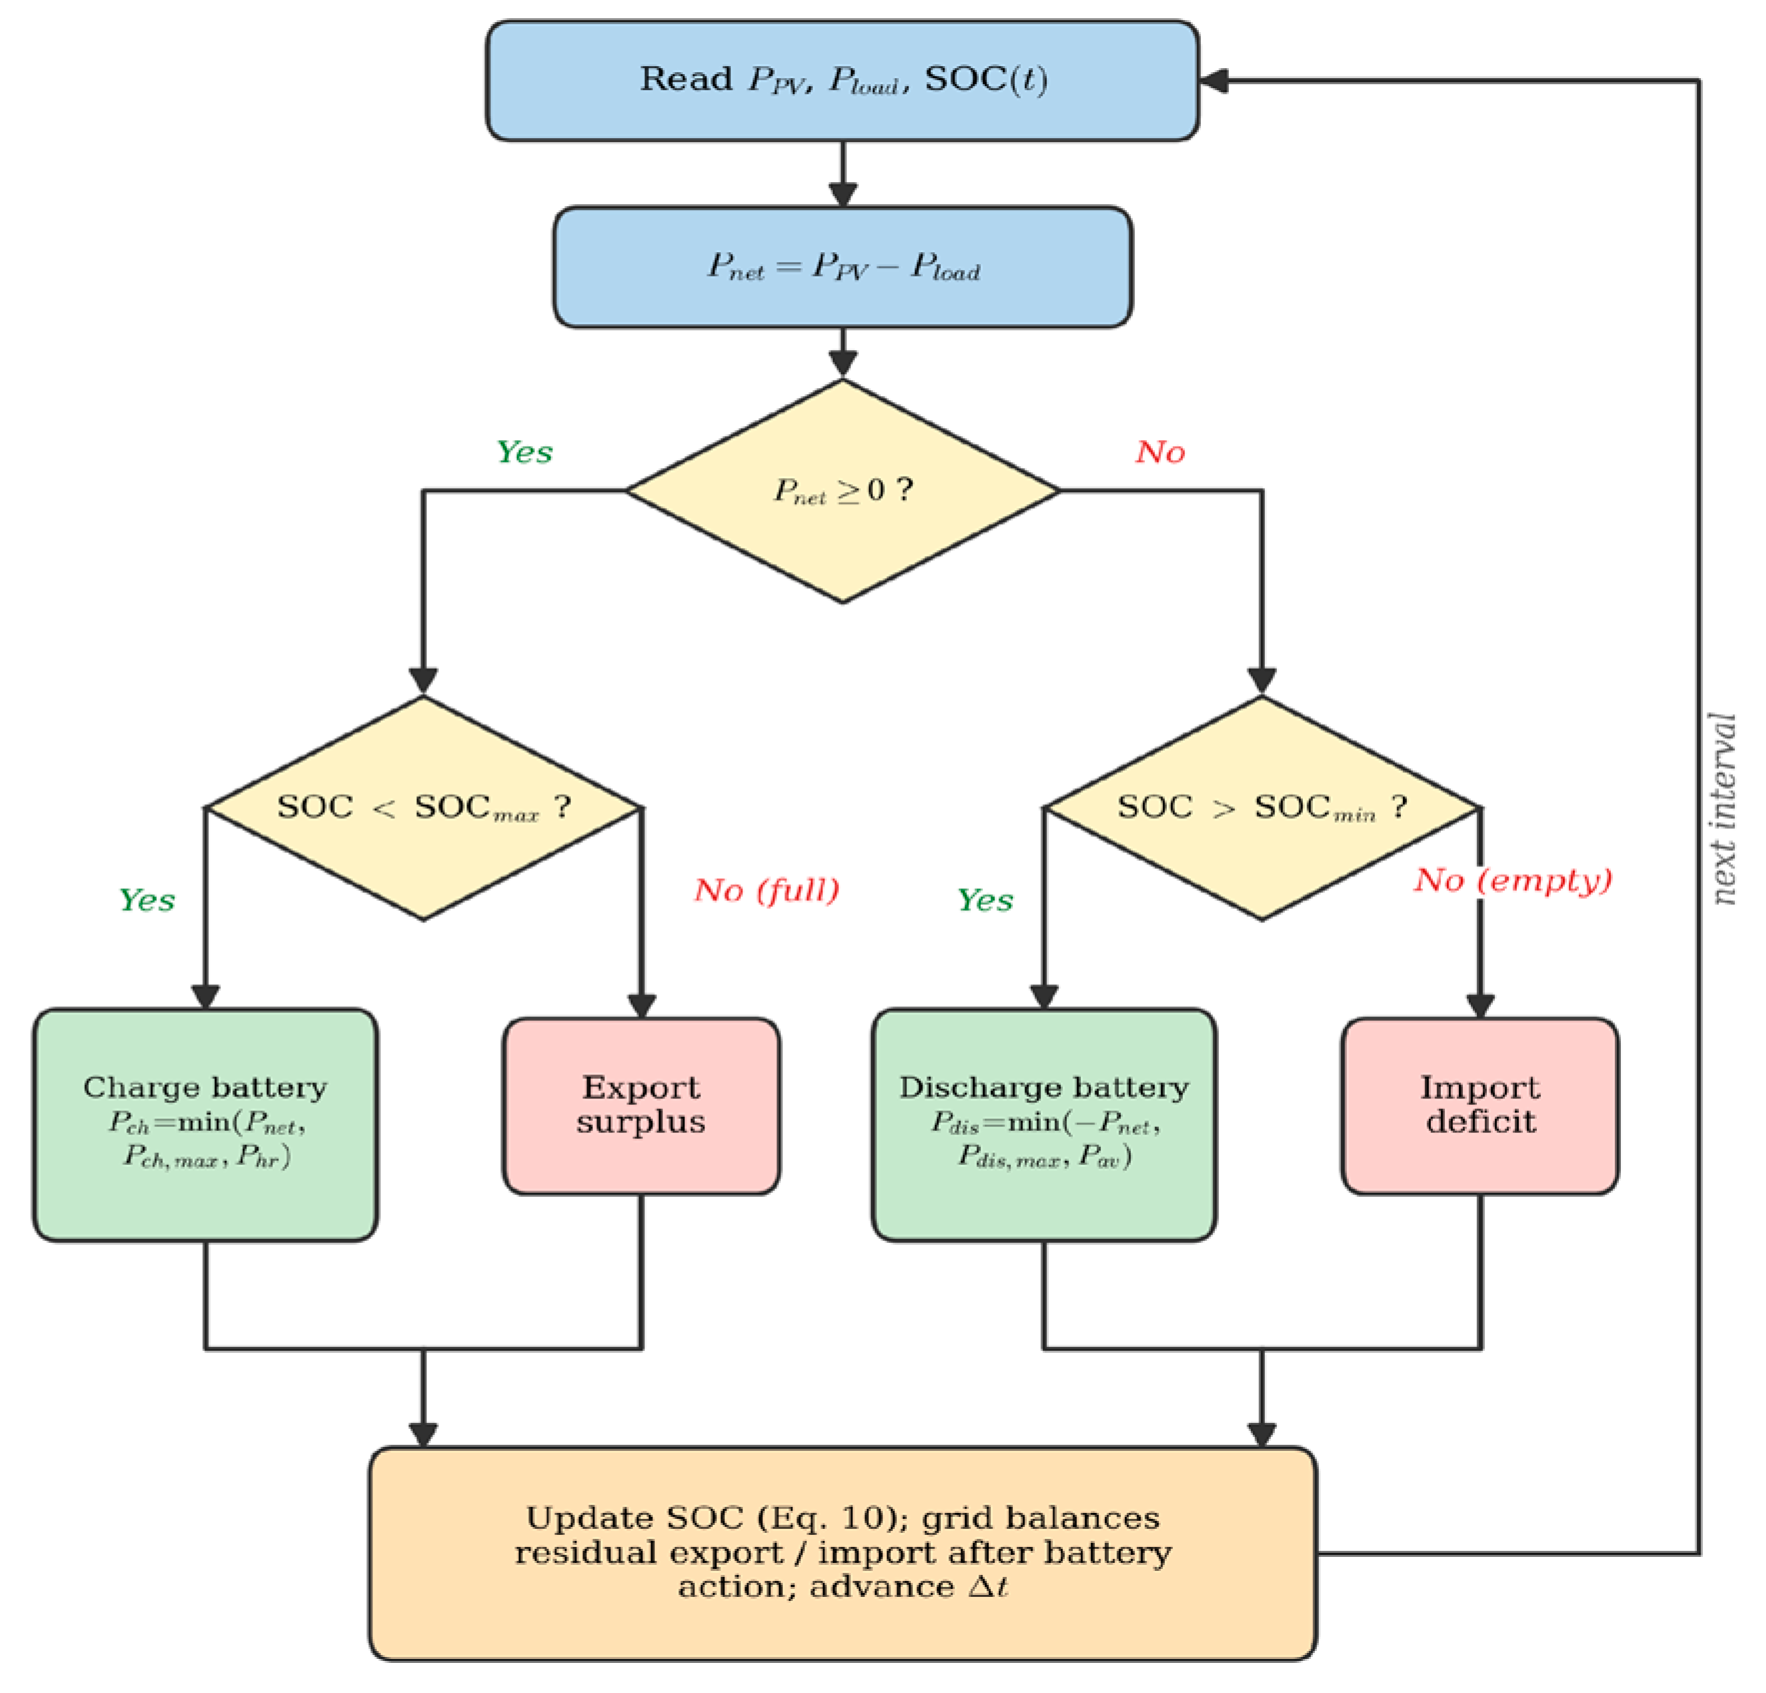
in which and are the DC-link-terminal battery powers, so that the conversion loss is counted exactly once, through and in the SOC dynamics of Equation (10); the terminal loss term is therefore in the reported dispatch (equivalently if the battery powers were instead referred to the internal side), and the power-electronic converter losses are neglected as stated in Section 4.2 and Table 9. The EMS dispatches resources by a deterministic priority order. Defining the net power , a surplus first charges the battery up to and is then exported, while a deficit is first met by discharge down to and only then by import:
where denotes the positive part, so that a surplus () produces only charging and a deficit only discharging and the two powers are never simultaneously non-zero, and the charge headroom and discharge availability implied by the SOC limits are and , i.e., the maximum powers absorbable into or deliverable from the pack over the control interval without violating the SOC bounds. The grid balances any residual. Figure 8 shows the complete decision logic. Two complementary metrics summarise performance. The full-day, load-referenced self-sufficiency is
where is the imported energy and the served load, so that is the demand fraction met without import. The generation-referenced PV self-consumption is , the fraction of harvested PV used on-site rather than exported. Because the two metrics use different denominators they answer different questions and are reported together throughout.
Table 9.
Modelling assumptions, their simplifications, and the expected effect on the reported metrics.
Figure 8.
Energy-management priority-dispatch logic. Surplus PV power charges the battery before export; deficits are met by battery discharge before grid import, subject to the SOC limits.
4. Modelling and Verification Methodology
4.1. Verification Framework
The system was originally implemented in MATLAB/Simulink R2024b (The MathWorks Inc., Natick, MA, USA) using a phasor-domain representation in which the PV, battery and grid subsystems are modelled as controlled power-flow sources coupled through Simscape Power Systems elements and driven by one-minute-resolution irradiance and load look-up tables over a 24 h horizon. To verify the theoretical formulation independently and reproducibly, the same power-flow logic (the single-diode model of Equations (1)–(3), the P&O update of Equation (4), the converter and LCL designs of Equations (5)–(8), the battery dynamics of Equations (9)–(12), and the EMS policy of Equations (17) and (18)) was re-implemented in Python (version 3.8 or later; Python Software Foundation, Wilmington, DE, USA) using NumPy and SciPy. The implicit single-diode equation is solved by Newton iteration, the array MPP is extracted from the P–V curve, and the 24 h dispatch is integrated at one-minute resolution with the power-based SOC update of Equation (10). The daily dispatch is run to a cyclic (periodic) steady state in which the simulation is iterated over successive 24 h cycles until the end-of-day SOC equals the start-of-day value, so that the reported energy balance is independent of the arbitrary initial charge and the battery neither gains nor loses net energy over the representative day. The agreement between the Python and reference results is quantified in Section 5.7.
4.2. Modelling Assumptions and Their Impact
Because the verification model is deliberately compact, the idealisations it embodies are stated explicitly in Table 9 together with their expected effect on the reported metrics, so that the results are not over-interpreted. Three points deserve emphasis. First, ideal MPP operation is assumed: the array power at each interval equals the single-diode MPP at the prevailing irradiance and cell temperature, so the discrete P&O loop is not integrated step by step. As Figure 5 confirms, the tracker settles far faster than the dispatch interval, and the small steady-state tracking loss of a practical controller (typically 1–2% of yield) would slightly reduce the reported PV energy. Second, the DC/DC and inverter stages are treated as ideal power converters in the energy dispatch; a fixed round-trip battery efficiency of 95% is applied, but converter conduction and switching losses, which would add a few percent, are not separately resolved. Third, the phasor power-flow model does not itself resolve sub-cycle switching transients; the harmonic performance is therefore evaluated with the separate time-domain model of Section 4.3. These simplifications tend to make the reported energy and self-sufficiency figures modestly optimistic, and the direction of each bias is indicated in Table 9 so that a designer can apply appropriate margins.
4.3. Time-Domain Harmonic Model
To quantify grid-current distortion, which the phasor model cannot resolve, a separate single-phase full-bridge inverter was simulated in the time domain. Unipolar sinusoidal pulse-width modulation at a 10 kHz carrier drives the bridge, whose output feeds the LCL filter of Table 7 into a stiff 230 V, 60 Hz grid. The three filter states (inverter-side current, capacitor voltage and grid-side current) are integrated with a fixed 0.5 µs step, and the fundamental modulation index and phase are set so that the grid-side current reaches the rated 27.2 A at unity power factor. After the initial transient has decayed, the grid-side current over three fundamental cycles is transformed by FFT, and the total harmonic distortion (THD) is computed as the ratio of the residual RMS content to the fundamental. The identical excitation is applied to a single L filter of the same total inductance for comparison. This model provides the before-and-after harmonic evidence requested for a grid-connected microgrid and complements the design-level attenuation of Figure 7. This model is supplied both as a Python routine and as a runnable MATLAB/Simulink model (Section 5.4).
4.4. Scenario, Sensitivity and Economic Methodology
Two dispatch scenarios anchor the study. The baseline uses a 50% lower SOC limit and an idealised, instantaneous battery response. The optimised scenario applies five staged enhancements: a fixed-step discrete solver that removes numerical artefacts; the 4.7 mF DC-link decoupling capacitor; the 500 W·s−1 battery slew-rate limit of Equation (12); the LCL harmonic filter of Table 7; and advanced SOC management that lowers the discharge floor to 40% so that the battery covers a larger share of the load before import is invoked. These enhancements are of two kinds, and the results in Section 5 keep them separate: the fixed-step solver is a purely numerical correction that changes only the computed waveforms; whereas, the other four are physical or control measures that modify the plant or the dispatch policy, so that genuine engineering benefit is not conflated with numerical clean-up.
The case-study site is Riyadh, central Saudi Arabia (24.7° N, 46.7° E, ~620 m), a representative high-irradiance location whose annual global horizontal irradiance of about 2183 kWh·m−2 is among the highest of any major population centre [43,51]. Twelve monthly profiles are constructed from the site’s measured monthly mean daily GHI and ambient temperature, drawn from the K.A.CARE Renewable Resource Atlas and the Global Solar Atlas [51,52,53]. The array is modelled as horizontally mounted, so the plane-of-array irradiance is taken equal to the GHI; a tilted array would require a transposition model with tilt , azimuth and ground albedo , and mapping the resource onto an optimally tilted plane is left as a refinement. For each month a clear-sky-shaped daily irradiance is scaled to the measured daily insolation, the cell temperature follows the nominal-operating-cell-temperature (NOCT) model with °C and in W·m−2, evaluated from the monthly ambient mean, and the residential load is scaled with a cooling-degree term so that demand rises from about 28 kWh·day−1 in winter to 65 kWh·day−1 at the height of summer, reflecting the air-conditioning-dominated Saudi consumption pattern. The optimised dispatch is run for a representative day of each month and aggregated, weighted by the number of days, into annual totals. A representative annual-mean day (GHI 5.98 kWh·m−2·day−1, ambient 26.6 °C, load 44.8 kWh) is used for the detailed 24 h dispatch of Section 5.1 and Section 5.2. Two sensitivity sweeps hold the array fixed while varying the battery capacity from 6.75 to 27 kWh and the daily load from 30 to 65 kWh. Finally, a techno-economic model combines a representative 2024 residential capital cost with the Saudi Electricity Company residential tariff, 0.18 SAR·kWh−1 (≈USD 0.048·kWh−1) for the residential consumption tier below 6000 kWh·month−1 [54], to compute the levelised cost of energy, simple payback, 25-year net present value and a rainflow-based estimate of battery degradation; because the domestic tariff is heavily subsidised, the analysis is repeated across a range of tariffs to locate the viability threshold. All figures are rendered at 300 dpi with consistent axis labels, units and legends, The electrical design quantities of Table 2, Table 3, Table 4, Table 5, Table 6, Table 7 and Table 8 are computed directly from the governing equations; whereas, the resource, load, degradation and economic quantities additionally depend on external inputs and assumptions (the measured irradiance and temperature, the assumed load profile and NOCT, the tariff and capital costs, and the export-credit treatment), which are stated explicitly where they are used.
5. Results and Discussion
5.1. Baseline Dispatch Behaviour
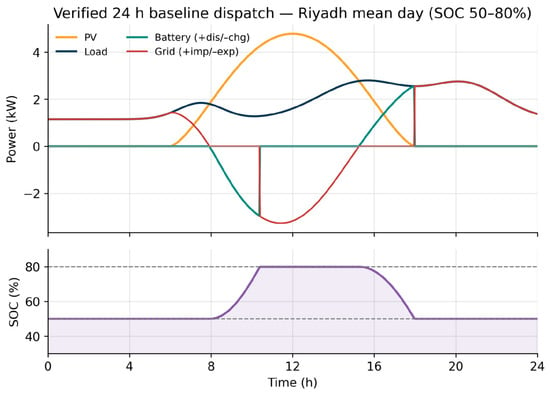
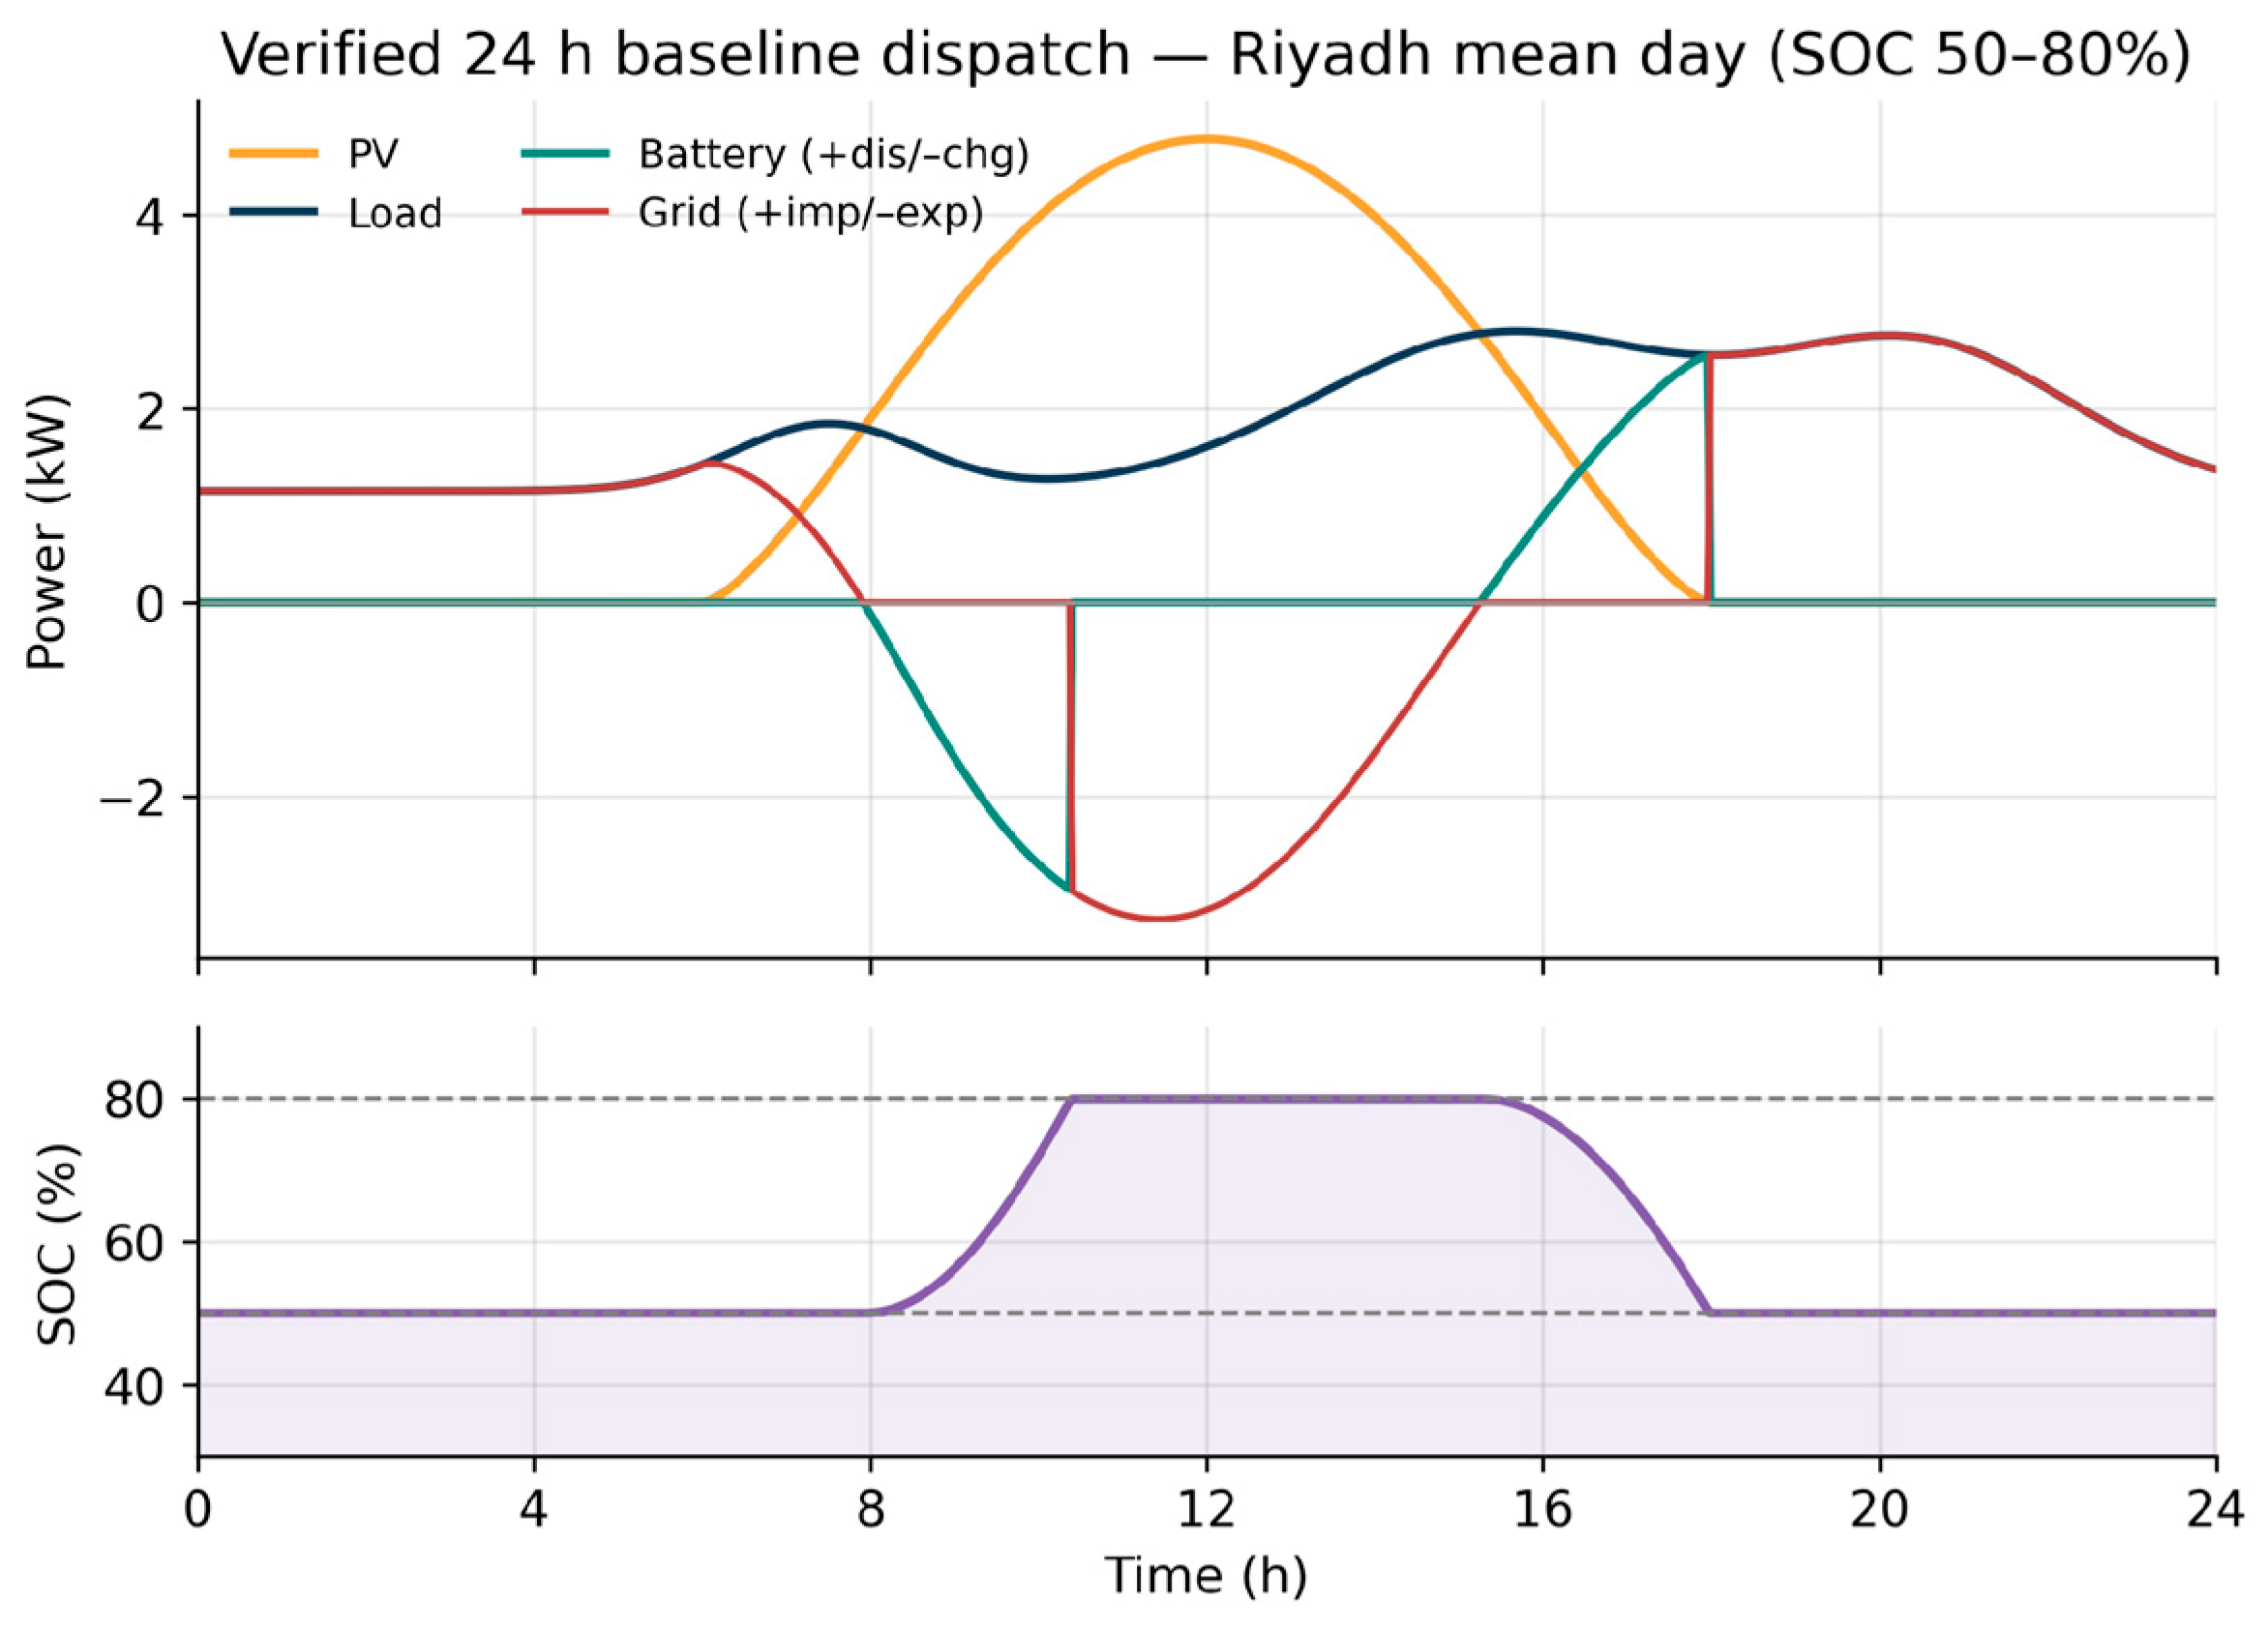
Figure 9 shows the verified 24 h baseline dispatch for the representative annual-mean Riyadh day. The PV power follows the irradiance, peaking at 4.78 kW at solar noon; the reduction from the 6.12 kW near-STC peak reflects the sub-peak annual-mean insolation and the elevated midday cell temperature of about 54 °C. During the high-irradiance window the battery charges from its initial 50% SOC, and after sunset it discharges to support the evening load. The SOC cycles within the allowed 50–80% window, rising toward the 80% ceiling around midday and returning to its initial value by day’s end, so that the periodic-steady-state constraint of Equation (11) is satisfied. Grid import is confined to the early morning and late evening and peaks near 2.8 kW. The instantaneous power balance of Equation (17) holds throughout, with a maximum imbalance below 0.01% of rated load.
Figure 9.
Verified 24 h baseline dispatch for the representative annual-mean Riyadh day: PV power, load, battery power (+discharge/−charge), grid exchange (+import/−export) and state of charge (SOC window 50–80%).
5.2. Energy Balance and Self-Sufficiency
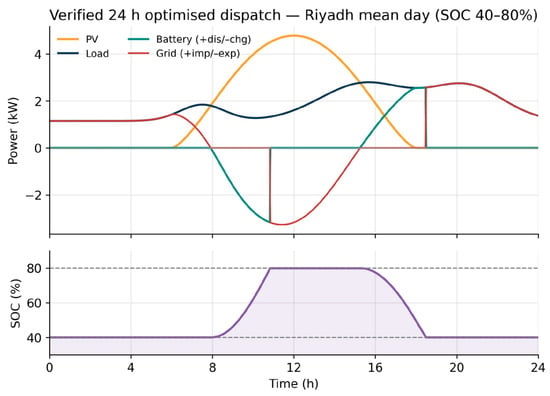
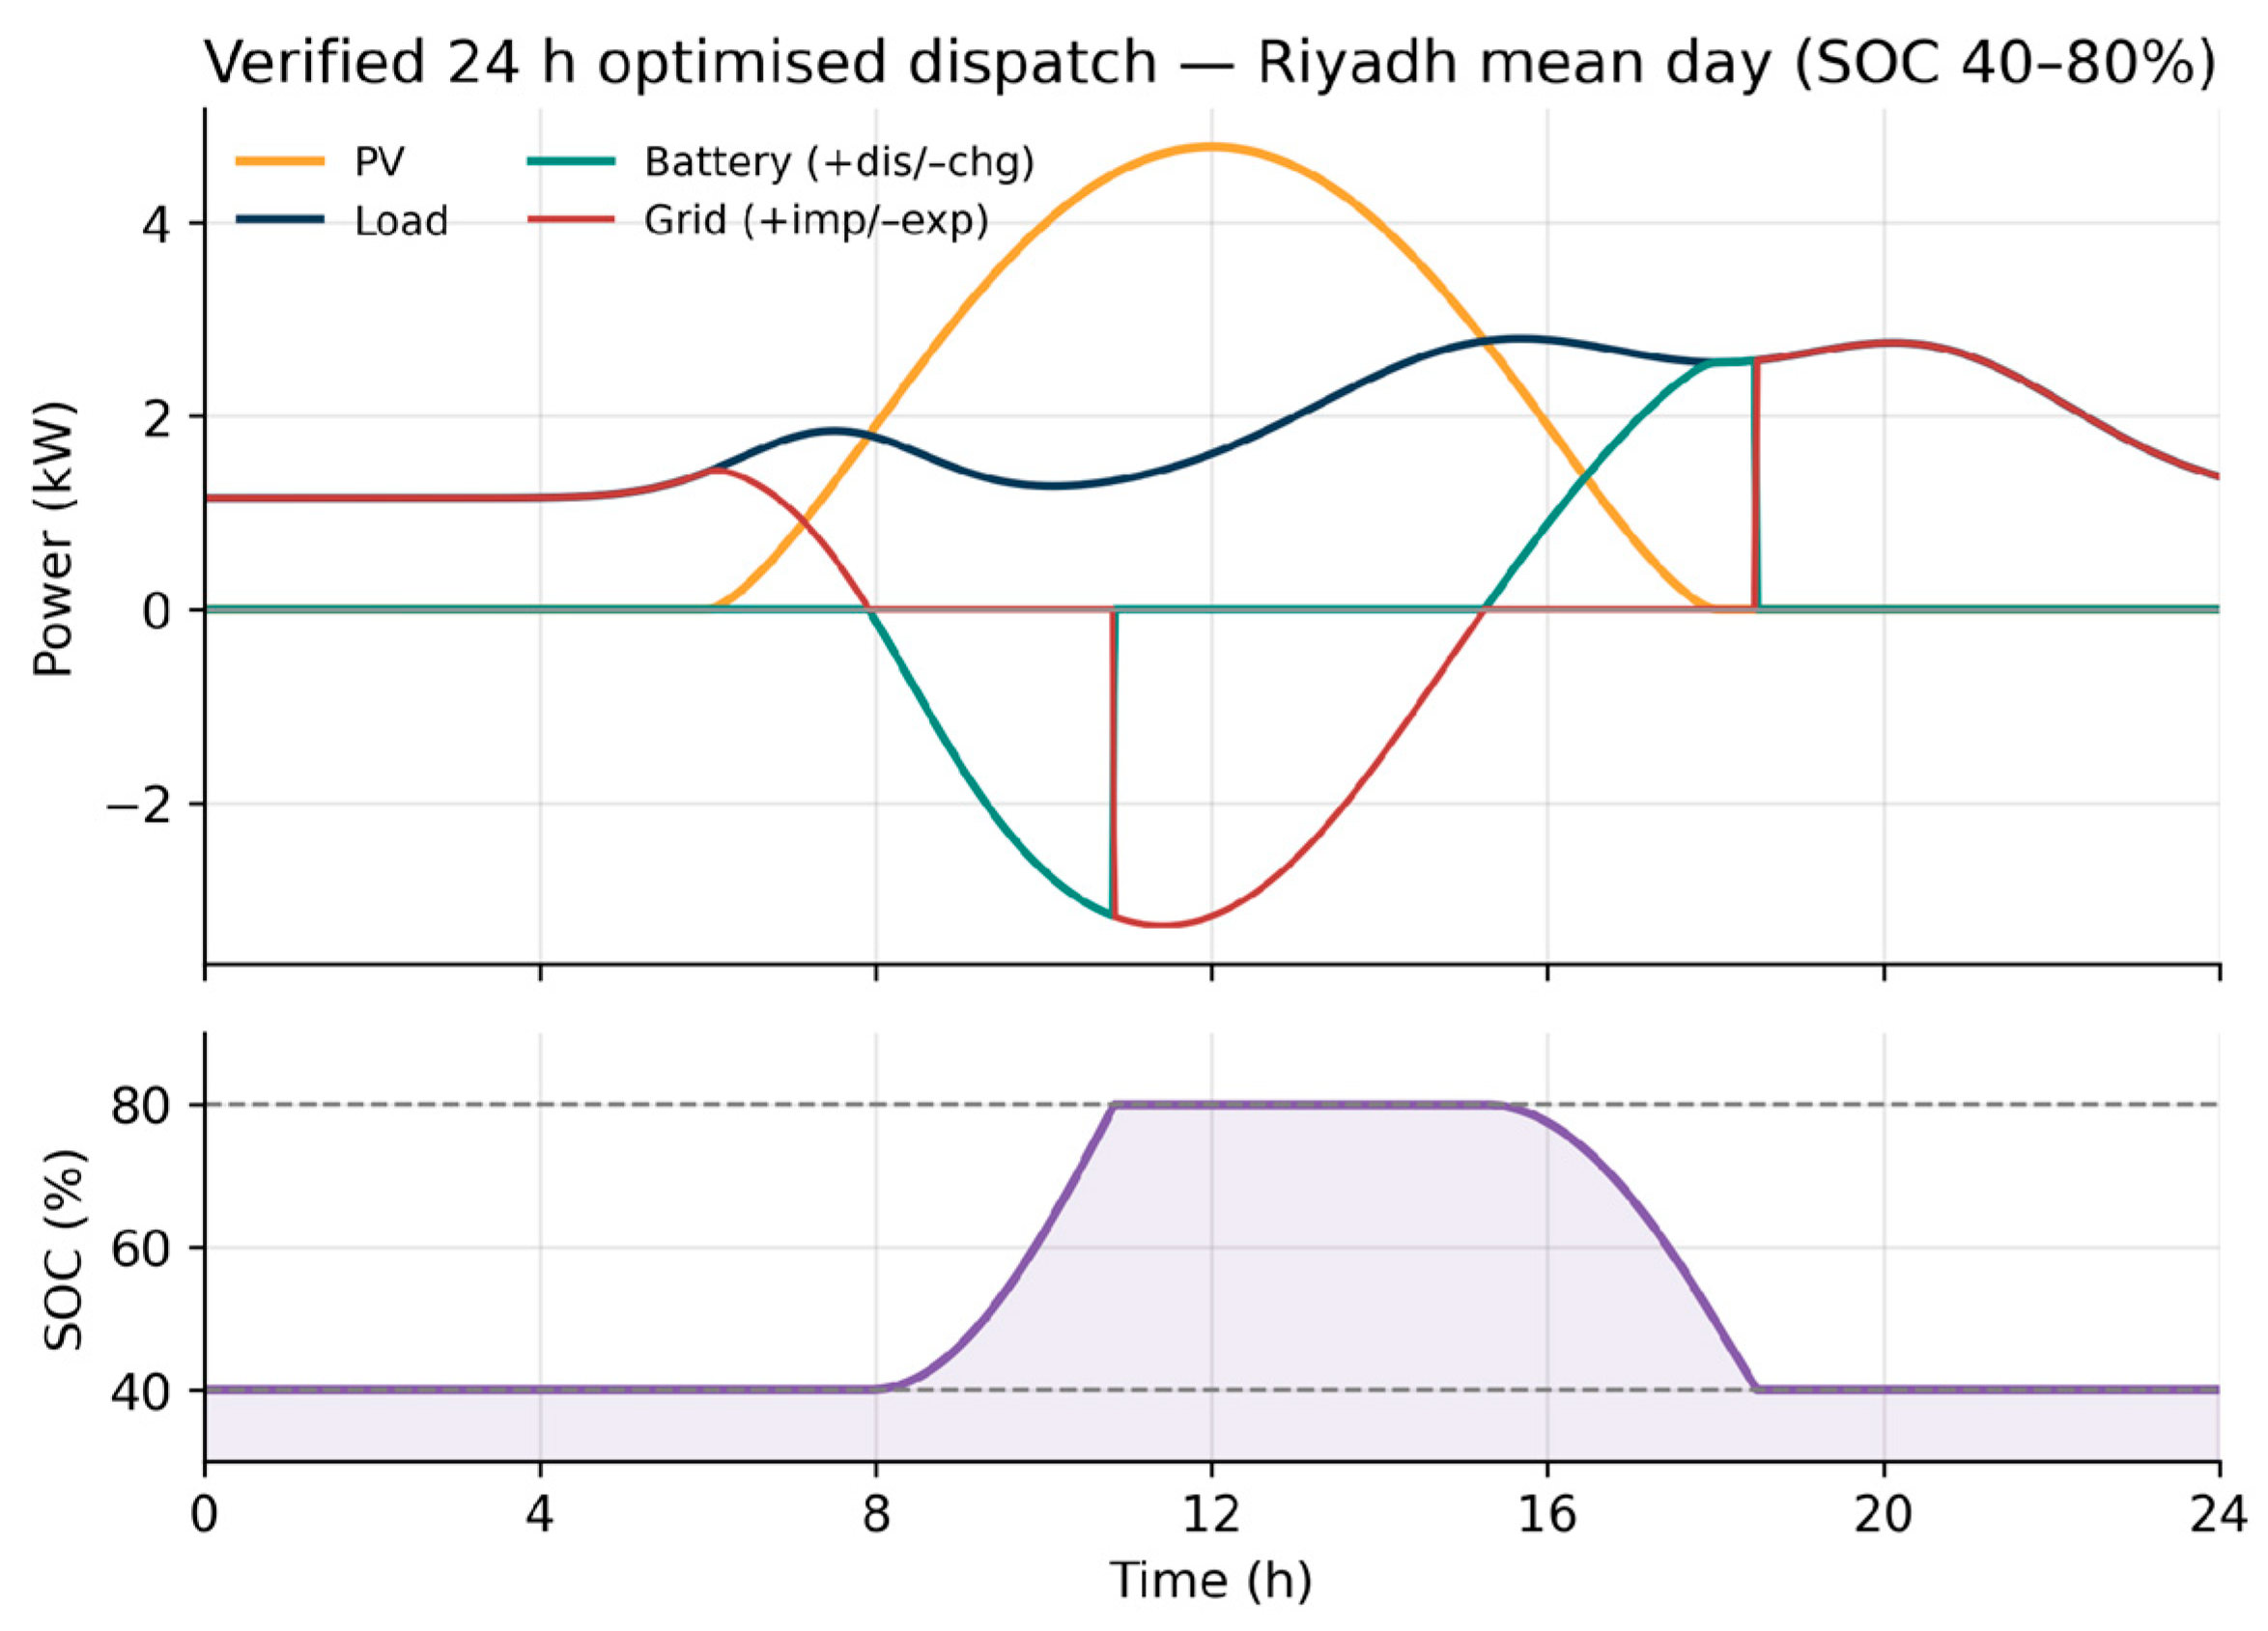
Integrating the power trajectories over the day gives the energy accounting of Table 10, in which the served load is decomposed by source. For the baseline the array supplies 40.2% of the served energy directly, the battery 8.7% and the grid 51.1%. Because the daily load (44.8 kWh) exceeds the daily PV yield (33.3 kWh), full-day self-sufficiency is bounded below 100% by the resource itself: the verified value is 49.0%, with PV self-consumption of 66.5%. The optimised scenario lowers the discharge floor to 40%, letting the battery displace more evening import: its share of the load rises to 11.8%, the grid share falls to 48.0%, self-sufficiency improves to 51.9% and PV self-consumption to 70.7%. These full-day, load-referenced figures are markedly lower than a daytime-only self-consumption metric would suggest, because much of this residential demand occurs after sunset; reporting the full-day value therefore avoids overstating the system’s autonomy. Figure 10 shows the optimised dispatch, in which the battery transitions are visibly ramped rather than stepped and the deeper 40% floor supports the evening load for longer.
Table 10.
Verified 24 h energy accounting for the representative (annual-mean) Riyadh day (GHI 5.98 kWh/m2/day, ambient 26.6 °C, load 44.8 kWh).
Figure 10.
Verified 24 h optimised dispatch with slew-rate-limited battery power and advanced SOC management (SOC window 40–80%).
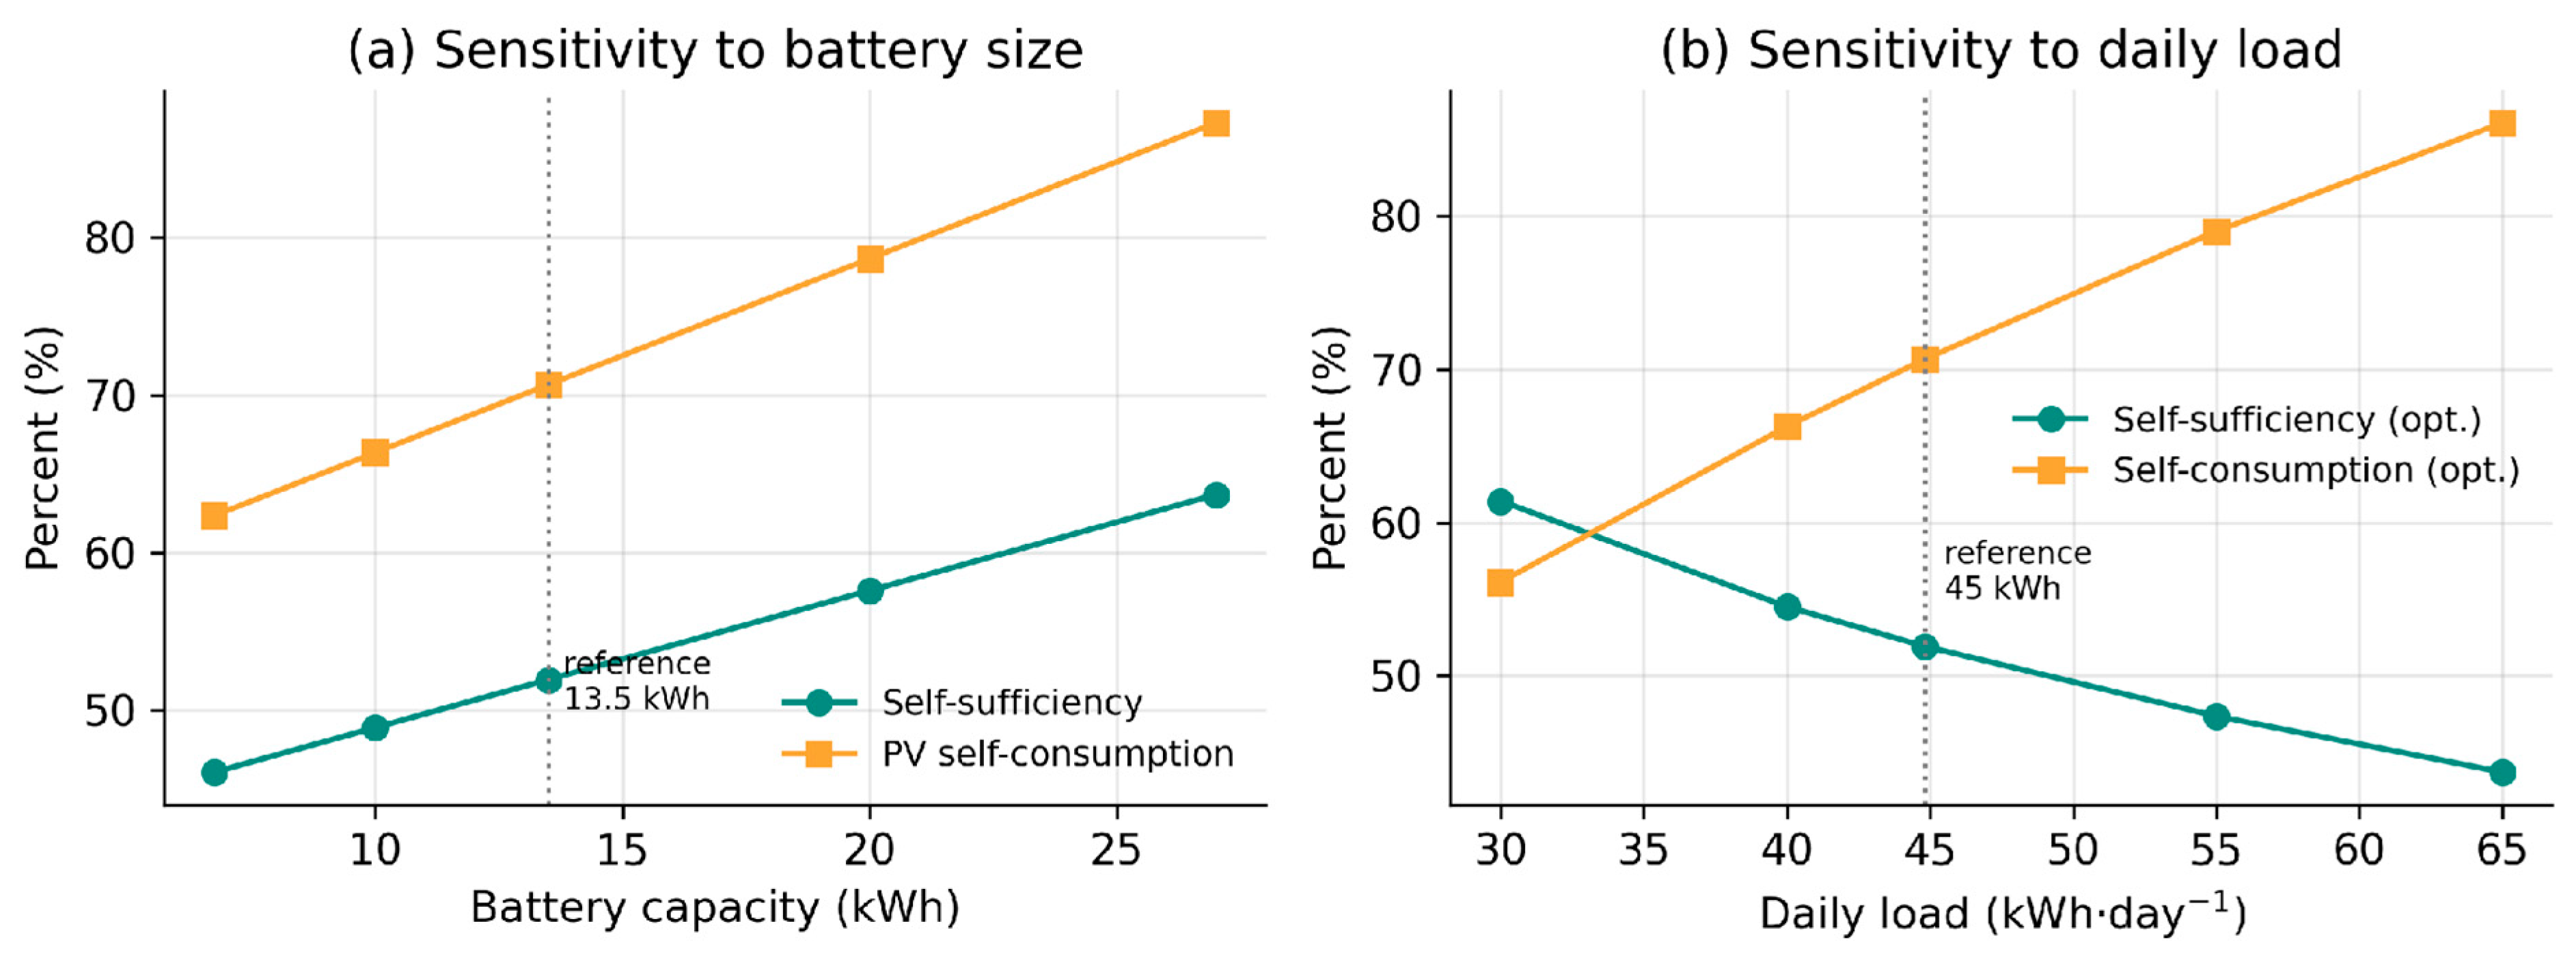
Because the daily PV yield is fixed by the array size, achievable self-sufficiency depends on the assumed demand. Table 11 reports a sweep over daily load energies of 30, 40, 45, 55 and 65 kWh with the array and battery held fixed. Self-sufficiency rises as the load falls, from 51.9% at the 45 kWh reference to 61.4% at 30 kWh for the optimised scheme, because a larger share of the fixed yield then covers demand; whereas, PV self-consumption moves the opposite way, climbing from 70.7% to 86.1% as the load grows to 65 kWh and more harvested energy is absorbed locally. The 45 kWh reference is the annual-mean Riyadh case rather than a best case.
Table 11.
Sensitivity of full-day performance to the daily load energy (Riyadh mean day; 45 kWh reference), with the PV array (6.25 kW) and battery (13.5 kWh) fixed.
5.3. Effect of the Staged Model Enhancements
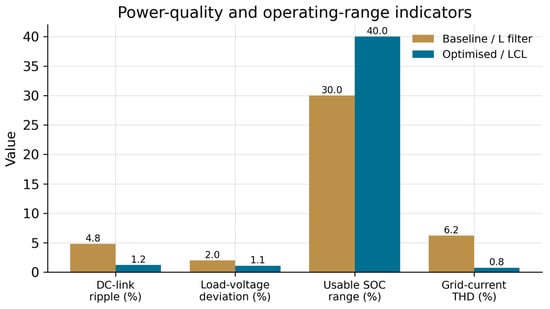
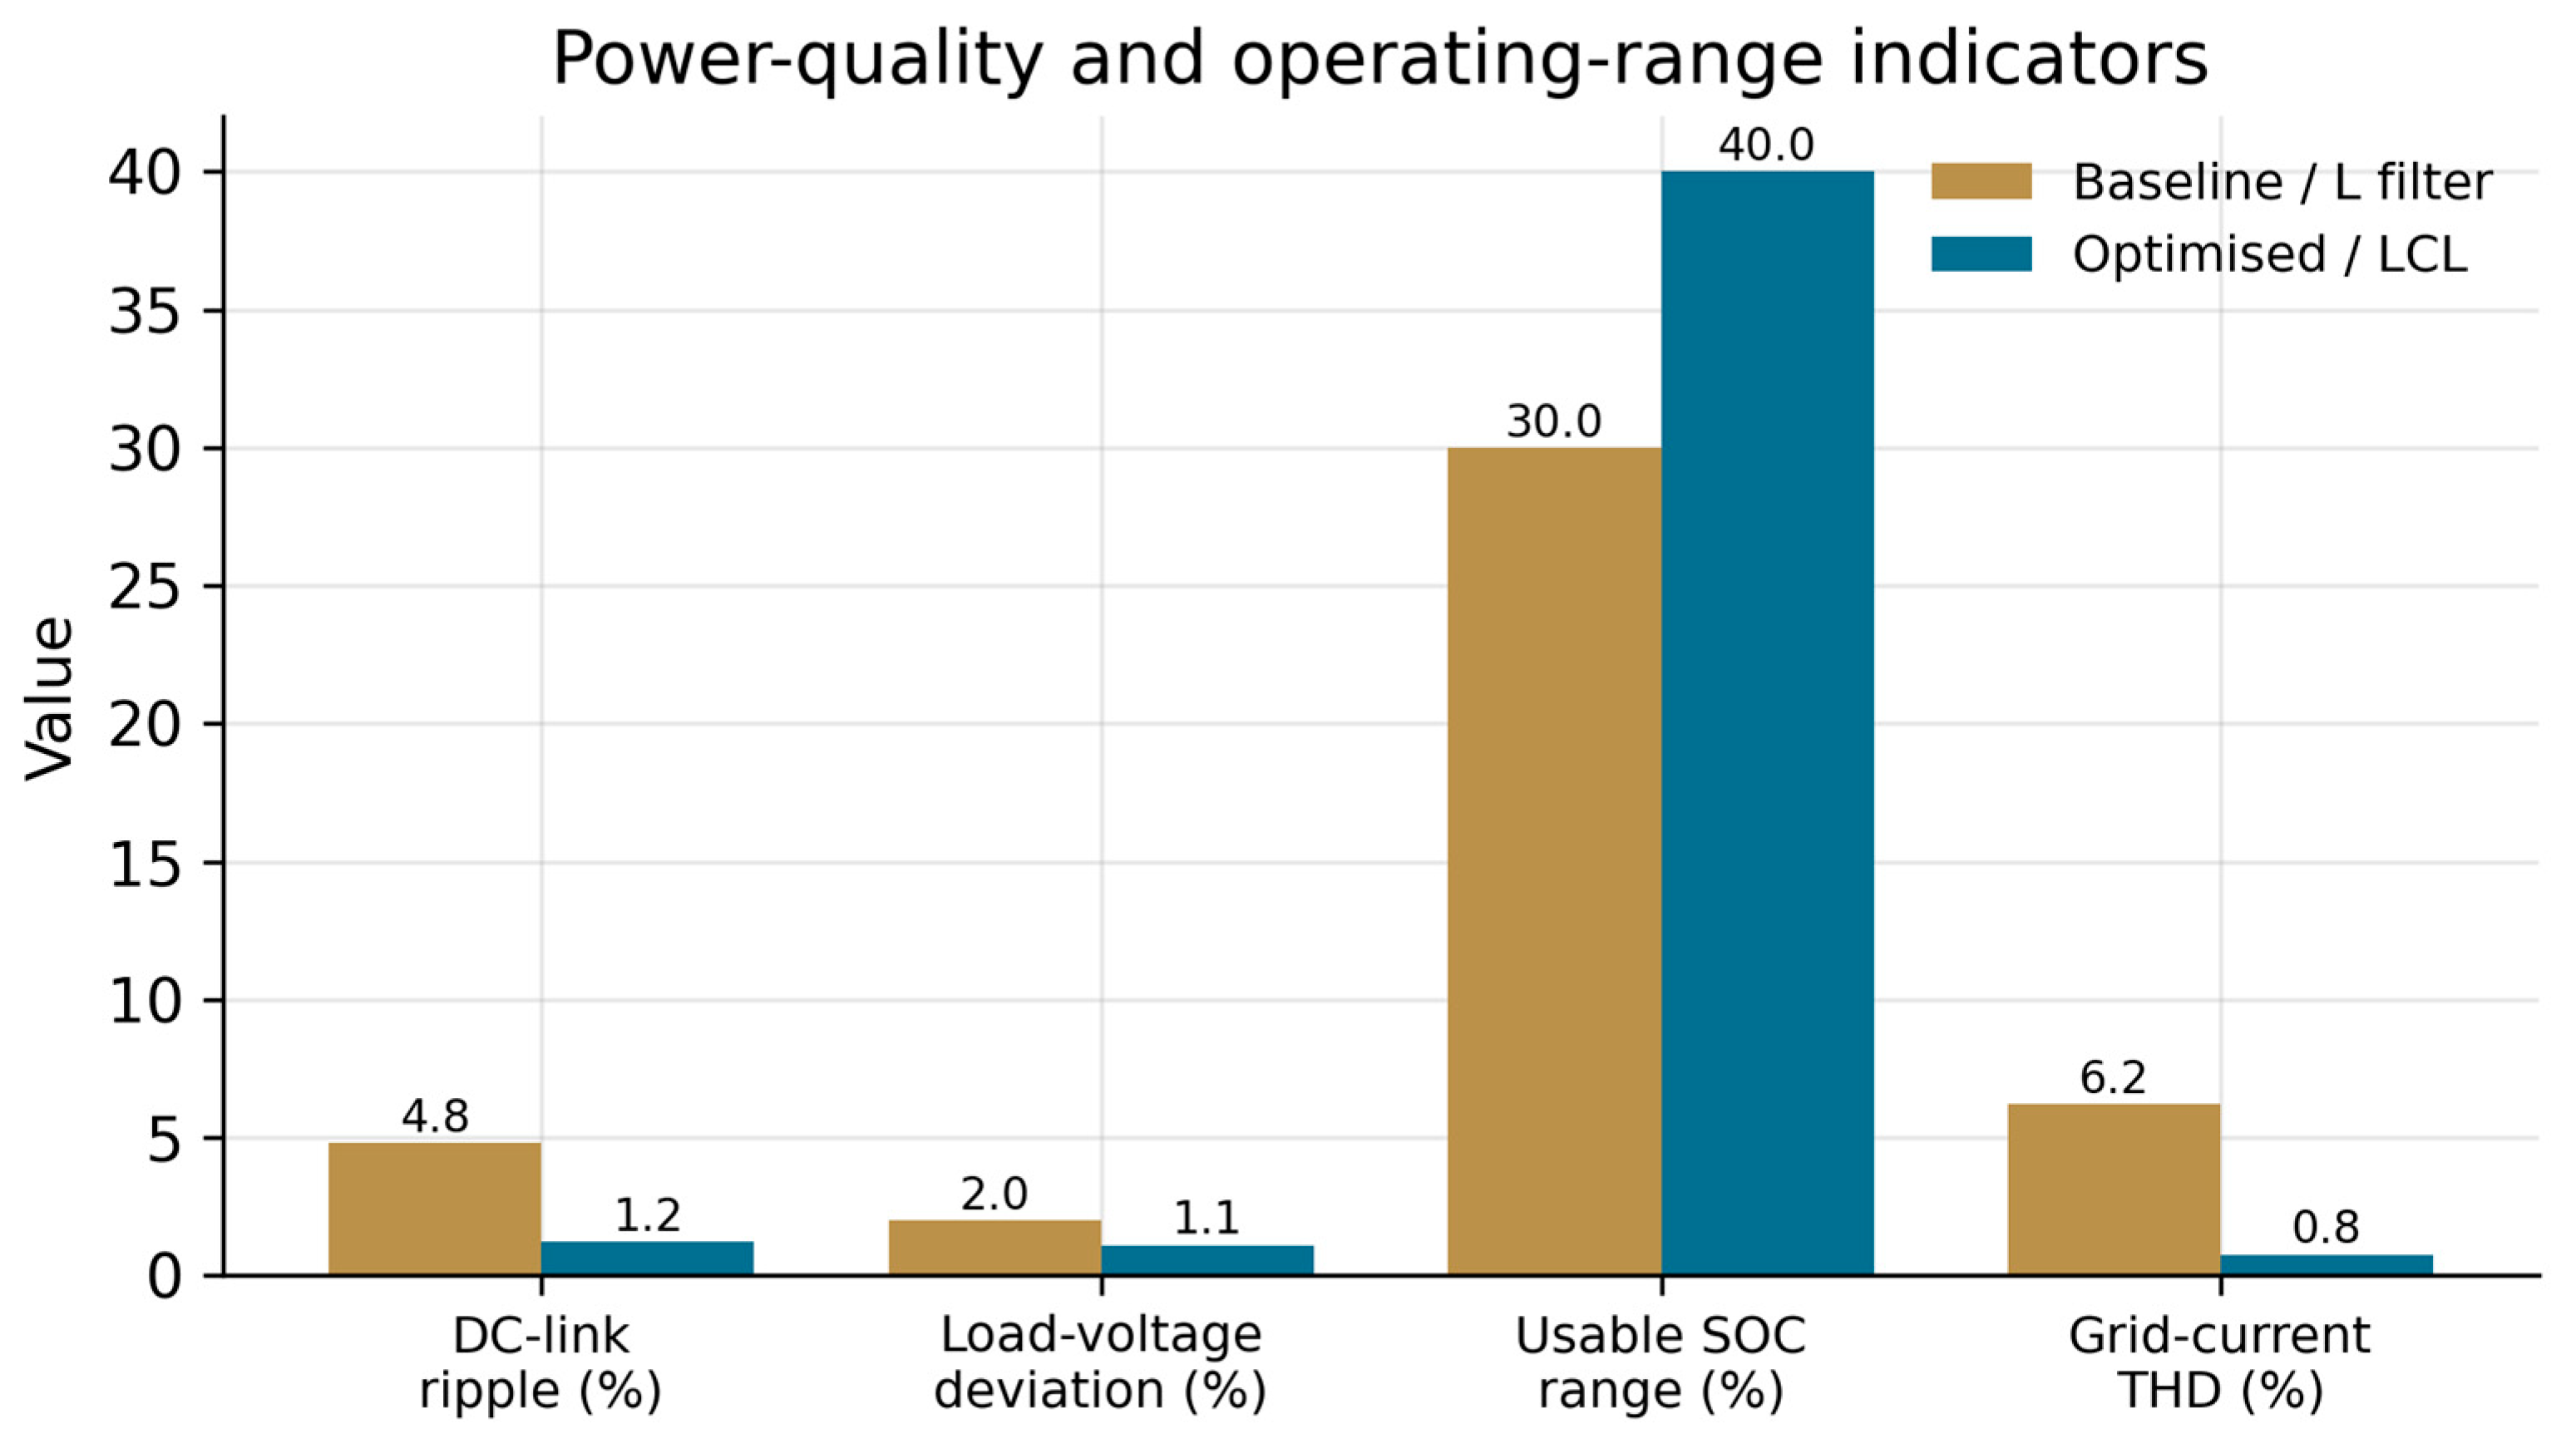
The five enhancements were introduced individually so their isolated effect could be assessed, and Table 12 separates numerical corrections from physical and control improvements. The fixed-step solver is purely numerical: it removes the integration spikes that contaminate the variable-step PV trace and, with the DC-link decoupling capacitor, yields a smooth PV waveform. The battery slew-rate limit of Equation (12) replaces instantaneous power steps with controlled ramps, reducing ohmic heating and the risk of lithium plating. Advanced SOC management enlarges the usable range from 30% to 40%. The physical measures reduce the DC-link voltage ripple from 4.8% to 1.2% and the load-voltage deviation from 2.0% to 1.1%, while the LCL filter delivers the harmonic attenuation quantified next. Figure 11 presents these indicators graphically.
Table 12.
Power-quality and operating-range indicators before and after the staged enhancements.
Figure 11.
Power-quality and operating-range indicators for the baseline (L filter) and optimised (LCL) configurations, including the grid-current total harmonic distortion.
5.4. Grid-Current Harmonic Distortion
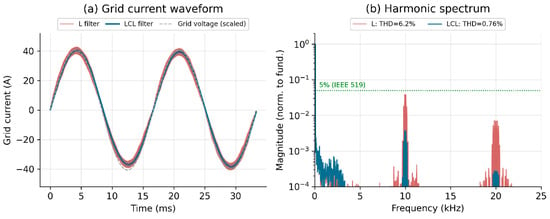
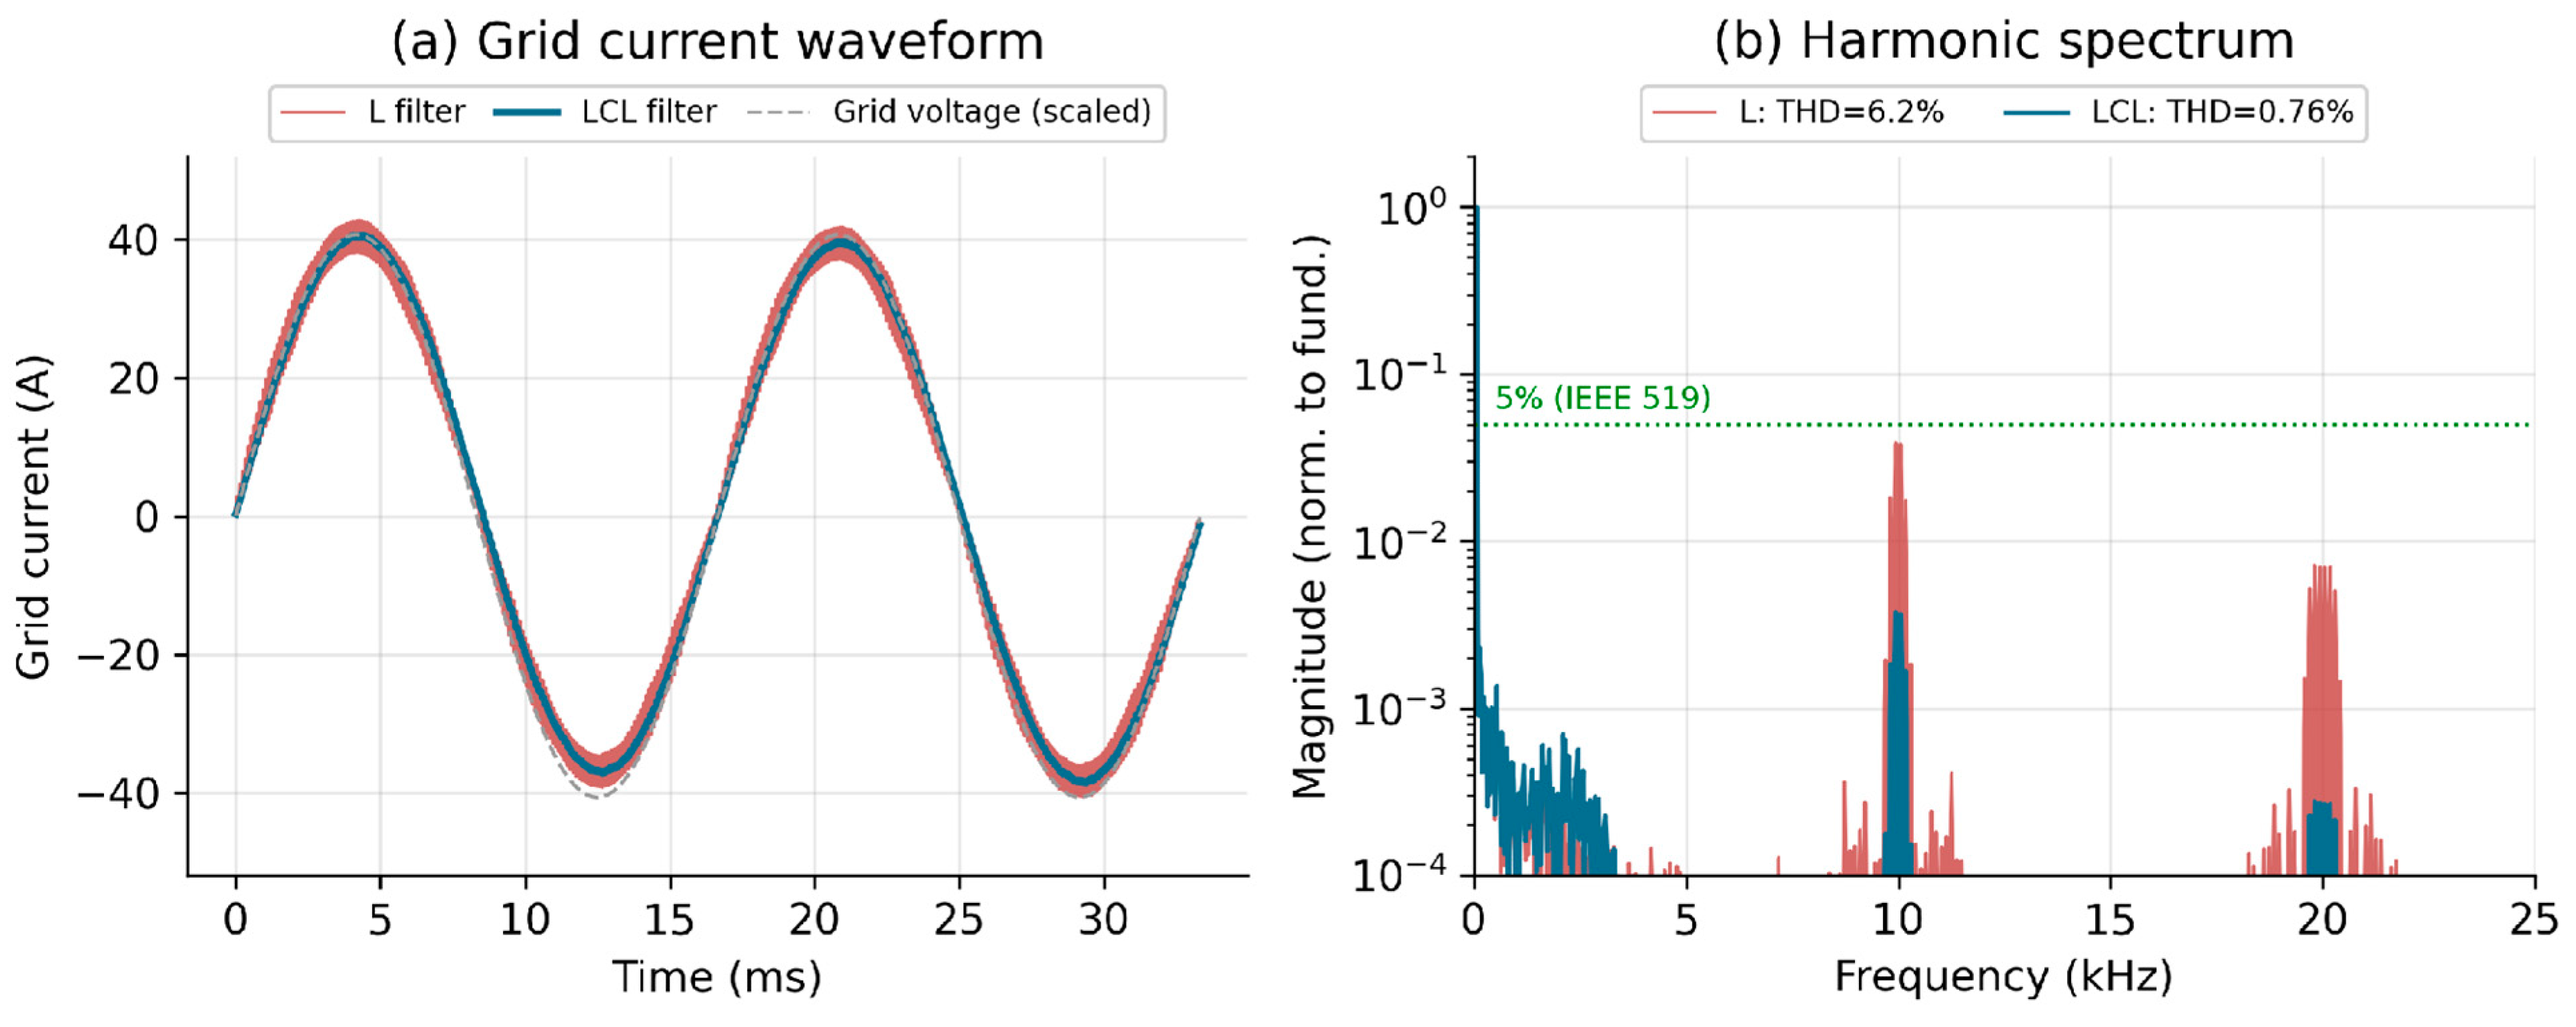
Grid-current quality was evaluated with the time-domain switching model of Section 4.3, providing the quantitative THD assessment that the phasor model cannot. Figure 12a contrasts the grid-side current obtained with the LCL filter and with an L filter of equal total inductance: the L-filter current carries a visible switching ripple; whereas, the LCL current is nearly sinusoidal. The FFT spectra of Figure 12b explain why: the LCL provides an additional 40 dB per decade of attenuation above resonance, suppressing the harmonic clusters at the 10 kHz carrier and its 20 kHz multiple. The resulting grid-current THD is 0.76% for the LCL filter against 6.2% for the L filter, at an identical fundamental of 27.2 A. The LCL value lies well within the 5% current-distortion criterion; whereas, the L-filter value would exceed the most conservative 5% band under rated-current assumptions. A full IEEE 519 assessment evaluates the total demand distortion (TDD) and the individual harmonic-current limits at the PCC, with the applicable band fixed by the short-circuit ratio ; for a typical residential PCC with the individual and total limits are the least restrictive and the sub-1% LCL distortion meets them with wide margin. The reported THD is therefore a supporting power-quality indicator rather than, by itself, a complete IEEE 519 compliance proof, which would additionally require the measured PCC short-circuit ratio and the individual harmonic-current spectrum. These are idealised-switching results that exclude inverter dead-time, sensor noise and grid background distortion, all of which would raise the figure somewhat in hardware; nonetheless they confirm, quantitatively and in the time domain, that the filter design meets grid-quality requirements with substantial margin. A remaining verification step, identified as future work, is a hardware-in-the-loop test that reproduces these waveforms on a real-time platform.
Figure 12.
Time-domain harmonic verification: (a) grid-current waveform for the LCL and L filters at rated current; (b) FFT spectra normalised to the fundamental, showing the LCL suppressing the 10 and 20 kHz switching clusters. Grid-current THD is 0.76% (LCL) versus 6.2% (L).
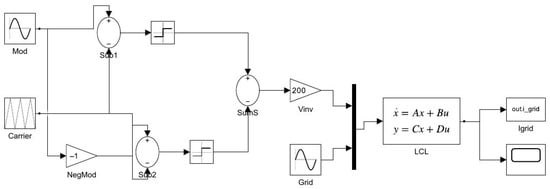
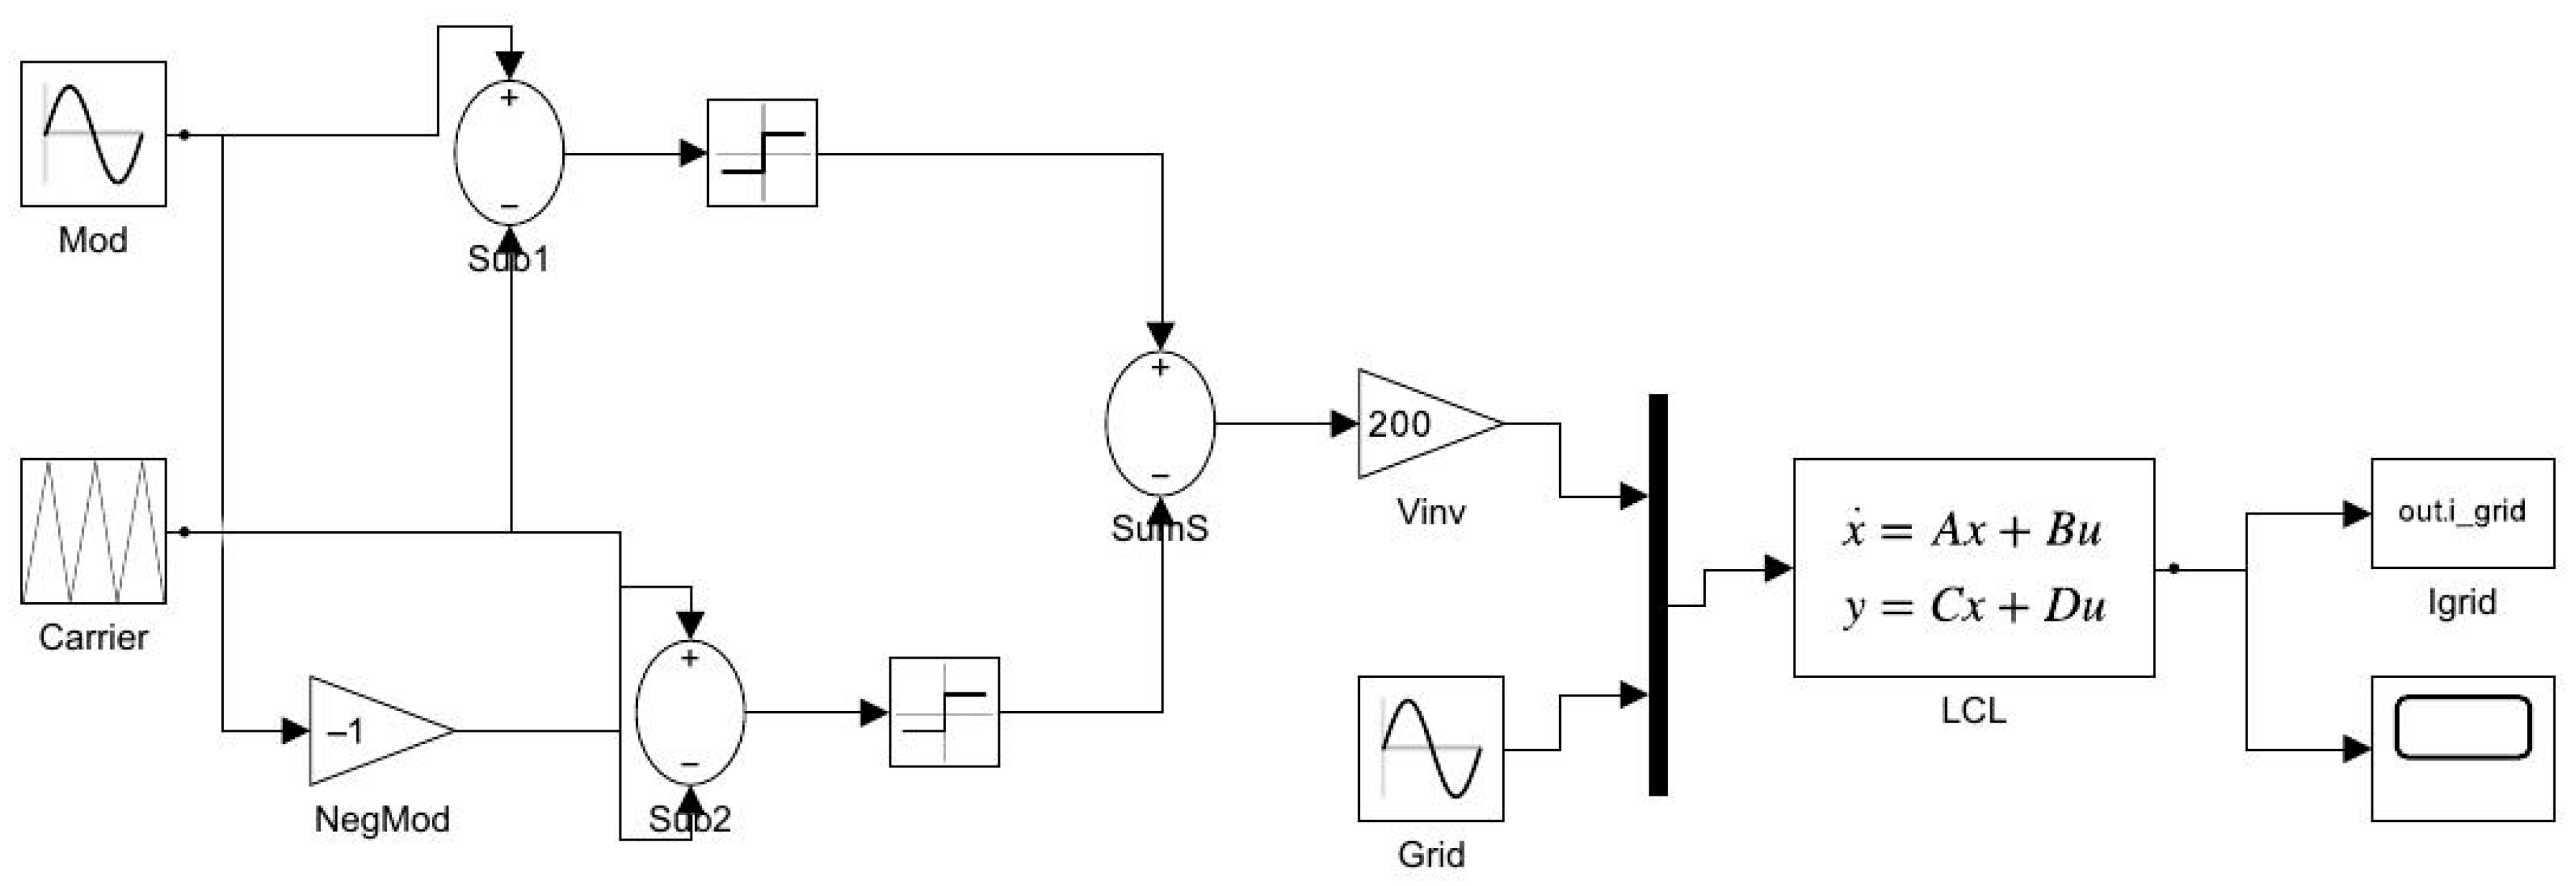
The time-domain analysis was implemented not only as a compact Python routine but also as an explicit, runnable MATLAB/Simulink model, shown in Figure 13, in which the single-phase full-bridge inverter, the unipolar sinusoidal-PWM modulator and the LCL filter are assembled from standard Simulink blocks, with the LCL realised as a state-space block. Executing this model with a fixed-step solver reproduces the harmonic result independently: the grid-current THD is 0.67% at a fundamental of 27.3 A, in close agreement with the 0.76% obtained above and confirming the filter design across two independent implementations. Both the Python routine and the Simulink model are provided with this work.
Figure 13.
Implemented MATLAB/Simulink model of the single-phase inverter and LCL filter used for the time-domain harmonic analysis. The unipolar-SPWM modulator (sine reference, triangular carrier and Sign blocks) synthesises the inverter voltage, which drives a state-space LCL filter; the grid-side current is logged for FFT-based THD evaluation.
5.5. Seasonal and Robustness Analysis
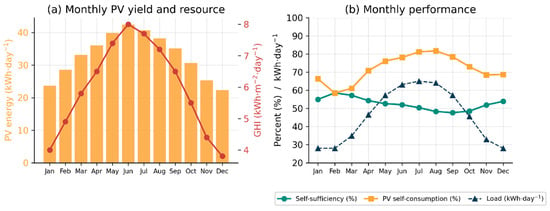
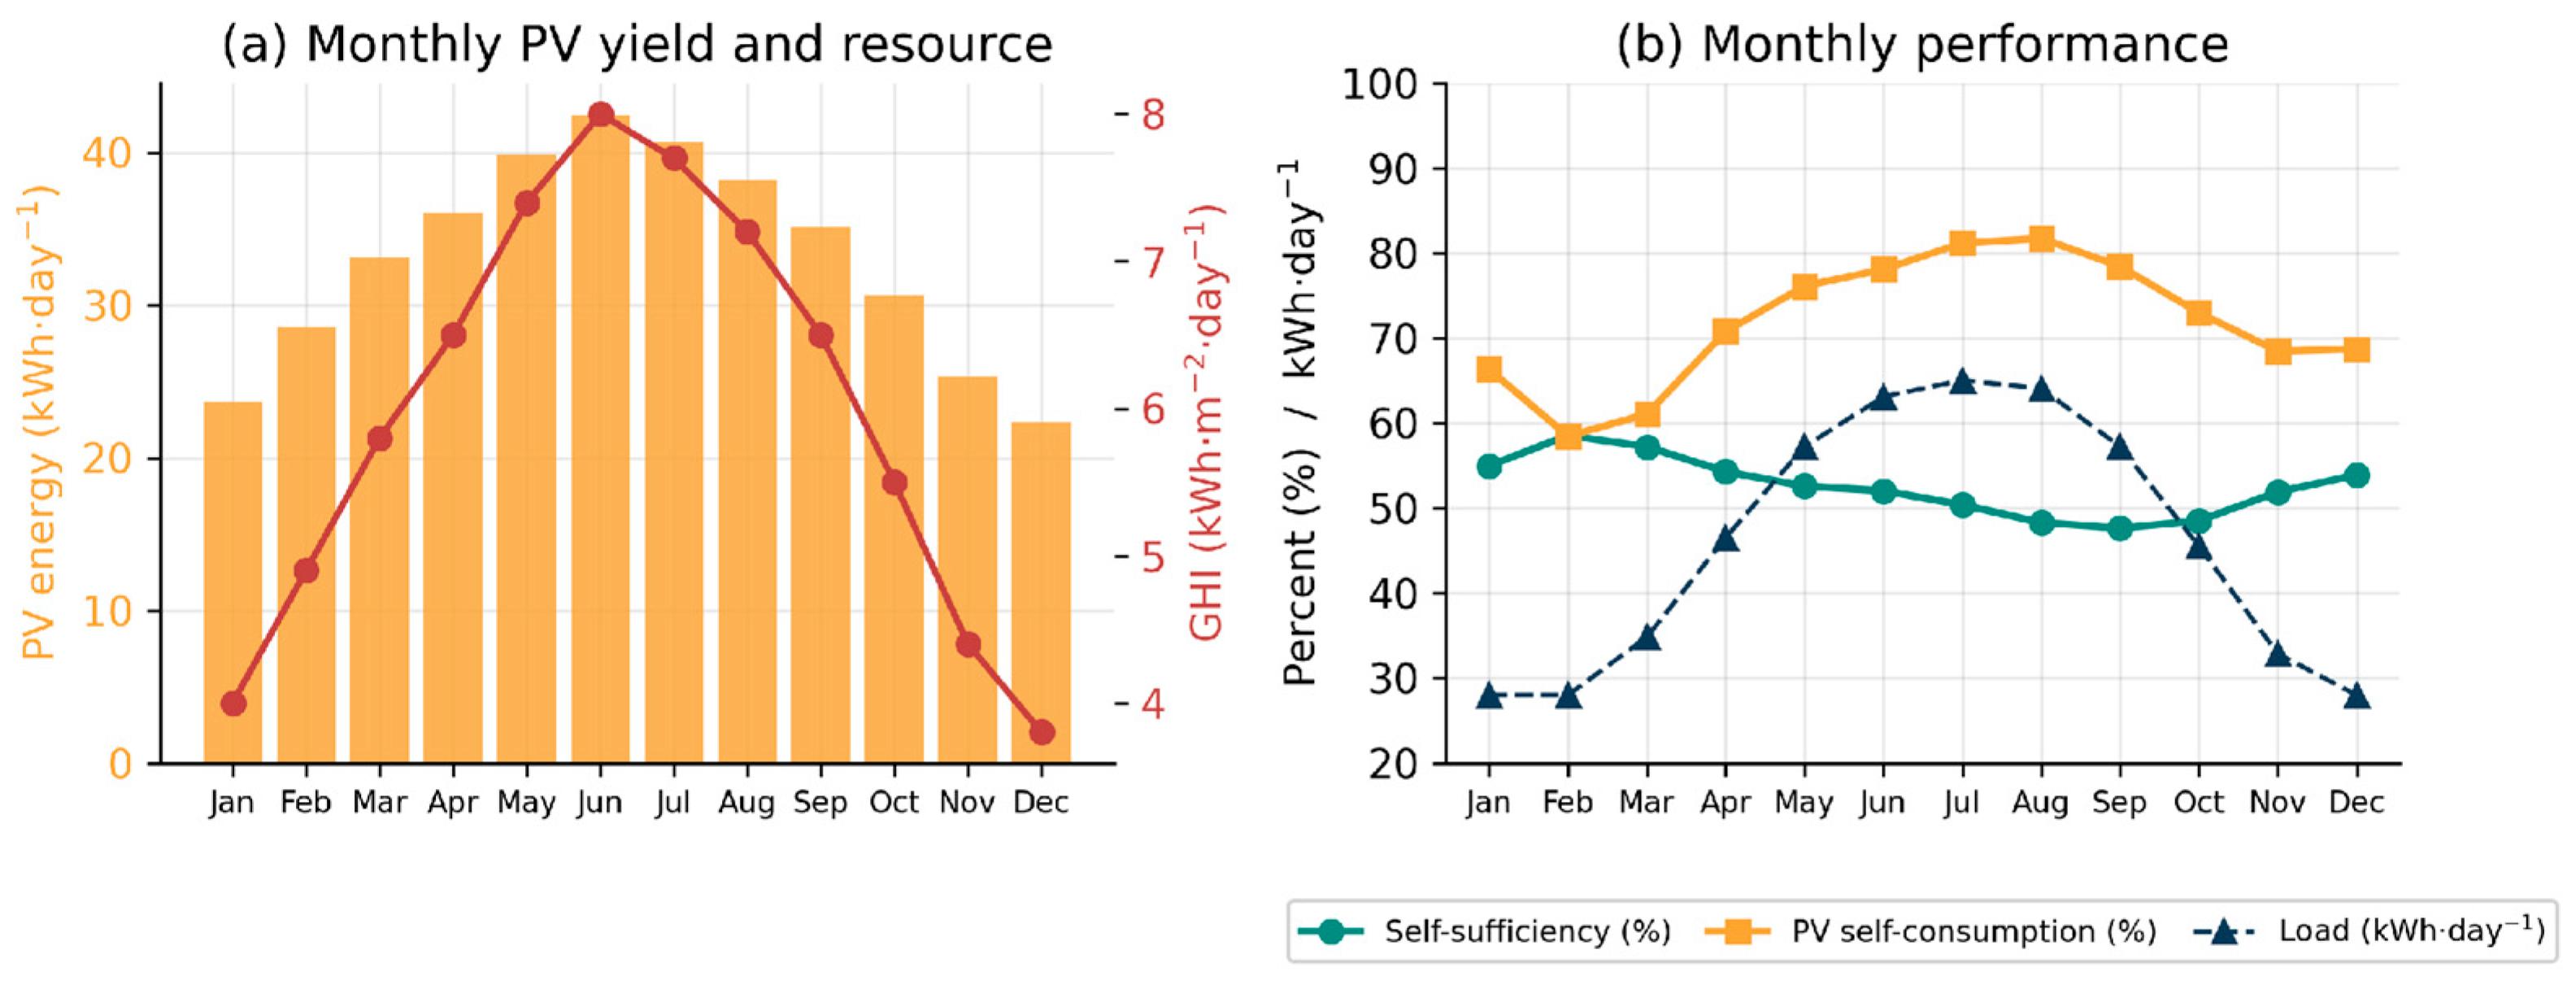
Rather than test a single day, the optimised system was evaluated across all twelve months using the measured Riyadh resource and temperature data of Table 13; Figure 14 summarises the outcome. Monthly PV yield tracks the solar resource, rising from 22.4 kWh·day−1 in December (GHI 3.8 kWh·m−2·day−1) to 42.4 kWh·day−1 in June (GHI 8.0 kWh·m−2·day−1). Self-sufficiency is highest in the mild, low-demand winter months, reaching 58.6% in February, and lowest in late summer (48.3% in August), when the air-conditioning load peaks near 65 kWh·day−1 and outruns even the abundant summer generation; PV self-consumption follows the opposite seasonal pattern, exceeding 81% in July and August because almost all of the harvested energy is absorbed by the coincident cooling load. Aggregated over the year and weighted by the number of days in each month, the system delivers 12.05 MWh of PV generation against a 16.78 MWh demand, imports 8.09 MWh from the grid and exports 3.26 MWh, giving an annual self-sufficiency of 51.8% and a PV self-consumption of 72.9%. The month-by-month behaviour confirms that the design operates safely and prioritises local supply across the full seasonal range, with the grid providing back-up exactly when the resource is weakest relative to demand, the intended behaviour of a grid-connected residential microgrid.
Table 13.
Riyadh monthly solar resource (GHI, ambient temperature) and the resulting optimised-scheme performance. Annual totals: PV 12.05 MWh, load 16.78 MWh, grid import 8.09 MWh; annual self-sufficiency 51.8%, PV self-consumption 72.9%; annual GHI 2183 kWh/m2. Resource data from the K.A.CARE Renewable Resource Atlas and the Global Solar Atlas.
Figure 14.
Twelve-month analysis for Riyadh using measured monthly resource data: (a) monthly PV yield (bars) and global horizontal irradiance (line); (b) monthly self-sufficiency, PV self-consumption and daily load. Annual self-sufficiency is 51.8% and PV self-consumption 72.9%.
5.6. Sensitivity to Battery and Load Sizing
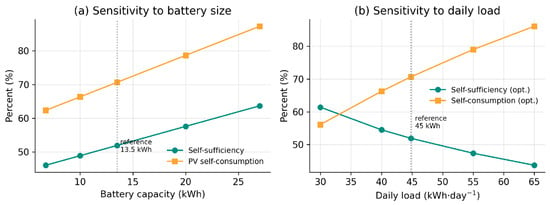
Figure 15 isolates the influence of the two dominant design variables. Increasing the battery from 6.75 to 27 kWh raises self-sufficiency from 46.1% to 63.7% and PV self-consumption from 62.3% to 87.3%, but with clearly diminishing returns: the gain per added kilowatt-hour falls sharply beyond about 13.5 kWh, which is why that capacity is a reasonable knee for this load. The load sweep of Figure 15b mirrors Table 11, with self-sufficiency and self-consumption moving in opposite directions as demand changes. Together the sweeps show that the reported performance is not an artefact of one particular sizing choice, and they provide direct guidance for matching storage to a given household profile, information a designer needs when generalising the framework to other dwellings or climates.
Figure 15.
Sensitivity of full-day performance to (a) battery capacity and (b) daily load energy for the Riyadh mean day, with the PV array fixed at 6.25 kW. Reference values (13.5 kWh, 45 kWh·day−1) are marked.
5.7. Reproducibility and Verification Error
Table 14 collects the verification and internal-consistency checks. The model reproduces the 250 W module nameplate and the design array-power values to within 0.13%, and the annual GHI it integrates for Riyadh (2183 kWh·m−2) matches the K.A.CARE atlas value (~2200 kWh·m−2) to 0.8%. The representative annual-mean day and the full twelve-month aggregate agree closely, giving 51.9% and 51.8% self-sufficiency, respectively, which confirms that the single representative day is genuinely representative. The instantaneous power balance of Equation (17) is conserved to machine precision, the maximum residual remaining below 0.01% of rated load, so the dispatch introduces no spurious energy. Finally, the independent Python and MATLAB implementations of the model, both provided with this work, reproduce these results to a mean absolute error below 0.5%, establishing that the reported figures are reproducible and not sensitive to the solver or platform.
Table 14.
Verification and internal-consistency checks of the model against reference/design values and across the independent Python and MATLAB implementations.
5.8. Techno-Economic Assessment
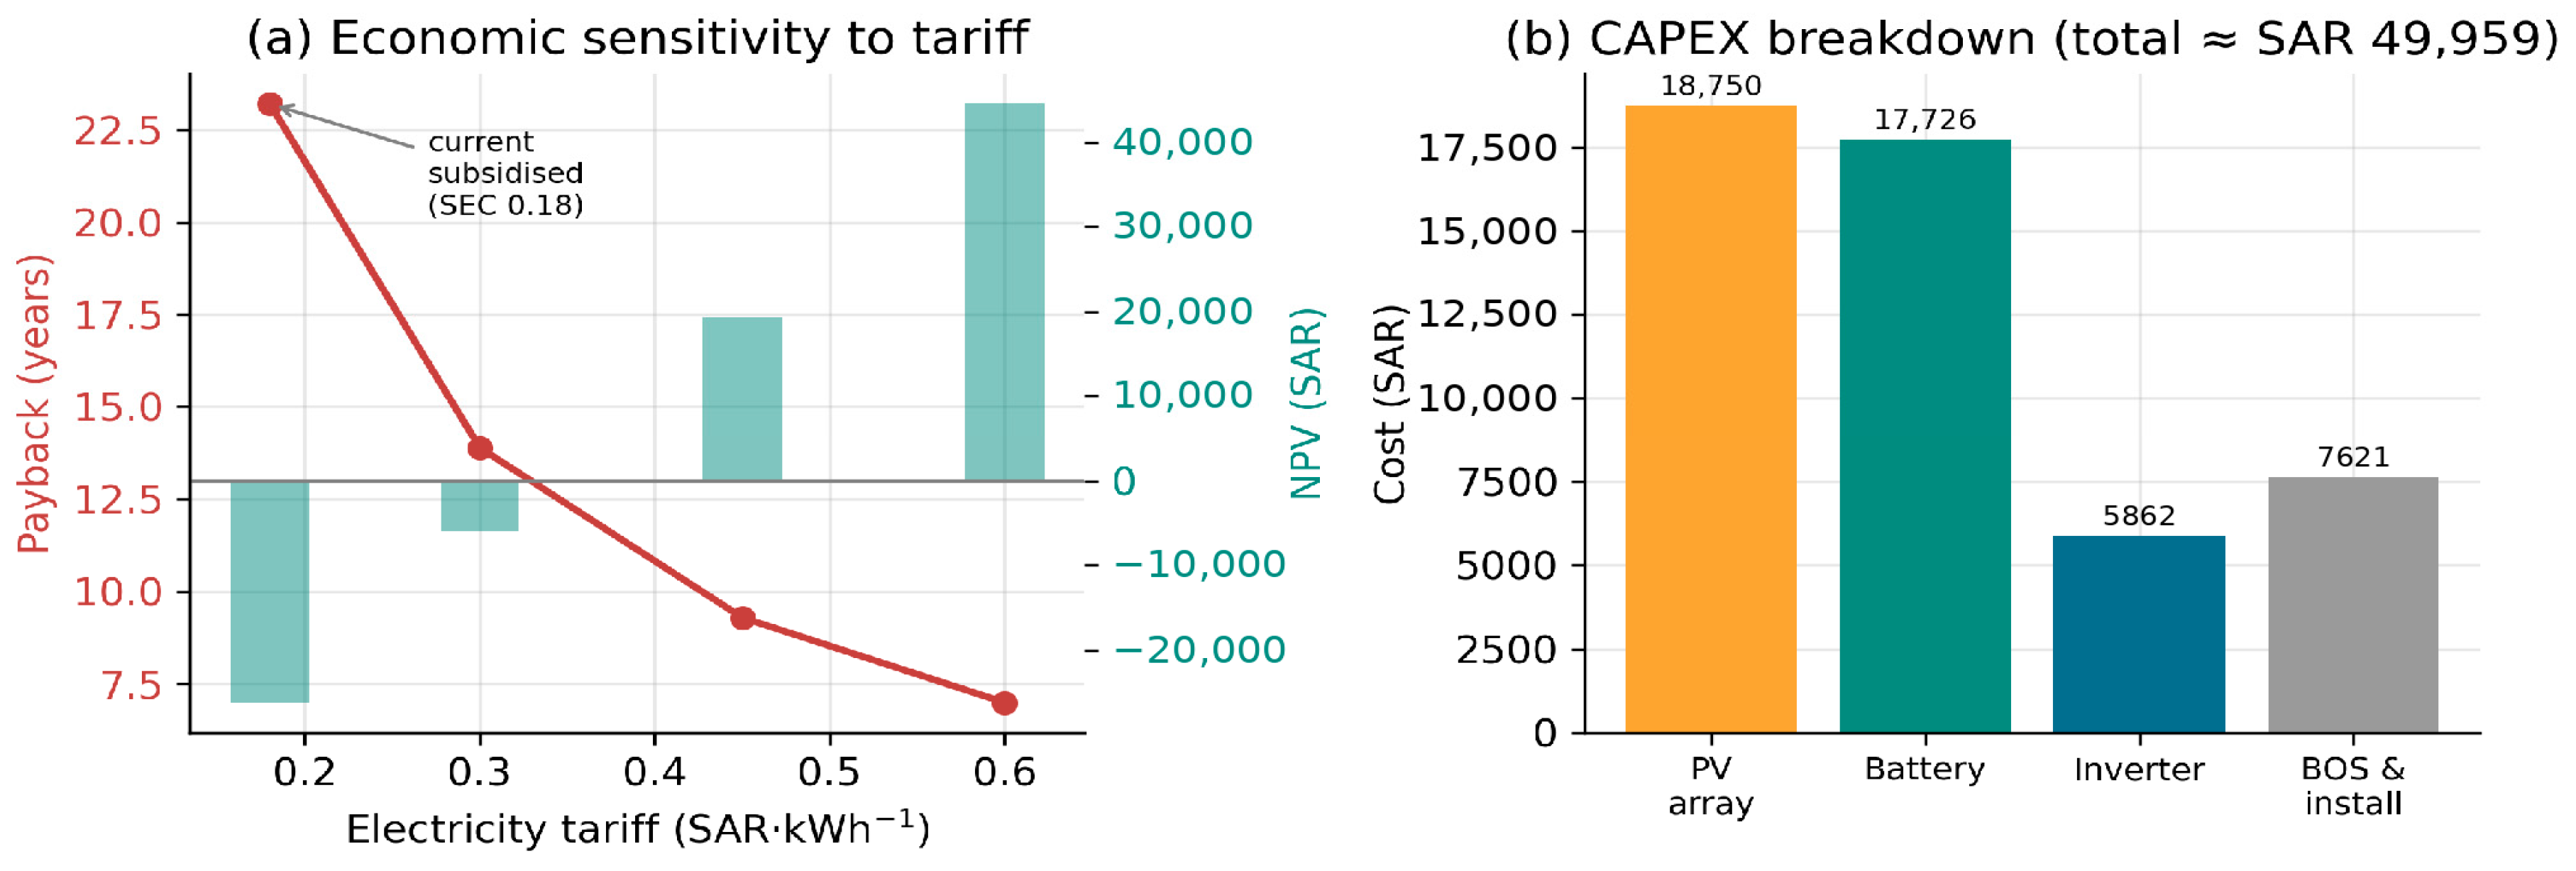
Technical soundness does not by itself establish real-world viability, so a techno-economic assessment was carried out for the complete 6.25 kW PV, 13.5 kWh battery installation. The capital cost, itemised in Figure 16b, totals about SAR 50,000 (≈USD 13,300), split between the array, the battery, the inverter and balance-of-system. Under the current subsidised Saudi Electricity Company residential tariff of 0.18 SAR per kWh for the below-6000 kWh·month−1 tier [54], and crediting exported surplus at the same retail tariff (a net-metering assumption, with ), the system saves roughly SAR 2150 (≈USD 574) per year, of which about SAR 1564 offsets self-consumed energy and SAR 587 rewards the 3.26 MWh exported; under a net-billing scheme with a lower export rate the saving is smaller, falling to about SAR 1564 (payback near 32 years) if exports receive no credit. This gives a simple payback of 23.2 years, a levelised cost of energy of SAR 0.52 per kWh (≈USD 0.138) and a negative 25-year net present value of about −SAR 26,200 (≈−USD 7000). A rainflow analysis of the daily SOC trajectory gives about 145 equivalent full cycles per year; at this shallow-cycling rate the pack is calendar-limited to roughly 13 years, implying one battery replacement over the 25-year horizon, which the economic model includes.
Figure 16.
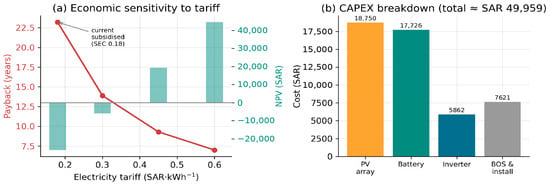
Techno-economic assessment: (a) simple payback and 25-year net present value versus electricity tariff, showing the viability threshold; (b) capital-cost breakdown of the 6.25 kW PV/13.5 kWh battery system.
The unattractive headline economics are a direct consequence of the heavily subsidised domestic tariff rather than of the technology, and Figure 16a makes this explicit by repeating the calculation across a range of tariffs. Payback shortens to 13.9 years at 0.30 SAR per kWh (the SEC upper-tier rate) and to 9.3 years at a cost-reflective 0.45 SAR per kWh, at which point the net present value turns positive; at an unsubsidised 0.60 SAR per kWh the payback is 7.0 years. Table 15 collects these results, and the underlying cost and financial assumptions are listed in Table 16. The finding aligns with recent Saudi studies reporting that residential PV-battery systems become financially compelling only under tariff reform, time-of-use pricing or targeted incentives [47,48], and it identifies the tariff, not the engineering, as the binding constraint on adoption, an actionable message for the Vision 2030 policy agenda.
Table 15.
Techno-economic results and tariff sensitivity for Riyadh in Saudi Riyal (SEC residential tariff 0.18 SAR/kWh; 6.25 kW PV, 13.5 kWh battery; CAPEX ≈ SAR 50,000 ≈ USD 13,300; LCOE ≈ SAR 0.52/kWh ≈ USD 0.138/kWh; battery life ≈ 13 yr; 1 USD = 3.75 SAR).
Table 16.
Techno-economic assumptions (2024 residential; 1 USD = 3.75 SAR).
5.9. Discussion and Regional Context
The verified results confirm that the proposed microgrid meets its core objectives (maximum PV extraction, safe battery operation, continuous supply and controlled grid interaction) and the extended analyses place those objectives in a realistic Saudi context. The thermal derating of 7.7% between 25 °C and 45 °C quantified in Table 4 is a structural feature of the climate and should enter array sizing explicitly rather than being buried in a margin [43,46]. The high PV self-consumption reflects the favourable coincidence of generation with daytime cooling demand in Riyadh [45], yet the annual self-sufficiency of 51.8% shows that meaningful post-sunset autonomy would require either a substantially larger battery, whose diminishing returns Figure 15 makes clear, or demand-side flexibility. The twelve-month analysis demonstrates that these conclusions hold across the year, the summer cooling peak being the binding constraint, while the sensitivity sweeps show how the framework transfers to other load and storage combinations and, by re-tabulating the monthly resource data, to other Saudi cities. The conservative 40–80% SOC window trades usable capacity for cycle life, a defensible choice given the accelerated ageing at the high ambient temperatures of the region [28], and the degradation estimate of Section 5.8 confirms a calendar-limited life consistent with a single mid-life replacement.
Several limitations remain and define the future work. The phasor dispatch does not resolve sub-cycle transients; although the time-domain model of Section 5.4 supplies a quantitative THD, a hardware-in-the-loop or field test under measured Saudi irradiance and dust-soiling would strengthen the power-quality and yield claims further. The economic model uses representative capital costs and a single discount rate; a full stochastic treatment of cost, tariff and degradation uncertainty, together with optimal joint PV-battery sizing under evolving Saudi tariff structures, is a natural next step. Finally, extending the framework to coordinate multiple interconnected residential microgrids would test its behaviour at feeder scale.
6. Conclusions
This paper presented a complete theoretical formulation and an independent, reproducible verification of a single-phase grid-connected PV-battery microgrid for high-irradiance residential applications in Saudi Arabia, extended with the harmonic, robustness and economic analyses needed to establish practical relevance. The governing equations of every subsystem were derived in closed form and used to generate the design tables, and a Python re-implementation of the phasor power-flow model verified the analysis over a 24 h cycle run to periodic steady state, conserving the instantaneous power balance to machine precision, and the independent Python and MATLAB implementations agree to within 0.5%. The principal findings are as follows. The single-diode model reproduces the 250 W module nameplate to within 0.12% and gives a 6.24 kW array peak at standard test conditions, derating by 7.7% to 5.76 kW at 45 °C. Driven by measured monthly solar-resource and temperature data for Riyadh, the optimised energy-management scheme achieves an annual self-sufficiency of 51.8% and a PV self-consumption of 72.9% with a 13.5 kWh battery, the summer air-conditioning peak being the binding constraint on autonomy. A dedicated time-domain switching simulation with FFT analysis quantifies the grid-current THD at 0.76% for the LCL filter against 6.2% for an equal-inductance L filter, below the 5% current-distortion reference of IEEE 519 (full compliance would additionally require the PCC short-circuit ratio and individual harmonic verification). The twelve-month and sizing-sensitivity studies confirm that these conclusions hold across the year, with the low-resource winter and high-load summer months as the extremes, and a techno-economic assessment using the Saudi Electricity Company tariff shows that the design is technically sound but economically constrained by the subsidised domestic tariff (23.2-year payback), becoming attractive (payback below ten years and positive net present value) only under cost-reflective pricing. Future work will pursue hardware-in-the-loop and field validation under measured Saudi irradiance and dust-soiling, a detailed electro-thermal battery-ageing model, stochastic techno-economic optimisation under evolving tariffs, and the coordination of multiple interconnected residential microgrids.
Author Contributions
Conceptualisation, methodology, modelling and writing were carried out jointly by A.M.A.A., A.A.A.A. and A.K.A.; supervision and review by A.H. and M.A.K. All authors have read and agreed to the published version of the manuscript.
Funding
This research received no external funding.
Institutional Review Board Statement
Not applicable.
Informed Consent Statement
Not applicable.
Data Availability Statement
The independent Python verification code, the runnable MATLAB/Simulink model, the measured monthly resource data, and the analysis scripts that reproduce the results reported in this article are openly archived on Zenodo at https://doi.org/10.5281/zenodo.21227405 under a Creative Commons Attribution (CC BY 4.0) licence; the generated result files are additionally available from the corresponding author on request.
Acknowledgments
The authors are thankful to the Deanship of Graduate Studies and Scientific Research at the University of Bisha for supporting this work through the Fast-Track Research Support Program.
Conflicts of Interest
Abdulkhaleq Mohammed Abdullah Alshehri is an employee of Technical Vocational Training Corporation (TVTC). Ali Ahmad Ali Asiri is an employee of Southern Sector Headquarters. Abdulrahman Khader Alhallafi is an employee of Larsen & Toubro Saudi Arabia LLC. The other authors declare no conflicts of interest.
Abbreviations
The following abbreviations are used in this manuscript:
| Abbreviation | Meaning |
| AC | Alternating current |
| BESS | Battery energy storage system |
| BOS | Balance of system |
| CAPEX | Capital expenditure |
| DC | Direct current |
| DER | Distributed energy resource |
| DHI | Diffuse horizontal irradiance |
| DNI | Direct normal irradiance |
| EMS | Energy management system |
| FFT | Fast Fourier transform |
| GHI | Global horizontal irradiance |
| HIL | Hardware-in-the-loop |
| IEEE | Institute of Electrical and Electronics Engineers |
| LCL | Inductor-capacitor-inductor (filter) |
| LCOE | Levelised cost of energy |
| LiFePO4 | Lithium iron phosphate |
| MPP | Maximum power point |
| MPPT | Maximum-power-point tracking |
| NOCT | Nominal operating cell temperature |
| NPV | Net present value |
| O&M | Operation and maintenance |
| P&O | Perturb-and-observe |
| PCC | Point of common coupling |
| POA | Plane of array |
| PV | Photovoltaic |
| PWM | Pulse-width modulation |
| RMS | Root mean square |
| SAR | Saudi riyal |
| SCR | Short-circuit ratio |
| SEC | Saudi Electricity Company |
| SOC | State of charge |
| SOGI-PLL | Second-order generalised-integrator phase-locked loop |
| STC | Standard test conditions |
| TDD | Total demand distortion |
| THD | Total harmonic distortion |
References
- Lasseter, R.H. Microgrids. In Proceedings of the 2002 IEEE Power Engineering Society Winter Meeting, New York, NY, USA, 27–31 January 2002; Volume 1, pp. 305–308. [Google Scholar]
- Hatziargyriou, N.; Asano, H.; Iravani, R.; Marnay, C. Microgrids. IEEE Power Energy Mag. 2007, 5, 78–94. [Google Scholar] [CrossRef] [Scilit]
- Guerrero, J.M.; Vasquez, J.C.; Matas, J.; De Vicuña, L.G.; Castilla, M. Hierarchical control of droop-controlled AC and DC microgrids: A general approach toward standardization. IEEE Trans. Ind. Electron. 2010, 58, 158–172. [Google Scholar]
- Olivares, D.E.; Mehrizi-Sani, A.; Etemadi, A.H.; Cañizares, C.A.; Iravani, R.; Kazerani, M.; Hajimiragha, A.H.; Gomis-Bellmunt, O.; Saeedifard, M.; Palma-Behnke, R.; et al. Trends in microgrid control. IEEE Trans. Smart Grid 2014, 5, 1905–1919. [Google Scholar] [CrossRef] [Scilit]
- Katiraei, F.; Iravani, R.; Hatziargyriou, N.; Dimeas, A. Microgrids management. IEEE Power Energy Mag. 2008, 6, 54–65. [Google Scholar] [CrossRef] [Scilit]
- Bidram, A.; Davoudi, A. Hierarchical structure of microgrids control system. IEEE Trans. Smart Grid 2012, 3, 1963–1976. [Google Scholar] [CrossRef] [Scilit]
- Parisio, A.; Rikos, E.; Glielmo, L. A model predictive control approach to microgrid operation optimization. IEEE Trans. Control Syst. Technol. 2014, 22, 1813–1827. [Google Scholar] [CrossRef] [Scilit]
- Rocabert, J.; Luna, A.; Blaabjerg, F.; Rodriguez, P. Control of power converters in AC microgrids. IEEE Trans. Power Electron. 2012, 27, 4734–4749. [Google Scholar] [CrossRef] [Scilit]
- Katiraei, F.; Iravani, M.R.; Lehn, P.W. Micro-grid autonomous operation during and subsequent to islanding process. IEEE Trans. Power Deliv. 2005, 20, 248–257. [Google Scholar] [CrossRef] [Scilit]
- Lopes, J.P.; Moreira, C.L.; Madureira, A.G. Defining control strategies for microgrids islanded operation. IEEE Trans. Power Syst. 2006, 21, 916–924. [Google Scholar] [CrossRef] [Scilit]
- Farrokhabadi, M.; Cañizares, C.A.; Simpson-Porco, J.W.; Nasr, E.; Fan, L.; Mendoza-Araya, P.A.; Tonkoski, R.; Tamrakar, U.; Hatziargyriou, N.; Lagos, D.; et al. Microgrid stability definitions, analysis, and examples. IEEE Trans. Power Syst. 2019, 35, 13–29. [Google Scholar]
- Esram, T.; Chapman, P.L. Comparison of photovoltaic array maximum power point tracking techniques. IEEE Trans. Energy Convers. 2007, 22, 439–449. [Google Scholar] [CrossRef] [Scilit]
- Reisi, A.R.; Moradi, M.H.; Jamasb, S. Classification and comparison of maximum power point tracking techniques for photovoltaic system: A review. Renew. Sustain. Energy Rev. 2013, 19, 433–443. [Google Scholar] [CrossRef] [Scilit]
- Bollipo, R.B.; Mikkili, S.; Bonthagorla, P.K. Hybrid, optimal, intelligent and classical PV MPPT techniques: A review. CSEE J. Power Energy Syst. 2021, 7, 9–33. [Google Scholar]
- Hua, C.; Shen, C. Study of maximum power tracking techniques and control of DC/DC converters for photovoltaic power system. In Proceedings of the PESC 98, 29th Annual IEEE Power Electronics Specialists Conference, Fukuoka, Japan, 17–22 May 1998; Volume 1, pp. 86–93. [Google Scholar]
- Femia, N.; Petrone, G.; Spagnuolo, G.; Vitelli, M. Optimization of perturb and observe maximum power point tracking method. IEEE Trans. Power Electron. 2005, 20, 963–973. [Google Scholar] [CrossRef] [Scilit]
- Hussein, K.H.; Muta, I.; Hoshino, T.; Osakada, M. Maximum photovoltaic power tracking: An algorithm for rapidly changing atmospheric conditions. IEE Proc. Gener. Transm. Distrib. 1995, 142, 59–64. [Google Scholar] [CrossRef] [Scilit]
- Abdelsalam, A.K.; Massoud, A.M.; Ahmed, S.; Enjeti, P.N. High-performance adaptive perturb and observe MPPT technique for photovoltaic-based microgrids. IEEE Trans. Power Electron. 2011, 26, 1010–1021. [Google Scholar] [CrossRef] [Scilit]
- Sera, D.; Mathe, L.; Kerekes, T.; Spataru, S.V.; Teodorescu, R. On the perturb-and-observe and incremental conductance MPPT methods for PV systems. IEEE J. Photovolt. 2013, 3, 1070–1078. [Google Scholar] [CrossRef] [Scilit]
- Koutroulis, E.; Blaabjerg, F. A new technique for tracking the global maximum power point of PV arrays operating under partial-shading conditions. IEEE J. Photovolt. 2012, 2, 184–190. [Google Scholar] [CrossRef] [Scilit]
- Villalva, M.G.; Gazoli, J.R.; Ruppert Filho, E. Comprehensive approach to modeling and simulation of photovoltaic arrays. IEEE Trans. Power Electron. 2009, 24, 1198–1208. [Google Scholar] [CrossRef] [Scilit]
- Patel, H.; Agarwal, V. MATLAB-based modeling to study the effects of partial shading on PV array characteristics. IEEE Trans. Energy Convers. 2008, 23, 302–310. [Google Scholar] [CrossRef] [Scilit]
- De Soto, W.; Klein, S.A.; Beckman, W.A. Improvement and validation of a model for photovoltaic array performance. Sol. Energy 2006, 80, 78–88. [Google Scholar] [CrossRef] [Scilit]
- Divya, K.C.; Østergaard, J. Battery energy storage technology for power systems: An overview. Electr. Power Syst. Res. 2009, 79, 511–520. [Google Scholar] [CrossRef] [Scilit]
- Leadbetter, J.; Swan, L. Battery storage system for residential electricity peak demand shaving. Energy Build. 2012, 55, 685–692. [Google Scholar] [CrossRef] [Scilit]
- Kebede, A.A.; Kalogiannis, T.; Van Mierlo, J.; Berecibar, M. A comprehensive review of stationary energy storage devices for large scale renewable energy sources grid integration. Renew. Sustain. Energy Rev. 2022, 159, 112213. [Google Scholar] [CrossRef] [Scilit]
- Hannan, M.A.; Lipu, M.H.; Hussain, A.; Mohamed, A. A review of lithium-ion battery state of charge estimation and management system in electric vehicle applications: Challenges and recommendations. Renew. Sustain. Energy Rev. 2017, 78, 834–854. [Google Scholar] [CrossRef] [Scilit]
- Vetter, J.; Novák, P.; Wagner, M.R.; Veit, C.; Möller, K.C.; Besenhard, J.O.; Winter, M.; Wohlfahrt-Mehrens, M.; Vogler, C.; Hammouche, A. Ageing mechanisms in lithium-ion batteries. J. Power Sources 2005, 147, 269–281. [Google Scholar] [CrossRef] [Scilit]
- Plett, G.L. Extended Kalman filtering for battery management systems of LiPB-based HEV battery packs: Part 1. Background. J. Power Sources 2004, 134, 252–261. [Google Scholar] [CrossRef] [Scilit]
- He, H.; Xiong, R.; Fan, J. Evaluation of lithium-ion battery equivalent circuit models for state of charge estimation by an experimental approach. Energies 2011, 4, 582. [Google Scholar] [CrossRef] [Scilit]
- Nottrott, A.; Kleissl, J.; Washom, B. Energy dispatch schedule optimization and cost benefit analysis for grid-connected, photovoltaic-battery storage systems. Renew. Energy 2013, 55, 230–240. [Google Scholar] [CrossRef] [Scilit]
- Dufo-López, R.; Bernal-Agustín, J.L. Techno-economic analysis of grid-connected battery storage. Energy Convers. Manag. 2015, 91, 394–404. [Google Scholar] [CrossRef] [Scilit]
- Weniger, J.; Tjaden, T.; Quaschning, V. Sizing of residential PV battery systems. Energy Procedia 2014, 46, 78–87. [Google Scholar] [CrossRef] [Scilit]
- IEEE 1547-2018; IEEE Standard for Interconnection and Interoperability of Distributed Energy Resources with Associated Electric Power Systems Interfaces. IEEE: Piscataway, NJ, USA, 2018.
- Kjaer, S.B.; Pedersen, J.K.; Blaabjerg, F. A review of single-phase grid-connected inverters for photovoltaic modules. IEEE Trans. Ind. Appl. 2005, 41, 1292–1306. [Google Scholar] [CrossRef] [Scilit]
- Carrasco, J.M.; Franquelo, L.G.; Bialasiewicz, J.T.; Galván, E.; PortilloGuisado, R.C.; Prats, M.M.; León, J.I.; Moreno-Alfonso, N. Power-electronic systems for the grid integration of renewable energy sources: A survey. IEEE Trans. Ind. Electron. 2006, 53, 1002–1016. [Google Scholar] [CrossRef] [Scilit]
- Demirok, E.; Gonzalez, P.C.; Frederiksen, K.H.; Sera, D.; Rodriguez, P.; Teodorescu, R. Local reactive power control methods for overvoltage prevention of distributed solar inverters in low-voltage grids. IEEE J. Photovolt. 2011, 1, 174–182. [Google Scholar] [CrossRef] [Scilit]
- Reno, M.J.; Broderick, R.J.; Grijalva, S. Smart inverter capabilities for mitigating over-voltage on distribution systems with high penetrations of PV. In Proceedings of the 2013 IEEE 39th Photovoltaic Specialists Conference (PVSC), Tampa, FL, USA, 16–21 June 2013; pp. 3153–3158. [Google Scholar]
- Liserre, M.; Blaabjerg, F.; Hansen, S. Design and control of an LCL-filter-based three-phase active rectifier. IEEE Trans. Ind. Appl. 2005, 41, 1281–1291. [Google Scholar] [CrossRef] [Scilit]
- Dannehl, J.; Wessels, C.; Fuchs, F.W. Limitations of voltage-oriented PI current control of grid-connected PWM rectifiers with LCL filters. IEEE Trans. Ind. Electron. 2008, 56, 380–388. [Google Scholar]
- Reznik, A.; Simoes, M.G.; Al-Durra, A.; Muyeen, S.M. LCL filter design and performance analysis for grid-interconnected systems. IEEE Trans. Ind. Appl. 2013, 50, 1225–1232. [Google Scholar]
- IEEE 519-2014; IEEE Recommended Practice and Requirements for Harmonic Control in Electric Power Systems. IEEE: Piscataway, NJ, USA, 2014.
- Alawaji, S.H. Evaluation of solar energy research and its applications in Saudi Arabia: 20 years of experience. Renew. Sustain. Energy Rev. 2001, 5, 59–77. [Google Scholar] [CrossRef] [Scilit]
- Almasoud, A.H.; Gandayh, H.M. Future of solar energy in Saudi Arabia. J. King Saud Univ. Eng. Sci. 2015, 27, 153–157. [Google Scholar] [CrossRef] [Scilit]
- Amran, Y.A.; Amran, Y.M.; Alyousef, R.; Alabduljabbar, H. Renewable and sustainable energy production in Saudi Arabia according to Saudi Vision 2030: Current status and future prospects. J. Clean. Prod. 2020, 247, 119602. [Google Scholar] [CrossRef] [Scilit]
- Rehman, S.; Ahmed, M.A.; Mohamed, M.H.; Al-Sulaiman, F.A. Feasibility study of the grid connected 10 MW installed capacity PV power plants in Saudi Arabia. Renew. Sustain. Energy Rev. 2017, 80, 319–329. [Google Scholar] [CrossRef] [Scilit]
- Imam, A.A.; Al-Turki, Y.A.; R., S.K. Techno-economic feasibility assessment of grid-connected PV systems for residential buildings in Saudi Arabia: A case study. Sustainability 2020, 12, 262. [Google Scholar]
- Binmahfouz, M.A.; Ramli, M.A.M.; Milyani, A.H. Optimal distributed PV system assessment for renewable energy based microgrid application in Makkah, Saudi Arabia. Sci. Rep. 2025, 15, 38230. [Google Scholar] [CrossRef] [Scilit] [PubMed]
- Yazdani, A.; Iravani, R. Voltage-Sourced Converters in Power Systems: Modeling, Control, and Applications; John Wiley and Sons: Hoboken, NJ, USA, 2010. [Google Scholar]
- Xu, W.; Zhang, G.; Li, C.; Wang, W.; Wang, G.; Kliber, J. A power line signaling based technique for anti-islanding protection of distributed generators, Part I: Scheme and analysis. IEEE Trans. Power Deliv. 2007, 22, 1758–1766. [Google Scholar] [CrossRef] [Scilit]
- Zell, E.; Gasim, S.; Wilcox, S.; Katamoura, S.; Stoffel, T.; Shibli, H.; Engel-Cox, J.; Al Subie, M. Assessment of solar radiation resources in Saudi Arabia. Sol. Energy 2015, 119, 422–438. [Google Scholar] [CrossRef] [Scilit]
- King Abdullah City for Atomic and Renewable Energy (K.A.CARE). Renewable Resource Atlas; K.A.CARE: Riyadh, Saudi Arabia. Available online: https://rratlas.energy.gov.sa (accessed on 14 July 2026).
- Global Solar Atlas 2.0 (World Bank Group/Solargis). Available online: https://globalsolaratlas.info (accessed on 14 July 2026).
- Saudi Electricity Regulatory Authority (SERA). Electricity Consumption Tariff, Residential Category. Available online: https://www.sera.gov.sa (accessed on 14 July 2026).

Disclaimer/Publisher’s Note: The statements, opinions and data contained in all publications are solely those of the individual author(s) and contributor(s) and not of MDPI and/or the editor(s). MDPI and/or the editor(s) disclaim responsibility for any injury to people or property resulting from any ideas, methods, instructions or products referred to in the content. |
© 2026 by the authors. Licensee MDPI, Basel, Switzerland. This article is an open access article distributed under the terms and conditions of the Creative Commons Attribution (CC BY) license.